alessio - pet/ct instrumentation 11/26/07 motivations for ...depts.washington.edu/imreslab/from old...
TRANSCRIPT
Alessio - PET/CT Instrumentation 11/26/07
1
1/36
PET/CT Instrumentation Basics
1. Motivations for PET/CT imaging2. What is a PET/CT Scanner3. Typical Protocols4. CT Attenuation Correction5. Problems and Challenges with PET/CT6. Examples
Adam AlessioDepartment of RadiologyUniversity of Washington
11/27/072/36
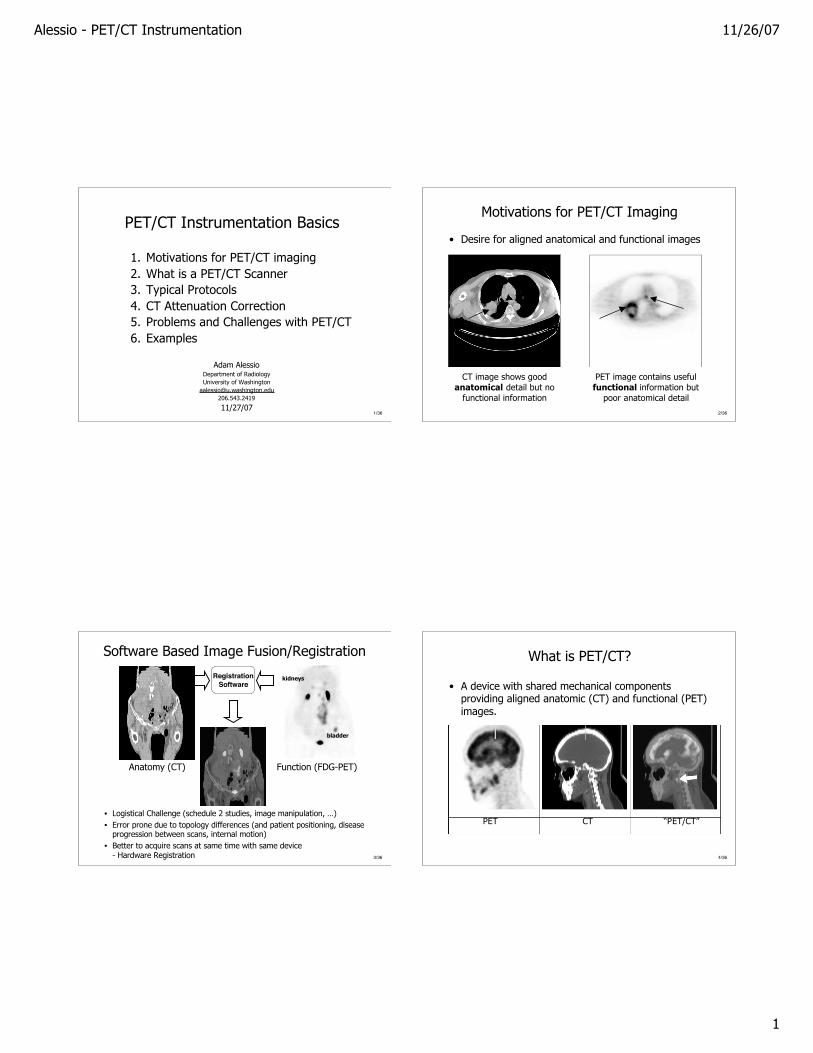
Motivations for PET/CT Imaging
• Desire for aligned anatomical and functional images
CT image shows goodanatomical detail but no
functional information
PET image contains usefulfunctional information but
poor anatomical detail
3/36
Software Based Image Fusion/Registration
Anatomy (CT) Function (FDG-PET)
kidneys
bladder
RegistrationSoftware
• Logistical Challenge (schedule 2 studies, image manipulation, …)• Error prone due to topology differences (and patient positioning, disease
progression between scans, internal motion)• Better to acquire scans at same time with same device
- Hardware Registration 4/36
What is PET/CT?
• A device with shared mechanical componentsproviding aligned anatomic (CT) and functional (PET)images.
PET CT “PET/CT”

Alessio - PET/CT Instrumentation 11/26/07
2
5/36
Aside: Why are PET images less visuallyappealing than CT?
A. Resolution is worse: PET limited by1. Positron Range2. Emitted photons are not exactly anti-parallel (slight angular spread)3. Intrinsic spatial resolution of detectors (high energy photons travel some
distance in detectors)4. Sampling of detectors
B. Signal to noise ratio worse: PET images are noisy/blurry because:1. Have much less good counts than CT2. Have more contributions of “bad” counts (scattered and random events)(Noisy images are then blurred for visual appeal leading to even worse resolution)
So why bother?
Answer: Sensitivity Typical whole-body PET system can detect ~2% of allemitted photons, thus we can image almost any biological compound.
In comparison CT looks at an energy-weighted density and MR (mostly) looksat proton (hydrogen) density
6/36
What is a PET/CT scanner?
PET/CT Scanner consists of separate CT and PETComponents
7/36
Some Background
Siemens/CTI/HitachiBiograph/Reveal(BGO or LSO)
GE Medical SystemsDiscovery LS, ST, STE
(BGO)
Phillips/ADACGemini (GSO)
Gemini TF (LYSO)
• First PET/CT scanner introduced in 1998 by University of Pittsburgh,NCI, and CTI PET Systems (Knoxville, TN)
• Combination of independent scanner components still standard
8/36
Benefits of PET/CT?
• Primary: Mechanically Aligned Anatomical andFunctional images– “Fusion” - images not “fused”, simply overlaid - “alpha”
blending
Alessio - PET/CT Instrumentation 11/26/07
3
9/36
Multimodality Imaging
10/36
Benefits of PET/CT?
• Primary: Mechanically Aligned Anatomical and Functionalimages– “Fusion” - images not “fused”, simply overlaid - “alpha” blending
• Secondary: CT scan provides attenuation correctioninformation for PET Reconstruction– Much faster than conventional PET transmission scan
(20 sec vs. ~20 min)– Less noise than conventional PET transmission scan– Shorter overall scan time
• Wholebody PET/CT ~ 30 min• Wholebody PET ~ 50 min
• Tertiary:– CT scan used for scatter correction– CT image could add in resolution recovery in PET image
11/36
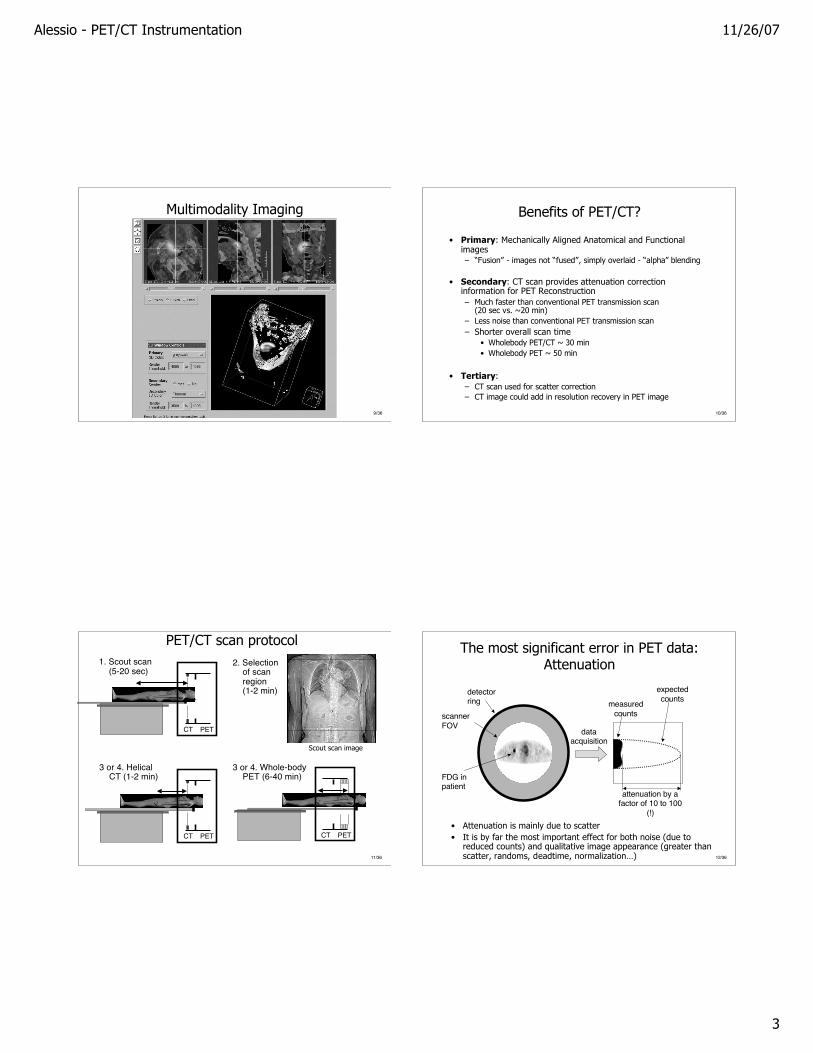
PET/CT scan protocol1. Scout scan
(5-20 sec)
CT PET
3 or 4. Whole-bodyPET (6-40 min)
CT PET
3 or 4. HelicalCT (1-2 min)
CT PET
2. Selectionof scanregion(1-2 min)
Scout scan image
12/36
The most significant error in PET data:Attenuation
• Attenuation is mainly due to scatter• It is by far the most important effect for both noise (due to
reduced counts) and qualitative image appearance (greater thanscatter, randoms, deadtime, normalization…)
detectorring
FDG inpatient
dataacquisition
expectedcountsmeasured
counts
attenuation by afactor of 10 to 100
(!)
scannerFOV
Alessio - PET/CT Instrumentation 11/26/07
4
13/36
Effects of attenuation on qualitative appearance:Patient example
Transmission:tissue density
Emission: FDG(Attenuationcorrected)
Emission: FDG(not corrected
for attenuation)
There are striking changes in appearance with and without attenuation correction14/36
PET Attenuation Correction-Transmission Scan Methods
Coincident photon Ge-68/Ga-68 (511 keV)
Single photonCs-137 (662 keV)
X-ray (CT)(~30-140kVp)
high noise~12-45 min whole body scan
no biaspost injection contamination
lower noise~4-20 min scan time
some biaspost injection contamination
Virtually no noise~20 sec scan time
potential for significant biasno post injection contamination
Rod source
PET Detectors
Past: Siemens and GE PET Scanners andoriginal PET/CT scanners
Now: not available for AC on any newsystem
Past: Philips PET Scanners
Now: not available on any new systems
Past: not on PET Scanners
Now: only option with new PET/CTsystems
HISTORY:
15/36
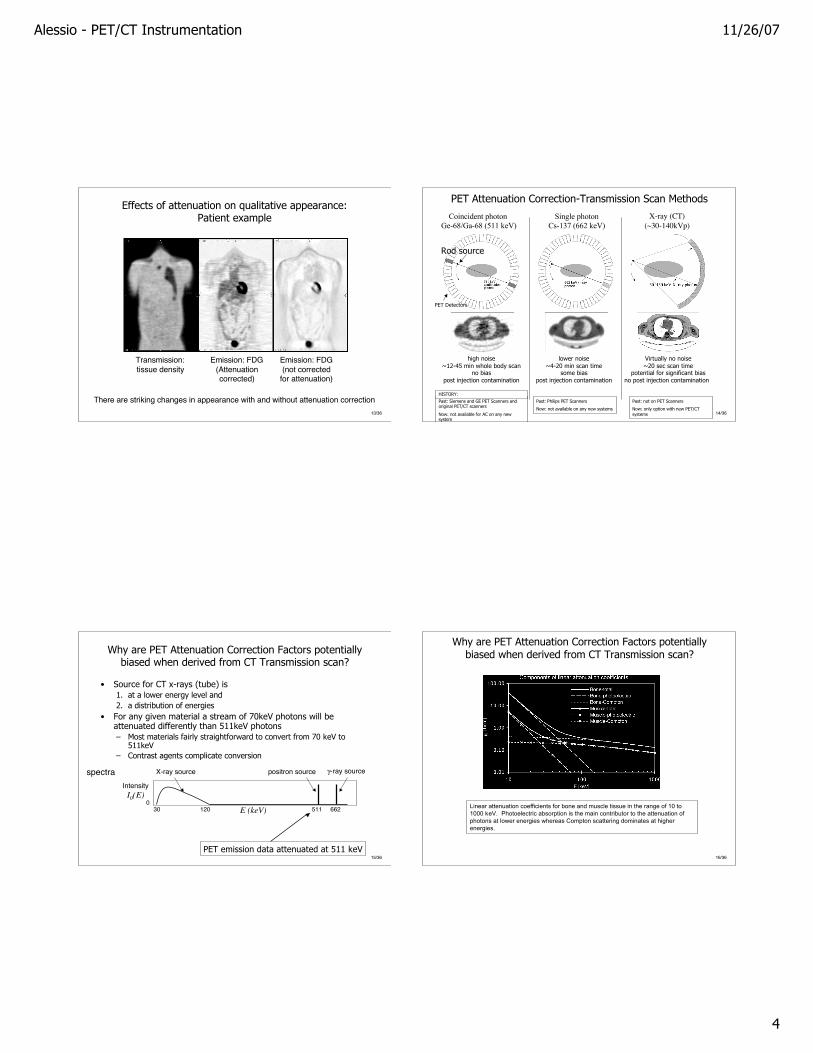
Why are PET Attenuation Correction Factors potentiallybiased when derived from CT Transmission scan?
• Source for CT x-rays (tube) is1. at a lower energy level and2. a distribution of energies
• For any given material a stream of 70keV photons will beattenuated differently than 511keV photons– Most materials fairly straightforward to convert from 70 keV to
511keV– Contrast agents complicate conversion
E (keV)30 120 511 662
IntensityI0(E)
X-ray source positron source γ-ray source
0
spectra
PET emission data attenuated at 511 keV16/36
Why are PET Attenuation Correction Factors potentiallybiased when derived from CT Transmission scan?
Linear attenuation coefficients for bone and muscle tissue in the range of 10 to1000 keV. Photoelectric absorption is the main contributor to the attenuation ofphotons at lower energies whereas Compton scattering dominates at higherenergies.

Alessio - PET/CT Instrumentation 11/26/07
5
17/36
Why are PET Attenuation Correction Factors potentiallybiased when derived from CT Transmission scan?
18/36
Bias in AC Factors
Illustrates that mass attenuation coefficient of iodine is appreciably different frombiological tissue at CT energies while similar at PET 511keV energy.
19/36
Converting CT Numbers toPET Attenuation Values
• Linear Scaling Method maps Hounsfield Units to Attenuation correctioncoefficients at 511keV
20/36
Flowchart of typical PET/CT Operation
Attenuation correction factors can be obtained from either (A) CT-based or(B) conventional PET transmission source (rare on recent systems)

Alessio - PET/CT Instrumentation 11/26/07
6
21/36
Comparing PET/CT Scanners*
190
182
182
160
160/200
co-scanlength(cm)
430
450
450
400
400
max bedload (lbs)
14 x 24
15 x 25
15 x 25
14 x 24
14 x 24
room size(feet)
501 (CT)60 (PET)
501 (CT)60 (PET)
501 (CT)58.5(PET)
501 (CT)70 (PET)
50 (CT)55 (PET)
FOVdiam(cm)
X-ray137Cs
X-ray
X-ray
X-ray
X-ray68Ge
TXModes
70 (CT)63 (PET)
3DPhilipsMX8000 Dual orBrilliance 16
Allegro(GSO)
PhilipsGemini
703DSOMATOM(6 or 16 slice)
wide-boreAccell(LSO)
SiemensHIREZ
703DSOMATOM(2 or 16 slice)
wide-boreAccel(LSO)
Siemens*** PICO
702D/3DLightspeed Plus(4,8, or 16slice)
wide-boreNXi (BGO)
GEH ST
70 (CT)tapered to59 (PET)
2D/3DLightspeed Plus(4,8, or 16slice)
NXi (BGO)GEH LS
Patientport (cm)
PETMode
CTComponent**
PETComponent
Scanner
*Based on published specifications - OUT OF DATE**CT sub-system options are changing rapidly***CPS products sold through CTI as Reveal and Siemens as Biograph 22/36
Challenges & Problems with PET/CT
1. Functional and Anatomical Image Alignment– Possible Movement between scans– Respiratory Motion (breath hold protocol?)
• Several organs deviate in volume and position (liver, spleen,…)– Calibration of CT gantry, PET gantry, and bed
2. CT Based Attenuation Correction(in my order of least to most important)– Truncation Errors from arms down in FOV ⇒ Artifacts in
corresponding regions in PET image– Biases in AC factors from conversion of X-ray energies to PET
energies ⇒ Incorrect Values in PET Image• Contrast agents, Prostheses, implants
– Movement between Scans– Respiratory Motion ⇒ Can cause artifacts near dome of liver (in
cardiac PET, causes defects in cardiac values)
31/36
CT Based AC Problems(Bias in AC Factors)
General Rule:• If one over attenuation corrects (uses higher (”more dense”) than
true correction factors for a region), will get artifactually high PETvalues
– Example: Contrast agents in CT image, when scaled to PET energies,are higher than should be leading to artifactual focal hot spots.
• If one under attenuation corrects (uses lower than true factors fora region), will get artifactually low PET values
– Example: Respiratory motion can replace diaphragm in PET imagewith lung space in CT image. Causes photopenic region (bananaartifact) along diaphragm in PET image.
32/36
Artifact Examples…