alone in the crowd: the structure and spread of loneliness...
TRANSCRIPT
INTERPERSONAL RELATIONS AND GROUP PROCESSES
Alone in the Crowd: The Structure and Spread of Loneliness in aLarge Social Network
John T. CacioppoUniversity of Chicago
James H. FowlerUniversity of California, San Diego
Nicholas A. ChristakisHarvard University
The discrepancy between an individual’s loneliness and the number of connections in a social networkis well documented, yet little is known about the placement of loneliness within, or the spread ofloneliness through, social networks. The authors use network linkage data from the population-basedFramingham Heart Study to trace the topography of loneliness in people’s social networks and the paththrough which loneliness spreads through these networks. Results indicated that loneliness occurs inclusters, extends up to 3 degrees of separation, is disproportionately represented at the periphery of socialnetworks, and spreads through a contagious process. The spread of loneliness was found to be strongerthan the spread of perceived social connections, stronger for friends than family members, and strongerfor women than for men. The results advance understanding of the broad social forces that driveloneliness and suggest that efforts to reduce loneliness in society may benefit by aggressively targetingthe people in the periphery to help repair their social networks and to create a protective barrier againstloneliness that can keep the whole network from unraveling.
Keywords: loneliness, social network, social isolation, contagion, longitudinal study
Human social isolation is recognized as a problem of vast importance.(Harlow, Dodsworth, & Harlow, 1965, p. 90)
Social species do not fare well when forced to live solitary lives.Social isolation decreases the lifespan of the fruit fly, Drosophiliamelanogaster (Ruan & Wu, 2008); promotes the development ofobesity and Type 2 diabetes in mice (Nonogaki, Nozue, & Oka,2007); delays the positive effects of running on adult neurogenesisin rats (Stranahan, Khalil, & Gould, 2006); increases the activationof the sympatho-adrenomedullary response to an acute immobili-zation or cold stressor in rats (Dronjak, Gavrilovic, Filipovic, &Radojcic, 2004); decreases the expression of genes regulatingglucocorticoid response in the frontal cortex of piglets (Poletto,Steibel, Siegford, & Zanella, 2006); decreases open field activity,increases basal cortisol concentrations, and decreases lymphocyteproliferation to mitogens in pigs (Kanitz, Tuchscherer, Puppe,
Tuchscherer, & Stabenow, 2004); increases the 24-hr urinarycatecholamines levels and evidence of oxidative stress in the aorticarch of the Watanabe heritable hyperlipidemic rabbit (Nation et al.,2008); increases the morning rises in cortisol in squirrel monkeys(Lyons, Ha, & Levine, 1995); and profoundly disrupts psychosex-ual development in rhesus monkeys (Harlow et al., 1965).
Humans, born to the longest period of abject dependency of anyspecies and dependent on conspecifics across the lifespan to sur-vive and prosper, do not fare well, either, whether they are livingsolitary lives or whether they simply perceive that they live inisolation. The average person spends about 80% of waking hoursin the company of others, and the time with others is preferred tothe time spent alone (Emler, 1994; Kahneman, Krueger, Schkade,Schwarz, & Stone, 2004). Social isolation, in contrast, is associ-ated not only with lower subjective well-being (Berscheid, 1985;Burt, 1986; Myers & Diener, 1995) but also with broad-basedmorbidity and mortality (House, Landis, & Umberson, 1988).
Humans are an irrepressibly meaning-making species, and alarge literature has developed showing that perceived social iso-lation (i.e., loneliness) in normal samples is a more importantpredictor of a variety of adverse health outcomes than is objectivesocial isolation (e.g., (Cole et al., 2007; Hawkley, Masi, Berry, &Cacioppo, 2006; Penninx et al., 1997; Seeman, 2000; Sugisawa,Liang, & Liu, 1994). In an illustrative study, Caspi, Harrington,Moffitt, Milne, & Poulton (2006) found that loneliness in adoles-cence and young adulthood predicted how many cardiovascular
John T. Cacioppo, Department of Psychology, University of Chicago;James H. Fowler, Department of Political Science, University of California,San Diego; Nicholas A. Christakis, Department of Health Care Policy, Har-vard Medical School and Department of Sociology, Harvard University.
The research was supported by National Institute on Aging GrantsR01AG034052-01 (to John T. Cacioppo), P01AG031093, and R01AG24448(to Nicholas A. Christakis).
Correspondence concerning this article should be addressed to John T.Cacioppo, Department of Psychology, University of Chicago, Chicago, IL,60637. E-mail: [email protected]
Journal of Personality and Social Psychology, 2009, Vol. 97, No. 6, 977–991© 2009 American Psychological Association 0022-3514/09/$12.00 DOI: 10.1037/a0016076
977

risk factors (e.g., body mass index, waist circumference, bloodpressure, cholesterol) were elevated in young adulthood and thatthe number of developmental occasions (i.e., childhood, adoles-cence, young adulthood) at which participants were lonely pre-dicted the number of elevated risk factors in young adulthood.Loneliness has also been associated with the progression ofAlzheimer’s disease (Wilson et al., 2007), obesity (Lauder, Mum-mery, Jones, & Caperchione, 2006), increased vascular resistance(Cacioppo, Hawkley, Crawford, et al., 2002), elevated blood pres-sure (Cacioppo, Hawkley, Crawford, et al., 2002; Hawkley et al.,2006), increased hypothalamic pituitary adrenocortical activity(Adam, Hawkley, Kudielka, & Cacioppo, 2006; Steptoe, Owen,Kunz-Ebrecht, & Brydon, 2004), less salubrious sleep (Cacioppo,Hawkley, Berntson, et al., 2002; Pressman et al., 2005), dimin-ished immunity (Kiecolt-Glaser et al., 1984; Pressman et al.,2005), reduction in independent living (Russell, Cutrona, de laMora, & Wallace, 1997; Tilvis, Pitkala, Jolkkonen, & Strandberg,2000), alcoholism (Akerlind & Hornquist, 1992), depressivesymptomatology (Cacioppo et al., 2006; Heikkinen & Kauppinen,2004), suicidal ideation and behavior (Rudatsikira, Muula, Siziya,& Twa-Twa, 2007), and mortality in older adults (Penninx et al.,1997; Seeman, 2000). Loneliness has even been associated withgene expression: specifically, the under-expression of genes bear-ing anti-inflammatory glucocorticoid response elements and over-expression of genes bearing response elements for proinflamma-tory NF-�B/Rel transcription factors (Cole et al., 2007).
Adoption and twin studies indicate that loneliness has a sizableheritable component in children (Bartels, Cacioppo, Hudziak,& Boomsma, 2008; McGuire & Clifford, 2000) and in adults(Boomsma, Cacioppo, Muthen, Asparouhov, & Clark, 2007;Boomsma, Cacioppo, Slagboom, & Posthuma, 2006; Boomsma,Willemsen, Dolan, Hawkley, & Cacioppo, 2005). Social factorshave a substantial impact on loneliness, as well, however. Forinstance, freshmen who leave family and friends behind often feelincreased social isolation when they arrive at college, even thoughthey are surrounded by large numbers of other young adults (e.g.,Cutrona, 1982; Russell, Peplau, & Cutrona, 1980). Lower levels ofloneliness are associated with marriage (Hawkley, Browne, &Cacioppo, 2005; Pinquart & Sorenson, 2003), higher education(Savikko, Routasalo, Tilvis, Strandberg, & Pitkala, 2005), andhigher income (Andersson, 1998; Savikko et al., 2005), whereashigher levels of loneliness are associated with living alone(Routasalo, Savikko, Tilvis, Strandberg, & Pitkala, 2006), infre-quent contact with friends and family (Bondevik & Skogstad,1998; Hawkley et al., 2005; Mullins & Dugan, 1990), dissatisfac-tion with living circumstances (Hector-Taylor & Adams, 1996),physical health symptoms, chronic work and/or social stress(Hawkley et al., 2008), small social network (Hawkley et al., 2005;Mullins & Dugan, 1990), lack of a spousal confidant (Hawkley etal., 2008), marital or family conflict (Jones, 1992; Segrin, 1999),poor quality social relationships (Hawkley et al., 2008; Mullins &Dugan, 1990; Routasalo et al., 2006), and divorce and widowhood(Dugan & Kivett, 1994; Dykstra & de Jong Gierveld, 1999;Holmen, Ericsson, Andersson, & Winblad, 1992; Samuelsson,Andersson, & Hagberg, 1998).
The discrepancy between an individual’s subjective report ofloneliness and the reported or observed number of connections intheir social network is well documented (e.g., see Berscheid &Reis, 1998), but few details are known about the placement of
loneliness within or the spread of loneliness through a socialnetwork. The association between the loneliness of individualsconnected to each other, and their clustering within the network,could be attributed to at least three social psychological processes.
First, the induction hypothesis posits that the loneliness in oneperson contributes to or causes the loneliness in others. The emo-tional, cognitive, and behavioral consequences of loneliness maycontribute to the induction of loneliness. For instance, emotionalcontagion refers to the tendency for the facial expressions, vocaliza-tions, postures, and movements of interacting individuals to lead to aconvergence of their emotions (Hatfield, Cacioppo, & Rapson, 1994).When people feel lonely, they tend to be shyer, more anxious, morehostile, more socially awkward, and lower in self-esteem (e.g., Ber-scheid & Reis, 1998; Cacioppo et al., 2006). Emotional contagioncould therefore contribute to the spread of loneliness to those withwhom they interact. Cognitively, loneliness can affect and be affectedby what one perceives and desires in their social relationships (Peplau& Perlman, 1982; Rook, 1984; Wheeler, Reis, & Nezlek, 1983). Tothe extent that interactions with others in an individual’s social net-work influence a person’s ideal or perceived interpersonal relation-ship, that person’s loneliness should be influenced. Behaviorally,when people feel lonely, they tend to act toward others in a lesstrusting and more hostile fashion (e.g., Rotenberg, 1994; cf. Berscheid& Reis, 1998; Cacioppo & Patrick, 2008). These behaviors, in turn,may lower the satisfaction of others with the relationship or lead to aweakening or loss of the relationship and a consequent induction ofloneliness in others.
Second, the homophily hypothesis posits that lonely or non-lonely individuals choose one another as friends and becomeconnected (i.e., the tendency of like to attract like; McPherson,Smith-Lovin, & Cook, 2001). Byrne’s (1971) law of attractionspecifies that there is a direct linear relationship between interper-sonal attraction and the proportion of similar attitudes. The asso-ciation between similarity and attraction is not limited to attitudes,and the characteristics on which similarity operates move fromobvious characteristics (e.g., physical attractiveness) to less obvi-ous ones (social perceptions) as relationships develop and deepen(e.g., Neimeyer & Mitchell, 1988). Although feelings of lonelinesscan be transient, stable individual differences in loneliness mayhave sufficiently broad effects on social cognition, emotion, andbehavior to produce similarity-based social sorting.
Finally, the shared environment hypothesis posits that con-nected individuals jointly experience contemporaneous exposuresthat contribute to loneliness. Loneliness, for instance, tends to beelevated in matriculating students, because for many, their arrivalat college is associated with a rupture of normal ties with theirfamily and friends (Cutrona, 1982). People who interact within asocial network may also be more likely to be exposed to the samesocial challenges and upheavals (e.g., coresidence in a dangerousneighborhood, job loss, retirement).
To distinguish among these hypotheses requires repeated mea-sures of loneliness, longitudinal information about network ties,and information about the nature or direction of the ties (e.g., whonominated whom as a friend; Carrington, Scott, & Wasserman,2005; Fowler & Christakis, 2008b). With the recent application ofinnovative research methods to network linkage data from thepopulation-based Framingham Heart Study (FHS), these data arenow available and have been used to trace the distinctive pathsthrough which obesity (Christakis & Fowler, 2007), smoking
978 CACIOPPO, FOWLER, AND CHRISTAKIS

(Christakis & Fowler, 2008), and happiness (Fowler & Christakis,2008a) spread through people’s social networks. We sought here touse these methods and data to determine the role of social networkprocesses in loneliness, with an emphasis on determining the topog-raphy of loneliness in people’s social networks, the interdependenceof subjective experiences of loneliness and the observed position insocial networks, the path through which loneliness spreads throughthese networks, and factors that modulate its spread.
Method
Assembling the FHS Social Network Dataset
The FHS is a population-based, longitudinal, observational co-hort study that was initiated in 1948 to prospectively investigaterisk factors for cardiovascular disease. Since then, it has come tobe composed of four separate but related cohort populations: (1)the “Original Cohort,” enrolled in 1948 (n � 5,209); (2) the“Offspring Cohort” (the children of the Original Cohort andspouses of the children), enrolled in 1971 (n � 5,124); (3) the“Omni Cohort,” enrolled in 1994 (n � 508); and (4) the “Gener-ation 3 Cohort” (the grandchildren of the Original Cohort), en-rolled beginning in 2002 (n � 4,095). The Original Cohort actuallycaptured the majority of the adult residents of Framingham in1948, and there was little refusal to participate. The OffspringCohort included offspring of the Original Cohort and their spousesin 1971. The supplementary, multiethnic Omni Cohort was initi-ated to reflect the increased diversity in Framingham since theinception of the Original Cohort. For the Generation 3 Cohort,Offspring Cohort participants were asked to identify all theirchildren and the children’s spouses, and 4,095 participants wereenrolled beginning in 2002. Published reports provide details aboutsample composition and study design for all these cohorts(Cupples & D’Agnostino, 1988; Kannel, Feinleib, McNamara,Garrison, & Castelli, 1979; Quan et al., 1997).
Continuous surveillance and serial examinations of these co-horts provide longitudinal data. All of the participants are person-ally examined by FHS physicians and nurses (or, for the smallminority for whom this is not possible, evaluated by telephone)and watched continuously for outcomes. The Offspring study hascollected information on health events and risk factors roughlyevery 4 years. The Original Cohort has data available for roughlyevery 2 years. It is important to note that even participants whomigrate out of the town of Framingham (to points throughout theUnited States) remain in the study and, remarkably, come backevery few years to be examined and to complete survey forms; thatis, there is no necessary loss to follow-up because of out-migrationin this dataset, and very little loss to follow-up for any reason (e.g.,only 10 cases out of 5,124 in the Offspring Cohort have been lost).
For the purposes of the analyses reported here, exam waves forthe Original Cohort were aligned with those of the OffspringCohort, so that all participants in the social network were treatedas having been examined at just seven waves (in the same timewindows as the Offspring, as noted in Table 1).
The Offspring Cohort is the key cohort of interest here, and it isour source of the focal participants (FPs) in our network. How-ever, individuals to whom these FPs are linked—in any of the fourcohorts—are also included in the network. These linked individ-uals are termed linked participants (LPs). That is, whereas FPs
come only from the Offspring Cohort, LPs are drawn from theentire set of FHS cohorts (including also the Offspring Cohortitself). Hence, the total number of individuals in the FHS socialnetwork is 12,067, because LPs identified in the Original, Generation3, and Omni Cohorts are also included, as long as they were alive in1971 or later. Spouses who list a different address of residence thanthe FP are termed noncoresident spouses. There were 311 FPs withnoncoresident spouses in Exam 6 and 299 in Exam 7.
The physical, laboratory, and survey examinations of the FHSparticipants provide a wide array of data. At each evaluation, partic-ipants complete a battery of questionnaires (e.g., the Center forEpidemiological Studies Depression Scale [CES–D; Radloff, 1977]measure of depression and loneliness, as described below), aphysician-administered medical history (including review of symp-toms and hospitalizations), a physical examination administered byphysicians on site at the FHS facility, and a large variety of lab tests.
To ascertain the network ties, we computerized informationfrom archived, handwritten documents that had not previouslybeen used for research purposes, namely, the administrative track-ing sheets used by the FHS since 1971 by personnel responsiblefor calling participants to arrange their periodic examinations.These sheets record the answers when all 5,124 of the FPs wereasked to comprehensively identify relatives, friends, neighbors(based on address), coworkers (based on place of employment),and relatives who might be in a position to know where the FPswould be in 2 to 4 years. The key fact here that makes theseadministrative records so valuable for social network research isthat, given the compact nature of the Framingham population inthe period from 1971 to 2007, many of the nominated contactswere themselves also participants of one or another FHS cohort.
We have used these tracking sheets to develop network links forFHS Offspring participants to other participants in any of the fourFHS cohorts. Thus, for example, it is possible to know whichparticipants have a relationship (e.g., spouse, sibling, friend, co-worker, neighbor) with other participants. Of note, each link be-tween two people might be identified by either party identifyingthe other; this observation is most relevant to the “friend” link, aswe can make this link either when A nominates B as a friend, orwhen B nominates A (and, as discussed below, this directionalityis methodologically important and might also be substantivelyinteresting). People in any of the FHS cohorts may marry orbefriend or live next to each other. Finally, given the high qualityof addresses in the FHS data, the compact nature of Framingham,the wealth of information available about each participant’s resi-
Table 1Survey Waves and Sample Sizes of the Framingham OffspringCohort (Network Focal Participants)
Survey wave/physical exam
Timeperiod
No.alive
No. aliveand 18�
No.examined
% of adultsparticipating
Exam 1 1971–1975 5,124 4,914 5,124 100.0Exam 2 1979–1982 5,053 5,037 3,863 76.7Exam 3 1984–1987 4,974 4,973 3,873 77.9Exam 4 1987–1990 4,903 4,903 4,019 82.0Exam 5 1991–1995 4,793 4,793 3,799 79.3Exam 6 1996–1998 4,630 4,630 3,532 76.3Exam 7 1998–2001 4,486 4,486 3,539 78.9
979STRUCTURE AND SPREAD OF LONELINESS

dential history, and new mapping technologies, we determinedwho is whose neighbor, and we computed distances betweenindividuals (Fitzpatrick & Modlin, 1986).
The measure of loneliness was derived from the CES–D adminis-tered between 1983 and 2001 at times corresponding to the fifth, sixth,and seventh examinations of the Offspring Cohort. The median yearof examination for these individuals was 1986 for Exam 5, 1996 forExam 6, and 2000 for Exam 7. Participants are asked how oftenduring the previous week they experienced a particular feeling, withfour possible answers: 0–1 days, 1–2 days, 3–4 days, and 5–7 days.To convert these categories to days, we recoded these responses at thecenter of each range (0.5, 1.5, 3.5, and 6). Factor analyses of the itemsfrom the CES–D and the University of California, Los Angelesloneliness scales indicate that they represent two separate factors, andthe “I felt lonely” item from the CES–D scale loads on a separatefactor from the depression items (Cacioppo et al., 2006). The face-valid nature of the item also supported the use of the “How often I feltlonely” item to gauge loneliness.
Table 2 shows summary statistics for loneliness, network vari-ables, and control variables we use to study the statistical relation-ship between feeling lonely and being alone.
Statistical Information and Sensitivity Analyses
To distinguish among the induction, homophily, and sharedenvironment hypotheses requires repeated measures of loneliness,longitudinal information about network ties, and information aboutthe nature or direction of the ties (e.g., who nominated whom as afriend; Carrington et al., 2005; Fowler & Christakis, 2008b). Forthe analyses in Table 3, we averaged across waves to determine themean number of social contacts for people in each of the fourloneliness categories. For the analyses in Tables 4 and 5, weconsidered the prospective effect of LPs, social network variables,and other control variables on FP’s future loneliness. For theanalyses in Tables 6–12, we conducted regressions of FP loneli-ness as a function of FP’s age, gender, education, and loneliness inthe prior exam and of the gender and loneliness of an LP in thecurrent and prior exam. The lagged observations for Wave 7 arefrom Wave 6 and the lagged observations for Wave 6 are fromWave 5. Inclusion of FP loneliness at the prior exam eliminates
serial correlation in the errors and also substantially controls forFP’s genetic endowment and any intrinsic, stable tendency to belonely. LP’s loneliness at the prior exam helps control for homoph-ily (Carrington et al., 2005), which has been verified in MonteCarlo simulations (Fowler & Christakis, 2008b).
The key coefficient in these models that measures the effect ofinduction is on the variable for LP contemporaneous loneliness.We used generalized estimating equation (GEE) procedures toaccount for multiple observations of the same FP across waves andacross FP–LP pairings (Liang & Zeger, 1986). We assumed anindependent working correlation structure for the clusters (Schild-crout & Heagerty, 2005). These analyses underlie the resultspresented in Figure 4.
The GEE regression models in the tables provide parameter esti-mates that are approximately interpretable as effect sizes, indicatingthe number of extra days of loneliness per week the FP experiencesgiven a one-unit increase in the independent variable. Mean effectsizes and 95% confidence intervals (CIs) were calculated by simulat-ing the first difference in LP contemporaneous loneliness (changingfrom 0.5 days feeling lonely to 1.5 days) using 1,000 randomly drawnsets of estimates from the coefficient covariance matrix and assumingall other variables are held at their means (King, Tomz, & Wittenberg,2000). We also checked all results using an ordered logit specifica-tion, and none of these models changed the significance of anyreported result; we therefore decided to present the simpler and moreeasily interpretable linear specifications.
The regression coefficients have mostly the expected effects,such that, for example, FP’s prior loneliness is the strongestpredictor for current loneliness. The models in the tables includeexam fixed effects, which, combined with age at baseline, accountfor the aging of the population. The sample size is shown for eachmodel, reflecting the total number of all such ties, with multipleobservations for each tie if it was observed in more than one exam,and allowing for the possibility that a given person can havemultiple ties. As previously indicated, repeated observations werehandled with GEE procedures.
We evaluated the possibility of omitted variables or contempo-raneous events explaining the associations by examining how thetype or direction of the social relationship between FP and LPaffects the association between FP and LP. If unobserved factorsdrive the association between FP and LP friendship, then direc-tionality of friendship should not be relevant. Loneliness in the FPand the LP move up and down together in response to the unob-served factors. In contrast, if an FP names an LP as a friend but theLP does not reciprocate, then a causal relationship indicates thatthe LP significantly affects the FP, but the FP does not necessarilyaffect the LP.1 The Kamada-Kawai algorithm used to prepare the
1 We explored the sensitivity of our results to model specification byconducting numerous other analyses, each of which had various strengthsand limitations, but none of which yielded substantially different resultsthan those presented here. For example, we experimented with differenterror specifications. Although we identified only a single close friend formost of the FPs, we studied how multiple observations on some FPsaffected the standard errors of our models. Huber-White sandwich esti-mates with clustering on the FPs yielded very similar results. We alsotested for the presence of serial correlation in the GEE models using aLagrange multiplier test and found none remaining after including thelagged dependent variable (Beck, 2001).
Table 2Summary Statistics for the Framingham Offspring Cohort(Network Focal Participants)
Variable M SD Min Max
Current no. of days per weekfeeling lonely 0.853 0.964 0.5 6
Prior wave no. of days per weekfeeling lonely 0.940 1.086 0.5 6
Current no. of family members 2.819 3.071 0 23Prior wave no. of family
members 3.035 3.255 0 26Current no. of close friends 0.897 0.894 0 6Prior wave no. of close friends 0.951 0.911 0 6Female 0.549 0.498 0 1Years of education 13.573 2.409 2 17Age (years) 63.787 11.848 29.667 101.278
Note. Min � minimum; Max � maximum.
980 CACIOPPO, FOWLER, AND CHRISTAKIS
images in Figure 1 generates a matrix of shortest network pathdistances from each node to all other nodes in the network andrepositions nodes so as to reduce the sum of the difference betweenthe plotted distances and the network distances (Kamada & Kawai,1989). The fundamental pattern of ties in a social network (knownas the “topology”) is fixed, but how this pattern is visually ren-dered depends on the analyst’s objectives.
Results
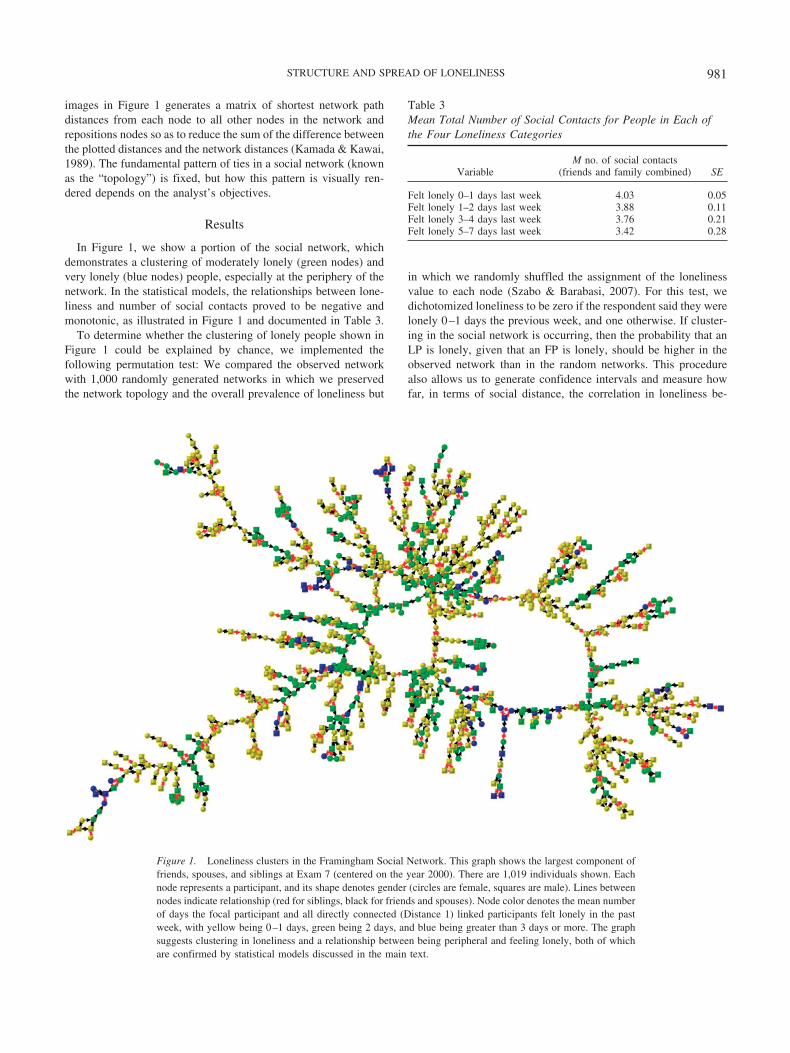
In Figure 1, we show a portion of the social network, whichdemonstrates a clustering of moderately lonely (green nodes) andvery lonely (blue nodes) people, especially at the periphery of thenetwork. In the statistical models, the relationships between lone-liness and number of social contacts proved to be negative andmonotonic, as illustrated in Figure 1 and documented in Table 3.
To determine whether the clustering of lonely people shown inFigure 1 could be explained by chance, we implemented thefollowing permutation test: We compared the observed networkwith 1,000 randomly generated networks in which we preservedthe network topology and the overall prevalence of loneliness but
in which we randomly shuffled the assignment of the lonelinessvalue to each node (Szabo & Barabasi, 2007). For this test, wedichotomized loneliness to be zero if the respondent said they werelonely 0–1 days the previous week, and one otherwise. If cluster-ing in the social network is occurring, then the probability that anLP is lonely, given that an FP is lonely, should be higher in theobserved network than in the random networks. This procedurealso allows us to generate confidence intervals and measure howfar, in terms of social distance, the correlation in loneliness be-
Figure 1. Loneliness clusters in the Framingham Social Network. This graph shows the largest component offriends, spouses, and siblings at Exam 7 (centered on the year 2000). There are 1,019 individuals shown. Eachnode represents a participant, and its shape denotes gender (circles are female, squares are male). Lines betweennodes indicate relationship (red for siblings, black for friends and spouses). Node color denotes the mean numberof days the focal participant and all directly connected (Distance 1) linked participants felt lonely in the pastweek, with yellow being 0–1 days, green being 2 days, and blue being greater than 3 days or more. The graphsuggests clustering in loneliness and a relationship between being peripheral and feeling lonely, both of whichare confirmed by statistical models discussed in the main text.
Table 3Mean Total Number of Social Contacts for People in Each ofthe Four Loneliness Categories
VariableM no. of social contacts
(friends and family combined) SE
Felt lonely 0–1 days last week 4.03 0.05Felt lonely 1–2 days last week 3.88 0.11Felt lonely 3–4 days last week 3.76 0.21Felt lonely 5–7 days last week 3.42 0.28
981STRUCTURE AND SPREAD OF LONELINESS

tween FP and LP reaches. As described below and illustrated inFigure 2, we found a significant relationship between FP and LPloneliness, and this relationship extends up to three degrees ofseparation. In other words, a person’s loneliness depends not juston his friend’s loneliness but also extends to his friend’s friend andhis friend’s friend’s friend. The full network shows that partici-pants are 52% (95% CI � 40% to 65%) more likely to be lonelyif a person to whom they are directly connected (at one degree ofseparation) is lonely. The size of the effect for people at twodegrees of separation (e.g., the friend of a friend) is 25% (95%CI � 14% to 36%), and for people at three degrees of separation(e.g., the friend of a friend of a friend), it is 15% (95% CI � 6%to 26%). At four degrees of separation, the effect disappears (2%;95% CI � �5% to 10%), in keeping with the “three degrees ofinfluence” rule of social network contagion that has been exhibitedfor obesity, smoking, and happiness (e.g., Christakis & Fowler,2007, 2008; Fowler & Christakis, 2008a).
The first model in Table 4, depicted in the first three columns,shows that (a) loneliness in the prior wave predicts loneliness inthe current wave, and (b) current feelings of loneliness are muchmore closely tied to our networks of optional social connections,measured at the prior wave, than to those that are handed to usupon birth or to demographic features of the individuals. Peoplewith more friends are less likely to experience loneliness in thefuture, and each extra friend appears to reduce the frequency offeeling lonely by 0.04 days per week. That may not seem like
much, but there are 52 weeks in a year, so this is equivalent toabout 2 extra days of loneliness per year; because, on average (inour data) people feel lonely 48 days per year, having a couple ofextra friends decreases loneliness by about 10% for the averageperson. The same model shows that the number of family membershas no effect at all.
Analyses also showed that loneliness shapes social networks.Model 2 in Table 4, depicted in the middle three columns, showsthat people who feel lonely at an assessment are less likely to havefriends by the next assessment. In fact, compared with people whoare never lonely, they lose about 8% of their friends on average bythe time they take their next exam in roughly 4 years. For com-parison, and not surprisingly, the results depicted in the thirdmodel in Table 4 (last three columns) show that loneliness has noeffect on the future number of family members a person has. Theseresults are symmetric to both incoming and outgoing ties (notshown; available on request). Lonely people tend to receive fewerfriendship nominations, but they also tend to name fewer people asfriends. What this means is that loneliness is both a cause and aconsequence of becoming disconnected. These results suggest thatour emotions and networks reinforce each other and create arich-gets-richer cycle that benefits those with the most friends.People with few friends are more likely to become lonelier overtime, which then makes it less likely that they will attract or try toform new social ties.
We also find that social connections and the loneliness of thepeople to whom these connections are directed interact to affecthow people feel. Figure 3 shows the smoothed bivariate relation-ship between the fraction of a person’s friends and family who arelonely at one exam and the number of days per week that personfeels lonely at the following exam. The relationship is significantand adds an extra quarter day of loneliness per week to the averageperson who is surrounded by other lonely people, compared withthose who are not connected to anyone who is lonely. In Table 5,we present a statistical model of the effect of lonely and nonlonelyLPs on future FP loneliness that includes controls for age, educa-tion, and gender. This model shows that each additional lonely LPsignificantly increases the number of days a FP feels lonely at thenext exam ( p � .001). Conversely, each additional nonlonely LPsignificantly reduces the number of days a participant feels lonelyat the next exam ( p � .002). But these effects are asymmetric:Lonely LPs are about two and a half times more influential thannonlonely LPs, and the difference in these effect sizes is itselfsignificant ( p � .01). Thus, the feeling of loneliness seems tospread more easily than a feeling of belonging.
To study person-to-person effects, we examined the direct tiesand individual-level determinants of FP loneliness. In the GEEmodels we present in Tables 6–12, we control for several factors,as noted earlier, and the effect of social influence from one personon another is captured by the “Days/Week LP Currently Lonely”coefficient in the first row. We have highlighted in bold the socialinfluence coefficients that are significant. Figure 4 summarizes theresults from these models for friends, spouses, siblings, and neigh-bors. Each extra day of loneliness in a “nearby” friend (who liveswithin 1 mile) increases the number of days FP is lonely by 0.29days (95% CI � 0.07 to 0.50; see the first model in Table 6). Incontrast, more distant friends (who live more than 1 mile away)have no significant effect on FP, and the effect size appears todecline with distance (see the second model in Table 6). Among
Figure 2. Social distance and loneliness in the Framingham Social Net-work. This figure shows for each exam the percentage increase in thelikelihood a given focal participant (FP) is lonely if a friend or familymember at a certain social distance is lonely (where lonely is defined asfeeling lonely more than once a week). The relationship is strongestbetween individuals who are directly connected, but it remains signifi-cantly greater than zero at social distances up to three degrees of separa-tion, meaning that a person’s loneliness is associated with the loneliness ofpeople up to three degrees removed from them in the network. Values arederived by comparing the conditional probability of being lonely in theobserved network with an identical network (with topology and incidenceof loneliness preserved) in which the same number of lonely participantsare randomly distributed. Linked participant (LP) social distance refers toclosest social distance between the LP and FP (LP � Distance 1, LP’sLP � Distance 2, etc.). Error bars show 95% confidence intervals.
982 CACIOPPO, FOWLER, AND CHRISTAKIS

friends, we can distinguish additional possibilities. Because eachperson was asked to name a friend, and not all of these nomina-tions were reciprocated, we have FP-perceived friends (denoted“friends”), “LP-perceived friends” (LP named FP as a friend, butnot vice versa) and “mutual friends” (FP and LP nominated each
other). Nearby mutual friends have a stronger effect than nearbyFP-perceived friends; each day they are lonely adds 0.41 days ofloneliness for the FP (95% CI � 0.14 to 0.67; see the third model
Figure 3. Lonely linked participants (LPs) in the Framingham SocialNetwork. This plot shows that the number of days per week a person feelslonely in Exams 6 and 7 is positively associated with the fraction of theirfriends and family in the previous exam who are lonely (those who say theyare lonely more than one day a week). The solid line shows smoothedrelationship based on bivariate LOESS regression, and dotted lines indicate95% confidence intervals. The results show that people surrounded byother lonely people are themselves more likely to feel lonely in the future.
Table 4Prospective Influence of Friends and Family on Loneliness and Vice Versa
Variable
Current wave
Days/week feel lonely No. of friends No. of family
Coef SE p Coef SE p Coef SE p
Prior wave days/week feel lonely 0.257 0.021 .000 �0.010 0.004 .010 �0.007 0.006 .227Prior wave no. of friends �0.040 0.013 .002 0.900 0.007 .000 �0.029 0.007 .000Prior wave no. of family �0.001 0.004 .797 �0.003 0.002 .046 0.933 0.003 .000Age 0.006 0.001 .000 �0.002 0.000 .000 0.002 0.001 .003Years of education �0.014 0.006 .019 0.003 0.002 .145 �0.005 0.003 .033Female 0.124 0.024 .000 �0.016 0.009 .067 0.014 0.012 .240Exam 7 0.043 0.022 .057 0.007 0.009 .419 0.041 0.012 .001Constant 0.112 0.196 .569 0.092 0.075 .223 �0.275 0.089 .002Deviance 5,065 720 1,288Null deviance 5,656 4,866 57,349N 6,083 6,083 6,083
Note. Coef � coefficient. Results for linear regression of focal participant’s loneliness, number of friends, and number of family members at current exam on priorloneliness, number of friends, and number of family, plus other covariates. Models were estimated using a general estimating equation with clustering on the focal participantand an independent working covariance structure (Liang & Zeger, 1986; Schildcrout & Heagerty, 2005). Models with an exchangeable correlation structure yielded poorerfit. Fit statistics show sum of squared deviance between predicted and observed values for the model and a null model with no covariates (Wei, 2002). The main results(coefficients in bold) show that number of friends is associated with a decrease in future loneliness, and loneliness is associated with a decrease in future friends.
Table 5Influence of Number of Lonely Linked Participants on FocalParticipant Loneliness
Variable
Current wave days/week feellonely
Coef SE p
Prior wave number of lonely LPs 0.064 0.017 .000Prior wave number of nonlonely LPs �0.024 0.008 .002Prior wave days/week feel lonely 0.230 0.022 .000Age 0.003 0.002 .030Years of education �0.003 0.006 .641Female 0.121 0.025 .000Exam 7 0.053 0.024 .027Constant 0.037 0.206 .858Deviance 3,487Null deviance 3,831N 4,879
Note. Coef � coefficient; LP � linked participant. Results for linear regres-sion of focal participant’s loneliness, on prior loneliness, number of lonelyfriends and family (�1 day of loneliness per week), number of nonlonelyfriends and family (0–1 days of loneliness per week), and other covariates.Models were estimated using a general estimating equation with clustering onthe focal participant and an independent working covariance structure (Liang& Zeger, 1986; Schildcrout & Heagerty, 2005). Models with an exchangeablecorrelation structure yielded poorer fit. Fit statistics show sum of squareddeviance between predicted and observed values for the model and a nullmodel with no covariates (Wei, 2002). The main results (coefficients in bold)show that number of lonely LPs is associated with an increase in futureloneliness and the number of nonlonely LPs is associated with a decrease infuture loneliness. Moreover, the lonely LP effect is significantly stronger thanthe nonlonely LP effect ( p � .01, calculated by drawing 1000 pairs ofcoefficients from the coefficient covariance matrix produced by the model).
983STRUCTURE AND SPREAD OF LONELINESS

in the third column of Table 6). In contrast, the influence of nearbyLP-perceived friends is not significant ( p � .25; see the fourthmodel in the fourth column of Table 6). If the associations in thesocial network were merely due to confounding, the significanceand effect sizes for different types of friendships should be similar.That is, if some third factor were explaining both FP and LPloneliness, it should not respect the directionality or strength of thetie.
We also find significant effects for other kinds of LPs. Each daya coresident spouse is lonely yields 0.10 extra days of lonelinessfor the FP (95% CI � 0.02 to 0.17; see the fifth model in Table 6),
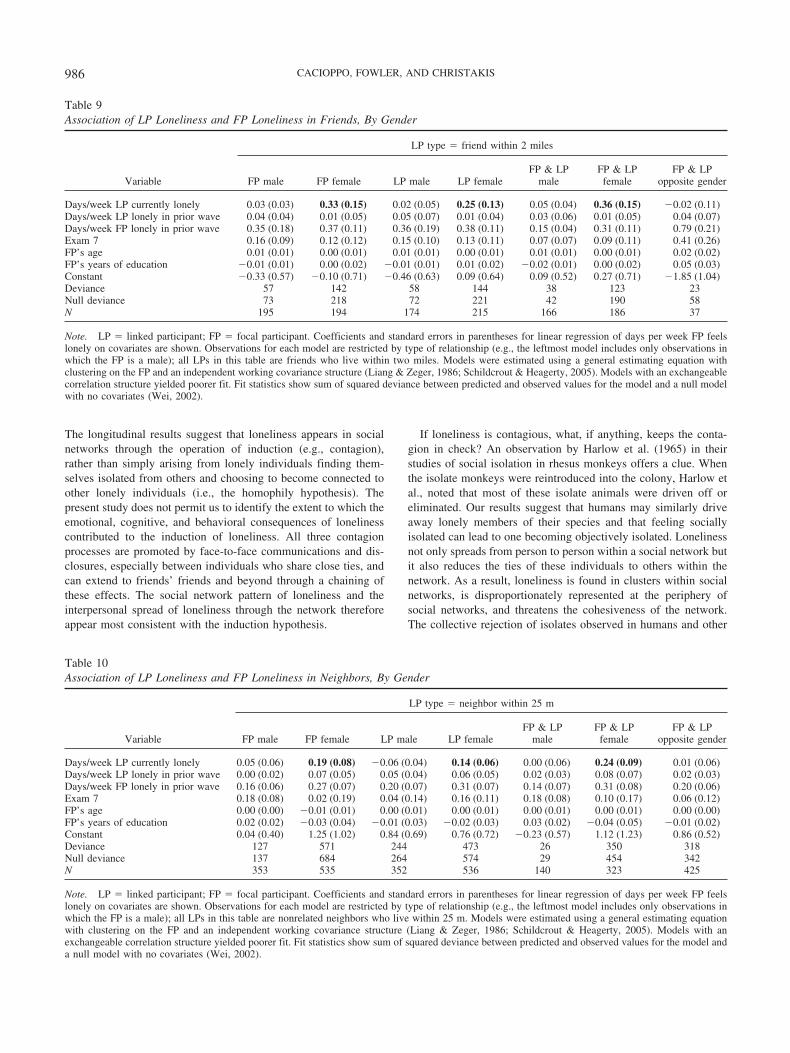
whereas noncoresident spouses have no significant effect (see thesixth model). Next-door neighbors who experience an extra day ofloneliness increase FP’s loneliness by 0.21 days (95% CI � 0.04to 0.38; see the third model in the third column of Table 7), but thiseffect quickly drops close to zero among neighbors who live on thesame block (within 25 m; see the fourth model in Table 7). Allthese relationships indicate the importance of physical proximity,and the strong influence of neighbors suggests that the spread ofloneliness may possibly depend more on frequent social contact inolder adults. But siblings do not appear to affect one another at all(even the ones who live nearby; see the first model in Table 7),which provides additional evidence that loneliness in older adultsis about the relationships people choose, rather than the relation-ships they inherit. And spouses appear to be an intermediatecategory; Table 8 shows that spouses are significantly less influ-ential than friends in the spread of loneliness from person to person(as indicated by the significant interaction term in the first row ofTable 8).
Analyses separated by gender suggested that loneliness spreadsmore easily among women than among men and that this holds forboth friends and neighbors. As shown in the coefficients in the firstrow of Tables 9 and 10, women are more likely to be affected bythe loneliness of both their friends (see Table 9) and neighbors (seeTable 10), and their loneliness is more likely to spread to otherpeople in their social network. The coefficients in bold show thatsocial influence is greatest when the FP or the LP is female.Women also reported higher levels of loneliness than did men. Weare reporting estimates from a linear model, however, so thebaseline rate of loneliness should not affect the absolute differ-ences that we observed. (We would be more concerned about thispossible effect if we were reporting odds ratios or risk ratios thatare sensitive to the baseline.) In a linear model, any additivedifferences in baseline should be captured by the sex variable inthe model, which does show a significantly higher baseline forwomen. However, because we include this control, the baseline
Figure 4. Linked participant (LP) type and loneliness in the FraminghamSocial Network. This figure shows that friends, spouses, and neighborssignificantly influence loneliness, but only if they live very close to thefocal participant. Effects are estimated using generalized estimating equa-tion linear models on several different subsamples of the FraminghamSocial Network (see Tables 6 and 7).
Table 6Association of LP Loneliness and FP Loneliness
Variable
LP type
Nearbyfriend
Distantfriend
Nearbymutual friend
Nearby LP:Perceived friend
Coresidentspouse
Noncoresidentspouse
Days/week LP currently lonely 0.29 (0.11) �0.08 (0.05) 0.41 (0.13) 0.35 (0.30) 0.10 (0.04) 0.08 (0.05)Days/week LP lonely in prior wave 0.12 (0.05) 0.11 (0.05) 0.16 (0.09) 0.02 (0.08) 0.03 (0.02) 0.06 (0.05)Days/week FP lonely in prior wave 0.31 (0.13) 0.39 (0.09) 0.28 (0.14) 0.10 (0.05) 0.21 (0.04) 0.04 (0.05)Exam 7 0.11 (0.09) 0.05 (0.07) 0.04 (0.16) �0.07 (0.09) 0.08 (0.03) 0.01 (0.08)FP’s age 0.01 (0.01) 0.01 (0.01) 0.01 (0.01) 0.01 (0.01) 0.00 (0.00) �0.01 (0.00)FP female 0.18 (0.09) 0.06 (0.08) 0.17 (0.14) 0.12 (0.14) 0.11 (0.03) 0.04 (0.08)FP’s years of education 0.00 (0.01) �0.01 (0.02) 0.01 (0.02) 0.05 (0.03) 0.00 (0.01) �0.05 (0.02)Constant �0.30 (0.43) �0.04 (0.60) �0.78 (0.60) �0.89 (0.71) 0.48 (0.20) 1.65 (0.51)Deviance 236 677 138 122 1,575 275Null deviance 375 899 285 145 1,734 290N 472 1,014 214 274 3,716 592
Note. LP � linked participant; FP � focal participant. Coefficients and standard errors in parentheses for linear regression of days per week FP feelslonely on covariates are shown. Observations for each model are restricted by type of relationship (e.g., the leftmost model includes only observations inwhich the FP named the LP as a “friend” in the previous and current period, and the friend is “nearby,” i.e., lives no more than 1 mile away). Models wereestimated using a general estimating equation with clustering on the FP and an independent working covariance structure (Liang & Zeger, 1986; Schildcrout& Heagerty, 2005). Models with an exchangeable correlation structure yielded poorer fit. Fit statistics show sum of squared deviance between predictedand observed values for the model and a null model with no covariates (Wei, 2002).
984 CACIOPPO, FOWLER, AND CHRISTAKIS

difference in men and women should not affect the interpretationof the absolute number of days each additional day of lonelinessexperienced by an LP contributes to the loneliness experienced byan FP.
Finally, our measure of loneliness was derived from the “I feellonely” item in the CES–D. To address whether our results would
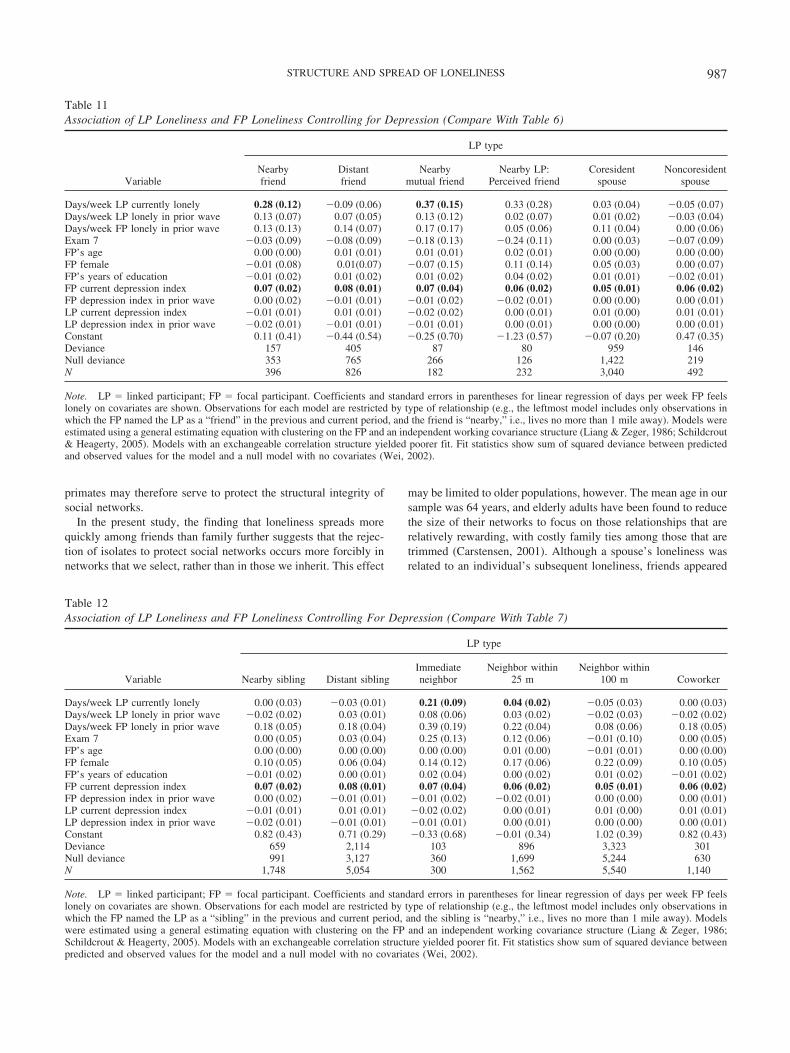
change if depression were included in the models, we created adepression index by summing the other 19 questions in the CES–D(dropping the question on loneliness). The Pearson correlationbetween the indices in our data is 0.566. If depression is causingthe correlation in loneliness between social contacts, then thecoefficient on LP loneliness should be reduced to insignificancewhen we add depression variables to the models in Tables 6 and 7.Specifically, we added a contemporaneous and lagged variable forboth FP’s and LP’s depression. The results in Tables 11 and 12show that there is a significant association between FP currentdepression and FP current loneliness (the eighth row in bold), butother depression variables have no effect, and adding them to themodel has little effect on the association between FP and LPloneliness. Loneliness in nearby friends, nearby mutual friends,immediate neighbors, and nearby neighbors all remain signifi-cantly associated with FP loneliness.
Discussion
The present research shows that what might appear to be aquintessential individualistic experience—loneliness—is not onlya function of the individual but is also a property of groups ofpeople. People who are lonely tend to be linked to others who arelonely, an effect that is stronger for geographically proximal thandistant friends yet extends up to three degrees of separation(friends’ friends’ friends) within the social network. The nature ofthe friendship matters, as well, in that nearby mutual friends showstronger effects than nearby ordinary friends. If some third factorwere explaining both focal and linked participants’ loneliness, thenloneliness should not be contingent on the different types offriendship or the directionality of the tie. These results, therefore,argue against loneliness within networks primarily reflectingshared environments.
Longitudinal analyses also indicated that nonlonely individualswho are around lonely individuals tend to grow lonelier over time.
Table 7Association of LP Loneliness and FP Loneliness
Variable
LP type
Nearbysibling
Distantsibling
Immediateneighbor
Neighbor within25 m
Neighbor within100 m Coworker
Days/week LP currently lonely 0.00 (0.03) �0.03 (0.01) 0.21 (0.09) 0.04 (0.02) �0.05 (0.03) 0.00 (0.03)Days/week LP lonely in prior wave �0.02 (0.02) 0.03 (0.01) 0.08 (0.06) 0.03 (0.02) �0.02 (0.03) �0.02 (0.02)Days/week FP lonely in prior wave 0.18 (0.05) 0.18 (0.04) 0.39 (0.19) 0.22 (0.04) 0.08 (0.06) 0.18 (0.05)Exam 7 0.00 (0.05) 0.03 (0.04) 0.25 (0.13) 0.12 (0.06) �0.01 (0.10) 0.00 (0.05)FP’s age 0.00 (0.00) 0.00 (0.00) 0.00 (0.00) 0.01 (0.00) �0.01 (0.01) 0.00 (0.00)FP female 0.10 (0.05) 0.06 (0.04) 0.14 (0.12) 0.17 (0.06) 0.22 (0.09) 0.10 (0.05)FP’s years of education �0.01 (0.02) 0.00 (0.01) 0.02 (0.04) 0.00 (0.02) 0.01 (0.02) �0.01 (0.02)Constant 0.82 (0.43) 0.71 (0.29) �0.33 (0.68) �0.01 (0.34) 1.02 (0.39) 0.82 (0.43)Deviance 1,065 3,729 205 1,618 5,738 636Null deviance 1,140 3,954 366 1,930 6,278 665N 2,124 6,168 364 1,904 6,888 1,330
Note. LP � linked participant; FP � focal participant. Coefficients and standard errors in parentheses for linear regression of days per week FP feelslonely on covariates are shown. Observations for each model are restricted by type of relationship (e.g., the leftmost model includes only observations inwhich the FP named the LP as a “sibling” in the previous and current period, and the sibling is “nearby,” i.e., lives no more than 1 mile away). Modelswere estimated using a general estimating equation with clustering on the FP and an independent working covariance structure (Liang & Zeger, 1986;Schildcrout & Heagerty, 2005). Models with an exchangeable correlation structure yielded poorer fit. Fit statistics show sum of squared deviance betweenpredicted and observed values for the model and a null model with no covariates (Wei, 2002).
Table 8Influence of Type of Relationship on Association Between LPLoneliness and FP Loneliness
Variable Coef SE p
LP is Spouse � Days/Week LPCurrently Lonely �0.274 0.138 .047
Days/week LP currently lonely 0.364 0.131 .005LP is spouse (instead of friend) 0.165 0.092 .074Days/week LP lonely in prior wave 0.046 0.022 .033Days/week FP lonely in prior wave 0.227 0.046 .000Exam 7 0.082 0.031 .009FP’s age 0.000 0.002 .914Female 0.117 0.032 .000FP’s years of education �0.005 0.006 .470Constant 0.232 0.204 .255Deviance 910Null deviance 1,056N 2,094
Note. LP � linked participant; FP � focal participant. Results for linearregression of days per week FP feels lonely at next exam on covariates areshown. Sample includes all spouses and nearby friends (nearby � �1 mileaway). The interaction term in the first row tests the hypothesis thatspouses have less influence than friends on loneliness. Models were esti-mated using a general estimating equation with clustering on the FP and anindependent working covariance structure (Liang & Zeger, 1986; Schild-crout & Heagerty, 2005). Models with an exchangeable correlation struc-ture yielded poorer fit. Fit statistics show sum of squared deviance betweenpredicted and observed values for the model and a null model with nocovariates (Wei, 2002). The results show that spouses exert significantlyless influence on each other than friends.
985STRUCTURE AND SPREAD OF LONELINESS
The longitudinal results suggest that loneliness appears in socialnetworks through the operation of induction (e.g., contagion),rather than simply arising from lonely individuals finding them-selves isolated from others and choosing to become connected toother lonely individuals (i.e., the homophily hypothesis). Thepresent study does not permit us to identify the extent to which theemotional, cognitive, and behavioral consequences of lonelinesscontributed to the induction of loneliness. All three contagionprocesses are promoted by face-to-face communications and dis-closures, especially between individuals who share close ties, andcan extend to friends’ friends and beyond through a chaining ofthese effects. The social network pattern of loneliness and theinterpersonal spread of loneliness through the network thereforeappear most consistent with the induction hypothesis.
If loneliness is contagious, what, if anything, keeps the conta-gion in check? An observation by Harlow et al. (1965) in theirstudies of social isolation in rhesus monkeys offers a clue. Whenthe isolate monkeys were reintroduced into the colony, Harlow etal., noted that most of these isolate animals were driven off oreliminated. Our results suggest that humans may similarly driveaway lonely members of their species and that feeling sociallyisolated can lead to one becoming objectively isolated. Lonelinessnot only spreads from person to person within a social network butit also reduces the ties of these individuals to others within thenetwork. As a result, loneliness is found in clusters within socialnetworks, is disproportionately represented at the periphery ofsocial networks, and threatens the cohesiveness of the network.The collective rejection of isolates observed in humans and other
Table 9Association of LP Loneliness and FP Loneliness in Friends, By Gender
Variable
LP type � friend within 2 miles
FP male FP female LP male LP femaleFP & LP
maleFP & LP
femaleFP & LP
opposite gender
Days/week LP currently lonely 0.03 (0.03) 0.33 (0.15) 0.02 (0.05) 0.25 (0.13) 0.05 (0.04) 0.36 (0.15) �0.02 (0.11)Days/week LP lonely in prior wave 0.04 (0.04) 0.01 (0.05) 0.05 (0.07) 0.01 (0.04) 0.03 (0.06) 0.01 (0.05) 0.04 (0.07)Days/week FP lonely in prior wave 0.35 (0.18) 0.37 (0.11) 0.36 (0.19) 0.38 (0.11) 0.15 (0.04) 0.31 (0.11) 0.79 (0.21)Exam 7 0.16 (0.09) 0.12 (0.12) 0.15 (0.10) 0.13 (0.11) 0.07 (0.07) 0.09 (0.11) 0.41 (0.26)FP’s age 0.01 (0.01) 0.00 (0.01) 0.01 (0.01) 0.00 (0.01) 0.01 (0.01) 0.00 (0.01) 0.02 (0.02)FP’s years of education �0.01 (0.01) 0.00 (0.02) �0.01 (0.01) 0.01 (0.02) �0.02 (0.01) 0.00 (0.02) 0.05 (0.03)Constant �0.33 (0.57) �0.10 (0.71) �0.46 (0.63) 0.09 (0.64) 0.09 (0.52) 0.27 (0.71) �1.85 (1.04)Deviance 57 142 58 144 38 123 23Null deviance 73 218 72 221 42 190 58N 195 194 174 215 166 186 37
Note. LP � linked participant; FP � focal participant. Coefficients and standard errors in parentheses for linear regression of days per week FP feelslonely on covariates are shown. Observations for each model are restricted by type of relationship (e.g., the leftmost model includes only observations inwhich the FP is a male); all LPs in this table are friends who live within two miles. Models were estimated using a general estimating equation withclustering on the FP and an independent working covariance structure (Liang & Zeger, 1986; Schildcrout & Heagerty, 2005). Models with an exchangeablecorrelation structure yielded poorer fit. Fit statistics show sum of squared deviance between predicted and observed values for the model and a null modelwith no covariates (Wei, 2002).
Table 10Association of LP Loneliness and FP Loneliness in Neighbors, By Gender
Variable
LP type � neighbor within 25 m
FP male FP female LP male LP femaleFP & LP
maleFP & LP
femaleFP & LP
opposite gender
Days/week LP currently lonely 0.05 (0.06) 0.19 (0.08) �0.06 (0.04) 0.14 (0.06) 0.00 (0.06) 0.24 (0.09) 0.01 (0.06)Days/week LP lonely in prior wave 0.00 (0.02) 0.07 (0.05) 0.05 (0.04) 0.06 (0.05) 0.02 (0.03) 0.08 (0.07) 0.02 (0.03)Days/week FP lonely in prior wave 0.16 (0.06) 0.27 (0.07) 0.20 (0.07) 0.31 (0.07) 0.14 (0.07) 0.31 (0.08) 0.20 (0.06)Exam 7 0.18 (0.08) 0.02 (0.19) 0.04 (0.14) 0.16 (0.11) 0.18 (0.08) 0.10 (0.17) 0.06 (0.12)FP’s age 0.00 (0.00) �0.01 (0.01) 0.00 (0.01) 0.00 (0.01) 0.00 (0.01) 0.00 (0.01) 0.00 (0.00)FP’s years of education 0.02 (0.02) �0.03 (0.04) �0.01 (0.03) �0.02 (0.03) 0.03 (0.02) �0.04 (0.05) �0.01 (0.02)Constant 0.04 (0.40) 1.25 (1.02) 0.84 (0.69) 0.76 (0.72) �0.23 (0.57) 1.12 (1.23) 0.86 (0.52)Deviance 127 571 244 473 26 350 318Null deviance 137 684 264 574 29 454 342N 353 535 352 536 140 323 425
Note. LP � linked participant; FP � focal participant. Coefficients and standard errors in parentheses for linear regression of days per week FP feelslonely on covariates are shown. Observations for each model are restricted by type of relationship (e.g., the leftmost model includes only observations inwhich the FP is a male); all LPs in this table are nonrelated neighbors who live within 25 m. Models were estimated using a general estimating equationwith clustering on the FP and an independent working covariance structure (Liang & Zeger, 1986; Schildcrout & Heagerty, 2005). Models with anexchangeable correlation structure yielded poorer fit. Fit statistics show sum of squared deviance between predicted and observed values for the model anda null model with no covariates (Wei, 2002).
986 CACIOPPO, FOWLER, AND CHRISTAKIS
primates may therefore serve to protect the structural integrity ofsocial networks.
In the present study, the finding that loneliness spreads morequickly among friends than family further suggests that the rejec-tion of isolates to protect social networks occurs more forcibly innetworks that we select, rather than in those we inherit. This effect
may be limited to older populations, however. The mean age in oursample was 64 years, and elderly adults have been found to reducethe size of their networks to focus on those relationships that arerelatively rewarding, with costly family ties among those that aretrimmed (Carstensen, 2001). Although a spouse’s loneliness wasrelated to an individual’s subsequent loneliness, friends appeared
Table 11Association of LP Loneliness and FP Loneliness Controlling for Depression (Compare With Table 6)
Variable
LP type
Nearbyfriend
Distantfriend
Nearbymutual friend
Nearby LP:Perceived friend
Coresidentspouse
Noncoresidentspouse
Days/week LP currently lonely 0.28 (0.12) �0.09 (0.06) 0.37 (0.15) 0.33 (0.28) 0.03 (0.04) �0.05 (0.07)Days/week LP lonely in prior wave 0.13 (0.07) 0.07 (0.05) 0.13 (0.12) 0.02 (0.07) 0.01 (0.02) �0.03 (0.04)Days/week FP lonely in prior wave 0.13 (0.13) 0.14 (0.07) 0.17 (0.17) 0.05 (0.06) 0.11 (0.04) 0.00 (0.06)Exam 7 �0.03 (0.09) �0.08 (0.09) �0.18 (0.13) �0.24 (0.11) 0.00 (0.03) �0.07 (0.09)FP’s age 0.00 (0.00) 0.01 (0.01) 0.01 (0.01) 0.02 (0.01) 0.00 (0.00) 0.00 (0.00)FP female �0.01 (0.08) 0.01(0.07) �0.07 (0.15) 0.11 (0.14) 0.05 (0.03) 0.00 (0.07)FP’s years of education �0.01 (0.02) 0.01 (0.02) 0.01 (0.02) 0.04 (0.02) 0.01 (0.01) �0.02 (0.01)FP current depression index 0.07 (0.02) 0.08 (0.01) 0.07 (0.04) 0.06 (0.02) 0.05 (0.01) 0.06 (0.02)FP depression index in prior wave 0.00 (0.02) �0.01 (0.01) �0.01 (0.02) �0.02 (0.01) 0.00 (0.00) 0.00 (0.01)LP current depression index �0.01 (0.01) 0.01 (0.01) �0.02 (0.02) 0.00 (0.01) 0.01 (0.00) 0.01 (0.01)LP depression index in prior wave �0.02 (0.01) �0.01 (0.01) �0.01 (0.01) 0.00 (0.01) 0.00 (0.00) 0.00 (0.01)Constant 0.11 (0.41) �0.44 (0.54) �0.25 (0.70) �1.23 (0.57) �0.07 (0.20) 0.47 (0.35)Deviance 157 405 87 80 959 146Null deviance 353 765 266 126 1,422 219N 396 826 182 232 3,040 492
Note. LP � linked participant; FP � focal participant. Coefficients and standard errors in parentheses for linear regression of days per week FP feelslonely on covariates are shown. Observations for each model are restricted by type of relationship (e.g., the leftmost model includes only observations inwhich the FP named the LP as a “friend” in the previous and current period, and the friend is “nearby,” i.e., lives no more than 1 mile away). Models wereestimated using a general estimating equation with clustering on the FP and an independent working covariance structure (Liang & Zeger, 1986; Schildcrout& Heagerty, 2005). Models with an exchangeable correlation structure yielded poorer fit. Fit statistics show sum of squared deviance between predictedand observed values for the model and a null model with no covariates (Wei, 2002).
Table 12Association of LP Loneliness and FP Loneliness Controlling For Depression (Compare With Table 7)
Variable
LP type
Nearby sibling Distant siblingImmediateneighbor
Neighbor within25 m
Neighbor within100 m Coworker
Days/week LP currently lonely 0.00 (0.03) �0.03 (0.01) 0.21 (0.09) 0.04 (0.02) �0.05 (0.03) 0.00 (0.03)Days/week LP lonely in prior wave �0.02 (0.02) 0.03 (0.01) 0.08 (0.06) 0.03 (0.02) �0.02 (0.03) �0.02 (0.02)Days/week FP lonely in prior wave 0.18 (0.05) 0.18 (0.04) 0.39 (0.19) 0.22 (0.04) 0.08 (0.06) 0.18 (0.05)Exam 7 0.00 (0.05) 0.03 (0.04) 0.25 (0.13) 0.12 (0.06) �0.01 (0.10) 0.00 (0.05)FP’s age 0.00 (0.00) 0.00 (0.00) 0.00 (0.00) 0.01 (0.00) �0.01 (0.01) 0.00 (0.00)FP female 0.10 (0.05) 0.06 (0.04) 0.14 (0.12) 0.17 (0.06) 0.22 (0.09) 0.10 (0.05)FP’s years of education �0.01 (0.02) 0.00 (0.01) 0.02 (0.04) 0.00 (0.02) 0.01 (0.02) �0.01 (0.02)FP current depression index 0.07 (0.02) 0.08 (0.01) 0.07 (0.04) 0.06 (0.02) 0.05 (0.01) 0.06 (0.02)FP depression index in prior wave 0.00 (0.02) �0.01 (0.01) �0.01 (0.02) �0.02 (0.01) 0.00 (0.00) 0.00 (0.01)LP current depression index �0.01 (0.01) 0.01 (0.01) �0.02 (0.02) 0.00 (0.01) 0.01 (0.00) 0.01 (0.01)LP depression index in prior wave �0.02 (0.01) �0.01 (0.01) �0.01 (0.01) 0.00 (0.01) 0.00 (0.00) 0.00 (0.01)Constant 0.82 (0.43) 0.71 (0.29) �0.33 (0.68) �0.01 (0.34) 1.02 (0.39) 0.82 (0.43)Deviance 659 2,114 103 896 3,323 301Null deviance 991 3,127 360 1,699 5,244 630N 1,748 5,054 300 1,562 5,540 1,140
Note. LP � linked participant; FP � focal participant. Coefficients and standard errors in parentheses for linear regression of days per week FP feelslonely on covariates are shown. Observations for each model are restricted by type of relationship (e.g., the leftmost model includes only observations inwhich the FP named the LP as a “sibling” in the previous and current period, and the sibling is “nearby,” i.e., lives no more than 1 mile away). Modelswere estimated using a general estimating equation with clustering on the FP and an independent working covariance structure (Liang & Zeger, 1986;Schildcrout & Heagerty, 2005). Models with an exchangeable correlation structure yielded poorer fit. Fit statistics show sum of squared deviance betweenpredicted and observed values for the model and a null model with no covariates (Wei, 2002).
987STRUCTURE AND SPREAD OF LONELINESS
to have more impact on loneliness than did spouses. The genderdifferences we observed may contribute to this finding. Wheeler etal. (1983) reported that loneliness is related to how much timemale and female participants interact with women each day, andwe found that the spread of loneliness was stronger for womenthan for men. Research is needed to address whether the absenceof an effect of spouses and family members on the loneliness ismore typical of older than younger adults and women than men.
Fowler and Christakis (2008a) found that happiness also oc-curred in clusters and spread through networks. Several importantdifferences have emerged in the induction of happiness and theinduction of loneliness, however. First, Fowler and Christakis(2008) found happiness to be more likely than unhappiness tospread through social networks. The present research, in contrast,indicates that the spread of loneliness is more powerful than thespread of nonloneliness. Negative events typically have morepowerful effects than positive events (i.e., differential reactivity;Cacioppo & Gardner, 1999), so Fowler and Christakis’s (2008)findings about the spread of happiness through social networks isdistinctive. Whereas laboratory studies are designed to gaugedifferential reactivity to a positive or negative event, the Fowlerand Christakis (2008) study also reflects people’s differentialexposure to happy and unhappy events. Thus, happiness mayspread through networks more than unhappiness because peoplehave much more frequent exposures to friends expressing happi-ness than unhappiness.
Loneliness does not have a bipolar opposite like happiness, but,rather, is like hunger, thirst, and pain in that its absence is thenormal condition, rather than an evocative state (Cacioppo &Patrick, 2008). Furthermore, as an aversive state, loneliness maymotivate people to seek social connection (whatever the responseof others to such overtures), which has the effect of increasing thelikelihood that those proximal to a lonely individual will be ex-posed to loneliness. Together, these processes may make loneli-ness more contagious than nonloneliness.
A second difference between the spread of happiness and lone-liness concerns the effect of gender. Fowler and Christakis (2008)found no gender differences in the spread of happiness, whereaswe found that loneliness spreads much more easily among womenthan among men. Women may be more likely to express and sharetheir emotions and may be more attentive to the emotions of others(Hatfield et al., 1994), but the spread of happiness, as well asloneliness, would be fostered similarly among women were this asufficient cause. There is also a stigma associated with loneliness,particularly among men; women are more likely to engage inintimate disclosures than are men; and relational connectedness ismore important for women than for men (Brewer & Gardner,1996; Hawkley et al., 2005; Shaver & Brennan, 1991). Theseprocesses may explain the greater spread of loneliness amongwomen relative to men. The present results, however, clearly showthat gender, like proximity and type of relationship, influences thespread of loneliness.
A limitation of all social network analyses is that the studies arenecessarily bound their sample. The compact nature of the Fra-mingham population in the period from 1971 to 2007 and thegeographical proximity of the influence mitigate this constraint,but we nevertheless considered whether the results might havechanged with a larger sample frame that includes all named indi-viduals who were themselves not participants in the Framingham
Heart Study. For instance, we calculated the statistical relationshipbetween the tendency to name people outside the study and lone-liness. A Pearson correlation between the number of contactsnamed outside the study and loneliness is not significant andactually flips signs from one exam to another (Exam 6, 0.016, p �.39; Exam 7, �0.011, p � .53). This result suggests that thesampling frame is not biasing the average level of loneliness in thetarget individuals we are studying.
A second possible limitation is that we included all participantsin the analysis. It is possible that the death or loss of certain criticalsocial network members during the study systematically affecthow lonely FPs felt across time. To address this possibility, werestricted analysis to those individuals (both FPs and LPs) whoremained alive at the end of the study. If death is the only or mostimportant source of network loss that causes the association be-tween FP and LP loneliness, then removing observations of peoplewho died during the study should reduce the association to insig-nificance. Results of these analyses show that the restriction has noeffect on the association between FP and LP loneliness. Lonelinessin nearby friends, nearby mutual friends, spouses, and immediateneighbors all remain significantly associated with FP loneliness.The death of critical network members, therefore, does not appearto account for our results.
Prior research has shown that disability is a predictor of lone-liness (Hawkley et al., 2008). A related issue, therefore, is whetherthe disability status of FPs factor into our findings. To address thisissue, we created a disability index by summing five questionsfrom the Katz Index of Activities of Daily Living (Spector, Katz,Murphy, & Fulton, 1987) about the subjects’ ability to indepen-dently dress themselves, bathe themselves, eat and drink, get intoand out of a chair, and use the toilet. The Pearson correlationbetween the indices in our data is 0.06 (ns). If disabilities affect thecorrelation in loneliness between social contacts, then the coeffi-cient on LP loneliness may be reduced to insignificance when weadd disability variables to the models in Tables 6 and 7. Specifi-cally, we added a contemporaneous and lagged variable for bothFP’s and LP’s disability index. The results of these ancillaryanalyses indicated that loneliness in nearby friends, nearby mutualfriends, immediate neighbors, and nearby neighbors all remainsignificantly associated with FP loneliness. Thus, disability doesnot appear to account for our findings.
In conclusion, the observation that loneliness can be passedfrom person to person is reminiscent of sociologist EmileDurkheim’s (1951) famous observation about suicide. He noticedthat suicide rates stayed the same across time and across groups,even though the individual members of those groups came andwent. In other words, whether people took their own lives de-pended on the kind of society they inhabited. Although suicide,like loneliness, has often been regarded as entirely individualistic,Durkheim’s work indicates that suicide is driven in part by largersocial forces. Although loneliness has a heritable component, thepresent study shows it also to be influenced by broader socialnetwork processes. Indeed, we detected an extraordinary pattern atthe edge of the social network. On the periphery, people havefewer friends, which makes them lonely, but it also drives them tocut the few ties that they have left. But before they do, they tendto transmit the same feeling of loneliness to their remainingfriends, starting the cycle anew. These reinforcing effects meanthat our social fabric can fray at the edges, like a yarn that comes
988 CACIOPPO, FOWLER, AND CHRISTAKIS

loose at the end of a crocheted sweater. An important implicationof this finding is that interventions to reduce loneliness in oursociety may benefit by aggressively targeting the people in theperiphery to help repair their social networks. By helping them, wemight create a protective barrier against loneliness that can keepthe whole network from unraveling.
References
Adam, E. K., Hawkley, L. C., Kudielka, B. M., & Cacioppo, J. T. (2006).Day-to-day dynamics of experience–cortisol associations in a population-based sample of older adults. Proceedings of the National Academy ofSciences of the United States of America, 103(45), 17058–17063.
Akerlind, I., & Hornquist, J. O. (1992). Loneliness and alcohol abuse: A review ofevidences of an interplay. Social Science and Medicine, 34(4), 405–414.
Andersson, L. (1998). Loneliness research and interventions: A review ofthe literature. Aging & Mental Health, 2(4), 264–274.
Bartels, M., Cacioppo, J. T., Hudziak, J. J., & Boomsma, D. I. (2008).Genetic and environmental contributions to stability in lonelinessthroughout childhood. American Journal of Medical Genetics Part B(Neuropsychiatric Genetics), 147(3), 385–391.
Beck, N. (2001). Time-series-cross-section data: What have we learned inthe past few years? Annual Review of Political Science, 4(1), 271–293.
Berscheid, E. (1985). Interpersonal attraction. In G. Lindzey & E. Aronson(Eds.), The handbook of social psychology (3rd ed., pp. 413–484). NewYork: Random House.
Berscheid, E., & Reis, H. T. (1998). Attraction and close relationships. InD. T. Gilbert, S. T. Fiske, & G. Lindzey (Eds.), The handbook of socialpsychology (4th ed., Vol. 2, pp. 193–281). New York: McGraw Hill.
Bondevik, M., & Skogstad, A. (1998). The oldest old, ADL, social network, andloneliness. Western Journal of Nursing Research, 20(3), 325–343.
Boomsma, D. I., Cacioppo, J. T., Muthen, B., Asparouhov, T., & Clark, S.(2007). Longitudinal genetic analysis for loneliness in Dutch twins. TwinResearch and Human Genetics, 10(2), 267–273.
Boomsma, D., Cacioppo, J., Slagboom, P., & Posthuma, D. (2006). Ge-netic linkage and association analysis for loneliness in Dutch twin andsibling pairs points to a region on chromosome 12q23–24. BehaviorGenetics, 36(1), 137–146.
Boomsma, D., Willemsen, G., Dolan, C., Hawkley, L., & Cacioppo, J. (2005).Genetic and environmental contributions to loneliness in adults: The Neth-erlands Twin Register Study. Behavior Genetics, 35(6), 745–752.
Brewer, M. B., & Gardner, W. (1996). Who is this “we”? Levels ofcollective identity and self representations. Journal of Personality andSocial Psychology, 71, 83–93.
Burt, R. S. (1986). Strangers, friends, and happiness. In GSS TechnicalReport No. 72. Chicago: National Opinion Research Center, Universityof Chicago.
Byrne, D. (1971). The attraction paradigm. New York: Academic Press.Cacioppo, J. T., & Gardner, W. L. (1999). Emotion. Annual Review of
Psychology, 50, 191–214.Cacioppo, J. T., Hawkley, L. C., Berntson, G. G., Ernst, J. M., Gibbs,
A. C., Stickgold, R., et al. (2002). Do lonely days invade the nights?Potential social modulation of sleep efficiency. Psychological Science,13(4), 384–387.
Cacioppo, J. T., Hawkley, L. C., Crawford, L. E., Ernst, J. M., Burleson,M. H., Kowalewski, R. B., et al. (2002). Loneliness and health: Potentialmechanisms. Psychosomatic Medicine, 64(3), 407–417.
Cacioppo, J. T., Hawkley, L. C., Ernst, J. M., Burleson, M., Berntson, G. G.,Nouriani, B., et al. (2006). Loneliness within a nomological net: An evolution-ary perspective. Journal of Research in Personality, 40(6), 1054–1085.
Cacioppo, J. T., & Patrick, B. (2008). Loneliness: Human nature and theneed for social connection. New York: Norton.
Carrington, P. J., Scott, J., & Wasserman, S. (2005). Models and methods
in social network analysis. Cambridge, United Kingdom: CambridgeUniversity Press.
Carstensen, L. L. (2001). Selectivity theory: Social activity in life-spancontext. In A. J. Walker, M. Manoogian-O’Dell, A. McGraw, & D. L. G.White (Eds.), Families in later life (pp. 265–275). Thousand Oaks, CA:Pine Forge Press.
Caspi, A., Harrington, H., Moffitt, T. E., Milne, B. J., & Poulton, R. (2006).Socially isolated children 20 years later: Risk of cardiovascular disease.Archives of Pediatric and Adolescent Medicine, 160(8), 805–811.
Christakis, N. A., & Fowler, J. H. (2007). The spread of obesity in a largesocial network over 32 years. New England Journal of Medicine, 357(4),370–379.
Christakis, N. A., & Fowler, J. H. (2008). The collective dynamics ofsmoking in a large social network. New England Journal of Medicine,358(21), 2249–2258.
Cole, S. W., Hawkley, L. C., Arevalo, J. M., Sung, C. Y., Rose, R. M., &Cacioppo, J. T. (2007). Social regulation of gene expression in humanleukocytes. Genome Biology, 8(9), R189.181–R189.113.
Cupples, L. A., & D’Agnostino, R. B. (1988). Survival following initialcardiovascular events: 30 year follow-up. In W. B. Kannel, P. A. Wolf,& R. J. Garrison (Eds.), The Framingham Study: An epidemiologicalinvestigation of cardiovascular disease (pp. 88–2969). Bethesda, MD:National Heart, Lung and Blood Institute.
Cutrona, C. E. (1982). Transition to college: Loneliness and the process of socialadjustment. In L. A. Peplau & D. Perlman (Eds.), Loneliness: A sourcebook ofcurrent theory, research, and therapy (pp. 291–309). New York: Wiley.
Dronjak, S., Gavrilovic, L., Filipovic, D., & Radojcic, M. B. (2004).Immobilization and cold stress affect sympatho-adrenomedullary systemand pituitary-adrenocortical axis of rats exposed to long-term isolationand crowding. Physiology and Behavior, 81(3), 409–415.
Dugan, E., & Kivett, V. R. (1994). The importance of emotional and socialisolation to loneliness among very old rural adults. Gerontologist, 34(3),340–346.
Durkheim, E. (1951). Suicide: A study in sociology. New York: Free Press.Dykstra, P. A., & de Jong Gierveld, J. (1999). [Differential indicators of
loneliness among elderly. The importance of type of partner relationship,partner history, health, socioeconomic status and social relations]. Tijd-schrift Voor Gerontologie En Geriatrie, 30(5), 212–225.
Emler, N. (1994). Gossip, reputation and adaptation. In R. F. Goodman &A. Ben-Ze’ev (Eds.), Good gossip (pp. 34–46). Lawrence: University ofKansas Press.
Fitzpatrick, G. L., & Modlin, M. J. (1986). Direct-line distances: Interna-tional edition. Metuchen, NJ: Scarecrow Press.
Fowler, J. H., & Christakis, N. A. (2008a). Dynamic spread of happinessin a large social network: Longitudinal analysis over 20 years in theFramingham Heart Study. British Medical Journal, 337, a2338.
Fowler, J. H., & Christakis, N. A. (2008b). Estimating peer effects on health insocial networks: A response to Cohen-Cole and Fletcher; and Trogdon, Non-nemaker, and Pais. Journal of Health Economics, 27(5), 1400–1405.
Harlow, H. F., Dodsworth, R. O., & Harlow, M. K. (1965). Total socialisolation in monkeys. Proceedings of the National Academy of Sciencesof the United States of America, 54(1), 90–97.
Hatfield, E., Cacioppo, J. T., & Rapson, R. L. (1994). Emotional conta-gion. New York: Cambridge University Press.
Hawkley, L. C., Browne, M. W., & Cacioppo, J. T. (2005). How can Iconnect with thee? Let me count the ways. Psychological Science,16(10), 798–804.
Hawkley, L. C., Hughes, M. E., Waite, L. J., Masi, C. M., Thisted, R. A., &Cacioppo, J. T. (2008). From social structure factors to perceptions of relation-ship quality and loneliness: The Chicago Health, Aging, and Social RelationsStudy. Journal of Gerontology: Social Sciences, 63B, S375–S384.
Hawkley, L. C., Masi, C. M., Berry, J. D., & Cacioppo, J. T. (2006).Loneliness is a unique predictor of age-related differences in systolicblood pressure. Psychology and Aging, 21(1), 152–164.
989STRUCTURE AND SPREAD OF LONELINESS
Hector-Taylor, L., & Adams, P. (1996). State versus trait loneliness inelderly New Zealanders. Psychological Reports, 78, 1329–1330.
Heikkinen, R.-L., & Kauppinen, M. (2004). Depressive symptoms in latelife: A 10-year follow-up. Archives of Gerontology and Geriatrics,38(3), 239–250.
Holmen, K., Ericsson, K., Andersson, L., & Winblad, B. (1992). Subjectiveloneliness: A comparison between elderly and relatives. Vard i Norden,12(2), 9–13.
House, J. S., Landis, K. R., & Umberson, D. (1988, July 29). Socialrelationships and health. Science, 241(4865), 540–545.
Jones, D. C. (1992). Parental divorce, family conflict and friendshipnetworks. Journal of Social and Personal Relationships, 9(2), 219–235.
Kahneman, D., Krueger, A. B., Schkade, D. A., Schwarz, N., & Stone, A. A.(2004, December 3). A survey method for characterizing daily life experience:The day reconstruction method. Science, 306(5702), 1776–1780.
Kamada, T., & Kawai, S. (1989). An algorithm for drawing generalundirected graphs. Information Processing Letters, 31(1), 7–15.
Kanitz, E., Tuchscherer, M., Puppe, B., Tuchscherer, A., & Stabenow, B.(2004). Consequences of repeated early isolation in domestic piglets(Sus scrofa) on their behavioural, neuroendocrine, and immunologicalresponses. Brain, Behavior, and Immunity, 18(1), 35–45.
Kannel, W. B., Feinleib, M., McNamara, P. M., Garrison, R. J., & Castelli,W. P. (1979). An investigation of coronary heart disease in families. TheFramingham Offspring Study. American Journal of Epidemiology,110(3), 281–290.
Kiecolt-Glaser, J. K., Ricker, D., George, J., Messick, G., Speicher, C. E.,Garner, W., et al. (1984). Urinary cortisol levels, cellular immunocom-petency, and loneliness in psychiatric inpatients. Psychosomatic Medi-cine, 46(1), 15–23.
King, G., Tomz, M., & Wittenberg, J. (2000). Making the most of statis-tical analyses: Improving interpretation and presentation. AmericanJournal of Political Science, 44(2), 341–355.
Lauder, W., Mummery, K., Jones, M., & Caperchione, C. (2006). Acomparison of health behaviours in lonely and non-lonely populations.Psychology, Health & Medicine, 11(2), 233–245.
Liang, K.-Y., & Zeger, S. L. (1986). Longitudinal data analysis usinggeneralized linear models. Biometrika, 73(1), 13–22.
Lyons, D. M., Ha, C. M., & Levine, S. (1995). Social effects and circadianrhythms in squirrel monkey pituitary-adrenal activity. Hormones andBehavior, 29(2), 177–190.
McGuire, S., & Clifford, J. (2000). Genetic and environmental contribu-tions to loneliness in children. Psychological Science, 11(6), 487–491.
McPherson, M., Smith-Lovin, L., & Cook, J. M. (2001). Birds of a feather:Homophily in social networks. Annual Review of Sociology, 27(1), 415.
Mullins, L. C., & Dugan, E. (1990). The influence of depression, andfamily and friendship relations, on residents’ loneliness in congregatehousing. Gerontologist, 30(3), 377–384.
Myers, D. G., & Diener, E. (1995). Who is happy? Psychological Science,6(1), 10–19.
Nation, D. A., Gonzales, J. A., Mendez, A. J., Zaias, J., Szeto, A., Brooks,L. G., et al. (2008). The effect of social environment on markers ofvascular oxidative stress and inflammation in the Watanabe heritablehyperlipidemic rabbit. Psychosomatic Medicine, 70(3), 269–275.
Neimeyer, R. A., & Mitchell, K. A. (1988). Similarity and attraction: Alongitudinal study. Journal of Social and Personal Relationships, 5(2),131–148.
Nonogaki, K., Nozue, K., & Oka, Y. (2007). Social isolation affects thedevelopment of obesity and Type 2 diabetes in mice. Endocrinology,148(10), 4658–4666.
Penninx, B. W., van Tilburg, T., Kriegsman, D. M., Deeg, D. J., Boeke, A. J.,& van Eijk, J. T. (1997). Effects of social support and personal copingresources on mortality in older age: The Longitudinal Aging Study Am-sterdam. American Journal of Epidemiology, 146(6), 510–519.
Peplau, L., & Perlman, D. (1982). Perspectives on loneliness. In L. Peplau
& D. Perlman (Eds.), Loneliness: A source book of current theory,research and therapy (pp. 1–18). New York: Wiley.
Pinquart, M., & Sorenson, S. (2003). Risk factors for loneliness in adult-hood and old age: A meta-analysis. In S. P. Shohov (Ed.), Advances inpsychology reseach (Vol. 19, pp. 111–143). Hauppauge, NY: NOVAScience Publishers.
Poletto, R., Steibel, J. P., Siegford, J. M., & Zanella, A. J. (2006). Effectsof early weaning and social isolation on the expression of glucocorticoidand mineralocorticoid receptor and 11beta-hydroxysteroid dehydroge-nase 1 and 2 mRNAs in the frontal cortex and hippocampus of piglets.Brain Research, 1067(1), 36–42.
Pressman, S. D., Cohen, S., Miller, G. E., Barkin, A., Rabin, B. S., &Treanor, J. J. (2005). Loneliness, social network size, and immuneresponse to influenza vaccination in college freshmen. Health Psychol-ogy, 24(3), 297–306.
Quan, S. F., Howard, B. V., Iber, C., Kiley, J. P., Nieto, F. J., O’Connor,G. T., et al. (1997). The Sleep Heart Health Study: Design, rationale, andmethods. Sleep, 20(12), 1077–1085.
Radloff, L. S. (1977). The CES–D scale: A self-report depression scale forresearch in the general population. Applied Psychological Measurement,1(3), 385–401.
Rook, K. S. (1984). Promoting social bonding: Strategies for helping thelonely and socially isolated. American Psychologist, 39(12), 1389–1407.
Rotenberg, K. (1994). Loneliness and interpersonal trust. Journal of Socialand Clinical Psychology, 13(2), 152–173.
Routasalo, P. E., Savikko, N., Tilvis, R. S., Strandberg, T. E., & Pitkala,K. H. (2006). Social contacts and their relationship to loneliness amongaged people: A population-based study. Gerontology, 52(3), 181–187.
Ruan, H., & Wu, C. F. (2008). Social interaction-mediated lifespan exten-sion of Drosophila Cu/Zn superoxide dismutase mutants. Proceedings ofthe National Academy of Sciences of the United States of America,105(21), 7506–7510.
Rudatsikira, E., Muula, A. S., Siziya, S., & Twa-Twa, J. (2007). Suicidalideation and associated factors among school-going adolescents in ruralUganda. BMC Psychiatry, 7, 67.
Russell, D., Peplau, L. A., & Cutrona, C. E. (1980). The revised UCLALoneliness Scale: Concurrent and discriminant validity evidence. Jour-nal of Personality and Social Psychology, 39(3), 472–480.
Russell, D. W., Cutrona, C. E., de la Mora, A., & Wallace, R. B. (1997).Loneliness and nursing home admission among rural older adults. Psy-chology and Aging, 12(4), 574–589.
Samuelsson, G., Andersson, L., & Hagberg, B. (1998). Loneliness inrelation to social, psychological and medical variables over a 13-yearperiod: A study of the elderly in a Swedish rural district. Journal ofMental Health and Aging, 4, 361–378.
Savikko, N., Routasalo, P., Tilvis, R. S., Strandberg, T. E., & Pitkala, K. H.(2005). Predictors and subjective causes of loneliness in an aged popu-lation. Archives of Gerontology and Geriatrics, 41(3), 223–233.
Schildcrout, J. S., & Heagerty, P. J. (2005). Regression analysis of longi-tudinal binary data with time-dependent environmental covariates: Biasand efficiency. Biostatistics, 6(4), 633–652.
Seeman, T. (2000). Health promoting effects of friends and family onhealth outcomes in older adults. American Journal of Health Promotion,14(6), 362–370.
Segrin, C. (1999). Social skills, stressful events, and the development ofpsychosocial problems. Journal of Social & Clinical Psychology, 18, 14–34.
Shaver, P. R., & Brennan, K. A. (1991). Measures of depression andloneliness. In J. P. Robinson, P. R. Shaver, & L. S. Wrightsman (Eds.),Measures of personality and social psychological attitudes: Measures ofsocial psychological attitudes (Vol. 1, pp. 195–289). San Diego, CA:Academic Press.
Spector, W. D., Katz, S., Murphy, J. B., & Fulton, J. B. (1987). The hierarchical
990 CACIOPPO, FOWLER, AND CHRISTAKIS

relationship between activities of daily living and instrumental activities of dailyliving. Journal of Chronic Diseases, 40, 481–490.
Steptoe, A., Owen, N., Kunz-Ebrecht, S. R., & Brydon, L. (2004). Lone-liness and neuroendocrine, cardiovascular, and inflammatory stress re-sponses in middle-aged men and women. Psychoneuroendocrinology,29(5), 593–611.
Stranahan, A. M., Khalil, D., & Gould, E. (2006). Social isolation delaysthe positive effects of running on adult neurogenesis. Nature Neuro-science, 9(4), 526–533.
Sugisawa, H., Liang, J., & Liu, X. (1994). Social networks, social support,and mortality among older people in Japan. Journal of Gerontology,49(1), S3–S13.
Szabo, G., & Barabasi, A. L. (2007). Network effects in service usage.Retrieved December 12, 2007, from http://lanl.arxiv.org/abs/physics/0611177
Tilvis, R. S., Pitkala, K. H., Jolkkonen, J., & Strandberg, T. E. (2000).Social networks and dementia. Lancet, 356(9223), 77–78.
Wei, P. A. N. (2002). Goodness-of-fit tests for GEE with correlated binarydata. Scandinavian Journal of Statistics, 29(1), 101–110.
Wheeler, L., Reis, H., & Nezlek, J. (1983). Loneliness, social interaction,and sex roles. Journal of Personality and Social Psychology, 45(4),943–953.
Wilson, R. S., Krueger, K. R., Arnold, S. E., Schneider, J. A., Kelly, J. F.,Barnes, L. L., et al. (2007). Loneliness and risk of Alzheimer disease.Archives of General Psychiatry, 64(2), 234–240.
Received December 4, 2008Revision received March 25, 2009
Accepted March 25, 2009 �
Call for Nominations
The Publications and Communications (P&C) Board of the American Psychological Associationhas opened nominations for the editorships of Experimental and Clinical Psychopharmacology,Journal of Abnormal Psychology, Journal of Comparative Psychology, Journal of CounselingPsychology, Journal of Experimental Psychology: General, Journal of Experimental Psychol-ogy: Human Perception and Performance, Journal of Personality and Social Psychology:Attitudes and Social Cognition, PsycCRITIQUES, and Rehabilitation Psychology for the years2012–2017. Nancy K. Mello, PhD, David Watson, PhD, Gordon M. Burghardt, PhD, Brent S.Mallinckrodt, PhD, Fernanda Ferreira, PhD, Glyn W. Humphreys, PhD, Charles M. Judd, PhD,Danny Wedding, PhD, and Timothy R. Elliott, PhD, respectively, are the incumbent editors.
Candidates should be members of APA and should be available to start receiving manuscripts inearly 2011 to prepare for issues published in 2012. Please note that the P&C Board encouragesparticipation by members of underrepresented groups in the publication process and would partic-ularly welcome such nominees. Self-nominations are also encouraged.
Search chairs have been appointed as follows:
● Experimental and Clinical Psychopharmacology, William Howell, PhD● Journal of Abnormal Psychology, Norman Abeles, PhD● Journal of Comparative Psychology, John Disterhoft, PhD● Journal of Counseling Psychology, Neil Schmitt, PhD● Journal of Experimental Psychology: General, Peter Ornstein, PhD● Journal of Experimental Psychology: Human Perception and Performance,
Leah Light, PhD● Journal of Personality and Social Psychology: Attitudes and Social Cognition,
Jennifer Crocker, PhD● PsycCRITIQUES, Valerie Reyna, PhD● Rehabilitation Psychology, Bob Frank, PhD
Candidates should be nominated by accessing APA’s EditorQuest site on the Web. Using yourWeb browser, go to http://editorquest.apa.org. On the Home menu on the left, find “Guests.” Next,click on the link “Submit a Nomination,” enter your nominee’s information, and click “Submit.”
Prepared statements of one page or less in support of a nominee can also be submitted by e-mailto Emnet Tesfaye, P&C Board Search Liaison, at [email protected].
Deadline for accepting nominations is January 10, 2010, when reviews will begin.
991STRUCTURE AND SPREAD OF LONELINESS