(also for release to apt pipelines limited (asx: aqh)) for ... · 2016-beyond more growth our...
TRANSCRIPT

ASX ANNOUNCEMENT 25 September 2015
APA Group (ASX: APA) (also for release to APT Pipelines Limited (ASX: AQH))
ANNUAL REVIEW AND SUSTAINABILITY REPORT, ANNUAL REPORT AND NEWSLETTER
The following documents are attached for release to the market:
• Annual Review and Sustainability Report 2015 • Annual Report 2015 • In the Pipeline newsletter
Mark Knapman Company Secretary Australian Pipeline Limited
For further information please contact: Investor enquiries: Media enquiries: Yoko Kosugi David Symons Telephone: +61 2 9693 0049 Telephone: +61 2 8306 4244 Mob: +61 438 010 332 Mob: +61 410 559 184 Email: [email protected] Email: [email protected]
About APA Group (APA) APA is Australia’s largest natural gas infrastructure business, owning and/or operating around $19 billion of energy infrastructure assets. Its gas transmission pipelines span every state and territory on mainland Australia, delivering approximately half of the nation’s gas usage. APA has direct management and operational control over its assets and the majority of its investments. APA also holds minority interests in a number of energy infrastructure enterprises including SEA Gas Pipeline, Energy Infrastructure Investments, GDI Allgas Gas Networks and Diamantina and Leichhardt Power Stations.
APT Pipelines Limited is a wholly owned subsidiary of Australian Pipeline Trust and is the borrowing entity of APA Group.
For more information visit APA’s website, www.apa.com.au
For
per
sona
l use
onl
y

AAPA Group | Annual Review and Sustainability Report 2015
APA GROUPANNUAL REVIEW AND
SUSTAINABILITY REPORT2015
CONNECTING MARKETS CREATING OPPORTUNITIES
For
per
sona
l use
onl
y

CONNECTING MARKETS
Front cover: APA’s most recent and largest acquisition - the Wallumbilla Gladstone Pipeline (“WGP”). This is APA’s delivery station for the Queensland Curtis LNG facility located on Curtis Island near Gladstone where the WGP emerges from the underground 556 kilometres from its starting point in the Surat Basin, Queensland.
This page: Pipes strung and welded during construction of APA’s new Eastern Goldfields Pipeline in Western Australia. The 293 kilometre pipeline connects to APA’s Murrin Murrin Lateral which connects to our Goldfields Gas Pipeline. APA’s three pipelines will be used to supply gas to AngloGold Ashanti’s gold mining operations displacing liquid fuel power supply.
CREATING OPPORTUNITIES
MOVING ENERGY
15 YEARS OF GROWTH
2016-BEYOND MORE GROWTH IN THE PIPELINE
2016
We only look forward at APA as to what opportunities for growth lay ahead, never resting on our laurels of what we’ve achieved. However, we also believe it’s healthy to acknowledge our significant growth and success since listing 15 years ago. That’s why our celebratory timeline starts at financial year 2015 – like you, we’re keen to see what’s next in 2016 and beyond, but we’re proud of the list of achievements you’ll see flowing through the pages of APA’s 2015 Annual Review.
For
per
sona
l use
onl
y

02 Highlights04 Chairman’s report06 Managing Director’s
report08 Operations report16 Sustainability report24 Leadership26 Five year financial
summary27 Investor information28 Map — our footprint
and FY2015 activities
Information contained in this document is current as at 26 August 2015.
Continuing to grow our ownership interests in transmission pipelines through further expanding the east and west coast grids
Growing other energy infrastructure midstream assets
Leveraging APA’s asset management, development and operational capabilities
Maintaining financial flexibility
Delivering responsive, valuable
solutions to our customers
As a leader in energy delivery, APA is transforming Australia’s dynamic energy sector. Energy is essential to our everyday lives and Australians are fortunate to take for granted 24/7 connection to it. For 15 years, APA has been making sure connections are in place, when and where they are needed now and for the future.
By connecting gas resources to markets, we create opportunities for our customers to more effectively manage their energy portfolios. Our focus is on serving our customers and solving their challenges which generates sustainable growth opportunities for APA.
We add value to our customers’ businesses which adds value to their customers’ operations. By providing flexible services and solutions, we are able to consistently deliver returns and value to our investors and offer our 1,600 employees a dynamic environment in which to use and further develop their talents.
APA is well positioned to connect, create and grow our stakeholders’ interests as we move energy around Australia.
1
5
4
3
2
OURSTRATEGY
OURVISION
MAINTAIN OURRANKING ASAUSTRALIA’S
NUMBER ONE ENERGYINFRASTRUCTURE
BUSINESS
2015 2014
JUN 2015Wallumbilla Gladstone Pipeline acquisition, underpinned by 20 year take-or-pay gas transportation agreements. APA’s largest acquisition to-date.
DEC 2014Diamantina and Leichhardt Power Stations officially opened, underpinned by long term electricity supply contracts until 2030.
30 JUNE 2015MARKET CAP $9.2BSECURITY PRICE$8.24
1APA Group | Annual Review and Sustainability Report 2015
For
per
sona
l use
onl
y
20122013
DEC 2012Completed acquisition of Hastings Diversified Utilities Fund. Creation of APA’s East Coast Grid through the addition of the South West Queensland Pipeline. Emergence of the West Coast Grid with acquisition of Pilbara Pipeline System.
DEC 2012Commenced expansion of APA’s compression capacity at the Wallumbilla Gas Hub.
2013-2011Maximising the value of APA’s portfolio through consolidation and expansion – we’re more than the sum of our parts.
28 JUNE 2013MARKET CAP $4.8BSECURITY PRICE$5.73
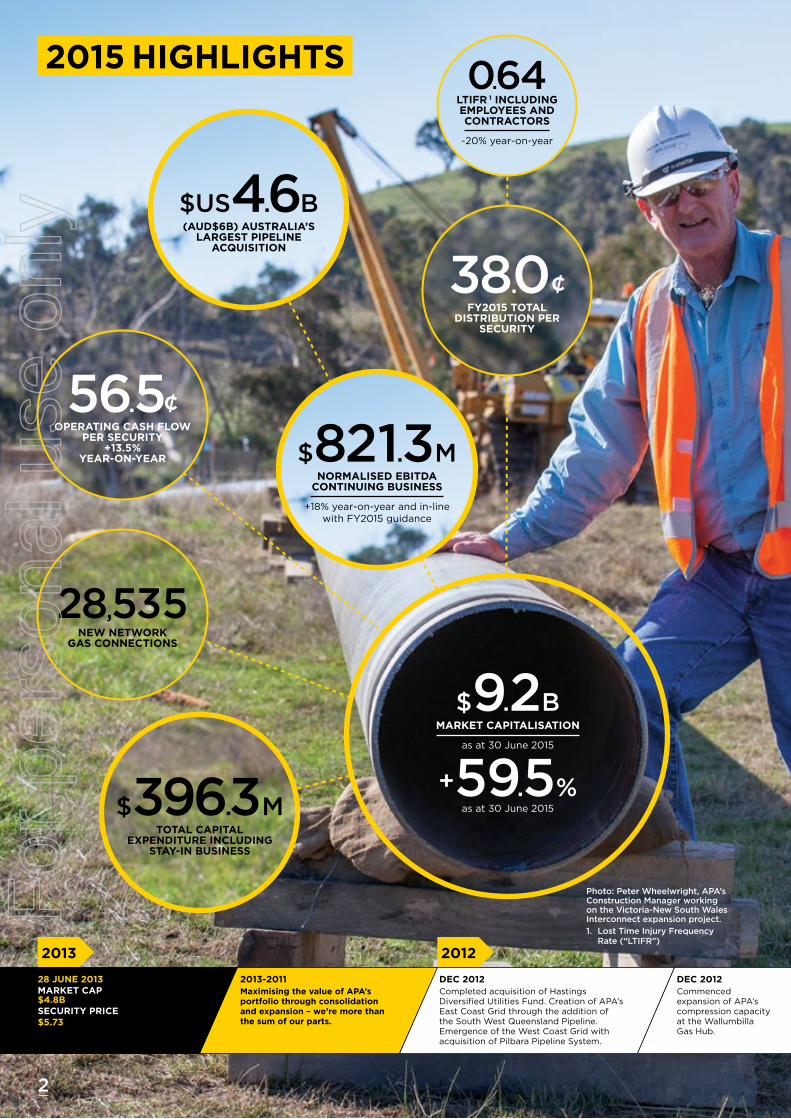
2015 HIGHLIGHTS
Photo: Peter Wheelwright, APA’s Construction Manager working on the Victoria-New South Wales Interconnect expansion project.
1. Lost Time Injury Frequency Rate (“LTIFR”)
$US4.6B(AUD$6B) AUSTRALIA’S
LARGEST PIPELINE ACQUISITION
$821.3MNORMALISED EBITDA
CONTINUING BUSINESS
+18% year-on-year and in-line with FY2015 guidance
$396.3MTOTAL CAPITAL
EXPENDITURE INCLUDING STAY-IN BUSINESS
56.5¢OPERATING CASH FLOW
PER SECURITY +13.5%
YEAR-ON-YEAR
38.0¢FY2015 TOTAL
DISTRIBUTION PER SECURITY
0.64LTIFR 1 INCLUDING EMPLOYEES AND CONTRACTORS
-20% year-on-year
28,535NEW NETWORK
GAS CONNECTIONS
$9.2BMARKET CAPITALISATION
as at 30 June 2015
+59.5%as at 30 June 2015
2
For
per
sona
l use
onl
y
3APA Group | Annual Review and Sustainability Report 2015
2011
DEC 2011Capacity expansion of the Goldfields Gas Pipeline.
JUL 2011Emu Downs wind farm acquisition in the Perth area energy precinct, underpinned by 20 year electricity supply contracts.
JUN 2011Acquisition of the Amadeus Gas Pipeline in the Northern Territory.
MAY 2011Fivefold capacity expansion of Mondarra gas storage facility in the Perth area energy precinct.
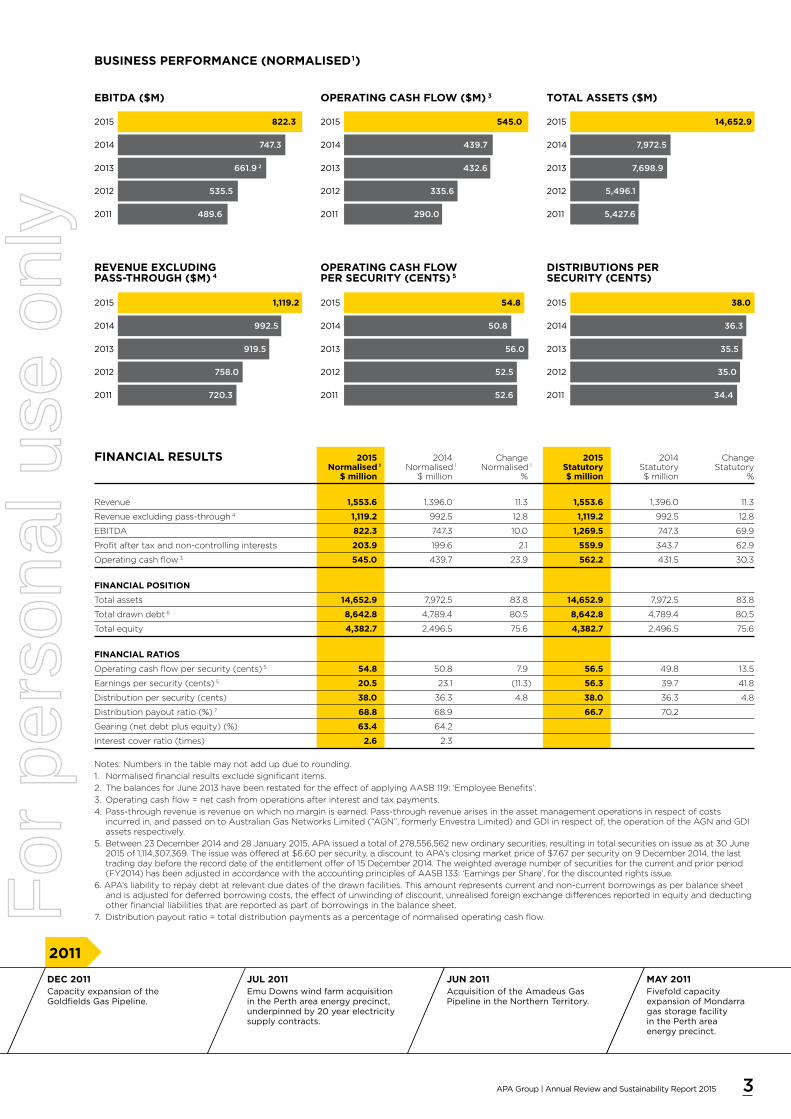
Notes: Numbers in the table may not add up due to rounding.
1. Normalised financial results exclude significant items.
2. The balances for June 2013 have been restated for the effect of applying AASB 119: ‘Employee Benefits’.
3. Operating cash flow = net cash from operations after interest and tax payments.
4. Pass-through revenue is revenue on which no margin is earned. Pass-through revenue arises in the asset management operations in respect of costs incurred in, and passed on to Australian Gas Networks Limited (“AGN”, formerly Envestra Limited) and GDI in respect of, the operation of the AGN and GDI assets respectively.
5. Between 23 December 2014 and 28 January 2015, APA issued a total of 278,556,562 new ordinary securities, resulting in total securities on issue as at 30 June 2015 of 1,114,307,369. The issue was offered at $6.60 per security, a discount to APA’s closing market price of $7.67 per security on 9 December 2014, the last trading day before the record date of the entitlement offer of 15 December 2014. The weighted average number of securities for the current and prior period (FY2014) has been adjusted in accordance with the accounting principles of AASB 133: ‘Earnings per Share’, for the discounted rights issue.
6. APA’s liability to repay debt at relevant due dates of the drawn facilities. This amount represents current and non-current borrowings as per balance sheet and is adjusted for deferred borrowing costs, the effect of unwinding of discount, unrealised foreign exchange differences reported in equity and deducting other financial liabilities that are reported as part of borrowings in the balance sheet.
7. Distribution payout ratio = total distribution payments as a percentage of normalised operating cash flow.
BUSINESS PERFORMANCE (NORMALISED 1)
REVENUE EXCLUDING PASS-THROUGH ($M) 4
OPERATING CASH FLOW PER SECURITY (CENTS) 5
DISTRIBUTIONS PER SECURITY (CENTS)
54.8
50.8
56.0
52.5
52.6
2015
2014
2013
2012
2011
EBITDA ($M) OPERATING CASH FLOW ($M) 3 TOTAL ASSETS ($M)
2015 822.3
2014
2013
2012
2011
747.3
661.9 2
535.5
489.6
1,119.2
992.5
919.5
758.0
720.3
2015
2014
2013
2012
2011
545.0
439.7
432.6
335.6
290.0
2015
2014
2013
2012
2011
54.8
50.8
56.0
52.5
52.6
2015
2014
2013
2012
2011
14,652.9
7,972.5
7,698.9
5,496.1
5,427.6
2015
2014
2013
2012
2011
38.0
36.3
35.5
35.0
34.4
2015
2014
2013
2012
2011
FINANCIAL RESULTS 2015 2014 Change 2015 2014 Change Normalised 1 Normalised 1 Normalised 1 Statutory Statutory Statutory $ million $ million % $ million $ million %
Revenue 1,553.6 1,396.0 11.3 1,553.6 1,396.0 11.3
Revenue excluding pass-through 4 1,119.2 992.5 12.8 1,119.2 992.5 12.8
EBITDA 822.3 747.3 10.0 1,269.5 747.3 69.9
Profit after tax and non-controlling interests 203.9 199.6 2.1 559.9 343.7 62.9
Operating cash flow 3 545.0 439.7 23.9 562.2 431.5 30.3
FINANCIAL POSITION
Total assets 14,652.9 7,972.5 83.8 14,652.9 7,972.5 83.8
Total drawn debt 6 8,642.8 4,789.4 80.5 8,642.8 4,789.4 80.5
Total equity 4,382.7 2,496.5 75.6 4,382.7 2,496.5 75.6
FINANCIAL RATIOS
Operating cash flow per security (cents) 5 54.8 50.8 7.9 56.5 49.8 13.5
Earnings per security (cents) 5 20.5 23.1 (11.3) 56.3 39.7 41.8
Distribution per security (cents) 38.0 36.3 4.8 38.0 36.3 4.8
Distribution payout ratio (%) 7 68.8 68.9 66.7 70.2
Gearing (net debt plus equity) (%) 63.4 64.2
Interest cover ratio (times) 2.6 2.3
For
per
sona
l use
onl
y

4
2010
30 JUNE 2010MARKET CAP $1.9BSECURITY PRICE$3.45
2010-2008Enhanced APA’s asset footprint by means of capacity expansion, pipeline development and acquisitions.
2010-2009APA obtained investment grade credit ratings from Standard & Poor’s (June 2009) and Moody’s (April 2010).
APR 2011Capacity expansion of the Roma Brisbane Pipeline.
As we look back over the 15 years since APA listed on the Australian Securities Exchange, it is timely to reflect on how much has been achieved. We began this journey with an asset base of less than $1 billion and a simple goal – “to be recognised as the leading transporter of natural gas in Australia”.
CHAIRMAN’S REPORT
From these modest beginnings, consistent strategy execution has seen APA emerge as a leader in energy delivery that is playing an active part in transforming Australia’s dynamic energy sector.
Today, we operate around $19 billion of owned or managed assets and our team of 1,600 experienced professionals is working harder than ever to unlock still more value from this diverse and growing portfolio. By connecting gas resources to markets, we create opportunities for our customers to more effectively manage their energy portfolios.
Our focus is on serving our customers and solving their challenges in a manner that generates sustainable growth opportunities for APA. It is pleasing to report that, consistent with this philosophy, APA has delivered another strong result for the 2015 financial year.
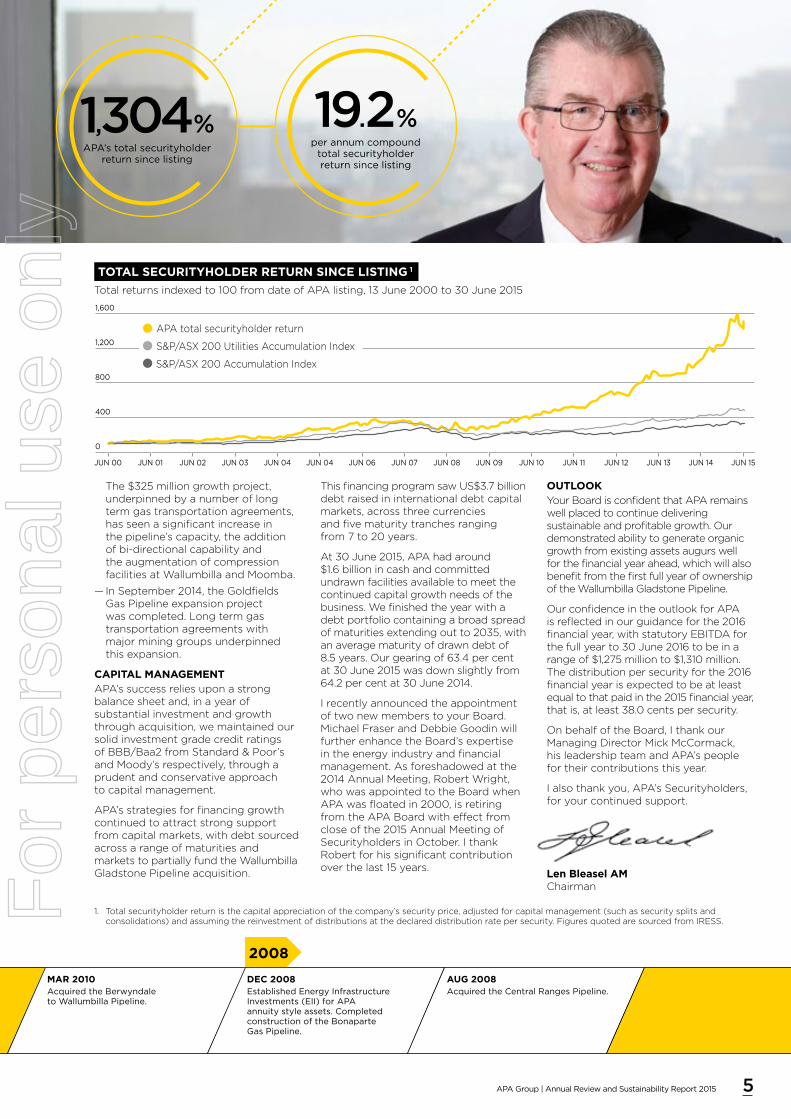
The Board declared total distributions for the year of 38.0 cents per security, including a final distribution of 20.5 cents, an increase of 4.8 per cent over the total distribution paid for the previous year. Distributions continue to be fully funded out of operating cash flow as we seek to deliver sustainable growth in distributions while maintaining investment in the growth of the business. Execution of this strategy has seen APA deliver a compound total securityholder return of 19.2 per cent per annum since listing in June 2000.
Net profit after tax including significant items increased by 62.9 per cent to $559.9 million, including a $356.0 million after tax profit from the sale of APA’s shareholding in Australian Gas Networks Limited (“AGN”, formerly Envestra Limited) and the recovery of fees paid by Hastings Diversified Utilities Fund to Hastings Funds Management during the period. Net profit after tax excluding significant items and profits attributable to minorities, increased by 2.1 per cent to $203.9 million.
Earnings before interest, tax, depreciation and amortisation (“EBITDA”) from continuing business and before significant items increased by 18 per cent to $821.3 million. The increase in normalised EBITDA from continuing business was underpinned by organic growth of $109.1 million, more than offsetting the decrease in contribution from the divested investment in AGN, and below-average customer contributions received by APA’s Asset Management operations.
WALLUMBILLA GLADSTONE PIPELINEA highlight of the year was the US$4.6 billion acquisition of the Wallumbilla Gladstone Pipeline that APA announced in December 2014. This was our largest ever acquisition and a true milestone for APA that further cements our position as Australia’s largest gas infrastructure business.
The acquisition significantly enhanced our asset portfolio, connecting APA’s East Coast Grid to Gladstone. Expansion of the grid provides our customers with the ability to transport gas seamlessly from multiple production facilities to users across four states and the ACT, as well as the export LNG market developing in Gladstone.
The 556 kilometre (including laterals) Wallumbilla Gladstone Pipeline is a key component of the Queensland Curtis LNG Project (“QCLNG”) linking gas fields in the Surat Basin to the project’s LNG plant on Curtis Island. The acquisition is underpinned by fully contracted revenues with BG Group entities and a China National Offshore Oil Corporation owned entity on a 20 year take-or-pay basis with primary tariff components escalated annually at U.S. Consumer Price Index.
Gas began flowing through the Wallumbilla Gladstone Pipeline in December 2014, with the QCLNG plant commencing commercial operations in May 2015 following the shipping of 16 LNG cargoes as part of commissioning and performance testing.
APA’s capacity to complete an acquisition of this scale is testament to the skills of our people, our relationships in the equity and debt markets, and our conservative approach to balance sheet management. From conception, and through preliminary discussions, structuring, due diligence, and financing to the ultimate closing of the acquisition, the quality of execution on this transaction was a credit to all those involved.
We are particularly grateful to APA Securityholders for the confidence they showed in the acquisition, and in our strategy, through their support for the $1.8 billion accelerated renounceable entitlement offer undertaken to partially fund the acquisition.
MORE GROWTHContinued investment in our existing assets is core to APA’s strategy to position the business for ongoing growth. Over the course of the financial year ending 2015, APA spent close to $400 million on capital expenditure including stay-in business capital expenditure, and expansions in New South Wales, Victoria, Queensland and Western Australia. Among a number of previously announced projects, the following were concluded:
— In May 2015, we completed the latest expansion of the Victoria – New South Wales Interconnect (“VNI”) to increase the firm peak winter gas flows from Victoria into New South Wales by 145 per cent to nearly 120 terajoules per day, at a total cost of approximately $160 million. New gas transportation agreements with three customers were entered into as a result of the project’s completion. A fourth agreement with an existing customer was announced in July 2015, which will support further expansion of the VNI;
— In January 2015, the South West Queensland Pipeline expansion project was completed and commissioned. F
or p
erso
nal u
se o
nly
5APA Group | Annual Review and Sustainability Report 2015
2008
DEC 2008Established Energy Infrastructure Investments (EII) for APA annuity style assets. Completed construction of the Bonaparte Gas Pipeline.
AUG 2008Acquired the Central Ranges Pipeline.
MAR 2010Acquired the Berwyndale to Wallumbilla Pipeline.
2010-2008Enhanced APA’s asset footprint by means of capacity expansion, pipeline development and acquisitions.
1,304%APA’s total securityholder
return since listing
TOTAL SECURITYHOLDER RETURN SINCE LISTING 1
400
0
JUN 00 JUN 01 JUN 02 JUN 03 JUN 04 JUN 04 JUN 06 JUN 07 JUN 08 JUN 09 JUN 10 JUN 11 JUN 12 JUN 13 JUN 14 JUN 15
1,200
1,600
800
APA total securityholder return
S&P/ASX 200 Utilities Accumulation Index
S&P/ASX 200 Accumulation Index
Total returns indexed to 100 from date of APA listing, 13 June 2000 to 30 June 2015
The $325 million growth project, underpinned by a number of long term gas transportation agreements, has seen a significant increase in the pipeline’s capacity, the addition of bi-directional capability and the augmentation of compression facilities at Wallumbilla and Moomba.
— In September 2014, the Goldfields Gas Pipeline expansion project was completed. Long term gas transportation agreements with major mining groups underpinned this expansion.
CAPITAL MANAGEMENTAPA’s success relies upon a strong balance sheet and, in a year of substantial investment and growth through acquisition, we maintained our solid investment grade credit ratings of BBB/Baa2 from Standard & Poor’s and Moody’s respectively, through a prudent and conservative approach to capital management.
APA’s strategies for financing growth continued to attract strong support from capital markets, with debt sourced across a range of maturities and markets to partially fund the Wallumbilla Gladstone Pipeline acquisition.
This financing program saw US$3.7 billion debt raised in international debt capital markets, across three currencies and five maturity tranches ranging from 7 to 20 years.
At 30 June 2015, APA had around $1.6 billion in cash and committed undrawn facilities available to meet the continued capital growth needs of the business. We finished the year with a debt portfolio containing a broad spread of maturities extending out to 2035, with an average maturity of drawn debt of 8.5 years. Our gearing of 63.4 per cent at 30 June 2015 was down slightly from 64.2 per cent at 30 June 2014.
I recently announced the appointment of two new members to your Board. Michael Fraser and Debbie Goodin will further enhance the Board’s expertise in the energy industry and financial management. As foreshadowed at the 2014 Annual Meeting, Robert Wright, who was appointed to the Board when APA was floated in 2000, is retiring from the APA Board with effect from close of the 2015 Annual Meeting of Securityholders in October. I thank Robert for his significant contribution over the last 15 years.
OUTLOOKYour Board is confident that APA remains well placed to continue delivering sustainable and profitable growth. Our demonstrated ability to generate organic growth from existing assets augurs well for the financial year ahead, which will also benefit from the first full year of ownership of the Wallumbilla Gladstone Pipeline.
Our confidence in the outlook for APA is reflected in our guidance for the 2016 financial year, with statutory EBITDA for the full year to 30 June 2016 to be in a range of $1,275 million to $1,310 million. The distribution per security for the 2016 financial year is expected to be at least equal to that paid in the 2015 financial year, that is, at least 38.0 cents per security.
On behalf of the Board, I thank our Managing Director Mick McCormack, his leadership team and APA’s people for their contributions this year.
I also thank you, APA’s Securityholders, for your continued support.
Len Bleasel AMChairman
19.2%per annum compound
total securityholder return since listing
1. Total securityholder return is the capital appreciation of the company’s security price, adjusted for capital management (such as security splits and consolidations) and assuming the reinvestment of distributions at the declared distribution rate per security. Figures quoted are sourced from IRESS.F
or p
erso
nal u
se o
nly

6
2007
APA completed construction and commissioning of Daandine (Jan 2007) and X41 (Nov 2007) Power Stations.
APA acquired Origin Energy Network (Jun/Jul 2007) assets including interests in SEA Gas Pipeline and the Envestra gas distribution network along with the long term operations and management contract for Envestra assets.
OCT 2007APA fully internalised asset management and operational services.
2007-2006Start of ongoing acquisition and development of complementary assets for the APA portfolio.
At the mid-point of our second decade as a listed entity, it is the skills and expertise of APA’s people across asset management, development and operational activities that have seen us emerge as a leader in energy delivery in Australia.
MANAGING DIRECTOR’S REPORT
Today, APA owns and/or operates over 14,700 kilometres of natural gas pipelines as well as gas storage facilities, gas-fired generation plants and a wind farm. Half of Australia’s natural gas production passes through our network, which is by far the largest in the country. We have a well-earned reputation for delivering our Securityholders sustainable growth and returns, while continuing to invest in assets that are a strategically vital part of our nation’s energy infrastructure.
The 2015 financial year saw exceptional levels of activity in the completion of existing projects, the commissioning of new projects, and our most substantial acquisition to date – the Wallumbilla Gladstone Pipeline. Our investment activity is focused on connecting APA’s physical assets to link more Australian gas resources to more gas markets. It is a process that is driven by engagement with our customers, listening to their needs and developing new and innovative ways to make the most of our infrastructure.
FUTURE GROWTHWhile it’s healthy to acknowledge our significant growth and success over the last 15 years, and reflect on what we have achieved in the past year, at APA we are always looking forward to the opportunities for growth that lie ahead. That is why, in addition to the projects we completed in the past year, we have also been planting the seeds for our future growth.
In April 2015 we opened the APA Integrated Operations Centre (“IOC”) in Brisbane. This new centre of excellence will enable us to centrally manage our portfolio of interconnected assets, responding more nimbly to operational and market imperatives. By integrating commercial, technical and operational resources in the one location in a real-time environment, we will provide a single operational point of contact
for our customers and realise additional operational efficiencies. I have no doubt that this concentration of expertise from many different parts of APA will, in itself, lead to the development of previously unthought-of services and a step-change in the timeliness and dynamism with which we meet our customers’ needs. In 2016 we will complete full transitioning of all APA pipelines to the IOC.
The establishment of the IOC is a natural step following the creation in 2012 of the East Coast Grid, which now allows our customers to choose from, and move gas between, around 30 receipt points and approximately 100 delivery points on the east coast. It is APA’s ongoing commitment to innovation that enabled us to develop the commercial and operational framework to provide this flexibility to our customers including related offerings such as multi-asset services, bi-directional transportation and gas storage and parking facilities.
We broke ground in March 2015 on the construction of the new 293 kilometre Eastern Goldfields Pipeline (“EGP”). This project is underwritten by two gas transportation agreements executed between AngloGold Ashanti Australia Limited (“AngloGold”) and APA in July 2014 for the transportation of natural gas to AngloGold’s Sunrise Dam Operations and the Tropicana Operations located in the eastern Goldfields region of Western Australia. The EGP will connect APA’s existing infrastructure, the Goldfields Gas Pipeline and the Murrin Murrin Lateral to the respective mine site locations transporting natural gas over a total distance of 1,500 kilometres. Commissioning of this project is scheduled to take place prior to January 2016.
As we discussed in last year’s Annual Review, in early 2014 APA announced a feasibility study into a possible link of our Northern Territory pipeline infrastructure with our East Coast Grid.
This year the Northern Territory Government announced its own process for this pipeline and shortlisted four bidders, one of which is APA. We are working towards making a final submission in September this year.
The proposed pipeline link would create the opportunity for gas sourced from onshore and offshore fields in the Northern Territory to be economically supplied to east coast markets as well as provide additional gas security for the Northern Territory. Any commitment by APA will be underpinned by appropriate long-term revenue agreements, and we look forward to the favourable conclusion of this exciting prospect.
These are just three of the projects that saw APA invest $343.1 million in growth capital expenditure, including expansions and enhancements to its gas infrastructure in New South Wales, Victoria, Queensland and Western Australia over the course of the year.
TRANSPARENT COSTSThis year we are introducing a change in our reporting by separating corporate costs from operating business segments. In doing so, it is our intention to provide our Securityholders with a greater insight to the underlying performance of the operating businesses and the costs incurred by APA in the management of these businesses.
Corporate costs have declined as a proportion of revenue (excluding pass-through revenue; 2015: 6.7 per cent and 2014: 7.7 per cent) and EBITDA (continuing businesses before corporate costs; 2015: 8.2 per cent and 2014: 9.4 per cent). Indeed, these ratios have trended down over the last five years, demonstrating the efficient scalability of APA.
For
per
sona
l use
onl
y

7APA Group | Annual Review and Sustainability Report 2015
2006
APA acquired the Murraylink (Mar 2006) and Directlink (May 2007) electricity interconnectors.
APA completed construction and commissioning of Kogan North (Mar 2006) and Tipton West (Mar 2007) gas processing facilities.
APA completed construction and commissioning of Daandine (Jan 2007) and X41 (Nov 2007) Power Stations.
DEC 2006Acquisition of the Victorian Transmission System (formerly GasNet).
NOV 2006Acquisition of Allgas gas distribution network in Queensland.
$9.2Bmarket capitalisation as at 30 June 2015,
+59.5% year-on-year
PUBLIC POLICYThe 2015 financial year saw unprecedented levels of public and policy discussion of the evolving gas market in Australia as LNG exports from Gladstone commence and domestic supply arrangements need renewal. The Federal and State Energy Ministers, through the Council of Australian Governments’ Energy Council, initiated a major review of the east coast gas market and concurrently, the Federal Government has instructed the Australian Competition and Consumer Commission to undertake an inquiry into the competitiveness of the wholesale gas market, including gas transmission.
There appears to be a high degree of overlap between these processes and each consumes a material amount of APA’s resources and management attention. These reviews cover much of the same ground considered in the expansive work undertaken by the Productivity Commission, the Harper Review into Competition Policy, and the Federal Government in developing its Energy White Paper, all of which were completed in 2014/15.
Whilst transparent discussion of the issues facing the industry promotes sensible policy determinations, provides certainty and serves to educate the public, it is important that a succession of reviews should not be allowed to adversely affect business confidence. In the last decade Australia has been well served by the relatively light level of regulation and market interference in transmission pipelines. It was this business environment that has enabled the development of the East Coast Grid and the range of services that APA provides the market. Today, as we are about to enter the next expansive stage of the gas market, it is critical that the ability to invest in further enhancements of Australia’s pipeline system such as the Northern Territory Link are not crippled by misguided government policy and bureaucratic interference.
CONTINUING COMMITMENT TO SAFETYIn this report last year, I announced APA’s three-year Health, Safety and Environment Strategic Improvement Plan following a corporate-wide health and safety cultural survey in early 2013. I am pleased to provide an update on the progress that we have made in the past year towards achieving our aim of being a Zero Harm workplace.
14 of the 17 Plan initiatives we originally identified have now been implemented. The Plan and ongoing progress of the initiatives are regularly reviewed and updated. Given the vast geographical spread and remoteness of our assets, an additional initiative was introduced this year, Safedrive+ which will provide the requisite level of control and training for all APA and contractor drivers and passengers, as well as a minimum standard vehicle specification.
The principle metric against which we measure the safety of our people is the Lost Time Injury Frequency Rate (“LTIFR” including both employees and contractors), which has continued to decline from 0.80 last year to 0.64 this financial year. This represents a significant improvement, but we will continue working towards zero, implementing the remaining initiatives as well as monitoring the active initiatives.
OUTLOOKI am tremendously proud of the dedication, competence and hard work that each of APA’s employees has contributed to our strong 2015 financial year result. It is these same qualities, combined with our robust balance sheet, and a commitment to innovation and excellent execution that give me confidence in APA’s future.
Our approach will not change. We will continue to invest in our existing infrastructure to provide tailored services to our customers.
We will continue to invest in the growth of our national infrastructure where customer demand provides an opportunity for commercial long-term returns. And we will remain alert to investment and acquisition opportunities compatible with our over-arching strategy, prudent management of the balance sheet, and our own return on investment requirements.
Recently, APA announced the retirement of two members of my executive team – Peter Wallace, Group Executive Human Resources and Mark Knapman, APA’s Company Secretary. Both have contributed significantly to APA’s growth and I thank them for their commitment and wish Peter and Mark all the best for their well-deserved retirements. We’re very proud of the talent pool and succession planning that has been internally developed within APA over a number of years. It was therefore with great pleasure to also announce at the time that both executive roles were taken up by existing employees and I welcome to the executive team Elise Manns APA’s new Group Executive Human Resources and Nevenka Codevelle, APA’s new Company Secretary and General Counsel.
Lastly, at 15 years young, I would like to extend my sincere thanks for your continued support of APA. I look forward to leading our business with the same enthusiasm and focus that has brought us this far, to a future that promises to be even more exciting than our past.
Mick McCormackManaging Director and Chief Executive Officer
US$4.6B(AUD$6B) Australia’s
largest pipeline acquisition
For
per
sona
l use
onl
y

8
2005 2004
FEB 2005Acquired the remaining 30% interest in the Carpentaria Gas Pipeline.
AUG 2004Goldfields Gas Pipeline interest increased to 88.2%.
30 JUNE 2005MARKET CAP $1.0BSECURITY PRICE$3.45
2005-2001Period of acquisition of minority interests in major APA pipelines consolidating our ownership positions across Australia.
we have also become skilled operators. Now we own and/or operate around $19 billion of assets when we include APA’s latest and largest acquisition, the Wallumbilla Gladstone Pipeline (“WGP”, renamed by APA from the Queensland Curtis LNG Pipeline post completion of the acquisition).
SOLUTIONS DELIVERYAPA has been busy working with our customers to provide more flexible and value-add services across this extensive infrastructure portfolio. Pipelines worldwide, including Australia, were originally built to deliver gas from one point to another. But APA has rewritten the guidelines of tradition by developing an interconnected grid and flexible solutions. Our East Coast Grid has now become a 7,500 kilometre gas superhighway, with customers able to take advantage of the many service offerings along its routes.
It is our technical and commercial ‘smarts’ that APA applies to our assets that transforms their functionality and capabilities from simple point to point pipelines to an interconnected gas grid. Our customers continually respond to the current dynamic energy markets and associated demand and supply movements, as well as seek to
Over the last 15 years, APA has extended its infrastructure footprint so gas can be seamlessly transported to the various markets where it is required from every major gas supply source in Australia. And we continue to invest in our interconnected gas infrastructure grids across the country that connects resources to markets and markets to resources. In doing so, we are contributing to the energy security of Australia’s economy and assisting the domestic market to adapt to the dynamic times that have developed with the onset of east coast LNG exports.
We now own and/or operate over 14,700 kilometres of gas transmission pipelines as well as a substantial portfolio of energy-related infrastructure assets. To achieve this sustainable growth, we listen to our customers and work with them, leveraging APA’s diversified assets and know-how to solve their logistical challenges. Our strategy of expansion and enhancement of our portfolio has remained consistent since we listed in 2000, developing organic growth opportunities surrounding our assets and prudent acquisitions. From 2006, when we acquired the asset management business,
take advantage of short term price differentials across the gas market. By listening to our customers, APA can now seamlessly manage their gas transportation requirements, providing park and loan services, storage services and bi-directional services across our connected gas grids. We can now offer additional services such as capacity and in-pipe trading that enables customers to more efficiently and effectively manage their energy needs.
APA’s various teams across commercial, engineering and operational disciplines have always worked together to deliver solutions to our customers’ needs. And now with the opening of the Integrated Operations Centre (“IOC”) in April 2015, APA expects that our coordinated solutions approach will be further enhanced, and our service delivery even more responsive to changes in operations and gas markets. The IOC currently services APA’s infrastructure assets in Queensland, New South Wales, the Northern Territory and the Pilbara Pipeline System in Western Australia with further assets transitioning to the IOC during FY2016. By integrating the service teams we aim to maximise commercial opportunities and minimise operational impact.
Energy Infrastructure is at the core of APA, housing our key gas infrastructure assets including gas transmission pipelines, compression facilities and storage facilities. Our national and interconnected portfolio of assets enables APA to provide various infrastructure services to our customers, including transportation, storage, compression or metering.
~7,500KMinterconnected East Coast Grid
~14,700KMtransmission gas
pipelines owned and/or operated by APA
ENERGY INFRASTRUCTUREF
or p
erso
nal u
se o
nly
2001 2000
FEB 2001Acquired the remaining 15% interest in the Roma Brisbane Pipeline.
13 JUNE 2000APA was listed on the Australian Stock Exchange. Foundation contract was on the only 100% owned Moomba Sydney Pipeline.
30 JUNE 2000MARKET CAP $0.5BSECURITY PRICE$2.10
AUG 2004Acquired Mondarra Gas Storage Facility, along with the Parmelia Gas Pipeline.
AUG 2004Goldfields Gas Pipeline interest increased to 88.2%.
EAST COAST GRIDThree years ago, APA created the East Coast Grid by interconnecting the majority of our existing assets in eastern Australia through the acquisition of the South West Queensland Pipeline. This has allowed our customers on the east coast of Australia to move gas seamlessly between different markets and states, enabling them to manage their energy portfolios with a high degree of flexibility. This year, we added some 500 kilometres to the East Coast Grid as well as a gateway to the LNG export market at Gladstone through the acquisition of the WGP.
The acquisition of the WGP is the largest pipeline transaction in Australia. But more impressive than the size of the transaction is the strategic value it adds to our East Coast Grid, adding a delivery point at Gladstone, extending our strong customer base with the addition of two international customers in BG Group and China National Offshore Oil Corporation and enhancing APA’s ability to capture further opportunities for the growing LNG export market as it connects with the other two LNG transmission pipelines due to come online in FY2016. These connections, together with other potential connections that we may develop in the future, provide us with opportunities for additional enhancements of the Wallumbilla Gladstone Pipeline, be they for the foundation shippers or new shippers.
APA’S EAST COAST GRIDThe WGP transports gas to BG’s Queensland Curtis LNG export facility on Curtis Island, just off Gladstone, from the Surat Basin, and is fully contracted in the form of long term take-or-pay gas transportation agreements. After the first twenty years, the shippers have two options to extend the contracts by a further ten years. So APA has 20 years of guaranteed revenues and potentially up to forty, with the extensions clearly designed for the shippers to take advantage of the technical life of the pipeline. We will earn a return on capital spent to ensure the pipeline operates for that additional 20 years.
This acquisition is consistent with the strategy that has created value for our investors and underpinned our growth for years. That is, it leverages our core skills in gas infrastructure assets to deliver appropriate commercial returns. The existing contracts provide that return, and the potential enhancements that come from our ownership and integration with our existing platform give further commercial opportunities.
Following commissioning of the pipeline in 2014, QGC Pty Limited, an Australian subsidiary of BG Group will continue to operate the WGP for the next 12 or so months after which APA has the option to take over the operatorship (from June 2016). As we’re first and foremost a pipeline operator, we’re likely to do so when that time arrives and we are comfortable that all the usual issues around commissioning have been settled.
MOUNTISA
MOOMBA
WALLUMBILLA
SYDNEY
BRISBANE
MELBOURNE
GLADSTONE
“We are very pleased that APA Group, as one of the most experienced owners and operators of pipeline infrastructure in Australia, has purchased the QCLNG Pipeline.
The newly-named Wallumbilla Gladstone Pipeline is a critical piece of infrastructure connecting our upstream CSG wells to our LNG plant on Curtis Island. APA Group has been an important partner as we have started up and commissioned the world’s first integrated, large-scale CSG-to-LNG project – partnering with us on key commercial arrangements; being a pragmatic and highly responsive counterparty; and a first-rate operator of an extensive pipeline network.
APA Group has demonstrated that it is deeply invested in supporting the success of the QCLNG Project - this was evident even before we completed the pipeline sale and we look forward to deepening our relationship with APA Group even further over the next 20 years and beyond.”
TONY NUNAN
Managing Director QGC
9APA Group | Annual Review and Sustainability Report 2015
For
per
sona
l use
onl
y

10
MORE CAPACITYThe network of our pipelines is not just getting bigger in length and reach, but we are also expanding the capacity of our pipelines – where that capacity is required. During the year, our Infrastructure Development team completed an expansion of the connection between Victoria and New South Wales (the Victoria-New South Wales Interconnect, “VNI”) that has increased the asset’s capacity by 145 per cent to nearly 120 terajoules per day. This involved looping around 60 per cent of the pipeline as well as increasing capacity at Culcairn in southern New South Wales.
APA has recently signed a fourth contract that will support 30 terajoules per day of further capacity expansion. On completion of this project, the capacity of the VNI will have trebled in three years, by responding to our customers’ needs to transport more gas from southern gas resource basins into northern markets with the benefit of APA’s flexible and seamless services. Also in Victoria, new compression facilities were completed at Winchelsea on APA’s South West Pipeline which connects to the Victorian Transmission System.
Major capital works were also undertaken and completed at both Moomba in South Australia and Wallumbilla in Queensland with the commissioning of three Solar Mars compressors at each location to enhance the overall capacity of the South West Queensland Pipeline in the LNG ramp up. In Western Australia on the Goldfields Gas Pipeline,
additional compression capacity was also increased. All of these expansion projects were underwritten by long term agreements with our customers.
BENEFIT TO LOCAL COMMUNITIESAs APA grows, we’re able to bring an economic boost to the local communities where our expansion projects are taking place. We understand that we are long term members of the communities in which our assets and operations exist and therefore where possible, we utilise the services and skills of those regional communities. It is very pleasing to get feedback such as was reported in the Euroa Gazette 17 December 2014 during the VNI expansion project works:
Gas pipe workers bring economic boost – Euroa benefiting economically from gas pipe construction
Shoppers in Euroa will have noticed a sea of flouro yellow work shirts when they’ve gone to buy their bread or café lattes. The town is in the grip of a mini economic boom thanks to the influx of hundreds of workers who are stationed at the gas pipe site outside Euroa. Almost 300 people are working on a project to construct a gas pipeline which will run 119 kilometres from Mangalore to Glenrowan.
Euroa Hot Bread owner David Mawson said many local businesses had extended their trading hours to accommodate the workers. “It’s brought a lot of money into the town, whether it’s the take-away shops or the petrol stations because they’re buying all their fuel locally.”
BOTH DIRECTIONSNot only are our pipelines expanding in length and capacity, but we’re changing their flow direction capability as well which increases the flexibility of services we can offer to customers. Today, the majority of APA’s key pipelines have bi-directional capabilities allowing gas to flow in both directions rather than simply point to point. We achieve this with a combination of additional compression capacity as well as installation of flow redirection skids.
In addition to the extra compression capacity installed at Moomba and Wallumbilla this year, both the South West Queensland Pipeline and the Berwyndale Wallumbilla Pipeline underwent bi-directional transformation. Currently works are underway on both the Roma Brisbane Pipeline and Moomba Sydney Pipeline to convert to bi-directional capability which are due for completion early FY2016.
Preparing to weld the new pipeline looping sections on the VNIBen Tibenszky, APA Project Engineer, with one of the flow redirection skids installed at Wallumbilla
Trebling of VNI capacity in
3years
ENERGY INFRASTRUCTUREF
or p
erso
nal u
se o
nly

11APA Group | Annual Review and Sustainability Report 2015
WEST COAST GRIDA grid is roughly defined as a network of horizontal and perpendicular lines and the Goldfields Gas Pipeline in Western Australia with all its expansions over the years in response to mining customer requirements has certainly seen it emerge as a key asset of APA’s West Coast Grid. Together with APA’s other assets and investments notably the Pilbara Pipeline System, Telfer and Nifty Pipelines, the Parmelia Gas Pipeline, Mid-West Pipeline and the Mondarra Gas Storage Facility, Western Australia is becoming an interconnected gas market.
The latest adjunct to the Goldfields Gas Pipeline is the 293 kilometre Eastern Goldfields Pipeline, APA’s latest greenfield project. In mid-2014, we were able to announce construction of the new pipeline on the back of two gas transportation agreements signed with AngloGold Ashanti, who took a long term view about energy supply and appreciated the reliability and cost stability that gas offered.
Once completed, APA will deliver gas from north-west of Western Australia to mines in the eastern Goldfields region via three of its interconnected pipelines spanning 1,500 kilometres – the Goldfields Gas Pipeline, the Murrin Murrin Lateral and the Eastern Goldfields Pipeline. Construction is expected to involve laying approximately 16,500 18-metre lengths of carbon steel pipe. The construction is well under way with completion prior to January 2016.
LINKING NORTH TO EASTListening to customers and observing gas market needs, APA commenced a feasibility study into a pipeline connection between our Amadeus Gas Pipeline in the Northern Territory and the East Coast Grid in early 2014 (“NT Link”). The study has been ongoing during this financial year.
APA has been short listed as one of four bidders to the Northern Territory Government’s process, the North East Gas Interconnect (“NEGI”), which was launched in late 2014 with final bids due in September 2015. Our feasibility work has gone into formulating our bid for this process.
The genesis of the NT Link concept was to address the supply dynamics in the eastern Australia gas market, given the development of the LNG projects around Gladstone. By connecting the Northern Territory with the east coast, those markets will effectively have additional gas basins to source their gas from and, conversely, the gas fields will have new markets they can access. This is another example of APA connecting more resources with more markets.
Jo Davis, APA’s Health and Safety Advisor on the Eastern Goldfields Pipeline project
293KMnew pipeline under
construction in Western Australia
For
per
sona
l use
onl
y
12
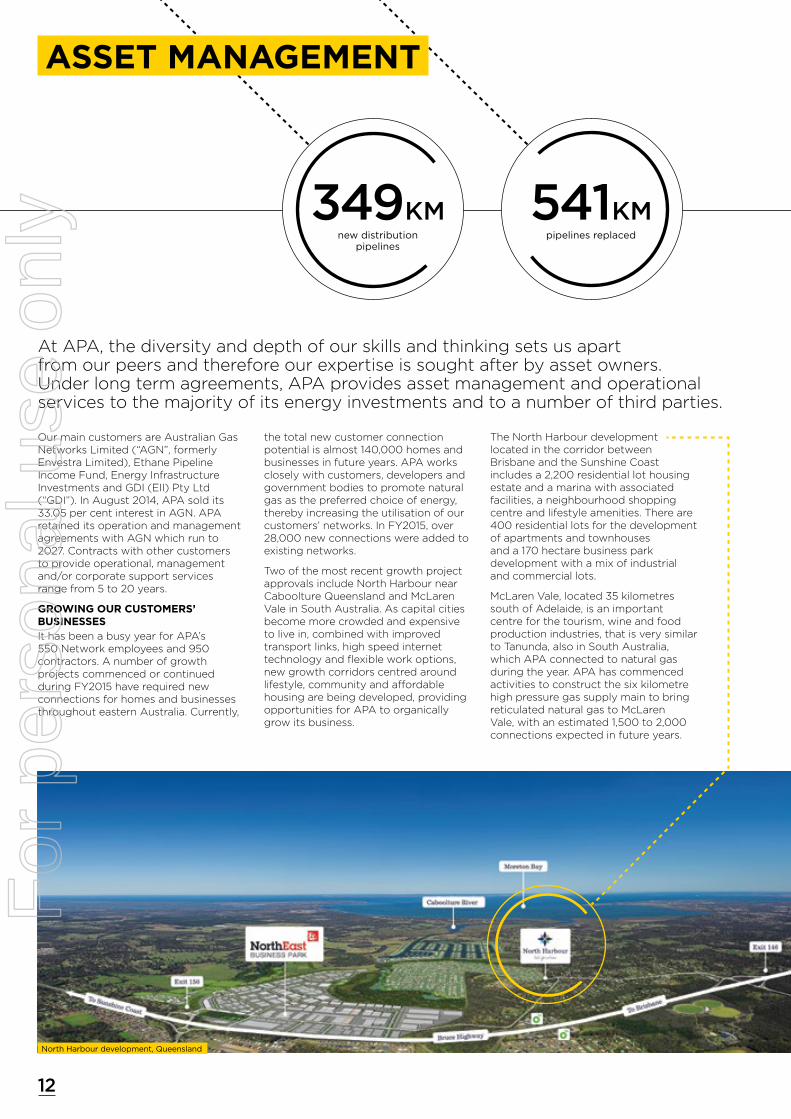
North Harbour development, Queensland
Our main customers are Australian Gas Networks Limited (“AGN”, formerly Envestra Limited), Ethane Pipeline Income Fund, Energy Infrastructure Investments and GDI (EII) Pty Ltd (“GDI”). In August 2014, APA sold its 33.05 per cent interest in AGN. APA retained its operation and management agreements with AGN which run to 2027. Contracts with other customers to provide operational, management and/or corporate support services range from 5 to 20 years.
GROWING OUR CUSTOMERS’ BUSINESSESIt has been a busy year for APA’s 550 Network employees and 950 contractors. A number of growth projects commenced or continued during FY2015 have required new connections for homes and businesses throughout eastern Australia. Currently,
the total new customer connection potential is almost 140,000 homes and businesses in future years. APA works closely with customers, developers and government bodies to promote natural gas as the preferred choice of energy, thereby increasing the utilisation of our customers’ networks. In FY2015, over 28,000 new connections were added to existing networks.
Two of the most recent growth project approvals include North Harbour near Caboolture Queensland and McLaren Vale in South Australia. As capital cities become more crowded and expensive to live in, combined with improved transport links, high speed internet technology and flexible work options, new growth corridors centred around lifestyle, community and affordable housing are being developed, providing opportunities for APA to organically grow its business.
The North Harbour development located in the corridor between Brisbane and the Sunshine Coast includes a 2,200 residential lot housing estate and a marina with associated facilities, a neighbourhood shopping centre and lifestyle amenities. There are 400 residential lots for the development of apartments and townhouses and a 170 hectare business park development with a mix of industrial and commercial lots.
McLaren Vale, located 35 kilometres south of Adelaide, is an important centre for the tourism, wine and food production industries, that is very similar to Tanunda, also in South Australia, which APA connected to natural gas during the year. APA has commenced activities to construct the six kilometre high pressure gas supply main to bring reticulated natural gas to McLaren Vale, with an estimated 1,500 to 2,000 connections expected in future years.
At APA, the diversity and depth of our skills and thinking sets us apart from our peers and therefore our expertise is sought after by asset owners. Under long term agreements, APA provides asset management and operational services to the majority of its energy investments and to a number of third parties.
ASSET MANAGEMENT
541KMpipelines replaced
349KMnew distribution
pipelines
For
per
sona
l use
onl
y
13APA Group | Annual Review and Sustainability Report 2015
“On behalf of Australian Gas Networks, I would like to acknowledge APA for its excellent performance during the interruption to gas supplies in Port Pirie and Whyalla in April. The APA teams at Kidman Park and on site showed outstanding commitment and professionalism throughout the incident period and the efforts to keep the two hospitals supplied with compressed natural gas and LNG and to provide hot showers and food to the community are to be commended.”
MAKING IMPORTANT CONNECTIONSDuring the financial year, APA also completed connecting natural gas to Adelaide’s new state of the art Royal Adelaide Hospital, due to open in 2016. One of the design features is natural gas supply connections from two different locations on the gas network to mitigate the risk of interruption to the supply of gas which is an essential energy source for the functioning of the hospital.
We have also commenced the pre-work for providing connection facilities for the Parklands Project, which will be utilised as the Commonwealth Games Village during the Gold Coast 2018 Commonwealth Games. The redevelopment of the Parklands precinct in Southport is one of the largest urban renewal projects ever undertaken on the Gold Coast. Natural gas is being used to supply bulk hot water and cooking to apartments, pool heating and catering. Once the Commonwealth Games are finished, the site will form the key residential, commercial and retail sector of the Gold Coast Health and Knowledge Precinct.
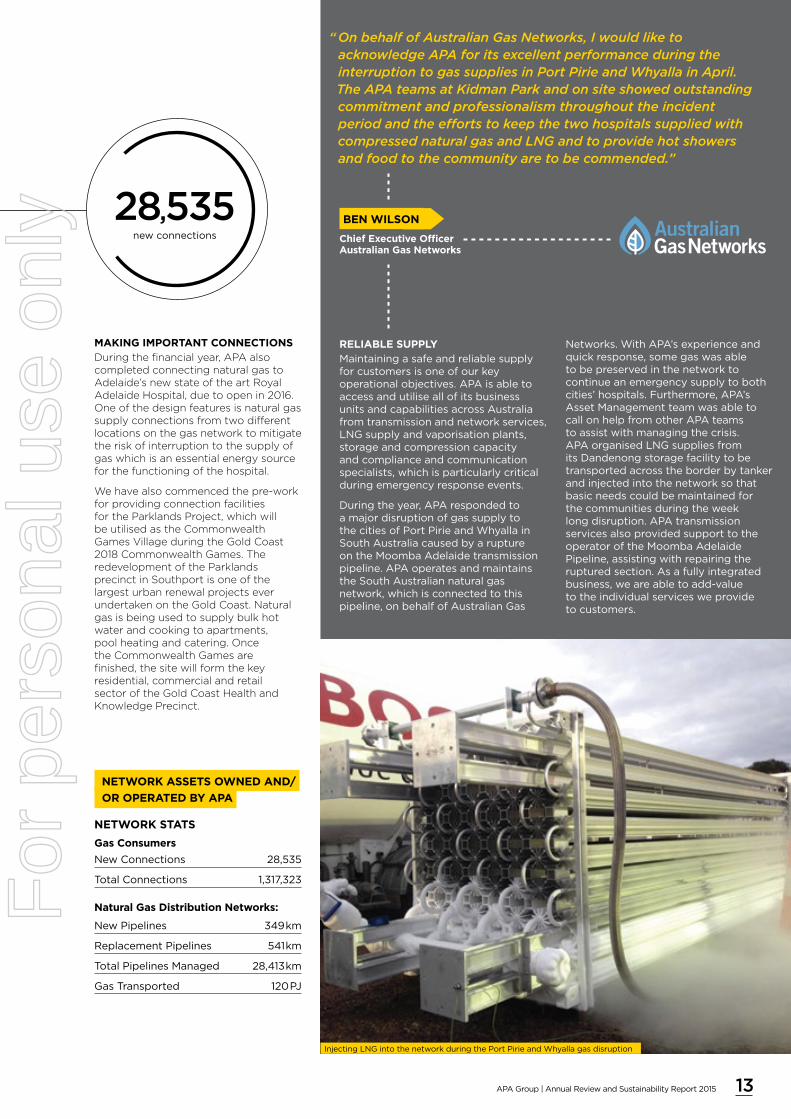
RELIABLE SUPPLYMaintaining a safe and reliable supply for customers is one of our key operational objectives. APA is able to access and utilise all of its business units and capabilities across Australia from transmission and network services, LNG supply and vaporisation plants, storage and compression capacity and compliance and communication specialists, which is particularly critical during emergency response events.
During the year, APA responded to a major disruption of gas supply to the cities of Port Pirie and Whyalla in South Australia caused by a rupture on the Moomba Adelaide transmission pipeline. APA operates and maintains the South Australian natural gas network, which is connected to this pipeline, on behalf of Australian Gas
Networks. With APA’s experience and quick response, some gas was able to be preserved in the network to continue an emergency supply to both cities’ hospitals. Furthermore, APA’s Asset Management team was able to call on help from other APA teams to assist with managing the crisis. APA organised LNG supplies from its Dandenong storage facility to be transported across the border by tanker and injected into the network so that basic needs could be maintained for the communities during the week long disruption. APA transmission services also provided support to the operator of the Moomba Adelaide Pipeline, assisting with repairing the ruptured section. As a fully integrated business, we are able to add-value to the individual services we provide to customers.
NETWORK STATS
Gas Consumers
New Connections 28,535
Total Connections 1,317,323
Natural Gas Distribution Networks:
New Pipelines 349km
Replacement Pipelines 541km
Total Pipelines Managed 28,413km
Gas Transported 120PJ
Injecting LNG into the network during the Port Pirie and Whyalla gas disruption
NETWORK ASSETS OWNED AND/
OR OPERATED BY APA
28,535new connections
BEN WILSON
Chief Executive Officer Australian Gas Networks
For
per
sona
l use
onl
y
14
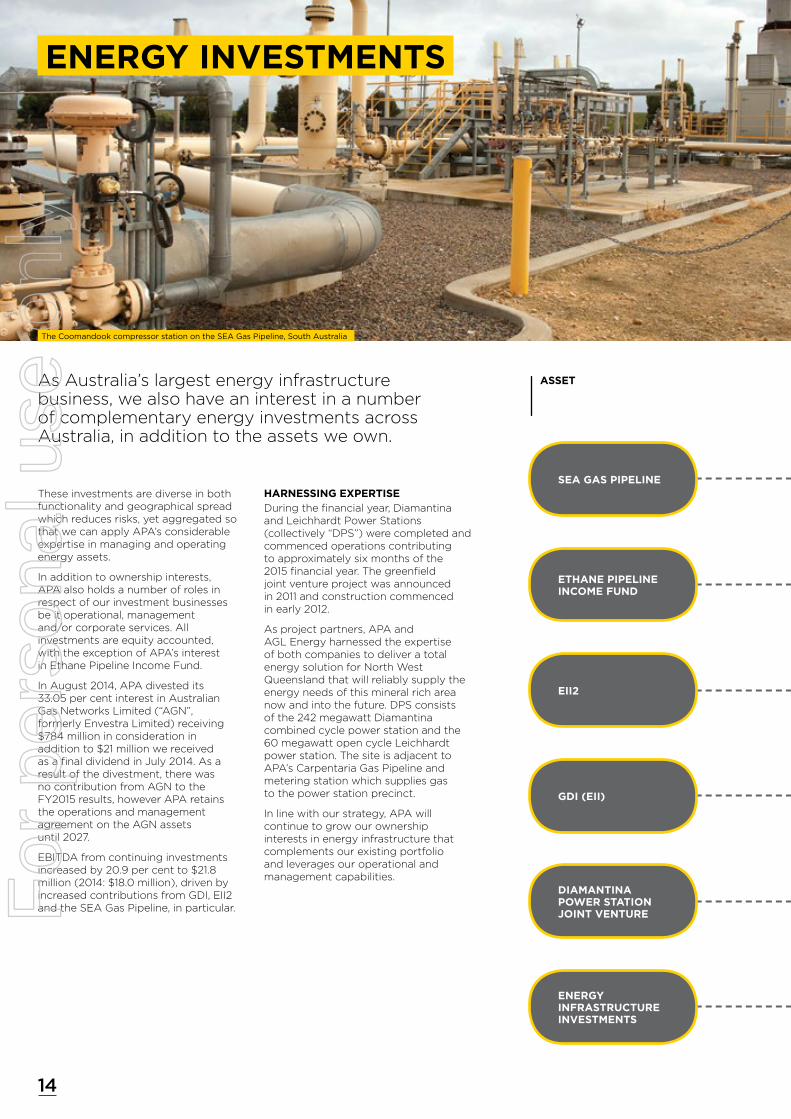
As Australia’s largest energy infrastructure business, we also have an interest in a number of complementary energy investments across Australia, in addition to the assets we own.
These investments are diverse in both functionality and geographical spread which reduces risks, yet aggregated so that we can apply APA’s considerable expertise in managing and operating energy assets.
In addition to ownership interests, APA also holds a number of roles in respect of our investment businesses be it operational, management and/or corporate services. All investments are equity accounted, with the exception of APA’s interest in Ethane Pipeline Income Fund.
In August 2014, APA divested its 33.05 per cent interest in Australian Gas Networks Limited (“AGN”, formerly Envestra Limited) receiving $784 million in consideration in addition to $21 million we received as a final dividend in July 2014. As a result of the divestment, there was no contribution from AGN to the FY2015 results, however APA retains the operations and management agreement on the AGN assets until 2027.
EBITDA from continuing investments increased by 20.9 per cent to $21.8 million (2014: $18.0 million), driven by increased contributions from GDI, EII2 and the SEA Gas Pipeline, in particular.
HARNESSING EXPERTISEDuring the financial year, Diamantina and Leichhardt Power Stations (collectively “DPS”) were completed and commenced operations contributing to approximately six months of the 2015 financial year. The greenfield joint venture project was announced in 2011 and construction commenced in early 2012.
As project partners, APA and AGL Energy harnessed the expertise of both companies to deliver a total energy solution for North West Queensland that will reliably supply the energy needs of this mineral rich area now and into the future. DPS consists of the 242 megawatt Diamantina combined cycle power station and the 60 megawatt open cycle Leichhardt power station. The site is adjacent to APA’s Carpentaria Gas Pipeline and metering station which supplies gas to the power station precinct.
In line with our strategy, APA will continue to grow our ownership interests in energy infrastructure that complements our existing portfolio and leverages our operational and management capabilities.
The Coomandook compressor station on the SEA Gas Pipeline, South Australia
ASSET
SEA GAS PIPELINE
ETHANE PIPELINE INCOME FUND
EII2
GDI (EII)
DIAMANTINA POWER STATION JOINT VENTURE
ENERGY INFRASTRUCTURE INVESTMENTS
ENERGY INVESTMENTSF
or p
erso
nal u
se o
nly

15APA Group | Annual Review and Sustainability Report 2015
680 km gas pipeline from Iona and Port Campbell in Victoria to Adelaide
1,375 km ethane pipeline from Moomba to Port Botany, Sydney
132 MW North Brown Hill wind farm in South Australia
3,214 km Allgas gas distribution network in Queensland with 96,045 connections
Two gas-fired power stations in Mount Isa with a combined gas fired power generation of 302 MW
Gas-fired power generation 71 MWGas processing facilities 41 TJ/dayElectricity transmission cables 244 kmThree gas pipelines totaling 787 km
REST
LISTED ENTITY “EPX”
INFRASTRUCTURE CAPITAL GROUPOSAKA GAS COMPANY LTD
MARUBENI CORPORATIONDEUTSCHE AWM
AGL ENERGY LTD
MARUBENI CORPORATIONOSAKA GAS
MAINTENANCE
OPERATIONALMANAGEMENTCORPORATE SUPPORT
CORPORATE SUPPORT
OPERATIONALMANAGEMENTCORPORATE SUPPORT
CORPORATE SUPPORT
OPERATIONALMANAGEMENTCORPORATE SUPPORT
Diamantina Power Station commenced supplying gas-fired power to North west Queensland in FY2015
50%
6.1%
20.2%
20%
50%
19.9%
ASSET DETAILS PARTNERS APA SERVICESOWNERSHIP INTEREST
For
per
sona
l use
onl
y

Each year APA works hard to maintain our ranking as Australia’s number one energy infrastructure business.
Whilst we own and/or operate thousands of kilometres of pipelines and hundreds of megawatts of power generation and other energy assets totalling $19 billion, we believe how we conduct our operations is key to being a sustainable business.
For our five stakeholder groups – investors, customers, the environment, communities and employees – we create value and responsibly use resources available to us, without compromising the needs of future generations.
That’s what sustainability means to APA.
During the financial year, the ASX Corporate Governance Council introduced a new Corporate Governance recommendation 7.4, regarding the expectation by listed companies to report on the way in which they manage material economic, environmental and social sustainability risks.
APA has an established and an effective risk management framework, whereby risks are measured against both probability of occurrence and severity of consequence. These are then captured in a centralised risk management application and are reviewed by APA management on an ongoing basis, with oversight by APA’s Board Audit and Risk Management Committee. As part of our Sustainability Report, we have detailed key sustainability risks and our risk management strategies.
2015 PERFORMANCE ACTIONS FOR 2016
— Total securityholder return of 30 per cent for FY2015.
— Maintained investment grade credit ratings (BBB/Baa2).
— Established a US$4.1 billion two year syndicated bridge facility in preparation for purchase of the Wallumbilla Gladstone Pipeline. Following debt and equity raising as detailed below, the facility was no longer required and therefore cancelled.
— Successful debt and equity raising for the Wallumbilla Gladstone Pipeline acquisition via $1.8 billion rights issue and US$3.7 billion in the global debt markets.
— $830 million new syndicated bank debt facility established (July 2015), replacing existing $1.1 billion facility.
— Delivered investors a 4.8 per cent increase in distributions.
— $343.1 million of organic growth capital expenditure.
— Market capitalisation increased by 59.5 per cent in FY2015.
— Progress or complete current growth capital projects underway.
— Continue to evaluate and develop additional revenue streams in related energy businesses.
— Maintain investment grade credit rating levels.
KEY SUSTAINABILITY RISKS RISK MANAGEMENT
— Debt and equity - Ensuring continued support from debt and equity markets for ongoing capital requirements. Inability to secure new debt facilities at appropriate quantum and price may adversely affect APA’s operations and/or financial position and performance.
— APA’s investment decisions are made and its balance sheet is utilised with a continuous focus on maintaining long term investment grade credit ratings.
— A diverse portfolio of long-life assets underpinned by regulated and long term bilateral agreements, underscores APA’s ability to service debt and sustain steady equity distributions.
— Maintain diversified funding base and access to deep and liquid global debt capital and banking markets.
— Financial results and other salient developments are communicated regularly to investors.
As at 30 June 2015, APA had over 79,000 securityholders holding 1.1 billion securities, with the top 20 investors holding 61.1 per cent of securities. Currently, approximately 70 per cent of APA’s investors are based in Australian and/or New Zealand.
APA issued a total of 278,556,562 new securities during December 2014 and January 2015 as a result of a 1 for 3 accelerated renounceable entitlement offer to existing securityholders, raising $1.8 billion to help fund the Wallumbilla Gladstone Pipeline acquisition. The new securities were issued at $6.60 per security in December 2014 and January 2015, with solid support from APA’s existing securityholders. Furthermore in March 2015, APA raised US$3.7 billion in the international debt capital markets, across three currencies and five tenors.
We will continue to be a reliable and attractive investment which delivers superior returns for securityholders by:— Achieving reliable and sustainable earnings growth by focusing on long-term revenue
and reduced costs.
— Maintaining a strong and robust balance sheet.
— Identifying and evaluating additional attractive infrastructure style investments in related energy businesses.
SUSTAINABILITY REPORT
INVESTORS
16
For
per
sona
l use
onl
y
17APA Group | Annual Review and Sustainability Report 2015
We will deliver value to our customers and create responsive solutions to meet their needs by:— Providing market-leading flexible solutions to meet our customer’s changing requirements, including responding
to critical events on assets we own and/or operate to enable customers to better manage their gas portfolios.
— Delivering value to customers by efficiently and reliably utilising the capacity of APA’s infrastructure assets.
— Working with customers to provide optimal investment and energy market solutions.
Refer to pages 8-15 for a full report on APA’s operations report and how we have supported and
responded to our customers’ needs.
CUSTOMERS
KEY SUSTAINABILITY RISKS RISK MANAGEMENT
Demand for gas – The volume of gas that is transported by APA is dependent on end-user demand. The relative price of gas and its competitive position with other energy sources (such as electricity, coals, fuel oil, renewable sources) may change demand levels for services on APA’s assets.
— Long-term agreements with strong counterparties underpin assets.
— Flexible customer solutions.
— Complementary investments in gas storage and power generation and continued evaluation of emerging fuels such as investment in wind farms.
Supply of gas – Availability of competitively priced gas is essential for ongoing use of gas infrastructure assets.
— Long term agreements with strong counterparties underpin assets.
— Connect more gas resources with more gas markets such as:
> East Coast Grid provides flexibility for customers to manage their gas portfolios.
> Expansion of interconnect between Victoria and New South Wales.
> Develop the business case for the Northern Territory Link.
> Working with new / emerging gas producers to bring new gas supply to market.
Counterparty – If a counterparty is unable to meet its commitments to APA, there is risk that future anticipated revenue would be reduced unless and until APA is able to secure an alternative customer.
— Creditworthiness test applied to new customers, and ongoing monitoring.
— Appropriate customer guarantees in place.
Operations - APA and our asset management customers are exposed to a number of operational risks such as equipment failures or breakdowns, rupture of pipelines and technological failures.
— APA operates assets in accordance with all relevant regulations and standards.
— In-house operating, maintenance and engineering expertise.
Economic regulation – APA may be negatively impacted as a result of a change in regulatory settings.
— Regulatory regime is well understood and encapsulated in national law.
— The reset dates of APA’s price regulated assets are staggered, with on average one review each year.
— Composition of asset portfolio is optimised to manage exposure to regulator settings.
2015 PERFORMANCE ACTIONS FOR 2016
— New agreement negotiated to support further capacity expansion of the Victoria – New South Wales Interconnect, the fourth expansion in two years. The new agreement was signed in July 2015 with the cost of the expansion approximately $85 million, increasing capacity between Victoria and New South Wales by 30 TJ per day.
— APA is in the final bidding stage of the Northern Territory Government’s competitive process to potentially construct the pipeline linking prospective gas reserves in the Northern Territory to east coast demand. During the year, we continued to progress our feasibility study on this potential link which we commenced in early 2014. This work has significantly contributed to our bid in the government process.
— Ongoing work on compression and pipeline projects to provide bi-directional gas transportation services on the East Coast Grid. This will enable APA to provide our customers with flexible services.
— Entered into a number of flexible agreements which incorporate multiple receipt and delivery points on the East Coast Grid.
— Continued to offer web-based capacity trading services to facilitate trades between sellers and buyers of capacity.
— Commissioned the Diamantina Power Station Project in Mount Isa which secures the power supply needs of North West Queensland.
— Continued to extend and develop flexible gas storage services utilising the Mondarra Gas Storage Facility.
— Signed two long term agreements with AngloGold Ashanti which have underwritten the construction of the new 293 kilometre Eastern Goldfields Pipeline (executed June 2015). Construction is well advanced on the new pipeline with commissioning on track for prior to January 2016.
— Continue to offer flexible transportation and storage services and innovative solutions to meet our customers’ requirements.
— Maximise use of existing assets and profitably continue to expand APA’s asset portfolio in order to meet customers needs.
— Commence and progress the further expansion of the Victoria – New South Wales Interconnect.
— Complete construction of the 293 kilometre Eastern Goldfields Pipeline (completion expected December 2015).
— Complete construction of the new South Metro gate station off the Parmelia Gas Pipeline, enhancing gas security of supply for metropolitan Perth (completion expected December 2015).
— Complete migration of APA’s gas transmission pipeline assets to the Integrated Operations Centre (“IOC”), to holistically manage day to day operations.
SUSTAINABILITY REPORT
For
per
sona
l use
onl
y

18
We will continue to deliver an environmentally responsible, safe and essential service by:
— Contributing to policy and responding to climate change initiatives to promote the use of gas as essential to a cleaner energy mix.
— Including the environment in all investment and procurement decision-making, complying with our emissions reporting obligations, and conserving and rehabilitating the natural state of the land we disturb.
— Evaluating complementary clean energy projects.
— Meeting or exceeding the Australian Pipelines and Gas Association (“APGA”) Code of Environmental Practice.
2015 PERFORMANCE ACTIONS FOR 2016
— Engaged with government to promote the role of gas in a carbon-constrained economy, directly and through industry associations.
— Participated for the fifth time in the Carbon Disclosure Project, a voluntary disclosure to investors on carbon emissions, liability, reduction activities, strategies and management. APA’s overall score of 79D ranked highest amongst its direct peers.
— Continued to develop the wind and solar renewable energy projects at Emu Downs Wind Farm, subject to customer demand.
— Applied effective environmental practices such as soil erosion control, revegetation of disturbed land, ecological assessments and environmental audits at operational and project sites, leading to zero regulatory breaches.
— Completed a full review and audit of APA’s current Environmental Management System and performance resulting in the development and approval of the APA Environmental Strategy and Improvement Plan, to commence implementation in FY2016.
— Participate in policy discussions and promote the role of gas as an important contribution to reducing Australia’s emissions.
— Maintain carbon market expertise and knowledge should energy markets shift to clean fuels such as wind, solar and gas.
— Evaluate wind and solar generation opportunities now that there is greater certainty in the federal Renewable Energy Target policy.
— Continue to maintain and operate assets in accordance with environmental regulations.
— Commence implementation of APA’s Environmental Strategy and Improvement Plan.
KEY SUSTAINABILITY RISKS RISK MANAGEMENT
Environmental risks - National, state and territory environmental laws and regulations affect the operations of APA Group’s assets.
— Within the Health, Safety and Environment framework, APA has a strategic plan to ensure environmental risks are identified and managed via appropriate controls.
— This strategy includes compliance with the necessary environmental regulations which apply to APA businesses and assets.
— In-house operating and maintenance expertise.
SUSTAINABILITY REPORT
Mandy McLeod, one of APA’s Environment Officers reviewing a site in Young, New South Wales
ENVIRONMENT
For
per
sona
l use
onl
y
19APA Group | Annual Review and Sustainability Report 2015
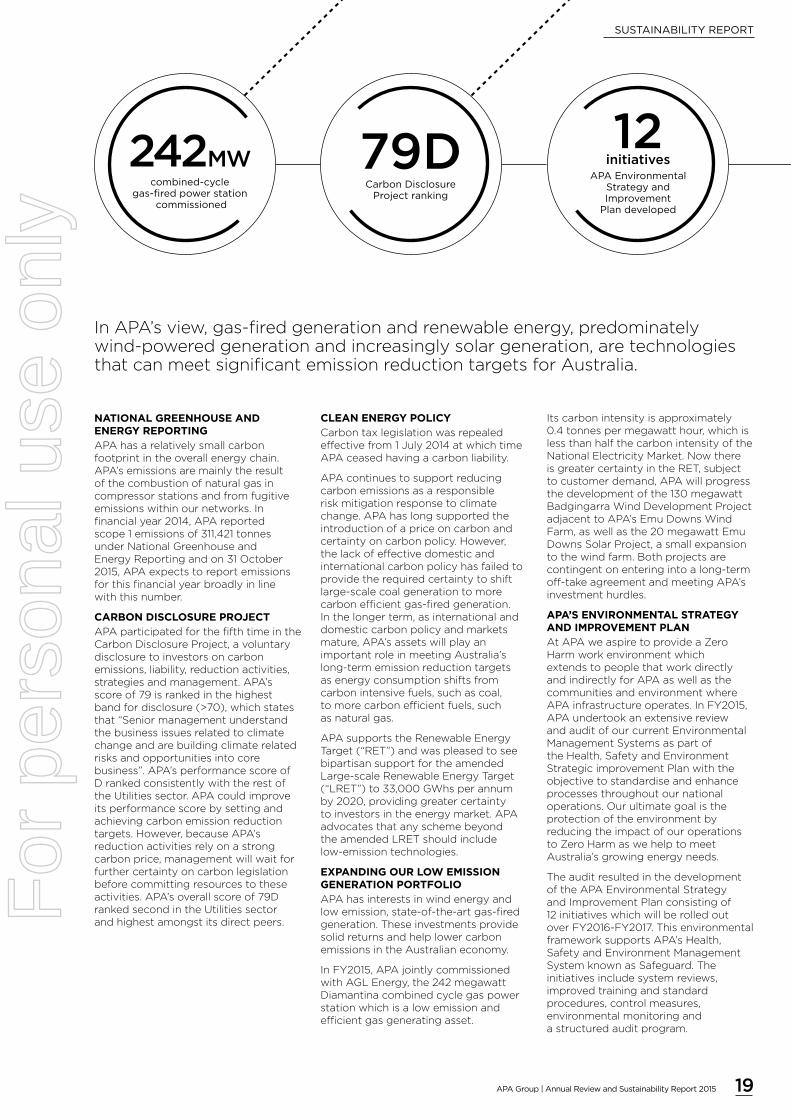
NATIONAL GREENHOUSE AND ENERGY REPORTINGAPA has a relatively small carbon footprint in the overall energy chain. APA’s emissions are mainly the result of the combustion of natural gas in compressor stations and from fugitive emissions within our networks. In financial year 2014, APA reported scope 1 emissions of 311,421 tonnes under National Greenhouse and Energy Reporting and on 31 October 2015, APA expects to report emissions for this financial year broadly in line with this number.
CARBON DISCLOSURE PROJECTAPA participated for the fifth time in the Carbon Disclosure Project, a voluntary disclosure to investors on carbon emissions, liability, reduction activities, strategies and management. APA’s score of 79 is ranked in the highest band for disclosure (>70), which states that “Senior management understand the business issues related to climate change and are building climate related risks and opportunities into core business”. APA’s performance score of D ranked consistently with the rest of the Utilities sector. APA could improve its performance score by setting and achieving carbon emission reduction targets. However, because APA’s reduction activities rely on a strong carbon price, management will wait for further certainty on carbon legislation before committing resources to these activities. APA’s overall score of 79D ranked second in the Utilities sector and highest amongst its direct peers.
CLEAN ENERGY POLICYCarbon tax legislation was repealed effective from 1 July 2014 at which time APA ceased having a carbon liability.
APA continues to support reducing carbon emissions as a responsible risk mitigation response to climate change. APA has long supported the introduction of a price on carbon and certainty on carbon policy. However, the lack of effective domestic and international carbon policy has failed to provide the required certainty to shift large-scale coal generation to more carbon efficient gas-fired generation. In the longer term, as international and domestic carbon policy and markets mature, APA’s assets will play an important role in meeting Australia’s long-term emission reduction targets as energy consumption shifts from carbon intensive fuels, such as coal, to more carbon efficient fuels, such as natural gas.
APA supports the Renewable Energy Target (“RET”) and was pleased to see bipartisan support for the amended Large-scale Renewable Energy Target (“LRET”) to 33,000 GWhs per annum by 2020, providing greater certainty to investors in the energy market. APA advocates that any scheme beyond the amended LRET should include low-emission technologies.
EXPANDING OUR LOW EMISSION GENERATION PORTFOLIOAPA has interests in wind energy and low emission, state-of-the-art gas-fired generation. These investments provide solid returns and help lower carbon emissions in the Australian economy.
In FY2015, APA jointly commissioned with AGL Energy, the 242 megawatt Diamantina combined cycle gas power station which is a low emission and efficient gas generating asset.
Its carbon intensity is approximately 0.4 tonnes per megawatt hour, which is less than half the carbon intensity of the National Electricity Market. Now there is greater certainty in the RET, subject to customer demand, APA will progress the development of the 130 megawatt Badgingarra Wind Development Project adjacent to APA’s Emu Downs Wind Farm, as well as the 20 megawatt Emu Downs Solar Project, a small expansion to the wind farm. Both projects are contingent on entering into a long-term off-take agreement and meeting APA’s investment hurdles.
APA’S ENVIRONMENTAL STRATEGY AND IMPROVEMENT PLANAt APA we aspire to provide a Zero Harm work environment which extends to people that work directly and indirectly for APA as well as the communities and environment where APA infrastructure operates. In FY2015, APA undertook an extensive review and audit of our current Environmental Management Systems as part of the Health, Safety and Environment Strategic improvement Plan with the objective to standardise and enhance processes throughout our national operations. Our ultimate goal is the protection of the environment by reducing the impact of our operations to Zero Harm as we help to meet Australia’s growing energy needs.
The audit resulted in the development of the APA Environmental Strategy and Improvement Plan consisting of 12 initiatives which will be rolled out over FY2016-FY2017. This environmental framework supports APA’s Health, Safety and Environment Management System known as Safeguard. The initiatives include system reviews, improved training and standard procedures, control measures, environmental monitoring and a structured audit program.
12 initiatives
APA Environmental Strategy and Improvement
Plan developed
In APA’s view, gas-fired generation and renewable energy, predominately wind-powered generation and increasingly solar generation, are technologies that can meet significant emission reduction targets for Australia.
SUSTAINABILITY REPORT
79DCarbon Disclosure
Project ranking
242MWcombined-cycle
gas-fired power station commissioned
For
per
sona
l use
onl
y

We will positively engage the communities within which we operate by:
— Building long-term strategic community relationships to maintain support and goodwill for APA’s activities.
— Increasing employee connections with local communities through sponsorships, employee volunteering and giving programs targeting vulnerable communities.
2015 PERFORMANCE ACTIONS FOR 2016
— Continued APA’s Building Brighter Futures community investment program supporting the Fred Hollows Foundation, Exodus Foundation (for Darwin Literacy Centre), and Clontarf Foundation.
— Introduced APA employee involvement in Clontarf Foundation and Fred Hollows Foundation events.
— Employees across APA participated in four community fundraising events including Cancer Council (Australia’s Biggest Morning Tea and Pink Ribbon Day), Black Dog Institute and Movember with their fundraising efforts matched by APA, up to $10,000 per event.
— Maintain support of our community investment program, Building Brighter Futures, by continuing our three headline partnerships. Employee involvement will also be continued to further support our partners’ objectives.
— Continue financial support for community events of up to $10,000 per event by matching employee fundraising for employee nominated causes.
— Continue to invest in causes that enhance our relationships with key community stakeholders and strengthen our brand.
Students from the Clontarf Foundation Academy meet with APA Sydney employees
KEY SUSTAINABILITY RISKS RISK MANAGEMENT
Community relations - Maintaining community support and goodwill for APA’s activities.
— Remain in touch with community interests and issues.
— APA actively engages with its communities through sponsorships.
— Construct and operate infrastructure using industry recognised standards or better.
— Education and communication around APA’s activities.
Encroachment - Urban encroachment around existing pipeline easements can increase the potential for damage. A change in pipeline location class may also increase compliance costs.
— Landowner and community education and support of “Dial Before You Dig” service.
— Pipeline easement monitoring and surveillance.
— Liaise with council and planning authorities to effectively manage potential encroachment issues.
COMMUNITY
SUSTAINABILITY REPORT
20
For
per
sona
l use
onl
y

21APA Group | Annual Review and Sustainability Report 2015
Building Brighter Futures supports initiatives to improve the future prospects of vulnerable Australians. Established in late 2010, the program seeks to strengthen our company and employment brand and connect the APA business and people to the communities in which we live and work.
The program includes:
— Corporate partnerships with three selected charities focused on supporting disadvantaged young Indigenous Australians.
— An employee community event calendar, supporting up to four employee-nominated causes, with capped matching of funds raised.
HEADLINE PARTNERSHIPS APA continues to support its three charity partners under three-year commitments that were renewed or established in March 2014.
The Clontarf Foundation works to improve the education, discipline, life skills, self-esteem and employment prospects of young Aboriginal men, through a network of football academies established in partnership with local schools. APA has been working with the Clontarf Foundation since 2011.
The Exodus Foundation’s Literacy Program is an accelerated literacy program to support disadvantaged children with severely compromised reading ability. APA has funded three children per annum to participate in the Foundation’s Darwin program since 2011.
In Australia, the Fred Hollows Foundation provides eye treatment and health programs for Indigenous communities in remote Australia. APA has been working with the Fred Hollows Foundation to deliver its Australian program since 2014.
In addition to direct financial support, APA introduced employee involvement in two of our three headline partners’ events in FY2015. APA employee representatives participated in these events as part of their personal and career development and shared their experiences throughout APA with an article in APA’s employee magazine as well as presenting at APA’s annual Leadership Conference. The events attended were:
— Clontarf Foundation’s Broome Leadership Academy: A three-day event where young Indigenous students are taught about leadership as part of building their skills for future work prospects.
— Fred Hollows Foundation’s See Australia: A five-day trek across outback areas to participate in eye clinics and other health programs for the Indigenous Community.
— Fred Hollows Foundation’s Barunga Festival involvement: A three-day festival hosted by the Barunga Aboriginal community in Western Australia for various remote Aboriginal communities in the Top End. The Foundation attended to educate the community about eye care and other basic health information.
— Clontarf Foundation’s Jatbula Experience: A six-day hike (in June) through Nitmiluk National Park providing the opportunity to engage with students from the Katherine Clontarf Academy who guided the group on the 62 kilometre trail.
Two APA sites also hosted Clontarf Foundation Academy students during the year. Sydney and Perth employees engaged with the students to learn more about how the Foundation helps young Indigenous men.
Looking ahead, APA will support the Clontarf Foundation to implement a program to assist Academy students to be work-ready. The Clontarf Employment Pathways program will allow selected APA colleagues the opportunity to provide mentoring and guidance to Clontarf students during Clontarf Employment Forums and help develop their exposure to, and experiences in, the corporate environment.
CALENDAR OF EMPLOYEE EVENTS Throughout the year, APA continued to support and promote employee events across multiple company sites and matched the funds raised by employees, to a capped amount per event. The events were selected based on an earlier survey of employees seeking their nominations of the four most worthy causes. The selected events/causes being:
— Pink Ribbon Day (Cancer Council)
— Movember (Movember Foundation)
— Black Dog Institute (Mental Health research)
— Australia’s Biggest Morning Tea (Cancer Council)
SPONSORSHIP AND DONATIONSIn addition to its Building Brighter Futures program, APA continued to provide monetary and in-kind support to a number of groups or causes that achieve one or more of the following:
— Strengthen APA’s reputation in the local community
— Enhance APA’s relationships with key community stakeholders
— Increase community awareness and understanding of APA
— Provide positive networking opportunities with community stakeholders
The two major sponsorships in FY2015 were for Taronga Zoo Foundation and the Australian Brandenburg Orchestra.
In FY2015 APA built on its ‘Building Brighter Futures’ community investment program, successfully introducing and implementing employee involvement in two of the program’s headline partners’ events.
SUSTAINABILITY REPORT
$73Kraised by employees,
including APA matched funding
4Employee
supported community fundraising events
For
per
sona
l use
onl
y
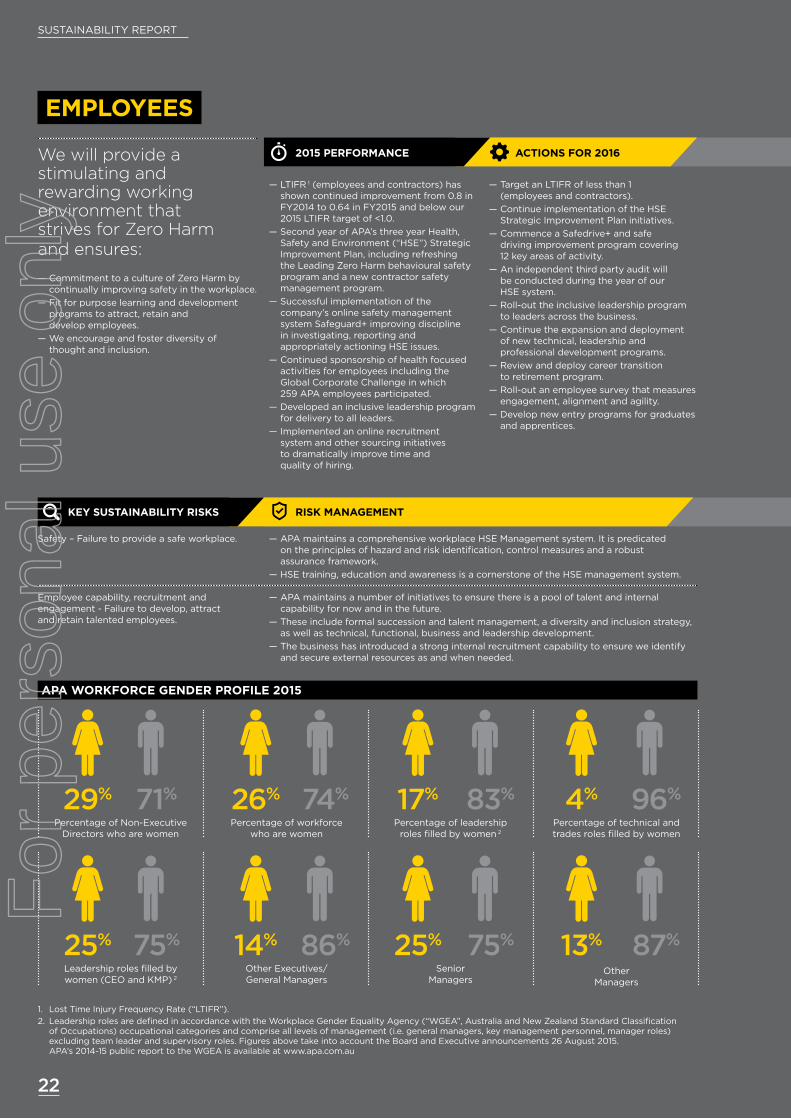
SUSTAINABILITY REPORT
22
We will provide a stimulating and rewarding working environment that strives for Zero Harm and ensures:
— Commitment to a culture of Zero Harm by continually improving safety in the workplace.
— Fit for purpose learning and development programs to attract, retain and develop employees.
— We encourage and foster diversity of thought and inclusion.
2015 PERFORMANCE ACTIONS FOR 2016
— LTIFR 1 (employees and contractors) has shown continued improvement from 0.8 in FY2014 to 0.64 in FY2015 and below our 2015 LTIFR target of <1.0.
— Second year of APA’s three year Health, Safety and Environment (“HSE”) Strategic Improvement Plan, including refreshing the Leading Zero Harm behavioural safety program and a new contractor safety management program.
— Successful implementation of the company’s online safety management system Safeguard+ improving discipline in investigating, reporting and appropriately actioning HSE issues.
— Continued sponsorship of health focused activities for employees including the Global Corporate Challenge in which 259 APA employees participated.
— Developed an inclusive leadership program for delivery to all leaders.
— Implemented an online recruitment system and other sourcing initiatives to dramatically improve time and quality of hiring.
— Target an LTIFR of less than 1 (employees and contractors).
— Continue implementation of the HSE Strategic Improvement Plan initiatives.
— Commence a Safedrive+ and safe driving improvement program covering 12 key areas of activity.
— An independent third party audit will be conducted during the year of our HSE system.
— Roll-out the inclusive leadership program to leaders across the business.
— Continue the expansion and deployment of new technical, leadership and professional development programs.
— Review and deploy career transition to retirement program.
— Roll-out an employee survey that measures engagement, alignment and agility.
— Develop new entry programs for graduates and apprentices.
1. Lost Time Injury Frequency Rate (“LTIFR”).
2. Leadership roles are defined in accordance with the Workplace Gender Equality Agency (“WGEA”, Australia and New Zealand Standard Classification of Occupations) occupational categories and comprise all levels of management (i.e. general managers, key management personnel, manager roles) excluding team leader and supervisory roles. Figures above take into account the Board and Executive announcements 26 August 2015. APA’s 2014-15 public report to the WGEA is available at www.apa.com.au
APA WORKFORCE GENDER PROFILE 2015
Percentage of Non-Executive Directors who are women
Leadership roles filled by women (CEO and KMP) 2
Percentage of workforce who are women
Other Executives/ General Managers
Percentage of leadership roles filled by women 2
Senior Managers
Percentage of technical and trades roles filled by women
Other Managers
29%
25%
71%
75%
26%
14%
74%
86%
17%
25%
83%
75%
4%
13%
96%
87%
KEY SUSTAINABILITY RISKS RISK MANAGEMENT
Safety – Failure to provide a safe workplace. — APA maintains a comprehensive workplace HSE Management system. It is predicated on the principles of hazard and risk identification, control measures and a robust assurance framework.
— HSE training, education and awareness is a cornerstone of the HSE management system.
Employee capability, recruitment and engagement - Failure to develop, attract and retain talented employees.
— APA maintains a number of initiatives to ensure there is a pool of talent and internal capability for now and in the future.
— These include formal succession and talent management, a diversity and inclusion strategy, as well as technical, functional, business and leadership development.
— The business has introduced a strong internal recruitment capability to ensure we identify and secure external resources as and when needed.
EMPLOYEES
For
per
sona
l use
onl
y
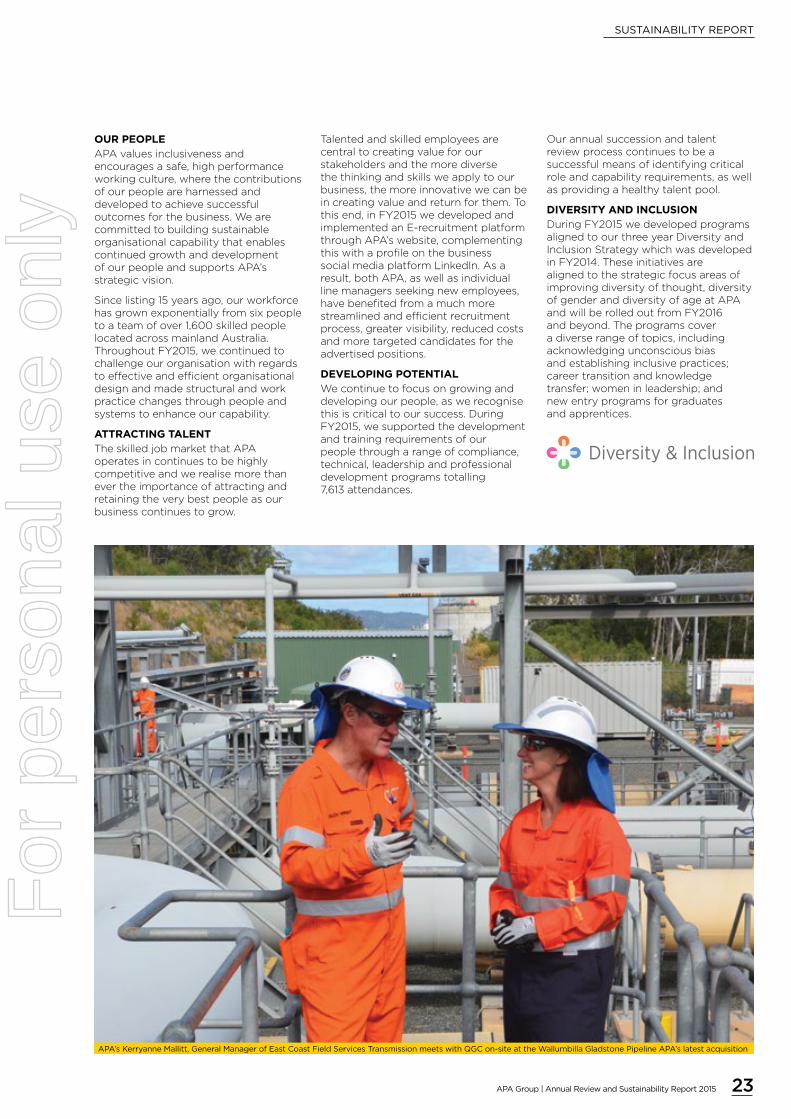
23APA Group | Annual Review and Sustainability Report 2015
SUSTAINABILITY REPORT
OUR PEOPLEAPA values inclusiveness and encourages a safe, high performance working culture, where the contributions of our people are harnessed and developed to achieve successful outcomes for the business. We are committed to building sustainable organisational capability that enables continued growth and development of our people and supports APA’s strategic vision.
Since listing 15 years ago, our workforce has grown exponentially from six people to a team of over 1,600 skilled people located across mainland Australia. Throughout FY2015, we continued to challenge our organisation with regards to effective and efficient organisational design and made structural and work practice changes through people and systems to enhance our capability.
ATTRACTING TALENTThe skilled job market that APA operates in continues to be highly competitive and we realise more than ever the importance of attracting and retaining the very best people as our business continues to grow.
Talented and skilled employees are central to creating value for our stakeholders and the more diverse the thinking and skills we apply to our business, the more innovative we can be in creating value and return for them. To this end, in FY2015 we developed and implemented an E-recruitment platform through APA’s website, complementing this with a profile on the business social media platform LinkedIn. As a result, both APA, as well as individual line managers seeking new employees, have benefited from a much more streamlined and efficient recruitment process, greater visibility, reduced costs and more targeted candidates for the advertised positions.
DEVELOPING POTENTIALWe continue to focus on growing and developing our people, as we recognise this is critical to our success. During FY2015, we supported the development and training requirements of our people through a range of compliance, technical, leadership and professional development programs totalling 7,613 attendances.
Our annual succession and talent review process continues to be a successful means of identifying critical role and capability requirements, as well as providing a healthy talent pool.
DIVERSITY AND INCLUSIONDuring FY2015 we developed programs aligned to our three year Diversity and Inclusion Strategy which was developed in FY2014. These initiatives are aligned to the strategic focus areas of improving diversity of thought, diversity of gender and diversity of age at APA and will be rolled out from FY2016 and beyond. The programs cover a diverse range of topics, including acknowledging unconscious bias and establishing inclusive practices; career transition and knowledge transfer; women in leadership; and new entry programs for graduates and apprentices.
APA’s Kerryanne Mallitt, General Manager of East Coast Field Services Transmission meets with QGC on-site at the Wallumbilla Gladstone Pipeline APA’s latest acquisition
For
per
sona
l use
onl
y

24
7 RUSSELL HIGGINS AO
Russell joined the Board in 2004. He has extensive experience both locally and internationally in the energy sector and in economic and fiscal policy. He was Secretary and Chief Executive Officer of the Department of Industry, Science and Resources from 1997 to 2002 and Chairman of the Australian Government’s Energy Task Force from 2003 to 2004. Russell is Chairman of the Health Safety and Environment Committee and a member of the Audit and Risk Management Committee.
8 PATRICIA MCKENZIE
Patricia joined the Board in 2011. She has considerable expertise and experience in energy market regulation having been Chief Executive Officer of Gas Market Company Limited and a former Director of Australian Energy Market Operator Limited. Patricia also has extensive corporate legal experience and is a qualified solicitor. Patricia is a member of the Health Safety and Environment Committee and the Remuneration Committee.
9 ROBERT WRIGHT
Robert joined the Board in 2000. He has over 30 years’ financial management experience, having held a number of Chief Financial Officer positions, including Finance Director of David Jones Limited. He is currently Chairman of APA Ethane Limited, the responsible entity of Ethane Pipeline Income Fund. Robert is Chairman of the Audit and Risk Management Committee and a member of the Health Safety and Environment Committee.
Retiring: 22 October 2015
1 LEN BLEASEL AM
Chairman
Leonard (Len) was appointed Chairman in 2007. He has had a long career in the energy industry commencing his career with AGL in 1958 working in a variety of roles, culminating in the position of Managing Director and CEO from 1990 until his retirement from management in 2001. Len was awarded an AM in the General Division of the Order of Australia for services to the Australian gas and energy industries and the community.
2 MICK McCORMACK
Chief Executive Officer and Managing Director
Michael (Mick) has been Chief Executive Officer of APA since 1 July 2005 and Managing Director since 1 July 2006. Mick has over 30 years’ experience in the gas infrastructure sector in Australia, and his career has encompassed all aspects of the sector, including commercial development, design, construction, operation and management of most of Australia’s natural gas pipelines and gas distribution systems.
3 STEVE CRANE
Steven (Steve) joined the Board in 2011. His background is in investment banking and he has over 30 years’ experience in the financial services industry having previously been Chief Executive Officer of ABN AMRO Australia and BZW Australia. Steve also has considerable experience as a non-executive Director of listed entities. Steve is a member of the Audit and Risk Management Committee and the Remuneration Committee.
4 JOHN FLETCHER
John joined the Board in 2008 and has over 35 years’ experience in the energy industry, including Chief Financial Officer of AGL. He brings a wide commercial and financial practical knowledge to the Board. John was previously an AGL appointed Director of Australian Pipeline Limited from 2000 to 2005. John is Chairman of the Remuneration Committee and a member of the Audit and Risk Management Committee.
5 MICHAEL FRASER
Michael has more than 30 years’ experience in the Australian energy industry He has held various executive positions at AGL culminating in his role as Managing Director and Chief Executive Officer until February 2015. Michael is a former Chairman of the Clean Energy Council, Elgas Limited and ActewAGL, and a former Director of Queensland Gas Company Limited. Michael is a member of the Remuneration Committee and the Health Safety and Environment Committee.
Effective: 1 September 2015
6 DEBBIE GOODIN
Debra (Debbie) has considerable experience as a non-executive director. Debbie is currently a director of ASX-listed companies Senex Energy Limited, oOh!media Limited and Victorian government owned City West Water. Debbie also has extensive executive experience in operations and corporate development, including with engineering and professional services firms. Debbie is a member of the Audit and Risk Management Committee and the Health Safety and Environment Committee.
Effective: 1 September 2015
1 2 3 4
7 8 95 6
APA GROUP BOARD
The Board is accountable to Securityholders for the performance of APA. It endorses the strategic direction of the business, approves new projects within that strategy and monitors the management and performance of the business and the executive team. The Board operates in accordance with the APA Group Board Charter.
For
per
sona
l use
onl
y

25APA Group | Annual Review and Sustainability Report 2015
View full biographies of our people at
APA.COM.AU
7 ELISE MANNS
Group Executive Human Resources
Responsible for managing the human resources function, which covers strategy and activities relating to APA’s employees, including providing a safe work environment for all employees.
8 NEVENKA CODEVELLE
Company Secretary and General Counsel
Responsible for the company secretariat and general counsel functions, including corporate governance and compliance, and legal advisory and support.
9 MARK KNAPMAN
Company Secretary
Responsible for the secretariat function, corporate governance, legal, internal audit and financial services compliance functions.
Retiring: October 2015
1 ROSS GERSBACH
Chief Executive Strategy and Development
Responsible for complementary businesses that enhance APA’s infrastructure portfolio, including power generation and APA’s Energy Investments as well as group strategy, regulatory and government affairs, environmental development and mergers and acquisitions.
2 ROB WHEALS
Group Executive Transmission
Responsible for the commercial and operational performance of APA’s gas transmission and gas storage assets.
3 JOHN FERGUSON
Group Executive Networks
Responsible for the management and operation of APA’s minority owned gas distribution assets, and Australian Gas Networks assets.
4 KEVIN LESTER
Group Executive Infrastructure Development
Responsible for engineering services and the delivery of APA’s infrastructure expansion projects, including asset management, project development and technical regulation of all pipeline and related assets.
5 PETER FREDRICSON
Chief Financial Officer
Responsible for all financial functions, including accounting and financial reporting, financial compliance and governance, taxation, treasury, balance sheet management and capital strategy, and insurance and risk. He is also responsible for investor relations and information technology.
6 PETER WALLACE
Group Executive Human Resources
Responsible for managing the human resources function, which covers strategy and activities relating to APA’s employees, including providing a safe work environment for all employees.
Retiring: October 2015
1 2 3 4 5
6 97 8
SENIOR MANAGEMENT
APA is an internally managed and operated business overseen by an executive leadership team with extensive know-how and industry experience across all areas of operations. Our leadership team holds the business to account to ensure high standards are achieved.
For
per
sona
l use
onl
y

26
FINANCIAL PERFORMANCE (STATUTORY) 2015 2014 2013 6 2012 2011
Revenue $m 1,553.6 1,396.0 1,272.3 1,060.7 1,102.0
Revenue excluding pass-through 1 $m 1,119.2 992.5 919.5 758.0 720.3
EBITDA $m 1,269.5 747.3 763.6 525.8 492.1
Depreciation and amortisation expense $m (208.2) (156.2) (130.5) (110.4) (100.4)
EBIT $m 1,061.3 591.1 633.2 415.4 391.8
Interest expense $m (324.2) (325.1) (290.9) (234.3) (247.1)
Tax (expense)/benefit $m (177.2) 77.7 (49.9) (50.4) (35.9)
Non-controlling interests $m (1.0) (1.0) 2.8 — (0.3)
Profit after tax and non-controlling interests including significant items $m 559.9 343.7 295.1 130.7 108.5
Significant items — after income tax $m 356.0 144.1 120.0 (9.7) (0.4)
Profit after tax and minorities, excluding significant items $m 203.9 199.6 175.1 140.3 108.9
FINANCIAL POSITION
Total assets $m 14,652.9 7,972.5 7,698.9 5,496.1 5,427.6
Total drawn debt 2 $m 8,642.8 4,789.4 4,412.0 3,223.6 3,239.9
Total equity $m 4,382.7 2,496.5 2,513.9 1,614.0 1,667.8
CASH FLOW AND CAPITAL EXPENDITURE
Operating cash flow 3 $m 562.2 431.5 374.4 335.6 290.0
Capital expenditure $m 2,814.6 446.8 397.4 249.1 173.4
Investments and acquisitions $m 17.4 — 330.8 46.4 342.7
KEY FINANCIAL RATIOS
Earnings per security 4 cents 56.3 39.7 38.2 20.4 19.7
Operating cash flow per security 4 cents 56.5 49.8 48.5 52.5 52.6
Distribution per security cents 38.0 36.3 35.5 35.0 34.4
Gearing (net debt to net debt plus equity) % 63.4 64.2 62.8 65.0 66.2
Interest cover ratio times 2.6 2.3 2.3 2.5 2.0
Weighted average number of securities 4 m 995.2 866.0 772.3 639.7 551.2
EBITDA BY SEGMENT (EXCLUDING SIGNIFICANT ITEMS)
EBITDA (Continuing Business)
Energy Infrastructure
East Coast Grid: Queensland $m 340.1 234.5 180.7 91.0 82.0
New South Wales $m 120.8 115.6 120.2 122.8 111.8
Victoria $m 130.2 127.6 136.9 138.3 128.8
South Australia $m 1.9 2.4 2.4 2.1 2.1
Western Australia $m 212.6 189.0 149.4 133.9 108.1
Northern Territory $m 18.0 15.2 13.5 10.6 5.6
Asset Management $m 49.5 67.6 51.6 35.6 42.5
Energy Investments $m 21.8 18.0 15.6 9.6 3.2
Divested businesses 5 $m 1.0 50.1 56.2 55.2 64.3
1. Pass-through revenue is revenue on which no margin is earned. Pass-through revenue arises in the asset management operations in respect of costs incurred in, and passed on to Australian Gas Networks Limited (“AGN”, formerly Envestra Limited) and GDI in respect of, the operation of the AGN and GDI assets respectively.
2. APA’s liability to repay debt at relevant due dates of the drawn facilities. This amount represents current and non-current borrowings as per balance sheet and is adjusted for deferred borrowing costs, the effect of unwinding of discount, unrealised foreign exchange differences reported in equity and deducting other financial liabilities that are reported as part of borrowings in the balance sheet.
3. Operating cash flow = net cash from operations after interest and tax payments.
4. Between 23 December 2014 and 28 January 2015, APA issued a total of 278,556,562 new ordinary securities resulting in total securities on issue as at 30 June 2015 of 1,114,307,369. The issue was offered at $6.60 per security, a discount to APA’s closing market price of $7.67 per security on 9 December 2014, the last trading day before the record date of the entitlement offer of 15 December 2014. The weighted average number of securities for the current and prior period (FY2014) has been adjusted in accordance with the accounting principles of AASB 133: ‘Earnings per Share’, for the discounted rights issue.
5. Australian Gas Networks Limited sold in August 2014, Moomba Adelaide Pipeline System sold in FY2013, APA Gas Network Queensland (Allgas) was sold into GDI (EII) Pty Ltd in FY2012, with APA retaining a 20 per cent interest in GDI (EII) Pty Ltd and operates the assets under a long term asset management agreement.
6. The balances for June 2013 have been restated for the effect of applying AASB: 119 ‘Employee Benefits’.
FIVE YEAR SUMMARYF
or p
erso
nal u
se o
nly

ANNUAL MEETING DETAILS Date: Thursday, 22 October 2015 Venue: City Recital Hall, Angel Place, Sydney NSW Time: 10.30am Registration commences at 10.00am
ASX LISTING An APA Group security comprises a unit in Australian Pipeline Trust and a unit in APT Investment Trust. These units are stapled together to form a stapled security which is listed on the ASX (ASX Code: APA). Australian Pipeline Limited is the Responsible Entity of those trusts.
APA GROUP RESPONSIBLE ENTITY AND REGISTERED OFFICE Australian Pipeline Limited ACN 091 344 704
Level 19, 580 George Street, Sydney NSW 2000
PO Box R41, Royal Exchange NSW 1225
Telephone: +61 2 9693 0000 Facsimile: +61 2 9693 0093 Website: apa.com.au
APA GROUP REGISTRY Link Market Services Limited Level 12, 680 George Street, Sydney NSW 2000
Locked Bag A14, Sydney South NSW 1235
Telephone: +61 1800 992 312 Facsimile: +61 2 9287 0303 Email: apagroup@ linkmarketservices.com.au Website: linkmarketservices.com.au
SECURITYHOLDER DETAILSIt is important that Securityholders notify the APA Group registry immediately if there is a change to their address or banking arrangements. Securityholders with enquiries should also contact the APA Group registry.
DISTRIBUTION PAYMENTS Distributions will be paid semi-annually in March and September. Securityholders will receive annual tax statements with the final distribution in September. Payment to Securityholders residing in Australia and New Zealand will be made only by direct credit into an Australian or New Zealand bank account. Securityholders with enquires should contact the APA Group registry.
ONLINE INTERACTIVE REPORTS APA Group’s 2015 Annual Report, Annual Review and Sustainability Report are available in an easy to view interactive format at apa.com.au.
ONLINE INFORMATIONFurther information on APA is available at apa.com.au, including:
— Results, market releases and news
— Asset and business information
— Corporate responsibility and sustainability reporting
— Securityholder information such as the current APA security price, distribution and tax information.
ELECTRONIC COMMUNICATION Securityholders can elect to receive communication from APA electronically by registering their email address with the APA Group registry. Electing to receive annual reports electronically will reduce the adverse impact we have on the environment.
CALENDAR OF EVENTS
Final distribution FY2015 record date 30 June 2015
Final distribution FY2015 payment date 16 September 2015
Annual meeting 22 October 2015
Interim result announcement 24 February 2016 1
Interim distribution FY2016 record date 31 December 2015 1
Interim distribution FY2016 payment date 16 March 2016 1
1. Subject to change
DISCLAIMER: APA Group comprises two registered investment schemes, Australian Pipeline Trust (ARSN 091 678 778) and APT Investment Trust (ARSN 115 585 441), the securities of which are stapled together. Australian Pipeline Limited (ACN 091 344 704) is the responsible entity of Australian Pipeline Trust and APT Investment Trust. Please note that Australian Pipeline Limited is not licensed to provide financial product advice in relation to securities in APA Group. This publication does not constitute financial product advice and has been prepared without taking into account your objectives, financial situation or particular needs. Before relying on any statements contained in this publication, including forecasts and projections, you should consider the appropriateness of the information, having regard to your own objectives, financial situations and needs and consult an investment adviser if necessary. Whilst due care and attention have been used in preparing this publication, certain forward looking statements are made in this publication which are not based on historical fact and necessarily involve assumptions as to future events and analysis, which may or may not be correct. These forward looking statements should not be relied upon as an indication or guarantee of future performance.
ONLINEINTERACTIVE
REPORTS
ANNUALMEETING
APA.COM.AU
10:30AM, THURSDAY 22 OCTOBER 2015
ANGEL PLACE, SYDNEY NSW
INVESTORINFORMATION
27APA Group | Annual Review and Sustainability Report 2015
For
per
sona
l use
onl
y

MOUNTISA
MOOMBA WALLUMBILLA
SYDNEY
ADELAIDE
BRISBANE
MELBOURNE
GLADSTONE
DARWIN
PERTH
3
2313
14
17
19
18
2016
15
23
12
26
23
2
4
6
24
25
23
22
119
10
78
23
23
21
23
5
1
GOLDFIELDS GASPIPELINE EXPANSION
Commenced in 2012, the final phase in this project was completed during the first half of FY2015 with commencement of operations at the new dual unit Turee Creek compressor. Pipeline capacity has increased a total of 28% with the expansion works undertaken on behalf of mining operations in the Pilbara.
EASTERN GOLDFIELDS
EXPANSION
Commenced construction of the new 293 km transmission pipeline and associated delivery and meter stations. Gas will be transported 1,500 km along 3 APA interconnected pipelines. Commencement date for services is 1 January 2016.
£ READ MORE P11
MOOMBA COMPRESSION
3 new compressors installed to provide a major capacity uplift on the South West Queensland Pipeline ahead of the Gladstone LNG project start-ups.
VICTORIAN NORTHERN
INTERCONNECT (VNI) EXPANSION
Enhanced capacity by looping 162 km of the VNI.
A fourth multi-service agreement was announced in July 2015 which will require further expansion of the VNI.
£ READ MORE P10
NT LINK
Continued the feasibility study committed to in FY2014.APA is 1 of 4 shortlisted bidders by the Northern Territory Government.
£ READ MORE P11
28
OUR FOOTPRINTAND KEY 2015 ACTIVITIES
~$19Bof energy infrastructure owned and/or operated
across Australia
~14,700KMtransmission gas pipelines
owned and/or operated by APA
APA Group assets and investmentsUnder constructionPotential pipeline linkAssets operated by APA (not owned)Other pipelines
For
per
sona
l use
onl
y

MOUNTISA
MOOMBA WALLUMBILLA
SYDNEY
ADELAIDE
BRISBANE
MELBOURNE
GLADSTONE
DARWIN
PERTH
3
2313
14
17
19
18
2016
15
23
12
26
23
2
4
6
24
25
23
22
119
10
78
23
23
21
23
5
1
NETWORK OPERATIONS
28,535new gas connections added.
541 kmsof network mains replaced.
349 kmsof gas pipeline added to distribution networks.
£ READ MORE P12
ENERGY INFRASTRUCTURE
Queensland1. Roma Brisbane Pipeline2. Carpentaria Gas Pipeline 3. Berwyndale Wallumbilla Pipeline4. South West Queensland Pipeline5. Wallumbilla Gladstone Pipeline New South Wales6. Moomba Sydney Pipeline7. Central West Pipeline8. Central Ranges PipelineVictoria9. Victorian Transmission System 10. Dandenong LNG facility South Australia11. SESA PipelineNorthern Territory12. Amadeus Gas PipelineWestern Australia13. Pilbara Pipeline System14. Goldfields Gas Pipeline (88.2%)15. Eastern Goldfields Pipeline
(under construction)16. Kalgoorlie Kambalda Pipeline17. Mid West Pipeline (50%)18. Parmelia Gas Pipeline19. Mondarra Gas Storage Facility20. Emu Downs Wind Farm
ENERGY INVESTMENTS
21. GDI (EII) Pty Ltd (20%) Allgas Gas distribution network in Queensland
22. SEA Gas Pipeline (50%)23. Energy Infrastructure
Investments (19.9%) Gas pipelines, electricity transmission, gas-fired power stations and gas processing plants
24. Ethane Pipeline Income Fund (6.1%)25. EII2 (20.2%) North Brown Hill
Wind Farm26. Diamantina and Leichhardt Power
Stations (50%)
ASSET MANAGEMENT
Commercial and/or operational services to: — Australian Gas Networks
(formerly Envestra)— GDI (EII) – Allgas (20%)— Energy Infrastructure
Investments (19.9%)— Ethane Pipeline Income Fund (6.1%)— SEA Gas Pipeline (50%)— EII2 (20.2%)— other third parties
DIAMANTINA AND LEICHHARDT
POWER STATIONS
Completed construction of both power stations which are now fully operational.
£ READ MORE P14
WALLUMBILLA GLADSTONE
PIPELINE
$6 billion acquisition completed and contributing EBITDA.
£ READ MORE P9
ROMA BRISBANE PIPELINE
Bi-directional capability due for completion 1Q FY2016.
INTEGRATED OPERATIONS
CENTRE (IOC)
Opened the national IOC, centralising APA’s commercial, technical and operational resources.
BERWYNDALE WALLUMBILLA
PIPELINE
Completed bi-directional capability.
WALLUMBILLA COMPRESSION
3 new compressors added.
SOUTH WEST QUEENSLAND
PIPELINE
Completed bi-directional capability.
Expansion projects support the bourgeoning LNG market.
£ READ MORE P10
MOOMBA SYDNEY PIPELINE SOUTHERN LATERAL
Completed installation of a third compressor at Culcairn to increase capacity.
VICTORIAN TRANSMISSION SYSTEM
Various capex projects as prescribed by access arrangements.
Constructed a new compressor station at Winchelsea on APA’s South West Pipeline.
MOOMBA SYDNEY PIPELINE
Bi-directional capability due for completion 1Q FY2016 and in-pipe storage services will provide flexibility to customers.
29APA Group | Annual Review and Sustainability Report 2015
For
per
sona
l use
onl
y

30
APA.COM.AU
For
per
sona
l use
onl
y

APA GROUPANNUAL REPORT
2015
CONNECTING MARKETS CREATING OPPORTUNITIES
For
per
sona
l use
onl
y

AUSTRALIAN PIPELINE TRUST
01 Directors’Report
23 RemunerationReport
36 ConsolidatedStatementofProfitorLossandOtherComprehensiveIncome
37 ConsolidatedStatementofFinancialPosition
38 ConsolidatedStatementofChangesinEquity
39 ConsolidatedStatementofCashFlows
41 NotestotheConsolidatedFinancialStatements
76 DeclarationbytheDirectorsofAustralianPipelineLimited
77 Auditor’sIndependenceDeclaration
78 IndependentAuditor’sReport
APT INVESTMENT TRUST
80 Directors’Report
82 ConsolidatedStatementofProfitorLossandOtherComprehensiveIncome
83 ConsolidatedStatementofFinancialPosition
84 ConsolidatedStatementofChangesinEquity
85 ConsolidatedStatementofCashFlows
86 NotestotheConsolidatedFinancialStatements
95 DeclarationbytheDirectorsofAustralianPipelineLimited
96 Auditor’sIndependenceDeclaration
97 IndependentAuditor’sReport
99 AdditionalInformation
For
per
sona
l use
onl
y

1APA Group | Annual Report 2015
AUSTRALIANPIPELINETRUSTANDITSCONTROLLEDENTITIESARSN091678778
DIRECTORS’ REPORT
TheDirectorsofAustralianPipelineLimited(“ResponsibleEntity”)submittheirreportandtheannualfinancialreportofAustralianPipelineTrust(“APT”)anditscontrolledentities(together“APA”or“ConsolidatedEntity”)forthefinancialyearended30June2015.ThisreportreferstotheconsolidatedresultsofAPTandAPTInvestmentTrust(“APTIT”).
DIRECTORSThenamesoftheDirectorsoftheResponsibleEntityduringthefinancialyearandsincethefinancialyearendare:
LeonardBleaselAM Chairman
MichaelMcCormack ChiefExecutiveOfficerandManagingDirector
StevenCrane
JohnFletcher
RussellHigginsAO
PatriciaMcKenzie
RobertWright
DetailsoftheDirectors,theirqualifications,experience,specialresponsibilitiesanddirectorshipsofotherlistedentitiesaresetoutonpages19to21.
TheCompanySecretaryoftheResponsibleEntityduringandsincethefinancialyearendisMarkKnapman.
PRINCIPAL ACTIVITIESTheprincipalactivitiesofAPAduringthecourseoftheyearweretheownershipandoperationofenergyinfrastructureassetsandbusinesses,including:
— energyinfrastructure,primarilygastransmissionbusinesseslocatedacrossAustralia;
— assetmanagementandoperationsservicesforthemajorityofAPA’senergyinvestmentsandforthirdparties;and
— energyinvestmentsinlistedandunlistedentities.
STATE OF AFFAIRSNosignificantchangeinthestateofaffairsofAPAoccurredduringtheyear.
SUBSEQUENT EVENTSExceptasdisclosedelsewhereinthisreport,theDirectorsareunawareofanymatterorcircumstancethathasoccurredsincetheendofthefinancialyearthathassignificantlyaffectedormaysignificantlyaffecttheoperationsofAPA,theresultsofthoseoperationsorthestateofaffairsofAPAinfutureyears.
FINANCIAL AND OPERATIONAL REVIEW1. About APA
1.1 APAOverviewAPAisAustralia’slargestnaturalgasinfrastructurebusiness.Itownsand/oroperatesorhasaninterestinapproximately$19billionofenergyinfrastructureacrossAustralia,andoperatesthesewithaskilledworkforceinexcessof1,600people.
APAhasadiverseportfolioofapproximately14,700kilometresofgastransmissionpipelinesthatspanseverystateandterritoryonmainlandAustraliaanddeliversabouthalfthenation’snaturalgas.Italsoownsorhasinterestsinotherrelatedenergyinfrastructureassetssuchasgasstoragefacilities,gasprocessingfacilities,gascompressionfacilitiesandpowergenerationassets.
On3June2015,APAcompletedtheacquisitionofthepipelinethatconnectstheQueenslandCurtisLNGProjecttoitsexportportatGladstone,fromBGGroup.APAhasrenamedthepipelinetheWallumbillaGladstonePipeline–seepage8.
APAhasownershipinterestsin,and/oroperates,theGDI(EII)PtyLtd(“GDI”)andAustralianGasNetworksLimited(previouslyEnvestraLimited)gasdistributionnetworks,whichtogetherhaveapproximately27,700kilometresofgasmainsandpipelines,andapproximately1.3milliongasconsumerconnections.
APAalsohasinterestsin,andoperates,otherenergyinfrastructureassetsandbusinesses,includingSEAGasPipeline,EnergyInfrastructureInvestments(“EII”),EII2,DiamantinaPowerStationandEthanePipelineIncomeFund.
APA’sobjectiveofmaximisingsecurityholdervalueisachievedthroughexpandingandenhancingitsinfrastructureportfolio,securinglowrisk,long-termrevenueonitsassets,operatingthebusinesssafelyandefficientlyandgeneratingfurthervaluethroughitsmanyandvariedserviceofferings.
APAislistedontheAustralianSecuritiesExchange(“ASX”)andisincludedintheS&PASX50Index.SincelistinginJune2000,itsmarketcapitalisationhasincreasedmorethan18-foldto$9.2billion(asat30June2015),andithasachievedtotalsecurityholderreturnof1,304%orannualcompoundgrowthrateof19.2%1attheendofthefinancialyear.
1) TotalsecurityholderreturnisthecapitalappreciationoftheAPA’ssecurityprice,adjustedforcapitalmanagementactions(suchassecuritysplitsandconsolidations)andassumingreinvestmentofdistributionsatthedeclareddistributionratepersecurity.FiguresquotedaresourcedfromIRESSandmeasuredasat30June2015.
For
per
sona
l use
onl
y

2 APA Group | Annual Report 2015
AUSTRALIAN PIPELINE TRUST AND ITS CONTROLLED ENTITIES
DIRECTORS’ REPORT CONTINUED
1.2 APAobjectivesandstrategiesAPA’sobjectivestoprovidesecureandpredictablereturntoitsinvestorsissupportedbyitsstrategiesof:
— continuingtogrowourownershipinterestsintransmissionpipelinesthroughfurtherexpandingtheEastandWestCoastGrids;
— growingotherenergyinfrastructuremidstreamassets;
— leveragingAPA’sassetmanagement,developmentandoperationalcapabilities;
— providingasafe,stimulatingandrewardingworkplace;
— deliveringresponsiveandvaluablesolutionstocustomers;
— continuingtodeliveranenvironmentallyresponsible,safeandessentialservice;
— contributingtothecommunitiesAPAserves;and
— maintainingAPA’sfinancialstrength,flexibilityandcapability.
Thisstrategyhasremainedrelativelyunchangedsincelisting.
1.3 APAassetsandoperationsAPAisamajorparticipantindeveloping,owningandoperatingnaturalgastransportationinfrastructureacrossAustralia.
APA’sassetsandoperationsarereportedinthreeprincipalbusinesssegments:
— EnergyInfrastructure,whichincludesallAPA’swhollyormajorityownedpipelines,gasstorageassets,gascompressionassetsandtheEmuDownswindfarm;
— AssetManagement,whichprovidescommercial,operatingservicesand/orassetmaintenanceservicestoitsenergyinvestmentsforappropriatefees;and
— EnergyInvestments,whichincludesAPA’sstrategicstakesinanumberofinvestmentvehiclesthathouseenergyinfrastructureassets,generallycharacterisedbylong-termsecurecashflows,withlowongoingcapitalexpenditurerequirements.
APA GROUP ASSETS AND OPERATIONS
WESTERNAUSTRALIA
NORTHERNTERRITORY
QUEENSLAND
SOUTHAUSTRALIA NEW
SOUTHWALES
VICTORIA
TASMANIA
Wind Farm
Gas Storage Facility
Gas Processing Plant
Gas Power Station
APA Group Assets
APA Group Investments
Assets Managed(Not Owned By APA)
2313
14
17
19
18
2016
15
23
12
27
26
23
2
4 3
1
6
24
25
23
22
11
9
10
78
23
23
21
23
5 27
27
27
27
For
per
sona
l use
onl
y
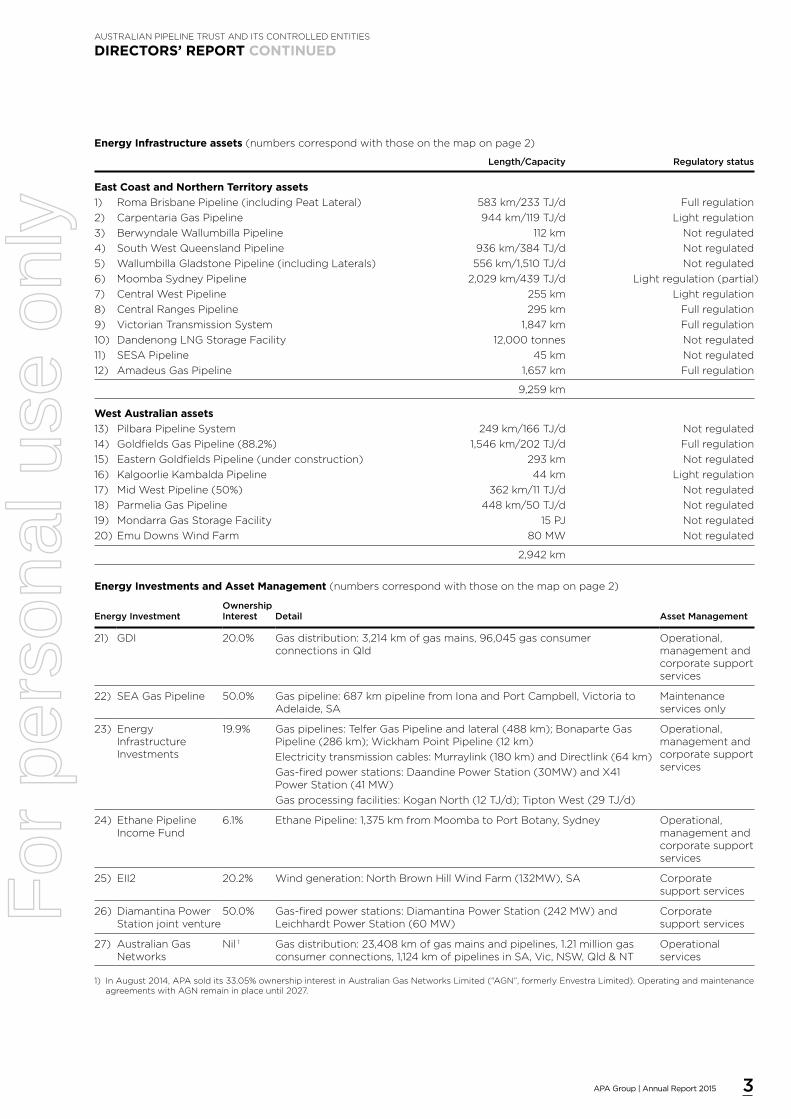
3APA Group | Annual Report 2015
AUSTRALIAN PIPELINE TRUST AND ITS CONTROLLED ENTITIES
DIRECTORS’ REPORT CONTINUED
Energy Infrastructure assets (numberscorrespondwiththoseonthemaponpage2)
Length/Capacity Regulatorystatus
East Coast and Northern Territory assets
1) RomaBrisbanePipeline(includingPeatLateral) 583km/233TJ/d Fullregulation
2) CarpentariaGasPipeline 944km/119TJ/d Lightregulation
3) BerwyndaleWallumbillaPipeline 112km Notregulated
4) SouthWestQueenslandPipeline 936km/384TJ/d Notregulated
5) WallumbillaGladstonePipeline(includingLaterals) 556km/1,510TJ/d Notregulated
6) MoombaSydneyPipeline 2,029km/439TJ/d Lightregulation(partial)
7) CentralWestPipeline 255km Lightregulation
8) CentralRangesPipeline 295km Fullregulation
9) VictorianTransmissionSystem 1,847km Fullregulation
10) DandenongLNGStorageFacility 12,000tonnes Notregulated
11) SESAPipeline 45km Notregulated
12) AmadeusGasPipeline 1,657km Fullregulation
9,259km
West Australian assets
13) PilbaraPipelineSystem 249km/166TJ/d Notregulated
14) GoldfieldsGasPipeline(88.2%) 1,546km/202TJ/d Fullregulation
15) EasternGoldfieldsPipeline(underconstruction) 293km Notregulated
16) KalgoorlieKambaldaPipeline 44km Lightregulation
17) MidWestPipeline(50%) 362km/11TJ/d Notregulated
18) ParmeliaGasPipeline 448km/50TJ/d Notregulated
19) MondarraGasStorageFacility 15PJ Notregulated
20)EmuDownsWindFarm 80MW Notregulated
2,942km
Energy Investments and Asset Management (numberscorrespondwiththoseonthemaponpage2)
EnergyInvestmentOwnershipInterest Detail AssetManagement
21) GDI 20.0% Gasdistribution:3,214kmofgasmains,96,045gasconsumerconnectionsinQld
Operational,managementandcorporatesupportservices
22) SEAGasPipeline 50.0% Gaspipeline:687kmpipelinefromIonaandPortCampbell,VictoriatoAdelaide,SA
Maintenanceservicesonly
23) EnergyInfrastructureInvestments
19.9% Gaspipelines:TelferGasPipelineandlateral(488km);BonaparteGasPipeline(286km);WickhamPointPipeline(12km)
Electricitytransmissioncables:Murraylink(180km)andDirectlink(64km)
Gas-firedpowerstations:DaandinePowerStation(30MW)andX41PowerStation(41MW)
Gasprocessingfacilities:KoganNorth(12TJ/d);TiptonWest(29TJ/d)
Operational,managementandcorporatesupportservices
24) EthanePipelineIncomeFund
6.1% EthanePipeline:1,375kmfromMoombatoPortBotany,Sydney Operational,managementandcorporatesupportservices
25) EII2 20.2% Windgeneration:NorthBrownHillWindFarm(132MW),SA Corporatesupportservices
26) DiamantinaPowerStationjointventure
50.0% Gas-firedpowerstations:DiamantinaPowerStation(242MW)andLeichhardtPowerStation(60MW)
Corporatesupportservices
27) AustralianGasNetworks
Nil1 Gasdistribution:23,408kmofgasmainsandpipelines,1.21milliongasconsumerconnections,1,124kmofpipelinesinSA,Vic,NSW,Qld&NT
Operationalservices
1) InAugust2014,APAsoldits33.05%ownershipinterestinAustralianGasNetworksLimited(“AGN”,formerlyEnvestraLimited).OperatingandmaintenanceagreementswithAGNremaininplaceuntil2027.
For
per
sona
l use
onl
y

4 APA Group | Annual Report 2015
AUSTRALIAN PIPELINE TRUST AND ITS CONTROLLED ENTITIES
DIRECTORS’ REPORT CONTINUED
2. Financial highlights
Profitaftertaxandnon-controllinginterests,earningsbeforeinterestandtax(“EBIT”)andEBITbeforedepreciationandamortisation(“EBITDA”)excludingsignificantitemsarefinancialmeasuresnotprescribedbyAustralianAccountingStandards(“AIFRS”)andrepresenttheprofitunderAIFRSadjustedforspecificsignificantitems.TheDirectorsconsiderthesemeasurestoreflectthecoreearningsoftheConsolidatedEntity,andthesearethereforedescribedinthisreportas‘normalised’measures.
APAreportedprofitaftertaxandnon-controlling interestsandincludingsignificant itemsof$559.9million,an increaseof62.9%comparedwith$343.7millionreportedinthelastfinancialyear.APA’sFY2015profitincludesaftertaxsignificantitemsof$356.0millionrelatingtoaftertaxprofitonthesaleofAPA’sshareholdinginAustralianGasNetworksLimited(formerlyEnvestraLimited)andtherecoveryduringtheperiodoffeespaidbyHastingsDiversifiedUtilitiesFundtoHastingsFundsManagement.Thisyear’sprofitiscomparedwithprofitinFY2014whichincludedaone-offadjustmenttothetaxexpenseforthefinancialyeartoreflectachangeinthetreatment,fortaxdepreciationpurposesonly,ofvariouscapitalassetsacquiredin2006(totalling$144.1million).
Normalisedprofitaftertaxandnon-controllinginterests(thatis,excludingsignificantitems)increasedby2.1%to$203.9million(2014:$199.6million).
Revenue(excludingpass-throughrevenue)increasedby$126.7millionto$1,119.2million,anincreaseof12.8%onthelastfinancialyear(2014:$992.5million).StatutoryEBITDAof$1,269.5millionwas$522.2millionabovelastfinancialyear(2014:$747.3million)andnormalisedEBITDAof$822.3millionwas$74.9millionor10.0%abovelastfinancialyear(2014:$747.3million).NormalisedEBITDAat$822.3millionisinlinewithAPA’sguidanceforFY2015of$810millionto$825million.
StrongerearningsacrossmostofAPA’sassetscontributedtotheincreaseinnormalisedprofitandEBITDAandincludedthefollowing:
— additionalearningsfromtheexpandedSouthWestQueenslandPipelineandtheGoldfieldsGasPipeline;
— organicgrowthacrossmostofourassetsincludingthePilbaraPipelineSystem,MondarraGasStorageFacility,RomaBrisbanePipelineandAmadeusGasPipeline;and
— fourweeksofEBITDAcontributionfromthenewlyacquiredWallumbillaGladstonePipeline.
TheseincreaseswerepartiallyoffsetbyareductioninearningsfromAssetManagement,givenabnormallyhigh,one-offcustomercontributionsinFY2014of$23.4million(2015:$3.6million).
Operatingcashflowincreasedby30.3%to$562.2million(2014:$431.5million),andoperatingcashflowpersecurityincreasedby13.5%,or6.7cents,to56.5centspersecurity(2014:49.8centspersecurity).
Operatingcashflowwasimpactedbytheone-offreceiptof$17.2millionduringthefinancialyearrelatingtoAPA’ssuccessfulappealtotheNSWSupremeCourtinamatterregardingfeespaidbyHastingsDiversifiedUtilitiesFundtoHastingsFundsManagementLimited.Thispartiallyreversespaymentsof$8.3millionmadeinFY2014and$68.8millioninFY2013.
Excludingthesesignificant items,normalisedoperatingcashflowwasupby23.9%to$545.0million(2014:$439.7million)andcorrespondingoperatingcashflowpersecuritywasupby7.9%,or4.0cents,to54.8centspersecurity(2014:50.8cents).Thisincreaseisdespitea14.9%increaseintheaveragenumberofsecuritiesonissuethisfinancialyearto995,244,990securities(2014:865,977,265securities).
APA’sdistributionsforthefinancialyeartotalled38.0centspersecurity,anincreaseof4.8%,or1.75cents,overthelastfinancialyear(2014:36.25cents),andwasinlinewithguidanceofatleast36centspersecurity.Thedistributionpayoutratioof68.8%basedonnormalisedoperatingcashflowwasslightlylowerthanthe68.9%ratiolastfinancialyear.APAcontinuestofullyfunditsdistributionsoutofoperatingcashflowswhilstalsoretainingappropriatelevelsofcashinthebusinesstosupportongoinggrowth.
ThetableonthefollowingpageprovidesasummaryofkeyfinancialdataforthefinancialyearandincludeskeyreconcilingitemsbetweenstatutoryprofitaftertaxattributabletoAPAsecurityholdersandthenormalisedfinancialmeasures.
For
per
sona
l use
onl
y

5APA Group | Annual Report 2015
AU
ST
RA
LIA
NP
IPE
LIN
ET
RU
ST
AN
DIT
SC
ON
TR
OL
LE
DE
NT
ITIE
S
DIR
EC
TO
RS
’ R
EP
OR
T C
ON
TIN
UE
D
3
0J
un
e2
015
3
0 J
un
e 2
014
C
han
ges
in
Ch
an
ges
in
($
00
0)
($0
00
)S
tatu
tory
acco
un
ts
No
rmalise
da
cco
un
ts
Sig
nifi
can
t
Sig
nifi
can
tYear
en
ded
30
Ju
ne
Sta
tuto
ry
item
s2
No
rmalise
d
Sta
tuto
ry
item
s 2
No
rmalis
ed
$
00
0
%
$0
00
%
Tota
lrev
en
ue
1,5
53
,615
–
1,5
53
,615
1,3
95,9
92
–
1,39
5,9
92
157,
623
11.3
%
157,
623
11.3
%
Pass
-th
rou
gh
rev
en
ue
1
43
4,3
82
–
43
4,3
82
4
03,4
77
–
40
3,4
77
30
,90
5
7.7%
30
,90
5
7.7%
Tota
l re
ven
ue
exc
lud
ing
pass
-th
rou
gh
1,
119
,23
3
– 1,
119
,23
3
99
2,5
15
–
99
2,5
15
126
,718
12
.8%
12
6,7
18
12.8
%
EB
ITD
A
1,2
69
,49
0
44
7,24
0
82
2,2
50
74
7,334
–
74
7,334
522,15
6
69
.9%
74
,916
10
.0%
Dep
recia
tio
na
nd
am
ort
isat
ion
exp
en
se
(20
8,2
00
) –
(20
8,2
00
) (1
56
,228
)–
(1
56
,228
)(5
1,972)
(33.3
%)
(51,9
72)
(33.3
%)
EB
IT
1,0
61,
29
0
44
7,24
0
614
,05
0
59
1,10
6
–
59
1,10
6
470
,184
79
.5%
22,9
44
3.9
%
Fin
an
cec
ost
san
din
tere
stin
com
e
(324
,16
2)
– (3
24
,16
2)
(325,0
84
)–
(3
25,0
84
)9
22
0.3
%
922
0.3
%
Pro
fit
befo
rein
com
et
axa
nd
n
on
-co
ntr
olli
ng
inte
rest
s737,
128
4
47,
24
0
28
9,8
88
26
6,0
22
–
26
6,0
22
471,1
06
17
7.1%
23,8
66
9
.0%
Inco
met
ax(
exp
en
se)/
ben
efi
t(1
77,
198
) (9
1,2
22
) (8
5,9
76
) 77,
68
4
144
,06
0
(66
,376
)–
328
.1%
–
(29
.5%
)
No
n-c
on
tro
llin
gin
tere
sts
(1)
– (1
) (1
)–
(1
)–
0
.0%
–
0
.0%
Pro
fit
aft
er
inco
me
tax
an
d
no
n-c
on
tro
llin
g in
tere
sts
55
9,9
29
3
56
,018
2
03
,911
34
3,7
05
144
,06
0
199
,64
5
216
,224
6
2.9
%
4,2
66
2.1%
Op
era
tin
gc
ash
flo
w3
56
2,1
90
17
,20
1 5
44
,98
9
431,5
41
(8,2
01)
4
39
,74
2
130
,64
9
30
.3%
10
5,2
47
23.9
%
Op
era
tin
gc
ash
flo
wp
er
secu
rity
(ce
nts
)4
56
.5
5
4.8
4
9.8
50
.8
6.7
13
.5%
4
.0
7.9
%
Earn
ing
sp
er
secu
rity
(ce
nts
)4
56
.3
2
0.5
39
.7
23.1
16.6
4
1.8%
(2
.6)
(11.3
%)
Dis
trib
uti
on
per
secu
rity
(ce
nts
)3
8.0
38
.0
36
.25
36
.25
1.75
4.8
%
1.75
4.8
%
Dis
trib
uti
on
pay
ou
tra
tio
5
66
.6%
68
.8%
70
.2%
68
.9%
(3
.6%
)(5
.1%)
(0.1%
)(0
.2%
)
Weig
hte
da
vera
gen
um
ber
of
secu
riti
es
(00
0)
99
5,2
45
99
5,2
45
8
65,9
77
8
65,9
77
129
,26
8
14.9
%
129
,26
8
14.9
%
No
tes:
Nu
mb
ers
int
het
ab
lem
ayn
ot
ad
du
pd
uet
or
ou
nd
ing
.
1)P
ass
-th
rou
gh
reven
ueis
reven
ueo
nw
hic
hn
om
arg
inis
earn
ed
.Pass
-th
rou
gh
reven
uea
rise
sin
th
ea
sset
man
ag
em
en
to
pera
tio
ns
inr
esp
ect
of
co
sts
incu
rred
in,a
nd
pass
ed
on
to
Au
stra
lian
Gas
Netw
ork
sL
imit
ed
(“A
GN
”,
form
erl
yE
nvest
raL
imit
ed
)an
dG
DIin
resp
ect
of,
theo
pera
tio
no
fth
eA
GN
an
dG
DIass
ets
resp
ecti
vely
.
2)
Sig
nifi
can
tit
em
s:2
015
rela
tes
ton
et
pro
ceed
sre
alis
ed
fro
mt
hes
ale
of
APA
’sinvest
men
tin
AG
Na
sw
ell
as
success
fulre
covery
of
fees
paid
byH
ast
ing
sD
ivers
ified
Uti
litie
sF
un
dt
oH
ast
ing
sF
un
ds
Man
ag
em
en
tL
imit
ed
.20
14r
ela
tes
toa
on
e-o
ffa
dju
stm
en
tto
APA
’st
axe
xp
en
sef
or
thefi
nan
cia
lyear
tor
efl
ect
ac
han
gein
th
et
reatm
en
t,f
or
taxd
ep
recia
tio
np
urp
ose
so
nly
,of
vari
ou
scap
itala
ssets
.
3)
Op
era
tin
gc
ash
flo
w=
net
cash
fro
mo
pera
tio
ns
aft
er
inte
rest
an
dt
axp
aym
en
ts.
4)
Betw
een
23D
ecem
ber
20
14a
nd
28
Jan
uary
20
15,A
PA
issu
ed
at
ota
lof278
,556
,56
2n
ew
ord
inary
secu
riti
es,
resu
ltin
gin
to
tals
ecu
riti
es
on
issu
ea
sat
30
June2
015
of1,1
14,3
07,
36
9.T
heis
suew
as
off
ere
da
t$
6.6
0p
er
securi
ty,
ad
isco
un
tto
APA
’sc
losi
ng
mark
et
pri
ceo
f$
7.6
7p
er
securi
tyo
n9
Decem
ber
20
14,t
hela
stt
rad
ing
dayb
efo
ret
her
eco
rdd
ate
of
thee
nti
tlem
en
to
ffer
of
15D
ecem
ber
20
14.T
hew
eig
hte
da
vera
gen
um
ber
of
secu
riti
es
for
thec
urr
en
tan
dp
rio
rp
eri
od
has
been
ad
just
ed
ina
cco
rdan
cew
ith
th
ea
cco
un
tin
gp
rin
cip
les
of
AA
SB
133:E
arn
ing
sp
er
Sh
are
,fo
rth
ed
isco
un
ted
rig
hts
issu
e.
5)
Dis
trib
uti
on
payo
ut
rati
o=
to
tald
istr
ibu
tio
np
aym
en
tsa
sap
erc
en
tag
eo
fn
orm
alis
ed
op
era
tin
gc
ash
flo
w.
For
per
sona
l use
onl
y

6 APA Group | Annual Report 2015
AUSTRALIAN PIPELINE TRUST AND ITS CONTROLLED ENTITIES
DIRECTORS’ REPORT CONTINUED
3. Business segment performances and operational review
StatutoryreportedrevenueandEBITDAperformanceofAPA’sbusinesssegmentsissetoutinthetablebelow.
Changes
2015 2014 Yearended30June $000 $000 $000 %
Revenue (continuing businesses)
EnergyInfrastructure
EastCoastGrid:Queensland1 388,916 271,746 117,170 43.1%
EastCoastGrid:NewSouthWales 137,998 133,555 4,443 3.3%
EastCoastGrid:Victoria 163,592 153,668 9,924 6.5%
EastCoastGrid:SouthAustralia 2,725 2,686 39 1.5%
NorthernTerritory 27,877 24,848 3,029 12.2%
WesternAustralia 265,972 237,566 28,406 12.0%
Energy Infrastructure total 987,080 824,069 163,011 19.8%
AssetManagement 85,056 99,171 (14,115) (14.2%)
EnergyInvestments 21,784 18,020 3,764 20.9%
Total segment revenue 1,093,920 941,260 152,660 16.2%
Pass-throughrevenue 434,382 403,477 30,905 7.7%
Unallocatedrevenue(interestincome)2 24,322 1,142 23,180 2,029.8%
Divestedbusiness3 991 50,113 (49,122) (98.0%)
Total revenue 1,553,615 1,395,992 157,623 11.3%
EBITDA (continuing businesses)
EnergyInfrastructure
EastCoastGrid:Queensland1 340,131 234,459 105,672 45.1%
EastCoastGrid:NewSouthWales 120,808 115,569 5,239 4.5%
EastCoastGrid:Victoria 130,170 127,616 2,554 2.0%
EastCoastGrid:SouthAustralia 1,940 2,380 (440) (18.5%)
NorthernTerritory 17,954 15,214 2,740 18.0%
WesternAustralia 212,604 188,947 23,657 12.5%
Energy Infrastructure total 823,607 684,185 139,422 20.4%
AssetManagement 49,448 67,552 (18,104) (26.8%)
EnergyInvestments 21,783 18,020 3,763 20.9%
Corporatecosts (73,579) (72,536) (1,043) (1.4%)
Total segment EBITDA 821,259 697,221 124,038 17.8%
Divestedbusiness3 991 50,113 (49,122) (98.0%)
Total EBITDA before significant items 822,250 747,334 74,916 10.0%
Significantitems4 447,240 – 447,240 n/a
Total EBITDA 1,269,490 747,334 522,156 69.9%
Notes:Numbersinthetablemaynotaddupduetorounding.Fromthisreportingperiod,APAwillreportitssegmentEBITDAexclusiveofcorporatecosts.FY2014segmentEBITDAhasbeenrestatedtoalignwithFY2015reporting.
1) IncludestheWallumbillaGladstonePipelinerevenueandEBITDAcontributionsfrom4June2015.
2)InterestincomeisnotincludedincalculationofEBITDA,butnetsoffagainstinterestexpenseincalculatingnetinterestcost.
3)InvestmentinAustralianGasNetworksLimited(“AGN”,formerlyEnvestraLimited)soldinAugust2014.
4)Significantitems:2015relatetonetproceedsrealisedfromthesaleofAPA’sinvestmentinAGNaswellassuccessfulrecoveryoffeespaidbyHastingsDiversifiedUtilitiesFundtoHastingsFundsManagementLimited.2014relatestoaone-offadjustmenttoAPA’staxexpenseforthefinancialyeartoreflectachangeinthetreatment,fortaxdepreciationpurposesonly,ofvariouscapitalassets.
APA’soperationsandfinancialperformanceduringthefinancialyearprincipallyreflectongoinggrowthinoperationalperformanceofAPA’sasset,additionalrevenuefromexpansionprojectsthathavebeencommissionedduringtheyearandfourweeksofearningsfromthenewlyacquiredWallumbillaGladstonePipeline,partiallyoffsetbyadecreaseinEBITDAfromAssetManagementduetolowercustomercontributions.
EBITDAinAPA’scontinuingbusinesses,whichexcludesAustralianGasNetworksLimited(formerlyEnvestraLimited)thatwasdivestedinAugust2014,increasedby$124.0million,or17.8%,to$821.3million,inlinewithAPA’sguidanceforFY2015of$810millionto$825million.
APAderivesitsrevenuethroughamixofregulatedrevenue,long-termnegotiatedrevenuecontracts,assetmanagementfeesandinvestmentearnings.Earningsareunderpinnedbystrongcashflowsgeneratedfromhighquality,geographicallydiversifiedassetsandaportfolioofhighlycreditworthycustomers.
For
per
sona
l use
onl
y

7APA Group | Annual Report 2015
AUSTRALIAN PIPELINE TRUST AND ITS CONTROLLED ENTITIES
DIRECTORS’ REPORT CONTINUED
Anationalregulatoryregimeprovidesmechanismsforregulatorypricingamongstotherthings,andisencapsulatedintheNationalGasLawandNationalGasRules.TheeconomicregulationaspectsoftheregimeapplytomostgasdistributionnetworksandanumberofgastransmissionpipelinesinAustralia.
Theregimeprovidesfortwoformsofregulationbasedonapipeline’srelativemarketpower–fullregulationandlightregulation.Forassetsunderfullregulation,theregulatorapprovespriceandothertermsofaccessforstandard(“reference”)servicesaspartofanaccessarrangementprocess,suchthattheassetownerhasareasonableopportunitytorecoveratleasttheefficientcostsofowningandoperatingtheassettoprovidethereferenceservices.Accessarrangementperiodsusuallyrunforfiveyears.Forassetsunderlightregulation,contractualterms(includingprice)arenegotiatedbetweentheserviceproviderandcustomerwithrecoursetoarbitrationbytheregulatorintheabsenceofagreement.APAassetssubjecttofullregulationorlightregulationaredetailedonthemapbelowandinthetableonpage3.
Contractedrevenuesaresourcedfromunregulatedassetsandassetsunderlightregulationaswellasassetsunderfullregulation.Contractsgenerallyentitlecustomerstocapacityreservation,withthemajorityoftherevenuefixedoverthetermoftherelevantcontract.APA’scurrentweightedaveragecontracttermisapproximately10years,andwherenewinfrastructureisrequired,termstendtobelongerthanthiscurrentaverageinordertounderwritetheinvestmentbyAPAinanynecessaryexpansion.
DuringFY2015,approximately21%ofrevenue(excludingpass-through)wassubjecttopricesdeterminedunderfullregulation,49%ofrevenue(excludingpass-through)wasfromcapacityreservationcharges,12%fromstorageandothercontractedrevenuesand15%fromthroughputcharges.Giventhedynamiceastcoastgasmarket,therewereadditionalrevenuesfromprovisionofflexibleshorttermservices,accountingfor2.2%ofFY2015revenue($21.4million)forEnergyInfrastructure.
APAcontinuestofocusontheoperation,developmentandenhancementofourgastransmissionanddistributionassets,andenergyinvestmentsacrossmainlandAustralia.
FY2015 REVENUES BY CONTRACT TYPE APA 1 PIPELINES BY REGULATION TYPE
Regulated revenue: 21%
Capacity charge revenue: 49%
Storage & other contracted revenue: 12%
Throughput charge &other variable revenue: 15%
Flexible short term services: 2.2%
Other: 0.8%
Full regulation pipelines
Light regulation pipelines
Not regulated pipelines
1) Owned and/or operated by APA
3.1 EnergyInfrastructureTheEnergyInfrastructuresegmentincludesgastransmission,gascompressionandstorageassetsandtheEmuDownswindfarm.Revenuefromtheseassetsisderivedfromeitherregulatoryarrangementsorcapacity-basedcontracts.Regulatoryarrangementsonmajorassetsarereviewedeveryfiveyears.Currently,in-placecontractshaveaweightedaveragetermofapproximately10years.
TheEnergyInfrastructuresegmentcontributed90.2%ofrevenue(forcontinuingbusinesses,excludingpass-through)and92%ofEBITDA(forcontinuingbusinesses,beforecorporatecosts)duringFY2015.Revenue(excludingpass-throughrevenue)was$987.1million,anincreaseof19.8%onthelastfinancialyear(2014:$824.1million).EBITDA(forcontinuingbusinesses,beforecorporatecosts)increasedby20.4%onthelastfinancialyearto$823.6million(2014:$684.2million).
Commissioningofvariousexpansionprojectsandnewhaulagecontractsacrossmultipleassets,includingSouthWestQueenslandPipelineandGoldfieldsGasPipeline,aswellasorganicgrowthfromthemajorityofAPA’sassets,asdetailedinsubsectionsbelow,contributedtothisresult.
ENERGY INFRASTRUCTURE REVENUE BY STATE ENERGY INFRASTRUCTURE EBITDA BY STATE
A$1,200m
800
1,000
600
400
200
FY11
QLD
FY12 FY13 FY14 FY15
0
82%
80%
78%
NSW VIC SA NT WA EBITDA margin(RHS)
A$1,000m
600
800
400
200
FY11
QLD
FY12 FY13 FY14 FY15
0
NSW VIC SA NT WA
For
per
sona
l use
onl
y
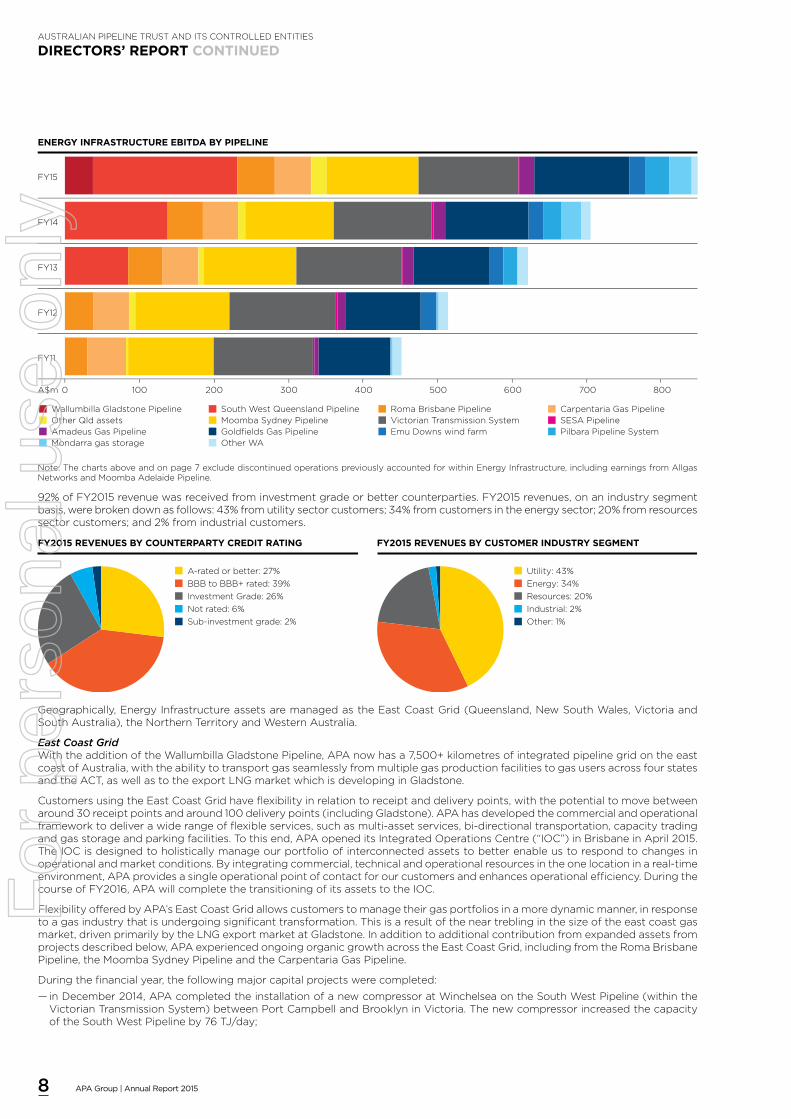
8 APA Group | Annual Report 2015
AUSTRALIAN PIPELINE TRUST AND ITS CONTROLLED ENTITIES
DIRECTORS’ REPORT CONTINUED
ENERGY INFRASTRUCTURE EBITDA BY PIPELINE
FY15
FY14
FY13
FY12
FY11
0A$m 100 200 300 400 500 600 700 800
Wallumbilla Gladstone Pipeline South West Queensland Pipeline Roma Brisbane Pipeline Carpentaria Gas PipelineOther Qld assets Moomba Sydney Pipeline Victorian Transmission System SESA PipelineAmadeus Gas Pipeline Goldfields Gas Pipeline Emu Downs wind farm Pilbara Pipeline SystemMondarra gas storage Other WA
Note:Thechartsaboveandonpage7excludediscontinuedoperationspreviouslyaccountedforwithinEnergyInfrastructure,includingearningsfromAllgasNetworksandMoombaAdelaidePipeline.
92%ofFY2015revenuewasreceivedfrominvestmentgradeorbettercounterparties.FY2015revenues,onanindustrysegmentbasis,werebrokendownasfollows:43%fromutilitysectorcustomers;34%fromcustomersintheenergysector;20%fromresourcessectorcustomers;and2%fromindustrialcustomers.
FY2015 REVENUES BY COUNTERPARTY CREDIT RATING FY2015 REVENUES BY CUSTOMER INDUSTRY SEGMENT
A-rated or better: 27%
BBB to BBB+ rated: 39%
Investment Grade: 26%
Not rated: 6%
Sub-investment grade: 2%
Utility: 43%
Energy: 34%
Resources: 20%
Industrial: 2%
Other: 1%
Geographically,EnergyInfrastructureassetsaremanagedastheEastCoastGrid(Queensland,NewSouthWales,VictoriaandSouthAustralia),theNorthernTerritoryandWesternAustralia.
East Coast GridWiththeadditionoftheWallumbillaGladstonePipeline,APAnowhasa7,500+kilometresofintegratedpipelinegridontheeastcoastofAustralia,withtheabilitytotransportgasseamlesslyfrommultiplegasproductionfacilitiestogasusersacrossfourstatesandtheACT,aswellastotheexportLNGmarketwhichisdevelopinginGladstone.
CustomersusingtheEastCoastGridhaveflexibilityinrelationtoreceiptanddeliverypoints,withthepotentialtomovebetweenaround30receiptpointsandaround100deliverypoints(includingGladstone).APAhasdevelopedthecommercialandoperationalframeworktodeliverawiderangeofflexibleservices,suchasmulti-assetservices,bi-directionaltransportation,capacitytradingandgasstorageandparkingfacilities.Tothisend,APAopeneditsIntegratedOperationsCentre(“IOC”)inBrisbaneinApril2015.TheIOCisdesignedtoholisticallymanageourportfolioofinterconnectedassetstobetterenableustorespondtochangesinoperationalandmarketconditions.Byintegratingcommercial,technicalandoperationalresourcesintheonelocationinareal-timeenvironment,APAprovidesasingleoperationalpointofcontactforourcustomersandenhancesoperationalefficiency.DuringthecourseofFY2016,APAwillcompletethetransitioningofitsassetstotheIOC.
FlexibilityofferedbyAPA’sEastCoastGridallowscustomerstomanagetheirgasportfoliosinamoredynamicmanner,inresponsetoagasindustrythatisundergoingsignificanttransformation.Thisisaresultoftheneartreblinginthesizeoftheeastcoastgasmarket,drivenprimarilybytheLNGexportmarketatGladstone.Inadditiontoadditionalcontributionfromexpandedassetsfromprojectsdescribedbelow,APAexperiencedongoingorganicgrowthacrosstheEastCoastGrid,includingfromtheRomaBrisbanePipeline,theMoombaSydneyPipelineandtheCarpentariaGasPipeline.
Duringthefinancialyear,thefollowingmajorcapitalprojectswerecompleted:
— inDecember2014,APAcompletedtheinstallationofanewcompressoratWinchelseaontheSouthWestPipeline(withintheVictorianTransmissionSystem)betweenPortCampbellandBrooklyninVictoria.ThenewcompressorincreasedthecapacityoftheSouthWestPipelineby76TJ/day;
For
per
sona
l use
onl
y

9APA Group | Annual Report 2015
AUSTRALIAN PIPELINE TRUST AND ITS CONTROLLED ENTITIES
DIRECTORS’ REPORT CONTINUED
— inMay2015,APAcompletedafurtherexpansionoftheVictoria–NewSouthWalesInterconnect(“VNI”)toincreasethefirmpeakwintergasflowsfromVictoriaintoNewSouthWalesby145%,atatotalcostofapproximately$160million.NewgastransportationagreementswithOriginEnergy,EnergyAustraliaandLumoEnergycommencedduringtheyeargivencompletionoftheexpansionprojectsthatinvolvedaugmentingadditionalcompressioncapacityatCulcairn,aswellasadditionallooping.AfourthagreementwithanexistingcustomerwasannouncedinJuly2015.ThiswillsupportfurtherexpansionoftheVNIby30TJ/dayto146TJ/dayintotal,treblingcapacityoveraperiodofnearlythreeyearsinresponsetochangesintheeastcoastgasmarket;and
— inJanuary2015,theSouthWestQueenslandPipelineexpansionprojectswerecompletedandcommissioned.Theseprojectsinvolved$325millionofexpansionsthatwereunderpinnedbyvariouslongtermcontractswithhighlycreditworthycounterparties.TheSouthWestQueenslandPipelinehasundergoneamajorcapacityexpansionthroughaugmentationofcompressionfacilitiesatWallumbillaandMoombaandpipelinebi-directionalcapability.
APAcompletedtheacquisitionoftheWallumbillaGladstonePipelineon3June2015andthepipelinecontributed$35millionofEBITDAduringthefinancialyear.WhilsttheQueenslandCurtisLNGProjectitselfisexpectedtoberampingupitsproductionforitssecondtrainduringFY2016,APA’scontractsonthepipelinearefulltake-or-paycontractsfor20years(withtwo10-yearoptionstoextend),regardlessofvolumetransportedforthefoundationshippers,withtariffsescalatingannuallyatUSCPI1.TheexpectedEBITDAcontributionofthesecontractsinthefirstfullfinancialyearto30June2016isUS$355million.USdollardenominateddebtwasraisedtoassistinthefinancingoftheacquisition.ThenetUSDcashflowsafterservicingtheUSDdenominateddebtfacilitieswillultimatelybeconvertedtoAUD,inlinewithAPA’sTreasuryRiskManagementPolicy.MoredetailsonAPA’sguidanceforFY2016canbefoundonpage16anditspolicyformanagingforeignexchangecanbefoundinNote21tothefinancialstatements.
AgainstthebackdropofaverydynamicgasmarketinthesoutheastofAustralia,APAcontinuestoadaptandprogressivelydevelopitsgasinfrastructureandservicesinresponsetothechangingneedsofitscustomers.
Northern TerritoryAPA’sassetsintheNorthernTerritorycontinuedtoperformatoraboveexpectationsduringtheyearincludingcommencementofanewlongtermagreementtodelivernaturalgastotheAustralianAgriculturalCompanymeatprocessingfacilitynearDarwinviatheAmadeusGasPipeline.
Inearly2014,APAcommencedafeasibilitystudytolinkitspipelineinfrastructureintheNorthernTerritorywithitsEastCoastGrid.Theproposedpipelinelink(the“NTLink”)willcreatetheopportunityforgassourcedfromonshoreandoffshorefieldsintheNorthernTerritorytosupplymarketsintheeast,andprovideadditionalgassecurityfortheNorthernTerritory.
TheNTLink,ifbuilt,willconnectAPA’sAmadeusGasPipelineintheNorthernTerritorywiththeAPAownedEastCoastGrid.APAexpectsthiswillprovideadditionalflexibilitytosuppliersandusersofgasintheNorthernTerritoryandtheeasternstatesofAustralia,byinterconnectingmoreresourceswithmoremarkets.
DuringFY2015,theNorthernTerritoryGovernmentannounceditsownprocess(NorthEastGasInterconnectoror“NEGI”)aroundconnectingtotheeastcoastandshortlistedfourbidders,includingAPA.APAcontinuestoworkonitsfinalsubmissionaspartofthegovernment’sprocesswhichisdueinSeptember2015andfurtherworkalsocontinuesinrespectofAPA’sfeasibilityprocessoutsideoftheNorthernTerritoryGovernmentprocess.
Western Australia – West Coast GridInWesternAustralia,APA’sassetsserveavarietyofcustomersintheresources,industrialandutility(mainlyinthePertharea)sectors.TheGoldfieldsGasPipeline(“GGP”)andPilbaraPipelineSystembothexperiencedstrongorganicgrowthfromresourcesectorcustomersinFY2015.IntheenergyprecinctthatisdevelopingaroundthePertharea,theMondarraGasStorageFacilitysawsolidorganicgrowth.
TheGGPexpansionprojectwascompletedduringtheyear.FY2015resultswerepositivelyaffectedbythenearfullyearcontributionfromthisexpansion.APAmanagedthe$150millionexpansionprojectonbehalfoftheGoldfieldsGasTransmissionJointVenture(“GGTJV”)throughwhichAPAowns88.2%oftheGGP.ContractswithRioTintoandMountNewmanJointVenture(85%ownedbyBHP),thatsupportedtheexpansion,wereenteredintoduringFY2012.
Duringthefinancialyear,APAcommencedconstructionofthenew293kilometreEasternGoldfieldsPipeline(“EGP”).ThisprojectisunderwrittenbytwogastransportationagreementsexecutedbetweenAngloGoldAshanti(“Anglogold”)andAPAinJuly2014forthetransportationofnaturalgastoAngloGold’sSunriseDamOperationsandtheTropicanaOperationsjointlyownedbyAngloGoldandIndependenceGroupNL,locatedintheeasternGoldfieldsregion.TheEGPwillconnectAPA’sexistinginfrastructure,theGoldfieldsGasPipelineandtheMurrinMurrinLateraltotherespectiveminesitelocations,withcommissioningexpectedaroundthemiddleofFY2016.Undertheagreements,APAwilltransportgasacrossatotaldistanceof1,500kilometrestotheminesthroughAPA’sthreeinterconnectedpipelines.
3.2 AssetManagementAPAprovidesassetmanagementandoperationalservicestothemajorityofitsenergyinvestmentsandtoanumberofthirdparties.ItsmaincustomersareAustralianGasNetworksLimited(“AGN”,formerlyEnvestraLimited),EthanePipelineIncomeFund,EnergyInfrastructureInvestmentsandGDI.Assetmanagementservicesareprovidedtothesecustomersunderlongtermcontracts.
Revenue(excludingpass-throughrevenue)fromassetmanagementservicesdecreasedby$14.1millionor14.2%to$85.1million(2014:$99.2million)andEBITDA(forcontinuingbusinesses)alsodecreasedby$18.1millionor26.8%to$49.4million(2014:$67.6million).
1) ConsumerPriceIndex.
For
per
sona
l use
onl
y

10 APA Group | Annual Report 2015
AUSTRALIAN PIPELINE TRUST AND ITS CONTROLLED ENTITIES
DIRECTORS’ REPORT CONTINUED
ASSET MANAGEMENT REVENUE ASSET MANAGEMENT EBITDA
A$100m
75
50
25
FY11
One-off Customer Contributions
FY12 FY13 FY14 FY15
0
Underlying Asset Management EBITDA
A$80m
40
60
20
FY11
One-off Customer Contributions
FY12 FY13 FY14 FY15
0
Underlying Asset Management EBITDA
ThisdecreaseinrevenueandEBITDAisduetoareductionincustomercontributionsforrelocatingAPAinfrastructure,to$3.6millioncomparedwith$23.4millioninthelastfinancialyear.Thiswaspartiallyoffsetbyanincreaseinassetmanagementfees.Ascanbeseeninthegraphbelow,therecontinuetobeannualswingsincustomercontributions,asthesearedrivenbyourcustomers’workprogrammesandrequirements.Overanumberofyears,thelongtermannualaveragerevenuereceivedforthisworkhasbeenapproximately$10millionperannum.
CUSTOMER CONTRIBUTIONS ENERGY INVESTMENT REVENUE & EBITDA
A$30m
20
FY11 FY12 FY13 FY14 FY15
0
Average ~$9.9m
A$80m
60
40
20
FY11
Divested & transferred investments
FY12 FY13 FY14 FY15
0
Continuing investments
Asmentionedpreviously,APAsoldits33.05%stakeinAGNduringthefinancialyear,however,theoperatingandmaintenanceagreementsremainonfootuntilmaturityin2027.
3.3 EnergyInvestmentsAPAhasinterestsinanumberofcomplementaryenergyinvestmentsacrossAustralia,includingSEAGasPipeline,EnergyInfrastructureInvestments(“EII”),EthanePipelineIncomeFund,EII2,GDIandDiamantinaandLeichhardtPowerStations(collectively“DPS”).APAholdsanumberofrolesinrespectofmostoftheseinvestments,inadditiontoitsownershipinterest.Allinvestmentsareequityaccounted,withtheexceptionofAPA’s6%interestinEthanePipelineIncomeFund.
APAdivestedits33.05%interestinAustralianGasNetworksLimited(“AGN”,formerlyEnvestraLimited)on7August2014.AsaresulttherewasnomaterialcontributionfromAGNtotheFY2015results.
BothpowerstationsatDPSwerecommissionedduringthefinancialyear.ContributionfromDPSisapproximatelyforthe6monthsthatthepowerstationshavebeeninoperation.
EBITDAfromcontinuinginvestmentsincreasedby20.9%to$21.8million(2014:$18.0million),drivenbyincreasedcontributionfromGDI,EII2andSEAGasPipeline,inparticular.
3.4 CorporateCostsFromthisfinancialyear,APAwillseparateoutcorporatecostsfromoperatingbusinesssegmentEBITDAreporting.Bydoingthis,itisexpectedthatsecurityholderswillbeabletobetterunderstandtheunderlyingperformanceoftheoperatingbusinessesandthecostsforAPAtooperateandmanagethesebusinesses.
Duringthefinancialyear,corporatecostsincreased,slightly,by1.4%overthepreviousyearto$73.6million(2014:$72.5million).
CorporatecostshavetrendeddownasaproportionofrevenueandtotalEBITDAoverthelastfewyears.Moreover,ascanbeseeninthegraphsbelow,asthebusinesshasgrownsignificantlybothintermsofinvestorreturnsandbalancesheet,APA’scorporatecostshaveremainedrelativelysteady,demonstratingtheefficientscalabilityofAPA.
For
per
sona
l use
onl
y

11APA Group | Annual Report 2015
AUSTRALIAN PIPELINE TRUST AND ITS CONTROLLED ENTITIES
DIRECTORS’ REPORT CONTINUED
CORPORATE COSTS TO CONTINUING BUSINESSES EBITDA CORPORATE COSTS VS BUSINESS GROWTH
A$1,000m
600
800
200
400
FY11
Continuing businesses EBITDA (LHS)
FY12 FY13 FY14 FY15
0
14%
8
10
12
4
2
6
0
Corporate costs / Continuing businesses Operating EBITDA (RHS)
A$1,200m
800
400
200
600
1,000
FY11
Revenue (LHS)
FY12 FY13 FY14 FY15
0
A$18b
12
9
3
15
6
0
Corporate costs (LHS)
Total Assets (RHS) Enterprise value (RHS)
EBITDA (LHS)
Infact,whilstrevenue,EBITDA,totalassetsandtotalenterprisevaluehavegrownatacompoundannualgrowthrate(“CAGR”)ofbetween14%and39%overthelastfiveyears,corporatecostshavegrownatasignificantlylower5.8%CAGR.
2015 2011 ChangesYearended30June $million $ million %
Revenue1 1,094 628 14.9%
EBITDA2 821 425 17.9%
Totalassets 14,653 5,428 28.2%
Marketcapitalisation 9,182 2,470 38.9%
Enterprisevalue3 17,413 5,615 32.7%
Corporatecosts 74 59 5.8%
Corporatecosts/EBITDA2(%) 8.2% 12.1%
Notes:
1) Continuingbusinessesrevenue,excludingpass-throughrevenue.
2)ContinuingbusinessesEBITDA.
3)Marketcapitalisationplusnetdebtasatendoffinancialyear.
3.5 RestatementofhistoricalsegmentEBITDAFromthisreportingperiod,APAwillreportitssegmentEBITDAexclusiveofcorporatecoststoprovideaclearerpictureoftheperformanceoftheunderlyingassetswithinthebusiness.Forprioryearcomparisonpurposes,thefollowingtablerestatessegmentEBITDAforthelast5years. 2015 2014 2013 1 2012 2011Yearended30June $000 $000 $000 $000 $000
EBITDA (continuing businesses)
EnergyInfrastructure
Queensland 340,131 234,459 180,652 91,016 81,966
NewSouthWales 120,808 115,569 120,243 122,789 111,764
Victoria 130,170 127,616 136,869 138,292 128,815
SouthAustralia 1,940 2,380 2,419 2,110 2,136
WesternAustralia 212,604 188,947 149,404 133,886 108,093
NorthernTerritory 17,954 15,214 13,502 10,633 5,577
Energy Infrastructure total 823,607 684,185 603,089 498,726 438,351
AssetManagement 49,448 67,552 51,553 35,563 42,517
EnergyInvestments 21,783 18,020 15,635 9,580 3,165
Corporatecosts (73,579) (72,536) (64,488) (63,594) (58,754)
Total segment EBITDA 821,259 697,221 605,789 480,275 425,279
Divestedbusiness2 991 50,113 56,154 55,213 64,309
Total EBITDA before significant items 822,250 747,334 661,943 535,488 489,588
Significantitems3 447,240 – 101,685 (9,663) 2,521
Total EBITDA 1,269,490 747,334 763,628 525,825 492,109
Notes:Numbersinthetablemaynotaddupduetorounding.
1) APAadoptedrevisedAASB119duringFY2014.Astherevisedstandardmustbeappliedretrospectively,comparativenumbershavebeenrestated.
2)AustralianGasNetworksLimited(formerlyEnvestraLimited)soldinFY2014,MoombaAdelaidePipelineSystemsoldinFY2013,APAGasNetworkQueensland(Allgas)soldintoGDI(EII)PtyLtdinFY2012.
3)Significantitems:FY2015relatestonetproceedsrealisedfromthesaleofAPA’sinvestmentinAustralianGasNetworksLimited(formerlyEnvestraLimited)aswellasthesuccessfulrecoveryoffeespaidbyHastingsDiversifiedUtilitiesFundtoHastingsFundsManagementLimited.FY2013relatesprimarilytoone-offitemsassociatedwiththeHDFacquisition.FY2012relatestotheprofitlesstransactioncostsonthesaleofAllgas.FY2011relatestoanumberofone-offnon-operatingitems.
For
per
sona
l use
onl
y

12 APA Group | Annual Report 2015
AUSTRALIAN PIPELINE TRUST AND ITS CONTROLLED ENTITIES
DIRECTORS’ REPORT CONTINUED
4. Capital and investment expenditure
Capitalexpenditure(includingstay-in-businesscapitalexpenditure)forthefinancialyeartotalled$396.3millioncomparedwith$446.7millionlastfinancialyear.
Growthprojectexpenditureof$343.1million(2014:$382.5million)wasinrespectofpipelinecapacityexpansionintheVictoria–NewSouthWalesInterconnect,additionalcompressionfacilitiesatMoombaandWallumbillaandconstructionoftheEasternGoldfieldsPipelineinWesternAustralia.Thesecapitalexpendituresweregenerallyeitherfullyunderwrittenthroughlong-termcontractualarrangementsorhaveregulatoryapprovalthrougharelevantaccessarrangement.
Themajorityofinvestmentexpenditureforthefinancialyearof$5,888.0million(2014:$126.1million)relatedtotheWallumbillaGladstonePipelineacquisitioncompletedinJune2015,withasmallportionattributabletocompletionoftheDiamantinaPowerStation.
Capitalandinvestmentexpenditureforthefinancialyearisdetailedinthetablebelow.
Capitalandinvestmentexpenditure1 Descriptionofmajorprojects
2015$million
2014 $ million
Growth expenditure
Regulated Victoria-NSWInterconnectlooping&compression,Winchelseacompression 136.1 65.5
Majorprojects
Queensland WallumbillaandMoombacompression 104.4 206.6
NewSouthWales MoombaSydneyPipelinesouthernexpansion 12.4 13.2
WesternAustralia EasternGoldfieldsPipelinedevelopment,GoldfieldsGasPipelineexpansions 64.2 73.4
Other VictorianmeteringandLNG,maintenancesystem,enterpriseassetmanagementsystemsandprocesses 26.3 23.8
207.0 317.0
Total growth capex 343.1 382.5
Stay-in-businesscapex 50.6 45.1
Customercontributions Piperelocationsforcouncils,PilbaraPipelinerelocation 2.7 19.1
Total capital expenditure 396.3 446.7
Acquisitions WallumbillaGasPipeline 5,866.8 –
EnergyInvestments DiamantinaPowerStationjointventure 21.2 126.1
Total investment expenditure 5,888.0 126.1
Total capital and investment expenditure 6,284.3 572.8
Notes:Numbersinthetablemaynotaddupduetorounding.
1) Thecapitalexpenditureshowninthistablerepresentsactualcashpaymentsasdisclosedinthecashflowstatement,andexcludesaccrualsbroughtforwardfromthepriorfinancialyearandcarriedforwardtonextfinancialyear.
For
per
sona
l use
onl
y

13APA Group | Annual Report 2015
AUSTRALIAN PIPELINE TRUST AND ITS CONTROLLED ENTITIES
DIRECTORS’ REPORT CONTINUED
Ascanbeseeninthemapbelow,APAcontinuestoworkonprojectsaroundthecountryandmaintainsguidancefor$300millionto$400millionofannualorganicgrowthcapitalexpenditureleveloverthenextcoupleofyears.
ACTUAL AND COMMITTED MAJOR CAPITAL EXPENDITURE PROJECTS GROWTH CAPITAL EXPENDITURE
1
2
3
4MOUNT
ISA
MOOMBA
WALLUMBILLA
SYDNEY
ADELAIDE
BRISBANE
MELBOURNE
GLADSTONE
DARWIN
PERTH
1
9
10
10
11
12
11
2
87
34 4
5
6
5
6
7
8
9
10
11
12
Goldfields Gas Pipelineexpansions completed
Diamantina Power Stationcompleted
Wallumbilla and Moombacompressions installed
Bi-directional capability onBerwyndale Wallumbilla andSouth West Queensland Pipelines
Wallumbilla GladstonePipeline acquisition
Integrated OperationsCentre opened
Winchelsea compression installed
Victoria-New South WalesInterconnect expansion to118Tj/d completed (VictorianTransmission System and MoombaSydney Pipeline southern lateral)
Eastern Goldfields Pipelineconstruction commenced
NT Link feasibility study continues
Bi-directional capability on RomaBrisbane and Moomba SydneyPipelines due 1Q FY16
Expansion work for further 30TJ/dcapacity increase commenced
A$400m
200
300
100
FY12A1 FY13A FY14 FY15 FY16 FY17
0
Committed
Actual
Capex guidance range1) FY12 guidance was for $200m+
10
3
COMPLETED PROJECTS
ONGOING PROJECTS
5. Financing Activities
5.1 CapitalmanagementAPAissuedatotalof278,556,562newsecuritiesbetween23December2014and28January2015(inclusive),raising$1.84billiontoprovidefundinginsupportoftheacquisitionoftheWallumbillaGasPipeline(formerlyQCLNGPipeline)andAPA’songoingcapitalneeds.Thenewsecuritieswereissuedat$6.60persecurityasaresultofaone-for-threeacceleratedrenounceableentitlementoffertoexistingsecurityholders.
Asat30June2015,1,114,307,369securitieswereonissue(2014:835,750,807).
DuringthefinancialyearAPAcompletedthefollowingfinancings:
— inDecember2014,APAestablishedaUS$4.1billiontwo-yearsyndicatedbridgefacilitytoprovidecertaintyoffundingfortheWallumbillaGladstonePipelineacquisition.US$4.1billionofthefacilitywascancelledinMarch2015,followingAPA’ssuccessfulissuanceofbondsintheinternationaldebtcapitalmarkets(detailedbelow).ThebalanceofUS$100millionisasyndicatedrevolvingcreditfacilitythatremainsavailabletoAPAtoprovideflexibilityinrespectofworkingcapitalneeds;
— inMarch2015,APAissuedEUR1,350millionandGBP600millionoffixedrateMediumTermNotes(MTNs)fromitsEuroMediumTermNoteprogramfollowingasuccessfulmarketingprocessaimedatraisinglongertermborrowingstofundtheacquisitionoftheWallumbillaGladstonePipelineandforAPA’songoingcorporateneeds.TheMTNswereissuedinthreetranches:EUR700millionofseven-yearnotesatafixedcouponof1.375%;EUR650millionof12-yearnotesatafixedcouponof2.0%;andGBP600millionof15-yearnotesissuedatafixedcouponof3.5%.ProceedsfromtheMTNswereswappedintoapproximatelyUS$2.3billionandAPAwillretainthefundsinUSdollarsatanall-inweightedaveragefixedrateofapproximately4.2%perannum;and
— inMarch2015,APAissuedUS$1.4billionofseniorguaranteednotesintheUnitedStates144Adebtcapitalmarket.Thenoteswereissuedintwotranches:US$1,100millionof10-yearnotesatafixedcouponof4.2%;andUS$300millionof20-yearnotesatafixedcouponof5.0%.
At30June2015,APA’sdebtportfoliohasabroadspreadofmaturitiesextendingouttoFY2035,withanaveragematurityofdrawndebtof8.5years1.APA’sgearing2of63.4%at30June2015wasdownslightlyfrom64.2%at30June2014.APAremainswellpositioned,atthislevel,tofunditsplannedorganicgrowthactivitiesfromavailablecashandcommittedresources.
1) USDdenominateddebthasbeennominallyexchangedatAUD/USDexchangerateatrespectiveinceptiondateof0.7772forEuroandGBPMTNissuancesand0.7879forUS144Anotes.
2)Gearingratiodeterminedinaccordancewithcovenantsincertainseniordebtfacilitiesasnetdebttonetdebtplusbookequity.
For
per
sona
l use
onl
y

14 APA Group | Annual Report 2015
AUSTRALIAN PIPELINE TRUST AND ITS CONTROLLED ENTITIES
DIRECTORS’ REPORT CONTINUED
APA DEBT MATURITY PROFILE AND DIVERSITY OF FUNDING SOURCES
A$2,000m
1,000
1,500
500
FY16 FY17 FY18 FY19 FY20 FY21 FY22 FY23 FY24 FY25 FY26 FY27 FY28 FY29 FY30 FY31 FY32 FY33 FY34 FY35
0
Bank borrowings US Private Placement Notes Public bonds swapped into AUD(AUD, CAD, JPY, Sterling, US144A)
Public bonds swapped into USD(Euro, Sterling, US144A)
First call date – 60yrSubordinated Notes
At30June2015,APAhadaround$1,587millionincashandcommittedundrawnfacilitiesavailabletomeetthecontinuedcapitalgrowthneedsofthebusiness.
SubsequenttotheendofFY2015,APAestablishedanew$830millionsyndicatedbankfacility,replacingtheexisting$1.1billionsyndicatedfacility.ThishasreducedAPA’scashandavailable,committed,undrawnfacilitiestoaround$1.3billion.Thenewfacilitycomprisesthreetranches:
— $311.25millionmaturinginSeptember2017;
— $311.25millionmaturinginSeptember2018;and
— $207.50millionmaturinginSeptember2020.
APAhasaprudenttreasurypolicywhichrequiresconservativelevelsofhedgingofinterestrateexposurestominimisethepotentialimpactsfromadversemovementsininterestrates.Otherthannotedbelow,allinterestrateandforeigncurrencyexposuresondebtraisedinforeigncurrencieshavebeenhedged.Themajorityoftherevenuestobereceivedoverthenext20yearsfromthefoundationcontractsontheWallumbillaGladstonePipelinewillbereceivedinUSD.TheUS$3.7billionofdebtraisedinMarch2015isconsideredtobea“designatedhedge”fortheserevenuesandthereforehavebeenkeptinUSD.NetUSDcashflowafterservicingtheUSDinterestcoststhatarenotpartofthat“designatedrelationship”willbehedgedonarollingbasisforanappropriateperiodoftime,inlinewithAPA’streasurypolicy.
APAalsoentersintointerestratehedgesforaproportionoftheinterestrateexposureonitsfloatingrateborrowings.Asat30June2015,94.0%(2014:72.8%)ofinterestobligationsongrossborrowingswereeitherhedgedintoorissuedatfixedinterestratesforvaryingperiodsextendingoutinexcessof19years.
5.2 BorrowingsandfinancecostsAsat30June2015,APAhadborrowingsof$8,643million1($4,789millionat30June2014)fromamixofsyndicatedbankdebtfacilities,bilateraldebtfacilities,USPrivatePlacementNotes,MediumTermNotesinseveralcurrencies,AustralianMediumTermNotes,UnitedStates144ANotesandAPAGroupSubordinatedNotes.
Excludingsignificantitems,netfinancecostsdecreasedby$0.9million,or0.3%,to$324.2million(2014:$325.1million).ThedecreaseisprimarilyduetoproceedsfromthesaleofsharesinAGNappliedtoreducedebtandtointerestincomefromtermdepositsreceivedduringthepre-settlementperiodoftheacquisitionoftheWallumbillaGladstonePipeline.Theaverageinterestrate(includingcreditmargins)applyingtodrawndebtwas6.76%1forthefinancialyear(2014:7.12%).
APA’sinterestcoverratio2forthefinancialyear,at2.59times(2014:2.31times),remainswellinexcessofitsdebtcovenantdefaultratioof1.1timesanddistributionlockupratioof1.3times.
5.3 CreditratingsAPTPipelinesLimited,theborrowingentityofAPA,maintainedthefollowingtwoinvestmentgradecreditratingsduringthefinancialyear:
— BBBlong-termcorporatecreditrating(outlookStable)assignedbyStandard&Poor’s(S&P)inJune2009,andlastconfirmedon10December2014;and
— Baa2long-termcorporatecreditrating(outlookStable)assignedbyMoody’sInvestorsService(Moody’s)inApril2010,andlastconfirmedon10December2014.
1) USDdenominateddebthasbeennominallyexchangedatAUD/USDexchangerateatrespectiveinceptiondateof0.7772forEuroandGBPMTNissuancesand0.7879forUS144Anotes.
2)Forthecalculationofinterestcover,significantitemsareexcludedfromtheEBITDAused.
For
per
sona
l use
onl
y

15APA Group | Annual Report 2015
AUSTRALIAN PIPELINE TRUST AND ITS CONTROLLED ENTITIES
DIRECTORS’ REPORT CONTINUED
5.4 IncometaxIncometaxexpense(includingsignificantitems)forthefinancialyearof$177.2millionresultsinaneffectiveincometaxrateof24.0%.TheFY2014profitaftertaxincludedasignificantitemof$144.1millionrelatingtoaone-offadjustmenttotaxexpensetoreflectachangeinthetreatment,fortaxdepreciationpurposesonly,ofvariouscapitalassetsacquiredinFY2007.ThisresultedinanincometaxbenefitforFY2014of$77.7million.
Excludingsignificantitems,theeffectiveincometaxrateforthefinancialyearis28.2%whichishigherthanthe25.0%inthepreviousyearduetoAPAceasingtoequityaccounttheEnvestrainvestmentandtotheincreaseinnon-deductibleamortisationoncontractintangiblesduringtheyear.
Afterutilisationofallavailablegrouptaxlossesandpartialutilisationofavailabletransferredtaxlosses,anincometaxprovisionof$7.2mhasbeenrecognisedasat30June2015.
5.5 DistributionsDistributionspaidtosecurityholdersduringthefinancialyearwere:
Final FY2014 distribution InterimFY2015distribution paid 10 September 2014 paid18March2015
Total distribution Totaldistribution Cents per security $000 Centspersecurity $000
APTprofitdistribution 16.42 137,239 15.12 126,396
APTcapitaldistribution – – – –
APTITprofitdistribution 2.33 19,465 2.38 19,860
APTITcapitaldistribution – – – –
18.75 156,704 17.50 146,256
On26August2015,theDirectorsdeclaredafinaldistributionforAPAforthefinancialyearof20.50centspersecuritywhichispayableon16September2015andwillcomprisethefollowingcomponents:
FinalFY2015distribution payable16September2015
Totaldistribution Centspersecurity $000
APTprofitdistribution 18.12 201,945
APTcapitaldistribution – –
APTITprofitdistribution 2.38 26,488
APTITcapitaldistribution – –
20.50 228,433
Totaldistributionforthefinancialyearended30June2015is38.0centspersecurity,anincreaseof1.75cents,or4.8%,onthe36.25centspersecuritypaidinrespectoftheyearended30June2014.
Distributioninformationispresentedonanaccountingclassificationbasis.TheAPAGroupAnnualTaxStatementandAnnualTaxReturnGuide(tobereleasedinSeptember2015)willprovidetheclassificationofdistributioncomponentsforthepurposesofpreparationofsecurityholderincometaxreturns.
5.6 TotalsecurityholderreturnDuringthefinancialyear,APA’smarketcapitalisationincreasedby59.5%to$9.2billionat30June2015.APA’stotalsecurityholderreturnforthefinancialyear,whichaccountsfordistributionspaidplusthecapitalappreciationofAPA’ssecuritypriceandassumesthereinvestmentofdistributionsatthedeclaredtime,was30.0%,placingAPAinthetop21stpercentileofoneyeartotalshareholderreturnsforthefinancialyear1.
APA’stotalsecurityholderreturnsincelistingontheASXis1,304%,acompoundannualgrowthrateof19.2%.
ThetablebelowprovidessecurityholderswithanunderstandingofthegrowthinvalueofAPAsecurities,excludingvalueraisedthroughcapitalraisingactivities,duringFY2015aswellassincelisting.
FY2015 SinceListing
Numberof Priceper Market Numberof Priceper Market securities security capitalisation securities security capitalisation (million) ($/security) ($million) (million) ($/security) ($million)
Beginningofperiod 835.8 $6.89 $5,758.3 244.0 $2.00 $488.0
Capitalraised2 278.6 $6.60 $1,838.5 870.3 $2.50-$6.60 $4,254.5
Endofperiod 1,114.3 $8.24 $9,181.9 1,114.3 $8.24 $9,181.9
Growthinvalueoverperiod $1,585.1 $4,439.4
1) FiguresquotedaresourcedfromIRESSandmeasuredasat30June2015.
2)Sincelisting,APAhasundertakenavarietyofcapitalraisingactivitiesincludingrightsissues,placementsanddividendreinvestmentplans.ForFY2015,thisrelatestothe1-for-3rightsissueconducted.
For
per
sona
l use
onl
y

16 APA Group | Annual Report 2015
AUSTRALIAN PIPELINE TRUST AND ITS CONTROLLED ENTITIES
DIRECTORS’ REPORT CONTINUED
APA TOTAL SECURITYHOLDER RETURN SINCE LISTING TO 30 JUNE 2015
APA total securityholder return Utilities Accumulation Index S&P/ASX 200 Accumulation Index
400
0
JUN 00 JUN 01 JUN 02 JUN 03 JUN 04 JUN 04 JUN 06 JUN 07 JUN 08 JUN 09 JUN 10 JUN 11 JUN 12 JUN 13 JUN 14 JUN 15
1,200
1,600
800
5.7 Guidanceforthe2016financialyearBasedoncurrentoperatingplans,APAexpectsstatutoryEBITDAforthefullyearto30June2016tobeinarangeof$1,275millionto$1,310million.Onanormalised,continuingbusinessesbasis,EBITDAisexpectedtoincreasebyapproximately55%to60%onthe2015financialyearcontinuingbusinessEBITDA.ThisincludesacontributionofaroundUS$355millionfromthenewlyacquiredWallumbillaGladstonePipelineandgrowthacrosstheremainderoftheAPAportfolioofbetween3%and7%.
APAhasenteredintoforwardexchangecontractsforFY2016,forthenetUSDcashflowfromthegastransportationagreementsfortheWallumbillaGladstonePipeline(“WGP”),afterservicingUSDdenominateddebt.InforecastingAUDequivalentEBITDAcontributionfromWGP,wehaveusedtheforwardexchangeratesforthesehedgedrevenues.AnydifferencesinthehedgedrateandtheactualratewillbeaccountedforinthehedgereserveaccountwithintheequityportionofAPA’sbalancesheet.
Netinterestcostisexpectedtobeinarangeof$500millionto$510million.
Growthcapitalexpenditureisexpectedtoremainintherangeof$300millionto$400millionforFY2016.
Distributionspersecurityforthe2016financialyearareexpectedtobeatleastequaltothosepaidinrespectofthe2015financialyear,thatis,atleast38.0centspersecurity.
Changes
2016guidance 2015actualYearended30June $000 $000 $000 %
NormalisedEBITDAfromcontinuingbusinesses 1,275to1,310 821.3 454to489 55%to60%
Netinterestcost 500to510 324.2 176to186 54%to57%
StatutoryEBITDA 300to400 343.1 – –
Distributionpersecurity Atleast38.0 38.0 – –
6. Regulatory matters
Keyregulatorymattersaddressedduringthefinancialyearincluded:
GoldfieldsPipelineaccessarrangementInAugust2014,arevisedaccessarrangementproposalwassubmittedtotheEconomicRegulationAuthorityofWesternAustralia.APAhasrespondedtoaseriesofqueriesbytheregulatoronthatproposal.TheregulatorwillissueadraftdecisiontowhichAPAwillthenprovideafurtherresponsebeforetheregulatormakesafinaldecision,whichisestimatedtooccurbyDecember2015.Thecurrenttariffsareapplicableuntiltheregulator’sfinaldecisionbecomesoperative.
GDIbecomessubjecttolight-handedregulationAPAholdsa20%interestinGDI.DuringtheyearAPA,onbehalfofGDI,successfullyhadtheregulatorystatusoftheGDInetworkchangedfromfulleconomicregulationtolight-handedregulation,loweringthecostofregulationincurredbythenetwork.
GasPolicydevelopmentsTheongoingunprecedentedchangesintheEasternAustraliangasmarkethaveresultedinnumerousgovernmentalreviewsandinquiriesintopolicysettings.APAhasbeenanactiveparticipantinthesereviews,highlightingthesignificantcontributionthatourportfolioofpipelineassetscoupledwithourresponsivecustomerserviceshasmadetothedevelopmentofthegasmarket.
7. Health, safety and environment
HealthandsafetyreportingTheLostTimeInjuryFrequencyRate(“LTIFR”)1forAPAwas0.64(foremployeesandcontractors)forthefinancialyear,downfrom0.80inthelastfinancialyear.Thereweretwoemployeeandtwocontractorlosttimeinjuriesduringthefinancialyear.TheTotalRecordableInjuryFrequencyRate2forAPAwas8.11(foremployeesandcontractorscombined)inFY2015,areductionof8.89from17.00inthelastfinancialyear.
APAaimstobeazeroharmworkplaceforitsemployees,contractorsandthebroadercommunitiesinwhichitoperates.DuringFY2014,APAlaunchedathreeyearStrategicImprovementPlanandintroducedatailoredlistofriskbasedinitiativesaspartoftheplan.
1) LostTimeInjuryFrequencyRateiscalculatedasthenumberoflosttimeinjuries(injurieswhichresultinthelossofatleastonefullshift),multipliedbyonemillion,dividedbythetotalhoursworked.
2)TotalRecordableInjuryFrequencyRateiscalculatedusingthesameformulaasLTIFRwiththeaddedinclusionofallmedicallytreatedinjuries.
For
per
sona
l use
onl
y

17APA Group | Annual Report 2015
AUSTRALIAN PIPELINE TRUST AND ITS CONTROLLED ENTITIES
DIRECTORS’ REPORT CONTINUED
TheStrategicImprovementPlanandeachinitiativefollowtheRisk–Control–Assureframework.Oneriskwhichwasidentifiedduringtheyearasrequiringadditionalcontrolswasdriving.Asafedrivinginitiative,calledSafedrive+ hasbeenaddedtothestrategicplan.ThisinitiativewillprovidetherequisitelevelofcontrolandtrainingforallAPAdrivers,passengersandcontractors,aswellasaminimumstandardvehiclespecification.
Otherkeyinitiativesimplementedduringthefinancialyearinclude:
— RelaunchtotheLeading Zero Harm behaviouralprogram,calibrationofthehazardprofileprocess,thecompletionofthehazardidentificationprocessandriskbasedandsystemaudits.
— The implementation of Safeguard+
APA’sonlinehealth,safetyandenvironment(“HSE”)repositorywentliveinDecember2014.Theplatformhasalreadyprovidedthebusinesswithmuchimproveddisciplinesforreporting,communicating,investigatingandactioningHSEfailureswhilstalsoprovidinganeasytousereportingsuitewhichprovidesvastlyimprovedHSEdataandanalysis.
— A tailored contractor management system
Thenewsystemprovidestoolsandprocessesforthebusinesstoappropriatelyassessandmonitorcontractorperformance.ItrequirescompliancewithAPAprocurementandHSEstandardsensuringalignmentwithregardstoapproachtoHSE.
APAencourageshealthylivingandcontinueditssponsorshipforemployeeswhoparticipateintheGlobalCorporateChallenge.Inaddition,APAcompletedacompanyhealthandwellbeingriskprofileofemployees.Theprogramsurveyedandtestedasampleof284employeesacrossthebusiness.Theresultswillbeusedtodevelophealthandwellbeingprograms.
EnvironmentalregulationsAllpipeline,distributionandgasprocessingassetsownedand/oroperatedbyAPAaredesigned,constructed,tested,operatedandmaintainedinaccordancewithpipelineanddistributionlicencesissuedbytherelevantStateandTerritorytechnicalregulators.AlllicencesrequirecompliancewithrelevantFederal,StateandTerritoryenvironmentallegislationandAustralianstandards.
ThepipelinelicencesalsorequirecompliancewiththeAustralianStandardAS2885“Pipelines–GasandLiquidPetroleum”,whichhasspecificrequirementsforthemanagementofenvironmentalmattersassociatedwithallaspectsofthehighpressurepipelineindustry.
ConstructionEnvironmentalManagementPlanssatisfyingSection6oftheAustralianPipelineGasAssociationCodeofEnvironmentalPracticearepreparedasneeded.MajorprojectconstructionactivitiesareauditedorinspectedinaccordancewithEnvironmentalManagementPlanrequirements.InaccordancewithPart3ofAS2885,EnvironmentalManagementPlanssatisfyingSection7oftheCodeareinplaceforalloperatingpipelinesandaremanagedinaccordancewithAPA’scontractsandthetermsandconditionsofthelicencesthatAPAhasbeenissued.
TheSafetyandOperatingPlanforthedistributionnetworksthatAPAoperateshasbeenauditedduringthefinancialyear,inaccordancewithNewSouthWalestechnicalregulatoryrequirements.
SeniormanagementreviewsauditreportsandanymaterialbreachesarecommunicatedtotheBoard.TheBoardreviewsexternalauditreportsand,onamonthlybasis,theinternalreportspreparedrelatingtoenvironmentalissues.NosignificantbreacheshavebeenreportedduringthefinancialyearandAPAhasmanageditsassetsinaccordancewiththerelevantEnvironmentalManagementPlans.
EnvironmentalreportingInOctober2014,APAcompliedwithAustralia’sNationalGreenhouseandEnergyReporting(“NGER”)obligationsfortheFY2014.EnergyreportingforFY2015willbesubmittedinOctober2015.
APA’smainsourcesofemissionsarefromthecombustionofnaturalgasincompressorstationsandfromfugitiveemissionsassociatedwithnaturalgaspipelines.NGERcompliancereportingappliedtoassetsunderAPA’soperationalcontrol,whichincludetheRomaBrisbanePipeline,theMoombaSydneyPipeline,theSouthWestQueenslandPipeline,theNorthernTerritoryNaturalGasDistributionNetwork,theGoldfieldsGasPipeline(88.2%ownership),theDiamantinaPowerStation(50%equityownership)andtheGDIgasdistributionnetwork(20%equityownership).
APA’ssummaryofScope1emissionsandenergyconsumptionforthe2014financialyeararesetoutinthefollowingtable:
Financialyear 2014 2013 Change
Scope1CO2emissions(tonnes) 311,421 322,827 (11,406) (3.5)%
Energyconsumption(GJ) 6,425,042 2,791,839 (3,633,203) (130.1)%
8. Risk overview
APAidentifiesriskstothebusinessandputsinplacemitigationactionstoremoveorminimisethenegativeimpactandmaximisetheopportunitiesinrespectoftheserisks.MaterialrisksarereviewedonanongoingbasisbyAPA’sExecutiveRiskManagementCommitteeandtheBoardAuditandRiskManagementCommittee,togetherwiththerelevantbusinessunitsandinternalexperts.FurtherinformationonthisprocessisprovidedinAPA’sCorporateGovernanceStatement(refertoPrinciple7)andtheSustainabilityReport(partoftheAnnualReview).
Riskassessmentconsidersacombinationoftheprobabilityandconsequenceofrisksoccurring.ListedbelowareanumberofkeyrisksidentifiedthatcouldmateriallyaffectAPAnegatively.However,theriskslistedmaynotincludeallrisksassociatedwithAPA’songoingoperations,thematerialityofrisksmaychangeandpreviouslyunidentifiedrisksmayemerge.
KeyrisksEconomic regulationAPAhasanumberofpriceregulatedassetsandinvestmentsinitsportfolio.Regulatorypricingperiodsgenerallyrunforfiveyearsandreflecttheregulator’sdeterminationof,amongstothermatters,APA’sprojectedoperatingandcapitalcosts,andweightedaveragecostofcapital.ThepriceregulationoutcomesdeterminedbytheAustralianEnergyRegulatororEconomicRegulationAuthority(forWesternAustralia)underanaccessarrangementprocessforafullregulationassetmayadverselyaffectAPA’srevenueinrespectofthatasset.
For
per
sona
l use
onl
y

18 APA Group | Annual Report 2015
AUSTRALIAN PIPELINE TRUST AND ITS CONTROLLED ENTITIES
DIRECTORS’ REPORT CONTINUED
AnumberofAPA’sassetsaresubjecttolightregulationwhich,whilenotapriceregulationregime,doesenabletheregulatortoarbitrateanydisputeswithcustomersonpriceandothertermsofaccess.Inaddition,undertheNationalGasLaw,anypersonmaymakeanapplicationthatanunregulatedpipelinebecome“covered”andsubjecttoeconomicregulation,whichmayadverselyaffectAPA’seconomicposition.
Bypass and competitive riskBypassandcompetitiveriskoccurswhenanewtransmissionpipelineoffersgastransportationservicestothesameendmarketservicedbyexistingpipelines. Ifabypassriskeventuates,APA’sfutureearningscouldbereducedifcustomerspurchasegastransportationservicesfromnewpipelinesratherthanfromAPA’sexistingpipelines.
Gas demand riskReduceddemandforgasandincreaseduseofgasswapcontractsbycustomersmayreducethefuturedemandforpipelinecapacityandtransportationservicesandadverselyimpactAPA’sfuturerevenue,profitsandfinancialposition.
Gas supply riskAlong-termshortageofcompetitivelypricedgas,eitherasaresultofgasreservedepletion,allocationofgastoothermarkets,ortheunwillingnessorinabilityofgasproductioncompaniestoproducegas,mayadverselyaffectAPA’srevenueandthecarryingvalueofAPA’sassets.
Counterparty riskThefailureofacounterpartytomeetitscontractualcommitmentstoAPA,whetherinwholeorinpart,wouldreducefutureanticipatedrevenueunlessanduntilAPAisabletosecureanalternativecustomer.Counterpartyriskalsoariseswhencontractsareenteredintoforderivativeswithfinancialinstitutions.
Interest rates and refinancing risksAPAisexposedtomovementsininterestrateswherefloatinginterestratefundsarenoteffectivelyhedged.ThereisariskthatadverseinterestratemovementsmayaffectAPA’searnings,bothdirectly(throughincreasedinterestpayments)andindirectly(throughtheimpactonassetcarryingvalues).
APAhasborrowingsextendingthroughto2035.Accesstocontinuingfinancingsourcestoextendand/orrefinancedebtfacilitieswillbeimportant.AninabilitytosecurenewdebtfacilitiesatasimilarquantumandcosttoexistingdebtfacilitiesmayadverselyaffectAPA’soperationsand/orfinancialpositionandperformance.
Foreign exchange risksAPAisexposedtomovementsinforeignexchangeratesandthereisariskthatadverseUSD:AUDexchangeratemovementsmayaffectAPA’searnings(throughreducedAUDrevenuesreceivedfromUSDdenominatedrevenues)anddebtlevels(throughtranslationofUSDdenominateddebt).
Investment riskAPAmayacquireinfrastructureandrelatedassetsorundertakeadditionalorincrementalinvestmentinitsexistingassets.Thereisariskthatassumptionsandforecastsusedinmakinginvestmentdecisionsmayultimatelynotberealised,andthismayadverselyaffectAPA’sfinancialpositionandperformance.ThereisalsoariskthatAPAmaybeunabletosecurefurtherappropriateinfrastructureinvestmentsonsuitableterms,therebylimitingitsgrowth.
Contract renewal riskAlargepartofAPA’srevenuesarethesubjectoflong-termnegotiatedrevenuecontractswithendcustomers.Duetoarangeoffactors,includingcustomerdemandrisk,gassupplyrisk,counterpartyrisk,shortertermcontractsandbypassandcompetitiverisk,APAmaynotbesuccessful inrecontractingtheavailablepipelinecapacitywhenitcomesdueforcontractrenewal,andconsequentlymayadverselyimpactAPA’sfuturerevenue,profitsandfinancialposition.
Operational riskAPAisexposedtoanumberofoperationalriskssuchasequipmentfailuresorbreakdowns,ruptureofpipelines,informationtechnologysystemsfailuresorbreakdowns,employeeorequipmentshortages,contractordefault,unplannedinterruptions,damagebythirdparties,integrationofacquiredassetsandunforeseenaccidents.Operationaldisruption,orthecostofrepairingorreplacingdamagedassets,couldadverselyimpactAPA’searnings.Insurancepoliciesmayonlyprovideprotectionforsome,butnotall,ofthecoststhatmayarisefromunforeseenevents.
Operating licences and authorisationsAllpipeline,distribution,gasprocessing,storageandelectricitygenerationassetsownedand/oroperatedbyAPArequirecompliancewithrelevantlaws,regulationsandpolicies.AnychangesmayhaveanadverseimpactonAPA’spricing,costsorcomplianceregimes,whichcouldmateriallyaffectAPA’soperations,earningsand/orfinancialpositionandperformance.Certainlicences,permitsorregulatoryconsentsmaynotberenewed,granted,continuedorsuchrenewal,grantorcontinuationmaybeonmoreoneroustermsorsubjecttolossorforfeiture,whichmayadverselyaffectAPA’soperationsand/orfinancialpositionandperformance.
Construction and development riskAPAdevelopsnewassetsandundertakesexpansionofitsexistingassets.Thisinvolvesanumberoftypicalconstructionrisks,includingthefailuretoobtainnecessaryapprovals,employeeorequipmentshortages,higherthanbudgetedconstructioncostsandprojectdelays,whichmayimpactthecommercialityandeconomicsofthedevelopmentorotherwiseimpactonAPA’sotherassets.Iftheserisksmaterialise,thismayadverselyaffectAPA’soperationsand/orfinancialpositionandperformance.
Disputes and litigation risksInthecourseofitsoperations,APAmaybeinvolvedindisputesandlitigation.ThereisariskthatmaterialorcostlydisputesorlitigationcouldaffectAPA’sfinancialpositionandperformance.
Credit rating risksThereisnoassurancethatanyratingwillremainineffectforagivenperiodoftimeorthatanyratingwillnotberevisedorwithdrawnentirelybyaratingagencyinthefutureifinitsjudgement,circumstanceswarrant.APAisundernoobligationtoupdateinformationregardingsuchratingsshouldtheychangeovertime.
For
per
sona
l use
onl
y

19APA Group | Annual Report 2015
AUSTRALIAN PIPELINE TRUST AND ITS CONTROLLED ENTITIES
DIRECTORS’ REPORT CONTINUED
DIRECTORS1. Information on Directors and Company Secretary
InformationrelatingtothequalificationsandexperienceoftheDirectorsandCompanySecretaryissetoutbelow:
Leonard Bleasel AMFAICD FAIMIndependent ChairmanAppointed28August2007AppointedChairman30October2007
Leonard(Len)Bleaselhadalongcareerintheenergyindustrybeforeretiringfrommanagementin2001.HestartedhiscareerinAGLin1958andworkedinavarietyofroles,culminatinginthepositionofManagingDirectorandCEOfrom1990to2001.
Len’spastappointmentshaveincludedleadnon-executiveDirectorofQBEInsuranceGroupLimitedandChairmanofFoodlandAssociatedLimited,ABNAMROAustraliaHoldingsPtyLimited,SolarisPower,NaturalGasCorporationHoldingsLtd(NewZealand),ElgasLtd,EastAustralianPipelineLtdandtheAdvisoryCouncilforCIMBSecuritiesInternational(Australia)PtyLtd.HewasalsoadirectorofStGeorgeBankLimitedandGasValpo(Chile).
LeniscurrentlyChairmanoftheTarongaConservationSocietyAustralia.HewasawardedanAMintheGeneralDivisionoftheOrderofAustraliaforservicestotheAustraliangasandenergyindustriesandthecommunity.
Michael McCormackBSurv GradDipEngMBA FAICDChief Executive Officer and Managing DirectorAppointedManagingDirector1July2006
Michael(Mick)McCormackhasbeenChiefExecutiveOfficerofAPAsince1July2005andManagingDirectorsince1July2006.Hehasover30years’experienceinthegasinfrastructuresectorinAustraliaandhiscareerhasencompassedallaspectsofthesectorincludingcommercialdevelopment,design,construction,operationandmanagementofmostofAustralia’snaturalgaspipelinesandgasdistributionsystems.
Mick isaformerDirectorofEnvestraLimited(nowAustralianGasNetworks),theAustralianPipelineIndustryAssociationandtheAustralianBrandenburgOrchestra.
Steven CraneBComm FAICD SF FinIndependent DirectorAppointed1January2011
Steven(Steve)Cranehasover30years’experienceinthefinancialservicesindustry.Hisbackgroundisininvestmentbanking,havingpreviouslybeenChiefExecutiveOfficerofABNAMROAustraliaandBZWAustralia.
Stevehasconsiderableexperienceasanon-executiveDirectorof listedbusinesses.HeiscurrentlyChairmanofnibholdingslimitedandDeputyChairmanoftheTarongaConservationSocietyAustralia.HewasformerlyChairmanofAdelaideManagedFundsLimitedandInvestaPropertyGroupLimited,aDirectorofTransfieldServicesLimited,BankofQueenslandLimited,AdelaideBankLimited,FoodlandAssociatedLimitedandAPAEthaneLimited,theresponsibleentityofEthanePipelineIncomeFund,andamemberoftheAdvisoryCouncilforCIMBSecuritiesInternational(Australia)PtyLimited.SteveisamemberoftheAuditandRiskManagementCommitteeandtheRemunerationCommittee.
John FletcherBSc MBA FAICDIndependent DirectorAppointed27February2008
JohnFletcherhasover35years’experienceintheenergyindustry,havingheldanumberofexecutivepositionsinAGLpriortohisretirementin2003,includingChiefFinancialOfficer.HebringsbroadfinancialandcommercialexperiencetotheBoardhavingpreviouslybeenaDirectorofIntegralEnergy,NaturalGasCorporationHoldingsLtd(NewZealand),FoodlandAssociatedLimited,SydneyWaterCorporationandAlintaEnergyGroup.
JohnwasanAGL-appointedDirectorofAustralianPipelineLimitedfrom2000to2005.
HeistheChairmanoftheRemunerationCommitteeandamemberoftheAuditandRiskManagementCommittee.
Russell Higgins AOBEc FAICDIndependent DirectorAppointed7December2004
RussellHigginshasextensiveexperience,bothlocallyandinternationally,intheenergysectorandineconomicandfiscalpolicy.HewasSecretaryandChiefExecutiveOfficeroftheDepartmentofIndustry,ScienceandResourcesfrom1997to2002andChairmanoftheAustralianGovernment’sEnergyTaskForcefrom2003to2004.
RussellisaDirectorofTelstraCorporationLimitedandArgoInvestmentsLimited.
HeisaformerChairmanoftheGlobalCarbonCaptureandStorageInstitute,theCSIROEnergyTransformedFlagshipAdvisoryCommitteeandSnowyHydro,aswellasaformerDirectorofLeightonHoldingsLimited,RicegrowersLimited(tradingasSunRice),StJamesEthicsFoundation,AustralianBiodieselGroupLimited,EFICandtheCSIRO.HewasalsopreviouslyamemberofthePrimeMinisterialTaskGrouponEmissionsTrading.
RussellisChairmanoftheHealthSafetyandEnvironmentCommitteeandamemberoftheAuditandRiskManagementCommittee.
For
per
sona
l use
onl
y

20 APA Group | Annual Report 2015
AUSTRALIAN PIPELINE TRUST AND ITS CONTROLLED ENTITIES
DIRECTORS’ REPORT CONTINUED
Patricia McKenzieLLB FAICDIndependent DirectorAppointed1January2011
PatriciaMcKenziehasconsiderableexpertiseandexperienceinenergymarketregulationand,asaqualifiedsolicitor,extensivecorporatelegalexperience.SheiscurrentlyChairofHealthdirectAustraliaandaDirectorofTransgrid.
PatriciawasformerlyaDirectorofMacquarieGeneration,AustralianEnergyMarketOperatorLimited(AEMO),thenationalenergymarketoperatorforelectricityandgas,andChiefExecutiveOfficerofGasMarketCompanyLimited,themarketadministratorforretailcompetitioninthegasindustryinNewSouthWalesandtheAustralianCapitalTerritory.
Patricia isamemberof theHealthSafetyandEnvironmentCommitteeandtheRemunerationCommittee.
Robert WrightBCom FCPAIndependent DirectorAppointed11February2000
RobertWrighthasover35years’financialmanagementexperience.DuringhisexecutivecareerhewastheChiefFinancialOfficerofseverallistedcompanies.HehasalsobeenbothanExecutiveDirectorandNonExecutiveDirectorofanumberoflistedcompanies.
HeiscurrentlytheChairmanofSuperRetailGroupLimitedandAPAEthaneLimited,theresponsibleentityofEthanePipelineIncomeFund,andwaspreviouslyChairmanofSAIGlobalLimited,DexionLimitedandRCLGroupLimited.
RobertistheChairmanoftheAuditandRiskManagementCommitteeandamemberoftheHealthSafetyandEnvironmentCommittee.
Mark KnapmanBCom LLB FGIA FCISCompany SecretaryAppointed16July2008
MarkhasextensiveexperienceasaCompanySecretary.HewasCompanySecretaryandGeneralCounselofanASX-listedcompanyandAsiaPacificLegalCounselandCompanySecretaryforaUSmultinationalcompanypriortojoiningAPA.Priortothoseroles,hewasapartnerofanAustralianlawfirm.
MarkisaFellowoftheGovernanceInstituteofAustraliaandtheInstituteofCompanySecretariesandAdministrators,andisadmittedtopracticeasasolicitor.
2. Directorships of other listed companies
DirectorshipsofotherlistedcompaniesheldbyDirectorsatanytimeinthethreeyearsimmediatelybeforetheendofthefinancialyearareasfollows:
Name Company Periodofdirectorship
LeonardBleaselAM QBEInsuranceGroupLimited January2001toSeptember2012
MichaelMcCormack EnvestraLimited July2007toSeptember2014
StevenCrane nibholdingslimited SinceSeptember2010
TransfieldServicesLimited February2008toFebruary2015
BankofQueenslandLimited December2008toJanuary2015
JohnFletcher – –
RussellHigginsAO TelstraCorporationLimited SinceSeptember2009
ArgoInvestmentsLimited SinceSeptember2011
LeightonHoldingsLimited June2013toMay2014
RicegrowersLimited December2005toAugust2012
PatriciaMcKenzie – –
RobertWright SuperRetailGroupLimited SinceMay2004
APAEthaneLimited1 SinceJuly2008
SAIGlobalLimited October2003toOctober2013
1) APAEthaneLimitedistheresponsibleentityoftheregisteredmanagedinvestmentschemesthatcompriseEthanePipelineIncomeFund,thesecuritiesinwhicharequotedontheASX.
For
per
sona
l use
onl
y

21APA Group | Annual Report 2015
AUSTRALIAN PIPELINE TRUST AND ITS CONTROLLED ENTITIES
DIRECTORS’ REPORT CONTINUED
3. Directors’ meetings
Duringthefinancialyear,14Boardmeetings,threeRemunerationCommitteemeetings,fourAuditandRiskManagementCommitteemeetingsandfourHealthSafetyandEnvironmentCommitteemeetingswereheld.ThefollowingtablesetsoutthenumberofmeetingsattendedbyeachDirectorwhiletheywereaDirectororacommitteemember:
AuditandRisk HealthSafetyand Remuneration Management Environment Board Committee Committee Committee
Directors A B A B A B A B
LeonardBleaselAM1 14 14 – – – – – –
MichaelMcCormack 14 14 – – – – – –
StevenCrane 14 14 3 3 4 4 – –
JohnFletcher 14 14 3 3 4 4 – –
RussellHigginsAO 14 14 – – 4 4 4 4
PatriciaMcKenzie 14 14 3 3 – – 4 4
RobertWright 14 14 – – 4 4 4 4
A:NumberofmeetingsheldduringthetimetheDirectorheldofficeorwasamemberofthecommitteeduringthefinancialyear.
B:Numberofmeetingsattended.
4. Directors’ Securityholdings
TheaggregatenumberofAPAsecuritieshelddirectly,indirectlyorbeneficiallybyDirectorsortheirDirectorrelatedentitiesat30June2015is1,305,883(2014:979,426).
ThefollowingtablesetsoutDirectors’relevantinterestsinAPAsecuritiesasat30June2015:
Fully paid securities Securities FullypaidsecuritiesDirectors as at 1 July 2014 Securitiesacquired disposed asat30June2015
LeonardBleaselAM 460,664 153,552 – 614,216
MichaelMcCormack 208,590 69,530 – 278,120
StevenCrane 100,000 30,000 – 130,000
JohnFletcher 66,188 22,062 – 88,250
RussellHigginsAO 92,040 30,679 – 122,719
PatriciaMcKenzie 12,500 7,486 – 19,986
RobertWright 39,444 13,148 – 52,592
979,426 326,457 – 1,305,883
TheDirectorsholdnootherrightsoroptionsoverAPAsecurities.TherearenocontractstowhichaDirectorisapartyorunderwhichtheDirectorisentitledtoabenefitandthatconferarighttocallforordeliverAPAsecurities.
OPTIONS GRANTEDInthisreport,theterm“APAsecurities”referstothestapledsecuritieseachcomprisingaunitinAustralianPipelineTruststapledtoaunitinAPTInvestmentTrustandtradedontheAustralianSecuritiesExchange(“ASX”)underthecode“APA”.
NooptionsoverunissuedAPAsecuritiesweregrantedduringorsincetheendofthefinancialyear,nounissuedAPAsecuritieswereunderoptionasatthedateofthisreport,andnoAPAsecuritieswereissuedduringorsincetheendofthefinancialyearasaresultoftheexerciseofanoptionoverunissuedAPAsecurities.
INDEMNIFICATION OF OFFICERS AND EXTERNAL AUDITORDuringthefinancialyear,theResponsibleEntitypaidapremiuminrespectofacontractinsuringtheDirectorsandofficersoftheResponsibleEntityandanyAPAGroupentityagainstanyliabilityincurredinperformingthoserolestotheextentpermittedbytheCorporations Act 2001.Thecontractofinsuranceprohibitsdisclosureofthenatureoftheliabilityandtheamountofthepremium.
AustralianPipelineLimited,initscapacityasResponsibleEntityofAustralianPipelineTrustandAPTInvestmentTrust,indemnifieseachpersonwhoisorhasbeenaDirectororCompanySecretaryoftheResponsibleEntityoranyAPAGroupentityunderarangeofdeedpollsandindemnityagreementswhichhavebeeninplacesince1July2000.ThisindemnitymayextendtosuchotherofficersorformerofficersofAPAGroupentitiesastheBoard,initsdiscretion,ineachcasedetermines.Theindemnityoperatestothefullextentallowedbylawbutonlytotheextentnotcoveredbyinsurance,andisontermstheBoardconsidersusualforarrangementsofthistype.
Underitsconstitution,AustralianPipelineLimited(initspersonalcapacity)indemnifieseachpersonwhoisorhasbeenaDirector,CompanySecretaryorexecutiveofficerofthatcompany.
TheResponsibleEntityhasnototherwise,duringorsincetheendofthefinancialyear,indemnifiedoragreedtoindemnifyanofficerorexternalauditoroftheResponsibleEntityoranyAPAGroupentityagainstaliabilityincurredbysuchanofficerorauditor.
1) TheChairmanattendedallcommitteemeetingsexofficio.
For
per
sona
l use
onl
y
22 APA Group | Annual Report 2015
AUSTRALIAN PIPELINE TRUST AND ITS CONTROLLED ENTITIES
DIRECTORS’ REPORT CONTINUED
REMUNERATION REPORTTheremunerationreportisattachedtoandformspartofthisreport.
AUDITOR1. Auditor’s independence declaration
Acopyoftheindependencedeclarationoftheauditor,DeloitteToucheTohmatsu(“Auditor”)asrequiredundersection307CoftheCorporations Act 2001 isincludedatpage77.
2. Non-audit services
Non-auditserviceshavebeenprovidedduringthefinancialyearbytheAuditor.AdescriptionofthoseservicesandtheamountspaidorpayabletotheAuditorfortheservicesaresetoutinNote29tothefinancialstatements.
TheBoardhasconsideredthosenon-auditservicesprovidedbytheAuditorand,inaccordancewithwrittenadvicefromtheAuditandRiskManagementCommittee(“Committee”),issatisfiedthattheprovisionofthoseservicesbytheAuditoriscompatiblewiththegeneralstandardofindependenceforauditorsimposedbytheCorporations Act 2001anddidnotcompromisetheauditorindependencerequirementsoftheAct.TheBoard’sreasonsforconcludingthatthenon-auditservicesprovideddidnotcompromisetheAuditor’sindependenceare:
— allnon-auditservicesweresubjecttoAPA’scorporategovernanceprocedureswithrespecttosuchmattersandhavebeenreviewedbytheCommitteetoensuretheydonotimpactontheimpartialityandobjectivityoftheAuditor;
— thenon-auditservicesprovideddidnotunderminethegeneralprinciplesrelatingtoauditorindependenceastheydidnotinvolvereviewingorauditingtheAuditor’sownwork,actinginamanagementordecisionmakingcapacityforAPA,actingasanadvocateforAPAorjointlysharingrisksandrewards;and
— theAuditorhasprovidedalettertotheCommitteewithrespecttotheAuditor’sindependenceandtheAuditor’sindependencedeclarationreferredtoabove.
INFORMATION REQUIRED FOR REGISTERED SCHEMESFeespaidtotheResponsibleEntityanditsassociates(includingDirectorsandSecretariesoftheResponsibleEntity,relatedbodiescorporateandDirectorsandSecretariesofrelatedbodiescorporate)outofAPAschemepropertyduringthefinancialyeararedisclosedinNote30tothefinancialstatements.
Exceptasdisclosedinthisreport,neithertheResponsibleEntitynoranyofitsassociatesholdsanyAPAsecurities.
ThenumberofAPAsecuritiesissuedduringthefinancialyear,andthenumberofAPAsecuritiesattheendofthefinancialyear,aredisclosedinNote23tothefinancialstatements.
ThevalueofAPA’sassetsasattheendofthefinancialyearisdisclosedinthebalancesheetintotalassets,andthebasisofvaluationisdisclosedinthenotestothefinancialstatements.
ROUNDING OF AMOUNTSAPAisanentityofthekindreferredtoinASICClassOrder98/0100dated10July1998and,inaccordancewiththatClassOrder,amountsintheDirectors’reportandthefinancialreportareroundedtothenearestthousanddollars,unlessotherwiseindicated.
CORPORATE GOVERNANCE STATEMENTCorporateGovernanceStatementforthefinancialyearisavailableatAPA’swebsiteonhttp://www.apa.com.au/about-apa/corporate-governance.aspx.
SignedinaccordancewitharesolutionoftheDirectorsoftheResponsibleEntitymadepursuanttosection298(2)oftheCorporations Act 2001.
OnbehalfoftheDirectors
LeonardBleaselAM RobertWrightChairman Director
Sydney,26August2015
For
per
sona
l use
onl
y

23APA Group | Annual Report 2015
AUSTRALIANPIPELINETRUSTANDITSCONTROLLEDENTITIES
REMUNERATION REPORTfortheyearended30June2015
LETTER FROM THE CHAIRMAN OF THE REMUNERATION COMMITTEE
DearSecurityholders,
OnbehalfoftheBoardandtheRemunerationCommittee,IampleasedtopresentAPA’sRemunerationReportforthefinancialyearended30June2015.
FY2015wasayearofstrongperformanceforsecurityholders,withAPAcontinuingtodeliversuperiormarketreturnsandfurtherstrengthenthebalancesheet.FY2015sawasuccessfulmajoracquisition,expansioninassetsthroughmajorcapitalworks,businessandtechnologyimprovements,improvedsafetyperformance,averagecontractdurationextensionsandexcellentfinancialreturns.
Changes to executive remuneration framework
Asflaggedinlastyear’sreport,forthisyearthemeasurementperiodfortotalsecurityholderreturn(“TSR”)inthelongtermincentive(“LTI”)planwasextendedtothreeyears,tomorecloselyreflectthelong-termnatureofAPA’sbusinesscycle.Inaddition,TotalFixedRemuneration(“TFR”)fortheCEO/MDandSeniorExecutiveshasincreasedthisyearasafunctionofAPA’scontinuedsignificantgrowthinsizerelativetootherAustralianStockExchange(ASX)listedcompanies.AspartofourconservativemanagementofTFRandtomaintainamarketcompetitiveremunerationpackage,APA’positioningpolicyisfortheTFRquantumtobeatleastthemedianagainstcomparableASXlistedcompanies.
InordertoensureourexecutiveremunerationstructureisalignedwithAPA’sstrategicoutlookandremainsmarketcompetitive,theBoardhasundertakenanindependentremunerationframeworkreview.Overall,weconcludedtheframeworkisalignedwithourbusinessstrategyandmodelbutthatthefollowingimprovementswouldbeimplemented.TheBoardapprovedtheintroductionofaminimumsecurityholdingpolicyfortheChiefExecutiveOfficerandManagingDirector(“CEO/MD”),SeniorExecutivesandalltheotherparticipantsoftheLTIplan.InadditiontheBoardhasapprovedtheextensionoftheperformancemeasurementperiodofnormalisedEarningsBeforeInterest,Tax,DepreciationandAmortisationdividedbyFundsEmployed(“EBITDA/FE”)fortheLTIplantothreeyears(tobeeffectivefromFY2016),tostrengthenthealignmentofmanagementandsecurityholderinterests.Formoreinformationonourexecutiveremunerationframeworkandhowitsupportssecurityholdervalue,pleaseseesection3ofthisreport.
This year’s remuneration report
TheBoardiscommittedtotransparencyandstronggovernance.Werecogniseandwelcomesecurityholders’ interestinAPA,includingunderstandingourremunerationstrategyandoutcomes.Thisyear,wehavesubstantiallyupdatedandexpandedourremunerationreporttoprovideinformationwebelievesecurityholdersneedtomakeinformeddecisions.While,asaregisteredmanagedinvestmentschemelistedontheASX,APAisnotcoveredbytheremunerationreportingrequirementsoftheCorporations Act 2001,wehavefollowedasimilarformat,aswerecognisethiswillbefamiliarandunderstandabletomanyofoursecurityholders.Wealsopresentremunerationinformationonanaccrualbasisratherthanapaidbasis,tobetterallowsecurityholderstoreconcileamountsawardedfortheperiodwithAPA’sperformanceintheperiod.
Wewelcomeyourfeedbackonthereportanditscontents,andlookforwardtoyourattendanceatourFY2015AnnualGeneralMeeting.
JohnFletcherChairman of the Remuneration Committee
For
per
sona
l use
onl
y
24 APA Group | Annual Report 2015
AUSTRALIAN PIPELINE TRUST AND ITS CONTROLLED ENTITIES
REMUNERATION REPORT CONTINUEDfor the year ended 30 June 2015
Topic Pagenumber
1.Whatthisreportcovers 24
2.RemunerationoutcomesandAPAperformance 24
3.Executiveremunerationarrangements 28
4.Executivecontracts 31
5.Remunerationgovernance 31
6.Non-executivedirectorarrangements 31
7.Additionalkeymanagementpersonneldisclosures 32
1. What this report covers
Thisreportdetailstheremunerationarrangementsfornon-executiveDirectorsincludingtheKeyManagementPersonnel(“KMP”)listedbelow.Thesearethepeoplewithauthorityandresponsibilityforplanning,directingandcontrollingthemajoractivitiesofAPA,directlyorindirectly,includingbothnon-executiveDirectorsandexecutives(executiveDirectorandseniorexecutives).
Name Role Durationofappointment
I) Non-executivedirectors
Leonard Bleasel AM ChairmanofAPAGroup Fullyear
Steven Crane MemberofAuditandRiskManagementCommitteeandRemunerationCommittee Fullyear
John Fletcher ChairmanofRemunerationCommitteeandmemberofAuditandRiskManagementCommittee Fullyear
Russell Higgins AO ChairmanofHealthSafetyandEnvironmentCommitteeandmemberofAuditand FullyearRiskManagementCommittee
Patricia McKenzie MemberofHealthSafetyandEnvironmentCommitteeandRemunerationCommittee Fullyear
Robert Wright ChairmanofAuditandRiskManagementCommitteeandmemberofHealthSafetyand FullyearEnvironmentCommittee
II) Executivedirector
Michael McCormack ChiefExecutiveOfficerandManagingDirector(“CEO/MD”) Fullyear
III) Seniorexecutives
Peter Fredricson ChiefFinancialOfficer(“CFO”) Fullyear
Ross Gersbach ChiefExecutiveStrategyandDevelopment Fullyear
Robert Wheals GroupExecutiveTransmission Fullyear
John Ferguson GroupExecutiveNetworks Fullyear
Kevin Lester GroupExecutiveInfrastructureDevelopment Fullyear
Mark Knapman CompanySecretary Fullyear
Peter Wallace GroupExecutiveHumanResources Fullyear
Thenamedpersonsheldtheircurrentpositionsforthewholeofthefinancialyear.TherehavebeennochangestoKMPbetweentheendofthefinancialyearandthedatethisreportwasauthorisedforissue.
2. Remuneration outcomes and APA performance
OneofthekeyfactorsindeterminingtheremunerationpositionofAPAexecutivesismarketrelativity,andwithinAustralia,rankingontheASX200onmarketcapitalisationisthemostcommonlyusedbenchmark.APAGrouphasdeliveredstrongshareholdingreturns,soundfinancialperformanceandsignificantorganisationalgrowthyearonyear.This,togetherwiththeBoard’sdesiretoattractandretainafirstclassmanagementteam,hasdrivencommensurategrowthinremunerationlevelsinAPA.
APA MARKET CAPITALISATION RANK AGAINST ASX200
10
60
40
20
80
70
50
30
90
FY11FY10
90th
75th
60th
46th 48th
34th
FY12 FY13 FY14 FY15
100
For
per
sona
l use
onl
y

25APA Group | Annual Report 2015
AUSTRALIAN PIPELINE TRUST AND ITS CONTROLLED ENTITIES
REMUNERATION REPORT CONTINUEDfor the year ended 30 June 2015
2.1 ExecutiveremunerationawardedFY2015Aspartofourcommitmenttogreatertransparencyandtobetterreflectthepayforperformancerelationship,thetablebelowsetsoutremunerationearnedbyAPAExecutivesinFY2015andFY2014onanaccrualbasisfortheperiodratherthanremunerationreceivedduringtheperiod.Forinstance,ShortTermIncentive(“STI”)valuesinthetablebelowreflectSTIearnedinFY2015butareduetobepaidinthenextfinancialyear.ThisdiffersfromAPA’sapproachintheFY2014remunerationreportwhereSTIreflectedcashpaidinFY2014(i.e.September2014),butearnedinFY2013.
Awarded Awarded inFY2015 in FY2014
TotalFixed Remuneration Awarded Allocated (“TFR”) STI1 LTI2 Other3 Total TotalExecutiveDirectorandSeniorExecutives $ $ $ $ $ $
Michael McCormack
CEO/MD 1,535,000 1,609,447 1,647,727 – 4,792,174 3,857,979
Peter Fredricson
CFO 780,000 561,600 559,650 202,000 2,103,250 1,823,444
Ross Gersbach
ChiefExecutiveStrategyandDevelopment 823,000 589,844 590,503 228,666 2,232,013 1,875,835
Robert Wheals
GroupExecutiveTransmission 590,000 408,162 423,325 – 1,421,487 1,125,803
John Ferguson
GroupExecutiveNetworks 524,000 361,560 375,970 – 1,261,530 1,031,199
Kevin Lester
GroupExecutiveInfrastructureDevelopment 479,000 311,757 343,683 – 1,134,440 878,714
Mark Knapman
CompanySecretary 509,000 260,406 264,461 – 1,033,867 872,659
Peter Wallace
GroupExecutiveHumanResources 532,000 361,893 381,710 – 1,275,603 967,288
5,772,000 4,464,669 4,587,029 430,666 15,254,364 12,432,921
1) AwardedSTIrepresentstheamountsearnedbytheexecutivesduringthereportingperiodandareduetobepaidinSeptember2015astheyaredependentonapprovalbytheBoardandhavingthesignedauditedannualaccounts.
2)AllocatedLTIrepresentsthevalueofreferenceunitsthatwereearnedbytheexecutivesduringthereportingperiod.ReferenceunitswillbeallocatedinAugust2015astheyaredependentontheapprovalbytheBoardandthereleaseofAPAGroup’sannualresultstotheASX.
3)OtherrepresentsthelastpaymentofaloyaltyandperformancebonusmadetoPeterFredricsonandRossGersbach.Thebonuswaspaidoutinthreeannualcashinstalments(commencinginApril2012)withthelastpaymentmadeinApril2015(seesection4forfurtherdetail).
2.2 APAperformanceandincentiveplanoutcomesFY2015StrongperformanceagainstallmajormetricshasbeenachievedagaininFY2015.TheGroup’ssuperiorperformanceledtostrongat-riskremunerationoutcomes.MoredetailonthelinkbetweenAPAperformanceandexecutiveremunerationoutcomesisprovidedbelow.
Five year snapshot of APA performanceThefollowingtableprovidesasummaryofAPA’sfinancialperformanceoverthelastfivefinancialyears.IncludedbelowarefinancialmetricsrelatedtoincentiveplanperformancemeasuresandadditionaldisclosuresreflectingAPA’searningsandhowthisimpactssecurityholderreturns.
Yearended30June FY2015 FY2014 FY2013 1 FY2012 FY2011
EBITDAbeforesignificantitems($m) 822.3 747.3 661.9 535.5 489.6
Profitafterincometaxandnon-controllinginterestsaftersignificantitems($m) 559.9 343.7 295.1 130.7 108.5
OCFPSbeforesignificantitems(cents)2 54.8 50.8 56.0 52.5 52.6
Earningspersecurity–reported(cents)2 56.3 39.7 38.2 20.4 19.7
Distributionpersecurity(cents) 38.0 36.3 35.5 35.0 34.4
Closingsecuritypriceat30June($) 8.24 6.89 5.99 4.99 4.07
1) ThebalancesforFY2013havebeenrestatedfortheeffectofapplyingaccountingstandardAASB 119: Employee Benefits.
2)APAissuednewordinarysecuritiesbetween23December2014and28January2015.Theissuewasofferedat$6.60persecurity,adiscounttoAPA’sclosingmarketpriceof$7.67persecurityon9December2014,thelasttradingdaybeforetherecorddateoftheentitlementofferof15December2014.Thenumberofsecuritiesforthecurrentandpriorperiod(FY2014)hasbeenadjustedinaccordancewiththeaccountingprinciplesofAASB 133: Earnings per share followingthediscountedrightsissue.
For
per
sona
l use
onl
y

26 APA Group | Annual Report 2015
AUSTRALIAN PIPELINE TRUST AND ITS CONTROLLED ENTITIES
REMUNERATION REPORT CONTINUEDfor the year ended 30 June 2015
ThechartbelowillustratesthemovementinAPA’sreturnindexoverthelastfivefinancialyearsagainsttheS&P/ASX100andS&P/ASX200Utilitiesreturnindices.Areturnindexreflectsthetheoreticalgrowthinvalueofasecurityholdingoveraspecifiedperiod,assumingdividendsarere-investedtopurchaseadditionalunitsattheclosingpriceapplicableontheex-distributiondate.
PERCENTAGE CHANGE IN RETURN INDEX FROM BASE
300%
150%
200%
250%
50%
100%
0%
FY11FY10 FY12 FY13 FY14 FY15
(50%)
S&P/ASX200 UtilitiesAPA Group S&P/ASX100
Link between APA performance and awarded STISTIisanannualcash-settledincentivesubjectto12monthfinancialandnon-financialperformance.STIfundingisdependentonnormalisedOCFPS,ameasureoftheaveragecashamountgeneratedbythebusinessforeachstapledsecurityissued(typicallyexcludingsuchthingsassignificantitems).ThismeasureisdirectlylinkedtoAPA’sstrategicgoalofincreasingcashflowsoverthemediumterm.
ExecutivesareawardedanSTIonlyifOCFPSisabovethethresholdlevelofperformancesetbytheBoard.OCFPSthereforeactsasagatewayforawardsundertheSTIplan.OCFPSisalsothemechanismthroughwhichtheaggregateamountavailableforSTIpaymentsislimited,ensuringstrongalignmentbetweenindividualperformanceandAPA’sabilitytopay.
STIawardedissubjecttoExecutivessatisfyingtheirperformanceagainstabalancedscorecardofpre-determinedAPAbusinessunitandpersonalobjectives.
ExecutiveSTIAwarded FY2015 FY2014 FY2013 FY2012 FY2011
ExecutiveAward–Maximum 96.0% 95.0% 95.0% 96.5% 95.0%
ExecutiveAward–Average 92.6% 89.2% 87.2% 90.8% 92.5%
ExecutiveAward–Minimum 86.8% 85.3% 77.0% 77.5% 89.5%
OCFPSPerformanceas%ofOCFPStarget 118.9% 113.1% 117.2% 105.6% 107.6%
ThechartbelowillustrateshowexecutiveSTIoutcomesalignwithperformanceagainstthekeybusinessmetricofOCFPS.
STI PERFORMANCE AND EXECUTIVE AWARDS
140%
110%
80%
FY11 FY12 FY13 FY14 FY15
50%
Executive Award – MaximumExecutive Award – AverageExecutive Award – Minimum
OCFPS Performance as % of OCFPS targetExecutive performance Vs. KPI performance measuresFor
per
sona
l use
onl
y

27APA Group | Annual Report 2015
AUSTRALIAN PIPELINE TRUST AND ITS CONTROLLED ENTITIES
REMUNERATION REPORT CONTINUEDfor the year ended 30 June 2015
STI outcomes during FY2015ForFY2015,theSTIoutcomesforexecutives,asa%ofmaximumopportunity,aresetoutinthetablebelow:
STIearned STIforfeited
Executives % $ % $
MichaelMcCormack 93.2% 1,609,447 6.8% 117,428
PeterFredricson 96.0% 561,600 4.0% 23,400
RossGersbach 95.6% 589,844 4.4% 27,406
RobertWheals 92.2% 408,162 7.8% 34,338
JohnFerguson 92.0% 361,560 8.0% 31,440
KevinLester 86.8% 311,757 13.2% 47,493
MarkKnapman 94.2% 260,406 5.8% 16,033
PeterWallace 90.7% 361,893 9.3% 37,107
Link between APA performance and awarded LTILTIisacash-settledincentivesubjecttotwoAPAmeasures–RelativeTSR(threeyearrollingaverageperformanceagainstS&P/ASX100companies)andEBITDA/FE.
Bothmeasuresareweightedequallyandarelinkedtobuildingsecurityholderwealth.RelativeTSRprovidesthemostdirectmeasureofsecurityholderreturnandreflectsaninvestor’schoicetoinvestinAPAordirectcompetitors.SecuritypricegrowthisunderpinnedbyearningsgrowthandEBITDA/FEisbasedontheintegrityofearningsperformanceagainstfundsemployedwhichprovidesameasureofhowefficientlytheassetsarebeingdeployed.
ThechartbelowpresentsAPA’sTSRperformancerelativetoS&P/ASX100companies(forFY2013andFY2014basedonTSRendofyearrankandforFY2015basedon3yearrollingaverage)andEBITDA/FEasafunctionofimprovementstohistoricalactual.
LTIawardsasapercentageofmaximumopportunity:
EBITDA/FE TSR LTIAllocated
FY2013 100.0% 55.4% 77.7%
FY2014 66.7% 53.2% 59.9%
FY2015 90.8% 100.0% 95.4%
LTI PERFORMANCE AND EXECUTIVE AWARDS
120%
80%
40%
20%
60%
100%
FY13 FY14 FY15
0%
EBITDA/FETSR
as a % of total trancheLTI Allocated
LTI outcomes during FY2015ForFY2015,theLTIoutcomesforexecutivesaresetoutinthetablebelow:
LTIallocated LTIforfeited
Executives $ $
MichaelMcCormack 1,647,727 79,148
PeterFredricson 559,650 25,350
RossGersbach 590,503 26,747
RobertWheals 423,325 19,175
JohnFerguson 375,970 17,030
KevinLester 343,683 15,567
MarkKnapman 264,461 11,978
PeterWallace 381,710 17,290
For
per
sona
l use
onl
y

28 APA Group | Annual Report 2015
AUSTRALIAN PIPELINE TRUST AND ITS CONTROLLED ENTITIES
REMUNERATION REPORT CONTINUEDfor the year ended 30 June 2015
3. Executive remuneration arrangements
3.1 Alignmentofremunerationstrategywithbusinessstrategy
VISIONMaintainourrankingasAustralia’snumberoneenergyinfrastructurebusiness
Enhanceourportfolioofgasinfrastructure
—DesignedtofurtheraligntheinterestsoftheExecutiveswiththelong-terminterestsofthesecurityholdersandtoensureexcessiverisk-takingisnotrewarded.
—TheBoardatitsdiscretionmayrequireExecutivestorepaysomeorallofanySTIorLTIawarded,forfeitunvestedLTIand/orforgofutureSTIorLTIawardsifAPA’sfinancialresultshavebeenmisstatedduringtheprecedingthreefinancialyearsandthemisstatementmayhaveimpactedincentiveplanoutcomes.
—AligningExecutivestosecurityholdersthroughanequity-basedincentiveprogramisnotpracticableforAPAduetoourstapledtruststructureandtheConstitution.APArecognisesthebenefitofitsExecutivesholdingsecuritiesinAPA.Asaresult,tofurtheralignExecutiveinterestswiththoseofsecurityholders,inFY16,theBoardhasintroducedaminimumsecurityholdingrequirement.
—ThepolicyrequirestheCEO/MDtohaveadirectsecurityholdinginAPAequaltoatleast100%ofTFR.SeniorexecutivesarerequiredtohaveadirectsecurityholdinginAPAequaltoatleast50%ofTFR.
—CurrentExecutiveswillhavefiveyearstomeettherequirementandnewExecutives(appointedtoofficeafter1July2015)willhavethreeyearsfollowingappointmenttomeettherequirement.
Attractandretainkeytalent
—Reflectmarketvalue,individual’sskillsandexperience.
—Consistsofbasesalary,non-monetarybenefitsandsuperannuation.
—Referencemarketmedianagainstacomparablesetofcompanies.
—Rewardperformanceagainstspecificbusinessobjectives(linkedtokeymeasuresofsuccess).
—Cash-basedincentive,subjecttoannualfinancialandnon-financialperformance.
—OnlypayableiftargetOCFPSisachieved.
—Clawbackappliesforthreeyears.
—Rewardexecutivesforcreatingsecurityholdervalue.
—Allocationsofreferenceunits(settledincash).
—TSRagainstS&P/ASX100companiesandEBITDA/FEperformancemeasures.
—Tranchevestingoverfouryearperformanceperiod.
—Clawbackappliesforthreeyears.
—ClawbackappliestounvestedLTIawards.
Motivateandrewardexecutivesforsuperiorperformance
Marketcompetitiveremuneration(PositionTFR/TPOatmarketmedian)
Alignwithsecurityholderinterests
AlignwithAPAbusinessmodel&organisationalimperatives
Complywithlegalrequirementsandappropriategovernancestandards
Capturerevenueandoperationalsynergies
Facilitatethedevelopmentofgasrelatedprojects
Pursueopportunitieswhichleverageourknowledgeandskillsbase
Strengthenourfinancialcapability
KEY MEASURES OF SUCCESS
REMUNERATION GOVERNANCE
EXECUTIVEREMUNERATIONCLAWBACKPOLICY
MINIMUMSECURITYHOLDINGPOLICY
REMUNERATION OBJECTIVES
TOTAL PACKAGE OPPORTUNITY (“TPO”)
TFR STI LTI
For
per
sona
l use
onl
y
29APA Group | Annual Report 2015
AUSTRALIAN PIPELINE TRUST AND ITS CONTROLLED ENTITIES
REMUNERATION REPORT CONTINUEDfor the year ended 30 June 2015
3.2 ChangestotheexecutiveremunerationframeworkduringFY2015Asnotedinlastyear’sreport,themeasurementperiodforTSRinthelongtermincentiveplanwasextendedtothreeyearsinFY2015,tomorecloselyreflectthelong-termperformanceofAPA.TheBoardhasalsoapprovedtheintroductionofaminimumsecurityholdingpolicyandtheextensionoftheEBITDA/FEperformancemeasurementperiodtothreeyears(tobeeffectivefromFY2016),tostrengthenthealignmentofmanagementandsecurityholderinterests.
3.3 ApproachtosettingremunerationEachexecutive’sTPOisdependentontheirroleintheorganisationandtheircapacitytoinfluenceoutcomes.APA’sexecutiveremunerationisstructuredasamixoffixedremunerationand‘atrisk’components(STIandLTI).Theequalemphasisonshortandlong-termperformance(i.e.,throughSTIandLTIawards)ensuresexecutivesareapproximatelyrewardedfordeliveringsustainedAPAperformance.Theproportionoffixedversus‘atrisk’remunerationvariesbetweenroleswithinAPA,reflectingthedifferentcapacityofexecutivestoinfluenceAPA’soperationalperformanceandreturnstosecurityholders.
CEO/MD
TFR as a % of TPO Target STI as a % of TPO Target LTI as a % of TPO
Senior Executives
Company Secretary
40%
50%
58%
30%
25%
21%
30%
25%
21%
3.4 RemunerationComponentsTFRTFRisreviewedannuallyandisdeterminedbyreferencetoindependentexternalremunerationbenchmarkinginformation,takingintoaccountanindividual’sresponsibilities,performance,qualificationsandexperience.APA’spolicyistopositionTFRatleastthemedianagainstcomparableASXlistedcompanies.
STIThetablebelowsetsoutthekeyelementsoftheexecutiveSTIplan.
STIplanelement Description
STI opportunity STIopportunityisexpressedasapercentageofTPOandvariesbyrole.
TargetSTIopportunitiesaresetoutinthetablebelow.MaximumSTIis150%oftargetSTIopportunity.
Participant Target STI as a % of TPO
CEO/MD 30%
SeniorExecutives 25%
CompanySecretary 21%
Performance gateway OCFPSactsasagatewayforawardsundertheSTIplan.STIopportunityisonlyrealisableiftheOCFPSthresholdlevelofperformancesetbytheBoardismet(i.e.,the“gateopens”).
Plan funding ProvidedtheOCFPSthresholdismet,theSTIopportunityavailablemaybemodifiedbasedonthelevelofOCFPSperformanceachieved.
Performance measures Oncethe“gateopens”andisfunded,STIawardsaresubjecttoperformanceagainstindividualKPIsbasedonabalancedscorecardofAPA-wide,businessunitandpersonalobjectivescovering:
— Financial measures:costcontrol,revenueandcashgenerationandcapitalexpendituremanagement.
— Non-financial measures:health,safetyandenvironmenttargets,projectdeliveryandreinforcementofourethicalandvalues-basedculture.
Timing and delivery AllSTIawardsarepaidincash,usuallyinSeptemberofthenewfinancialyear,followingthecompletionoftheauditofannualaccounts.
Clawback TheBoardinitsdiscretionmaydeterminethatsome,orall,ofanexecutive’sSTIawardisforfeitedintheeventofmisconductorofamaterialmisstatementintheyearendaccountsintheprecedingthreeyears.
Cessation of employment Ifaparticipantresignsorisdismissed(withorwithoutnotice),allunvestedSTIawardsareforfeited.Ifanemployeeleavesforanyotherreason,anSTIawardwillbepaidoutbasedontheproportionoftheperiodthathaspassedandperformanceatthetimeofcessation(subjecttoBoarddiscretion).
Change of control Ifachangeofcontroloccurs,anSTIawardwillbepaidoutbasedontheproportionoftheperiodthathaspassedatthetimeofchangeofcontrol(subjecttoBoarddiscretion).For
per
sona
l use
onl
y

30 APA Group | Annual Report 2015
AUSTRALIAN PIPELINE TRUST AND ITS CONTROLLED ENTITIES
REMUNERATION REPORT CONTINUEDfor the year ended 30 June 2015
LTIThetablebelowsetsoutthekeyelementsoftheexecutiveLTIplan.
LTIplanelement Description
Award vehicle AsastapledsecurityandunderourConstitution,theuseofactualsecuritiesintheLTIplanwouldnotbepracticable.Instead,APAoperatesareferenceunitincentiveplantocreatealignmentwithsecurityholders.
ReferenceunitsexactlymirrortheperformanceofAPAsecuritiesandaresettledincash.Tofurtheralignexecutivesandsecurityholders,APAhasintroducedamandatorysecurityholdingpolicy,effectivefromFY2016,requiringexecutivestoholdasubstantialnumberofsecuritiesinAPA(seepage28forfurtherdetail).
ReferenceUnitsarevaluedatallocationbasedonthe30tradingdayvolumeweightedaveragemarketprice(“VWAP”)ofanAPAsecurityimmediatelypriortotheopeningoftheAPAsecuritytradingwindow.ThewindowfollowstheannouncementofAPA’sannualfinancialresultstotheASX.
LTI opportunity LTIopportunitiesforeachparticipantaresetasapercentageofTPO,varybyroleandareshownonpage29.MaximumLTIis150%oftargetopportunity.
Participant Target LTI as a % of TPO
CEO/MD 30%
Senior Executives 25%
Company Secretary 21%
LTI allocation TheactualindividualLTIallocationisdeterminedatthecompletionofthefinancialyearbasedonTSRperformanceagainsttheS&P/ASX100comparatorgroupandEBITDA/FEperformance.
Performance measures and targets
Awardsaresubjecttotwoequallyweightedmeasures:RelativeTSRandEBITDA/FE.
Relative TSR— TSRmeasuresthepercentagechangeinsecurityprice,plusthevalueofdividendsordistributionsreceivedduringtheperiod,assumingalldividendsanddistributionsarere-investedintonewsecurities.
— APAGroup’sTSRismeasuredrelativetoapeergroupcomprisingofS&P/ASX100constituentsandismeasuredoverthreefinancialyears.
— RelativeTSRhasbeenselectedasanLTIperformancemeasureasitprovidesthemostdirectmeasureofsecurityholderreturnandreflectsaninvestor’schoiceto invest inAPAordirectcompetitors.ExecutivesonlyderivevaluefromtheTSRcomponentoftheLTIplanifAPA’sperformanceisatleastatthemedianofS&P/ASX100companiesoverathreeyearperiod.
EBITDA/FE— EBITDA/FEreflectsEarningsBeforeInterest,Tax,DepreciationandAmortisationdividedbyadjustedFundsEmployed.EBITDA/FEhurdleissetasapercentagegrowthcomparedtobudgetandhasbeensettoreflectimprovementonthepriorfinancialyear.TheBoarddeterminestheEBITDA/FEtargeteachyearthroughtherigorousbudgetsettingprocesstoimprovethecapitalefficiencyoftheorganisation.
— EBITDA/FEhasbeenselectedasanLTIperformancemeasureasithelpsdeterminetheoperatingcashflowleveragebeingachievedbasedontheoperatingassetsavailabletothebusiness.Itisalongertermperformancemeasurebasedontheintegrityofearningsperformanceagainstfundsemployed.
Retesting Thereisnoretestingoftheallocation.
Timing and delivery AnLTIallocationvestsinthreeequalinstalmentsoverthethreefinancialyearsfollowingtheallocation,withtheinitialone-thirdvestingattheendofthefirstfinancialyearfollowingthefirstaward,one-thirdattheendofthesecondfinancialyearandone-thirdattheendofthethirdfinancialyear.
Uponvesting,theLTIisdeliveredincash.Thecashpaymentisequaltothenumberofunitsvestingonthevestingdatemultipliedbythe30tradingdayVWAPofAPAsecuritiesimmediatelypriortotheopeningoftheAPAsecuritytradingwindow,followingtheannouncementofAPA’sannualfinancialresultstotheASX.
FromFY2016,APAwillrequireexecutivestoholdanumberofAPAsecurities.ExecutivesmayapplyvestedLTIamountstothepurchaseofsecuritiestofulfilthesecurityholdingrequirement.
Restrictions LTIallocationsdonotentitleparticipantstovoteatsecurityholdersmeetingsnortobepaiddistributions.NooptionsorotherequityinstrumentsareissuedtoAPAemployeesornon-executivedirectorsundertheLTIplan.
Cessation of employment Ifaparticipantresignsorisdismissed(withorwithoutnotice),allunvestedunitsareforfeited.Ifanemployeeleavesforanyotherreason,theBoarddeterminesthenumberofunitswhichwilllapseorareretained,subjecttovestingontheoriginalschedule.
Change of control Ifachangeofcontroloccurs,allpreviouslyallocatedunitswillvest.Afurthernumberofunitswillbeallocatedbasedontheproportionoftheperiodthathaspassedinthecurrentfinancialyearatthetimeofchangeofcontrolandwillalsovestonchangeofcontrol(subjecttoBoarddiscretion).
For
per
sona
l use
onl
y

31APA Group | Annual Report 2015
AUSTRALIAN PIPELINE TRUST AND ITS CONTROLLED ENTITIES
REMUNERATION REPORT CONTINUEDfor the year ended 30 June 2015
4. Executive contracts
4.1 ContractualarrangementsRemunerationarrangementsforExecutivesareformalisedinindividualemploymentagreements.ThetermsofthecontractualarrangementsforExecutivesaresetoutinthetablebelow:
TerminationentitlementExecutive Contracttype Noticeperiod (withoutcause)
CEO/MD Permanent 12months 52weeksTFR
SeniorExecutives Permanent 6months 13weeksTFR
CompanySecretary Permanent 3months 26weeksTFR
4.2 Retentionarrangements/loyaltyandperformancebonusInreturnforincreasednotice,non-competeandnon-solicitationprovisionsandinregardoftheirroleinthegrowthintegrationandfinancialchallengesfacingAPA,PeterFredricson,RossGersbach,RobertWhealsandJohnFergusonwereofferedaloyaltyandperformancebonuseffectivefromMarch2012(lastingthreeyearsforPeterFredricsonandRossGersbach,andtwoyearsforRobertWhealsandJohnFerguson),withthefirstinstalmentpaidinApril2013andthefinalinstalmentwaspaidinApril2015.TheBoarddoesnotintendtointroduceareplacementtothisbonusscheme.
4.3 Sign-on/terminationpaymentsprovidedtoexecutivesAPAdidnotpayanysign-onorterminationpaymentsduringFY2015.
5. Remuneration governance
5.1 RoleofremunerationcommitteeTheRemunerationCommitteehasbeenestablishedbytheBoardtooverseeExecutiveandNon-executiveDirectorremuneration.TheroleoftheRemunerationCommitteeistoensuretheprovisionofarobustremunerationandrewardsystemthatalignsemployeeandinvestorinterestsandfacilitateseffectiveattraction,retentionanddevelopmentofemployees.TheRemunerationCommittee’sactivitiesaregovernedbyitsCharter(acopyoftheCharterisavailableonAPA’swebsite).
InadditiontomakingrecommendationsregardingAPA’sbroadremunerationstrategyandpolicy(includingdiversitymatters),theRemunerationCommitteeisresponsiblefor:
— RecommendingtheCEO/MD’sperformanceobjectives,remunerationandappointment,retentionandterminationpolicytotheBoard;
— ReviewingandapprovingExecutives’remuneration(basedonrecommendationsfromtheCEO/MD);and
— ReviewingandrecommendingtheRemunerationReporttotheBoard.
5.2 CompositionofremunerationcommitteeThemembersoftheRemunerationCommittee,allofwhomareindependentNon-executiveDirectors,are:
— JohnFletcher(Chairman);
— StevenCrane;and
— PatriciaMcKenzie.
TheChairmanoftheBoardattendsallmeetingsoftheRemunerationCommitteeandtheCEO/MDattendsbyinvitation,wheremanagementinputisrequired.TheRemunerationCommitteemetthreetimesduringtheyear.
5.3 UseofexternaladvisorsTheRemunerationCommitteeseeksexternalprofessionaladvicefromtimetotimeonanymatterwithinitstermsofreference.RemunerationadvisorsareengagedbytheRemunerationCommitteeandreportdirectlytotheCommittee.
DuringFY2015,thefollowingremunerationinformationwasobtainedandconsideredbytheRemunerationCommittee:
— Ernst&Youngprovidedremunerationbenchmarkinginformation,undertookareviewofAPA’sexecutiveremunerationframeworkandassistedwithremunerationgovernance;
— Egan&Associatesprovidedfeeandremunerationbenchmarkinginformationfornon-executivedirectorfeesandcertainmembersoftheexecutiveteam,respectively;and
— OrientCapital(LinkGroup)providedTSRbenchmarkinganalysis.
NoremunerationrecommendationswereprovidedbyanyexternaladvisorsduringFY2015.
6. Non-executive director arrangements
6.1 Determinationofnon-executivedirectorfeesTheBoardseekstoattractandretainhighcalibrenon-executivedirectorswhoareequippedwithdiverseskillstooverseeallfunctionsofAPAinanincreasinglycomplexenvironment.
TheBoarddeterminesBoardfeesandCommitteefeesannually.ItactsonadvicefromtheRemunerationCommitteewhichobtainsexternalbenchmarkinformationfromindependentremunerationspecialists.SuchinformationincludesmarketcomparisonspaidbycomparableS&P/ASX100organisations.
Non-executiveDirectorfeescomprise:
— aBoardfee;
— anadditionalfeeforservingonacommitteeoftheBoard;and
— statutorysuperannuationcontributions.
Non-executiveDirectorsdonotreceiveincentivepaymentsnorparticipateinincentiveplansofanytype.
For
per
sona
l use
onl
y
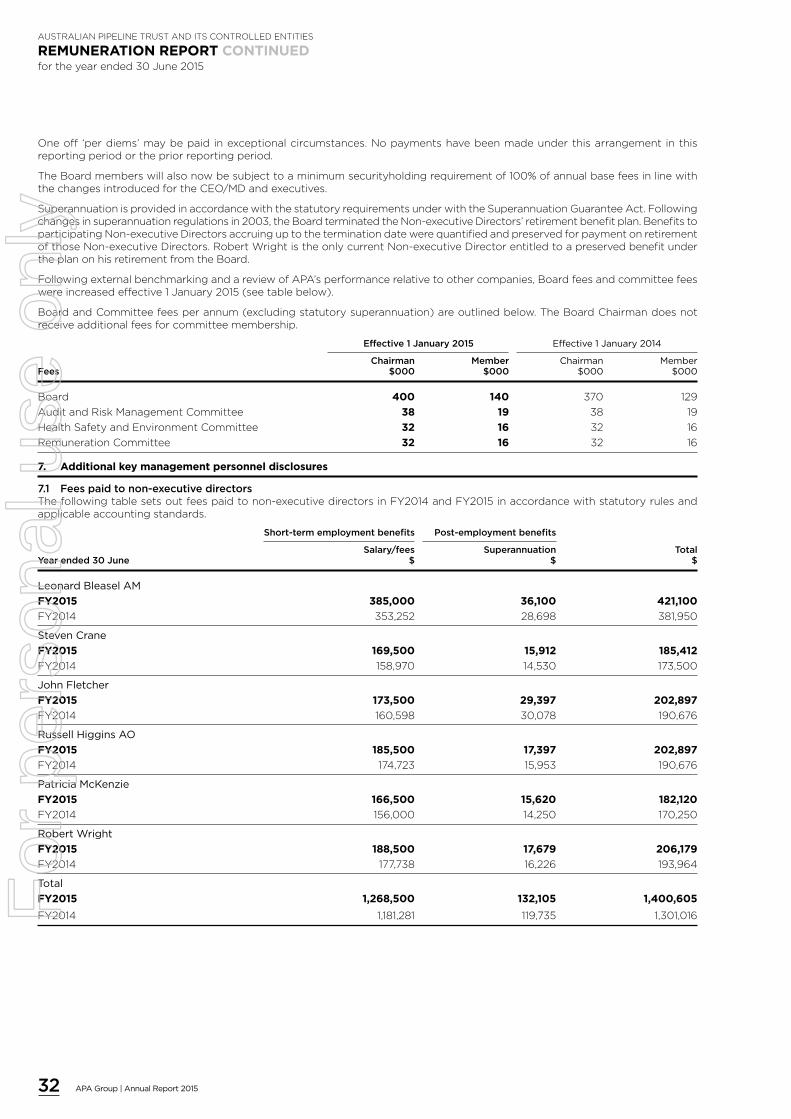
32 APA Group | Annual Report 2015
AUSTRALIAN PIPELINE TRUST AND ITS CONTROLLED ENTITIES
REMUNERATION REPORT CONTINUEDfor the year ended 30 June 2015
Oneoff ‘perdiems’maybepaidinexceptionalcircumstances.Nopaymentshavebeenmadeunderthisarrangementinthisreportingperiodorthepriorreportingperiod.
TheBoardmemberswillalsonowbesubjecttoaminimumsecurityholdingrequirementof100%ofannualbasefeesinlinewiththechangesintroducedfortheCEO/MDandexecutives.
SuperannuationisprovidedinaccordancewiththestatutoryrequirementsunderwiththeSuperannuationGuaranteeAct.Followingchangesinsuperannuationregulationsin2003,theBoardterminatedtheNon-executiveDirectors’retirementbenefitplan.BenefitstoparticipatingNon-executiveDirectorsaccruinguptotheterminationdatewerequantifiedandpreservedforpaymentonretirementofthoseNon-executiveDirectors.RobertWrightistheonlycurrentNon-executiveDirectorentitledtoapreservedbenefitundertheplanonhisretirementfromtheBoard.
FollowingexternalbenchmarkingandareviewofAPA’sperformancerelativetoothercompanies,Boardfeesandcommitteefeeswereincreasedeffective1January2015(seetablebelow).
BoardandCommitteefeesperannum(excludingstatutorysuperannuation)areoutlinedbelow.TheBoardChairmandoesnotreceiveadditionalfeesforcommitteemembership.
Effective1January2015 Effective 1 January 2014
Chairman Member Chairman MemberFees $000 $000 $000 $000
Board 400 140 370 129
AuditandRiskManagementCommittee 38 19 38 19
HealthSafetyandEnvironmentCommittee 32 16 32 16
RemunerationCommittee 32 16 32 16
7. Additional key management personnel disclosures
7.1 Feespaidtonon-executivedirectorsThefollowingtablesetsoutfeespaidtonon-executivedirectorsinFY2014andFY2015inaccordancewithstatutoryrulesandapplicableaccountingstandards.
Short-termemploymentbenefits Post-employmentbenefits
Salary/fees Superannuation TotalYearended30June $ $ $
Leonard Bleasel AM
FY2015 385,000 36,100 421,100
FY2014 353,252 28,698 381,950
Steven Crane
FY2015 169,500 15,912 185,412
FY2014 158,970 14,530 173,500
John Fletcher
FY2015 173,500 29,397 202,897
FY2014 160,598 30,078 190,676
Russell Higgins AO
FY2015 185,500 17,397 202,897
FY2014 174,723 15,953 190,676
Patricia McKenzie
FY2015 166,500 15,620 182,120
FY2014 156,000 14,250 170,250
Robert Wright
FY2015 188,500 17,679 206,179
FY2014 177,738 16,226 193,964
Total
FY2015 1,268,500 132,105 1,400,605
FY2014 1,181,281 119,735 1,301,016For
per
sona
l use
onl
y

33APA Group | Annual Report 2015
AUSTRALIAN PIPELINE TRUST AND ITS CONTROLLED ENTITIES
REMUNERATION REPORT CONTINUEDfor the year ended 30 June 2015
7.2 TotalremunerationearnedandreceivedbyexecutivesThefollowingtableoutlinesthetotalremunerationearnedandreceivedbyexecutivesduringFY2014andFY2015,calculatedinaccordancewithapplicableaccountingstandards.
Post- Short-TermEmploymentBenefits Employment LTIPlans
Security-Based Other Salary/Fees STI Non-Monetary Superannuation Payments1 Payments2 TotalYearended30June $ $ $ $ $ $ $
Michael McCormack
FY2015 1,500,000 1,609,447 – 35,000 1,564,212 – 4,708,659
FY2014 1,405,000 1,463,962 – 25,000 1,301,316 – 4,195,278
Peter Fredricson
FY2015 745,000 561,600 – 35,000 570,885 202,000 2,114,485
FY2014 725,000 534,375 – 25,000 501,596 202,000 1,987,971
Ross Gersbach
FY2015 792,295 589,844 11,922 18,783 622,328 228,666 2,263,838
FY2014 761,303 512,595 11,922 17,775 558,598 228,667 2,090,860
Robert Wheals
FY2015 560,000 408,162 – 30,000 344,570 – 1,342,732
FY2014 475,000 341,090 – 25,000 251,563 60,000 1,152,653
John Ferguson
FY2015 489,000 361,560 – 35,000 318,204 – 1,203,764
FY2014 435,000 304,463 – 25,000 238,352 60,000 1,062,815
Kevin Lester
FY2015 444,000 311,757 – 35,000 215,410 – 1,006,167
FY2014 395,000 269,955 – 25,000 103,441 – 793,396
Mark Knapman
FY2015 474,005 260,406 – 34,995 272,908 – 1,042,314
FY2014 455,000 236,445 – 25,000 245,153 – 961,598
Peter Wallace
FY2015 497,000 361,893 – 35,000 334,123 – 1,228,016
FY2014 438,000 296,204 – 25,000 210,465 – 969,669
Total Remuneration
FY2015 5,501,300 4,464,669 11,922 258,778 4,242,640 430,666 14,909,975
FY2014 5,089,303 3,959,089 11,922 192,775 3,410,484 550,667 13,214,240
1) Cashsettledsecurity-basedpayments.ReferenceunitssubjecttoBoardallocationinAugust2015basedonanestimatedVWAPof$8.7864.
2)OtherpaymentsincludeLoyaltyPaymentinstalments.Referto“Executivecontracts”sectionformoreinformation.
For
per
sona
l use
onl
y

34 APA Group | Annual Report 2015
AUSTRALIAN PIPELINE TRUST AND ITS CONTROLLED ENTITIES
REMUNERATION REPORT CONTINUEDfor the year ended 30 June 2015
7.3 OutstandingLTIawardsThefollowingtablesetsoutthemovementsinthenumberofLTIreferenceunitsandthenumberofLTIreferenceunitsthathavebeenallocatedtoexecutivesbuthavenotyetvestedorbeenpaid,andtheyearsinwhichtheywillvest:
Referenceunitsallocatedthathavenotyetvestedor beenpaidandthefinancialyearsinwhichtheywillvest3
Unitssubjectto Opening Closing allocationby Grantdate balanceat balanceat theBoardinExecutives (financialyear) 1July20141 Allocated Paid 30June2015 August20152 FY20163 FY2017 FY2018 FY2019
Michael McCormack FY2011 69,373 (69,373) – – – – – FY2012 129,749 (63,672) 66,077 66,077 – – – FY2013 182,674 (59,396) 123,278 61,639 61,639 – – FY2014 135,141 135,141 45,047 45,047 45,047 – FY2015 187,530 – 62,510 62,510 62,510
Total 172,763 169,196 107,557 62,510
Peter Fredricson FY2011 28,654 (28,654) – – – – – FY2012 51,643 (25,343) 26,300 26,300 – – – FY2013 66,880 (21,746) 45,134 22,567 22,567 – – FY2014 47,250 47,250 15,750 15,750 15,750 – FY2015 63,693 – 21,231 21,231 21,231
Total 64,617 59,548 36,981 21,231
Ross Gersbach FY2011 32,676 (32,676) – – – – – FY2012 58,461 (28,689) 29,772 29,772 – – – FY2013 73,468 (23,888) 49,580 24,790 24,790 – – FY2014 49,833 49,833 16,611 16,611 16,611 – FY2015 67,206 – 22,402 22,402 22,402
Total 71,173 63,803 39,013 22,402
Robert Wheals FY2011 11,085 (11,085) – – – – – FY2012 22,227 (10,907) 11,320 11,320 – – – FY2013 41,423 (13,469) 27,954 13,977 13,977 – – FY2014 31,500 31,500 10,500 10,500 10,500 – FY2015 48,177 – 16,059 16,059 16,059
Total 35,797 40,536 25,559 16,059
John Ferguson FY2011 10,794 (10,794) – – – – – FY2012 21,712 (10,655) 11,057 11,057 – – – FY2013 38,231 (12,431) 25,800 12,900 12,900 – – FY2014 28,980 28,980 9,660 9,660 9,660 – FY2015 42,789 – 14,263 14,263 14,263
Total 33,617 36,823 23,923 14,263
Kevin Lester FY2013 31,400 (10,210) 21,190 10,595 10,595 – – FY2014 26,460 26,460 8,820 8,820 8,820 – FY2015 39,114 – 13,038 13,038 13,038
Total 19,415 32,453 21,858 13,038
Mark Knapman FY2011 14,561 (14,561) – – – – – FY2012 25,671 (12,598) 13,073 13,073 – – – FY2013 31,515 (10,247) 21,268 10,634 10,634 – FY2014 21,897 21,897 7,299 7,299 7,299 – FY2015 30,096 – 10,032 10,032 10,032
Total 31,006 27,965 17,331 10,032
Peter Wallace FY2011 3,638 (3,638) – – – – – FY2012 26,716 (13,110) 13,606 13,606 – – – FY2013 36,933 (12,009) 24,924 12,462 12,462 – – FY2014 29,166 29,166 9,722 9,722 9,722 – FY2015 43,443 – 14,481 14,481 14,481
Total 35,790 36,665 24,203 14,481
1) Theunitshavebeenadjustedfollowingtheacceleratedrenounceableentitlementoffer.
2)ReferenceunitssubjecttoBoardallocationinAugust2015basedonanestimatedVWAPof$8.7864.
3)Referenceunitsmultipliedby30tradingdaysVWAPtobepaidincashinSeptember2015.
For
per
sona
l use
onl
y
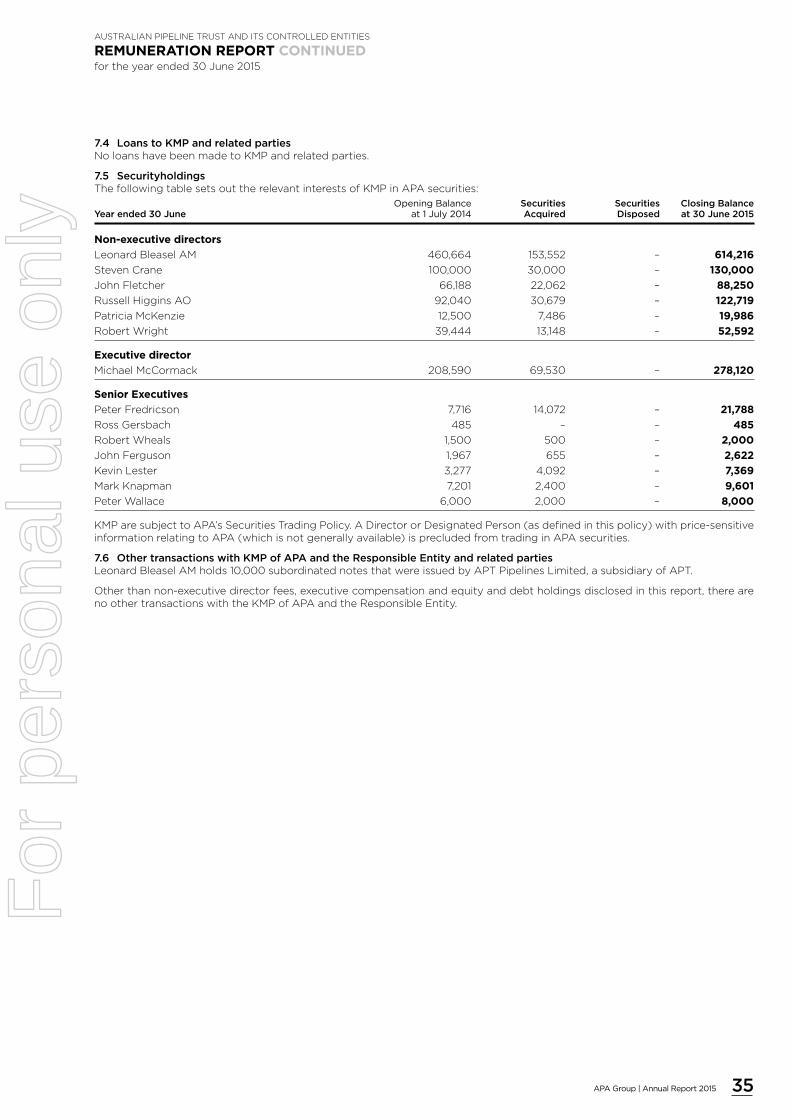
35APA Group | Annual Report 2015
AUSTRALIAN PIPELINE TRUST AND ITS CONTROLLED ENTITIES
REMUNERATION REPORT CONTINUEDfor the year ended 30 June 2015
7.4 LoanstoKMPandrelatedpartiesNoloanshavebeenmadetoKMPandrelatedparties.
7.5 SecurityholdingsThefollowingtablesetsouttherelevantinterestsofKMPinAPAsecurities:
Opening Balance Securities Securities ClosingBalanceYearended30June at 1 July 2014 Acquired Disposed at30June2015
Non-executive directors
LeonardBleaselAM 460,664 153,552 – 614,216
StevenCrane 100,000 30,000 – 130,000
JohnFletcher 66,188 22,062 – 88,250
RussellHigginsAO 92,040 30,679 – 122,719
PatriciaMcKenzie 12,500 7,486 – 19,986
RobertWright 39,444 13,148 – 52,592
Executive director
MichaelMcCormack 208,590 69,530 – 278,120
Senior Executives
PeterFredricson 7,716 14,072 – 21,788
RossGersbach 485 – – 485
RobertWheals 1,500 500 – 2,000
JohnFerguson 1,967 655 – 2,622
KevinLester 3,277 4,092 – 7,369
MarkKnapman 7,201 2,400 – 9,601
PeterWallace 6,000 2,000 – 8,000
KMParesubjecttoAPA’sSecuritiesTradingPolicy.ADirectororDesignatedPerson(asdefinedinthispolicy)withprice-sensitiveinformationrelatingtoAPA(whichisnotgenerallyavailable)isprecludedfromtradinginAPAsecurities.
7.6 OthertransactionswithKMPofAPAandtheResponsibleEntityandrelatedpartiesLeonardBleaselAMholds10,000subordinatednotesthatwereissuedbyAPTPipelinesLimited,asubsidiaryofAPT.
Otherthannon-executivedirectorfees,executivecompensationandequityanddebtholdingsdisclosedinthisreport,therearenoothertransactionswiththeKMPofAPAandtheResponsibleEntity.
For
per
sona
l use
onl
y

36 APA Group | Annual Report 2015
AUSTRALIAN PIPELINE TRUST AND ITS CONTROLLED ENTITIESAUSTRALIANPIPELINETRUSTANDITSCONTROLLEDENTITIES
CONSOLIDATED STATEMENT OF PROFIT OR LOSS AND OTHER COMPREHENSIVE INCOMEForthefinancialyearended30June2015
2015 2014 Note $000 $000
Continuing operations
Revenue 5 1,539,694 1,331,703
Shareofnetprofitsofassociatesandjointventuresusingtheequitymethod 5 13,921 64,289
1,553,615 1,395,992
Netprofitonsaleofequityaccountedinvestment 3 430,039 –
Assetoperationandmanagementexpenses (55,053) (65,570)
Depreciationandamortisationexpense 6 (208,200) (156,228)
Otheroperatingcosts–pass-through 6 (434,382) (403,477)
Financecosts 6 (348,484) (326,226)
Employeebenefitexpense 6 (176,174) (168,615)
Otherexpenses (24,233) (9,854)
Profit before tax 737,128 266,022
Incometax(expense)/benefit 7 (177,198) 77,684
Profit for the year 559,930 343,706
Other comprehensive income, net of income tax
Items that will not be reclassified subsequently to profit or loss:
Actuarialgainondefinedbenefitplan 18,354 6,796
Incometaxrelatingtoitemsthatwillnotbereclassifiedsubsequently (5,506) (2,039)
12,848 4,757
Items that may be reclassified subsequently to profit or loss:
Gain/(loss)onavailable-for-saleinvestmentstakentoequity 2,591 (2,823)
Transferoflossoncashflowhedgestoprofitorloss 68,960 72,522
Lossoncashflowhedgestakentoequity (316,555) (154,309)
Lossonassociatehedgestakentoequity (9,660) (7,928)
Recyclingofreservesondisposalofassociate (19,416) –
Incometaxrelatingtoitemsthatmaybereclassifiedsubsequently 82,520 27,504
(191,560) (65,034)
Othercomprehensiveincomefortheyear(netoftax) (178,712) (60,277)
Total comprehensive income for the year 381,218 283,429
Profit attributable to:
Unitholdersoftheparent 513,581 304,999
Non-controllinginterest–APTInvestmentTrustunitholders 46,348 38,706
APAstapledsecurityholders 559,929 343,705
Non-controllinginterest–other 1 1
559,930 343,706
Total comprehensive income attributable to:
Unitholdersoftheparent 333,880 245,583
Non-controllinginterest–APTInvestmentTrustunitholders 47,337 37,845
APAstapledsecurityholders 381,217 283,428
Non-controllinginterest–other 1 1
381,218 283,429
2014 Earningspersecurity 2015 (Restated)
Basicanddiluted(centspersecurity) 8 56.3 39.7
Theaboveconsolidatedstatementofprofitor lossandothercomprehensiveincomeshouldbereadinconjunctionwiththeaccompanyingnotes.
For
per
sona
l use
onl
y
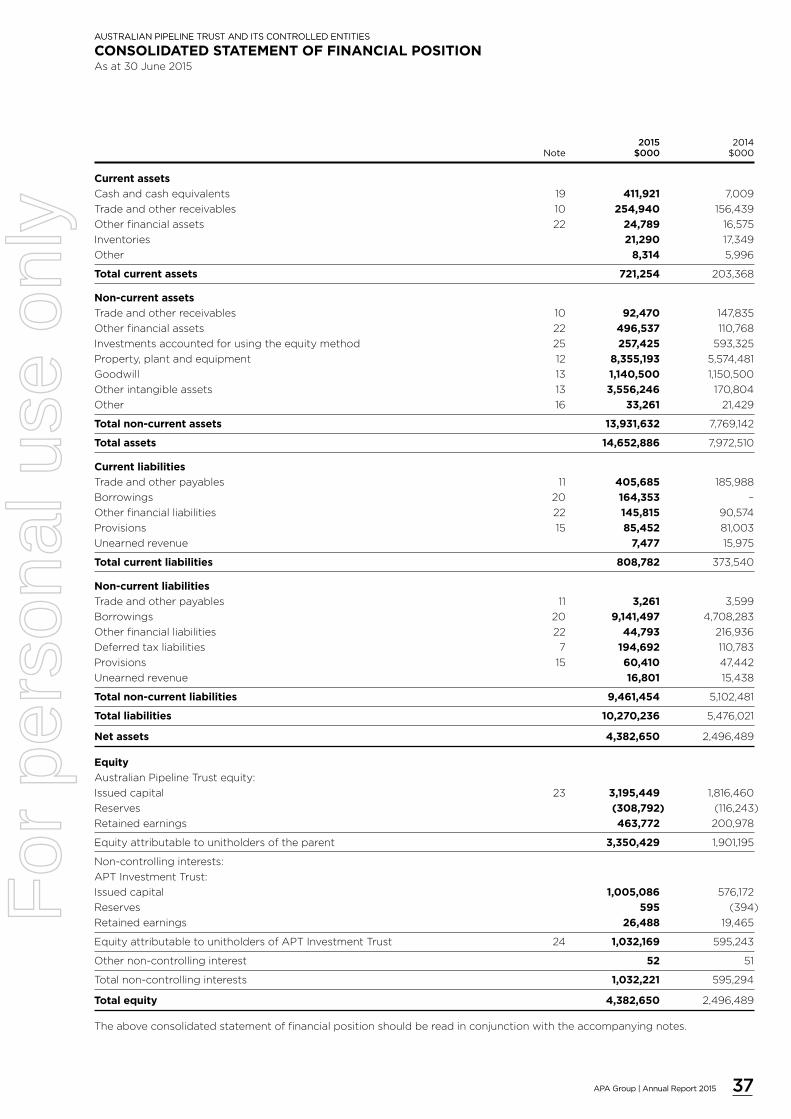
37APA Group | Annual Report 2015
AUSTRALIAN PIPELINE TRUST AND ITS CONTROLLED ENTITIESAUSTRALIANPIPELINETRUSTANDITSCONTROLLEDENTITIES
CONSOLIDATED STATEMENT OF FINANCIAL POSITIONAsat30June2015
2015 2014 Note $000 $000
Current assets
Cashandcashequivalents 19 411,921 7,009
Tradeandotherreceivables 10 254,940 156,439
Otherfinancialassets 22 24,789 16,575
Inventories 21,290 17,349
Other 8,314 5,996
Total current assets 721,254 203,368
Non-current assets
Tradeandotherreceivables 10 92,470 147,835
Otherfinancialassets 22 496,537 110,768
Investmentsaccountedforusingtheequitymethod 25 257,425 593,325
Property,plantandequipment 12 8,355,193 5,574,481
Goodwill 13 1,140,500 1,150,500
Otherintangibleassets 13 3,556,246 170,804
Other 16 33,261 21,429
Total non-current assets 13,931,632 7,769,142
Total assets 14,652,886 7,972,510
Current liabilities
Tradeandotherpayables 11 405,685 185,988
Borrowings 20 164,353 –
Otherfinancialliabilities 22 145,815 90,574
Provisions 15 85,452 81,003
Unearnedrevenue 7,477 15,975
Total current liabilities 808,782 373,540
Non-current liabilities
Tradeandotherpayables 11 3,261 3,599
Borrowings 20 9,141,497 4,708,283
Otherfinancialliabilities 22 44,793 216,936
Deferredtaxliabilities 7 194,692 110,783
Provisions 15 60,410 47,442
Unearnedrevenue 16,801 15,438
Total non-current liabilities 9,461,454 5,102,481
Total liabilities 10,270,236 5,476,021
Net assets 4,382,650 2,496,489
Equity
AustralianPipelineTrustequity:
Issuedcapital 23 3,195,449 1,816,460
Reserves (308,792) (116,243)
Retainedearnings 463,772 200,978
Equityattributabletounitholdersoftheparent 3,350,429 1,901,195
Non-controllinginterests:
APTInvestmentTrust:
Issuedcapital 1,005,086 576,172
Reserves 595 (394)
Retainedearnings 26,488 19,465
EquityattributabletounitholdersofAPTInvestmentTrust 24 1,032,169 595,243
Othernon-controllinginterest 52 51
Totalnon-controllinginterests 1,032,221 595,294
Total equity 4,382,650 2,496,489
Theaboveconsolidatedstatementoffinancialpositionshouldbereadinconjunctionwiththeaccompanyingnotes.
For
per
sona
l use
onl
y

38 APA Group | Annual Report 2015
AU
ST
RA
LIA
NP
IPE
LIN
ET
RU
ST
AN
DIT
SC
ON
TR
OL
LE
DE
NT
ITIE
S
CO
NS
OL
IDA
TE
D S
TAT
EM
EN
T O
F C
HA
NG
ES
IN
EQ
UIT
YF
or
thefi
nan
cia
lyear
en
ded
30
Ju
ne2
015
A
ust
ralian
Pip
elin
eT
rust
A
PT
Invest
men
tTru
st
Oth
er
no
n-c
on
tro
llin
gin
tere
st
A
vaila
ble
-
A
vaila
ble
-
for-
sale
Att
rib
uta
ble
for-
sale
A
sset
Inve
stm
ent
too
wner
Inve
stm
ent
A
PT
O
ther
no
n-
Is
sued
Rev
alu
atio
nR
evalu
atio
n
Hed
gin
g
Reta
ined
o
fth
e
Issu
ed
Rev
alu
atio
n
Reta
ined
Inve
stm
ent
Issu
ed
Reta
ined
co
ntr
olli
ng
Cap
ital
Rese
rve
Rese
rve
Rese
rve
earn
ing
sp
are
nt
Cap
ital
Rese
rve
earn
ing
sTr
ust
C
ap
ital
Oth
er
earn
ing
sin
tere
sts
Tota
l
$0
00
$
00
0
$0
00
$
00
0
$0
00
$
00
0
$0
00
$
00
0
$0
00
$
00
0
$0
00
$
00
0
$0
00
$
00
0
$0
00
Bala
nce
at
1Ju
ly2
013
1,8
20
,516
8
,66
9
1,736
(6
2,4
75)
146
,76
2
1,915
,20
8
578
,78
0
46
7
19,4
24
59
8,6
71
4
14
5
50
2,5
13,9
29
Pro
fit
for
they
ear
––
––
30
4,9
99
30
4,9
99
–
–38
,70
6
38
,70
6
––
11
34
3,7
06
Oth
er
com
pre
hen
sive
in
com
e
––
(1,9
62)
(89
,715
)6
,79
6
(84
,88
1)
–(8
61)
–
(86
1)
––
––
(85,7
42)
Inco
met
axr
ela
tin
gt
o
com
po
nen
tso
fo
ther
co
mp
reh
en
sive
inco
me
––
58
9
26
,915
(2
,039
)25,4
65
––
––
––
––
25,4
65
Tota
lco
mp
reh
en
sive
in
com
ef
or
they
ear
––
(1,3
73)
(62,8
00
)30
9,7
56
24
5,5
83
–(8
61)
38
,70
6
37,
84
5
––
11
28
3,4
29
Pay
men
to
fd
istr
ibu
tio
ns
––
––
(255,5
40
)(2
55,5
40
)–
–(3
8,6
65)
(38
,66
5)
––
––
(29
4,2
05)
Cap
italr
etu
rn
tos
ecu
rity
ho
lders
(4
,056
)–
––
–(4
,056
)(2
,60
8)
––
(2,6
08
)–
––
–(6
,66
4)
Bala
nce
at
30
Ju
ne2
014
1,8
16,4
60
8
,66
9
36
3
(125,2
75)
20
0,9
78
1,9
01,1
95
576
,172
(39
4)
19,4
65
59
5,2
43
4
14
6
51
2,4
96
,48
9
Bala
nce
at
1Ju
ly2
014
1,
816
,46
0
8,6
69
3
63
(1
25
,275
) 2
00
,978
1,
90
1,19
5
576
,172
(3
94
) 19
,46
5
59
5,2
43
4
1
46
5
1 2
,49
6,4
89
Pro
fit
for
they
ear
– –
– –
513
,58
1 5
13,5
81
– –
46
,34
8
46
,34
8
– –
1 1
55
9,9
30
Oth
er
com
pre
hen
sive
in
com
e
– –
1,6
02
(2
76
,67
1)
18,3
54
(2
56
,715
) –
98
9
– 9
89
–
– –
– (2
55
,72
6)
Inco
met
axr
ela
tin
gt
o
com
po
nen
tso
fo
ther
co
mp
reh
en
sive
inco
me
– –
(48
1)
83
,00
1 (5
,50
6)
77,
014
–
– –
– –
– –
– 7
7,0
14
Tota
lco
mp
reh
en
sive
in
com
ef
or
they
ear
– –
1,12
1 (1
93
,670
) 5
26
,42
9
33
3,8
80
–
98
9
46
,34
8
47,
337
–
– 1
1 3
81,
218
Pay
men
to
fd
istr
ibu
tio
ns
– –
– –
(26
3,6
35
) (2
63
,63
5)
– –
(39
,32
5)
(39
,32
5)
– –
– –
(30
2,9
60
)
Secu
riti
es
issu
ed
un
der
en
titl
em
en
to
ffer
1,4
00
,12
2
– –
– –
1,4
00
,12
2
43
8,3
51
– –
43
8,3
51
– –
– –
1,8
38
,473
Issu
ec
ost
of
secu
riti
es
(30
,19
0)
– –
– –
(30
,19
0)
(9,4
37
) –
– (9
,437
) –
– –
– (3
9,6
27
)
Taxr
ela
tin
gt
o
secu
rity
issu
ec
ost
s9
,057
–
– –
– 9
,057
–
– –
– –
– –
– 9
,057
Bala
nce
at
30
Ju
ne
20
153
,19
5,4
49
8
,66
9
1,4
84
(3
18,9
45
) 4
63
,772
3,3
50
,42
9 1
,00
5,0
86
5
95
2
6,4
88
1,
03
2,1
69
4
1
47
5
2
4,3
82
,65
0
Th
ea
bo
vec
on
solid
ate
ds
tate
men
to
fch
an
ges
ine
qu
itys
ho
uld
ber
ead
inc
on
jun
cti
on
wit
ht
hea
cco
mp
anyin
gn
ote
s.
For
per
sona
l use
onl
y

39APA Group | Annual Report 2015
AUSTRALIAN PIPELINE TRUST AND ITS CONTROLLED ENTITIESAUSTRALIANPIPELINETRUSTANDITSCONTROLLEDENTITIES
CONSOLIDATED STATEMENT OF CASH FLOWSForthefinancialyearended30June2015
2015 2014 Note $000 $000
Cash flows from operating activities
Receiptsfromcustomers 1,584,738 1,461,695
Paymentstosuppliersandemployees (827,797) (767,599)
Receiptsof/(paymentsfor)HastingsFundsManagementfees 3 17,201 (8,201)
Dividendsreceived 46,526 61,971
Proceedsfromrepaymentoffinanceleases 4,621 4,693
Interestreceived 30,296 5,965
Interestandothercostsoffinancepaid (293,395) (327,124)
Incometaxrefund – 141
Net cash provided by operating activities 562,190 431,541
Cash flows from investing activities
Paymentsforproperty,plantandequipment (2,814,559) (446,754)
Proceedsfromsaleofproperty,plantandequipment 876 797
Paymentsforequityaccountedinvestments (17,383) –
Paymentsforcontrolledentitiesnetofcashacquired – (24)
Paymentsforotherassets (18,612) –
Paymentsforintangibleassets (3,429,281) (677)
Loansadvancedtorelatedparties (3,490) (126,127)
Proceedsfromsaleofbusiness – 1,487
Proceedsfromsaleoffinanceleaseasset 8,683 –
Proceedsfromsaleofequityaccountedinvestment 783,758 –
Net cash used in investing activities (5,490,008) (571,298)
Cash flows from financing activities
Proceedsfromborrowings 5,279,188 1,585,833
Repaymentsofborrowings (1,429,500) (1,208,915)
Proceedsfromissueofsecurities 1,838,473 –
Paymentofdebtissuecosts (32,398) (10,178)
Paymentsofsecurityissuecosts (39,567) (60)
Proceedsfromearlysettlementofderivatives 19,515 –
Distributionspaidto:
UnitholdersofAPT (263,636) (259,598)
Unitholdersofnon-controllinginterests–APTIT (39,324) (41,271)
Net cash provided by financing activities 5,332,751 65,811
Net decrease in cash and cash equivalents 404,933 (73,946)
Cashandcashequivalentsatbeginningoffinancialyear 7,009 80,955
Unrealisedexchangelossesoncashheld (21) –
Cash and cash equivalents at end of financial year 411,921 7,009
Theaboveconsolidatedstatementofcashflowsshouldbereadinconjunctionwiththeaccompanyingnotes.
A
ust
ralian
Pip
elin
eT
rust
A
PT
Invest
men
tTru
st
Oth
er
no
n-c
on
tro
llin
gin
tere
st
A
vaila
ble
-
A
vaila
ble
-
for-
sale
Att
rib
uta
ble
for-
sale
A
sset
Inve
stm
ent
too
wner
Inve
stm
ent
A
PT
O
ther
no
n-
Is
sued
Rev
alu
atio
nR
evalu
atio
n
Hed
gin
g
Reta
ined
o
fth
e
Issu
ed
Rev
alu
atio
n
Reta
ined
Inve
stm
ent
Issu
ed
Reta
ined
co
ntr
olli
ng
Cap
ital
Rese
rve
Rese
rve
Rese
rve
earn
ing
sp
are
nt
Cap
ital
Rese
rve
earn
ing
sTr
ust
C
ap
ital
Oth
er
earn
ing
sin
tere
sts
Tota
l
$0
00
$
00
0
$0
00
$
00
0
$0
00
$
00
0
$0
00
$
00
0
$0
00
$
00
0
$0
00
$
00
0
$0
00
$
00
0
$0
00
Bala
nce
at
1Ju
ly2
013
1,8
20
,516
8
,66
9
1,736
(6
2,4
75)
146
,76
2
1,915
,20
8
578
,78
0
46
7
19,4
24
59
8,6
71
4
14
5
50
2,5
13,9
29
Pro
fit
for
they
ear
––
––
30
4,9
99
30
4,9
99
–
–38
,70
6
38
,70
6
––
11
34
3,7
06
Oth
er
com
pre
hen
sive
in
com
e
––
(1,9
62)
(89
,715
)6
,79
6
(84
,88
1)
–(8
61)
–
(86
1)
––
––
(85,7
42)
Inco
met
axr
ela
tin
gt
o
com
po
nen
tso
fo
ther
co
mp
reh
en
sive
inco
me
––
58
9
26
,915
(2
,039
)25,4
65
––
––
––
––
25,4
65
Tota
lco
mp
reh
en
sive
in
com
ef
or
they
ear
––
(1,3
73)
(62,8
00
)30
9,7
56
24
5,5
83
–(8
61)
38
,70
6
37,
84
5
––
11
28
3,4
29
Pay
men
to
fd
istr
ibu
tio
ns
––
––
(255,5
40
)(2
55,5
40
)–
–(3
8,6
65)
(38
,66
5)
––
––
(29
4,2
05)
Cap
italr
etu
rn
tos
ecu
rity
ho
lders
(4
,056
)–
––
–(4
,056
)(2
,60
8)
––
(2,6
08
)–
––
–(6
,66
4)
Bala
nce
at
30
Ju
ne2
014
1,8
16,4
60
8
,66
9
36
3
(125,2
75)
20
0,9
78
1,9
01,1
95
576
,172
(39
4)
19,4
65
59
5,2
43
4
14
6
51
2,4
96
,48
9
Bala
nce
at
1Ju
ly2
014
1,
816
,46
0
8,6
69
3
63
(1
25
,275
) 2
00
,978
1,
90
1,19
5
576
,172
(3
94
) 19
,46
5
59
5,2
43
4
1
46
5
1 2
,49
6,4
89
Pro
fit
for
they
ear
– –
– –
513
,58
1 5
13,5
81
– –
46
,34
8
46
,34
8
– –
1 1
55
9,9
30
Oth
er
com
pre
hen
sive
in
com
e
– –
1,6
02
(2
76
,67
1)
18,3
54
(2
56
,715
) –
98
9
– 9
89
–
– –
– (2
55
,72
6)
Inco
met
axr
ela
tin
gt
o
com
po
nen
tso
fo
ther
co
mp
reh
en
sive
inco
me
– –
(48
1)
83
,00
1 (5
,50
6)
77,
014
–
– –
– –
– –
– 7
7,0
14
Tota
lco
mp
reh
en
sive
in
com
ef
or
they
ear
– –
1,12
1 (1
93
,670
) 5
26
,42
9
33
3,8
80
–
98
9
46
,34
8
47,
337
–
– 1
1 3
81,
218
Pay
men
to
fd
istr
ibu
tio
ns
– –
– –
(26
3,6
35
) (2
63
,63
5)
– –
(39
,32
5)
(39
,32
5)
– –
– –
(30
2,9
60
)
Secu
riti
es
issu
ed
un
der
en
titl
em
en
to
ffer
1,4
00
,12
2
– –
– –
1,4
00
,12
2
43
8,3
51
– –
43
8,3
51
– –
– –
1,8
38
,473
Issu
ec
ost
of
secu
riti
es
(30
,19
0)
– –
– –
(30
,19
0)
(9,4
37
) –
– (9
,437
) –
– –
– (3
9,6
27
)
Taxr
ela
tin
gt
o
secu
rity
issu
ec
ost
s9
,057
–
– –
– 9
,057
–
– –
– –
– –
– 9
,057
Bala
nce
at
30
Ju
ne
20
153
,19
5,4
49
8
,66
9
1,4
84
(3
18,9
45
) 4
63
,772
3,3
50
,42
9 1
,00
5,0
86
5
95
2
6,4
88
1,
03
2,1
69
4
1
47
5
2
4,3
82
,65
0
Th
ea
bo
vec
on
solid
ate
ds
tate
men
to
fch
an
ges
ine
qu
itys
ho
uld
ber
ead
inc
on
jun
cti
on
wit
ht
hea
cco
mp
anyin
gn
ote
s.
For
per
sona
l use
onl
y

40 APA Group | Annual Report 2015
AUSTRALIAN PIPELINE TRUST AND ITS CONTROLLED ENTITIESAUSTRALIANPIPELINETRUSTANDITSCONTROLLEDENTITIES
CONSOLIDATED STATEMENT OF CASH FLOWS CONTINUEDForthefinancialyearended30June2015
Reconciliation of profit for the year to the net cash provided by operating activities
2015 2014 Note $000 $000
Profitfortheyear 559,930 343,706
Lossondisposalofproperty,plantandequipment 3,337 115
Profitonsaleoffinanceleaseasset (1,764) –
Shareofnetprofitsofjointventuresandassociatesusingtheequitymethod (13,921) (64,289)
Dividends/distributionsreceivedfromequityaccountedinvestments 45,989 61,418
Netprofitonsaleofequityaccountedinvestment 3 (430,039) –
Depreciationandamortisationexpense 208,200 156,228
Financecosts 21,221 11,142
Unrealisedforeignexchangeloss 35 –
Realisedhedginggains (19,258) –
Changesinassetsandliabilities:
Tradeandotherreceivables (49,880) 5,948
Inventories (3,936) (4,623)
Otherassets (24,725) 4,291
Tradeandotherpayables 65,083 5,962
Provisions 14,725 885
Otherliabilities 9,995 (11,558)
Incometaxbalances 177,198 (77,684)
Net cash provided by operating activities 562,190 431,541
Cashflowsareincludedinthestatementofcashflowsonagrossbasis.TheGSTcomponentofcashflowsarisingfrominvestingandfinancingactivitieswhichisrecoverablefrom,orpayableto,thetaxationauthorityisclassifiedwithinoperatingcashflows.
For
per
sona
l use
onl
y
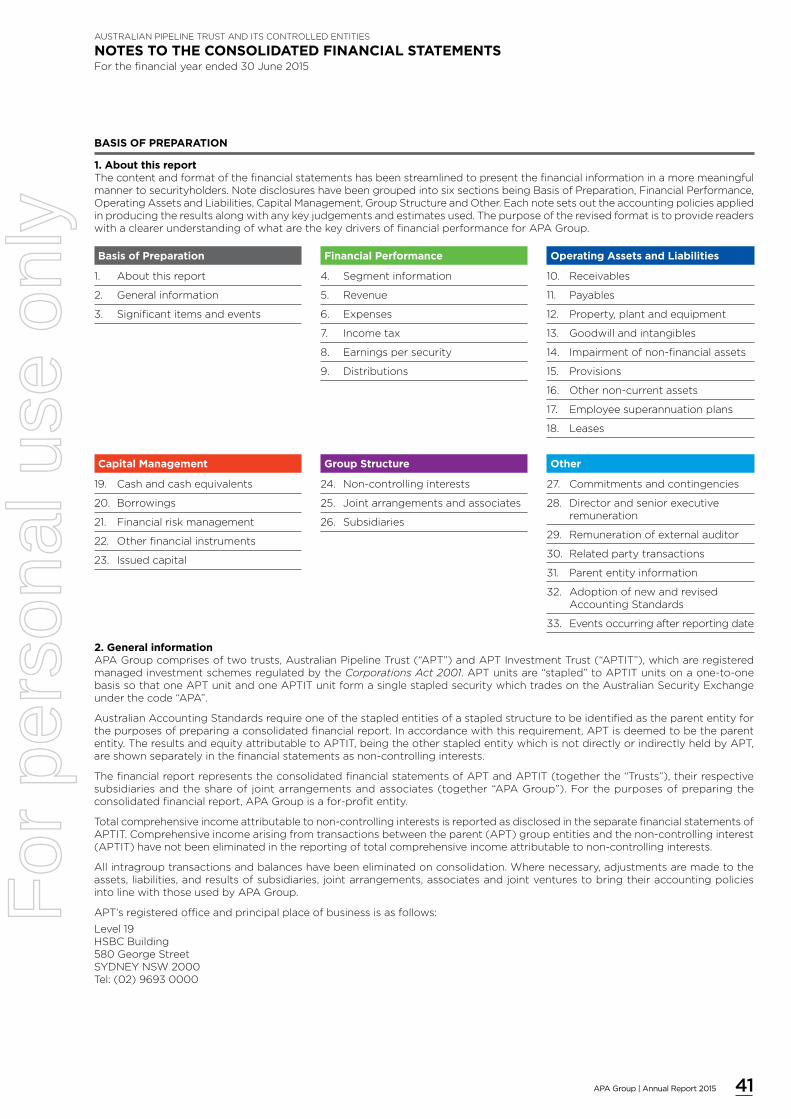
41APA Group | Annual Report 2015
AUSTRALIANPIPELINETRUSTANDITSCONTROLLEDENTITIES
NOTES TO THE CONSOLIDATED FINANCIAL STATEMENTSForthefinancialyearended30June2015
BASIS OF PREPARATION
1. About this reportThecontentandformatofthefinancialstatementshasbeenstreamlinedtopresentthefinancialinformationinamoremeaningfulmannertosecurityholders.NotedisclosureshavebeengroupedintosixsectionsbeingBasisofPreparation,FinancialPerformance,OperatingAssetsandLiabilities,CapitalManagement,GroupStructureandOther.Eachnotesetsouttheaccountingpoliciesappliedinproducingtheresultsalongwithanykeyjudgementsandestimatesused.ThepurposeoftherevisedformatistoprovidereaderswithaclearerunderstandingofwhatarethekeydriversoffinancialperformanceforAPAGroup.
Basis of Preparation
1. Aboutthisreport
2. Generalinformation
3. Significantitemsandevents
Financial Performance
4. Segmentinformation
5. Revenue
6. Expenses
7. Incometax
8. Earningspersecurity
9. Distributions
Operating Assets and Liabilities
10. Receivables
11. Payables
12. Property,plantandequipment
13. Goodwillandintangibles
14. Impairmentofnon-financialassets
15. Provisions
16. Othernon-currentassets
17. Employeesuperannuationplans
18. Leases
Capital Management
19. Cashandcashequivalents
20. Borrowings
21. Financialriskmanagement
22. Otherfinancialinstruments
23. Issuedcapital
Group Structure
24. Non-controllinginterests
25. Jointarrangementsandassociates
26. Subsidiaries
Other
27. Commitmentsandcontingencies
28. Directorandseniorexecutiveremuneration
29. Remunerationofexternalauditor
30. Relatedpartytransactions
31. Parententityinformation
32. AdoptionofnewandrevisedAccountingStandards
33. Eventsoccurringafterreportingdate
2. General informationAPAGroupcomprisesoftwotrusts,AustralianPipelineTrust(“APT”)andAPTInvestmentTrust(“APTIT”),whichareregisteredmanagedinvestmentschemesregulatedbytheCorporations Act 2001.APTunitsare“stapled”toAPTITunitsonaone-to-onebasissothatoneAPTunitandoneAPTITunitformasinglestapledsecuritywhichtradesontheAustralianSecurityExchangeunderthecode“APA”.
AustralianAccountingStandardsrequireoneofthestapledentitiesofastapledstructuretobeidentifiedastheparententityforthepurposesofpreparingaconsolidatedfinancialreport.Inaccordancewiththisrequirement,APTisdeemedtobetheparententity.TheresultsandequityattributabletoAPTIT,beingtheotherstapledentitywhichisnotdirectlyorindirectlyheldbyAPT,areshownseparatelyinthefinancialstatementsasnon-controllinginterests.
ThefinancialreportrepresentstheconsolidatedfinancialstatementsofAPTandAPTIT(togetherthe“Trusts”),theirrespectivesubsidiariesandtheshareof jointarrangementsandassociates(together“APAGroup”).Forthepurposesofpreparingtheconsolidatedfinancialreport,APAGroupisafor-profitentity.
Totalcomprehensiveincomeattributabletonon-controllinginterestsisreportedasdisclosedintheseparatefinancialstatementsofAPTIT.Comprehensiveincomearisingfromtransactionsbetweentheparent(APT)groupentitiesandthenon-controllinginterest(APTIT)havenotbeeneliminatedinthereportingoftotalcomprehensiveincomeattributabletonon-controllinginterests.
Allintragrouptransactionsandbalanceshavebeeneliminatedonconsolidation.Wherenecessary,adjustmentsaremadetotheassets,liabilities,andresultsofsubsidiaries,jointarrangements,associatesandjointventurestobringtheiraccountingpoliciesintolinewiththoseusedbyAPAGroup.
APT’sregisteredofficeandprincipalplaceofbusinessisasfollows:
Level19HSBCBuilding580GeorgeStreetSYDNEYNSW2000Tel:(02)96930000
For
per
sona
l use
onl
y

42 APA Group | Annual Report 2015
AUSTRALIAN PIPELINE TRUST AND ITS CONTROLLED ENTITIES
NOTES TO THE CONSOLIDATED FINANCIAL STATEMENTS CONTINUEDFor the financial year ended 30 June 2015
BASIS OF PREPARATION
2. General information (continued)Theconsolidatedgeneralpurposefinancialreportfortheyearended30June2015wasauthorisedforissueinaccordancewitharesolutionofthedirectorson26August2015.
ThisgeneralpurposefinancialreporthasbeenpreparedinaccordancewiththerequirementsoftheCorporations Act 2001,AustralianAccountingStandardsandotherauthoritativepronouncementsoftheAustralianAccountingStandardsBoard(AIFRS)andalsocomplywithInternationalFinancialReportingStandards(IFRS)asissuedbytheInternationalAccountingStandardsBoard.
Thefinancialreporthasbeenpreparedonthebasisofhistoricalcost,exceptfortherevaluationoffinancialinstruments.ThefinancialreportispresentedinAustraliandollarsandallvaluesareroundedtothenearestthousanddollars($000)inaccordancewithASICClassOrder98/0100,unlessotherwisestated.
WorkingcapitalpositionTheworkingcapitalpositionasat30June2015forAPAGroupisthatcurrentliabilitiesexceedcurrentassetsby$87.5million($170.2millionfor30June2014)primarilyasaresultof$145.8million(AUDequivalent)ofcashflowhedgeliabilities,currentborrowingsof$164.4millionandaccruedtransactioncostsof$137.2million.
APAGrouphasaccesstosufficientavailablecommitted,un-drawnbankfacilitiesof$1,175.0millionasat30June2015($835.5millionfor30June2014).
TheDirectorscontinuallymonitorAPAGroup’sworkingcapitalposition,includingforecastworkingcapitalrequirementsandhaveensuredthatthereareappropriaterefinancingstrategiesandadequatecommittedfundingfacilitiesinplacetoaccommodatedebtrepaymentsasandwhentheyfalldue.
ForeigncurrencytransactionsBoththefunctionalandpresentationcurrencyofAPAGroupandAPTisAustraliandollars(A$).Allforeigncurrencytransactionsduringthefinancialyeararebroughttoaccountusingtheexchangerateineffectatthedateofthetransaction.Foreigncurrencymonetaryitemsatreportingdatearetranslatedattheexchangerateexistingatthatdateandresultingexchangedifferencesarerecognisedinprofitorlossintheperiodinwhichtheyarise,unlesstheyqualifyforhedgeaccounting.
3. Significant items and eventsIndividuallysignificantitemsincludedinprofitafterincometaxexpenseareasfollows:
2015 2014 $000 $000
SignificantitemsimpactingEBITDA
Netprofitonsaleofequityaccountedinvestmenta 430,039 –
RecoveryoffeespaidtoHDFbyHastingsFundsManagementLimitedb 17,201 –
Total significant items impacting EBITDA 447,240 –
Incometaxrelatedtosignificantitemsabove (91,222) –
Incometaxbenefitontaxcostbasestepupc – 144,060
Profit from significant items after income tax 356,018 144,060
a)DuringAugust2014,APAGroupsolditsinvestmentinEnvestraLimitedtoCheungKongGroupconsortiumfor$1.32pershareamountingto$783.8millioningrossproceedswhichrealisedanetpre-taxprofitof$430.0million.
b)InNovember2014,APAGroupsuccessfullyappealedtheNSWSupremeCourtdecisioninamatterregardingperformancefeespreviouslypaidbyHastingsDiversifiedUtilityFund(HDF)toHastingsFundsManagementLimited(HFML).
c)APAGroupmadeaonce-offadjustmenttoitstaxexpensefortheyearended30June2014toreflectachangeinthetreatment,fortaxdepreciationpurposesonly,ofvariouscapitalassets.
AcquisitionoftheWallumbillaGladstonePipelineAPAGroupcompletedtheacquisitionoftheWallumbillaGladstonePipeline(formerlyQCLNGPipeline)on3June2015fromamemberoftheBGGroupforUS$4,596.6million(A$5,834.6million)netofarefundofA$15.2millionreceivedon20July2015,relatingtotheadjustedacquisitionprice.
TheacquisitionwasfundedthroughtheissuanceofUS$3,705millionoffixedratedebt(achievedthroughUSDplacementsandacombinationofGBPandEuroMediumTermNoteplacements,swappedtoUSDthroughcrosscurrencyinterestrateswaps).TheremainderwasfundedbyanacceleratedrenounceableentitlementoffercompletedinJanuary2015whenAPAGroupissued278,556,562newstapledsecuritiesatatotalvalueof$1,807.9million,netoftransactioncosts.
Theacquisitionresultedinanincreaseinproperty,plantandequipmentof$2,562.0million,contractintangiblesof$3,413.8million,linepackgasof$4.0millionandothernetassetsof$18.6million.F
or p
erso
nal u
se o
nly
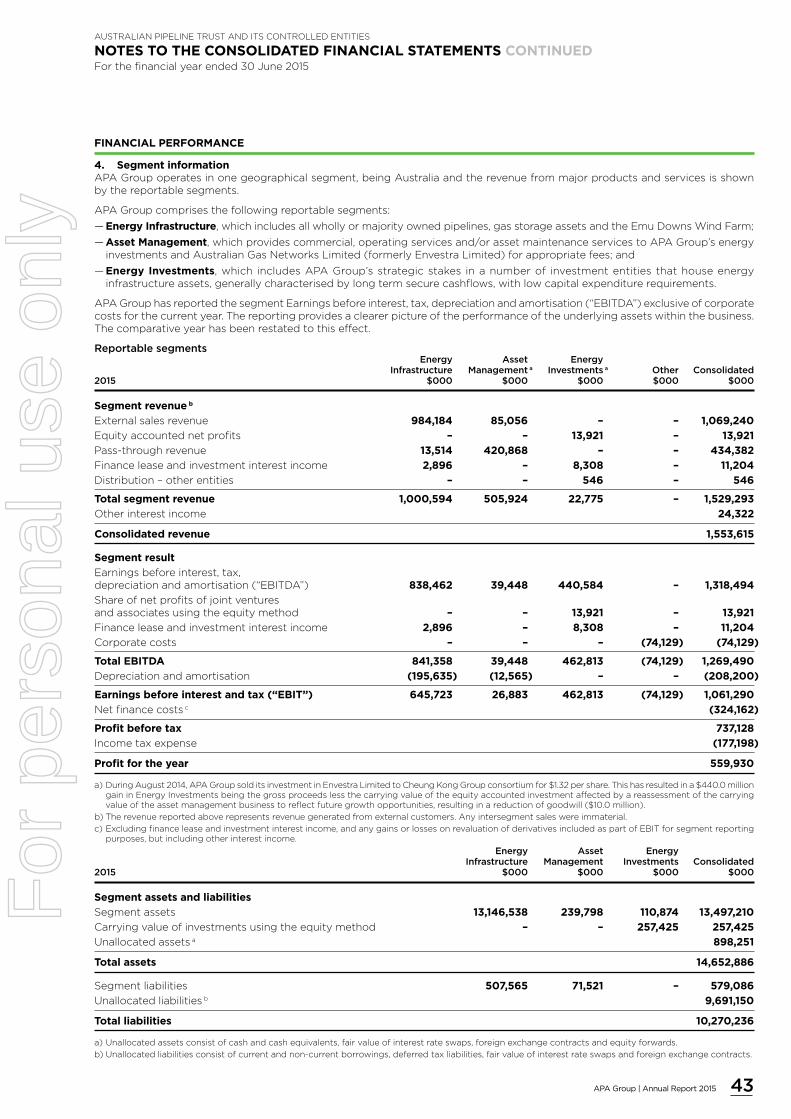
43APA Group | Annual Report 2015
AUSTRALIAN PIPELINE TRUST AND ITS CONTROLLED ENTITIES
NOTES TO THE CONSOLIDATED FINANCIAL STATEMENTS CONTINUEDFor the financial year ended 30 June 2015
FINANCIAL PERFORMANCE
4. Segment informationAPAGroupoperatesinonegeographicalsegment,beingAustraliaandtherevenuefrommajorproductsandservicesisshownbythereportablesegments.
APAGroupcomprisesthefollowingreportablesegments:
— Energy Infrastructure,whichincludesallwhollyormajorityownedpipelines,gasstorageassetsandtheEmuDownsWindFarm;
— Asset Management,whichprovidescommercial,operatingservicesand/orassetmaintenanceservicestoAPAGroup’senergyinvestmentsandAustralianGasNetworksLimited(formerlyEnvestraLimited)forappropriatefees;and
— Energy Investments,which includesAPAGroup’sstrategicstakes inanumberof investmententitiesthathouseenergyinfrastructureassets,generallycharacterisedbylongtermsecurecashflows,withlowcapitalexpenditurerequirements.
APAGrouphasreportedthesegmentEarningsbeforeinterest,tax,depreciationandamortisation(“EBITDA”)exclusiveofcorporatecostsforthecurrentyear.Thereportingprovidesaclearerpictureoftheperformanceoftheunderlyingassetswithinthebusiness.Thecomparativeyearhasbeenrestatedtothiseffect.
Reportablesegments Energy Asset Energy Infrastructure Managementa Investmentsa Other Consolidated2015 $000 $000 $000 $000 $000
Segment revenueb
Externalsalesrevenue 984,184 85,056 – – 1,069,240
Equityaccountednetprofits – – 13,921 – 13,921
Pass-throughrevenue 13,514 420,868 – – 434,382
Financeleaseandinvestmentinterestincome 2,896 – 8,308 – 11,204
Distribution–otherentities – – 546 – 546
Total segment revenue 1,000,594 505,924 22,775 – 1,529,293
Otherinterestincome 24,322
Consolidated revenue 1,553,615
Segment result
Earningsbeforeinterest,tax,depreciationandamortisation(“EBITDA”) 838,462 39,448 440,584 – 1,318,494
Shareofnetprofitsofjointventuresandassociatesusingtheequitymethod – – 13,921 – 13,921
Financeleaseandinvestmentinterestincome 2,896 – 8,308 – 11,204
Corporatecosts – – – (74,129) (74,129)
Total EBITDA 841,358 39,448 462,813 (74,129) 1,269,490
Depreciationandamortisation (195,635) (12,565) – – (208,200)
Earnings before interest and tax (“EBIT”) 645,723 26,883 462,813 (74,129) 1,061,290
Netfinancecostsc (324,162)
Profit before tax 737,128
Incometaxexpense (177,198)
Profit for the year 559,930
a)DuringAugust2014,APAGroupsolditsinvestmentinEnvestraLimitedtoCheungKongGroupconsortiumfor$1.32pershare.Thishasresultedina$440.0milliongaininEnergyInvestmentsbeingthegrossproceedslessthecarryingvalueoftheequityaccountedinvestmentaffectedbyareassessmentofthecarryingvalueoftheassetmanagementbusinesstoreflectfuturegrowthopportunities,resultinginareductionofgoodwill($10.0million).
b)Therevenuereportedaboverepresentsrevenuegeneratedfromexternalcustomers.Anyintersegmentsaleswereimmaterial.
c)Excludingfinanceleaseandinvestmentinterestincome,andanygainsorlossesonrevaluationofderivativesincludedaspartofEBITforsegmentreportingpurposes,butincludingotherinterestincome.
Energy Asset Energy Infrastructure Management Investments Consolidated2015 $000 $000 $000 $000
Segment assets and liabilities
Segmentassets 13,146,538 239,798 110,874 13,497,210
Carryingvalueofinvestmentsusingtheequitymethod – – 257,425 257,425
Unallocatedassetsa 898,251
Total assets 14,652,886
Segmentliabilities 507,565 71,521 – 579,086
Unallocatedliabilitiesb 9,691,150
Total liabilities 10,270,236
a)Unallocatedassetsconsistofcashandcashequivalents,fairvalueofinterestrateswaps,foreignexchangecontractsandequityforwards.
b)Unallocatedliabilitiesconsistofcurrentandnon-currentborrowings,deferredtaxliabilities,fairvalueofinterestrateswapsandforeignexchangecontracts.
For
per
sona
l use
onl
y
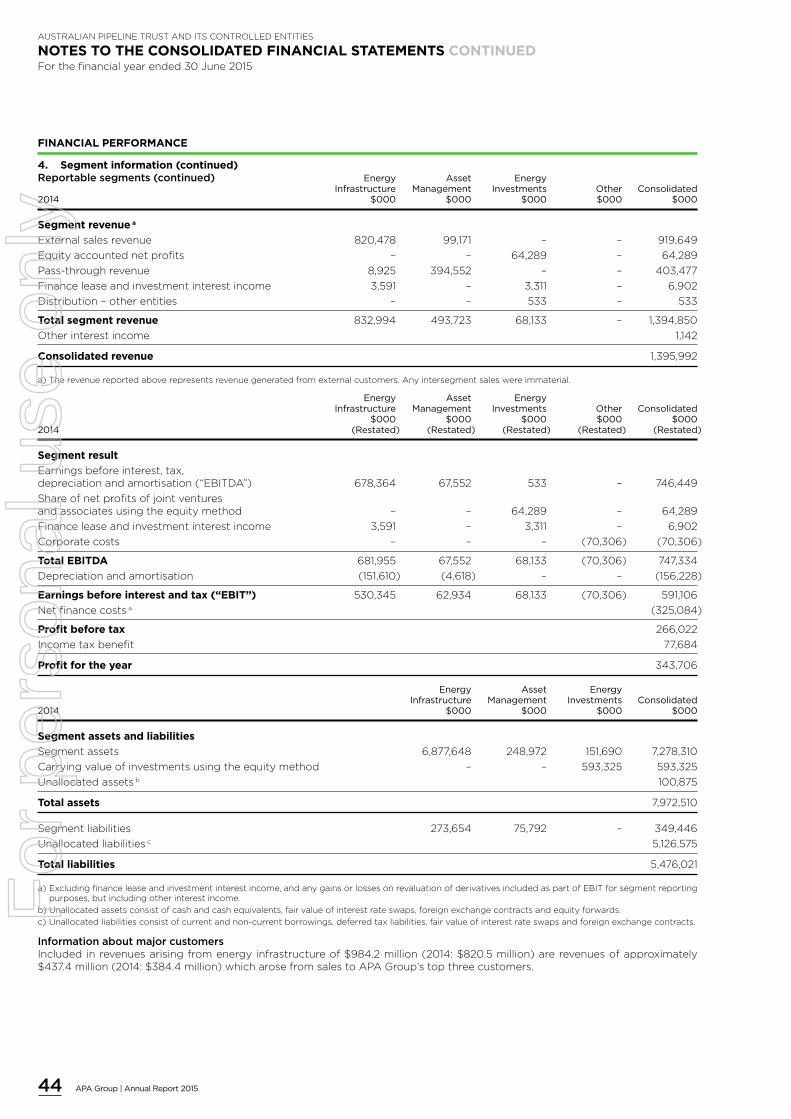
44 APA Group | Annual Report 2015
AUSTRALIAN PIPELINE TRUST AND ITS CONTROLLED ENTITIES
NOTES TO THE CONSOLIDATED FINANCIAL STATEMENTS CONTINUEDFor the financial year ended 30 June 2015
FINANCIAL PERFORMANCE
4. Segment information (continued)Reportablesegments(continued) Energy Asset Energy Infrastructure Management Investments Other Consolidated 2014 $000 $000 $000 $000 $000
Segment revenue a
Externalsalesrevenue 820,478 99,171 – – 919,649
Equityaccountednetprofits – – 64,289 – 64,289
Pass-throughrevenue 8,925 394,552 – – 403,477
Financeleaseandinvestmentinterestincome 3,591 – 3,311 – 6,902
Distribution–otherentities – – 533 – 533
Total segment revenue 832,994 493,723 68,133 – 1,394,850
Otherinterestincome 1,142
Consolidated revenue 1,395,992
a)Therevenuereportedaboverepresentsrevenuegeneratedfromexternalcustomers.Anyintersegmentsaleswereimmaterial.
Energy Asset Energy Infrastructure Management Investments Other Consolidated $000 $000 $000 $000 $000 2014 (Restated) (Restated) (Restated) (Restated) (Restated)
Segment result
Earningsbeforeinterest,tax,depreciationandamortisation(“EBITDA”) 678,364 67,552 533 – 746,449
Shareofnetprofitsofjointventuresandassociatesusingtheequitymethod – – 64,289 – 64,289
Financeleaseandinvestmentinterestincome 3,591 – 3,311 – 6,902
Corporatecosts – – – (70,306) (70,306)
Total EBITDA 681,955 67,552 68,133 (70,306) 747,334
Depreciationandamortisation (151,610) (4,618) – – (156,228)
Earnings before interest and tax (“EBIT”) 530,345 62,934 68,133 (70,306) 591,106
Netfinancecostsa (325,084)
Profit before tax 266,022
Incometaxbenefit 77,684
Profit for the year 343,706
Energy Asset Energy Infrastructure Management Investments Consolidated 2014 $000 $000 $000 $000
Segment assets and liabilities
Segmentassets 6,877,648 248,972 151,690 7,278,310
Carryingvalueofinvestmentsusingtheequitymethod – – 593,325 593,325
Unallocatedassetsb 100,875
Total assets 7,972,510
Segmentliabilities 273,654 75,792 – 349,446
Unallocatedliabilitiesc 5,126,575
Total liabilities 5,476,021
a)Excludingfinanceleaseandinvestmentinterestincome,andanygainsorlossesonrevaluationofderivativesincludedaspartofEBITforsegmentreportingpurposes,butincludingotherinterestincome.
b)Unallocatedassetsconsistofcashandcashequivalents,fairvalueofinterestrateswaps,foreignexchangecontractsandequityforwards.
c)Unallocatedliabilitiesconsistofcurrentandnon-currentborrowings,deferredtaxliabilities,fairvalueofinterestrateswapsandforeignexchangecontracts.
InformationaboutmajorcustomersIncludedinrevenuesarisingfromenergyinfrastructureof$984.2million(2014:$820.5million)arerevenuesofapproximately$437.4million(2014:$384.4million)whicharosefromsalestoAPAGroup’stopthreecustomers.
For
per
sona
l use
onl
y

45APA Group | Annual Report 2015
AUSTRALIAN PIPELINE TRUST AND ITS CONTROLLED ENTITIES
NOTES TO THE CONSOLIDATED FINANCIAL STATEMENTS CONTINUEDFor the financial year ended 30 June 2015
FINANCIAL PERFORMANCE
5. RevenueAnanalysisofAPAGroup’srevenuefortheyearisasfollows:
Continuingoperations 2015 2014 $000 $000
Energyinfrastructurerevenue 983,587 819,899
Pass-throughrevenue 13,514 8,925
Energy infrastructure revenue 997,101 828,824
Assetmanagementrevenue 85,056 99,171
Pass-throughrevenue 420,868 394,552
Asset management revenue 505,924 493,723
Operating revenue 1,503,025 1,322,547
Interest 24,322 1,142
Interestincomeonredeemableordinaryshares(EII),redeemablepreferenceshares(GDI)and
loanstorelatedparties(DPS) 8,308 3,311
Financeleaseincome 2,896 3,591
Finance income 35,526 8,044
Dividends 546 533
Rentalincome 597 579
Total revenue 1,539,694 1,331,703
Shareofnetprofitsofjointventuresandassociatesusingtheequitymethod 13,921 64,289
1,553,615 1,395,992
RevenueisrecognisedtotheextentthatitisprobablethattheeconomicbenefitswillflowtoAPAGroupandcanbereliablymeasured.Amountsdisclosedasrevenuearenetofdutiesandtaxespaid.Revenueisrecognisedforthemajorbusinessactivitiesasfollows:
Operating revenue,whichisearnedforthetransportationofgas,generationofelectricityandotherrelatedservicesandisrecognisedwhentheservicesareprovidednetofgoodsandservicestax(“GST”),exceptwheretheamountofGSTincurredisnotrecoverablefromthetaxationauthority;
Pass-through revenue,forwhichnomarginisearned,isrecognisedwhentheservicesareprovidedandoffsetbycorrespondingpass-throughcosts;
Interest revenue,whichisrecognisedasitaccruesandisdeterminedusingtheeffectiveinterestmethod;
Dividend revenue,whichisrecognisedwhentherighttoreceivethepaymenthasbeenestablished;and
Finance lease income,whichisallocatedtoaccountingperiodssoastoreflectaconstantperiodicrateofreturnontheGroup’snetinvestmentoutstandinginrespectoftheleases.
For
per
sona
l use
onl
y

46 APA Group | Annual Report 2015
AUSTRALIAN PIPELINE TRUST AND ITS CONTROLLED ENTITIES
NOTES TO THE CONSOLIDATED FINANCIAL STATEMENTS CONTINUEDFor the financial year ended 30 June 2015
FINANCIAL PERFORMANCE
6. Expenses 2015 2014 $000 $000
Depreciationofnon-currentassets 182,084 151,132
Amortisationofnon-currentassets 26,116 5,096
Depreciation and amortisation expense 208,200 156,228
Gaspipelinecosts 13,514 8,925
Management,operatingandmaintenancecosts 420,868 394,552
Other operating costs – pass-through 434,382 403,477
Interestonbankoverdraftsandborrowingsa 357,255 324,122
Amortisationofdeferredborrowingcosts 14,978 9,245
Otherfinancecosts 14,641 9,031
386,874 342,398
Less:amountsincludedinthecostofqualifyingassets (20,002) (18,069)
366,872 324,329
(Gain)/lossonderivatives (19,643) 787
Unwindingofdiscountonnon-currentliabilities 1,255 1,110
Finance costs 348,484 326,226
Definedcontributionplans 10,116 9,648
Definedbenefitplans(Note17) 4,146 4,468
Post-employmentbenefits 14,262 14,116
Terminationbenefits 2,172 1,004
Cashsettledsecurity-basedpaymentsb 23,629 22,452
Otheremployeebenefits 136,111 131,043
Employee benefit expense 176,174 168,615
a)Theaverageinterestrateonfundsborrowedis7.12%p.a.(2014:7.44%p.a.)includingamortisationofborrowingcostsandotherfinancecosts.
b)APAGroupprovidesbenefitstocertainemployeesintheformofcashsettledsecurity-basedpayments.Forcashsettledsecurity-basedpayments,aliabilityequaltotheportionofservicesreceivedisrecognisedatthecurrentfairvaluedeterminedateachreportingdate.
7. Income taxThemajorcomponentsoftaxexpenseare:
Income statement (continuing operations)
Currenttaxexpenseinrespectofthecurrentyear (8,734) (1,063)
Adjustmentsrecognisedinthecurrentyearinrelationtocurrenttaxofprioryears 1,516 1,061
Deferredtaxexpenserelatingtotheoriginationandreversaloftemporarydifferences (169,980) 77,686
Total tax (expense)/benefit (177,198) 77,684
Tax reconciliation (continuing operations)
Profitbeforetax 737,128 266,022
Incometaxexpensecalculatedat30% (221,138) (79,807)
Non-assessabletrustdistribution 13,904 11,611
Nondeductibleexpenses (13,567) (3,054)
Nonassessableincome 4,278 15,034
ExcessofequityaccountedbookvalueovertaxbaseofEnvestrashares 12,149 –
Unfrankeddividendsfromassociates (4,530) (11,221)
(208,904) (67,437)
Taxbenefitontaxcostbasestepup – 144,060
Previouslyunbookedlossesnowrecognised 30,190 –
Adjustmentrecognisedinthecurrentyearinrelationtothecurrenttaxofprioryears 1,516 1,061
(177,198) 77,684
Incometaxexpensecomprisesofcurrentanddeferredtax.Incometaxisrecognisedinprofitorlossexcepttotheextentthatitrelatestoitemsrecogniseddirectlyinothercomprehensiveincome,inwhichcaseitisrecognisedinequity.Currenttaxrepresentstheexpectedtaxableincomeattheapplicabletaxrateforthefinancialyear,andanyadjustmenttotaxpayableinrespectofpreviousfinancialyears.
For
per
sona
l use
onl
y

47APA Group | Annual Report 2015
AUSTRALIAN PIPELINE TRUST AND ITS CONTROLLED ENTITIES
NOTES TO THE CONSOLIDATED FINANCIAL STATEMENTS CONTINUEDFor the financial year ended 30 June 2015
FINANCIAL PERFORMANCE
7. Income tax (continued)Incometaxexpenseforthe2015yearis$177.2million.Anincometaxprovisionof$7.2millionhasbeenrecognisedafterutilisationofallavailablegrouptaxlossesandpartialutilisationofavailabletransferredtaxlosses(refertoNote11).
DeferredtaxbalancesDeferredtax(liabilities)/assetsarisefromthefollowing:
Opening Chargedto Chargedto Closing balance income equity balance2015 $000 $000 $000 $000
Gross deferred tax liabilities
Intangibleassets (3,437) 769 – (2,668)
Property,plantandequipment (486,629) (99,478) – (586,107)
Deferredexpenses (49,683) (1,986) – (51,669)
Definedbenefitobligation 4,328 171 (5,506) (1,007)
Availableforsaleinvestments (157) – (482) (639)
(535,578) (100,524) (5,988) (642,090)
Gross deferred tax assets
Provisions 37,448 7,603 – 45,051
Cashflowhedges 52,516 193 74,765 127,474
Securityissuecosts 186 (1,982) 9,057 7,261
Deferredrevenue 2,465 4,264 – 6,729
Investmentsequityaccounted (990) 2,945 8,237 10,192
Other 32 1,389 – 1,421
Taxlosses 333,138 (83,868) – 249,270
424,795 (69,456) 92,059 447,398
Net deferred tax liability (110,783) (169,980) 86,071 (194,692)
2014
Gross deferred tax liabilities
Intangibleassets (3,975) 538 – (3,437)
Property,plantandequipment (497,925) 11,296 – (486,629)
Deferredexpenses (47,535) (2,148) – (49,683)
Investmentsequityaccounted (3,445) 295 2,160 (990)
Availableforsaleinvestments (746) – 589 (157)
(553,626) 9,981 2,749 (540,896)
Gross deferred tax assets
Provisions 36,361 1,087 – 37,448
Cashflowhedges 27,527 236 24,753 52,516
Definedbenefitobligation 6,225 142 (2,039) 4,328
Securityissuecosts 368 (182) – 186
Deferredrevenue 467 1,998 – 2,465
Other 59 (27) – 32
Taxlosses 268,687 64,451 – 333,138
339,694 67,705 22,714 430,113
Net deferred tax liability (213,932) 77,686 25,463 (110,783)
Unrecogniseddeferredtaxassets 2015 2014 $000 $000
Thefollowingdeferredtaxassetshavenotbeenbroughttoaccountasassets:
Taxlosses–capital 2,012 32,069
Deferredtaxisprovidedusingthebalancesheetliabilitymethod,providingfortemporarydifferencesbetweenthecarryingamountsofassetsandliabilitiesforfinancialreportingpurposesandtheamountsusedfortaxationpurposes.Thefollowingtemporarydifferencesarenotprovidedfor:
i) initialrecognitionofgoodwill;
ii) initialrecognitionofassetsorliabilitiesthataffectneitheraccountingnortaxableprofit;and
iii) differencesrelatingtoinvestmentsinwholly-ownedentitiestotheextentthattheywillprobablynotreverseintheforeseeablefuture.
For
per
sona
l use
onl
y
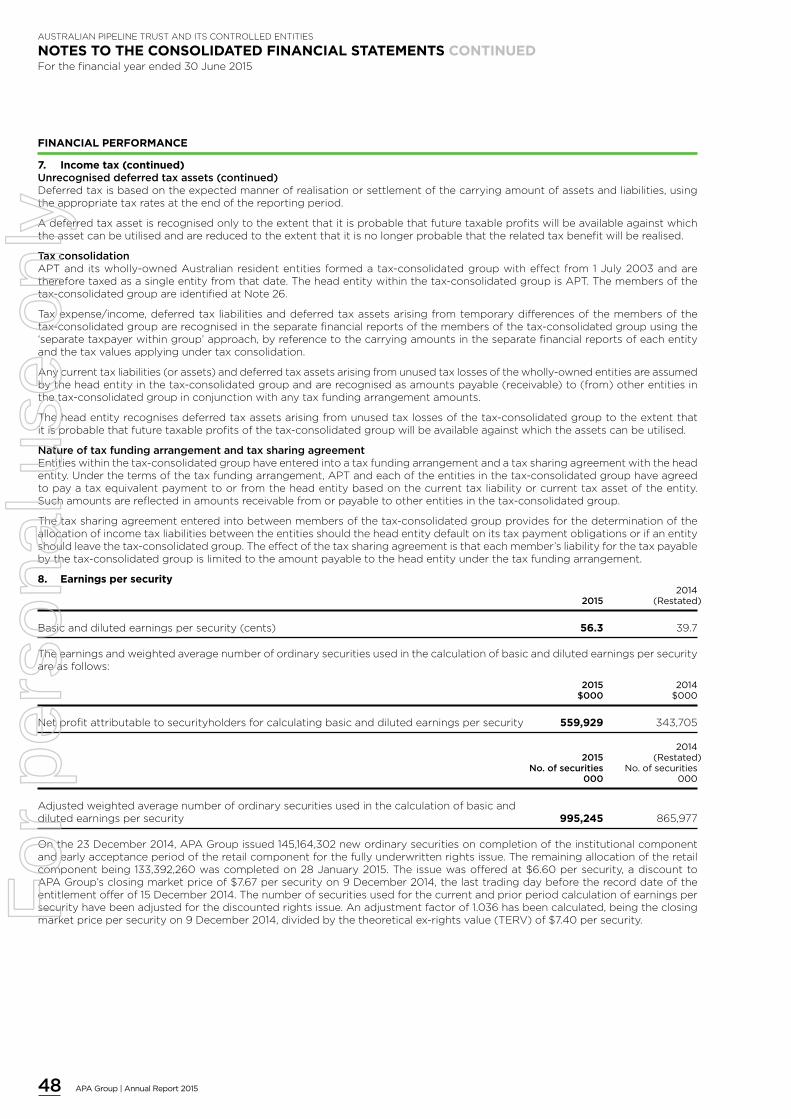
48 APA Group | Annual Report 2015
AUSTRALIAN PIPELINE TRUST AND ITS CONTROLLED ENTITIES
NOTES TO THE CONSOLIDATED FINANCIAL STATEMENTS CONTINUEDFor the financial year ended 30 June 2015
FINANCIAL PERFORMANCE
7. Income tax (continued)Unrecogniseddeferredtaxassets(continued)Deferredtaxisbasedontheexpectedmannerofrealisationorsettlementofthecarryingamountofassetsandliabilities,usingtheappropriatetaxratesattheendofthereportingperiod.
Adeferredtaxassetisrecognisedonlytotheextentthatitisprobablethatfuturetaxableprofitswillbeavailableagainstwhichtheassetcanbeutilisedandarereducedtotheextentthatitisnolongerprobablethattherelatedtaxbenefitwillberealised.
TaxconsolidationAPTanditswholly-ownedAustralianresidententitiesformedatax-consolidatedgroupwitheffectfrom1July2003andarethereforetaxedasasingleentityfromthatdate.Theheadentitywithinthetax-consolidatedgroupisAPT.Themembersofthetax-consolidatedgroupareidentifiedatNote26.
Taxexpense/income,deferredtaxliabilitiesanddeferredtaxassetsarisingfromtemporarydifferencesofthemembersofthetax-consolidatedgrouparerecognisedintheseparatefinancialreportsofthemembersofthetax-consolidatedgroupusingthe‘separatetaxpayerwithingroup’approach,byreferencetothecarryingamountsintheseparatefinancialreportsofeachentityandthetaxvaluesapplyingundertaxconsolidation.
Anycurrenttaxliabilities(orassets)anddeferredtaxassetsarisingfromunusedtaxlossesofthewholly-ownedentitiesareassumedbytheheadentityinthetax-consolidatedgroupandarerecognisedasamountspayable(receivable)to(from)otherentitiesinthetax-consolidatedgroupinconjunctionwithanytaxfundingarrangementamounts.
Theheadentityrecognisesdeferredtaxassetsarisingfromunusedtaxlossesofthetax-consolidatedgrouptotheextentthatitisprobablethatfuturetaxableprofitsofthetax-consolidatedgroupwillbeavailableagainstwhichtheassetscanbeutilised.
NatureoftaxfundingarrangementandtaxsharingagreementEntitieswithinthetax-consolidatedgrouphaveenteredintoataxfundingarrangementandataxsharingagreementwiththeheadentity.Underthetermsofthetaxfundingarrangement,APTandeachoftheentitiesinthetax-consolidatedgrouphaveagreedtopayataxequivalentpaymenttoorfromtheheadentitybasedonthecurrenttaxliabilityorcurrenttaxassetoftheentity.Suchamountsarereflectedinamountsreceivablefromorpayabletootherentitiesinthetax-consolidatedgroup.
Thetaxsharingagreemententeredintobetweenmembersofthetax-consolidatedgroupprovidesforthedeterminationoftheallocationofincometaxliabilitiesbetweentheentitiesshouldtheheadentitydefaultonitstaxpaymentobligationsorifanentityshouldleavethetax-consolidatedgroup.Theeffectofthetaxsharingagreementisthateachmember’sliabilityforthetaxpayablebythetax-consolidatedgroupislimitedtotheamountpayabletotheheadentityunderthetaxfundingarrangement.
8. Earnings per security 2014 2015 (Restated)
Basicanddilutedearningspersecurity(cents) 56.3 39.7
Theearningsandweightedaveragenumberofordinarysecuritiesusedinthecalculationofbasicanddilutedearningspersecurityareasfollows:
2015 2014 $000 $000
Netprofitattributabletosecurityholdersforcalculatingbasicanddilutedearningspersecurity 559,929 343,705
2014 2015 (Restated) No.ofsecurities No. of securities 000 000
Adjustedweightedaveragenumberofordinarysecuritiesusedinthecalculationofbasicanddilutedearningspersecurity 995,245 865,977
Onthe23December2014,APAGroupissued145,164,302newordinarysecuritiesoncompletionoftheinstitutionalcomponentandearlyacceptanceperiodoftheretailcomponentforthefullyunderwrittenrightsissue.Theremainingallocationoftheretailcomponentbeing133,392,260wascompletedon28January2015.Theissuewasofferedat$6.60persecurity,adiscounttoAPAGroup’sclosingmarketpriceof$7.67persecurityon9December2014,thelasttradingdaybeforetherecorddateoftheentitlementofferof15December2014.Thenumberofsecuritiesusedforthecurrentandpriorperiodcalculationofearningspersecurityhavebeenadjustedforthediscountedrightsissue.Anadjustmentfactorof1.036hasbeencalculated,beingtheclosingmarketpricepersecurityon9December2014,dividedbythetheoreticalex-rightsvalue(TERV)of$7.40persecurity.F
or p
erso
nal u
se o
nly

49APA Group | Annual Report 2015
AUSTRALIAN PIPELINE TRUST AND ITS CONTROLLED ENTITIES
NOTES TO THE CONSOLIDATED FINANCIAL STATEMENTS CONTINUEDFor the financial year ended 30 June 2015
FINANCIAL PERFORMANCE
9. Distributions 2015 2015 2014 2014 centsper Total cents per Total security $000 security $000
Recognised amounts
Final distribution paid on 10 September 2014
(2014:11September2013)
Profitdistribution–APTa 16.42 137,239 16.02 133,877
Profitdistribution–APTITa(Note24) 2.33 19,465 2.32 19,424
Capitaldistribution–APT(Note23) – – – –
Capitaldistribution–APTIT(Note24) – – 0.16 1,313
18.75 156,704 18.50 154,614
Interim distribution paid on 18 March 2015 b
(2014:12March2014)
Profitdistribution–APTa 15.12 126,396 14.56 121,663
Profitdistribution–APTITa(Note24) 2.38 19,860 2.30 19,241
Capitaldistribution–APT(Note23) – – 0.49 4,057
Capitaldistribution–APTIT(Note24) – – 0.15 1,295
17.50 146,256 17.50 146,256
Total distributions recognised
Profitdistributionsa 36.25 302,960 35.20 294,205
Capitaldistributions – – 0.80 6,665
Unrecognised amounts
Final distribution payable on 16 September 2015c
(2014:10September2014)
Profitdistribution–APTa 18.12 201,945 16.42 137,239
Profitdistribution–APTITa 2.38 26,488 2.33 19,464
20.50 228,433 18.75 156,703
a)Profitdistributionswereunfranked(2014:unfranked).
b)NewsecuritiesissuedundertheentitlementofferwerenoteligiblefortheFY2015interimdistribution.
c)Recorddate30June2015.
Thefinaldistributioninrespectofthefinancialyearhasnotbeenrecognisedinthisfinancialreportbecausethefinaldistributionwasnotdeclared,determinedorpubliclyconfirmedpriortotheendofthefinancialyear.
2015 2014 $000 $000
Adjustedfrankingaccountbalance(taxpaidbasis) 6,811 5,107
For
per
sona
l use
onl
y
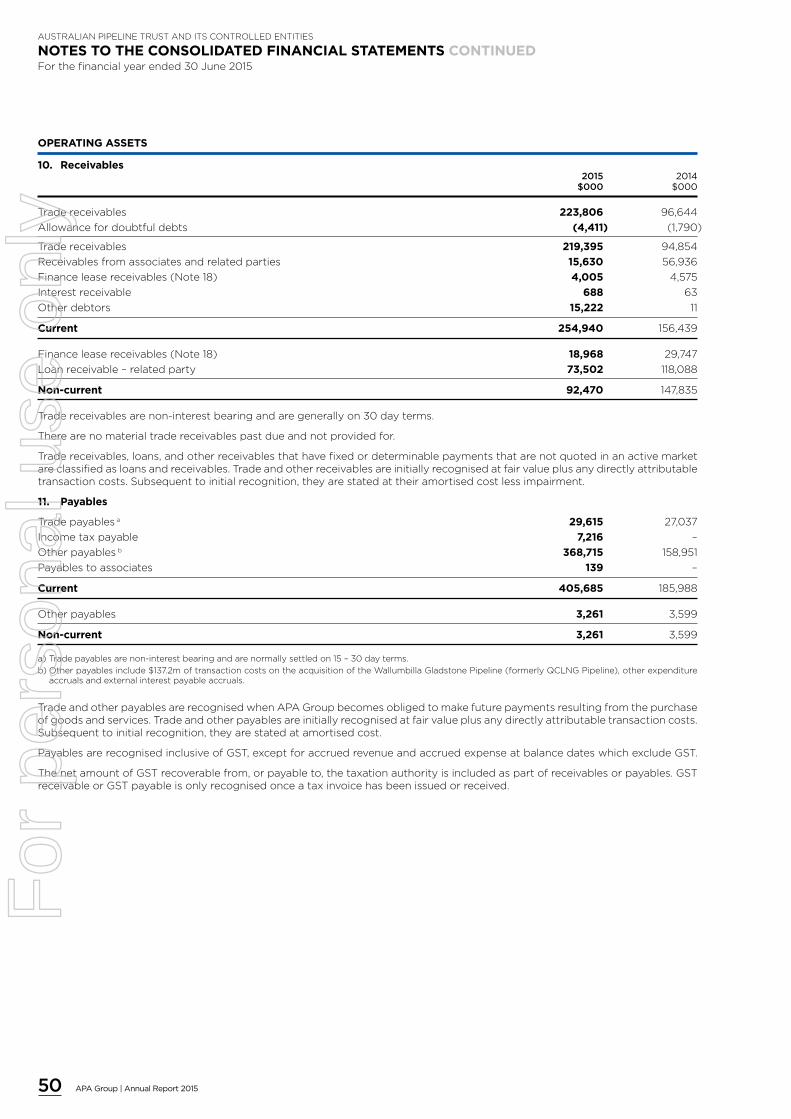
50 APA Group | Annual Report 2015
AUSTRALIAN PIPELINE TRUST AND ITS CONTROLLED ENTITIES
NOTES TO THE CONSOLIDATED FINANCIAL STATEMENTS CONTINUEDFor the financial year ended 30 June 2015
OPERATING ASSETS
10. Receivables 2015 2014 $000 $000
Tradereceivables 223,806 96,644
Allowancefordoubtfuldebts (4,411) (1,790)
Tradereceivables 219,395 94,854
Receivablesfromassociatesandrelatedparties 15,630 56,936
Financeleasereceivables(Note18) 4,005 4,575
Interestreceivable 688 63
Otherdebtors 15,222 11
Current 254,940 156,439
Financeleasereceivables(Note18) 18,968 29,747
Loanreceivable–relatedparty 73,502 118,088
Non-current 92,470 147,835
Tradereceivablesarenon-interestbearingandaregenerallyon30dayterms.
Therearenomaterialtradereceivablespastdueandnotprovidedfor.
Tradereceivables,loans,andotherreceivablesthathavefixedordeterminablepaymentsthatarenotquotedinanactivemarketareclassifiedasloansandreceivables.Tradeandotherreceivablesareinitiallyrecognisedatfairvalueplusanydirectlyattributabletransactioncosts.Subsequenttoinitialrecognition,theyarestatedattheiramortisedcostlessimpairment.
11. Payables
Tradepayablesa 29,615 27,037
Incometaxpayable 7,216 –
Otherpayablesb 368,715 158,951
Payablestoassociates 139 –
Current 405,685 185,988
Otherpayables 3,261 3,599
Non-current 3,261 3,599
a)Tradepayablesarenon-interestbearingandarenormallysettledon15–30dayterms.
b)Otherpayablesinclude$137.2moftransactioncostsontheacquisitionoftheWallumbillaGladstonePipeline(formerlyQCLNGPipeline),otherexpenditureaccrualsandexternalinterestpayableaccruals.
TradeandotherpayablesarerecognisedwhenAPAGroupbecomesobligedtomakefuturepaymentsresultingfromthepurchaseofgoodsandservices.Tradeandotherpayablesareinitiallyrecognisedatfairvalueplusanydirectlyattributabletransactioncosts.Subsequenttoinitialrecognition,theyarestatedatamortisedcost.
PayablesarerecognisedinclusiveofGST,exceptforaccruedrevenueandaccruedexpenseatbalancedateswhichexcludeGST.
ThenetamountofGSTrecoverablefrom,orpayableto,thetaxationauthorityisincludedaspartofreceivablesorpayables.GSTreceivableorGSTpayableisonlyrecognisedonceataxinvoicehasbeenissuedorreceived.
For
per
sona
l use
onl
y
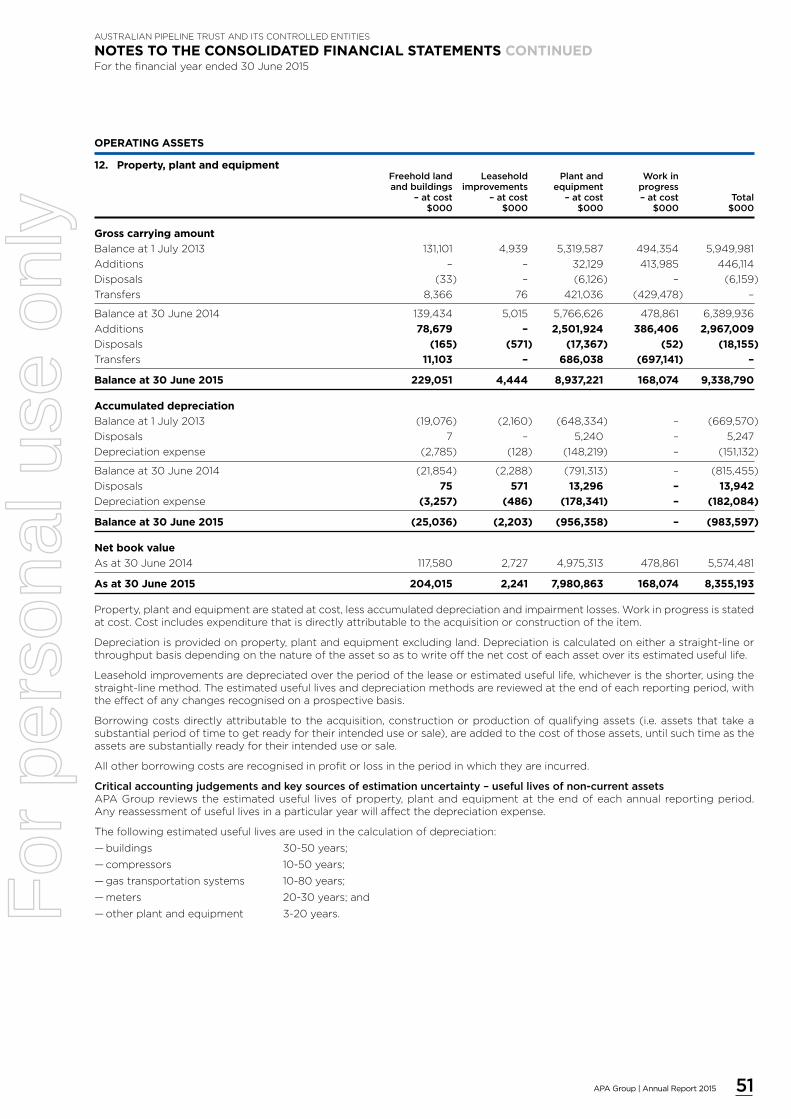
51APA Group | Annual Report 2015
AUSTRALIAN PIPELINE TRUST AND ITS CONTROLLED ENTITIES
NOTES TO THE CONSOLIDATED FINANCIAL STATEMENTS CONTINUEDFor the financial year ended 30 June 2015
OPERATING ASSETS
12. Property, plant and equipment Freeholdland Leasehold Plantand Workin andbuildings improvements equipment progress –atcost –atcost –atcost –atcost Total $000 $000 $000 $000 $000
Gross carrying amount
Balanceat1July2013 131,101 4,939 5,319,587 494,354 5,949,981
Additions – – 32,129 413,985 446,114
Disposals (33) – (6,126) – (6,159)
Transfers 8,366 76 421,036 (429,478) –
Balanceat30June2014 139,434 5,015 5,766,626 478,861 6,389,936
Additions 78,679 – 2,501,924 386,406 2,967,009
Disposals (165) (571) (17,367) (52) (18,155)
Transfers 11,103 – 686,038 (697,141) –
Balance at 30 June 2015 229,051 4,444 8,937,221 168,074 9,338,790
Accumulated depreciation
Balanceat1July2013 (19,076) (2,160) (648,334) – (669,570)
Disposals 7 – 5,240 – 5,247
Depreciationexpense (2,785) (128) (148,219) – (151,132)
Balanceat30June2014 (21,854) (2,288) (791,313) – (815,455)
Disposals 75 571 13,296 – 13,942
Depreciationexpense (3,257) (486) (178,341) – (182,084)
Balance at 30 June 2015 (25,036) (2,203) (956,358) – (983,597)
Net book value
Asat30June2014 117,580 2,727 4,975,313 478,861 5,574,481
As at 30 June 2015 204,015 2,241 7,980,863 168,074 8,355,193
Property,plantandequipmentarestatedatcost,lessaccumulateddepreciationandimpairmentlosses.Workinprogressisstatedatcost.Costincludesexpenditurethatisdirectlyattributabletotheacquisitionorconstructionoftheitem.
Depreciationisprovidedonproperty,plantandequipmentexcludingland.Depreciationiscalculatedoneitherastraight-lineorthroughputbasisdependingonthenatureoftheassetsoastowriteoffthenetcostofeachassetoveritsestimatedusefullife.
Leaseholdimprovementsaredepreciatedovertheperiodoftheleaseorestimatedusefullife,whicheveristheshorter,usingthestraight-linemethod.Theestimatedusefullivesanddepreciationmethodsarereviewedattheendofeachreportingperiod,withtheeffectofanychangesrecognisedonaprospectivebasis.
Borrowingcostsdirectlyattributabletotheacquisition,constructionorproductionofqualifyingassets(i.e.assetsthattakeasubstantialperiodoftimetogetreadyfortheirintendeduseorsale),areaddedtothecostofthoseassets,untilsuchtimeastheassetsaresubstantiallyreadyfortheirintendeduseorsale.
Allotherborrowingcostsarerecognisedinprofitorlossintheperiodinwhichtheyareincurred.
Criticalaccountingjudgementsandkeysourcesofestimationuncertainty–usefullivesofnon-currentassetsAPAGroupreviewstheestimateduseful livesofproperty,plantandequipmentattheendofeachannualreportingperiod.Anyreassessmentofusefullivesinaparticularyearwillaffectthedepreciationexpense.
Thefollowingestimatedusefullivesareusedinthecalculationofdepreciation:
— buildings 30-50years;
— compressors 10-50years;
— gastransportationsystems 10-80years;
— meters 20-30years;and
— otherplantandequipment 3-20years.For
per
sona
l use
onl
y
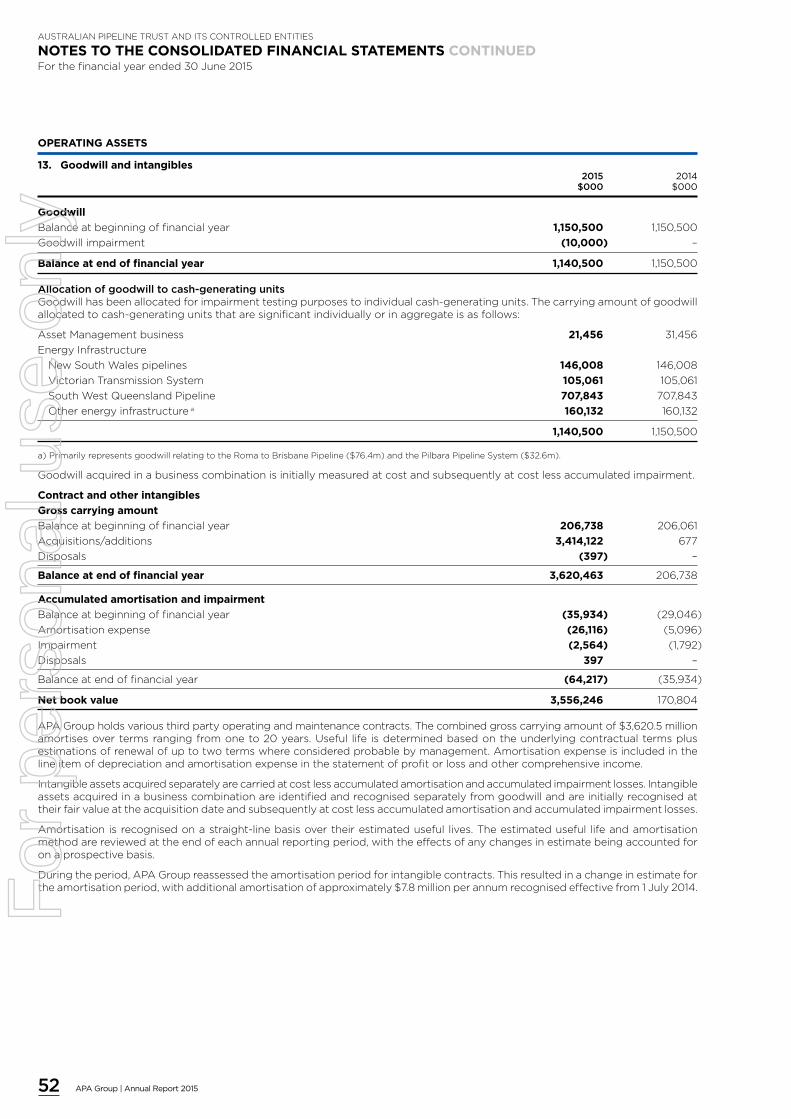
52 APA Group | Annual Report 2015
AUSTRALIAN PIPELINE TRUST AND ITS CONTROLLED ENTITIES
NOTES TO THE CONSOLIDATED FINANCIAL STATEMENTS CONTINUEDFor the financial year ended 30 June 2015
OPERATING ASSETS
13. Goodwill and intangibles 2015 2014 $000 $000
Goodwill
Balanceatbeginningoffinancialyear 1,150,500 1,150,500
Goodwillimpairment (10,000) –
Balance at end of financial year 1,140,500 1,150,500
Allocationofgoodwilltocash-generatingunitsGoodwillhasbeenallocatedforimpairmenttestingpurposestoindividualcash-generatingunits.Thecarryingamountofgoodwillallocatedtocash-generatingunitsthataresignificantindividuallyorinaggregateisasfollows:
AssetManagementbusiness 21,456 31,456
EnergyInfrastructure
NewSouthWalespipelines 146,008 146,008
VictorianTransmissionSystem 105,061 105,061
SouthWestQueenslandPipeline 707,843 707,843
Otherenergyinfrastructurea 160,132 160,132
1,140,500 1,150,500
a)PrimarilyrepresentsgoodwillrelatingtotheRomatoBrisbanePipeline($76.4m)andthePilbaraPipelineSystem($32.6m).
Goodwillacquiredinabusinesscombinationisinitiallymeasuredatcostandsubsequentlyatcostlessaccumulatedimpairment.
Contract and other intangibles
Gross carrying amount
Balanceatbeginningoffinancialyear 206,738 206,061
Acquisitions/additions 3,414,122 677
Disposals (397) –
Balance at end of financial year 3,620,463 206,738
Accumulated amortisation and impairment
Balanceatbeginningoffinancialyear (35,934) (29,046)
Amortisationexpense (26,116) (5,096)
Impairment (2,564) (1,792)
Disposals 397 –
Balanceatendoffinancialyear (64,217) (35,934)
Net book value 3,556,246 170,804
APAGroupholdsvariousthirdpartyoperatingandmaintenancecontracts.Thecombinedgrosscarryingamountof$3,620.5millionamortisesovertermsrangingfromoneto20years.Useful lifeisdeterminedbasedontheunderlyingcontractualtermsplusestimationsofrenewalofuptotwotermswhereconsideredprobablebymanagement.Amortisationexpenseisincludedinthelineitemofdepreciationandamortisationexpenseinthestatementofprofitorlossandothercomprehensiveincome.
Intangibleassetsacquiredseparatelyarecarriedatcostlessaccumulatedamortisationandaccumulatedimpairmentlosses.Intangibleassetsacquiredinabusinesscombinationareidentifiedandrecognisedseparatelyfromgoodwillandareinitiallyrecognisedattheirfairvalueattheacquisitiondateandsubsequentlyatcostlessaccumulatedamortisationandaccumulatedimpairmentlosses.
Amortisationisrecognisedonastraight-linebasisovertheirestimateduseful lives.Theestimateduseful lifeandamortisationmethodarereviewedattheendofeachannualreportingperiod,withtheeffectsofanychangesinestimatebeingaccountedforonaprospectivebasis.
Duringtheperiod,APAGroupreassessedtheamortisationperiodforintangiblecontracts.Thisresultedinachangeinestimatefortheamortisationperiod,withadditionalamortisationofapproximately$7.8millionperannumrecognisedeffectivefrom1July2014.F
or p
erso
nal u
se o
nly

53APA Group | Annual Report 2015
AUSTRALIAN PIPELINE TRUST AND ITS CONTROLLED ENTITIES
NOTES TO THE CONSOLIDATED FINANCIAL STATEMENTS CONTINUEDFor the financial year ended 30 June 2015
OPERATING ASSETS
14. Impairment of non-financial assetsAPAGrouptestsproperty,plantandequipment,intangiblesandgoodwillforimpairmentatleastannuallyorwheneverthereisanindicationthattheassetmaybeimpaired.Assetsotherthangoodwillthatsufferedanimpairmentarereviewedforpossiblereversaloftheimpairmentateachreportingperiod.
Iftheassetdoesnotgenerateindependentcashinflowsanditsvalueinusecannotbeestimatedtobeclosetoitsfairvalue,theassetistestedforimpairmentaspartoftheCashGeneratingUnit(CGU)towhichitbelongs.
Assetsare impairediftheircarryingvalueexceedstheirrecoverableamount.TherecoverableamountofanassetorCGUisdeterminedasthehigherofitsfairvaluelesscostsofdisposalorvalueinuse.
Determiningwhetheridentifiableintangibleassetsandgoodwillareimpairedrequiresanestimationofthevalue-in-useorfairvalueofthecash-generatingunits.ThecalculationsrequireAPAGrouptoestimatethefuturecashflowsexpectedtoarisefromcash-generatingunitsandsuitablediscountratesinordertocalculatethepresentvalueofcash-generatingunits.Theseestimatesandassumptionsarereviewedonanongoingbasis.
Therecoverableamountsofcash-generatingunitsaredeterminedbasedonvalue-in-usecalculations.Thesecalculationsusecashflowprojectionsbasedonafiveyearfinancialbusinessplanandthereafterafurther15yearfinancialmodel.ThisisthebasisofAPAGroup’sforecastingandplanningprocesseswhichrepresentstheunderlyinglongtermnatureofassociatedcustomercontractsontheseassets.
Criticalaccountingjudgementsandkeysourcesofestimationuncertainty–impairmentofassetsForfullyregulatedassets,cashflowshavebeenextrapolatedonthebasisofexistingtransportationcontractsandgovernmentpolicysettings,andexpectedcontractrenewalswitharesultingaverageannualgrowthrateof1.6%p.a.Theseexpectedcashflowsarefactoredintotheregulatedassetbaseanddonotexceedmanagement’sexpectationsofthelong-termaveragegrowthrateforthemarketinwhichthecashgeneratingunitoperates.
Fornon-regulatedassets,APAhasassumednocapacityexpansionbeyondinstalledandcommittedlevels;utilisationofcapacityisbasedonexistingcontracts,governmentpolicysettingsandexpectedmarketoutcomes.
Ascontractsmature,givenongoingdemandforcapacity,itisassumedthatthemajorityofthecapacityisresoldonsimilarpricing.
AssetManagementcashflowprojectionsreflectlongtermagreementswithassumptionsofrenewalonsimilartermsandconditionsbasedonmanagementexpectations.
Cashflowprojectionsareestimatedforaperiodofupto20years,withaterminalvalue,recognisingthelongtermnatureoftheassets.Thepre-taxdiscountratesusedare8.25%p.a.(2014:8.25%p.a.)forEnergyInfrastructureassetsand8.25%p.a.(2014:8.25%p.a.)forAssetManagement.
Theseassumptionshavebeendeterminedwithreferencetohistoricinformation,currentperformanceandexpectedchangestakingintoaccountexternalinformation.
DuringAugust2014,APAGroupsolditsinvestmentinEnvestraLimitedtoCheungKongGroupconsortiumwhichresultedinareassessmentofthecarryingvalueoftheassetmanagementbusinesstoreflectfuturegrowthopportunities,resultinginareductionofgoodwill($10.0million).
15. Provisions 2015 2014 $000 $000
Employeebenefits 76,953 73,899
Other 8,499 7,104
Current 85,452 81,003
Employeebenefits 30,484 38,833
Other 29,926 8,609
Non-current 60,410 47,442
Employee benefits
Incentives 25,556 25,217
Cashsettledsecurity-basedpayments 10,009 9,263
Leavebalances 39,608 37,310
Terminationbenefits 1,780 2,109
Current 76,953 73,899
Cashsettledsecurity-basedpayments 17,215 15,818
Definedbenefitliability(Note17) 4,425 14,426
Leavebalances 8,844 8,589
Non-current 30,484 38,833
For
per
sona
l use
onl
y
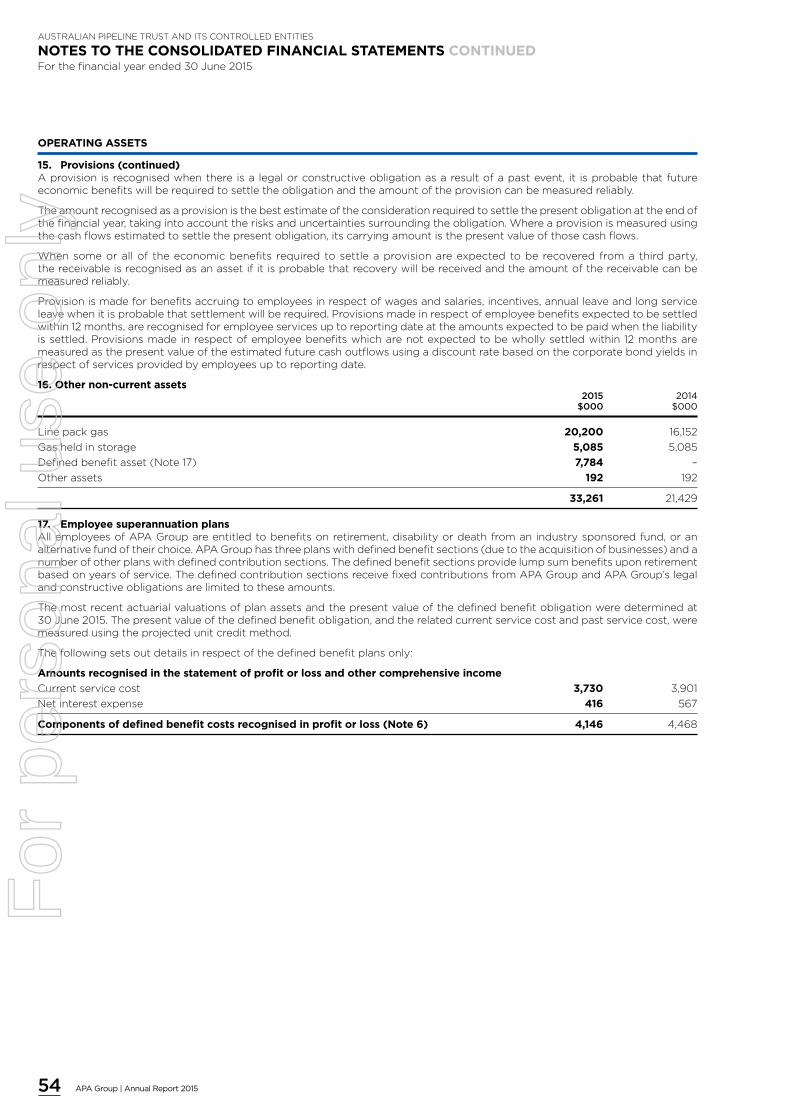
54 APA Group | Annual Report 2015
AUSTRALIAN PIPELINE TRUST AND ITS CONTROLLED ENTITIES
NOTES TO THE CONSOLIDATED FINANCIAL STATEMENTS CONTINUEDFor the financial year ended 30 June 2015
OPERATING ASSETS
15. Provisions (continued)Aprovisionisrecognisedwhenthereisalegalorconstructiveobligationasaresultofapastevent, it isprobablethatfutureeconomicbenefitswillberequiredtosettletheobligationandtheamountoftheprovisioncanbemeasuredreliably.
Theamountrecognisedasaprovisionisthebestestimateoftheconsiderationrequiredtosettlethepresentobligationattheendofthefinancialyear,takingintoaccounttherisksanduncertaintiessurroundingtheobligation.Whereaprovisionismeasuredusingthecashflowsestimatedtosettlethepresentobligation,itscarryingamountisthepresentvalueofthosecashflows.
Whensomeoralloftheeconomicbenefitsrequiredtosettleaprovisionareexpectedtoberecoveredfromathirdparty,thereceivableisrecognisedasanassetifitisprobablethatrecoverywillbereceivedandtheamountofthereceivablecanbemeasuredreliably.
Provisionismadeforbenefitsaccruingtoemployeesinrespectofwagesandsalaries,incentives,annualleaveandlongserviceleavewhenitisprobablethatsettlementwillberequired.Provisionsmadeinrespectofemployeebenefitsexpectedtobesettledwithin12months,arerecognisedforemployeeservicesuptoreportingdateattheamountsexpectedtobepaidwhentheliabilityissettled.Provisionsmadeinrespectofemployeebenefitswhicharenotexpectedtobewhollysettledwithin12monthsaremeasuredasthepresentvalueoftheestimatedfuturecashoutflowsusingadiscountratebasedonthecorporatebondyieldsinrespectofservicesprovidedbyemployeesuptoreportingdate.
16. Other non-current assets 2015 2014 $000 $000
Linepackgas 20,200 16,152
Gasheldinstorage 5,085 5,085
Definedbenefitasset(Note17) 7,784 –
Otherassets 192 192
33,261 21,429
17. Employee superannuation plansAllemployeesofAPAGroupareentitledtobenefitsonretirement,disabilityordeathfromanindustrysponsoredfund,oranalternativefundoftheirchoice.APAGrouphasthreeplanswithdefinedbenefitsections(duetotheacquisitionofbusinesses)andanumberofotherplanswithdefinedcontributionsections.Thedefinedbenefitsectionsprovidelumpsumbenefitsuponretirementbasedonyearsofservice.ThedefinedcontributionsectionsreceivefixedcontributionsfromAPAGroupandAPAGroup’slegalandconstructiveobligationsarelimitedtotheseamounts.
Themostrecentactuarialvaluationsofplanassetsandthepresentvalueofthedefinedbenefitobligationweredeterminedat30June2015.Thepresentvalueofthedefinedbenefitobligation,andtherelatedcurrentservicecostandpastservicecost,weremeasuredusingtheprojectedunitcreditmethod.
Thefollowingsetsoutdetailsinrespectofthedefinedbenefitplansonly:
Amounts recognised in the statement of profit or loss and other comprehensive income
Currentservicecost 3,730 3,901
Netinterestexpense 416 567
Components of defined benefit costs recognised in profit or loss (Note 6) 4,146 4,468
For
per
sona
l use
onl
y
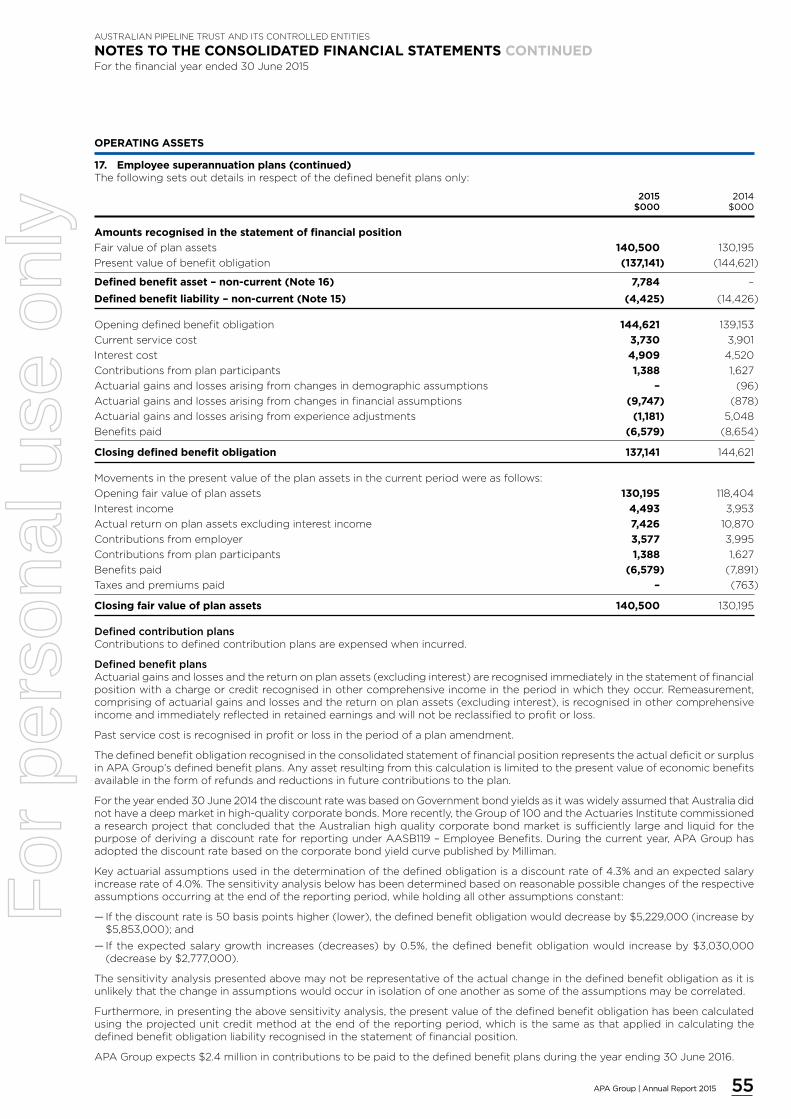
55APA Group | Annual Report 2015
AUSTRALIAN PIPELINE TRUST AND ITS CONTROLLED ENTITIES
NOTES TO THE CONSOLIDATED FINANCIAL STATEMENTS CONTINUEDFor the financial year ended 30 June 2015
OPERATING ASSETS
17. Employee superannuation plans (continued)Thefollowingsetsoutdetailsinrespectofthedefinedbenefitplansonly:
2015 2014 $000 $000
Amounts recognised in the statement of financial position
Fairvalueofplanassets 140,500 130,195
Presentvalueofbenefitobligation (137,141) (144,621)
Defined benefit asset – non-current (Note 16) 7,784 –
Defined benefit liability – non-current (Note 15) (4,425) (14,426)
Openingdefinedbenefitobligation 144,621 139,153
Currentservicecost 3,730 3,901
Interestcost 4,909 4,520
Contributionsfromplanparticipants 1,388 1,627
Actuarialgainsandlossesarisingfromchangesindemographicassumptions – (96)
Actuarialgainsandlossesarisingfromchangesinfinancialassumptions (9,747) (878)
Actuarialgainsandlossesarisingfromexperienceadjustments (1,181) 5,048
Benefitspaid (6,579) (8,654)
Closing defined benefit obligation 137,141 144,621
Movementsinthepresentvalueoftheplanassetsinthecurrentperiodwereasfollows:
Openingfairvalueofplanassets 130,195 118,404
Interestincome 4,493 3,953
Actualreturnonplanassetsexcludinginterestincome 7,426 10,870
Contributionsfromemployer 3,577 3,995
Contributionsfromplanparticipants 1,388 1,627
Benefitspaid (6,579) (7,891)
Taxesandpremiumspaid – (763)
Closing fair value of plan assets 140,500 130,195
DefinedcontributionplansContributionstodefinedcontributionplansareexpensedwhenincurred.
DefinedbenefitplansActuarialgainsandlossesandthereturnonplanassets(excludinginterest)arerecognisedimmediatelyinthestatementoffinancialpositionwithachargeorcreditrecognisedinothercomprehensiveincomeintheperiodinwhichtheyoccur.Remeasurement,comprisingofactuarialgainsandlossesandthereturnonplanassets(excludinginterest),isrecognisedinothercomprehensiveincomeandimmediatelyreflectedinretainedearningsandwillnotbereclassifiedtoprofitorloss.
Pastservicecostisrecognisedinprofitorlossintheperiodofaplanamendment.
ThedefinedbenefitobligationrecognisedintheconsolidatedstatementoffinancialpositionrepresentstheactualdeficitorsurplusinAPAGroup’sdefinedbenefitplans.Anyassetresultingfromthiscalculationislimitedtothepresentvalueofeconomicbenefitsavailableintheformofrefundsandreductionsinfuturecontributionstotheplan.
Fortheyearended30June2014thediscountratewasbasedonGovernmentbondyieldsasitwaswidelyassumedthatAustraliadidnothaveadeepmarketinhigh-qualitycorporatebonds.Morerecently,theGroupof100andtheActuariesInstitutecommissionedaresearchprojectthatconcludedthattheAustralianhighqualitycorporatebondmarketissufficientlylargeandliquidforthepurposeofderivingadiscountrateforreportingunderAASB119–EmployeeBenefits.Duringthecurrentyear,APAGrouphasadoptedthediscountratebasedonthecorporatebondyieldcurvepublishedbyMilliman.
Keyactuarialassumptionsusedinthedeterminationofthedefinedobligationisadiscountrateof4.3%andanexpectedsalaryincreaserateof4.0%.Thesensitivityanalysisbelowhasbeendeterminedbasedonreasonablepossiblechangesoftherespectiveassumptionsoccurringattheendofthereportingperiod,whileholdingallotherassumptionsconstant:
— Ifthediscountrateis50basispointshigher(lower),thedefinedbenefitobligationwoulddecreaseby$5,229,000(increaseby$5,853,000);and
— Iftheexpectedsalarygrowthincreases(decreases)by0.5%,thedefinedbenefitobligationwouldincreaseby$3,030,000(decreaseby$2,777,000).
Thesensitivityanalysispresentedabovemaynotberepresentativeoftheactualchangeinthedefinedbenefitobligationasitisunlikelythatthechangeinassumptionswouldoccurinisolationofoneanotherassomeoftheassumptionsmaybecorrelated.
Furthermore,inpresentingtheabovesensitivityanalysis,thepresentvalueofthedefinedbenefitobligationhasbeencalculatedusingtheprojectedunitcreditmethodattheendofthereportingperiod,whichisthesameasthatappliedincalculatingthedefinedbenefitobligationliabilityrecognisedinthestatementoffinancialposition.
APAGroupexpects$2.4millionincontributionstobepaidtothedefinedbenefitplansduringtheyearending30June2016.
For
per
sona
l use
onl
y

56 APA Group | Annual Report 2015
AUSTRALIAN PIPELINE TRUST AND ITS CONTROLLED ENTITIES
NOTES TO THE CONSOLIDATED FINANCIAL STATEMENTS CONTINUEDFor the financial year ended 30 June 2015
OPERATING ASSETS
18. LeasesLeasesareclassifiedasfinanceleaseswhenthetermsoftheleasetransfersubstantiallyalltherisksandrewardsincidentaltotheownershipoftheleasedassettothelessee.Allotherleasesareclassifiedasoperatingleases.
Financeleasereceivablesrelatetotheleaseofameteringstation,naturalgasvehiclerefuellingfacilitiesandtwopipelinelaterals.
2015 2014 $000 $000
Finance lease receivables
Notlongerthan1year 5,317 7,668
Longerthan1yearandnotlongerthan5years 12,347 20,724
Longerthan5years 19,183 26,181
Minimum future lease payments receivable ab 36,847 54,573
Grossfinanceleasereceivables 36,847 54,573
Less:unearnedfinanceleasereceivables (13,874) (20,251)
Present value of lease receivables 22,973 34,322
Includedinthefinancialstatementsaspartof:
Currenttradeandotherreceivables(Note10) 4,005 4,575
Non-currentreceivables(Note10) 18,968 29,747
22,973 34,322
a)Minimumfutureleasepaymentsreceivableincludetheaggregateofallleasepaymentsreceivableandanyguaranteedresidual.
b)X41powerstationexpansionwasdisposedofduringthe2015financialyear.
APAGroupasalessorAmountsduefromalesseeunderfinanceleasesarerecordedasreceivables.Financeleasereceivablesareinitiallyrecognisedatamountsequaltothepresentvalueoftheminimumleasepaymentsreceivableplusthepresentvalueofanyunguaranteedresidualvalueexpectedtoaccrueattheendoftheleaseterm.Financeleaseincomeisallocatedtoaccountingperiodssoastoreflectaconstantperiodicrateofreturnonthenetinvestmentoutstandinginrespectoftheleases.
APAGroupasalesseeAssetsheldunderfinanceleasesareinitiallyrecognisedattheirfairvalueor,iflower,atamountsequaltothepresentvalueoftheminimumleasepayments,eachdeterminedattheinceptionofthelease.Thecorrespondingliabilitytothelessorisincludedintheconsolidatedstatementoffinancialpositionasafinanceleaseobligation.Leasepaymentsareallocatedbetweenfinancechargesandreductionoftheleaseobligationsoastoachieveaconstantrateofinterestontheremainingbalanceoftheliability.
Financeleaseassetsareamortisedonastraight-linebasisovertheestimatedusefullifeoftheasset.
Non-cancellableoperatingleasesOperatingleaseobligationsareprimarilyrelatedtocommercialofficeleasesandmotorvehicles.
Notlongerthan1year 11,270 9,927
Longerthan1yearandnotlongerthan5years 29,418 21,776
Longerthan5years 21,115 22,808
61,803 54,511
Operatingleasepaymentsarerecognisedasanexpenseonastraight-linebasisovertheleaseterm,exceptwhereanothersystematicbasisismorerepresentativeofthetimepatternsinwhicheconomicbenefitsfromtheleasedassetareconsumed.Operatingleaseincentivesarerecognisedasaliabilitywhenreceivedandreleasedtothestatementofprofitorlossonastraightlinebasisovertheleaseterm.
For
per
sona
l use
onl
y
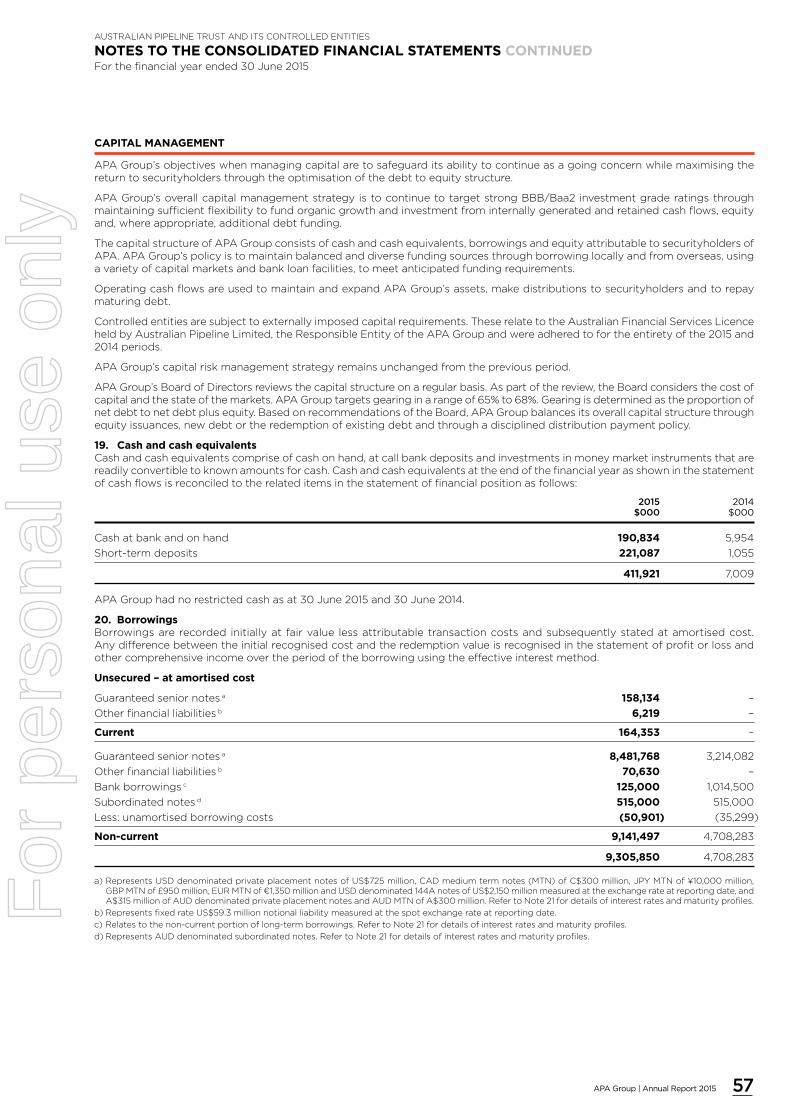
57APA Group | Annual Report 2015
AUSTRALIAN PIPELINE TRUST AND ITS CONTROLLED ENTITIES
NOTES TO THE CONSOLIDATED FINANCIAL STATEMENTS CONTINUEDFor the financial year ended 30 June 2015
CAPITAL MANAGEMENT
APAGroup’sobjectiveswhenmanagingcapitalaretosafeguarditsabilitytocontinueasagoingconcernwhilemaximisingthereturntosecurityholdersthroughtheoptimisationofthedebttoequitystructure.
APAGroup’soverallcapitalmanagementstrategyistocontinuetotargetstrongBBB/Baa2investmentgraderatingsthroughmaintainingsufficientflexibilitytofundorganicgrowthandinvestmentfrominternallygeneratedandretainedcashflows,equityand,whereappropriate,additionaldebtfunding.
ThecapitalstructureofAPAGroupconsistsofcashandcashequivalents,borrowingsandequityattributabletosecurityholdersofAPA.APAGroup’spolicyistomaintainbalancedanddiversefundingsourcesthroughborrowinglocallyandfromoverseas,usingavarietyofcapitalmarketsandbankloanfacilities,tomeetanticipatedfundingrequirements.
OperatingcashflowsareusedtomaintainandexpandAPAGroup’sassets,makedistributionstosecurityholdersandtorepaymaturingdebt.
Controlledentitiesaresubjecttoexternallyimposedcapitalrequirements.TheserelatetotheAustralianFinancialServicesLicenceheldbyAustralianPipelineLimited,theResponsibleEntityoftheAPAGroupandwereadheredtofortheentiretyofthe2015and2014periods.
APAGroup’scapitalriskmanagementstrategyremainsunchangedfromthepreviousperiod.
APAGroup’sBoardofDirectorsreviewsthecapitalstructureonaregularbasis.Aspartofthereview,theBoardconsidersthecostofcapitalandthestateofthemarkets.APAGrouptargetsgearinginarangeof65%to68%.Gearingisdeterminedastheproportionofnetdebttonetdebtplusequity.BasedonrecommendationsoftheBoard,APAGroupbalancesitsoverallcapitalstructurethroughequityissuances,newdebtortheredemptionofexistingdebtandthroughadisciplineddistributionpaymentpolicy.
19. Cash and cash equivalentsCashandcashequivalentscompriseofcashonhand,atcallbankdepositsandinvestmentsinmoneymarketinstrumentsthatarereadilyconvertibletoknownamountsforcash.Cashandcashequivalentsattheendofthefinancialyearasshowninthestatementofcashflowsisreconciledtotherelateditemsinthestatementoffinancialpositionasfollows:
2015 2014 $000 $000
Cashatbankandonhand 190,834 5,954
Short-termdeposits 221,087 1,055
411,921 7,009
APAGrouphadnorestrictedcashasat30June2015and30June2014.
20. BorrowingsBorrowingsarerecordedinitiallyatfairvaluelessattributabletransactioncostsandsubsequentlystatedatamortisedcost.Anydifferencebetweentheinitialrecognisedcostandtheredemptionvalueisrecognisedinthestatementofprofitorlossandothercomprehensiveincomeovertheperiodoftheborrowingusingtheeffectiveinterestmethod.
Unsecured – at amortised cost
Guaranteedseniornotesa 158,134 –
Otherfinancialliabilitiesb 6,219 –
Current 164,353 –
Guaranteedseniornotesa 8,481,768 3,214,082
Otherfinancialliabilitiesb 70,630 –
Bankborrowingsc 125,000 1,014,500
Subordinatednotesd 515,000 515,000
Less:unamortisedborrowingcosts (50,901) (35,299)
Non-current 9,141,497 4,708,283
9,305,850 4,708,283
a)RepresentsUSDdenominatedprivateplacementnotesofUS$725million,CADmediumtermnotes(MTN)ofC$300million,JPYMTNof¥10,000million,GBPMTNof£950million,EURMTNof¤1,350millionandUSDdenominated144AnotesofUS$2,150millionmeasuredattheexchangerateatreportingdate,andA$315millionofAUDdenominatedprivateplacementnotesandAUDMTNofA$300million.RefertoNote21fordetailsofinterestratesandmaturityprofiles.
b)RepresentsfixedrateUS$59.3millionnotionalliabilitymeasuredatthespotexchangerateatreportingdate.
c)Relatestothenon-currentportionoflong-termborrowings.RefertoNote21fordetailsofinterestratesandmaturityprofiles.
d)RepresentsAUDdenominatedsubordinatednotes.RefertoNote21fordetailsofinterestratesandmaturityprofiles.
For
per
sona
l use
onl
y

58 APA Group | Annual Report 2015
AUSTRALIAN PIPELINE TRUST AND ITS CONTROLLED ENTITIES
NOTES TO THE CONSOLIDATED FINANCIAL STATEMENTS CONTINUEDFor the financial year ended 30 June 2015
CAPITAL MANAGEMENT
20. Borrowings (continued)
Financingfacilitiesavailable 2015 2014 $000 $000
Total facilities
Guaranteedseniornotesa 8,639,902 3,214,082
Bankborrowingsc 1,300,000 1,850,000
Subordinatednotesd 515,000 515,000
10,454,902 5,579,082
Facilities used at balance date
Guaranteedseniornotesa 8,639,902 3,214,082
Bankborrowingsc 125,000 1,014,500
Subordinatednotesd 515,000 515,000
9,279,902 4,743,582
Facilities unused at balance date
Guaranteedseniornotesa – –
Bankborrowingsc 1,175,000 835,500
Subordinatednotesd – –
1,175,000 835,500
a)RepresentsUSDdenominatedprivateplacementnotesofUS$725million,CADmediumtermnotes(MTN)ofC$300million,JPYMTNof¥10,000million,GBPMTNof£950million,EURMTNof¤1,350millionandUSDdenominated144AnotesofUS$2,150millionmeasuredattheexchangerateatreportingdate,andA$315millionofAUDdenominatedprivateplacementnotesandAUDMTNofA$300million.RefertoNote21fordetailsofinterestratesandmaturityprofiles.
c)Relatestothenon-currentportionoflong-termborrowings.RefertoNote21fordetailsofinterestratesandmaturityprofiles.
d)RepresentsAUDdenominatedsubordinatednotes.RefertoNote21fordetailsofinterestratesandmaturityprofiles.
21. Financial risk managementTheTreasurydepartmentwithinFinanceisresponsiblefortheoverallmanagementofAPAGroup’scapitalraisingactivities,liquidity, lenderrelationshipsandengagement,debtportfoliomanagement, interestrateandforeignexchangehedging,creditratingmaintenanceandthirdpartyindemnities(bankguarantees)withinriskmanagementparametersreviewedbytheBoard.TheAuditandRiskManagementCommitteeapproveswrittenprinciplesforoverallriskmanagement,aswellaspoliciescoveringspecificareassuchassuchasliquidityandfundingrisk,foreigncurrencyrisk,interestraterisk,creditrisk,contractandlegalriskandoperationalrisk.APAGroup’sBoardofDirectorsensuresthereisanappropriateRiskManagementPolicyforthemanagementoftreasuryriskandcompliancewiththepolicythroughmonthlyreportingfromtheTreasurydepartment.
APAGroup’sactivitiesgeneratefinancialinstrumentscomprisingofcash,receivables,payablesandinterestbearingliabilitieswhichexposeittovariousrisksassummarisedbelow:
a) Marketriskincludingcurrencyrisk,interestrateriskandpricerisk;
b) Creditrisk;and
c) Liquidityrisk.
TreasuryasacentralisedfunctionprovidesAPAGroupwiththebenefitsofefficientcashutilisation,controloffundinganditsassociatedcosts,efficientandeffectivemanagementofaggregatedfinancialriskandconcentrationoffinancialexpertise,atanacceptablecostandmanagesrisksthroughtheuseofnaturalhedgesandderivativeinstruments.APAGroupdoesnotengageinspeculativetrading.AllderivativeshavebeentradedtohedgeunderlyingorexistingexposuresandhaveadheredtotheBoardapprovedTreasuryRiskManagementPolicy.
a) MarketriskAPAGroup’smarketriskexposureisprimarilyduetochangesinmarketpricessuchasinterestandforeignexchangerates.APAGroupentersintoavarietyofderivativefinancialinstrumentstomanageitsexposuretointerestrateandforeigncurrencyrisk,including:
— forwardexchangecontractstohedgetheexchangerateriskarisingfromforeigncurrencycashflows,mainlyUSdollars,derivedfromrevenues,interestpaymentsandcapitalequipmentpurchases;
— crosscurrencyinterestrateswapstomanagethecurrencyriskassociatedwithforeigncurrencydenominatedborrowings;
— foreigncurrencydenominatedborrowingstomanagethecurrencyriskassociatedwithforeigncurrencydenominatedrevenueandreceivables;and
— interestrateswapstomitigatetheriskofrisinginterestrates.
AchangeinthenatureofAPAGroup’sexposuretoforeigncurrencyhasoriginatedthisyearwiththeacquisitionoftheWallumbillaGladstonePipeline(formerlyQCLNGPipeline)inJune2015intheformofUSdollardenominatedrevenuesandborrowingseitherdirectlyorthroughtheuseofderivatives.
APAGroupisalsoexposedtopriceriskarisingfromitsinvestmentinandforwardpurchasecontractsoverlistedequities.
For
per
sona
l use
onl
y
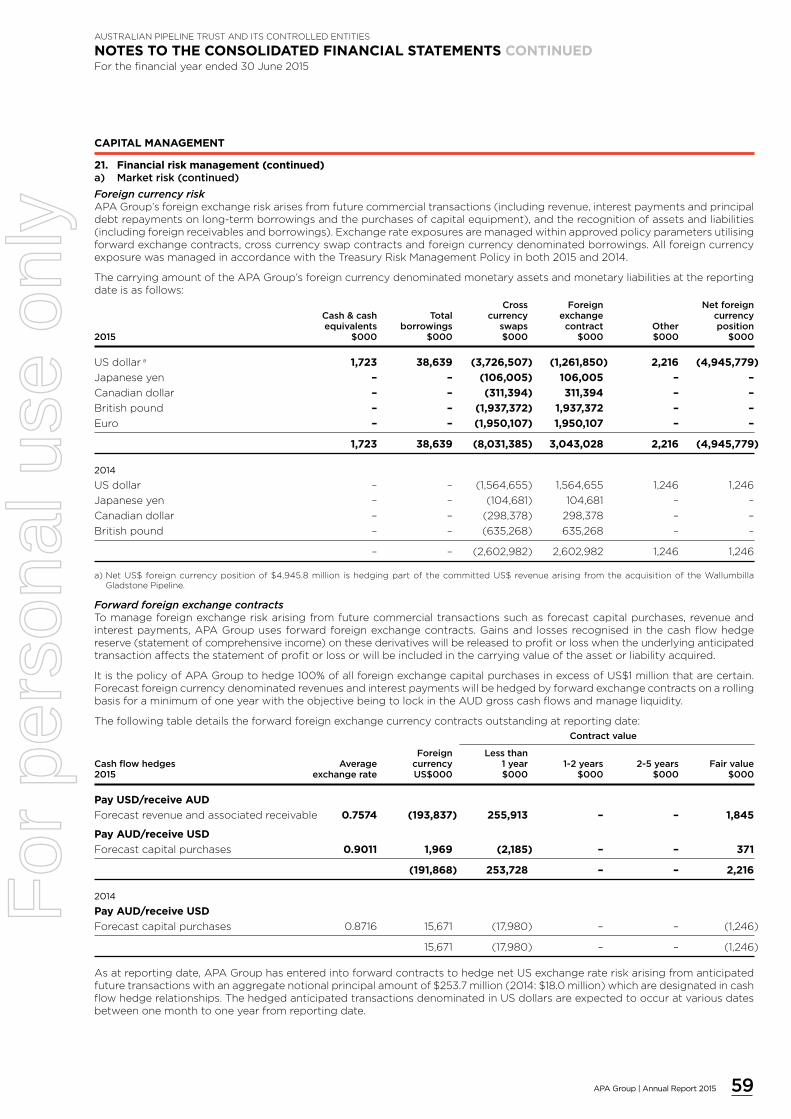
59APA Group | Annual Report 2015
AUSTRALIAN PIPELINE TRUST AND ITS CONTROLLED ENTITIES
NOTES TO THE CONSOLIDATED FINANCIAL STATEMENTS CONTINUEDFor the financial year ended 30 June 2015
CAPITAL MANAGEMENT
21. Financial risk management (continued)a) Marketrisk(continued)
Foreign currency riskAPAGroup’sforeignexchangeriskarisesfromfuturecommercialtransactions(includingrevenue,interestpaymentsandprincipaldebtrepaymentsonlong-termborrowingsandthepurchasesofcapitalequipment),andtherecognitionofassetsandliabilities(includingforeignreceivablesandborrowings).Exchangerateexposuresaremanagedwithinapprovedpolicyparametersutilisingforwardexchangecontracts,crosscurrencyswapcontractsandforeigncurrencydenominatedborrowings.AllforeigncurrencyexposurewasmanagedinaccordancewiththeTreasuryRiskManagementPolicyinboth2015and2014.
ThecarryingamountoftheAPAGroup’sforeigncurrencydenominatedmonetaryassetsandmonetaryliabilitiesatthereportingdateisasfollows:
Cross Foreign Netforeign Cash&cash Total currency exchange currency equivalents borrowings swaps contract Other position2015 $000 $000 $000 $000 $000 $000
USdollara 1,723 38,639 (3,726,507) (1,261,850) 2,216 (4,945,779)
Japaneseyen – – (106,005) 106,005 – –
Canadiandollar – – (311,394) 311,394 – –
Britishpound – – (1,937,372) 1,937,372 – –
Euro – – (1,950,107) 1,950,107 – –
1,723 38,639 (8,031,385) 3,043,028 2,216 (4,945,779)
2014
USdollar – – (1,564,655) 1,564,655 1,246 1,246
Japaneseyen – – (104,681) 104,681 – –
Canadiandollar – – (298,378) 298,378 – –
Britishpound – – (635,268) 635,268 – –
– – (2,602,982) 2,602,982 1,246 1,246
a)NetUS$foreigncurrencypositionof$4,945.8million ishedgingpartofthecommittedUS$revenuearisingfromtheacquisitionoftheWallumbillaGladstonePipeline.
Forward foreign exchange contractsTomanageforeignexchangeriskarisingfromfuturecommercialtransactionssuchasforecastcapitalpurchases,revenueandinterestpayments,APAGroupusesforwardforeignexchangecontracts.Gainsandlossesrecognisedinthecashflowhedgereserve(statementofcomprehensiveincome)onthesederivativeswillbereleasedtoprofitorlosswhentheunderlyinganticipatedtransactionaffectsthestatementofprofitorlossorwillbeincludedinthecarryingvalueoftheassetorliabilityacquired.
ItisthepolicyofAPAGrouptohedge100%ofallforeignexchangecapitalpurchasesinexcessofUS$1millionthatarecertain.ForecastforeigncurrencydenominatedrevenuesandinterestpaymentswillbehedgedbyforwardexchangecontractsonarollingbasisforaminimumofoneyearwiththeobjectivebeingtolockintheAUDgrosscashflowsandmanageliquidity.
Thefollowingtabledetailstheforwardforeignexchangecurrencycontractsoutstandingatreportingdate:
Contractvalue
Foreign Lessthan Cashflowhedges Average currency 1year 1-2years 2-5years Fairvalue2015 exchangerate US$000 $000 $000 $000 $000
Pay USD/receive AUD
Forecastrevenueandassociatedreceivable 0.7574 (193,837) 255,913 – – 1,845
Pay AUD/receive USD
Forecastcapitalpurchases 0.9011 1,969 (2,185) – – 371
(191,868) 253,728 – – 2,216
2014
Pay AUD/receive USD
Forecastcapitalpurchases 0.8716 15,671 (17,980) – – (1,246)
15,671 (17,980) – – (1,246)
Asatreportingdate,APAGrouphasenteredintoforwardcontractstohedgenetUSexchangerateriskarisingfromanticipatedfuturetransactionswithanaggregatenotionalprincipalamountof$253.7million(2014:$18.0million)whicharedesignatedincashflowhedgerelationships.ThehedgedanticipatedtransactionsdenominatedinUSdollarsareexpectedtooccuratvariousdatesbetweenonemonthtooneyearfromreportingdate.
For
per
sona
l use
onl
y

60 APA Group | Annual Report 2015
AUSTRALIAN PIPELINE TRUST AND ITS CONTROLLED ENTITIES
NOTES TO THE CONSOLIDATED FINANCIAL STATEMENTS CONTINUEDFor the financial year ended 30 June 2015
CAPITAL MANAGEMENT
21. Financial risk management (continued)a) Marketrisk(continued)
Cross currency swap contractsAPAGroupentersintocrosscurrencyswapcontractstomitigatetheriskofadversemovementsinforeignexchangeratesinrelationtoprincipalandinterestpaymentsarisingfromforeigncurrencyborrowings.APAGroupreceivesfixedamountsinthevariousforeigncurrenciesandpaysbothvariableinterestrates(basedonAustralianBBSW)andfixedinterestratesbasedonagreedswapratesforthefulltermoftheunderlyingborrowings.Incertaincircumstancesborrowingsareleftintheforeigncurrency,orhedgedfromoneforeigncurrencytoanothertomatchpaymentsofinterestandprincipalagainstexpectedfuturebusinesscashflowsinthatforeigncurrency.
Thefollowingtabledetailsthecrosscurrencyswapcontractprincipalpaymentsdueasatthereportingdate:
Exchange Lessthan MorethanCashflowhedges Foreign rate 1year 1-2years 2-5years 5years2015 currency $ $000 $000 $000 $000
Pay AUD/receive foreign currency
2003USPPNotes AUD/USD 0.6573 (185,608) – (95,847) –
2007USPPNotes AUD/USD 0.8068 – (190,877) (151,215) (153,694)
2009USPPNotes AUD/USD 0.7576 – (85,787) (98,997) –
2012JPYmediumtermnotes AUD/JPY 79.4502 – – (125,865) –
2012CADmediumtermnotes AUD/CAD 1.0363 – – (289,494) –
2012US144A AUD/USD 1.0198 – – – (735,438)
2012GBPmediumtermnotes AUD/GBP 0.6530 – – – (535,988)
Pay USD/receive foreign currency
2015EURmediumtermnotes USD/EUR 0.9515 – – – (1,839,073)
2015GBPmediumtermnotes USD/GBP 0.6773 – – – (1,148,283)
(185,608) (276,664) (761,418) (4,412,476)
2014
Pay AUD/receive foreign currency
2003USPPNotes USD 0.6573 – (185,608) (95,847) –
2007USPPNotes USD 0.8068 – – (342,092) (153,694)
2009USPPNotes USD 0.7576 – – (85,787) (98,997)
2012JPYmediumtermnotes JPY 79.4502 – – (125,865) –
2012CADmediumtermnotes CAD 1.0363 – – – (289,494)
2012US144A USD 1.0198 – – – (735,438)
2012GBPmediumtermnotes GBP 0.6530 – – – (535,988)
– (185,608) (649,591) (1,813,611)
Foreign currency denominated borrowingsAPAGroupmaintainsalevelofborrowingsinforeigncurrency,orswappedfromoneforeigncurrencytoanothertomatchpaymentsofinterestandprincipalagainstexpectedfuturebusinesscashflowsinthatforeigncurrency.Thismitigatestheriskofadversemovementsinforeignexchangeratesinrelationtoprincipalandinterestpaymentsarisingfromtheseforeigncurrencyborrowingsaswellasfuturerevenues.
Foreign currency sensitivity analysisTheanalysisbelowshowstheeffectonprofitandtotalequityofretranslatingcash,receivables,payablesandinterest-bearingliabilitiesdenominatedinUSD,JPY,CAD,GBPandEURintoAUD,hadtheratesbeen20percenthigherorlowerthantherelevantyearendrate,withallothervariablesheldconstant,andtakingintoaccountallunderlyingexposuresandrelatedhedges.Asensitivityof20percenthasbeenselectedandrepresentsmanagement’sassessmentofthepossiblechangeinratestakingintoaccountthecurrentlevelofexchangeratesandthevolatilityobservedbothonahistoricalbasisandonmarketexpectationsforfuturemovements.Thesensitivityanalysisincludesonlyoutstandingforeigncurrencydenominatedmonetaryitemsandadjuststheirtranslationattheperiodendfora20percentchangeinforeigncurrencyrates.
— Therewouldbenoimpactonnetprofitasallforeigncurrencyexposuresarefullyhedged(2014:nil);and
— Equityreserveswoulddecreaseby$1,268.4millionwitha20percentdepreciationoftheA$orincreaseby$845.1millionwitha20percentincreaseinforeignexchangerates(2014:increaseby$1.8millionordecreaseby$1.5millionrespectively).Theincreaseinsensitivityisduetotheincreaseinthenotionalvalueofchangesinthevalueofforwardexchangecontractsthatareinahedgingrelationshipwithhighlyprobableforecasttransactions.
Interest rate riskAPAGroup’s interestraterisk isderivedpredominatelyfromborrowingssubjecttofixedandfloatinginterestrates.ThisriskismanagedbyAPAGroupbymaintaininganappropriatemixbetweenfixedandfloatingrateborrowings,throughtheuseofinterestrateswapcontracts.Hedgingactivitiesareevaluatedregularlytoalignwithinterestrateviewsanddefinedpolicy,ensuringappropriatehedgingstrategiesareapplied.
APAGroup’sexposurestointerestrateriskonfinancialliabilitiesaredetailedintheliquidityriskmanagementsectionofthisnote.Exposuretofinancialassetsislimitedtocashandcashequivalentsamountingto$411.9millionasat30June2015(2014:$7.0million).
For
per
sona
l use
onl
y

61APA Group | Annual Report 2015
AUSTRALIAN PIPELINE TRUST AND ITS CONTROLLED ENTITIES
NOTES TO THE CONSOLIDATED FINANCIAL STATEMENTS CONTINUEDFor the financial year ended 30 June 2015
CAPITAL MANAGEMENT
21. Financial risk management (continued)a) Marketrisk(continued)
Interest rate swap contractsInterestrateswapcontractshavetheeconomiceffectofconvertingborrowingsfromfloatingtofixedratesonagreednotionalprincipalamountsenablingAPAGrouptomitigatetheriskofcashflowexposuresonvariableratedebtheld.Thefairvalueofinterestrateswapsatthereportingdateisdeterminedbydiscountingthefuturecashflowsusingtheyieldcurvesatreportingdate.Theaverageinterestrateisbasedontheoutstandingbalancesattheendofthefinancialyear.
Thefollowingtabledetailsthenotionalprincipalamountsandremainingtermsofthecrosscurrencyandinterestrateswapcontractsoutstandingasattheendofthefinancialyear:
Weightedaverageinterestrate Notionalprincipalamount Fairvalue
2015 2014 2015 2014 2015 2014 %p.a. % p.a. $000 $000 $000 $000
Cash flow hedges – Pay fixed AUD interest – receive floating AUD or fixed/floating foreign currency
Lessthan1year 7.10 5.90 310,608 100,000 (32,637) (1,852)
1yearto2years 8.58 7.10 276,664 310,608 7,520 (66,627)
2yearsto5years 7.60 7.75 761,417 649,591 (31,028) (130,564)
5yearsandmore 4.61 7.24 4,412,476 1,813,611 352,208 (16,621)
5,761,165 2,873,810 296,063 (215,664)
Theinterestrateswapssettleonaquarterlyorsemi-annualbasis.ThefloatingratebenchmarkontheinterestrateswapsisAustralianBBSW.APAGroupwillsettlethedifferencebetweenthefixedandfloatinginterestrateonanetbasis.
AllinterestrateswapcontractsexchangingfloatingrateinterestamountsforfixedrateinterestamountsaredesignatedascashflowhedgesinordertoreduceAPAGroup’scashflowexposureresultingfromvariableinterestratesonborrowings.
Interest rate sensitivity analysisThesensitivityanalysisbelowhasbeendeterminedbasedontheexposuretointerestratesforbothderivativeandnon-derivativeinstrumentsheld.A100basispointincreaseordecreaseisusedandrepresentsmanagement’sassessmentofthegreatestpossiblechangeininterestrates.Atreportingdate,ifinterestrateshadbeen100basispointshigherorlowerandallothervariableswereheldconstant,APAGroup’s:
— netprofitwoulddecreaseby$5,150,000orincreaseby$5,150,000(2014:decreaseby$13,045,000orincreaseby$13,045,000).ThisismainlyattributabletoAPAGroup’sexposuretointerestratesonitsvariablerateborrowings,includingitsAustralianDollarsubordinatednotes;and
— equityreserveswouldincreaseby$14,483,000witha100basispointdecreaseininterestratesorincreaseby$38,594,000witha100basispointincreaseininterestrates(2014:increaseby$6,923,000ordecreaseby$6,386,000respectively).Thisisduetothechangesinthefairvalueofderivativeinterestinstruments.
APAGroup’sprofitsensitivitytointerestrateshasdecreasedduringthecurrentperiodduetotheoveralldecreaseinthelevelofAPAGroup’sunhedgedfloatingrateborrowings.Thevaluationoftheincrease/decreaseinequityreservesisbasedon1.00%p.a.increase/decreaseintheyieldcurveatthereportingdate.Theincreaseinsensitivityinequityisduetotheincreaseinthenotionalvalueofinterestrateandcrosscurrencyswaps.
Price riskAPAGroupisexposedtopriceriskarisingfromitsinvestmentinandforwardpurchasecontractsoverlistedequities.Theinvestmentandforwardpurchasecontractsareheldtomeetstrategicorhedgingobjectivesratherthanfortradingpurposes.APAGroupdoesnotactivelytradeanyoftheseholdings.
Price risk sensitivityThesensitivityanalysisbelowhasbeendeterminedbasedontheexposuretopricerisksatthereportingdate.Atthereportingdate,ifthepricesofAPAGroup’sinvestmentsinEthanePipelineIncomeFundandforwardpurchasecontractsoverlistedequitieshadbeen5percentp.a.higherorlower:
— netprofitwouldhavebeenunaffectedastheinvestmentisclassifiedasavailable-for-saleandnoinvestmentsweredisposedoforimpaired,thereisalsonileffectfromtheforwardsasthecorrespondingexposurewilloffsetinfull(2014:$nil);and
— equityreserveswoulddecrease/increaseby$4,000(2014:$96,000),duetothechangesinthefairvalueofavailable-for-saleinvestments.
APAGroup’sanalysisofitsexposuretopriceriskhasdeclinedduringthecurrentperiodcomparedtothepriorperiod.Thisoutcomeislargelyaresultofthedecreaseinthepricevolatility,relativetothemarket,oftheinvestmentinthestapledsecurityofEthanePipelineIncomeFund.
b) CreditriskCreditriskreferstotheriskthatacounterpartywilldefaultonitscontractualobligationsresultinginfinanciallosstoAPAGroup.APAGrouphasadoptedthepolicyofonlydealingwithcreditworthycounterpartiesandobtainingsufficientcollateralorbankguaranteeswhereappropriateasameansofmitigatinganyriskofloss.Forfinancialinvestmentsormarketriskhedging,APAGroup’spolicyistoonlytransactwithcounterpartiesthathaveacreditratingofA–(Standard&Poor’s)/A3(Moody’s)orhigherunlessspecificallyapprovedbytheboard.Whereacounterparty’sratingfallsbelowthisthresholdfollowingatransaction,noothertransactionscanbeexecutedwiththatcounterpartyuntiltheexposureissufficientlyreducedortheircreditratingisupgradedaboveAPAGroup’sminimumthreshold.APAGroup’sexposuretofinancialinstrumentanddepositcreditriskiscloselymonitoredagainstcounterpartycredit limits imposedbytheTreasuryRiskManagementPolicyapprovedbytheBoard.TheselimitsareregularlyreviewedbytheBoard.
For
per
sona
l use
onl
y

62 APA Group | Annual Report 2015
AUSTRALIAN PIPELINE TRUST AND ITS CONTROLLED ENTITIES
NOTES TO THE CONSOLIDATED FINANCIAL STATEMENTS CONTINUEDFor the financial year ended 30 June 2015
CAPITAL MANAGEMENT
21. Financial risk management (continued)b) Creditrisk(continued)Tradereceivablesconsistofmainlycorporatecustomerswhicharediverseandgeographicallyspread.MostsignificantcustomershaveaninvestmentgraderatingfromeitherStandard&Poor’sorMoody’s.Ongoingcreditmonitoringofthefinancialpositionofcustomersismaintained.
Thecarryingamountoffinancialassetsrecordedinthefinancialstatements,netofanyallowances,representsAPAGroup’smaximumexposuretocreditriskinrelationtothoseassets.
Cross guaranteeInaccordancewithadeedofcrossguarantee,APTPipelinesLimited,asubsidiaryofAPAGroup,hasagreedtoprovidefinancialsupport,whenandasrequired,toallwholly-ownedcontrolledentitieswitheitheradeficitinshareholders’fundsoranexcessofcurrentliabilitiesovercurrentassets.Thefairvalueofthefinancialguaranteeasat30June2015hasbeendeterminedtobeimmaterialandnoliabilityhasbeenrecorded(2014:$nil).
c) LiquidityriskAPAGrouphasapolicydealingwithliquidityriskwhichrequiresanappropriateliquidityriskmanagementframeworkforthemanagementofAPAGroup’sshort,mediumandlong-termfundingandliquiditymanagementrequirements.Liquidityriskismanagedbymaintainingadequatecashreservesandbankingfacilities,bymonitoringandforecastingcashflowandwherepossiblearrangingliabilitieswithlongermaturitiestomorecloselymatchtheunderlyingassetsofAPAGroup.
DetailedinthetablefollowingareAPAGroup’sremainingcontractualmaturitiesforitsnon-derivativefinancialliabilities.ThetablehasbeendrawnupbasedontheundiscountedcashflowsoffinancialliabilitiestakingaccountoftheearliestdateonwhichAPAGroupcanberequiredtopay.Thetableincludesbothinterestandprincipalcashflows.
ThetablebelowshowstheundiscountedAustraliandollarcashflowsassociatedwiththeforeigncurrencynotes,crosscurrencyinterestrateswapsandfixedinterestrateswapsinaggregate. Average Lessthan Morethan interestrate 1year 1-5years 5years2015 Maturity %p.a. $000 $000 $000
Unsecured financial liabilitiesTradeandotherpayables – 405,685 – –Unsecuredbankborrowingsa 3.09 2,935 125,975 –2012SubordinatedNotes 1-Oct-72 7.20 34,203 148,917 2,795,775Interestrateswaps(netsettled) 6.28 3,844 1,302 –
Denominated in A$Otherfinancialliabilitiesb 7,574 30,296 48,918
Guaranteed Senior Notesc
Denominated in A$2007SeriesA 15-May-17 7.33 367 5,367 –2007SeriesC 15-May-17 7.38 7,318 106,475 –2007SeriesE 15-May-19 7.40 5,045 83,304 –2007SeriesG 15-May-22 7.45 6,002 24,008 92,5862007SeriesH 15-May-22 7.45 4,617 18,468 71,2202010AUDMediumTermNote 22-Jul-20 7.75 23,250 93,000 311,625
Denominated in US$2003SeriesC 9-Sep-15 5.77 192,773 – –2003SeriesD 9-Sep-18 6.02 6,949 113,220 –2007SeriesB 15-May-17 5.89 13,986 204,864 –2007SeriesD 15-May-19 5.99 11,111 184,546 –2007SeriesF 15-May-22 6.14 11,354 45,416 176,4332009SeriesA 1-Jul-16 8.35 9,805 90,569 –2009SeriesB 1-Jul-19 8.86 11,825 140,047 –2012US144A 11-Oct-22 3.88 48,989 197,031 857,9102015US144Ab 23-Mar-25 4.20 59,883 239,533 1,725,3772015US144Ab 23-Mar-35 5.00 19,443 77,771 680,709
Denominated in stated foreign currency2012JPYMediumTermNote 22-Jun-18 1.23 4,291 147,274 –2012CADMediumTermNote 24-Jul-19 4.25 19,422 357,766 –2012GBPMediumTermNote 26-Nov-24 4.25 39,567 157,943 713,8232015GBPMediumTermNoteb 22-Mar-30 3.50 51,894 206,081 1,663,4262015EURMediumTermNoteb 22-Mar-22 1.38 35,023 139,314 1,023,1632015EURMediumTermNoteb 22-Mar-27 2.00 39,142 155,699 1,158,040
1,076,297 3,094,186 11,319,005
a)Facilitiesmatureon19September2016($400millionlimit),19September2017($425millionlimit),19December2018($200millionlimit),and19September2019($275millionlimit).
b)FacilitiesaredenominatedorfullyswappedviawayofCCIRSintoUS$.CashflowsrepresenttheUS$cashflowtranslatedattheUSD/AUDspotrateasat30June2015.TheseamountsarefullyhedgedbyforwardexchangecontractsorfutureUS$revenues.
c)Ratesshownarethecouponrate.
For
per
sona
l use
onl
y
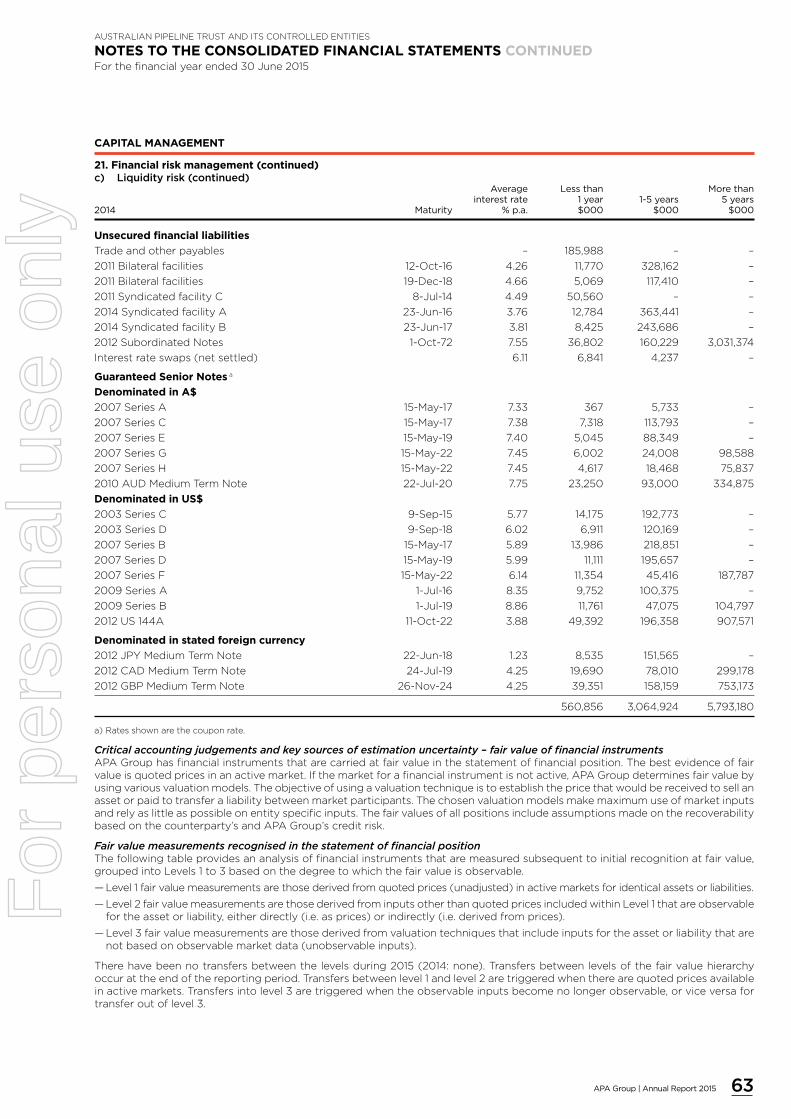
63APA Group | Annual Report 2015
AUSTRALIAN PIPELINE TRUST AND ITS CONTROLLED ENTITIES
NOTES TO THE CONSOLIDATED FINANCIAL STATEMENTS CONTINUEDFor the financial year ended 30 June 2015
CAPITAL MANAGEMENT
21. Financial risk management (continued)c) Liquidityrisk(continued) Average Less than More than interest rate 1 year 1-5 years 5 years 2014 Maturity % p.a. $000 $000 $000
Unsecured financial liabilities
Tradeandotherpayables – 185,988 – –
2011Bilateralfacilities 12-Oct-16 4.26 11,770 328,162 –
2011Bilateralfacilities 19-Dec-18 4.66 5,069 117,410 –
2011SyndicatedfacilityC 8-Jul-14 4.49 50,560 – –
2014SyndicatedfacilityA 23-Jun-16 3.76 12,784 363,441 –
2014SyndicatedfacilityB 23-Jun-17 3.81 8,425 243,686 –
2012SubordinatedNotes 1-Oct-72 7.55 36,802 160,229 3,031,374
Interestrateswaps(netsettled) 6.11 6,841 4,237 –
Guaranteed Senior Notesa
Denominated in A$
2007SeriesA 15-May-17 7.33 367 5,733 –
2007SeriesC 15-May-17 7.38 7,318 113,793 –
2007SeriesE 15-May-19 7.40 5,045 88,349 –
2007SeriesG 15-May-22 7.45 6,002 24,008 98,588
2007SeriesH 15-May-22 7.45 4,617 18,468 75,837
2010AUDMediumTermNote 22-Jul-20 7.75 23,250 93,000 334,875
Denominated in US$
2003SeriesC 9-Sep-15 5.77 14,175 192,773 –
2003SeriesD 9-Sep-18 6.02 6,911 120,169 –
2007SeriesB 15-May-17 5.89 13,986 218,851 –
2007SeriesD 15-May-19 5.99 11,111 195,657 –
2007SeriesF 15-May-22 6.14 11,354 45,416 187,787
2009SeriesA 1-Jul-16 8.35 9,752 100,375 –
2009SeriesB 1-Jul-19 8.86 11,761 47,075 104,797
2012US144A 11-Oct-22 3.88 49,392 196,358 907,571
Denominated in stated foreign currency
2012JPYMediumTermNote 22-Jun-18 1.23 8,535 151,565 –
2012CADMediumTermNote 24-Jul-19 4.25 19,690 78,010 299,178
2012GBPMediumTermNote 26-Nov-24 4.25 39,351 158,159 753,173
560,856 3,064,924 5,793,180
a)Ratesshownarethecouponrate.
Critical accounting judgements and key sources of estimation uncertainty – fair value of financial instrumentsAPAGrouphasfinancialinstrumentsthatarecarriedatfairvalueinthestatementoffinancialposition.Thebestevidenceoffairvalueisquotedpricesinanactivemarket.Ifthemarketforafinancialinstrumentisnotactive,APAGroupdeterminesfairvaluebyusingvariousvaluationmodels.Theobjectiveofusingavaluationtechniqueistoestablishthepricethatwouldbereceivedtosellanassetorpaidtotransferaliabilitybetweenmarketparticipants.Thechosenvaluationmodelsmakemaximumuseofmarketinputsandrelyaslittleaspossibleonentityspecificinputs.Thefairvaluesofallpositionsincludeassumptionsmadeontherecoverabilitybasedonthecounterparty’sandAPAGroup’screditrisk.
Fair value measurements recognised in the statement of financial positionThefollowingtableprovidesananalysisoffinancialinstrumentsthataremeasuredsubsequenttoinitialrecognitionatfairvalue,groupedintoLevels1to3basedonthedegreetowhichthefairvalueisobservable.
— Level1fairvaluemeasurementsarethosederivedfromquotedprices(unadjusted)inactivemarketsforidenticalassetsorliabilities.
— Level2fairvaluemeasurementsarethosederivedfrominputsotherthanquotedpricesincludedwithinLevel1thatareobservablefortheassetorliability,eitherdirectly(i.e.asprices)orindirectly(i.e.derivedfromprices).
— Level3fairvaluemeasurementsarethosederivedfromvaluationtechniquesthatincludeinputsfortheassetorliabilitythatarenotbasedonobservablemarketdata(unobservableinputs).
Therehavebeennotransfersbetweenthelevelsduring2015(2014:none).Transfersbetweenlevelsofthefairvaluehierarchyoccurattheendofthereportingperiod.Transfersbetweenlevel1andlevel2aretriggeredwhentherearequotedpricesavailableinactivemarkets.Transfersintolevel3aretriggeredwhentheobservableinputsbecomenolongerobservable,orviceversafortransferoutoflevel3.
For
per
sona
l use
onl
y

64 APA Group | Annual Report 2015
AUSTRALIAN PIPELINE TRUST AND ITS CONTROLLED ENTITIES
NOTES TO THE CONSOLIDATED FINANCIAL STATEMENTS CONTINUEDFor the financial year ended 30 June 2015
CAPITAL MANAGEMENT
21. Financial risk management (continued)
Fair value of the Group’s financial assets and liabilities that are measured at fair value on a recurring basisThefairvaluesoffinancialassetsandfinancialliabilitiesaremeasuredattheendofeachreportingperiodanddeterminedasfollows:
— thefairvaluesofavailable-for-salefinancialassetsandfinancial liabilitieswithstandardtermsandconditionsandtradedonactiveliquidmarketsaredeterminedwithreferencetoquotedmarketprices,theseinstrumentsareclassifiedinthefairvaluehierarchyatlevel1;
— thefairvaluesofforwardforeignexchangecontractsincludedinhedgingassetsandliabilitiesarecalculatedusingdiscountedcashflowanalysisbasedonobservableforwardexchangeratesattheendofthereportingperiodandcontractforwardratesdiscountedataratethatreflectsthecreditriskofthevariouscounterparties.Theinstrumentsareclassifiedinthefairvaluehierarchyatlevel2;
— thefairvaluesofinterestratesswaps,crosscurrencyswaps,equityforwardsandotherderivativeinstrumentsincludedinhedgingassetsandliabilitiesarecalculatedusingdiscountedcashflowanalysisusingobservableyieldcurvesattheendofthereportingperiodandcontractratesdiscountedataratethatreflectsthecreditriskofthevariouscounterparties;
— thefairvaluesofotherfinancialassetsandfinancialliabilities(excludingderivativeinstruments)aredeterminedinaccordancewithgenerallyacceptedpricingmodelsbasedondiscountedcashflowanalysisusingpricesfromobservablecurrentmarketsdiscountedataratethatreflectsthecreditriskofthevariouscounterparties.Theinstrumentsareclassifiedinthefairvaluehierarchyatlevel2;
— thefairvalueoffinancialguaranteecontractsisdeterminedbasedupontheprobabilityofdefaultbythespecifiedcounterpartyextrapolatedfrommarket-basedcreditinformationandtheamountofloss,giventhedefault.Theinstrumentsareclassifiedinthefairvaluehierarchyatlevel2;and
— thecarryingvalueoffinancialassetsandliabilitiesrecordedatamortisedcostinthefinancialstatementsapproximatetheirfairvaluehavingregardtothespecifictermsoftheagreementsunderlyingthoseassetsandliabilities.
Fair value hierarchy Level1 Level2 Level3 Total2015 $000 $000 $000 $000
Financial assets measured at fair value
Available-for-sale listed equity securities
EthanePipelineIncomeFund 7,162 – – 7,162
Equityforwardsdesignatedasfairvaluethroughprofitorloss – 5,199 – 5,199
CrossCurrencyInterestRateSwapsusedforhedging – 461,484 – 461,484
Forwardforeignexchangecontractsusedforhedging – 4,016 – 4,016
7,162 470,699 – 477,861
Financial liabilities measured at fair value
Interestrateswapsusedforhedging – 17,885 – 17,885
CrossCurrencyInterestRateSwapsusedforhedging – 147,537 – 147,537
Forwardforeignexchangecontractsusedforhedging – 1,800 – 1,800
– 167,222 – 167,222
2014
Financial assets measured at fair value
Available-for-sale listed equity securities
EthanePipelineIncomeFund 4,571 – – 4,571
Equityforwardsdesignatedasfairvaluethroughprofitorloss – 4,004 – 4,004
Forwardforeignexchangecontractsusedforhedging – 77,115 – 77,115
4,571 81,119 – 85,690
Financial liabilities measured at fair value
Interestrateswapsusedforhedging – 31,041 – 31,041
CrossCurrencyInterestRateSwapsusedforhedging – 261,739 – 261,739
Forwardforeignexchangecontractsusedforhedging – 1,246 – 1,246
– 294,026 – 294,026
For
per
sona
l use
onl
y
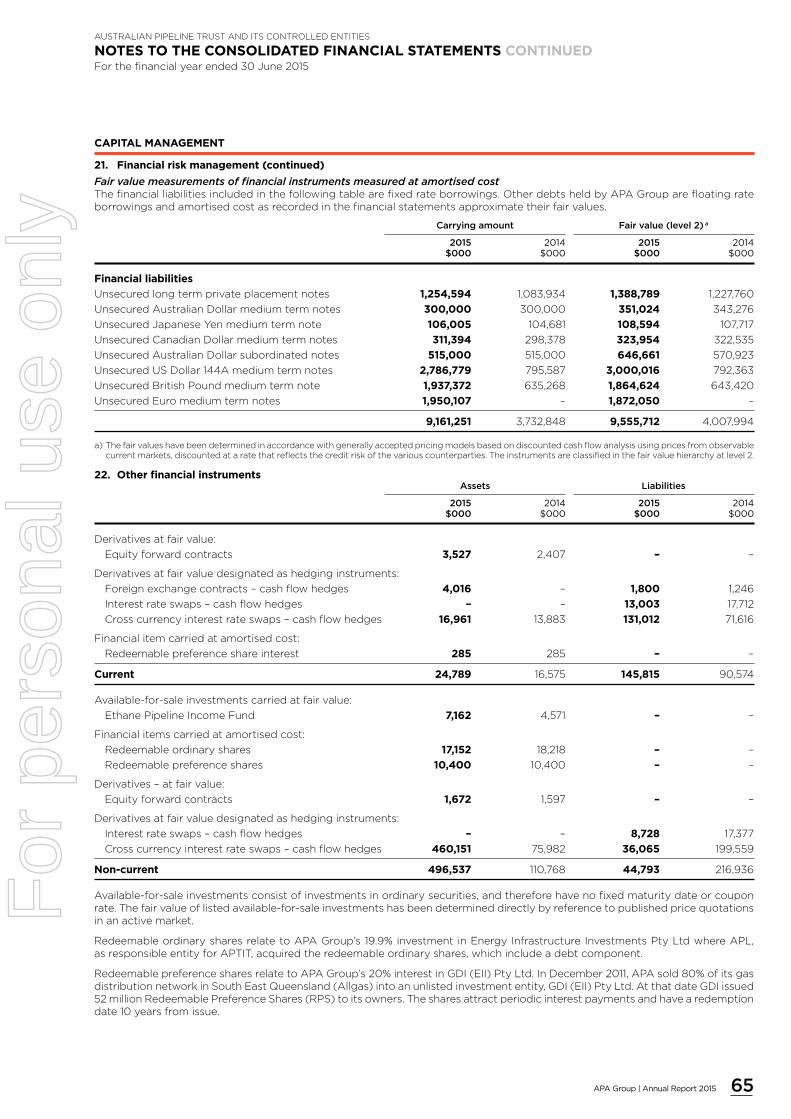
65APA Group | Annual Report 2015
AUSTRALIAN PIPELINE TRUST AND ITS CONTROLLED ENTITIES
NOTES TO THE CONSOLIDATED FINANCIAL STATEMENTS CONTINUEDFor the financial year ended 30 June 2015
CAPITAL MANAGEMENT
21. Financial risk management (continued)
Fair value measurements of financial instruments measured at amortised costThefinancialliabilitiesincludedinthefollowingtablearefixedrateborrowings.OtherdebtsheldbyAPAGrouparefloatingrateborrowingsandamortisedcostasrecordedinthefinancialstatementsapproximatetheirfairvalues.
Carryingamount Fairvalue(level2)a
2015 2014 2015 2014 $000 $000 $000 $000
Financial liabilities
Unsecuredlongtermprivateplacementnotes 1,254,594 1,083,934 1,388,789 1,227,760
UnsecuredAustralianDollarmediumtermnotes 300,000 300,000 351,024 343,276
UnsecuredJapaneseYenmediumtermnote 106,005 104,681 108,594 107,717
UnsecuredCanadianDollarmediumtermnotes 311,394 298,378 323,954 322,535
UnsecuredAustralianDollarsubordinatednotes 515,000 515,000 646,661 570,923
UnsecuredUSDollar144Amediumtermnotes 2,786,779 795,587 3,000,016 792,363
UnsecuredBritishPoundmediumtermnote 1,937,372 635,268 1,864,624 643,420
UnsecuredEuromediumtermnotes 1,950,107 – 1,872,050 –
9,161,251 3,732,848 9,555,712 4,007,994
a)Thefairvalueshavebeendeterminedinaccordancewithgenerallyacceptedpricingmodelsbasedondiscountedcashflowanalysisusingpricesfromobservablecurrentmarkets,discountedataratethatreflectsthecreditriskofthevariouscounterparties.Theinstrumentsareclassifiedinthefairvaluehierarchyatlevel2.
22. Other financial instruments Assets Liabilities
2015 2014 2015 2014 $000 $000 $000 $000
Derivativesatfairvalue:
Equityforwardcontracts 3,527 2,407 – –
Derivativesatfairvaluedesignatedashedginginstruments:
Foreignexchangecontracts–cashflowhedges 4,016 – 1,800 1,246
Interestrateswaps–cashflowhedges – – 13,003 17,712
Crosscurrencyinterestrateswaps–cashflowhedges 16,961 13,883 131,012 71,616
Financialitemcarriedatamortisedcost:
Redeemablepreferenceshareinterest 285 285 – –
Current 24,789 16,575 145,815 90,574
Available-for-saleinvestmentscarriedatfairvalue:
EthanePipelineIncomeFund 7,162 4,571 – –
Financialitemscarriedatamortisedcost:
Redeemableordinaryshares 17,152 18,218 – –
Redeemablepreferenceshares 10,400 10,400 – –
Derivatives–atfairvalue:
Equityforwardcontracts 1,672 1,597 – –
Derivativesatfairvaluedesignatedashedginginstruments:
Interestrateswaps–cashflowhedges – – 8,728 17,377
Crosscurrencyinterestrateswaps–cashflowhedges 460,151 75,982 36,065 199,559
Non-current 496,537 110,768 44,793 216,936
Available-for-saleinvestmentsconsistofinvestmentsinordinarysecurities,andthereforehavenofixedmaturitydateorcouponrate.Thefairvalueoflistedavailable-for-saleinvestmentshasbeendetermineddirectlybyreferencetopublishedpricequotationsinanactivemarket.
RedeemableordinarysharesrelatetoAPAGroup’s19.9%investmentinEnergyInfrastructureInvestmentsPtyLtdwhereAPL,asresponsibleentityforAPTIT,acquiredtheredeemableordinaryshares,whichincludeadebtcomponent.
RedeemablepreferencesharesrelatetoAPAGroup’s20%interestinGDI(EII)PtyLtd.InDecember2011,APAsold80%ofitsgasdistributionnetworkinSouthEastQueensland(Allgas)intoanunlistedinvestmententity,GDI(EII)PtyLtd.AtthatdateGDIissued52millionRedeemablePreferenceShares(RPS)toitsowners.Thesharesattractperiodicinterestpaymentsandhavearedemptiondate10yearsfromissue.
For
per
sona
l use
onl
y

66 APA Group | Annual Report 2015
AUSTRALIAN PIPELINE TRUST AND ITS CONTROLLED ENTITIES
NOTES TO THE CONSOLIDATED FINANCIAL STATEMENTS CONTINUEDFor the financial year ended 30 June 2015
CAPITAL MANAGEMENT
22. Other financial instruments (continued)
RecognitionandmeasurementHedge accountingAPAGroupdesignatescertainhedginginstruments,whichincludederivatives,embeddedderivativesandnon-derivativesinrespectofforeigncurrencyrisk,aseitherfairvaluehedgesorcashflowhedges.Therearenofairvaluehedgesinthecurrentorprioryear,hedgesofforeignexchangeandinterestrateriskareaccountedforascashflowhedges.
Attheinceptionofthehedgerelationship,APAGroupformallydesignatesanddocumentsthehedgerelationship,includingtheriskmanagementstrategyforundertakingthehedge.This includesidentificationofthehedginginstrument,hedgeditemortransaction,thenatureofthereriskbeinghedgedandhowtheentitywillassessthehedginginstrument’seffectiveness.Hedgesareexpectedtobehighlyeffectiveinachievingoffsettingchangesinfairvalueorcashflowsandtheireffectivenessisregularlyassessedtoensuretheycontinuetobeso.
Note21containsdetailsofthefairvaluesofthederivativeinstrumentsusedforhedgingpurposes.MovementsinthehedgingreserveinequityaredetailedintheConsolidatedStatementofChangesinEquity.
Derivativesareinitiallyrecognisedatfairvalueatthedateaderivativescontractisenteredintoandsubsequentlyremeasuredtotheirfairvalueateachreportingperiod.Theresultinggainorlossisrecognisedinprofitorlossimmediatelyunlessthederivativeisdesignatedandeffectiveasahedginginstrument,inwhicheventthetimingoftherecognitioninprofitorlossdependsonthenatureofthehedgerelationship.
Aderivativewithapositivefairvalueisrecognisedasafinancialasset,aderivativewithanegativefairvalueisrecognisedasafinancialliability.Thefairvalueofhedgingderivativesisclassifiedaseithercurrentornon-currentbasedonthetimingoftheunderlyingdiscountedcashflowsoftheinstrument.Cashflowsduewithin12monthsofthereportingdateareclassifiedascurrentandcashflowsdueafter12monthsofthereportingdateareclassifiedasnon-current.
Cash flow hedgesForcashflowhedges,theportionofthegainorlossonthehedginginstrumentthatiseffectiveisrecogniseddirectlyinequity,whiletheineffectiveportionisrecognisedinprofitorloss.
Amountsrecognisedinequityaretransferredtotheprofitorlosswhenthehedgedtransactionaffectsprofitorloss,suchaswhenthehedgedincomeorexpensesarerecognisedorwhenaforecastsaleoccurs.Whenthehedgeditemisthecostofanon-financialassetorliability,theamountstakentoequityaretransferredtotheinitialcarryingamountofthenon-financialassetorliability.
Iftheforecasttransactionisnolongerexpectedtooccur,amountspreviouslyrecognisedinequityaretransferredtotheprofitorloss.Ifthehedginginstrumentexpiresorissold,terminatedorexercised,orifitsdesignationasahedgeisrevoked,amountspreviouslyrecognisedinequityremaininequityuntiltheforecasttransactionoccurs.
Available-for-sale financial assetsCertainsharesheldbyAPAGroupareclassifiedasbeingavailable-for-sale.Theseassetsareinitiallyrecognisedatfairvalueplusanydirectlyattributabletransactioncosts.Subsequenttoinitialrecognition,theyaremeasuredatfairvalueandchangestherein,otherthanimpairmentlosses,whicharerecognisedinothercomprehensiveincomeandaccumulatedintheavailable-for-saleinvestmentrevaluationreserve.Whentheseassetsarederecognised,thegainorlossinequityisreclassifiedtoprofitorloss.
Dividendsonavailable-for-saleequityinstrumentsarerecognisedinprofitorlosswhentheAPAGroup’srighttoreceivethedividendsisestablished.
Determiningwhetheravailable-for-saleinvestmentsareimpairedrequiresanassessmentastowhetherdeclinesinvaluearesignificantorprolonged.Managementhastakenintoaccountanumberofqualitativeandquantitativefactorsinmakingthisassessment.Anyassessmentofwhetheradeclineinvaluerepresentsanimpairmentwouldresultinthetransferofthedecrementfromreservestothestatementofprofitorlossandothercomprehensiveincome.
Impairment of financial assetsFinancialassets,otherthanthoseatfairvaluethroughprofitorloss,areassessedforindicatorsofimpairmentattheendofeachreportingperiod.Financialassetsareimpairedwherethereisobjectiveevidencethatasaresultofoneormoreeventsthatoccurredaftertheinitialrecognitionofthefinancialassettheestimatedfuturecashflowsoftheinvestmentshavebeenunfavourablyimpacted.
Forfinancialassetscarriedatamortisedcost,theamountoftheimpairmentisthedifferencebetweentheasset’scarryingamountandthepresentvalueofestimatedfuturecashflows,discountedattheoriginaleffectiveinterestrate.Thecarryingamountoftheassetisreducedthroughtheuseofanallowanceaccountandthelossisrecognisedinthestatementofprofitorloss.
Withtheexceptionofavailable-for-saleequityinstruments,if,inasubsequentperiod,theamountoftheimpairmentlossdecreasesandthedecreasecanberelatedobjectivelytoaneventoccurringaftertheimpairmentwasrecognised,thepreviouslyrecognisedimpairmentlossisreversedthroughprofitorlosstotheextentthecarryingamountoftheinvestmentatthedatetheimpairmentisreversed,doesnotexceedwhattheamortisedcostwouldhavebeenhadtheimpairmentnotbeenrecognised. Inrespectofavailable-for-saleequityinstruments,anysubsequent increaseinfairvalueafteranimpairmentlossisrecognisedinothercomprehensiveincome.
For
per
sona
l use
onl
y

67APA Group | Annual Report 2015
AUSTRALIAN PIPELINE TRUST AND ITS CONTROLLED ENTITIES
NOTES TO THE CONSOLIDATED FINANCIAL STATEMENTS CONTINUEDFor the financial year ended 30 June 2015
CAPITAL MANAGEMENT
23. Issued capital 2015 2014 $000 $000
Securities
1,114,307,369securities,fullypaid(2014:835,750,807securities,fullypaid)a 3,195,449 1,816,460
2015 2014 No.of No. of securities 2015 securities 2014 000 $000 000 $000
Movements
Balanceatbeginningoffinancialyear 835,751 1,816,460 835,751 1,820,516
Capitalreturntosecurityholders(Note10) – – – (4,056)
Issueofsecuritiesunderentitlementoffer 278,556 1,400,122 – –
Lesstransactioncostsrelatingtotheissueofsecurities – (30,190) – –
Deferredtaxonthetransactioncostsrelatingtotheissueofsecurities – 9,057 – –
Balance at end of financial year 1,114,307 3,195,449 835,751 1,816,460
a)Fullypaidsecuritiescarryonevotepersecurityandcarrytherighttodistributions.NewsecuritiesissuedundertheentitlementofferwerenoteligiblefortheFY2015interimdistribution,butotherwiserankequallywithexistingsecuritiesfromallotment.
ChangestothethenCorporationsLawabolishedtheauthorisedcapitalandparvalueconceptinrelationtoissuedcapitalfrom1July1998.Therefore,theTrustdoesnothavealimitedamountofauthorisedcapitalandissuedsecuritiesdonothaveaparvalue.
For
per
sona
l use
onl
y
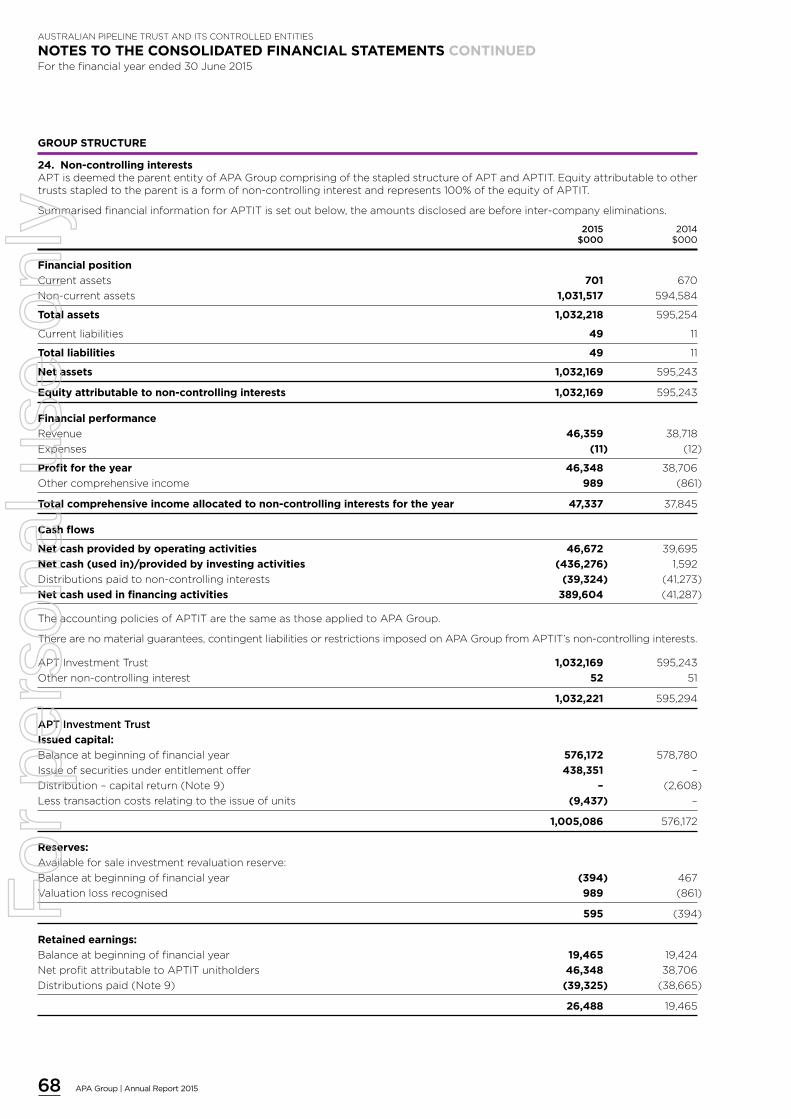
68 APA Group | Annual Report 2015
AUSTRALIAN PIPELINE TRUST AND ITS CONTROLLED ENTITIES
NOTES TO THE CONSOLIDATED FINANCIAL STATEMENTS CONTINUEDFor the financial year ended 30 June 2015
GROUP STRUCTURE
24. Non-controlling interestsAPTisdeemedtheparententityofAPAGroupcomprisingofthestapledstructureofAPTandAPTIT.Equityattributabletoothertrustsstapledtotheparentisaformofnon-controllinginterestandrepresents100%oftheequityofAPTIT.
SummarisedfinancialinformationforAPTITissetoutbelow,theamountsdisclosedarebeforeinter-companyeliminations.
2015 2014 $000 $000
Financial position
Currentassets 701 670
Non-currentassets 1,031,517 594,584
Total assets 1,032,218 595,254
Currentliabilities 49 11
Total liabilities 49 11
Net assets 1,032,169 595,243
Equity attributable to non-controlling interests 1,032,169 595,243
Financial performance
Revenue 46,359 38,718
Expenses (11) (12)
Profit for the year 46,348 38,706
Othercomprehensiveincome 989 (861)
Total comprehensive income allocated to non-controlling interests for the year 47,337 37,845
Cash flows
Net cash provided by operating activities 46,672 39,695
Net cash (used in)/provided by investing activities (436,276) 1,592
Distributionspaidtonon-controllinginterests (39,324) (41,273)
Net cash used in financing activities 389,604 (41,287)
TheaccountingpoliciesofAPTITarethesameasthoseappliedtoAPAGroup.
Therearenomaterialguarantees,contingentliabilitiesorrestrictionsimposedonAPAGroupfromAPTIT’snon-controllinginterests.
APTInvestmentTrust 1,032,169 595,243
Othernon-controllinginterest 52 51
1,032,221 595,294
APTInvestmentTrust
Issued capital:
Balanceatbeginningoffinancialyear 576,172 578,780
Issueofsecuritiesunderentitlementoffer 438,351 –
Distribution–capitalreturn(Note9) – (2,608)
Lesstransactioncostsrelatingtotheissueofunits (9,437) –
1,005,086 576,172
Reserves:
Availableforsaleinvestmentrevaluationreserve:
Balanceatbeginningoffinancialyear (394) 467
Valuationlossrecognised 989 (861)
595 (394)
Retained earnings:
Balanceatbeginningoffinancialyear 19,465 19,424
NetprofitattributabletoAPTITunitholders 46,348 38,706
Distributionspaid(Note9) (39,325) (38,665)
26,488 19,465
For
per
sona
l use
onl
y

69APA Group | Annual Report 2015
AUSTRALIAN PIPELINE TRUST AND ITS CONTROLLED ENTITIES
NOTES TO THE CONSOLIDATED FINANCIAL STATEMENTS CONTINUEDFor the financial year ended 30 June 2015
GROUP STRUCTURE
24. Non-controlling interests (continued)APTInvestmentTrust(continued) 2015 2014 $000 $000
Other non-controlling interest
Issuedcapital 4 4
Reserves 1 1
Retainedearnings 47 46
52 51
25. Joint arrangements and associatesThetablebelowlistsAPAGroup’sinterestinjointventuresandassociatesthatarereportedaspartoftheEnergyInvestmentssegment.APAGroupprovidesassetmanagement,operationandmaintenanceservicesandcorporateservices, invaryingcombinationstothemajorityofenergyinfrastructureassetshousedwithintheseentities.
Ownershipinterest%
Nameofentity Principalactivity Countryofincorporation 2015 2014
Joint ventures:
SEAGas Gastransmission Australia 50.00 50.00
DiamantinaPowerStation Powergeneration(gas) Australia 50.00 50.00
EnergyInfrastructureInvestments Unlistedenergyvehicle Australia 19.90 19.90
EII2 Powergeneration(wind) Australia 20.20 20.20
Associates:
GDI(EII) Gasdistribution Australia 20.00 20.00
EnvestraLimiteda Gasdistribution Australia – 33.05
a)DuringAugust2014,APAGroupsolditsinvestmentinEnvestraLimitedtoCheungKongGroupconsortiumfor$1.32pershareamountingto$783.8millioningrossproceedswhichrealisedanetpre-taxprofitof$430.0million.
Investment in joint ventures and associates using the equity method 257,425 593,325
Joint Ventures
Aggregatecarryingamountofinvestment 228,556 179,820
APAGroup’saggregatedshareof:
Profitfromcontinuingoperations 10,288 11,973
Othercomprehensiveincome (9,786) (8,783)
Total comprehensive income 502 3,190
Associates
Aggregatecarryingamountofinvestment 28,869 413,505
APAGroup’saggregatedshareof:
Profitfromcontinuingoperations 3,633 52,317
Othercomprehensiveincome (19,290) 854
Total comprehensive income (15,657) 53,171
Investment in associatesAnassociateisanentityoverwhichAPAGrouphassignificantinfluenceandthatisneitherasubsidiarynorajointarrangement.Investmentsinassociatesareaccountedforusingtheequityaccountingmethod.
UndertheequityaccountingmethodtheinvestmentisrecordedinitiallyatcosttoAPAGroup,includinganygoodwillonacquisition.InsubsequentperiodsthecarryingamountoftheinvestmentisadjustedtoreflectAPAGroup’sshareoftheretainedpost-acquisitionprofitorlossandothercomprehensiveincome,lessanyimpairment.
LossesofanassociateorjointventureinexcessofAPAGroup’sinterests(whichincludesanylong-terminterests,thatinsubstance,formpartofthenetinvestment)arerecognisedonlytotheextentthatthereisalegalorconstructiveobligationorAPAGrouphasmadepaymentsonbehalfoftheassociateorjointventure.
For
per
sona
l use
onl
y

70 APA Group | Annual Report 2015
AUSTRALIAN PIPELINE TRUST AND ITS CONTROLLED ENTITIES
NOTES TO THE CONSOLIDATED FINANCIAL STATEMENTS CONTINUEDFor the financial year ended 30 June 2015
GROUP STRUCTURE
25. Joint arrangements and associates (continued)
Contingent liabilities and capital commitmentsAPAGroup’sshareofthecontingentliabilities,capitalcommitmentsandotherexpenditurecommitmentsofjointoperationsisdisclosedinNote27.
APAGroupisaventurerinthefollowingjointoperations:
Outputinterest
2015 2014Nameofventure Principalactivity % %
GoldfieldsGasTransmission Gaspipelineoperation–WesternAustralia 88.2a 88.2a
MidWestPipeline Gaspipelineoperation–WesternAustralia 50.0 b 50.0b
a)On17August2004,APAacquiredadirectinterestintheGoldfieldsGasTransmissionjointoperationsaspartoftheSCPGasBusinessacquisition.
b)Pursuanttothejointventureagreement,APAGroupreceivesa70.8%shareofoperatingincomeandexpenses.
Interest in joint arrangementsAjointarrangementisanarrangementwherebytwoormorepartieshavejointcontrol.Jointcontrolisthecontractuallyagreedsharingofcontrolsuchthatdecisionsabouttherelevantactivitiesofthearrangement(thosethatsignificantlyaffectthereturns)requiretheunanimousconsentofthepartiessharingcontrol.APAGrouphastwotypesofjointarrangements:
Joint ventures: Ajointarrangementinwhichthepartiesthatsharejointcontrolhaverightstothenetassetsofthearrangement.JointVenturesareaccountedforusingtheequityaccountingmethod;and
Joint operations: Ajointarrangementinwhichthepartiesthatsharejointcontrolhaverightstotheassets,andobligationsfortheliabilities,relatingtothearrangement.Inrelationtoitsinterestinajointoperation,APAGrouprecognisesitsshareofassetsandliabilities,revenuefromthesaleofitsshareoftheoutputanditsshareofanyrevenuegeneratedfromthesaleoftheoutputbythejointoperationanditsshareofexpenses.TheseareincorporatedintoAPAGroup’sfinancialstatementsundertheappropriateheadings.
26. SubsidiariesSubsidiariesareentitiescontrolledbyAPT.ControlexistswhereAPThaspowerovertheentities,i.e.existingrightsthatgivethemthecurrentabilitytodirecttherelevantactivitiesoftheentities(thosethatsignificantlyaffectthereturns);exposure,orrights,tovariablereturnsfromtheirinvolvementwiththeentities;andtheabilitytousetheirpowertoaffectthosereturns.
Ownershipinterest
Countryofregistration/ 2015 2014Nameofentity incorporation % %
Parent entity
AustralianPipelineTrusta
Subsidiaries
APTPipelinesLimitedb,c Australia 100 100
AustralianPipelineLimitedb Australia 100 100
AgexPtyLtdb,c Australia 100 100
AmadeusGasTrust Australia 96 96
APTGoldfieldsPtyLtdb,c Australia 100 100
APTManagementServicesPtyLimitedb,c Australia 100 100
APTParmeliaGasPtyLtde Australia – 100
APTParmeliaHoldingsPtyLtdb,c Australia 100 100
APTParmeliaPtyLtdb,c Australia 100 100
APTParmeliaTrustb CaymanIslands 100 100
APTPetroleumPipelinesHoldingsPtyLimitedb,c Australia 100 100
APTPetroleumPipelinesPtyLimitedb,c Australia 100 100
APTPipelines(NSW)PtyLimitedb,c Australia 100 100
APTPipelines(NT)PtyLimitedb,c Australia 100 100
APTPipelines(QLD)PtyLimitedb,c Australia 100 100
APTPipelines(WA)PtyLimitedb,c Australia 100 100
APTPipelinesInvestments(NSW)PtyLimitedb,c Australia 100 100
APTPipelinesInvestments(WA)PtyLimitedb,c Australia 100 100
EastAustralianPipelinePtyLimitedb,c Australia 100 100
GasinvestAustraliaPtyLtdb,c Australia 100 100
GoldfieldsGasTransmissionPtyLtdb Australia 100 100
N.T.GasDistributionPtyLimitedb,c Australia 100 100
N.T.GasEasementsPtyLimitedb,c Australia 100 100
N.T.GasPtyLimited Australia 96 96
For
per
sona
l use
onl
y

71APA Group | Annual Report 2015
AUSTRALIAN PIPELINE TRUST AND ITS CONTROLLED ENTITIES
NOTES TO THE CONSOLIDATED FINANCIAL STATEMENTS CONTINUEDFor the financial year ended 30 June 2015
GROUP STRUCTURE
26. Subsidiaries (continued) Ownershipinterest
Countryofregistration/ 2015 2014Nameofentity incorporation % %
RovertonPtyLtdb,c Australia 100 100
SCPInvestments(No.1)PtyLimitedb,c Australia 100 100
SCPInvestments(No.2)PtyLimitedb,c Australia 100 100
SCPInvestments(No.3)PtyLimitedb,c Australia 100 100
SopicPtyLtdb,c Australia 100 100
SouthernCrossPipelines(NPL)AustraliaPtyLtdb,c Australia 100 100
SouthernCrossPipelinesAustraliaPtyLimitedb,c Australia 100 100
TransAustraliaPipelinePtyLtdb,c Australia 100 100
WesternAustralianGasTransmissionCompany1PtyLtdb,c Australia 100 100
GasNetAustraliaTrustb Australia 100 100
APAGasNetAustralia(Holdings)PtyLimitedb,c Australia 100 100
APAGasNetAustralia(Operations)PtyLimitedb,c Australia 100 100
APAGasNetAPtyLimitedb,c Australia 100 100
GasNetATrust Australia 100 100
APAGasNetAustralia(NSW)PtyLimitedb,c Australia 100 100
APAGasNetBPtyLimitedb,c Australia 100 100
APAGasNetAustraliaPtyLimitedb,c Australia 100 100
GasNetBTrustb Australia 100 100
GasNetAustraliaInvestmentsTrust Australia 100 100
APAOperationsPtyLimitedb,c Australia 100 100
APTAMHoldingsPtyLimitedb,c Australia 100 100
APTO&MHoldingsPtyLtdb,c Australia 100 100
APTO&MServicesPtyLtdb,c Australia 100 100
APTO&MServices(QLD)PtyLtdb,c Australia 100 100
APTWaterManagementPtyLtde Australia – 100
APTWaterManagementHoldingsPtyLtde Australia – 100
APTAM(Stratus)PtyLimitedb,c Australia 100 100
APTFacilityManagementPtyLimitedb,c Australia 100 100
APTAMEmploymentPtyLimitedb,c Australia 100 100
APTSeaGasHoldingsPtyLimitedb,c Australia 100 100
APTSPV2PtyLtdb Australia 100 100
APTSPV3PtyLtdb Australia 100 100
APTPipelines(SA)PtyLimitedb,c Australia 100 100
APT(MIT)ServicesPtyLimitedb,c Australia 100 100
APAOperations(EII)PtyLimitedb,c Australia 100 100
APAPipelines(QNSW)PtyLimitede Australia – 100
CentralRangesPipelinePtyLtdb,c Australia 100 100
APACountryPipelinesPtyLimitedb,c Australia 100 100
NorthWesternNaturalGasCompanyPtyLimitede Australia – 100
APAFacilitiesManagementPtyLimitedb,c Australia 100 100
APA(NBH)PtyLimitedb,c Australia 100 100
APAPipelinesInvestments(BWP)PtyLimitedb,c Australia 100 100
APAPowerHoldingsPtyLimitedb,c Australia 100 100
APA(EDWFHoldco)PtyLtdb,c Australia 100 100
APA(BWFHoldco)PtyLtdb,c Australia 100 100
EDWFHoldings1PtyLtdb,c Australia 100 100
EDWFHoldings2PtyLtdb,c Australia 100 100
EDWFManagerPtyLtdb,c Australia 100 100
WindPortfolioPtyLtdb,c Australia 100 100
GriffinWindfarm2PtyLtdb Australia 100 100
APAAM(Allgas)PtyLimitedb,c Australia 100 100
APADPSHoldingsPtyLimitedb,c Australia 100 100
APAPowerPFPtyLimitedb,c Australia 100 100
For
per
sona
l use
onl
y

72 APA Group | Annual Report 2015
AUSTRALIAN PIPELINE TRUST AND ITS CONTROLLED ENTITIES
NOTES TO THE CONSOLIDATED FINANCIAL STATEMENTS CONTINUEDFor the financial year ended 30 June 2015
GROUP STRUCTURE
26. Subsidiaries (continued) Ownershipinterest
Countryofregistration/ 2015 2014Nameofentity incorporation % %
APASubTrustNo1b Australia 100 100
APASubTrustNo2b Australia 100 100
APASubTrustNo3b Australia 100 100
APA(PilbaraPipeline)PtyLtdb,c Australia 100 100
APA(SubNo3)InternationalHoldings1PtyLtdb,c,f Australia 100 100
APA(SubNo3)InternationalHoldings2PtyLtdb,c,f Australia 100 100
APA(SubNo3)InternationalNomineesPtyLtdb,c,f Australia 100 100
APA(SWQP)PtyLimitedb,c Australia 100 100
APA(WA)OnePtyLimitedb,c Australia 100 100
APAAIS1PtyLimitedb,c Australia 100 100
APAAIS2PtyLtdb,c Australia 100 100
APAAISPtyLimitedb,c Australia 100 100
APABiobondPtyLimitedb,c Australia 100 100
APAEastOnePtyLimitedb,c,f Australia 100 100
APAEastPipelinesPtyLimitedb,c Australia 100 100
APAEEPtyLimitedb,c Australia 100 100
APAEEAustraliaPtyLimitedb,c Australia 100 100
APAEECorporateSharedServicesPtyLimitedb,c Australia 100 100
APAEEHoldingsPtyLimitedb,c Australia 100 100
EpicEnergyEastPipelinesTrustb Australia 100 100
APA(NT)PtyLimitedb,c,f Australia 100 100
APABidCoPtyLimitedb,c,d Australia 100 –
APAHoldCoPtyLimitedb,c,d Australia 100 –
APAWGPPtyLimitedb,c,d Australia 100 –
a)AustralianPipelineTrustistheheadentitywithinthetax-consolidatedgroup.
b)Theseentitiesaremembersofthetax-consolidatedgroup.
c)Thesewholly-ownedsubsidiarieshaveenteredintoadeedofcrossguaranteewithAPTPipelinesLimitedpursuanttoASICClassOrder98/1418andarerelievedfromtherequirementtoprepareandlodgeanauditedfinancialreport.
d)Entitywasacquiredduringthe2015year.
e)Entitywasderegisteredduringthe2015year.
f) EntitypartytoarevocationdeedinrelationtotheAPTPipelinesLimiteddeedofcrossguaranteelodgedwithASICon1August2014whichhastakenaffectinthe2015yearandisthereforenolongerapartytothedeed.
For
per
sona
l use
onl
y

73APA Group | Annual Report 2015
AUSTRALIAN PIPELINE TRUST AND ITS CONTROLLED ENTITIES
NOTES TO THE CONSOLIDATED FINANCIAL STATEMENTS CONTINUEDFor the financial year ended 30 June 2015
OTHER ITEMS
27. Commitments and contingencies 2015 2014 $000 $000
Capital expenditure commitments
APAGroup–plantandequipment 94,169 87,835
APAGroup’sshareofjointlycontrolledoperations–plantandequipment 5,987 16,458
100,156 104,293
Contingent liabilities
Bankguarantees 49,049 28,553
APAGrouphadnocontingentassetsasat30June2015and30June2014.
28. Director and senior executive remunerationDirectorsremunerationTheaggregateremunerationmadetoDirectorsofAPAGroupissetoutbelow:
2015 2014 $ $
Short-termemploymentbenefits 1,268,500 1,181,281
Post-employmentbenefits 132,105 119,735
Total Remuneration: Non-Executive Directors 1,400,605 1,301,016
Short-termemploymentbenefits 3,109,447 2,868,962
Post-employmentbenefits 35,000 25,000
Cashsettledsecurity-basedpayments 1,564,212 1,301,316
Total Remuneration: Executive Directora 4,708,659 4,195,278
Total Remuneration: Directors 6,109,264 5,496,294
a)TheremunerationfortheChiefExecutiveOfficerandManagingDirector,MichaelMcCormack,isalsoincludedintheremunerationdisclosureforseniorexecutives.
Senior executive remunerationa
TheaggregateremunerationmadetoseniorexecutivesofAPAGroupissetoutbelow:
Short-termemploymentbenefits 9,977,891 9,060,314
Post-employmentbenefits 258,778 192,775
Cashsettledsecurity-basedpayments 4,242,640 3,410,484
Retentionaward 430,666 550,667
14,909,975 13,214,240
a)TheremunerationfortheChiefExecutiveOfficerandManagingDirector,MichaelMcCormack,isalsoincludedintheremunerationdisclosureforseniorexecutives.
29. Remuneration of external auditor
Amounts received or due and receivable by Deloitte Touche Tohmatsu for:
Auditingthefinancialreport 659,500 700,000
Complianceplanaudit 18,000 21,500
Taxcomplianceandadvicea – 8,500
Otherassuranceservicesa 436,500 414,000
1,114,000 1,144,000
a)Servicesprovidedwereinaccordancewiththeexternalauditorindependencepolicy.Otherassuranceservicescomprisepreparationofinvestigatingaccountantsreportsandassuranceservicesinrelationtodebtraisings,aschemeofarrangementandtheentitlementoffer.
For
per
sona
l use
onl
y

74 APA Group | Annual Report 2015
AUSTRALIAN PIPELINE TRUST AND ITS CONTROLLED ENTITIES
NOTES TO THE CONSOLIDATED FINANCIAL STATEMENTS CONTINUEDFor the financial year ended 30 June 2015
OTHER ITEMS
30. Related party transactionsa) EquityinterestinrelatedpartiesDetailsofthepercentageofordinarysecuritiesheldinsubsidiariesaredisclosedinNote26andthedetailsofthepercentageheldinjointoperations,jointventuresandassociatesaredisclosedinNote25.
b) ResponsibleEntity–AustralianPipelineLimitedTheResponsibleEntityiswhollyownedbyAPTPipelinesLimited.
c) TransactionswithrelatedpartieswithinAPAGroupTransactionsbetweentheentitiesthatcompriseAPAGroupduringthefinancialyearconsistedof:
— dividends;
— assetleaserentals;
— loansadvancedandpaymentsreceivedonlong-terminter-entityloans;
— managementfees;
— operationalservicesprovidedbetweenentities;
— paymentsofdistributions;and
— equityissues.
Theabovetransactionsweremadeonnormalcommercialtermsandconditions.TheGroupchargesinterestoninter-entityloansfromtimetotime.
AlltransactionsbetweentheentitiesthatcompriseAPAGrouphavebeeneliminatedonconsolidation.
RefertoNote26fordetailsoftheentitiesthatcompriseAPAGroup.
Australian Pipeline LimitedManagementfeesof$3,451,167(2014:$3,177,861)werepaidtotheResponsibleEntityasreimbursementofcostsincurredonbehalfofAPAGroup.NoamountswerepaiddirectlybyAPAGrouptotheDirectorsoftheResponsibleEntity,exceptasdisclosedatNote28.
AustralianPipelineLimited,initscapacityastrusteeandResponsibleEntityoftheTrust,hasguaranteedthepaymentofprincipal,interestandotheramountsasprovidedintheseniordebtfacilitiesofAPTPipelinesLimited,theprincipalborrowingentityofAPAGroup.
d) TransactionswithotherrelatedpartiesTransactionswithassociatesandjointventures
ThefollowingtransactionsoccurredwithAPAGroup’sassociatesandjointventuresonnormalmarkettermsandconditions:
Dividends Purchases Amount Amount from Salesto from owedby owedto related related related related related parties parties parties parties parties2015 $000 $000 $000 $000 $000
SEAGas 14,164 3,733 – 181 –
EnergyInfrastructureInvestments 3,460 27,021 139 3,074 139
EII2 3,105 661 – – –
APAEthaneLtd – 200 – – –
DiamantinaPowerStation – 1,608 – – –
GDI(EII) 4,479 51,190 – 5,749 –
25,208 84,413 139 9,004 139
2014
SEAGas 11,298 3,256 – 98 –
EnergyInfrastructureInvestments 4,283 22,755 250 1,935 –
EII2 2,405 641 – – –
APAEthaneLtd – 200 – – –
DiamantinaPowerStation – 3,083 – – –
GDI(EII) 5,433 49,435 18 4,994 –
EnvestraLimiteda 38,000 369,471 578 40,400 –
61,419 448,841 846 47,427 –
Atyearend,APAGrouphadashareholderloanreceivablefromDiamantinaPowerStationof$75.7million(2014$118.1million).
a)DuringAugust2014,APAGroupsolditsinvestmentinEnvestraLimitedtoCheungKongGroupconsortiumfor$1.32pershareamountingto$783.8millioningrossproceedswhichrealisedanetpre-taxprofitof$430.0million.
For
per
sona
l use
onl
y
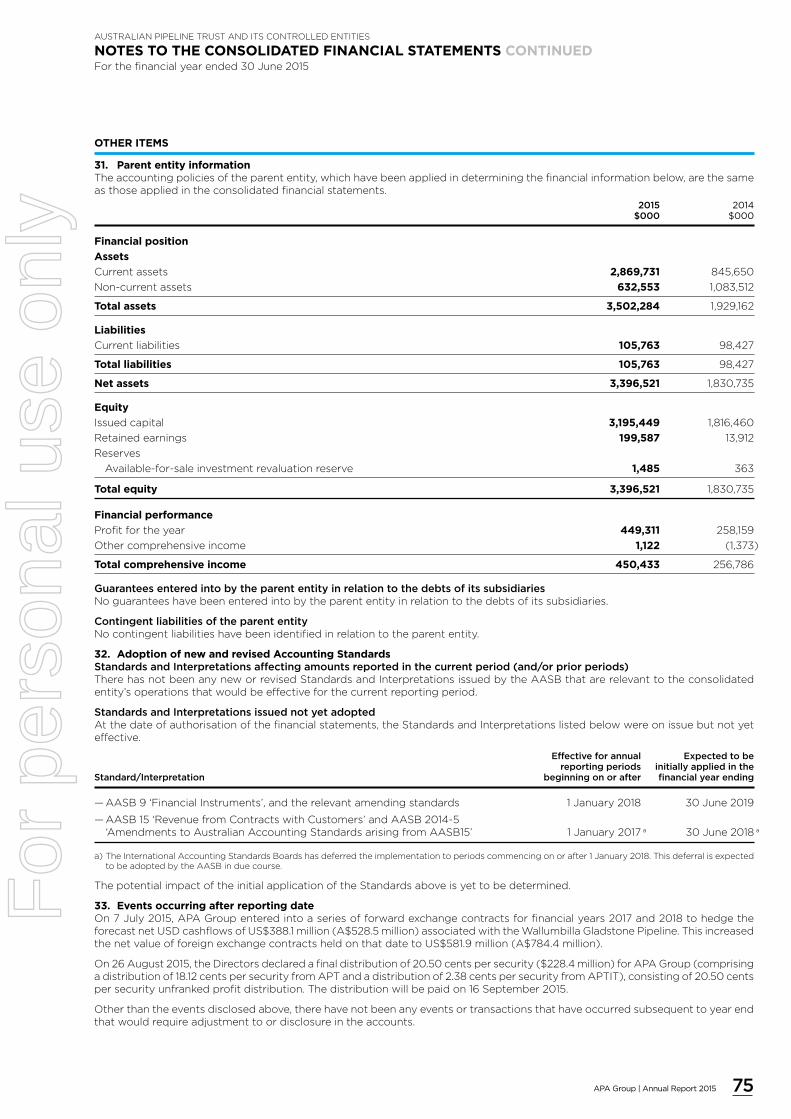
75APA Group | Annual Report 2015
AUSTRALIAN PIPELINE TRUST AND ITS CONTROLLED ENTITIES
NOTES TO THE CONSOLIDATED FINANCIAL STATEMENTS CONTINUEDFor the financial year ended 30 June 2015
OTHER ITEMS
31. Parent entity informationTheaccountingpoliciesoftheparententity,whichhavebeenappliedindeterminingthefinancialinformationbelow,arethesameasthoseappliedintheconsolidatedfinancialstatements.
2015 2014 $000 $000
Financial position
Assets
Currentassets 2,869,731 845,650
Non-currentassets 632,553 1,083,512
Total assets 3,502,284 1,929,162
Liabilities
Currentliabilities 105,763 98,427
Total liabilities 105,763 98,427
Net assets 3,396,521 1,830,735
Equity
Issuedcapital 3,195,449 1,816,460
Retainedearnings 199,587 13,912
Reserves
Available-for-saleinvestmentrevaluationreserve 1,485 363
Total equity 3,396,521 1,830,735
Financial performance
Profitfortheyear 449,311 258,159
Othercomprehensiveincome 1,122 (1,373)
Total comprehensive income 450,433 256,786
GuaranteesenteredintobytheparententityinrelationtothedebtsofitssubsidiariesNoguaranteeshavebeenenteredintobytheparententityinrelationtothedebtsofitssubsidiaries.
ContingentliabilitiesoftheparententityNocontingentliabilitieshavebeenidentifiedinrelationtotheparententity.
32. Adoption of new and revised Accounting StandardsStandardsandInterpretationsaffectingamountsreportedinthecurrentperiod(and/orpriorperiods)TherehasnotbeenanyneworrevisedStandardsandInterpretationsissuedbytheAASBthatarerelevanttotheconsolidatedentity’soperationsthatwouldbeeffectiveforthecurrentreportingperiod.
StandardsandInterpretationsissuednotyetadoptedAtthedateofauthorisationofthefinancialstatements,theStandardsandInterpretationslistedbelowwereonissuebutnotyeteffective.
Effectiveforannual Expectedtobe reportingperiods initiallyappliedintheStandard/Interpretation beginningonorafter financialyearending
—AASB9‘FinancialInstruments’,andtherelevantamendingstandards 1January2018 30June2019
—AASB15‘RevenuefromContractswithCustomers’andAASB2014-5‘AmendmentstoAustralianAccountingStandardsarisingfromAASB15’ 1January2017a 30June2018a
a)TheInternationalAccountingStandardsBoardshasdeferredtheimplementationtoperiodscommencingonorafter1January2018.ThisdeferralisexpectedtobeadoptedbytheAASBinduecourse.
ThepotentialimpactoftheinitialapplicationoftheStandardsaboveisyettobedetermined.
33. Events occurring after reporting dateOn7July2015,APAGroupenteredintoaseriesofforwardexchangecontractsforfinancialyears2017and2018tohedgetheforecastnetUSDcashflowsofUS$388.1million(A$528.5million)associatedwiththeWallumbillaGladstonePipeline.ThisincreasedthenetvalueofforeignexchangecontractsheldonthatdatetoUS$581.9million(A$784.4million).
On26August2015,theDirectorsdeclaredafinaldistributionof20.50centspersecurity($228.4million)forAPAGroup(comprisingadistributionof18.12centspersecurityfromAPTandadistributionof2.38centspersecurityfromAPTIT),consistingof20.50centspersecurityunfrankedprofitdistribution.Thedistributionwillbepaidon16September2015.
Otherthantheeventsdisclosedabove,therehavenotbeenanyeventsortransactionsthathaveoccurredsubsequenttoyearendthatwouldrequireadjustmenttoordisclosureintheaccounts.
For
per
sona
l use
onl
y

76 APA Group | Annual Report 2015
AUSTRALIANPIPELINETRUSTANDITSCONTROLLEDENTITIES
DECLARATION BY THE DIRECTORS OF AUSTRALIAN PIPELINE LIMITEDForthefinancialyearended30June2015
TheDirectorsdeclarethat:
a) intheDirectors’opinion,therearereasonablegroundstobelievethatAustralianPipelineTrustwillbeabletopayitsdebtsasandwhentheybecomedueandpayable;
b) intheDirectors’opinion,theattachedfinancialstatementsandnotestheretoareinaccordancewiththeCorporations Act 2001,includingcompliancewithAccountingStandardsandgivingatrueandfairviewofthefinancialpositionandperformanceofAPAGroup;
c) intheDirectors’opinion,thefinancialstatementsandnotestheretoareinaccordancewithInternationalFinancialReportingStandardsasstatedinNote2tothefinancialstatements;and
d) theDirectorshavebeengiventhedeclarationsbytheManagingDirectorandChiefFinancialOfficerrequiredbysection295AoftheCorporations Act 2001.
Signed inaccordancewitharesolutionoftheDirectorsoftheResponsibleEntitymadepursuanttosection295(5)oftheCorporations Act 2001.
OnbehalfoftheDirectors
LeonardBleaselAM RobertWrightChairman Director
Sydney,26August2015
For
per
sona
l use
onl
y

77APA Group | Annual Report 2015
AUSTRALIANPIPELINETRUSTANDITSCONTROLLEDENTITIES
AUDITOR’S INDEPENDENCE DECLARATIONtoAustralianPipelineLimitedasResponsibleEntityforAustralianPipelineTrust
Liability limited by a scheme approved under Professional Standards LegislationMember of Deloitte Touche Tohmatsu Limited
109
26 August 2015
Dear Directors
Auditor’s Independence Declaration to Australian Pipeline Limited as responsible entity forAustralian Pipeline Trust
In accordance with section 307C of the Corporations Act 2001 , I am pleased to provide the followingdeclaration of independence to the directors of Australian Pipeline Limited as responsible entity forAustralian Pipeline Trust.
As lead audit partner for the audit of the financial statements of Australian Pipeline Trust for thefinancial year ended 30 June 2015, I declare that to the best of my knowledge and belief, there havebeen no contraventions of:
(i) the auditor independence requirements of the Corporations Act 2001 in relation to theaudit; and
(ii) any applicable code of professional conduct in relation to the audit.
Yours sincerely
DELOITTE TOUCHE TOHMATSU
A V GriffithsPartnerChartered Accountants
Deloitte Touche TohmatsuABN 74 490 121 060
Grosvenor Place225 George StreetSydney NSW 2000PO Box N250 Grosvenor PlaceSydney NSW 1220 Australia
DX: 10307SSETel: +61 (0) 2 9322 7000Fax: +61 (0) 2 9322 7001ww.deloitte.com.au
The DirectorsAustralian Pipeline Limited as responsible entity forAustralian Pipeline TrustHSBC BuildingLevel 19, 580 George StreetSydney NSW 2000
For
per
sona
l use
onl
y

78 APA Group | Annual Report 2015
AUSTRALIANPIPELINETRUSTANDITSCONTROLLEDENTITIES
INDEPENDENT AUDITOR’S REPORTtoAustralianPipelineLimitedasResponsibleEntityforAustralianPipelineTrust
110
Independent Auditor’s Reportto the Unitholders of Australian Pipeline Trust
Report on the Financial Report
We have audited the accompanying financial report of Australian Pipeline Trust, which comprises the statement of financial position as at 30 June 2015, the statement of profit or loss and other comprehensive income, the statement of cash flows and the statement of changes in equity for the year ended on that date, notes comprising a summary of significant accounting policies and other explanatory information, and the directors’ declaration of the consolidated entity, comprising the Trust and the entities it controlled at the year’s end or from time to time during the financial year as set out on pages 36 to 76.
Directors’ Responsibility for the Financial Report
The directors of Australian Pipeline Limited are responsible for the preparation of the financial report that gives a true and fair view in accordance with Australian Accounting Standards and the Corporations Act 2001 and for such internal control as the directors determine is necessary to enable the preparation of the financial report that gives a true and fair view and is free from material misstatement, whether due to fraud or error. In Note 2, the directors also state, in accordance with Accounting Standard AASB 101 Presentation of Financial Statements , that the financial statements comply with International Financial Reporting Standards.
Auditor’s Responsibility
Our responsibility is to express an opinion on the financial report based on our audit. We conducted our audit in accordance with Australian Auditing Standards. Those standards require that we comply with relevant ethical requirements relating to audit engagements and plan and perform the audit to obtain reasonable assurance whether the financial report is free from material misstatement.
An audit involves performing procedures to obtain audit evidence about the amounts and disclosures in the financial report. The procedures selected depend on the auditor’s judgement, including the assessment of the risks of material misstatement of the financial report, whether due to fraud or error. In making those risk assessments, the auditor considers internal control, relevant to the entity’s preparation of the financial report that gives a true and fair view, in order to design audit procedures that are appropriate in the circumstances, but not for the purpose of expressing an opinion on the effectiveness of the entity’s internal control. An audit also includes evaluating the appropriateness of accounting policies used and the reasonableness of accounting estimates made by the directors, as well as evaluating the overall presentation of the financial report.
Liability limited by a scheme approved under Professional Standards LegislationMember of Deloitte Touche Tohmatsu Limited
Deloitte Touche TohmatsuABN 74 490 121 060
Grosvenor Place225 George StreetSydney NSW 2000PO Box N250 Grosvenor PlaceSydney NSW 1220 Australia
DX: 10307SSETel: +61 (0) 2 9322 7000Fax: +61 (0) 2 9322 7001www.deloitte.com.au
For
per
sona
l use
onl
y

79APA Group | Annual Report 2015
AUSTRALIANPIPELINETRUSTANDITSCONTROLLEDENTITIES
INDEPENDENT AUDITOR’S REPORT CONTINUEDtoAustralianPipelineLimitedasResponsibleEntityforAustralianPipelineTrust
111
We believe that the audit evidence we have obtained is sufficient and appropriate to provide a basis forour audit opinion.
Auditor’s Independence Declaration
In conducting our audit, we have complied with the independence requirements of the CorporationsAct 2001. We confirm that the independence declaration required by the Corporations Act 2001 ,which has been given to the directors of Australian Pipeline Limited as responsible entity forAustralian Pipeline Trust would be in the same terms if given to the directors as at the time of thisauditor’s report.
Opinion
In our opinion:
(a) the financial report of Australian Pipeline Trust is in accordance with the Corporations Act 2001 ,including:
(i) giving a true and fair view of the consolidated entity’s financial position as at 30 June 2015and of its performance for the year ended on that date; and
(ii) complying with Australian Accounting Standards and the Corporations Regulations 2001 ; and
(b) the financial statements also comply with International Financial Reporting Standards as disclosedin Note 2.
Report on the Remuneration Report
We have audited the Remuneration Report included in pages 23 to 35 of the directors’ report of Australian Pipeline Limited as responsible entity for Australian Pipeline Trust for the year ended 30 June 2015. The directors have voluntarily prepared and presented the Remuneration Report in accordance with the requirements of section 300A of the Corporations Act 2001 . Our responsibility is to express an opinion on the Remuneration Report, based on our audit conducted in accordance with Australian Auditing Standards.
Opinion
In our opinion the Remuneration Report of Australian Pipeline Limited for the year ended 30 June 2015, has been prepared in accordance with the requirements of section 300A of the Corporations Act 2001.
DELOITTE TOUCHE TOHMATSU
A V GriffithsPartnerChartered AccountantsSydney, 26 August 2015
110
Independent Auditor’s Reportto the Unitholders of Australian Pipeline Trust
Report on the Financial Report
We have audited the accompanying financial report of Australian Pipeline Trust, which comprises the statement of financial position as at 30 June 2015, the statement of profit or loss and other comprehensive income, the statement of cash flows and the statement of changes in equity for the year ended on that date, notes comprising a summary of significant accounting policies and other explanatory information, and the directors’ declaration of the consolidated entity, comprising the Trust and the entities it controlled at the year’s end or from time to time during the financial year as set out on pages 36 to 76.
Directors’ Responsibility for the Financial Report
The directors of Australian Pipeline Limited are responsible for the preparation of the financial report that gives a true and fair view in accordance with Australian Accounting Standards and the Corporations Act 2001 and for such internal control as the directors determine is necessary to enable the preparation of the financial report that gives a true and fair view and is free from material misstatement, whether due to fraud or error. In Note 2, the directors also state, in accordance with Accounting Standard AASB 101 Presentation of Financial Statements , that the financial statements comply with International Financial Reporting Standards.
Auditor’s Responsibility
Our responsibility is to express an opinion on the financial report based on our audit. We conducted our audit in accordance with Australian Auditing Standards. Those standards require that we comply with relevant ethical requirements relating to audit engagements and plan and perform the audit to obtain reasonable assurance whether the financial report is free from material misstatement.
An audit involves performing procedures to obtain audit evidence about the amounts and disclosures in the financial report. The procedures selected depend on the auditor’s judgement, including the assessment of the risks of material misstatement of the financial report, whether due to fraud or error. In making those risk assessments, the auditor considers internal control, relevant to the entity’s preparation of the financial report that gives a true and fair view, in order to design audit procedures that are appropriate in the circumstances, but not for the purpose of expressing an opinion on the effectiveness of the entity’s internal control. An audit also includes evaluating the appropriateness of accounting policies used and the reasonableness of accounting estimates made by the directors, as well as evaluating the overall presentation of the financial report.
Liability limited by a scheme approved under Professional Standards LegislationMember of Deloitte Touche Tohmatsu Limited
Deloitte Touche TohmatsuABN 74 490 121 060
Grosvenor Place225 George StreetSydney NSW 2000PO Box N250 Grosvenor PlaceSydney NSW 1220 Australia
DX: 10307SSETel: +61 (0) 2 9322 7000Fax: +61 (0) 2 9322 7001www.deloitte.com.au
For
per
sona
l use
onl
y

80 APA Group | Annual Report 2015
APTINVESTMENTTRUSTANDITSCONTROLLEDENTITIESARSN115585441
DIRECTORS’ REPORT
TheDirectorsofAustralianPipelineLimited(“ResponsibleEntity”)submittheirreportandtheannualfinancialreportofAPTInvestmentTrust(“APTIT”)anditscontrolledentities(together“ConsolidatedEntity”)forthefinancialyearended30June2015.ThisreportreferstotheconsolidatedresultsofAPTIT,oneofthetwostapledentitiesofAPAGroup,withtheotherstapledentitybeingAustralianPipelineTrust(together“APA”).
DIRECTORSThenamesoftheDirectorsoftheResponsibleEntityduringthefinancialyearandsincethefinancialyearendare:
LeonardBleaselAM Chairman
MichaelMcCormack ChiefExecutiveOfficerandManagingDirector
StevenCrane
JohnFletcher
RussellHigginsAO
PatriciaMcKenzie
RobertWright
DetailsoftheDirectors,theirqualifications,experience,specialresponsibilitiesanddirectorshipsofotherlistedentitiesaresetoutonpages19to21.
TheCompanySecretaryoftheResponsibleEntityduringandsincethefinancialyearendisMarkKnapman.
PRINCIPAL ACTIVITIESAPTIToperatesasaninvestmentandfinancingentitywithintheAPAstapledgroup.
STATE OF AFFAIRSNosignificantchangeinthestateofaffairsofAPTIToccurredduringtheyear.
SUBSEQUENT EVENTSExceptasdisclosedelsewhereinthisreport,theDirectorsareunawareofanymatterorcircumstancethathasoccurredsincetheendoftheyearthathassignificantlyaffectedormaysignificantlyaffecttheoperationsoftheConsolidatedEntity,theresultsofthoseoperationsorthestateofaffairsoftheConsolidatedEntityinfutureyears.
REVIEW AND RESULTS OF OPERATIONSAPTITreportednetprofitaftertaxof$46.3million(2014:$38.7million)fortheyearended30June2015andtotalrevenueof$46.4million(2014:$38.7million).
DISTRIBUTIONSDistributionspaidtounitholdersduringthefinancialyearwere:
Final FY 2014 distribution InterimFY2015distribution paid 10 September 2014 paid18March2015
Total distribution Totaldistribution Cents per unit $000 Centsperunit $000
APTITprofitdistribution 2.33 19,465 2.38 19,860
APTITcapitaldistribution – – – –
2.33 19,465 2.38 19,860
On26August2015,theDirectorsdeclaredafinaldistributionforAPTITforthefinancialyearof2.38centsperunitywhichispayableon16September2015andwillcomprisethefollowingcomponents:
FinalFY2015distribution payable16September2015
Totaldistribution Centsperunit $000
APTITprofitdistribution 2.38 26,488
APTITcapitaldistribution – –
2.38 26,488
Distributioninformationispresentedonanaccountingclassificationbasis.TheAPAGroupAnnualTaxStatementandAnnualTaxReturnGuide(tobereleasedinSeptember2015)willprovidetheclassificationofdistributioncomponentsforthepurposesofpreparationofsecurityholderincometaxreturns.F
or p
erso
nal u
se o
nly

81APA Group | Annual Report 2015
APT INVESTMENT TRUST AND ITS CONTROLLED ENTITIES
DIRECTORS’ REPORT CONTINUEDFor the year ended 30 June 2015
OTHER INFORMATIONDetailsoftheDirectorandCompanySecretaryoftheResponsibleEntityaresetoutintheAustralianPipelineTrustDirectors’reportatpages1to22.ThatreportalsocontainsinformationontheDirectors’directorshipsofotherlistedentities,theirattendanceatmeetingsandsecurityholdings,options,indemnificationofofficers,remunerationandtheauditor’sprovisionofnon-auditservicesandindependence.
INFORMATION REQUIRED FOR REGISTERED SCHEMESFeespaidtotheResponsibleEntityanditsassociates(includingdirectorsandsecretariesoftheResponsibleEntity,relatedbodiescorporateanddirectorsandsecretariesofrelatedbodiescorporate)outofAPAschemepropertyduringtheyeararedisclosedinNote16tothefinancialstatements.
Exceptasdisclosedinthisreport,neithertheResponsibleEntitynoranyofitsassociatesholdsanyAPTITunits.
ThenumberofAPTITunitsissuedduringtheyear,andthenumberofAPTITunitsattheendoftheyear,aredisclosedinNote11tothefinancialstatements.
ThevalueofAPA’sassetsasattheendoftheyearisdisclosedinthebalancesheetintotalassets,andthebasisofvaluationisincludedinthenotestothefinancialstatements.
AUDITOR’S INDEPENDENCE DECLARATIONAcopyoftheAuditor’sindependencedeclarationasrequiredundersection307CoftheCorporations Act 2001isincludedonpage96.
ROUNDING OF AMOUNTSAPAisanentityofthekindreferredtoinASICClassOrder98/0100dated10July1998and,inaccordancewiththatClassOrder,amountsintheDirectors’reportandthefinancialreportareroundedtothenearestthousanddollars,unlessotherwiseindicated.
SignedinaccordancewitharesolutionoftheDirectorsoftheResponsibleEntitymadepursuanttosection298(2)oftheCorporations Act 2001.
OnbehalfoftheDirectors
LeonardBleaselAM RobertWrightChairman Director
Sydney,26August2015
For
per
sona
l use
onl
y

82 APA Group | Annual Report 2015
APTINVESTMENTTRUSTANDITSCONTROLLEDENTITIES
CONSOLIDATED STATEMENT OF PROFIT OR LOSS AND OTHER COMPREHENSIVE INCOMEForthefinancialyearended30June2015
2015 2014 Note $000 $000
Continuing operations
Revenue 3 46,359 38,718
Expenses 3 (11) (12)
Profitbeforetax 46,348 38,706
Incometaxexpense 4 – –
Profit for the year 46,348 38,706
Other comprehensive income
Items that may be reclassified to profit or loss:
Gain/(loss)onavailable-for-saleinvestmentstakentoequity 989 (861)
Othercomprehensiveincomefortheyear(netoftax) 989 (861)
Total comprehensive income for the year 47,337 37,845
Profit Attributable to:
Unitholdersoftheparent 46,348 38,706
46,348 38,706
Total comprehensive income attributable to:
Unitholdersoftheparent 47,337 37,845
2014Earningsperunit 2015 (Restated)
Basicanddiluted(centsperunit) 5 4.7 4.5
Theaboveconsolidatedstatementofprofitor lossandothercomprehensiveincomeshouldbereadinconjunctionwiththeaccompanyingnotes.
For
per
sona
l use
onl
y
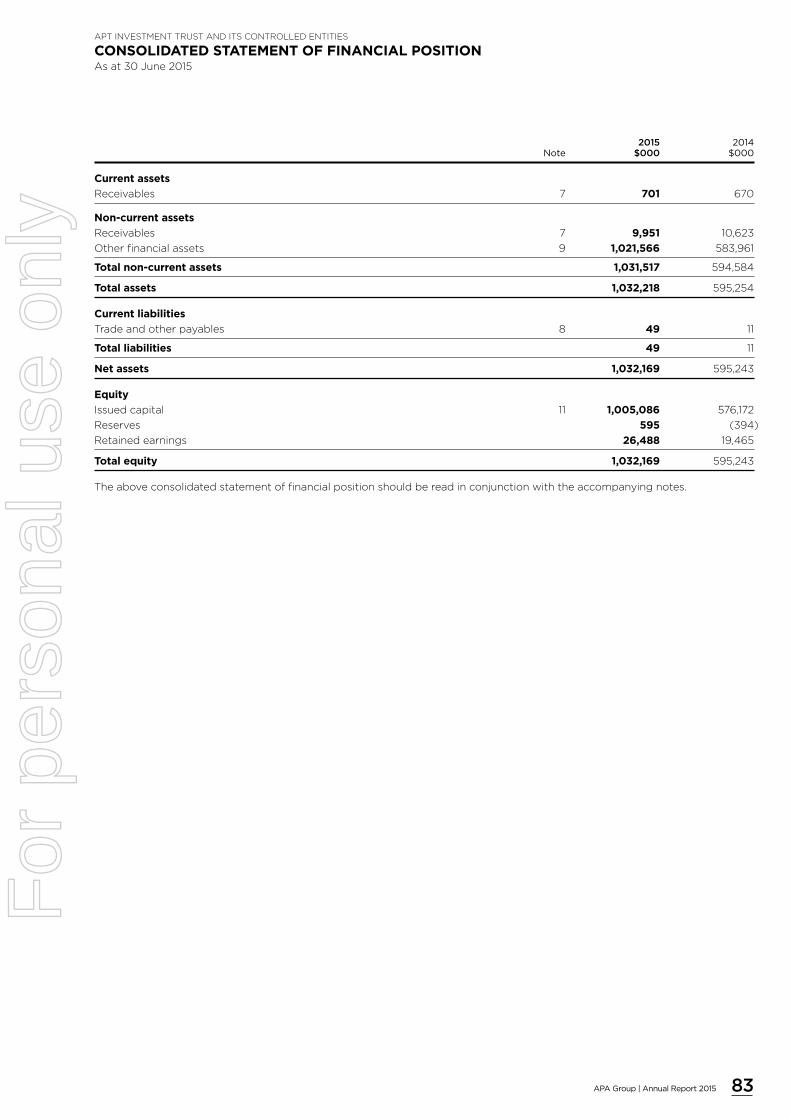
83APA Group | Annual Report 2015
APTINVESTMENTTRUSTANDITSCONTROLLEDENTITIES
CONSOLIDATED STATEMENT OF FINANCIAL POSITIONAsat30June2015
2015 2014 Note $000 $000
Current assets
Receivables 7 701 670
Non-current assets
Receivables 7 9,951 10,623
Otherfinancialassets 9 1,021,566 583,961
Total non-current assets 1,031,517 594,584
Total assets 1,032,218 595,254
Current liabilities
Tradeandotherpayables 8 49 11
Total liabilities 49 11
Net assets 1,032,169 595,243
Equity
Issuedcapital 11 1,005,086 576,172
Reserves 595 (394)
Retainedearnings 26,488 19,465
Total equity 1,032,169 595,243
Theaboveconsolidatedstatementoffinancialpositionshouldbereadinconjunctionwiththeaccompanyingnotes.
For
per
sona
l use
onl
y

84 APA Group | Annual Report 2015
Issued Retained capital Reserves earnings Total Note $000 $000 $000 $000
Balanceat1July2013 578,780 467 19,424 598,671
Profitfortheyear – – 38,706 38,706
Othercomprehensiveincomefortheyear(netoftax) – (861) – (861)
Totalcomprehensiveincomefortheyear – (861) 38,706 37,845
Distributionstounitholders 6 (2,608) – (38,665) (41,273)
Balanceat30June2014 576,172 (394) 19,465 595,243
Balance at 1 July 2014 576,172 (394) 19,465 595,243
Profit for the year – – 46,348 46,348
Other comprehensive income for the year (net of tax) – 989 – 989
Total comprehensive income for the year – 989 46,348 47,337
Issue of capital (net of issue costs) 11 428,914 – – 428,914
Distributions to unitholders 6 – – (39,325) (39,325)
Balance at 30 June 2015 1,005,086 595 26,488 1,032,169
Theaboveconsolidatedstatementofchangesinequityshouldbereadinconjunctionwiththeaccompanyingnotes.
APTINVESTMENTTRUSTANDITSCONTROLLEDENTITIES
CONSOLIDATED STATEMENT OF CHANGES IN EQUITYForthefinancialyearended30June2015
For
per
sona
l use
onl
y

85APA Group | Annual Report 2015
APTINVESTMENTTRUSTANDITSCONTROLLEDENTITIES
CONSOLIDATED STATEMENT OF CASH FLOWSForthefinancialyearended30June2015
2015 2014 $000 $000
Cash flows from operating activities
Trustdistribution–relatedparty 23,184 23,013
Dividendsreceived 125 126
Interestreceived–relatedparties 21,889 15,199
Proceedsfromrepaymentoffinanceleases 1,167 1,168
Receiptsfromcustomers 318 201
Paymentstosuppliers (11) (12)
Net cash provided by operating activities 46,672 39,695
Cash flows from investing activities
(Advancesto)/repaymentreceivedfromrelatedparties (436,276) 1,592
Net cash (used in)/provided by investing activities (436,276) 1,592
Cash flows from financing activities
Proceedsfromissueofunits 438,351 –
Paymentofunitissuecosts (9,422) (14)
Distributionstounitholders (39,325) (41,273)
Net cash used in financing activities 389,604 (41,287)
Net increase in cash and cash equivalents – –
Cashandcashequivalentsatbeginningoffinancialyear – –
Cash and cash equivalents at end of financial year – –
Theaboveconsolidatedstatementofcashflowsshouldbereadinconjunctionwiththeaccompanyingnotes.
Cashflowsareincludedinthestatementofcashflowsonagrossbasis.TheGSTcomponentofcashflowsarisingfrominvestingandfinancingactivitieswhichisrecoverablefrom,orpayableto,thetaxationauthorityisclassifiedwithinoperatingcashflows.
For
per
sona
l use
onl
y

86 APA Group | Annual Report 2015
APTINVESTMENTTRUSTANDITSCONTROLLEDENTITIES
NOTES TO THE CONSOLIDATED FINANCIAL STATEMENTSForthefinancialyearended30June2015
BASIS OF PREPARATION
1. About this reportThecontentandformatofthefinancialstatementshavebeenstreamlinedtopresentthefinancialinformationinamoremeaningfulmannertounitholders.NotedisclosureshavebeengroupedintosixsectionsbeingBasisofPreparation,FinancialPerformance,OperatingAssetsandLiabilities,CapitalManagement,GroupStructureandOther.Eachnotesetsouttheaccountingpoliciesappliedinproducingtheresultsalongwithanykeyjudgementsandestimatesused.ThepurposeofrevisedformatistoprovidereaderswithaclearerunderstandingofwhatarethekeydriversoffinancialperformancefortheConsolidatedEntity.
Basis of Preparation
1. Aboutthisreport
2. Generalinformation
Financial Performance
3. Profitfromoperations
4. Incometax
5. Earningsperunit
6. Distributions
Operating Assets and Liabilities
7. Receivables
8. Payables
Capital Management
9. Otherfinancialinstruments
10. Financialriskmanagement
11. Issuedcapital
Group Structure
12. Subsidiaries
Other
13. Commitmentsandcontingencies
14. Directorandseniorexecutiveremuneration
15. Remunerationofexternalauditor
16. Relatedpartytransactions
17. Parententityinformation
18. Leases
19. AdoptionofnewandrevisedAccountingStandards
20. Eventsoccurringafterreportingdate
2. General informationAPTInvestmentTrust(“APTIT”or“Trust”)isoneofthetwostapledtrustsofAPAGroup(“APAGroup”),theotherstapledtrustbeingAustralianPipelineTrust(“APT”).EachofAPTandAPTITareregisteredmanagedinvestmentschemesregulatedbytheCorporations Act 2001.APTITunitsare“stapled”toAPTunitsonaone-to-onebasissothatoneAPTITunitandoneAPTunitformasinglestapledsecuritywhichtradesontheAustralianSecuritiesExchangeunderthecode“APA”.
ThisfinancialreportrepresentstheconsolidatedfinancialstatementsofAPTITanditscontrolledentities(togetherthe“ConsolidatedEntity”).Forthepurposesofpreparingtheconsolidatedfinancialreport,theConsolidatedEntityisafor-profitentity.
Allintragrouptransactionsandbalanceshavebeeneliminatedonconsolidation.Wherenecessary,adjustmentsaremadetotheassets,liabilities,andresultsofsubsidiaries,jointarrangementsandassociatestobringtheiraccountingpoliciesintolinewiththoseusedbytheConsolidatedEntity.
APTIT’sregisteredofficeanditsprincipalplaceofbusinessareasfollows:
RegisteredofficeandprincipalplaceofbusinessLevel19HSBCBuilding580GeorgeStreetSYDNEYNSW2000Tel:(02)96930000
APTIToperatesasaninvestmententitywithintheAustralianPipelineTruststapledgroup.
Thefinancialreportfortheyearended30June2015wasauthorisedforissueinaccordancewitharesolutionofthedirectorson26August2015.
Thisgeneralpurposefinancialreportfortheyearended30June2015hasbeenpreparedinaccordancewiththeCorporations Act 2001,AustralianAccountingStandardsandotherauthoritativepronouncementsoftheAustralianAccountingStandardsBoardandInterpretations(AIFRS).CompliancewithAustralianAccountingStandardsensuresthattheFinancialStatementsandnotesalsocomplywithInternationalFinancialReportingStandards(IFRS).
Thefinancialreporthasbeenpreparedonthebasisofhistoricalcost,exceptfortherevaluationoffinancialinstruments.ThefinancialreportispresentedinAustraliandollarsandallvaluesareroundedtothenearestthousanddollars($000)inaccordancewithASICClassOrder98/0100,unlessotherwisestated.
i) SubsidiariesSubsidiariesareentitiescontrolledbyAPTIT.ControlexistswhereAPTIThaspowerovertheentities,i.e.existingrightsthatgiveAPTITthecurrentabilitytodirecttherelevantactivitiesoftheentities(thosethatsignificantlyaffectthereturns);exposure,orrights,tovariablereturnsfromitsinvolvementwiththeentities;andtheabilitytouseitspowertoaffectthosereturns.
ii) Segment informationTheConsolidatedEntityhasonereportablesegmentbeingenergyinfrastructureinvestmentandoperation.
TheConsolidatedEntityisaninvestingentitywithintheAustralianPipelineTruststapledgroup.AstheTrustonlyoperatesinonesegment,ithasnotdisclosedsegmentinformationseparately.
For
per
sona
l use
onl
y

87APA Group | Annual Report 2015
APT INVESTMENT TRUST AND ITS CONTROLLED ENTITIES
NOTES TO THE CONSOLIDATED FINANCIAL STATEMENTS CONTINUEDFor the financial year ended 30 June 2015
FINANCIAL PERFORMANCE
3. Profit from operationsProfitbeforeincometaxincludesthefollowingitemsofincomeandexpense:
2015 2014 $000 $000
Revenue
Distributions
Trustdistribution–relatedparty 23,184 23,013
Otherentities 125 125
23,309 23,138
Finance income
Interest–relatedparties 22,157 15,162
Gain/(loss)onfinancialassetheldatfairvaluethroughprofitorloss 70 (342)
Financeleaseincome–relatedparty 529 559
22,756 15,379
Other revenue
Other 294 201
Total revenue 46,359 38,718
Expenses
Auditfees (11) (12)
Total expenses (11) (12)
RevenueisrecognisedtotheextentthatitisprobablethattheeconomicbenefitswillflowtotheConsolidatedEntityandcanbereliablymeasured.Amountsdisclosedasrevenuearenetofdutiesandtaxespaid.Revenueisrecognisedforthemajorbusinessactivitiesasfollows:
Interest revenue,whichisrecognisedasitaccruesandisdeterminedusingtheeffectiveinterestmethod;
Distribution revenue,whichisrecognisedwhentherighttoreceiveadistributionhasbeenestablished;
Dividend revenue,whichisrecognisedwhentherighttoreceiveadividendhasbeenestablished;and
Finance lease income,whichisrecognisedwhenreceivable.
4. IncometaxIncometaxexpenseisnotbroughttoaccountinrespectofAPTITas,pursuanttotheAustraliantaxationlawsAPTIT,isnotliableforincometaxprovidedthatitsrealisedtaxableincome(includinganyassessablerealisedcapitalgains)isfullydistributedtoitsunitholderseachyear.
5. Earnings per unit 2014 2015 (Restated)
Basicanddiluted(centsperunit) 4.7 4.5
Theearningsandweightedaveragenumberofunitsusedinthecalculationofbasicanddilutedearningsperunitareasfollows:
2015 2014 $000 $000
Netprofitattributabletounitholdersforcalculatingbasicanddilutedearningsperunit 46,348 38,706
2014 2015 (Restated) No.ofunits No. of units 000 000
Adjustedweightedaveragenumberofordinaryunitsusedinthecalculationofbasicanddilutedearningsperunit 995,245 865,977
Onthe23December2014,APAGroupissued145,164,302newordinarysecuritiesoncompletionoftheinstitutionalcomponentandearlyacceptanceperiodoftheretailcomponentforthefullyunderwrittenrightsissue.Theremainingallocationoftheretailcomponentbeing133,392,260wascompletedon28January2015.Theissuewasofferedat$6.60persecurity,adiscounttoAPAGroup’sclosingmarketpriceof$7.67persecurityonthe9December2014,thelasttradingdaybeforetherecorddateoftheentitlementofferof15December2014.Thenumberofsecuritiesusedforthecurrentandpriorperiodcalculationofearningspersecurityhasbeenadjustedforthediscountedrightsissue.Anadjustmentfactorof1.036hasbeencalculated,beingtheclosingmarketpricepersecurityon9December2014,dividedbythetheoreticalex-rightsvalue(TERV)of$7.40persecurity.
For
per
sona
l use
onl
y
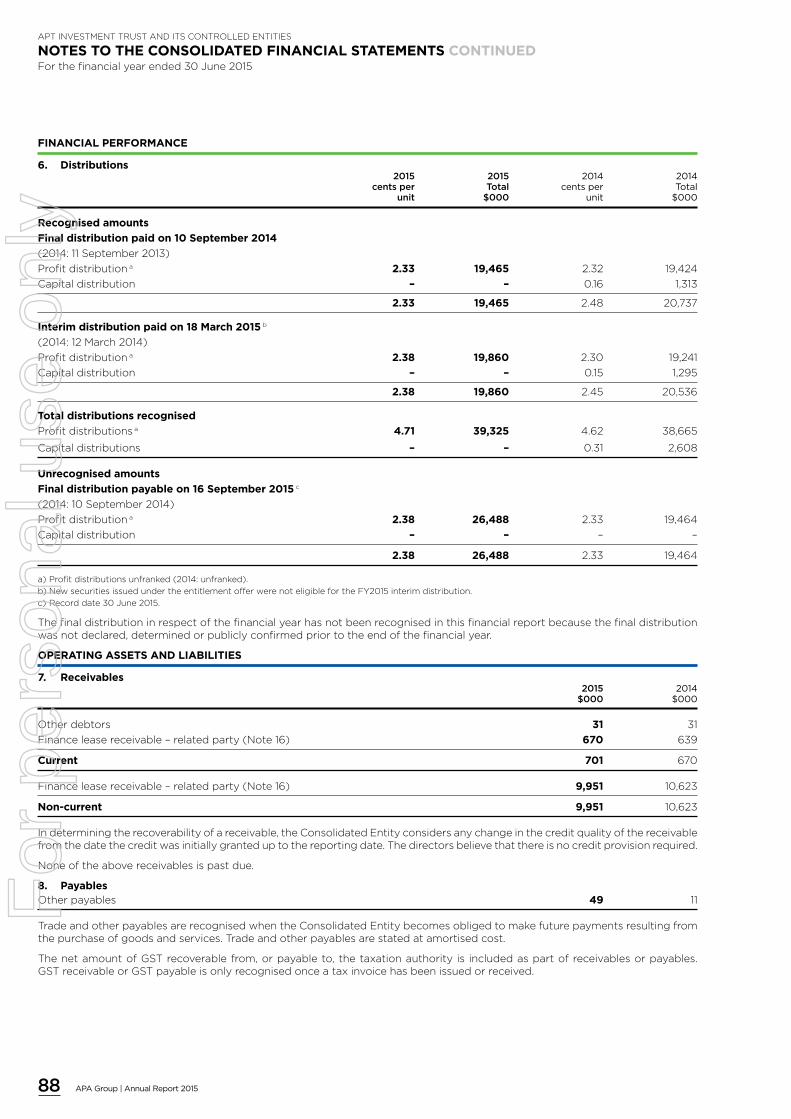
88 APA Group | Annual Report 2015
APT INVESTMENT TRUST AND ITS CONTROLLED ENTITIES
NOTES TO THE CONSOLIDATED FINANCIAL STATEMENTS CONTINUEDFor the financial year ended 30 June 2015
FINANCIAL PERFORMANCE
6. Distributions 2015 2015 2014 2014 centsper Total cents per Total unit $000 unit $000
Recognised amounts
Final distribution paid on 10 September 2014
(2014:11September2013)
Profitdistributiona 2.33 19,465 2.32 19,424
Capitaldistribution – – 0.16 1,313
2.33 19,465 2.48 20,737
Interim distribution paid on 18 March 2015 b
(2014:12March2014)
Profitdistributiona 2.38 19,860 2.30 19,241
Capitaldistribution – – 0.15 1,295
2.38 19,860 2.45 20,536
Total distributions recognised
Profitdistributionsa 4.71 39,325 4.62 38,665
Capitaldistributions – – 0.31 2,608
Unrecognised amounts
Final distribution payable on 16 September 2015 c
(2014:10September2014)
Profitdistributiona 2.38 26,488 2.33 19,464
Capitaldistribution – – – –
2.38 26,488 2.33 19,464
a)Profitdistributionsunfranked(2014:unfranked).
b)NewsecuritiesissuedundertheentitlementofferwerenoteligiblefortheFY2015interimdistribution.
c)Recorddate30June2015.
Thefinaldistributioninrespectofthefinancialyearhasnotbeenrecognisedinthisfinancialreportbecausethefinaldistributionwasnotdeclared,determinedorpubliclyconfirmedpriortotheendofthefinancialyear.
OPERATING ASSETS AND LIABILITIES
7. Receivables 2015 2014 $000 $000
Otherdebtors 31 31
Financeleasereceivable–relatedparty(Note16) 670 639
Current 701 670
Financeleasereceivable–relatedparty(Note16) 9,951 10,623
Non-current 9,951 10,623
Indeterminingtherecoverabilityofareceivable,theConsolidatedEntityconsidersanychangeinthecreditqualityofthereceivablefromthedatethecreditwasinitiallygranteduptothereportingdate.Thedirectorsbelievethatthereisnocreditprovisionrequired.
Noneoftheabovereceivablesispastdue.
8. PayablesOtherpayables 49 11
TradeandotherpayablesarerecognisedwhentheConsolidatedEntitybecomesobligedtomakefuturepaymentsresultingfromthepurchaseofgoodsandservices.Tradeandotherpayablesarestatedatamortisedcost.
ThenetamountofGSTrecoverablefrom,orpayableto,thetaxationauthorityis includedaspartofreceivablesorpayables.GSTreceivableorGSTpayableisonlyrecognisedonceataxinvoicehasbeenissuedorreceived.
For
per
sona
l use
onl
y

89APA Group | Annual Report 2015
APT INVESTMENT TRUST AND ITS CONTROLLED ENTITIES
NOTES TO THE CONSOLIDATED FINANCIAL STATEMENTS CONTINUEDFor the financial year ended 30 June 2015
CAPITAL MANAGEMENT
9. Other financial instruments 2015 2014 $000 $000
Non-current
Advancetorelatedparty 876,911 440,633
Investmentscarriedatcost:
Investmentinrelatedpartya 107,379 107,379
984,290 548,012
Financialassetscarriedatfairvalue:
Redeemableordinarysharesb 34,765 34,427
Available-for-saleinvestmentscarriedatfairvaluec 2,511 1,522
1,021,566 583,961
a)TheinvestmentinrelatedpartyreflectsGasNetAustraliaInvestmentsTrust’s(“GAIT”)investmentin100%oftheBClassunitsinGasNetATrust.TheBClassunitsgiveGAITpreferredrightstotheincomeandcapitalofGasNetATrust,butholdnovotingrights.TheAClassunitholdermayhoweversuspendforaperiodorterminatealloftheBClassunitholderrightstoincomeandcapital.Assuch,GAITneithercontrolsnorhasasignificantinfluenceoverGasNetATrust.GasNetAustraliaTrust,arelatedpartywhollyownedbyAPAGroup,owns100%oftheAClassunitsinGasNetATrustand,accordingly,GasNetATrustisincludedintheconsolidationoftheAPAGroup.TheinvestmenthasnotbeenmeasuredatfairvalueastheunitsofGasNetATrustarenotavailablefortradeonanactivemarketandassuch,thefairvalueoftheunitscannotbereliablydetermined.TheConsolidatedEntitydoesnotintendtodisposeofitsinterestinGasNetATrust.
b)FinancialassetscarriedatfairvaluerelatetoAPAGroup’s19.9%investmentinEnergyInfrastructureInvestmentsPtyLtdwhereAustralianPipelineLimited(APL),asResponsibleEntityforAPTIT,acquiredtheredeemableordinaryshares.Thisinvestmentisclassifiedasfairvaluethroughprofitorloss.
c)Available-for-saleinvestmentsreflecta6%unitholdinginEthanePipelineIncomeFinancingTrust.
Financialassetsareclassifiedintothefollowingspecifiedcategories:‘available-for-sale’financialassets,‘loansandreceivables’and‘fairvaluethroughprofitorloss’.
Theclassificationdependsonthenatureandpurposeofthefinancialassetsandisdeterminedatthetimeofinitialrecognition.
EffectiveinterestmethodTheeffectiveinterestmethodisamethodofcalculatingtheamortisedcostofafinancialassetandofallocatinginterestincomeovertherelevantperiod.Theeffectiveinterestrateistheratethatexactlydiscountsestimatedfuturecashreceiptsthroughtheexpectedlifeofthefinancialasset,orwhereappropriate,ashorterperiod.
FairvaluethroughprofitorlossFinancialassetsatfairvaluethroughprofitorlossarestatedatfairvalue,withanyresultantgainorlossrecognisedinprofitorloss.Thenetgainorlossrecognisedinprofitorlossincorporatesanydividendorinterestearnedonthefinancialasset.
Available-for-salefinancialassetsFinancialassetsclassifiedasbeingavailable-for-salearestatedatfairvalue.Gainsandlossesarisingfromchangesinfairvaluearerecogniseddirectlyintheavailable-for-saleinvestmentrevaluationreserve.
Theavailable-for-saleinvestmentrevaluationreservearisesontherevaluationofavailable-for-salefinancialassets.Whenarevaluedfinancialassetissold,theportionofthereservewhichrelatestothatfinancialassetiseffectivelyrealised,andisrecognisedinprofitorloss.Whenarevaluedfinancialassetisimpaired,theportionofthereservewhichrelatestothatfinancialassetisrecognisedinprofitorloss.
ReceivablesandloansTradereceivables,loans,andotherreceivablesthathavefixedordeterminablepaymentsthatarenotquotedinanactivemarketareclassifiedas‘loansandreceivables’.Tradeandotherreceivablesarestatedattheiramortisedcostlessimpairment.
ImpairmentoffinancialassetsFinancialassetsareassessedforindicatorsofimpairmentateachbalancesheetdate.Financialassetsareimpairedwherethereisobjectiveevidencethatasaresultofoneormoreeventsthatoccurredafterinitialrecognitionofthefinancialasset,theestimatedfuturecashflowsoftheinvestmenthavebeenadverselyimpacted.
10. Financial risk managementTheTreasurydepartmentwithinFinanceisresponsiblefortheoverallmanagementoftheConsolidatedEntity’scapitalraisingactivities,liquidity,lenderrelationshipsandengagement,debtportfoliomanagement,interestrateandforeignexchangehedging,creditratingmaintenanceandthirdpartyindemnities(bankguarantees)withinriskmanagementparametersreviewedbytheBoard.TheAuditandRiskManagementCommitteeapproveswrittenprinciplesforoverallriskmanagement,aswellaspoliciescoveringspecificareassuchasliquidityandfundingrisk,foreigncurrencyrisk,interestraterisk,creditrisk,contractandlegalriskandoperationalrisk.TheConsolidatedEntity’sBoardofDirectorsensuresthereisanappropriateRiskManagementPolicyforthemanagementoftreasuryriskandcompliancewiththepolicythroughmonthlyreportingfromtheTreasurydepartment.
TheConsolidatedEntity’sactivitiesgeneratefinancialinstrumentscomprisingofcash,receivables,payablesandinterestbearingliabilitieswhichexposeittovariousrisksassummarisedbelow:
a) Marketriskincludingcurrencyrisk,interestrateriskandpricerisk;
b) Creditrisk;and
c) Liquidityrisk.
TreasuryasacentralisedfunctionprovidestheConsolidatedEntitywiththebenefitsofefficientcashutilisation,controloffundinganditsassociatedcosts,efficientandeffectivemanagementofaggregatedfinancialriskandconcentrationoffinancialexpertise,atanacceptablecost,andminimisesrisksthroughtheuseofnaturalhedgesandderivativeinstruments.TheConsolidatedEntitydoesnotengageinspeculativetrading.AllderivativeshavebeentradedtohedgeunderlyingorexistingexposuresandhaveadheredtotheBoardapprovedTreasuryRiskManagementPolicy.
For
per
sona
l use
onl
y
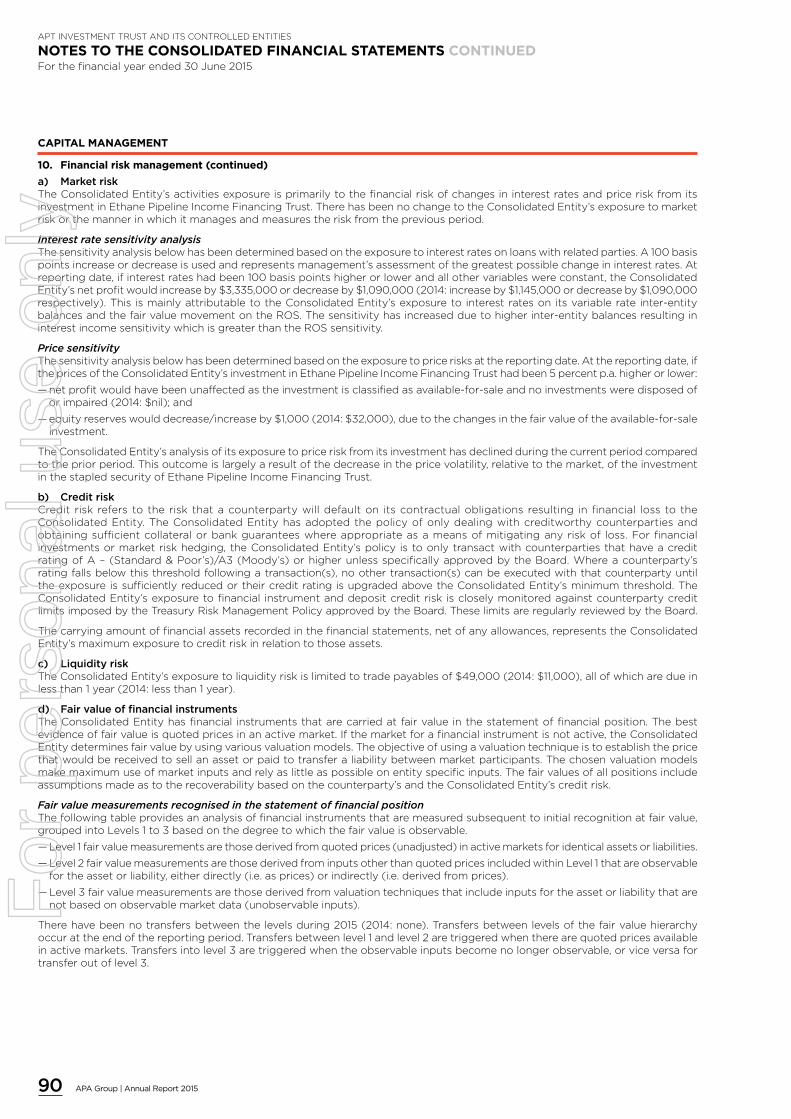
90 APA Group | Annual Report 2015
APT INVESTMENT TRUST AND ITS CONTROLLED ENTITIES
NOTES TO THE CONSOLIDATED FINANCIAL STATEMENTS CONTINUEDFor the financial year ended 30 June 2015
CAPITAL MANAGEMENT
10. Financial risk management (continued)
a) MarketriskTheConsolidatedEntity’sactivitiesexposureisprimarilytothefinancialriskofchangesininterestratesandpriceriskfromitsinvestmentinEthanePipelineIncomeFinancingTrust.TherehasbeennochangetotheConsolidatedEntity’sexposuretomarketriskorthemannerinwhichitmanagesandmeasurestheriskfromthepreviousperiod.
Interest rate sensitivity analysisThesensitivityanalysisbelowhasbeendeterminedbasedontheexposuretointerestratesonloanswithrelatedparties.A100basispointsincreaseordecreaseisusedandrepresentsmanagement’sassessmentofthegreatestpossiblechangeininterestrates.Atreportingdate,ifinterestrateshadbeen100basispointshigherorlowerandallothervariableswereconstant,theConsolidatedEntity’snetprofitwouldincreaseby$3,335,000ordecreaseby$1,090,000(2014:increaseby$1,145,000ordecreaseby$1,090,000respectively).ThisismainlyattributabletotheConsolidatedEntity’sexposuretointerestratesonitsvariablerateinter-entitybalancesandthefairvaluemovementontheROS.Thesensitivityhasincreasedduetohigherinter-entitybalancesresultingininterestincomesensitivitywhichisgreaterthantheROSsensitivity.
Price sensitivityThesensitivityanalysisbelowhasbeendeterminedbasedontheexposuretopricerisksatthereportingdate.Atthereportingdate,ifthepricesoftheConsolidatedEntity’sinvestmentinEthanePipelineIncomeFinancingTrusthadbeen5percentp.a.higherorlower:
— netprofitwouldhavebeenunaffectedastheinvestmentisclassifiedasavailable-for-saleandnoinvestmentsweredisposedoforimpaired(2014:$nil);and
— equityreserveswoulddecrease/increaseby$1,000(2014:$32,000),duetothechangesinthefairvalueoftheavailable-for-saleinvestment.
TheConsolidatedEntity’sanalysisofitsexposuretopriceriskfromitsinvestmenthasdeclinedduringthecurrentperiodcomparedtothepriorperiod.Thisoutcomeislargelyaresultofthedecreaseinthepricevolatility,relativetothemarket,oftheinvestmentinthestapledsecurityofEthanePipelineIncomeFinancingTrust.
b) CreditriskCreditriskreferstotheriskthatacounterpartywilldefaulton itscontractualobligationsresulting infinancial losstotheConsolidatedEntity.TheConsolidatedEntityhasadoptedthepolicyofonlydealingwithcreditworthycounterpartiesandobtainingsufficientcollateralorbankguaranteeswhereappropriateasameansofmitigatinganyriskof loss.Forfinancialinvestmentsormarketriskhedging,theConsolidatedEntity’spolicyistoonlytransactwithcounterpartiesthathaveacreditratingofA–(Standard&Poor’s)/A3(Moody’s)orhigherunlessspecificallyapprovedbytheBoard.Whereacounterparty’sratingfallsbelowthisthresholdfollowingatransaction(s),noothertransaction(s)canbeexecutedwiththatcounterpartyuntiltheexposureissufficientlyreducedortheircreditratingisupgradedabovetheConsolidatedEntity’sminimumthreshold.TheConsolidatedEntity’sexposuretofinancial instrumentanddepositcreditriskiscloselymonitoredagainstcounterpartycreditlimitsimposedbytheTreasuryRiskManagementPolicyapprovedbytheBoard.TheselimitsareregularlyreviewedbytheBoard.
Thecarryingamountoffinancialassetsrecordedinthefinancialstatements,netofanyallowances,representstheConsolidatedEntity’smaximumexposuretocreditriskinrelationtothoseassets.
c) LiquidityriskTheConsolidatedEntity’sexposuretoliquidityriskislimitedtotradepayablesof$49,000(2014:$11,000),allofwhicharedueinlessthan1year(2014:lessthan1year).
d) FairvalueoffinancialinstrumentsTheConsolidatedEntityhasfinancial instrumentsthatarecarriedatfairvalueinthestatementoffinancialposition.Thebestevidenceoffairvalueisquotedpricesinanactivemarket.Ifthemarketforafinancialinstrumentisnotactive,theConsolidatedEntitydeterminesfairvaluebyusingvariousvaluationmodels.Theobjectiveofusingavaluationtechniqueistoestablishthepricethatwouldbereceivedtosellanassetorpaidtotransferaliabilitybetweenmarketparticipants.Thechosenvaluationmodelsmakemaximumuseofmarketinputsandrelyaslittleaspossibleonentityspecificinputs.Thefairvaluesofallpositionsincludeassumptionsmadeastotherecoverabilitybasedonthecounterparty’sandtheConsolidatedEntity’screditrisk.
Fair value measurements recognised in the statement of financial positionThefollowingtableprovidesananalysisoffinancialinstrumentsthataremeasuredsubsequenttoinitialrecognitionatfairvalue,groupedintoLevels1to3basedonthedegreetowhichthefairvalueisobservable.
— Level1fairvaluemeasurementsarethosederivedfromquotedprices(unadjusted)inactivemarketsforidenticalassetsorliabilities.
— Level2fairvaluemeasurementsarethosederivedfrominputsotherthanquotedpricesincludedwithinLevel1thatareobservablefortheassetorliability,eitherdirectly(i.e.asprices)orindirectly(i.e.derivedfromprices).
— Level3fairvaluemeasurementsarethosederivedfromvaluationtechniquesthatincludeinputsfortheassetorliabilitythatarenotbasedonobservablemarketdata(unobservableinputs).
Therehavebeennotransfersbetweenthelevelsduring2015(2014:none).Transfersbetweenlevelsofthefairvaluehierarchyoccurattheendofthereportingperiod.Transfersbetweenlevel1andlevel2aretriggeredwhentherearequotedpricesavailableinactivemarkets.Transfersintolevel3aretriggeredwhentheobservableinputsbecomenolongerobservable,orviceversafortransferoutoflevel3.
For
per
sona
l use
onl
y

91APA Group | Annual Report 2015
APT INVESTMENT TRUST AND ITS CONTROLLED ENTITIES
NOTES TO THE CONSOLIDATED FINANCIAL STATEMENTS CONTINUEDFor the financial year ended 30 June 2015
CAPITAL MANAGEMENT
10. Financial risk management (continued)d) Fairvalueoffinancialinstruments(continued)
Fair value of the Group’s financial assets and liabilities that are measured at fair value on a recurring basisThefairvaluesoffinancialassetsandfinancialliabilitiesaremeasuredattheendofeachreportingperiodanddeterminedasfollows:
Available-for-sale listed equity securities— thefairvaluesofavailable-for-salefinancialassetsandfinancialliabilitieswithstandardtermsandconditionsandtradedonactiveliquidmarketsaredeterminedwithreferencetoquotedmarketprices;and
— theseinstrumentsareclassifiedinthefairvaluehierarchyatlevel1.
Unlisted redeemable ordinary sharesThefinancialstatementsincluderedeemableordinaryshares(“ROS”)heldinanunlistedentitywhicharemeasuredatfairvalue(Note9).ThefairmarketvalueoftheROSisderivedfromabinomialtreemodel,whichincludessomeassumptionsthatarenotabletobesupportedbyobservablemarketpricesorrates.Themodelmapsdifferentpossiblevaluationpathsofthreedistinctcomponents:
— valueofthedebtcomponent;
— valueoftheROSdiscretionarydividends;and
— valueoftheoptiontoconverttoordinaryshares.
Indeterminingthefairvalue,thefollowingassumptionswereused:
— theriskadjustedratefortheROSisestimatedastherequiredrateofreturnbasedonprojectedcashflowstoequityatissuanceassumingtheROSpriceatissuance($0.99)andtheordinarypriceatissuance($0.01)areattheirfairvalue;
— theriskfreerateofreturnis2.13%(2014:2.93%)perannumandisbaseduponaninterpolationofthethreeandfiveyearGovernmentbondratesatthevaluationdate;
— theROSdiscretionarydividendsareestimatedbasedonaninternalforecastedcashflowmodel;
— thevalueoftheoptiontoconvertisdeemedtobezero(2014:zero).Forconversiontooccur,anumberofconditionsmustbemet.Atthereportingdate,itwasdeemedhighlyunlikelytheseconditionswouldoccurbasedonaninternalforecastingmodel;and
— theseinstrumentsareclassifiedinthefairvaluehierarchyatlevel3.
Thefairvalueisimpactedbythefollowingunobservableinputs:
— anincreaseinthediscountratewillresultinadecreaseinthefairvalue;
— anincreaseindiscretionarydividendswillresultinaincreaseinthefairvalue;and
— meetingconditionstotriggertheconversionoftheoptionwouldresultinanincreaseinthefairvalue.
Fair value hierarchy Level1 Level2 Level3 Total2015 $000 $000 $000 $000
Financial assets measured at fair value (Note 9)
Available-for-sale listed equity securities
EthanePipelineIncomeFund 2,511 – – 2,511
Unlisted redeemable ordinary shares
EnergyInfrastructureInvestments – – 34,765 34,765
2,511 – 34,765 37,276
2014
Financial assets measured at fair value (Note 9)
Available-for-sale listed equity securities
EthanePipelineIncomeFund 1,522 – – 1,522
Unlisted redeemable ordinary shares
EnergyInfrastructureInvestments – – 34,427 34,427
1,522 – 34,427 35,949
Reconciliation of Level 3 fair value measurements of financial assets FairvaluethroughProfitorLoss
2015 2014 $000 $000
Openingbalance 34,427 34,807
Total gains or losses:
–inprofitorloss:Interest–relatedparties 3,522 4,245
–inprofitorloss:(Loss)/gainonfinancialassetheldatfairvaluethroughprofitorloss 70 (342)
Distributions (3,254) (4,283)
Closing balance 34,765 34,427
For
per
sona
l use
onl
y
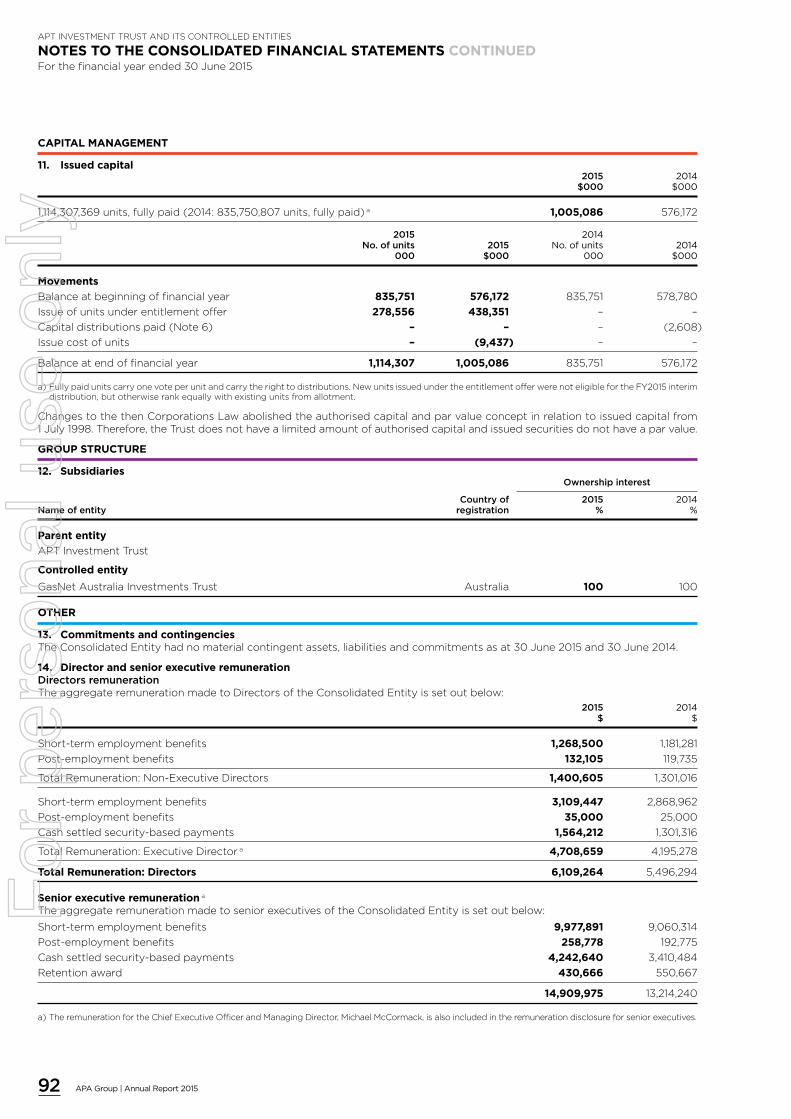
92 APA Group | Annual Report 2015
APT INVESTMENT TRUST AND ITS CONTROLLED ENTITIES
NOTES TO THE CONSOLIDATED FINANCIAL STATEMENTS CONTINUEDFor the financial year ended 30 June 2015
CAPITAL MANAGEMENT
11. Issued capital 2015 2014 $000 $000
1,114,307,369units,fullypaid(2014:835,750,807units,fullypaid)a 1,005,086 576,172
2015 2014 No.ofunits 2015 No. of units 2014 000 $000 000 $000
Movements
Balanceatbeginningoffinancialyear 835,751 576,172 835,751 578,780
Issueofunitsunderentitlementoffer 278,556 438,351 – –
Capitaldistributionspaid(Note6) – – – (2,608)
Issuecostofunits – (9,437) – –
Balanceatendoffinancialyear 1,114,307 1,005,086 835,751 576,172
a)Fullypaidunitscarryonevoteperunitandcarrytherighttodistributions.NewunitsissuedundertheentitlementofferwerenoteligiblefortheFY2015interimdistribution,butotherwiserankequallywithexistingunitsfromallotment.
ChangestothethenCorporationsLawabolishedtheauthorisedcapitalandparvalueconceptinrelationtoissuedcapitalfrom1July1998.Therefore,theTrustdoesnothavealimitedamountofauthorisedcapitalandissuedsecuritiesdonothaveaparvalue.
GROUP STRUCTURE
12. Subsidiaries Ownershipinterest
Countryof 2015 2014Nameofentity registration % %
Parent entity
APTInvestmentTrust
Controlled entity
GasNetAustraliaInvestmentsTrust Australia 100 100
OTHER
13. Commitments and contingenciesTheConsolidatedEntityhadnomaterialcontingentassets,liabilitiesandcommitmentsasat30June2015and30June2014.
14. Director and senior executive remunerationDirectorsremunerationTheaggregateremunerationmadetoDirectorsoftheConsolidatedEntityissetoutbelow:
2015 2014 $ $
Short-termemploymentbenefits 1,268,500 1,181,281
Post-employmentbenefits 132,105 119,735
TotalRemuneration:Non-ExecutiveDirectors 1,400,605 1,301,016
Short-termemploymentbenefits 3,109,447 2,868,962
Post-employmentbenefits 35,000 25,000
Cashsettledsecurity-basedpayments 1,564,212 1,301,316
TotalRemuneration:ExecutiveDirectora 4,708,659 4,195,278
Total Remuneration: Directors 6,109,264 5,496,294
Senior executive remunerationa
TheaggregateremunerationmadetoseniorexecutivesoftheConsolidatedEntityissetoutbelow:
Short-termemploymentbenefits 9,977,891 9,060,314
Post-employmentbenefits 258,778 192,775
Cashsettledsecurity-basedpayments 4,242,640 3,410,484
Retentionaward 430,666 550,667
14,909,975 13,214,240
a)TheremunerationfortheChiefExecutiveOfficerandManagingDirector,MichaelMcCormack,isalsoincludedintheremunerationdisclosureforseniorexecutives.
For
per
sona
l use
onl
y
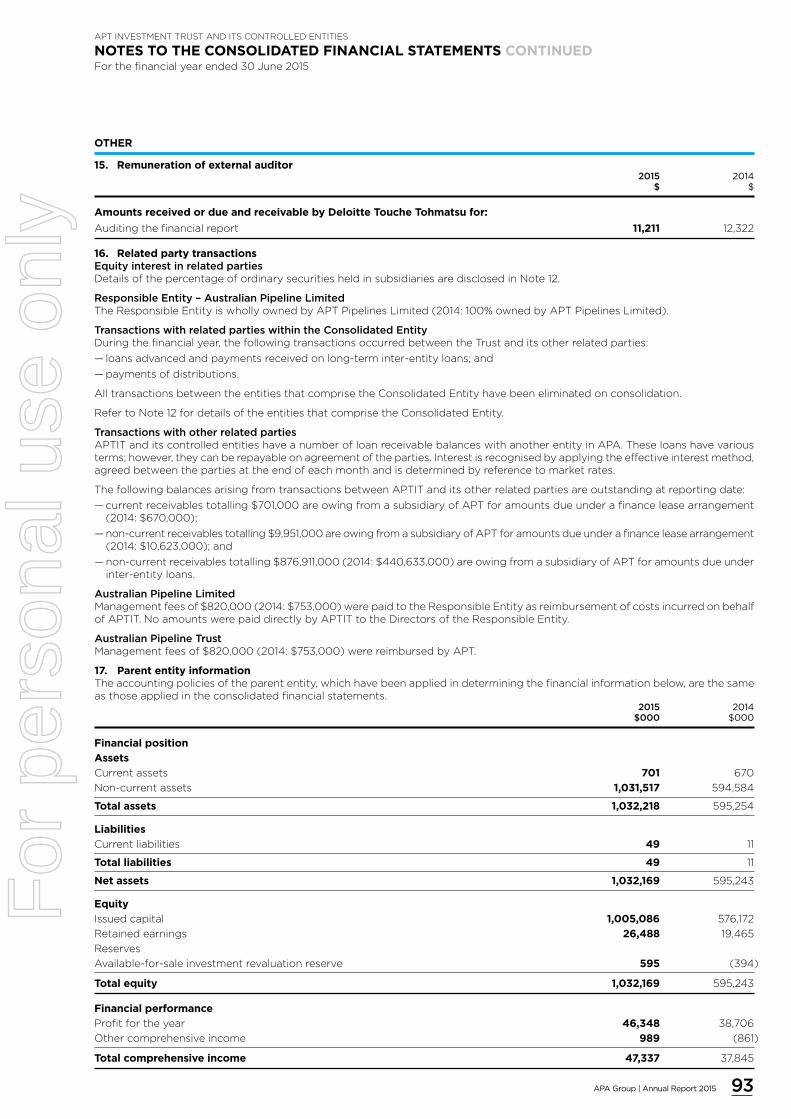
93APA Group | Annual Report 2015
APT INVESTMENT TRUST AND ITS CONTROLLED ENTITIES
NOTES TO THE CONSOLIDATED FINANCIAL STATEMENTS CONTINUEDFor the financial year ended 30 June 2015
OTHER
15. Remuneration of external auditor 2015 2014 $ $
Amounts received or due and receivable by Deloitte Touche Tohmatsu for:
Auditingthefinancialreport 11,211 12,322
16. Related party transactionsEquityinterestinrelatedpartiesDetailsofthepercentageofordinarysecuritiesheldinsubsidiariesaredisclosedinNote12.
ResponsibleEntity–AustralianPipelineLimitedTheResponsibleEntityiswhollyownedbyAPTPipelinesLimited(2014:100%ownedbyAPTPipelinesLimited).
TransactionswithrelatedpartieswithintheConsolidatedEntityDuringthefinancialyear,thefollowingtransactionsoccurredbetweentheTrustanditsotherrelatedparties:
— loansadvancedandpaymentsreceivedonlong-terminter-entityloans;and
— paymentsofdistributions.
AlltransactionsbetweentheentitiesthatcomprisetheConsolidatedEntityhavebeeneliminatedonconsolidation.
RefertoNote12fordetailsoftheentitiesthatcomprisetheConsolidatedEntity.
TransactionswithotherrelatedpartiesAPTITanditscontrolledentitieshaveanumberofloanreceivablebalanceswithanotherentityinAPA.Theseloanshavevariousterms;however,theycanberepayableonagreementoftheparties.Interestisrecognisedbyapplyingtheeffectiveinterestmethod,agreedbetweenthepartiesattheendofeachmonthandisdeterminedbyreferencetomarketrates.
ThefollowingbalancesarisingfromtransactionsbetweenAPTITanditsotherrelatedpartiesareoutstandingatreportingdate:
— currentreceivablestotalling$701,000areowingfromasubsidiaryofAPTforamountsdueunderafinanceleasearrangement(2014:$670,000);
— non-currentreceivablestotalling$9,951,000areowingfromasubsidiaryofAPTforamountsdueunderafinanceleasearrangement(2014:$10,623,000);and
— non-currentreceivablestotalling$876,911,000(2014:$440,633,000)areowingfromasubsidiaryofAPTforamountsdueunderinter-entityloans.
AustralianPipelineLimitedManagementfeesof$820,000(2014:$753,000)werepaidtotheResponsibleEntityasreimbursementofcostsincurredonbehalfofAPTIT.NoamountswerepaiddirectlybyAPTITtotheDirectorsoftheResponsibleEntity.
AustralianPipelineTrustManagementfeesof$820,000(2014:$753,000)werereimbursedbyAPT.
17. Parent entity informationTheaccountingpoliciesoftheparententity,whichhavebeenappliedindeterminingthefinancialinformationbelow,arethesameasthoseappliedintheconsolidatedfinancialstatements. 2015 2014 $000 $000
Financial position
Assets
Currentassets 701 670
Non-currentassets 1,031,517 594,584
Total assets 1,032,218 595,254
Liabilities
Currentliabilities 49 11
Total liabilities 49 11
Net assets 1,032,169 595,243
Equity
Issuedcapital 1,005,086 576,172
Retainedearnings 26,488 19,465
Reserves
Available-for-saleinvestmentrevaluationreserve 595 (394)
Total equity 1,032,169 595,243
Financial performance
Profitfortheyear 46,348 38,706
Othercomprehensiveincome 989 (861)
Total comprehensive income 47,337 37,845
For
per
sona
l use
onl
y

94 APA Group | Annual Report 2015
APT INVESTMENT TRUST AND ITS CONTROLLED ENTITIES
NOTES TO THE CONSOLIDATED FINANCIAL STATEMENTS CONTINUEDFor the financial year ended 30 June 2015
OTHER
17. Parent entity information (continued)
GuaranteesenteredintobytheparententityinrelationtothedebtsofitssubsidiariesNoguaranteeshavebeenenteredintobytheparententityinrelationtothedebtsofitssubsidiaries.
ContingentliabilitiesoftheparententityNocontingentliabilitieshavebeenidentifiedinrelationtotheparententity.
18. Leases 2015 2014 $000 $000
Finance leases
Leasing arrangements – receivables
Financeleasereceivablesrelatetotheleaseofapipelinelateral.
Therearenocontingentrentalpaymentsdue.
Finance lease receivables
Notlongerthan1year 1,167 1,167
Longerthan1yearandnotlongerthan5years 4,669 4,669
Longerthan5years 8,171 9,338
Minimumfutureleasepaymentsreceivablea 14,007 15,174
Grossfinanceleasereceivables 14,007 15,174
Less:unearnedfinanceleasereceivables (3,386) (3,912)
Presentvalueofleasereceivables 10,621 11,262
Includedinthefinancialstatementsaspartof:
Currentreceivables(Note7) 670 639
Non-currentreceivables(Note7) 9,951 10,623
10,621 11,262
a)Minimumfutureleasepaymentsreceivableincludetheaggregateofallleasepaymentsreceivableandanyguaranteedresidual.
Leasesareclassifiedasfinanceleaseswhenthetermsoftheleasetransfersubstantiallyalltherisksandrewardsincidentaltotheownershipoftheleasedassettothelessee.Allotherleasesareclassifiedasoperatingleases.
ConsolidatedEntityaslessorAmountsduefromalesseeunderafinanceleasearerecordedasreceivables.Financeleasereceivablesareinitiallyrecognisedattheamountequaltothepresentvalueoftheminimumleasepaymentsreceivableplusthepresentvalueofanyunguaranteedresidualvalueexpectedtoaccrueattheendoftheleaseterm.Financeleasereceiptsareallocatedbetweeninterestrevenueandreductionoftheleasereceivableoverthetermoftheleaseinordertoreflectaconstantperiodicrateofreturnonthenetinvestmentoutstandinginrespectofthelease.
19. Adoption of new and revised Accounting Standardsa) StandardsandInterpretationsaffectingamountsreportedinthecurrentperiod(and/orpriorperiods)TherehasnotbeenanyneworrevisedStandardsandInterpretationsissuedbytheAASBthatarerelevanttotheconsolidatedentity’soperationsthatwouldbeeffectiveforthecurrentreportingperiod.
b) Standards and Interpretations issued not yet adoptedAtthedateofauthorisationofthefinancialstatements,theStandardsandInterpretationslistedbelowwereonissuebutnotyeteffective.
Effectiveforannualreporting ExpectedtobeinitiallyappliedStandard/Interpretation periodsbeginningonorafter inthefinancialyearending
—AASB9‘FinancialInstruments’,andtherelevantamendingstandards 1January2018 30June2019
—AASB15‘RevenuefromContractswithCustomers’andAASB2014-5‘AmendmentstoAustralianAccountingStandardsarisingfromAASB15’ 1January2017a 30June2018a
a)TheInternationalAccountingStandardsBoardshasdeferredtheimplementationtoperiodscommencingonorafter1January2018.ThisdeferralisexpectedtobeadoptedbytheAASBinduecourse.
ThepotentialimpactoftheinitialapplicationoftheStandardsaboveisyettobedetermined.
20. Events occurring after reporting dateOn26August2015,theDirectorsdeclaredafinaldistributionforthe2015financialyearof2.38centsperunit($26.5million).Thedistributionrepresentsa2.38centspersecurityunfrankedprofitdistributionandnilcentspersecuritycapitaldistribution.Thedistributionwillbepaidon16September2015.
Otherthantheeventsdisclosedabove,therehavenotbeenanyeventsortransactionsthathaveoccurredsubsequenttoyearendthatwouldrequireadjustmenttoordisclosureintheaccounts.
For
per
sona
l use
onl
y

95APA Group | Annual Report 2015
APT INVESTMENT TRUST AND ITS CONTROLLED ENTITIESAPTINVESTMENTTRUSTANDITSCONTROLLEDENTITIES
DECLARATION BY THE DIRECTORS OF AUSTRALIAN PIPELINE LIMITEDForthefinancialyearended30June2015
TheDirectorsdeclarethat:
a) intheDirectors’opinion,therearereasonablegroundstobelievethatAPTInvestmentTrustwillbeabletopayitsdebtsasandwhentheybecomedueandpayable;
b) intheDirectors’opinion,theattachedfinancialstatementsandnotestheretoareinaccordancewiththeCorporations Act 2001,includingcompliancewithAccountingStandardsandgivingatrueandfairviewofthefinancialpositionandperformanceoftheConsolidatedEntity;
c) intheDirectors’opinion,thefinancialstatementsandnotestheretoareinaccordancewithInternationalFinancialReportingStandardsasstatedinNote2tothefinancialstatements;and
d) theDirectorshavebeengiventhedeclarationsbytheManagingDirectorandChiefFinancialOfficerrequiredbysection295AoftheCorporations Act 2001.
SignedinaccordancewitharesolutionoftheDirectorsoftheResponsibleEntitymadepursuanttosection295(5)oftheCorporations Act 2001.
OnbehalfoftheDirectors
LeonardBleaselAM RobertWrightChairman Director
Sydney,26August2015
For
per
sona
l use
onl
y
96 APA Group | Annual Report 2015
APTINVESTMENTTRUSTANDITSCONTROLLEDENTITIES
AUDITOR’S INDEPENDENCE DECLARATIONToAustralianPipelineLimitedasresponsibleentityforAPTInvestmentTrust
Liability limited by a scheme approved under Professional Standards LegislationMember of Deloitte Touche Tohmatsu Limited
28
26 August 2015
Dear Directors
Auditor’s Independence Declaration to Australian Pipeline Limited as responsible entity forAPT Investment Trust
In accordance with section 307C of the Corporations Act 2001 , I am pleased to provide the followingdeclaration of independence to the directors of Australian Pipeline Limited as responsible entity forAPT Investment Trust.
As lead audit partner for the audit of the financial statements of APT Investment Trust for thefinancial year ended 30 June 2015, I declare that to the best of my knowledge and belief, there havebeen no contraventions of:
(i) the auditor independence requirements of the Corporations Act 2001 in relation to theaudit; and
(ii) any applicable code of professional conduct in relation to the audit.
Yours sincerely
DELOITTE TOUCHE TOHMATSU
A V GriffithsPartnerChartered Accountants
Deloitte Touche TohmatsuABN 74 490 121 060
Grosvenor Place225 George StreetSydney NSW 2000PO Box N250 Grosvenor PlaceSydney NSW 1220 Australia
DX: 10307SSETel: +61 (0) 2 9322 7000Fax: +61 (0) 2 9322 7001www.deloitte.com.au
The DirectorsAustralian Pipeline Limited as responsible entity forAPT Investment TrustHSBC BuildingLevel 19, 580 George StreetSydney NSW 2000
For
per
sona
l use
onl
y

97APA Group | Annual Report 2015
APTINVESTMENTTRUSTANDITSCONTROLLEDENTITIES
INDEPENDENT AUDITOR’S REPORTToAustralianPipelineLimitedasresponsibleentityforAPTInvestmentTrust
29
Independent Auditor’s Reportto the Unitholders of APT Investment Trust
We have audited the accompanying financial report of APT Investment Trust, which comprises the statement of financial position as at 30 June 2015, the statement of profit or loss and other comprehensive income, the statement of cash flows and the statement of changes in equity for the year ended on that date, notes comprising a summary of significant accounting policies and other explanatory information, and the directors’ declaration of the consolidated entity, comprising the Trust and the entities it controlled at the year’s end or from time to time during the financial year as set out on pages 82 to 95.
Directors’ Responsibility for the Financial Report
The directors of Australian Pipeline Limited are responsible for the preparation of the financial report that gives a true and fair view in accordance with Australian Accounting Standards and the Corporations Act 2001 and for such internal control as the directors determine is necessary to enable the preparation of the financial report that gives a true and fair view and is free from material misstatement, whether due to fraud or error. In Note 2, the directors also state, in accordance with Accounting Standard AASB 101 Presentation of Financial Statements , that the financial statements comply with International Financial Reporting Standards.
Auditor’s Responsibility
Our responsibility is to express an opinion on the financial report based on our audit. We conducted our audit in accordance with Australian Auditing Standards. Those standards require that we comply with relevant ethical requirements relating to audit engagements and plan and perform the audit to obtain reasonable assurance whether the financial report is free from material misstatement.
An audit involves performing procedures to obtain audit evidence about the amounts and disclosures in the financial report. The procedures selected depend on the auditor’s judgement, including the assessment of the risks of material misstatement of the financial report, whether due to fraud or error. In making those risk assessments, the auditor considers internal control, relevant to the entity’s preparation of the financial report that gives a true and fair view, in order to design audit procedures that are appropriate in the circumstances, but not for the purpose of expressing an opinion on the effectiveness of the entity’s internal control. An audit also includes evaluating the appropriateness of accounting policies used and the reasonableness of accounting estimates made by the directors, as well as evaluating the overall presentation of the financial report.
We believe that the audit evidence we have obtained is sufficient and appropriate to provide a basis for our audit opinion.
Liability limited by a scheme approved under Professional Standards LegislationMember of Deloitte Touche Tohmatsu Limited
Deloitte Touche TohmatsuABN 74 490 121 060
Grosvenor Place225 George StreetSydney NSW 2000PO Box N250 Grosvenor PlaceSydney NSW 1220 Australia
DX: 10307SSETel: +61 (0) 2 9322 7000Fax: +61 (0) 2 9322 7001www.deloitte.com.au
For
per
sona
l use
onl
y
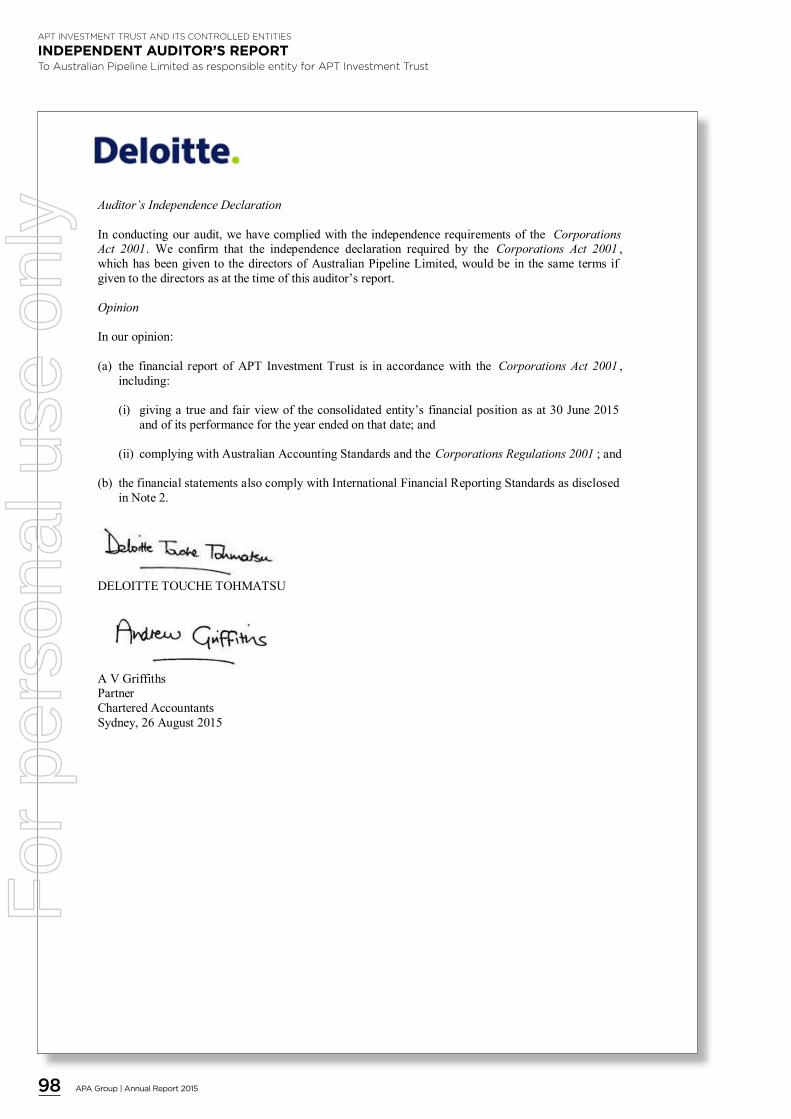
98 APA Group | Annual Report 2015
APTINVESTMENTTRUSTANDITSCONTROLLEDENTITIES
INDEPENDENT AUDITOR’S REPORTToAustralianPipelineLimitedasresponsibleentityforAPTInvestmentTrust
30
Auditor’s Independence Declaration
In conducting our audit, we have complied with the independence requirements of the CorporationsAct 2001. We confirm that the independence declaration required by the Corporations Act 2001 ,which has been given to the directors of Australian Pipeline Limited, would be in the same terms ifgiven to the directors as at the time of this auditor’s report.
Opinion
In our opinion:
(a) the financial report of APT Investment Trust is in accordance with the Corporations Act 2001 ,including:
(i) giving a true and fair view of the consolidated entity’s financial position as at 30 June 2015and of its performance for the year ended on that date; and
(ii) complying with Australian Accounting Standards and the Corporations Regulations 2001 ; and
(b) the financial statements also comply with International Financial Reporting Standards as disclosedin Note 2.
DELOITTE TOUCHE TOHMATSU
A V GriffithsPartnerChartered AccountantsSydney, 26 August 2015
110
Independent Auditor’s Reportto the Unitholders of Australian Pipeline Trust
Report on the Financial Report
We have audited the accompanying financial report of Australian Pipeline Trust, which comprises the statement of financial position as at 30 June 2015, the statement of profit or loss and other comprehensive income, the statement of cash flows and the statement of changes in equity for the year ended on that date, notes comprising a summary of significant accounting policies and other explanatory information, and the directors’ declaration of the consolidated entity, comprising the Trust and the entities it controlled at the year’s end or from time to time during the financial year as set out on pages 36 to 76.
Directors’ Responsibility for the Financial Report
The directors of Australian Pipeline Limited are responsible for the preparation of the financial report that gives a true and fair view in accordance with Australian Accounting Standards and the Corporations Act 2001 and for such internal control as the directors determine is necessary to enable the preparation of the financial report that gives a true and fair view and is free from material misstatement, whether due to fraud or error. In Note 2, the directors also state, in accordance with Accounting Standard AASB 101 Presentation of Financial Statements , that the financial statements comply with International Financial Reporting Standards.
Auditor’s Responsibility
Our responsibility is to express an opinion on the financial report based on our audit. We conducted our audit in accordance with Australian Auditing Standards. Those standards require that we comply with relevant ethical requirements relating to audit engagements and plan and perform the audit to obtain reasonable assurance whether the financial report is free from material misstatement.
An audit involves performing procedures to obtain audit evidence about the amounts and disclosures in the financial report. The procedures selected depend on the auditor’s judgement, including the assessment of the risks of material misstatement of the financial report, whether due to fraud or error. In making those risk assessments, the auditor considers internal control, relevant to the entity’s preparation of the financial report that gives a true and fair view, in order to design audit procedures that are appropriate in the circumstances, but not for the purpose of expressing an opinion on the effectiveness of the entity’s internal control. An audit also includes evaluating the appropriateness of accounting policies used and the reasonableness of accounting estimates made by the directors, as well as evaluating the overall presentation of the financial report.
Liability limited by a scheme approved under Professional Standards LegislationMember of Deloitte Touche Tohmatsu Limited
Deloitte Touche TohmatsuABN 74 490 121 060
Grosvenor Place225 George StreetSydney NSW 2000PO Box N250 Grosvenor PlaceSydney NSW 1220 Australia
DX: 10307SSETel: +61 (0) 2 9322 7000Fax: +61 (0) 2 9322 7001www.deloitte.com.au
For
per
sona
l use
onl
y
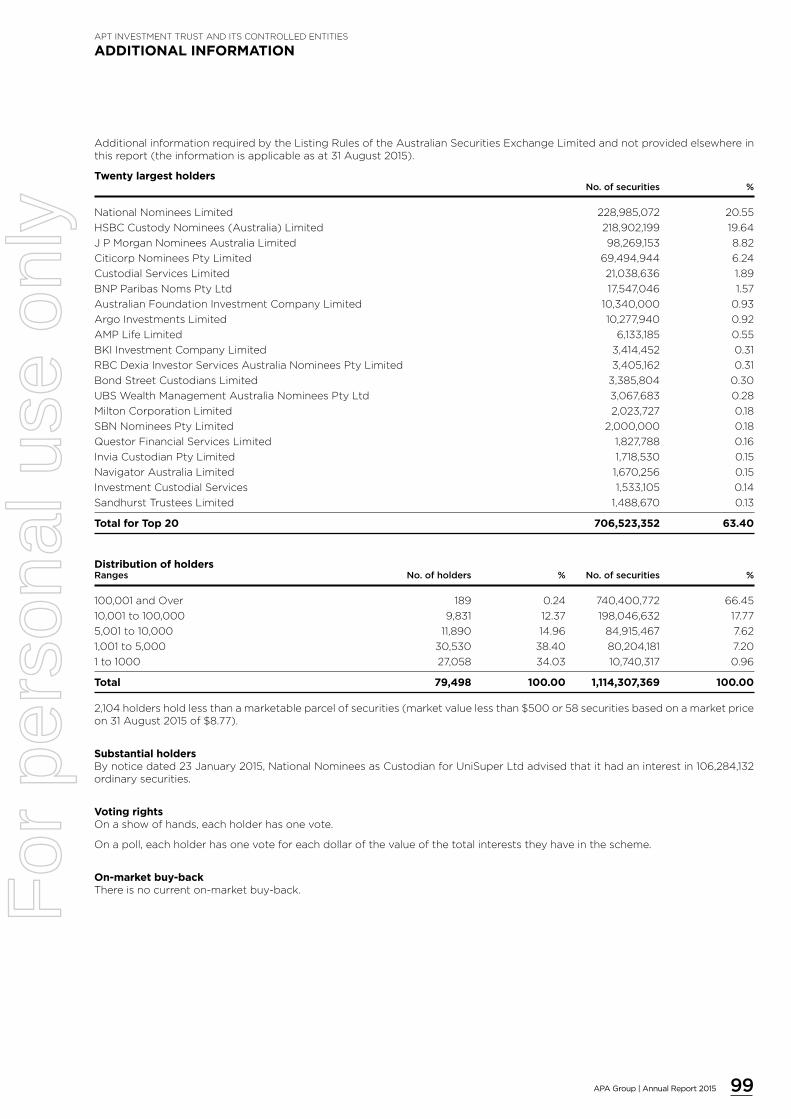
99APA Group | Annual Report 2015
APTINVESTMENTTRUSTANDITSCONTROLLEDENTITIES
ADDITIONAL INFORMATION
AdditionalinformationrequiredbytheListingRulesoftheAustralianSecuritiesExchangeLimitedandnotprovidedelsewhereinthisreport(theinformationisapplicableasat31August2015).
Twenty largest holders No.ofsecurities %
NationalNomineesLimited 228,985,072 20.55
HSBCCustodyNominees(Australia)Limited 218,902,199 19.64
JPMorganNomineesAustraliaLimited 98,269,153 8.82
CiticorpNomineesPtyLimited 69,494,944 6.24
CustodialServicesLimited 21,038,636 1.89
BNPParibasNomsPtyLtd 17,547,046 1.57
AustralianFoundationInvestmentCompanyLimited 10,340,000 0.93
ArgoInvestmentsLimited 10,277,940 0.92
AMPLifeLimited 6,133,185 0.55
BKIInvestmentCompanyLimited 3,414,452 0.31
RBCDexiaInvestorServicesAustraliaNomineesPtyLimited 3,405,162 0.31
BondStreetCustodiansLimited 3,385,804 0.30
UBSWealthManagementAustraliaNomineesPtyLtd 3,067,683 0.28
MiltonCorporationLimited 2,023,727 0.18
SBNNomineesPtyLimited 2,000,000 0.18
QuestorFinancialServicesLimited 1,827,788 0.16
InviaCustodianPtyLimited 1,718,530 0.15
NavigatorAustraliaLimited 1,670,256 0.15
InvestmentCustodialServices 1,533,105 0.14
SandhurstTrusteesLimited 1,488,670 0.13
Total for Top 20 706,523,352 63.40
Distribution of holdersRanges No.ofholders % No.ofsecurities %
100,001andOver 189 0.24 740,400,772 66.45
10,001to100,000 9,831 12.37 198,046,632 17.77
5,001to10,000 11,890 14.96 84,915,467 7.62
1,001to5,000 30,530 38.40 80,204,181 7.20
1to1000 27,058 34.03 10,740,317 0.96
Total 79,498 100.00 1,114,307,369 100.00
2,104holdersholdlessthanamarketableparcelofsecurities(marketvaluelessthan$500or58securitiesbasedonamarketpriceon31August2015of$8.77).
Substantial holdersBynoticedated23January2015,NationalNomineesasCustodianforUniSuperLtdadvisedthatithadaninterestin106,284,132ordinarysecurities.
Voting rightsOnashowofhands,eachholderhasonevote.
Onapoll,eachholderhasonevoteforeachdollarofthevalueofthetotalintereststheyhaveinthescheme.
On-market buy-backThereisnocurrenton-marketbuy-back.F
or p
erso
nal u
se o
nly

100 APA Group | Annual Report 2015
CALENDAR OF EVENTS
FinaldistributionFY2015recorddate 30June2015
FinaldistributionFY2015paymentdate 16September2015
Annualmeeting 22October2015
Interimresultannouncement 24February20161
InterimdistributionFY2016recorddate 31December20151
InterimdistributionFY2016paymentdate 16March20161
1. Subjecttochange.
APTINVESTMENTTRUSTANDITSCONTROLLEDENTITIES
INVESTOR INFORMATION
ANNUAL MEETING DETAILS Date:Thursday,22October2015
Venue:CityRecitalHall,AngelPlace,SydneyNSW
Time:10.30amRegistrationcommencesat10.00am
ASX LISTING AnAPAGroupsecuritycomprisesaunitinAustralianPipelineTrustandaunitinAPTInvestmentTrust.TheseunitsarestapledtogethertoformastapledsecuritywhichislistedontheASX(ASXCode:APA).AustralianPipelineLimitedistheResponsibleEntityofthosetrusts.
APA GROUP RESPONSIBLE ENTITY AND REGISTERED OFFICE AustralianPipelineLimitedACN091344704
Level19,580GeorgeStreet,SydneyNSW2000
POBoxR41,RoyalExchangeNSW1225
Telephone:+61296930000Facsimile: +61296930093Website: apa.com.au
APA GROUP REGISTRY Link Market Services Limited Level12,680GeorgeStreet,SydneyNSW2000
LockedBagA14,SydneySouthNSW1235
Telephone:+611800992312Facsimile: +61292870303Email: [email protected]
Website: linkmarketservices.com.au
SECURITYHOLDER DETAILS
It is important thatSecurityholdersnotify theAPAGroupregistry immediately ifthere isachangetotheiraddressorbankingarrangements.SecurityholderswithenquiriesshouldalsocontacttheAPAGroupregistry.
DISTRIBUTION PAYMENTS
Distributionswillbepaidsemi-annuallyinMarchandSeptember.SecurityholderswillreceiveannualtaxstatementswiththefinaldistributioninSeptember.PaymenttoSecurityholdersresidinginAustraliaandNewZealandwillbemadeonlybydirectcreditintoanAustralianorNewZealandbankaccount.SecrurityholderswithenquiresshouldcontacttheAPAGroupregistry.
ONLINE INTERACTIVE REPORTS
APA Group’s 2015 Annual Report, Annual Review andSustainabilityReportareavailableinaneasytoviewinteractiveformatatapa.com.au.
ONLINE INFORMATION
FurtherinformationonAPAisavailableatapa.com.au,including:
— Results,marketreleasesandnews
— Assetandbusinessinformation
— Corporateresponsibilityandsustainabilityreporting
— SecurityholderinformationsuchasthecurrentAPAsecurityprice,distributionandtaxinformation.
ELECTRONIC COMMUNICATION
SecurityholderscanelecttoreceivecommunicationfromAPAelectronicallybyregisteringtheiremailaddresswiththeAPAGroupregistry.Electingtoreceiveannualreportselectronicallywillreducetheadverseimpactwehaveontheenvironment.
DISCLAIMER:APAGroupcomprisestworegisteredinvestmentschemes,AustralianPipelineTrust(ARSN091678778)andAPTInvestmentTrust(ARSN115585441),thesecuritiesofwhicharestapledtogether.AustralianPipelineLimited(ACN091344704)istheresponsibleentityofAustralianPipelineTrustandAPTInvestmentTrust.PleasenotethatAustralianPipelineLimitedisnotlicensedtoprovidefinancialproductadviceinrelationtosecuritiesinAPAGroup.Thispublicationdoesnotconstitutefinancialproductadviceandhasbeenpreparedwithouttakingintoaccountyourobjectives,financialsituationorparticularneeds.Beforerelyingonanystatementscontainedinthispublication,includingforecastsandprojections,youshouldconsidertheappropriatenessoftheinformation,havingregardtoyourownobjectives,financialsituationsandneedsandconsultaninvestmentadviserifnecessary.Whilstduecareandattentionhavebeenusedinpreparingthispublication,certainforwardlookingstatementsaremadeinthispublicationwhicharenotbasedonhistoricalfactandnecessarilyinvolveassumptionsastofutureeventsandanalysis,whichmayormaynotbecorrect.Theseforwardlookingstatementsshouldnotberelieduponasanindicationorguaranteeoffutureperformance.
For
per
sona
l use
onl
y

Desi
gned
byD
esi
gnD
avey.
com
.au
For
per
sona
l use
onl
y

APA.COM.AU
For
per
sona
l use
onl
y
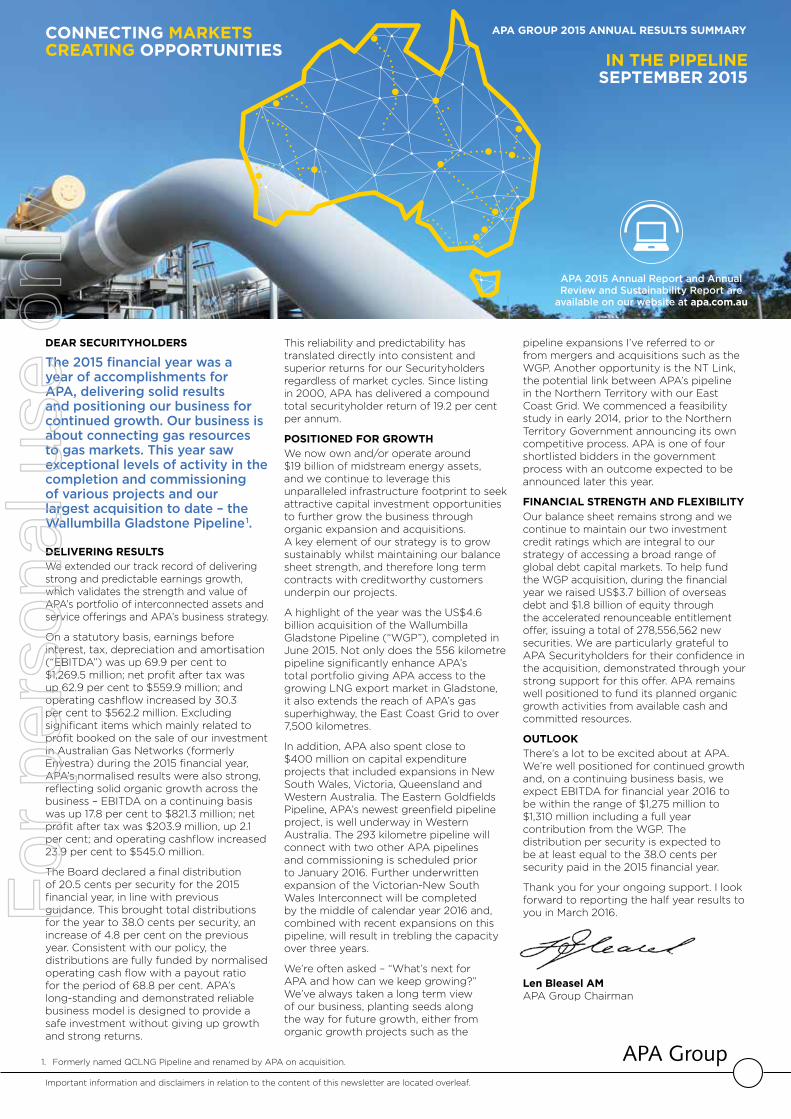
IN THE PIPELINESEPTEMBER 2015
CONNECTING MARKETS CREATING OPPORTUNITIES
DEAR SECURITYHOLDERS
The 2015 financial year was a year of accomplishments for APA, delivering solid results and positioning our business for continued growth. Our business is about connecting gas resources to gas markets. This year saw exceptional levels of activity in the completion and commissioning of various projects and our largest acquisition to date – the Wallumbilla Gladstone Pipeline1.
DELIVERING RESULTSWe extended our track record of delivering strong and predictable earnings growth, which validates the strength and value of APA’s portfolio of interconnected assets and service offerings and APA’s business strategy.
On a statutory basis, earnings before interest, tax, depreciation and amortisation (“EBITDA”) was up 69.9 per cent to $1,269.5 million; net profit after tax was up 62.9 per cent to $559.9 million; and operating cashflow increased by 30.3 per cent to $562.2 million. Excluding significant items which mainly related to profit booked on the sale of our investment in Australian Gas Networks (formerly Envestra) during the 2015 financial year, APA’s normalised results were also strong, reflecting solid organic growth across the business – EBITDA on a continuing basis was up 17.8 per cent to $821.3 million; net profit after tax was $203.9 million, up 2.1 per cent; and operating cashflow increased 23.9 per cent to $545.0 million.
The Board declared a final distribution of 20.5 cents per security for the 2015 financial year, in line with previous guidance. This brought total distributions for the year to 38.0 cents per security, an increase of 4.8 per cent on the previous year. Consistent with our policy, the distributions are fully funded by normalised operating cash flow with a payout ratio for the period of 68.8 per cent. APA’s long-standing and demonstrated reliable business model is designed to provide a safe investment without giving up growth and strong returns.
This reliability and predictability has translated directly into consistent and superior returns for our Securityholders regardless of market cycles. Since listing in 2000, APA has delivered a compound total securityholder return of 19.2 per cent per annum.
POSITIONED FOR GROWTHWe now own and/or operate around $19 billion of midstream energy assets, and we continue to leverage this unparalleled infrastructure footprint to seek attractive capital investment opportunities to further grow the business through organic expansion and acquisitions. A key element of our strategy is to grow sustainably whilst maintaining our balance sheet strength, and therefore long term contracts with creditworthy customers underpin our projects.
A highlight of the year was the US$4.6 billion acquisition of the Wallumbilla Gladstone Pipeline (“WGP”), completed in June 2015. Not only does the 556 kilometre pipeline significantly enhance APA’s total portfolio giving APA access to the growing LNG export market in Gladstone, it also extends the reach of APA’s gas superhighway, the East Coast Grid to over 7,500 kilometres.
In addition, APA also spent close to $400 million on capital expenditure projects that included expansions in New South Wales, Victoria, Queensland and Western Australia. The Eastern Goldfields Pipeline, APA’s newest greenfield pipeline project, is well underway in Western Australia. The 293 kilometre pipeline will connect with two other APA pipelines and commissioning is scheduled prior to January 2016. Further underwritten expansion of the Victorian-New South Wales Interconnect will be completed by the middle of calendar year 2016 and, combined with recent expansions on this pipeline, will result in trebling the capacity over three years.
We’re often asked – “What’s next for APA and how can we keep growing?” We’ve always taken a long term view of our business, planting seeds along the way for future growth, either from organic growth projects such as the
pipeline expansions I’ve referred to or from mergers and acquisitions such as the WGP. Another opportunity is the NT Link, the potential link between APA’s pipeline in the Northern Territory with our East Coast Grid. We commenced a feasibility study in early 2014, prior to the Northern Territory Government announcing its own competitive process. APA is one of four shortlisted bidders in the government process with an outcome expected to be announced later this year.
FINANCIAL STRENGTH AND FLEXIBILITY
Our balance sheet remains strong and we continue to maintain our two investment credit ratings which are integral to our strategy of accessing a broad range of global debt capital markets. To help fund the WGP acquisition, during the financial year we raised US$3.7 billion of overseas debt and $1.8 billion of equity through the accelerated renounceable entitlement offer, issuing a total of 278,556,562 new securities. We are particularly grateful to APA Securityholders for their confidence in the acquisition, demonstrated through your strong support for this offer. APA remains well positioned to fund its planned organic growth activities from available cash and committed resources.
OUTLOOKThere’s a lot to be excited about at APA. We’re well positioned for continued growth and, on a continuing business basis, we expect EBITDA for financial year 2016 to be within the range of $1,275 million to $1,310 million including a full year contribution from the WGP. The distribution per security is expected to be at least equal to the 38.0 cents per security paid in the 2015 financial year.
Thank you for your ongoing support. I look forward to reporting the half year results to you in March 2016.
Len Bleasel AMAPA Group Chairman
APA GROUP 2015 ANNUAL RESULTS SUMMARY
1. Formerly named QCLNG Pipeline and renamed by APA on acquisition.
Important information and disclaimers in relation to the content of this newsletter are located overleaf.
APA 2015 Annual Report and Annual Review and Sustainability Report are
available on our website at apa.com.au
For
per
sona
l use
onl
y
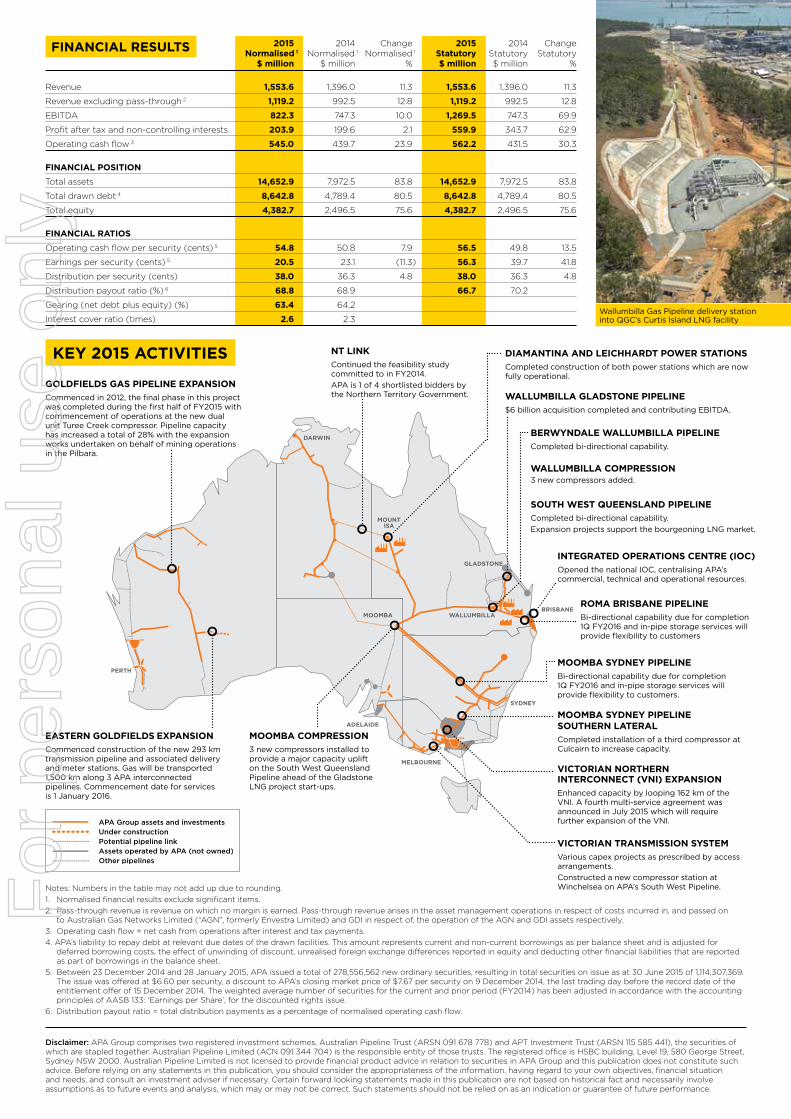
Notes: Numbers in the table may not add up due to rounding.
1. Normalised financial results exclude significant items.
2. Pass-through revenue is revenue on which no margin is earned. Pass-through revenue arises in the asset management operations in respect of costs incurred in, and passed on to Australian Gas Networks Limited (“AGN”, formerly Envestra Limited) and GDI in respect of, the operation of the AGN and GDI assets respectively.
3. Operating cash flow = net cash from operations after interest and tax payments.
4. APA’s liability to repay debt at relevant due dates of the drawn facilities. This amount represents current and non-current borrowings as per balance sheet and is adjusted for deferred borrowing costs, the effect of unwinding of discount, unrealised foreign exchange differences reported in equity and deducting other financial liabilities that are reported as part of borrowings in the balance sheet.
5. Between 23 December 2014 and 28 January 2015, APA issued a total of 278,556,562 new ordinary securities, resulting in total securities on issue as at 30 June 2015 of 1,114,307,369. The issue was offered at $6.60 per security, a discount to APA’s closing market price of $7.67 per security on 9 December 2014, the last trading day before the record date of the entitlement offer of 15 December 2014. The weighted average number of securities for the current and prior period (FY2014) has been adjusted in accordance with the accounting principles of AASB 133: ‘Earnings per Share’, for the discounted rights issue.
6. Distribution payout ratio = total distribution payments as a percentage of normalised operating cash flow.
2015 2014 Change 2015 2014 Change Normalised 1 Normalised 1 Normalised 1 Statutory Statutory Statutory $ million $ million % $ million $ million %
Revenue 1,553.6 1,396.0 11.3 1,553.6 1,396.0 11.3
Revenue excluding pass-through 2 1,119.2 992.5 12.8 1,119.2 992.5 12.8
EBITDA 822.3 747.3 10.0 1,269.5 747.3 69.9
Profit after tax and non-controlling interests 203.9 199.6 2.1 559.9 343.7 62.9
Operating cash flow 3 545.0 439.7 23.9 562.2 431.5 30.3
FINANCIAL POSITION
Total assets 14,652.9 7,972.5 83.8 14,652.9 7,972.5 83.8
Total drawn debt 4 8,642.8 4,789.4 80.5 8,642.8 4,789.4 80.5
Total equity 4,382.7 2,496.5 75.6 4,382.7 2,496.5 75.6
FINANCIAL RATIOS
Operating cash flow per security (cents) 5 54.8 50.8 7.9 56.5 49.8 13.5
Earnings per security (cents) 5 20.5 23.1 (11.3) 56.3 39.7 41.8
Distribution per security (cents) 38.0 36.3 4.8 38.0 36.3 4.8
Distribution payout ratio (%) 6 68.8 68.9 66.7 70.2
Gearing (net debt plus equity) (%) 63.4 64.2
Interest cover ratio (times) 2.6 2.3 Wallumbilla Gas Pipeline delivery station into QGC’s Curtis Island LNG facility
FINANCIAL RESULTS
MOUNTISA
MOOMBA WALLUMBILLA
SYDNEY
ADELAIDE
BRISBANE
MELBOURNE
GLADSTONE
DARWIN
PERTH
KEY 2015 ACTIVITIES NT LINK Continued the feasibility study committed to in FY2014.
APA is 1 of 4 shortlisted bidders by the Northern Territory Government.
APA Group assets and investmentsUnder constructionPotential pipeline linkAssets operated by APA (not owned)Other pipelines
DIAMANTINA AND LEICHHARDT POWER STATIONS
Completed construction of both power stations which are now fully operational.
WALLUMBILLA GLADSTONE PIPELINE
$6 billion acquisition completed and contributing EBITDA.
INTEGRATED OPERATIONS CENTRE (IOC)
Opened the national IOC, centralising APA’s commercial, technical and operational resources.
ROMA BRISBANE PIPELINE
Bi-directional capability due for completion 1Q FY2016 and in-pipe storage services will provide flexibility to customers
MOOMBA COMPRESSION
3 new compressors installed to provide a major capacity uplift on the South West Queensland Pipeline ahead of the Gladstone LNG project start-ups.
EASTERN GOLDFIELDS EXPANSION
Commenced construction of the new 293 km transmission pipeline and associated delivery and meter stations. Gas will be transported 1,500 km along 3 APA interconnected pipelines. Commencement date for services is 1 January 2016.
GOLDFIELDS GAS PIPELINE EXPANSION
Commenced in 2012, the final phase in this project was completed during the first half of FY2015 with commencement of operations at the new dual unit Turee Creek compressor. Pipeline capacity has increased a total of 28% with the expansion works undertaken on behalf of mining operations in the Pilbara.
BERWYNDALE WALLUMBILLA PIPELINE
Completed bi-directional capability.
WALLUMBILLA COMPRESSION 3 new compressors added.
SOUTH WEST QUEENSLAND PIPELINE
Completed bi-directional capability.
Expansion projects support the bourgeoning LNG market.
MOOMBA SYDNEY PIPELINE
Bi-directional capability due for completion 1Q FY2016 and in-pipe storage services will provide flexibility to customers.
MOOMBA SYDNEY PIPELINESOUTHERN LATERAL
Completed installation of a third compressor at Culcairn to increase capacity.
VICTORIAN NORTHERNINTERCONNECT (VNI) EXPANSION
Enhanced capacity by looping 162 km of the VNI. A fourth multi-service agreement was announced in July 2015 which will require further expansion of the VNI.
VICTORIAN TRANSMISSION SYSTEM
Various capex projects as prescribed by access arrangements.
Constructed a new compressor station at Winchelsea on APA’s South West Pipeline.
Disclaimer: APA Group comprises two registered investment schemes, Australian Pipeline Trust (ARSN 091 678 778) and APT Investment Trust (ARSN 115 585 441), the securities of which are stapled together. Australian Pipeline Limited (ACN 091 344 704) is the responsible entity of those trusts. The registered office is HSBC building, Level 19, 580 George Street, Sydney NSW 2000. Australian Pipeline Limited is not licensed to provide financial product advice in relation to securities in APA Group and this publication does not constitute such advice. Before relying on any statements in this publication, you should consider the appropriateness of the information, having regard to your own objectives, financial situation and needs, and consult an investment adviser if necessary. Certain forward looking statements made in this publication are not based on historical fact and necessarily involve assumptions as to future events and analysis, which may or may not be correct. Such statements should not be relied on as an indication or guarantee of future performance.
For
per
sona
l use
onl
y