always delivering an
TRANSCRIPT


2
Always delivering an amazing experience
Fast, easy and to your door

3
Profitability
Drive profitability through
scale and automation
Long term adj. EBITDA margin
target of 5-8% of GMV
Invest for Leadership
Further strengthen our
position across the most
attractive regions
Growth as No. 1
Priority
>40% in short/mid-term
(2017 IPO target)
>30% in the long-term
Build Tech & Product
Leadership
Invest in innovation to build
a third generation on-
demand platform

Q2 2021 Trading Update
Case Studies
2021 Outlook
5
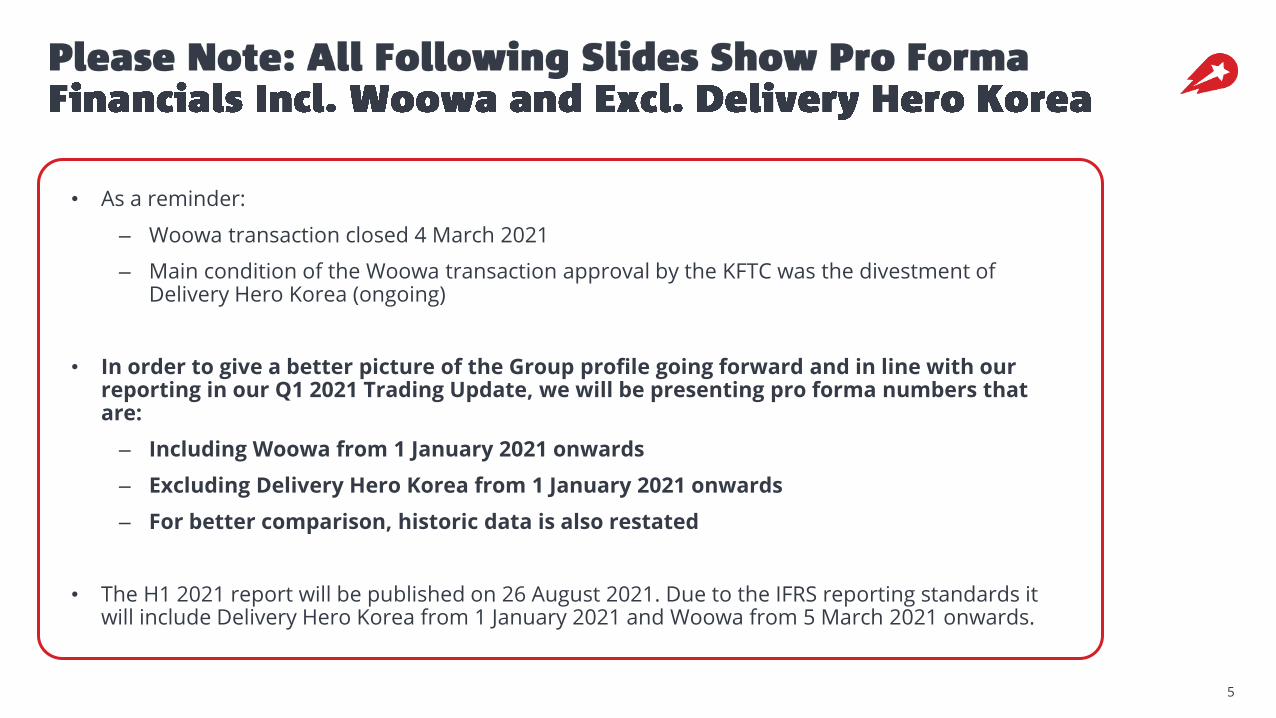
• As a reminder:
‒ Woowa transaction closed 4 March 2021
‒ Main condition of the Woowa transaction approval by the KFTC was the divestment of Delivery Hero Korea (ongoing)
• In order to give a better picture of the Group profile going forward and in line with our reporting in our Q1 2021 Trading Update, we will be presenting pro forma numbers that are:
‒ Including Woowa from 1 January 2021 onwards
‒ Excluding Delivery Hero Korea from 1 January 2021 onwards
‒ For better comparison, historic data is also restated
• The H1 2021 report will be published on 26 August 2021. Due to the IFRS reporting standards it will include Delivery Hero Korea from 1 January 2021 and Woowa from 5 March 2021 onwards.
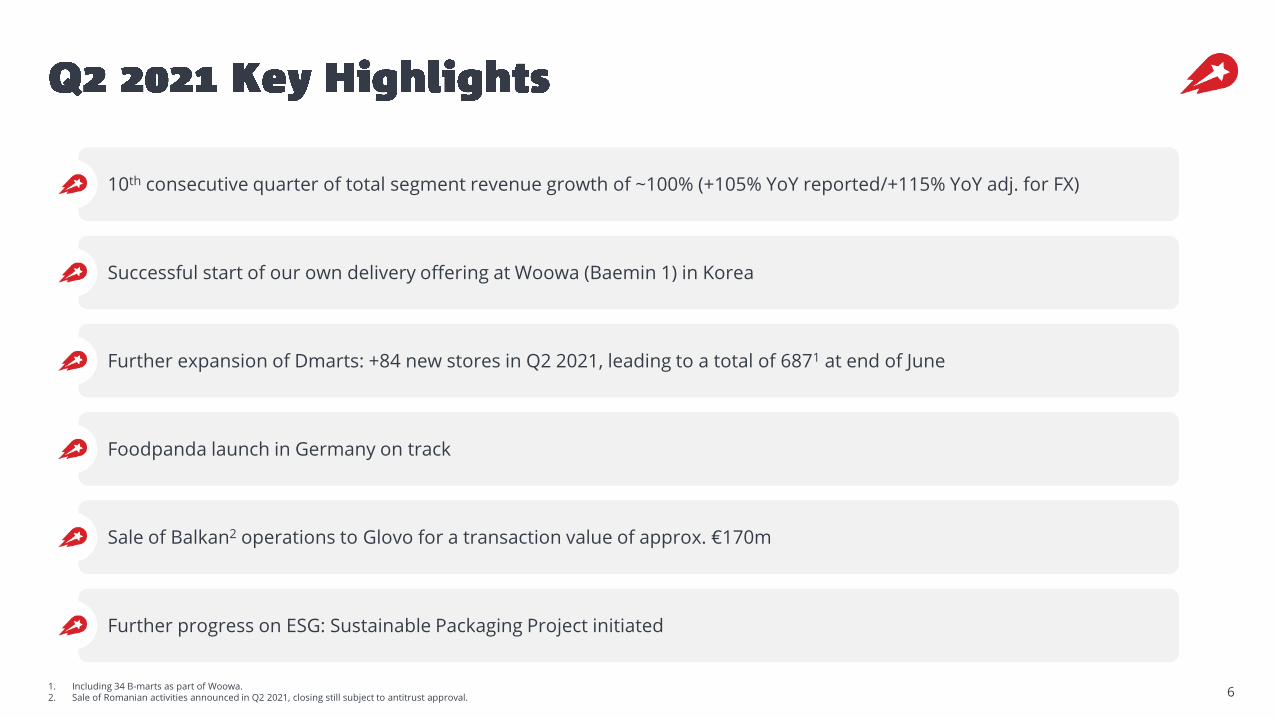
10th consecutive quarter of total segment revenue growth of ~100% (+105% YoY reported/+115% YoY adj. for FX)
Successful start of our own delivery offering at Woowa (Baemin 1) in Korea
Further expansion of Dmarts: +84 new stores in Q2 2021, leading to a total of 6871 at end of June
Foodpanda launch in Germany on track
Sale of Balkan2 operations to Glovo for a transaction value of approx. €170m
Further progress on ESG: Sustainable Packaging Project initiated
61. Including 34 B-marts as part of Woowa.2. Sale of Romanian activities announced in Q2 2021, closing still subject to antitrust approval.
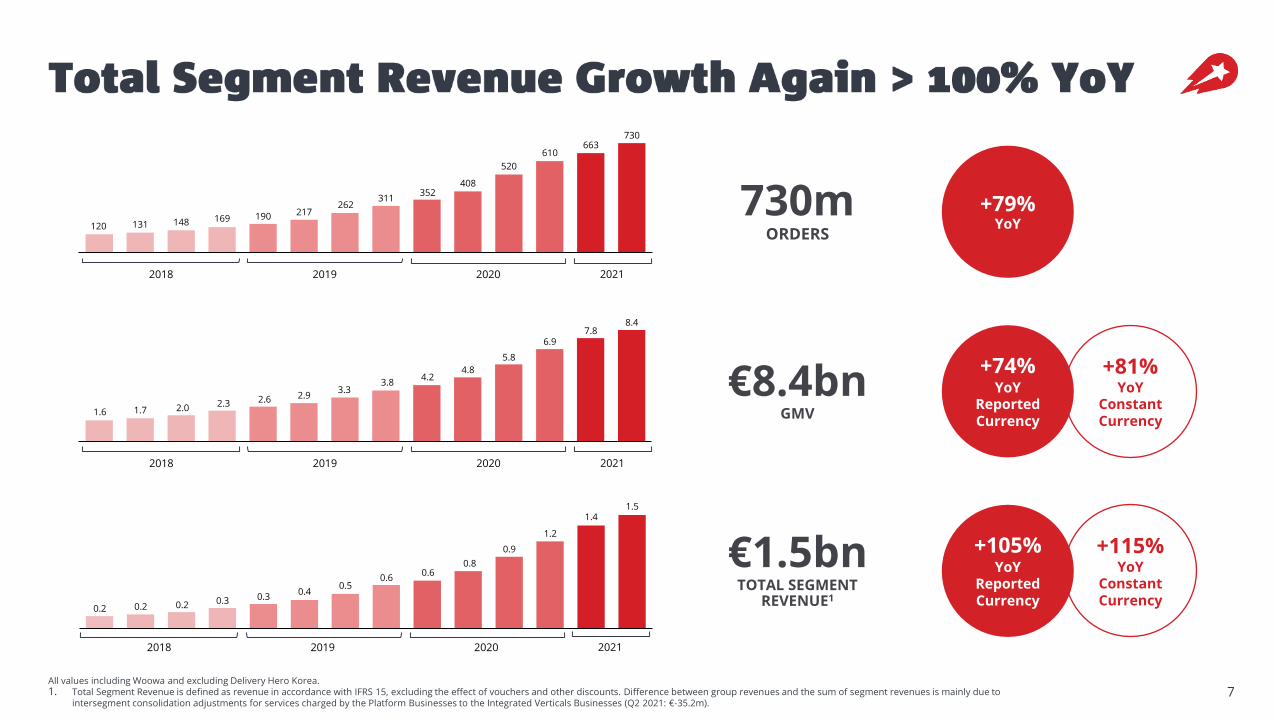
7All values including Woowa and excluding Delivery Hero Korea.1. Total Segment Revenue is defined as revenue in accordance with IFRS 15, excluding the effect of vouchers and other discounts. Difference between group revenues and the sum of segment revenues is mainly due to
intersegment consolidation adjustments for services charged by the Platform Businesses to the Integrated Verticals Businesses (Q2 2021: €-35.2m).
730mORDERS
€8.4bnGMV
€1.5bnTOTAL SEGMENT
REVENUE1
+79%YoY
+74%YoY
Reported Currency
+81% YoY
Constant Currency
+105%YoY
Reported Currency
+115% YoY
Constant Currency
120 131 148 169 190 217262
311352
408
520
610663
730
1 2 3 4 5 6 7 8 9 10 11 12 13 142018 2019 2020 2021
1.6 1.7 2.0 2.3 2.6 2.93.3
3.84.2
4.8
5.8
6.97.8
8.4
0.2 0.2 0.2 0.3 0.30.4
0.50.6
0.60.8
0.9
1.2
1.41.5
2018 2019 2020 2021
2018 2019 2020 2021
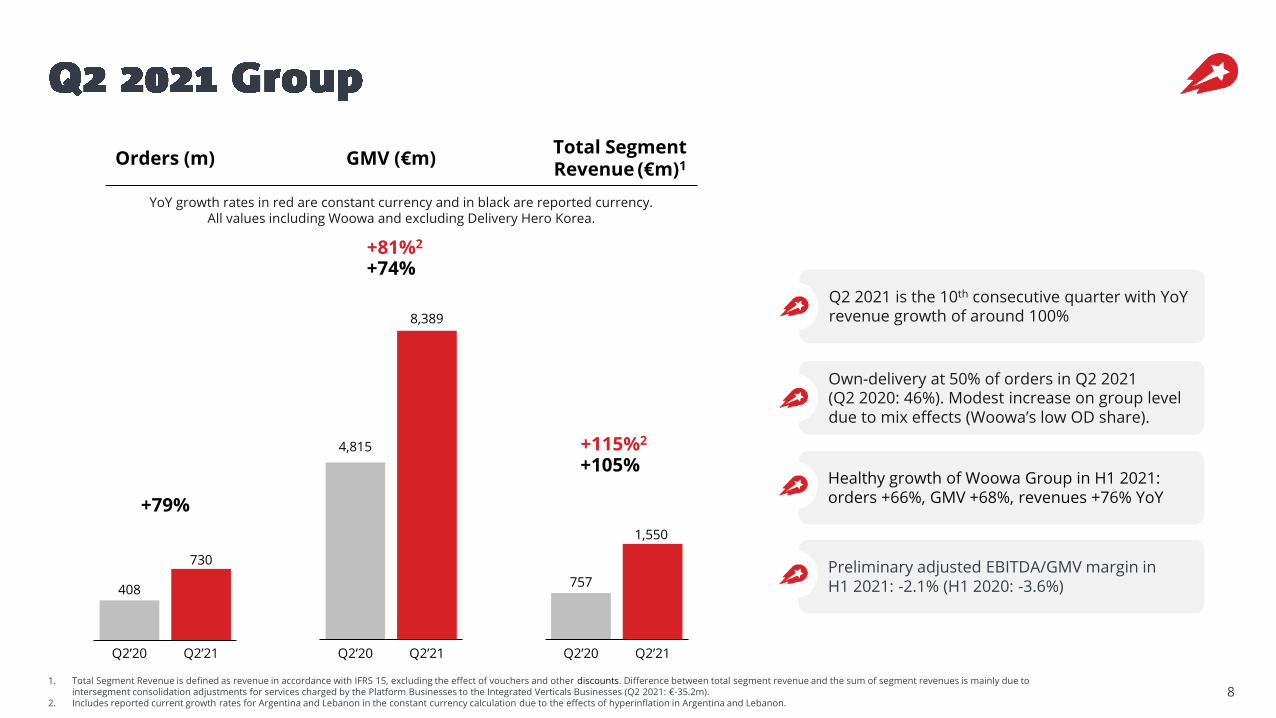
81. Total Segment Revenue is defined as revenue in accordance with IFRS 15, excluding the effect of vouchers and other discounts. Difference between total segment revenue and the sum of segment revenues is mainly due to
intersegment consolidation adjustments for services charged by the Platform Businesses to the Integrated Verticals Businesses (Q2 2021: €-35.2m).2. Includes reported current growth rates for Argentina and Lebanon in the constant currency calculation due to the effects of hyperinflation in Argentina and Lebanon.
Q2 2021 is the 10th consecutive quarter with YoY revenue growth of around 100%
Own-delivery at 50% of orders in Q2 2021 (Q2 2020: 46%). Modest increase on group level due to mix effects (Woowa’s low OD share).
4,815
8,389
408
730
+79%
757
1,550
YoY growth rates in red are constant currency and in black are reported currency.All values including Woowa and excluding Delivery Hero Korea.
Total SegmentRevenue (€m)1Orders (m) GMV (€m)
Q2’21Q2’20Q2’21Q2’20 Q2’21Q2’20
+105%+115%2
Healthy growth of Woowa Group in H1 2021: orders +66%, GMV +68%, revenues +76% YoY
+74%+81%2
Preliminary adjusted EBITDA/GMV margin in H1 2021: -2.1% (H1 2020: -3.6%)
9
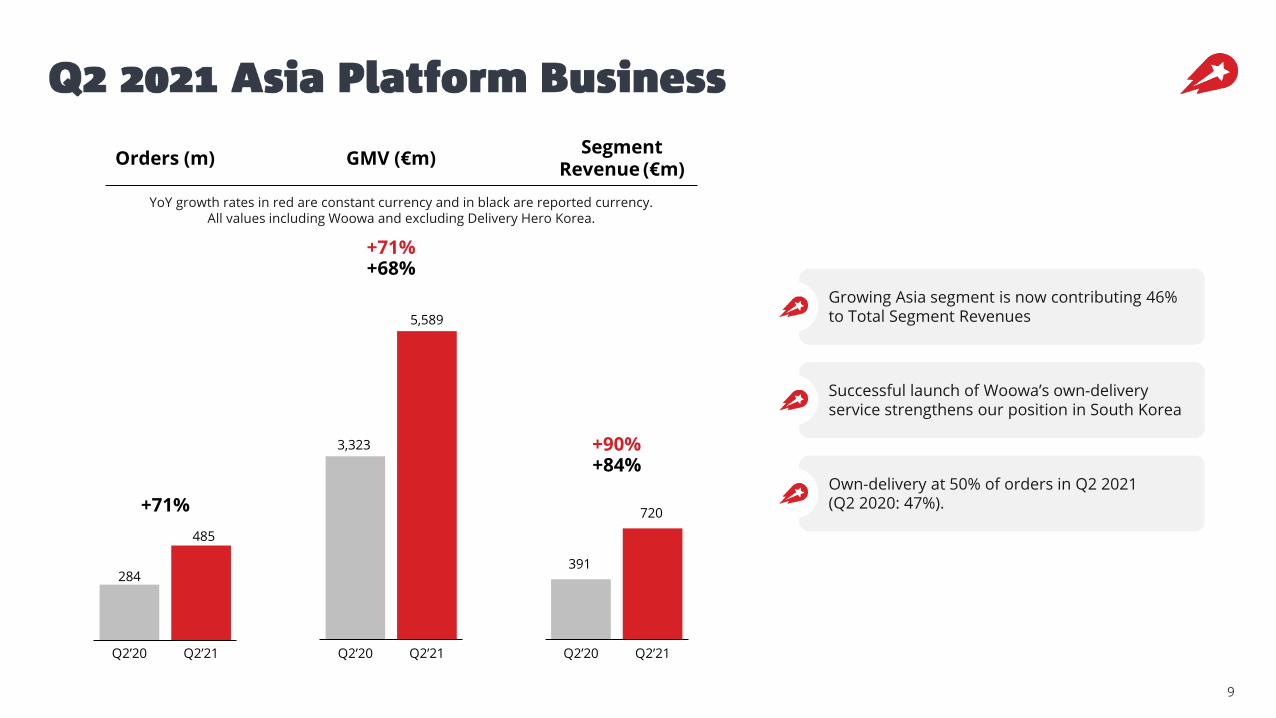
3,323
5,589
+68%
284
485
+71%
391
720
+84%
+71%
+90%
Orders (m) GMV (€m)
Q2’21Q2’20Q2’21Q2’20 Q2’21Q2’20
Growing Asia segment is now contributing 46% to Total Segment Revenues
Successful launch of Woowa’s own-delivery service strengthens our position in South Korea
Own-delivery at 50% of orders in Q2 2021 (Q2 2020: 47%).
YoY growth rates in red are constant currency and in black are reported currency.All values including Woowa and excluding Delivery Hero Korea.
SegmentRevenue (€m)
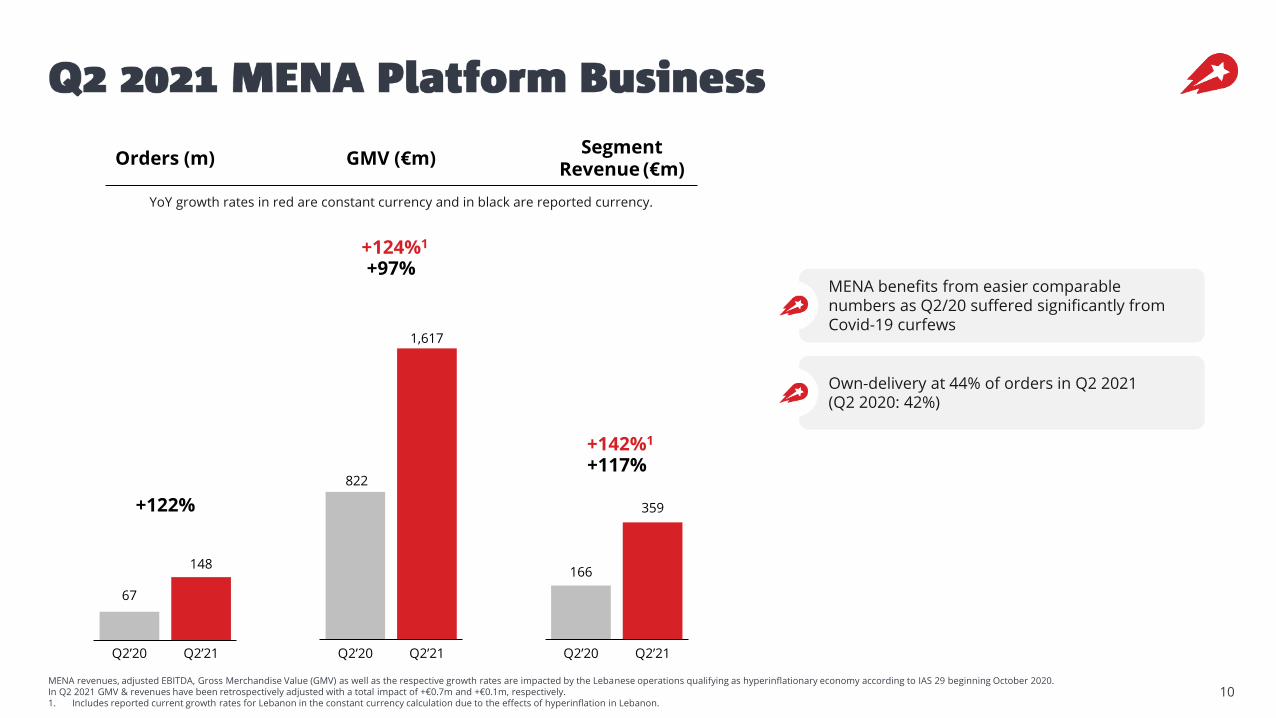
10MENA revenues, adjusted EBITDA, Gross Merchandise Value (GMV) as well as the respective growth rates are impacted by the Lebanese operations qualifying as hyperinflationary economy according to IAS 29 beginning October 2020. In Q2 2021 GMV & revenues have been retrospectively adjusted with a total impact of +€0.7m and +€0.1m, respectively.1. Includes reported current growth rates for Lebanon in the constant currency calculation due to the effects of hyperinflation in Lebanon.
67
148
822
1,617
166
359
SegmentRevenue (€m)
Orders (m) GMV (€m)
+97%+124%1
Q2’21Q2’20Q2’21Q2’20 Q2’21Q2’20
+122%
+117%+142%1
MENA benefits from easier comparable numbers as Q2/20 suffered significantly from Covid-19 curfews
YoY growth rates in red are constant currency and in black are reported currency.
Own-delivery at 44% of orders in Q2 2021(Q2 2020: 42%)
11
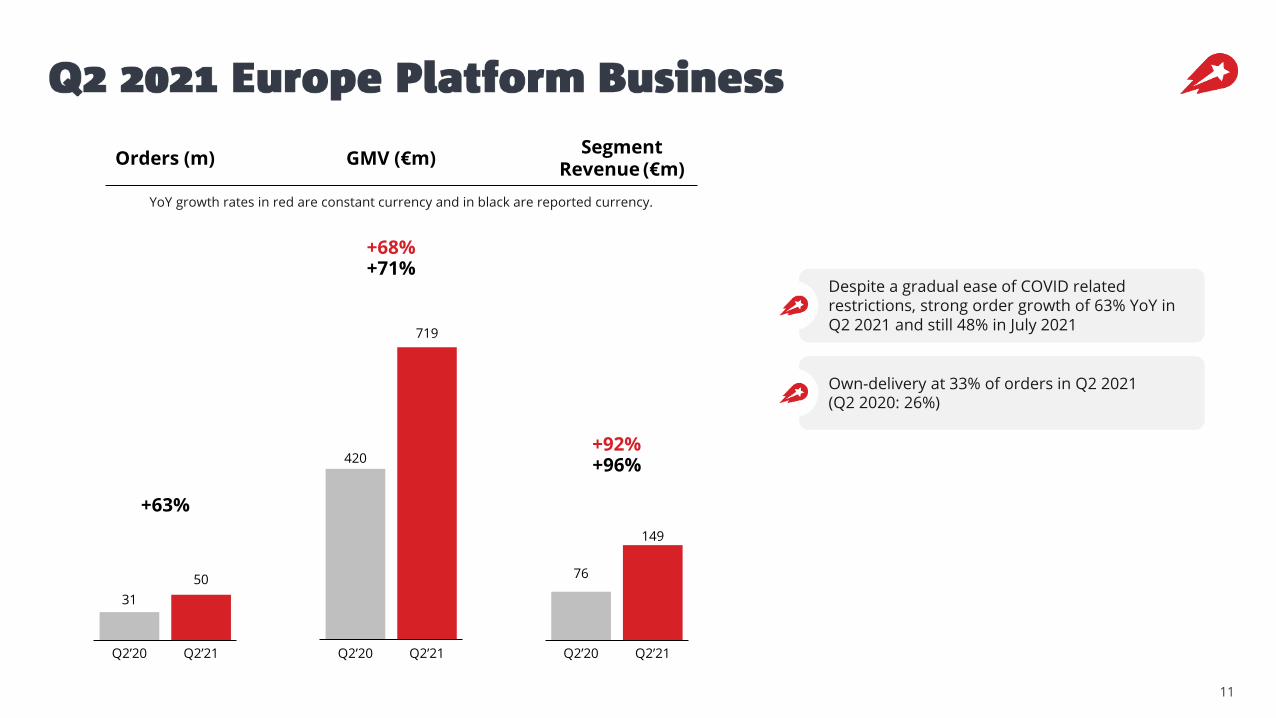
31
50
420
719
76
149
+71%+68%
Q2’21Q2’20Q2’21Q2’20 Q2’21Q2’20
+63%
+96%+92%
Despite a gradual ease of COVID related restrictions, strong order growth of 63% YoY in Q2 2021 and still 48% in July 2021
Own-delivery at 33% of orders in Q2 2021(Q2 2020: 26%)
SegmentRevenue (€m)
Orders (m) GMV (€m)
YoY growth rates in red are constant currency and in black are reported currency.
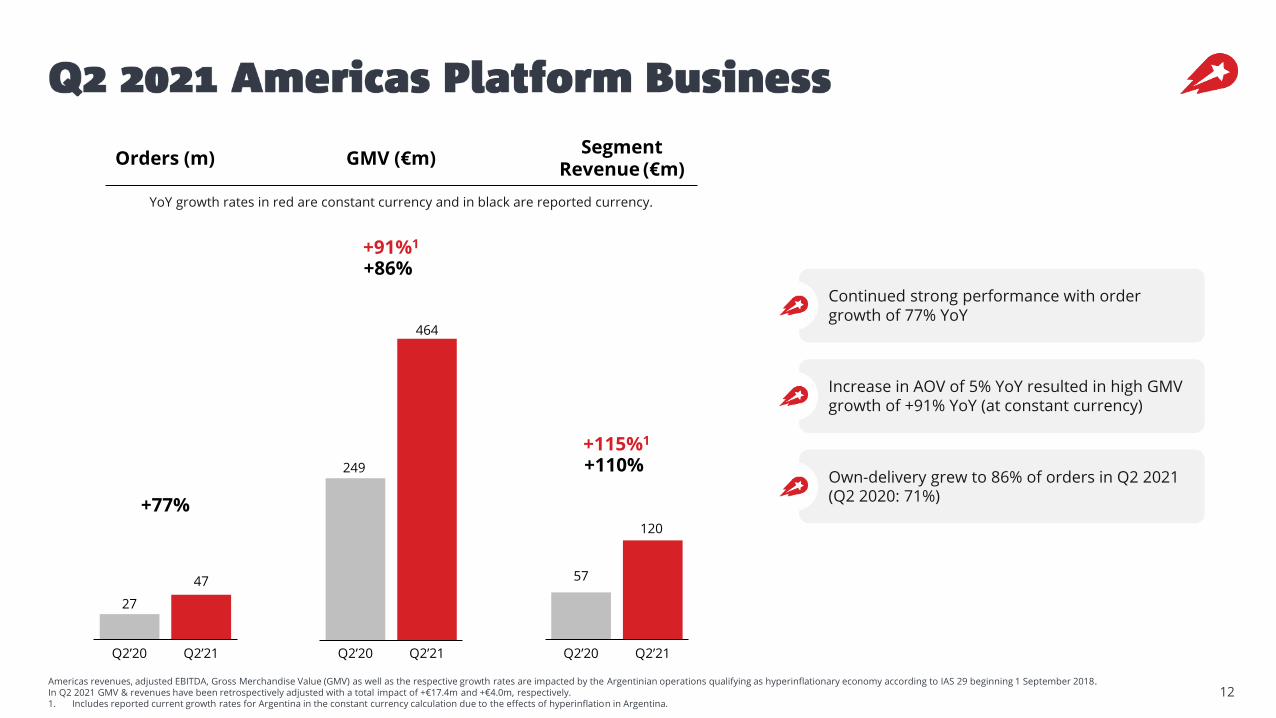
12Americas revenues, adjusted EBITDA, Gross Merchandise Value (GMV) as well as the respective growth rates are impacted by the Argentinian operations qualifying as hyperinflationary economy according to IAS 29 beginning 1 September 2018. In Q2 2021 GMV & revenues have been retrospectively adjusted with a total impact of +€17.4m and +€4.0m, respectively.1. Includes reported current growth rates for Argentina in the constant currency calculation due to the effects of hyperinflation in Argentina.
249
464
27
47 57
120
+86%+91%1
Q2’21Q2’20Q2’21Q2’20 Q2’21Q2’20
+77%
+110%+115%1
Continued strong performance with order growth of 77% YoY
Increase in AOV of 5% YoY resulted in high GMV growth of +91% YoY (at constant currency)
Own-delivery grew to 86% of orders in Q2 2021(Q2 2020: 71%)
SegmentRevenue (€m)
Orders (m) GMV (€m)
YoY growth rates in red are constant currency and in black are reported currency.
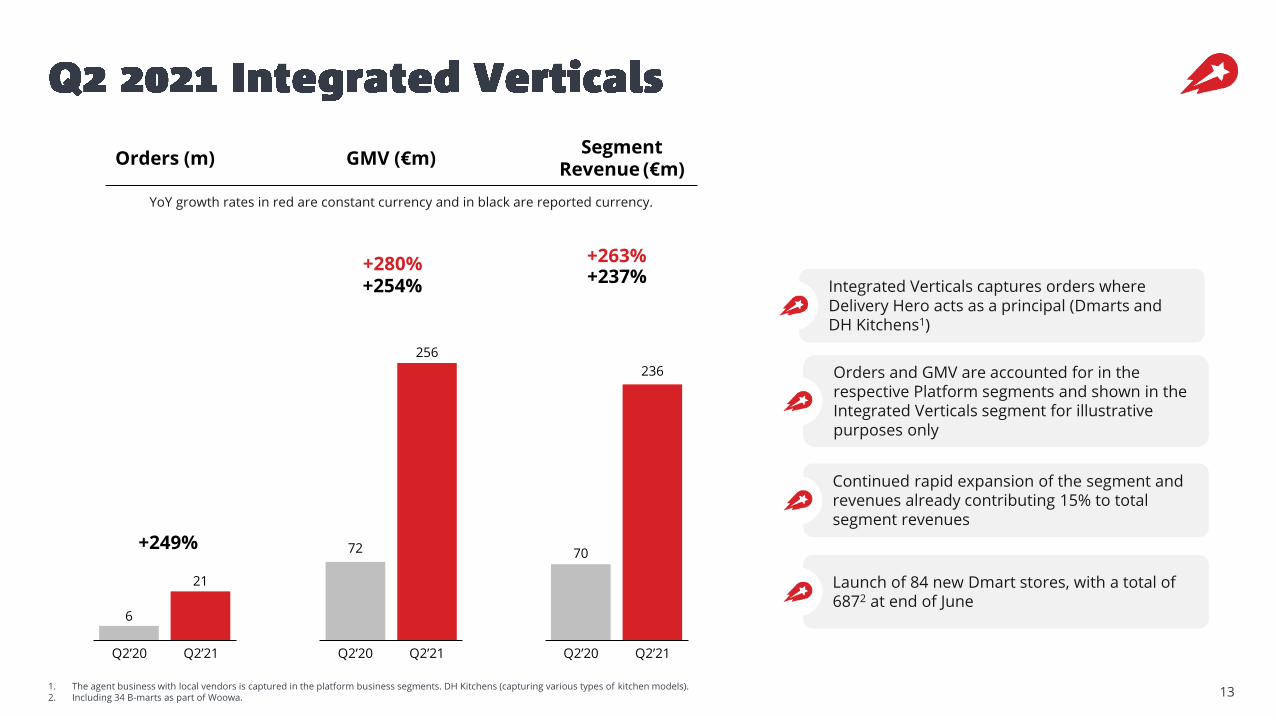
131. The agent business with local vendors is captured in the platform business segments. DH Kitchens (capturing various types of kitchen models).2. Including 34 B-marts as part of Woowa.
Integrated Verticals captures orders where Delivery Hero acts as a principal (Dmarts and DH Kitchens1)
Continued rapid expansion of the segment and revenues already contributing 15% to total segment revenues
Launch of 84 new Dmart stores, with a total of 6872 at end of June
Orders and GMV are accounted for in the respective Platform segments and shown in the Integrated Verticals segment for illustrative purposes only
6
21
70
236
72
256
Q2’21Q2’20Q2’21Q2’20 Q2’21Q2’20
+254%+280%
+249%
+237%+263%
SegmentRevenue (€m)
Orders (m) GMV (€m)
YoY growth rates in red are constant currency and in black are reported currency.
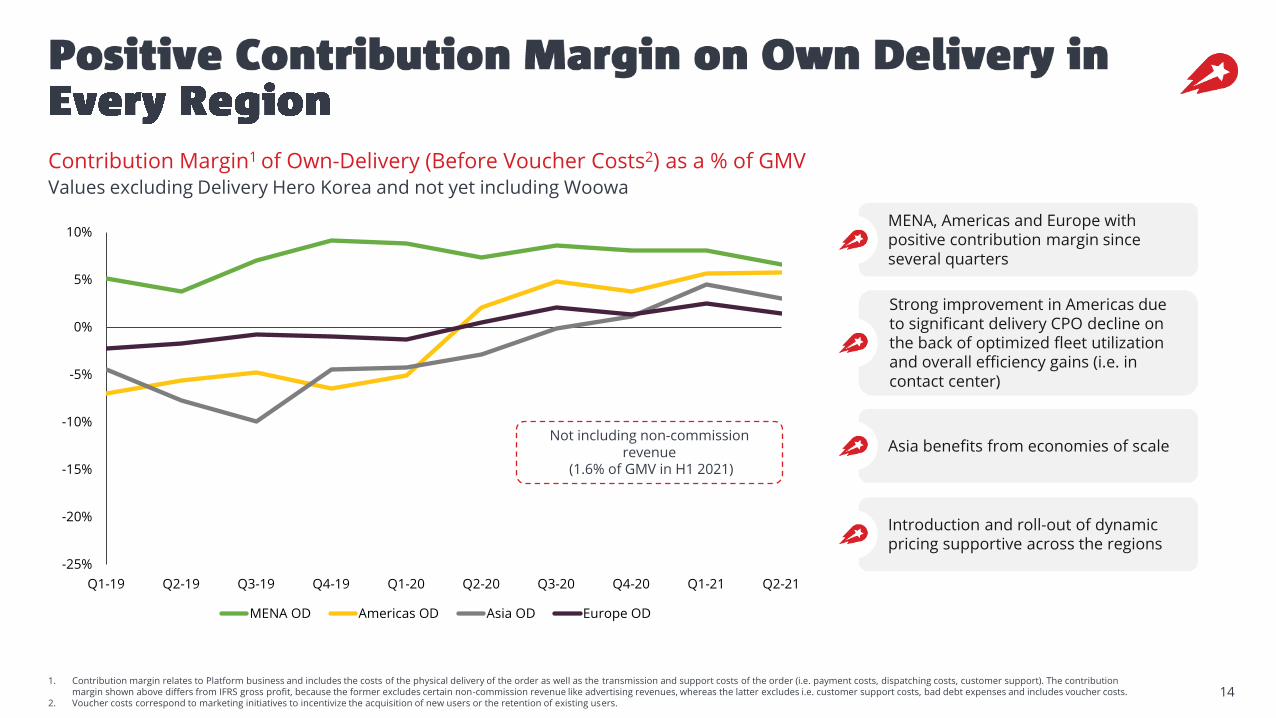
141. Contribution margin relates to Platform business and includes the costs of the physical delivery of the order as well as the transmission and support costs of the order (i.e. payment costs, dispatching costs, customer support). The contribution
margin shown above differs from IFRS gross profit, because the former excludes certain non-commission revenue like advertising revenues, whereas the latter excludes i.e. customer support costs, bad debt expenses and includes voucher costs.2. Voucher costs correspond to marketing initiatives to incentivize the acquisition of new users or the retention of existing users.
Contribution Margin1 of Own-Delivery (Before Voucher Costs2) as a % of GMVValues excluding Delivery Hero Korea and not yet including Woowa
-25%
-20%
-15%
-10%
-5%
0%
5%
10%
Q1-19 Q2-19 Q3-19 Q4-19 Q1-20 Q2-20 Q3-20 Q4-20 Q1-21 Q2-21
MENA OD Americas OD Asia OD Europe OD
Strong improvement in Americas due to significant delivery CPO decline on the back of optimized fleet utilization and overall efficiency gains (i.e. in contact center)
MENA, Americas and Europe with positive contribution margin since several quarters
Asia benefits from economies of scale
Introduction and roll-out of dynamic pricing supportive across the regions
Not including non-commission revenue
(1.6% of GMV in H1 2021)
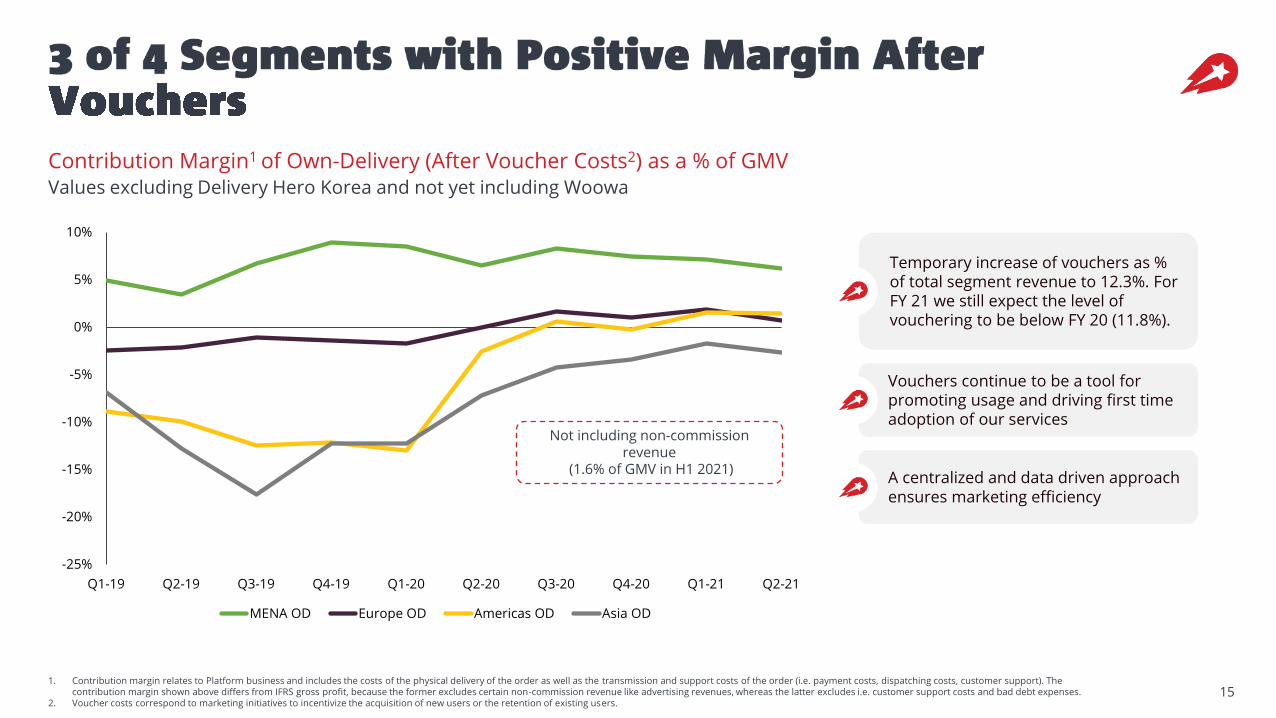
151. Contribution margin relates to Platform business and includes the costs of the physical delivery of the order as well as the transmission and support costs of the order (i.e. payment costs, dispatching costs, customer support). The
contribution margin shown above differs from IFRS gross profit, because the former excludes certain non-commission revenue like advertising revenues, whereas the latter excludes i.e. customer support costs and bad debt expenses.2. Voucher costs correspond to marketing initiatives to incentivize the acquisition of new users or the retention of existing users.
-25%
-20%
-15%
-10%
-5%
0%
5%
10%
Q1-19 Q2-19 Q3-19 Q4-19 Q1-20 Q2-20 Q3-20 Q4-20 Q1-21 Q2-21
MENA OD Europe OD Americas OD Asia OD
Contribution Margin1 of Own-Delivery (After Voucher Costs2) as a % of GMVValues excluding Delivery Hero Korea and not yet including Woowa
Temporary increase of vouchers as % of total segment revenue to 12.3%. For FY 21 we still expect the level of vouchering to be below FY 20 (11.8%).
Vouchers continue to be a tool for promoting usage and driving first time adoption of our services
A centralized and data driven approach ensures marketing efficiency
Not including non-commission revenue
(1.6% of GMV in H1 2021)
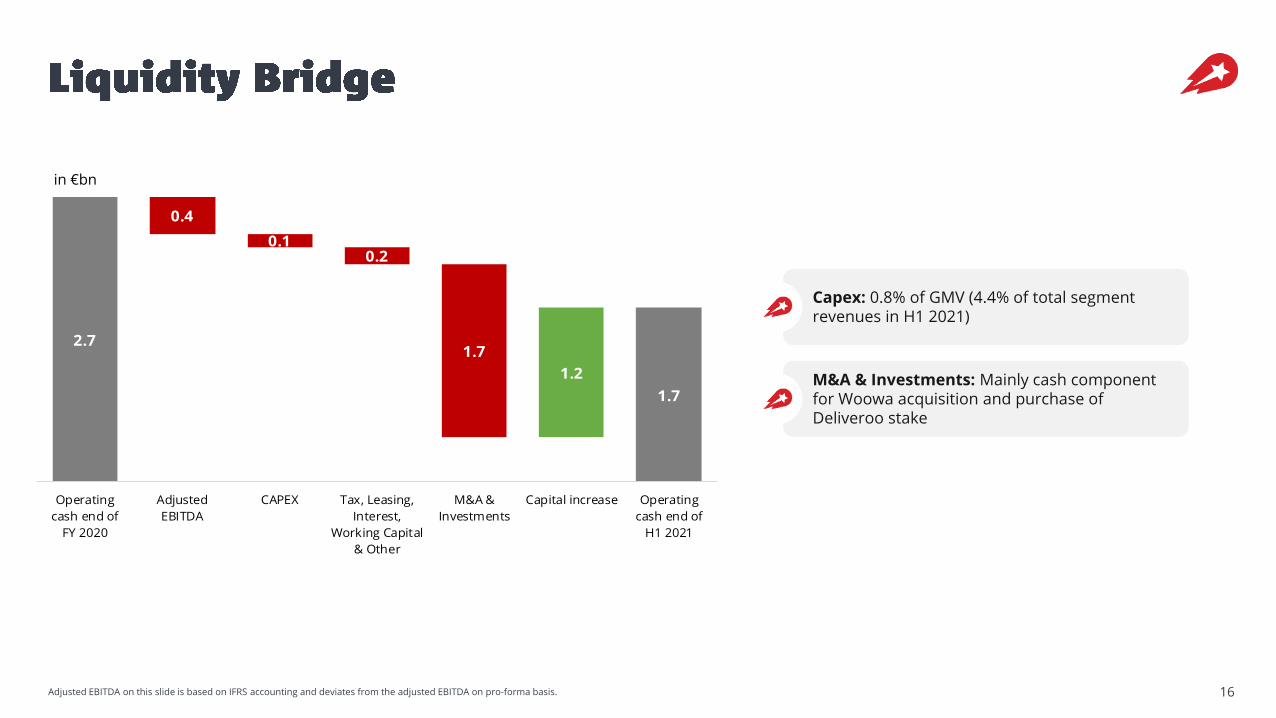
16Adjusted EBITDA on this slide is based on IFRS accounting and deviates from the adjusted EBITDA on pro-forma basis.
Capex: 0.8% of GMV (4.4% of total segment revenues in H1 2021)
M&A & Investments: Mainly cash component for Woowa acquisition and purchase of Deliveroo stake
2.7
0.4
0.10.2
1.7
1.2
1.7
Operating
cash end of
FY 2020
Adjusted
EBITDA
CAPEX Tax, Leasing,
Interest,
Working Capital
& Other
M&A &
Investments
Capital increase Operating
cash end of
H1 2021
in €bn
17
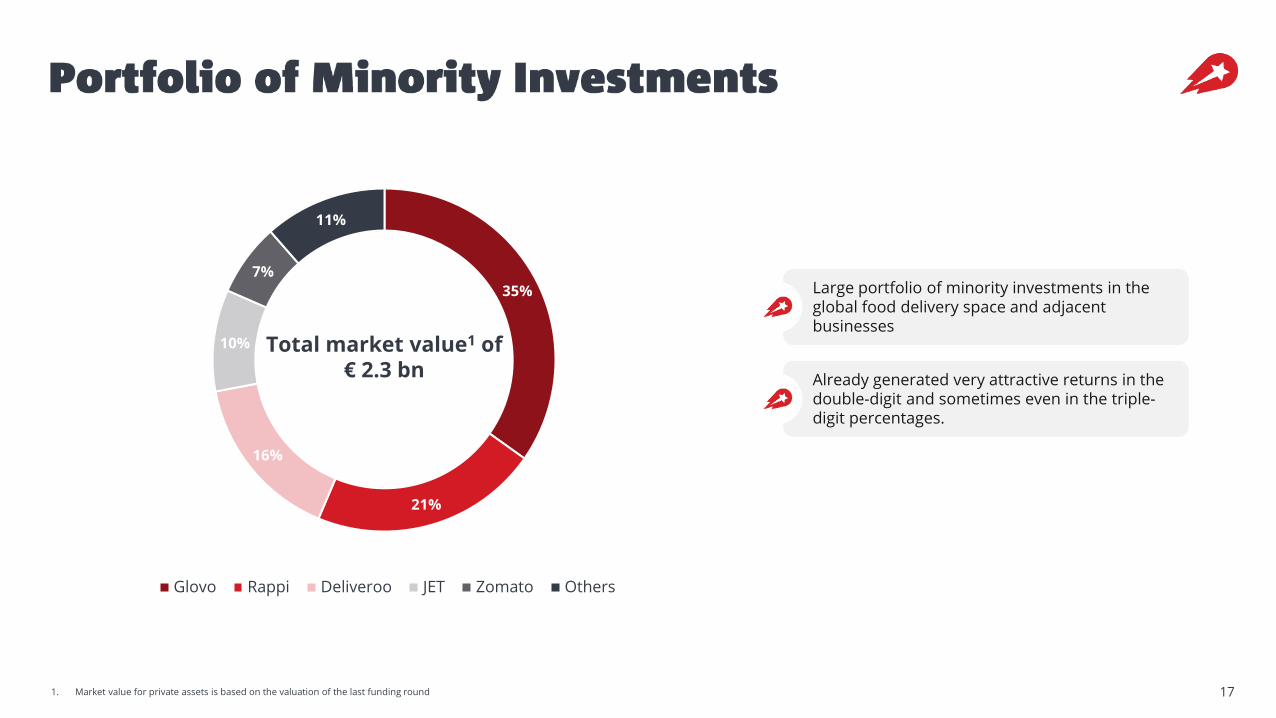
Large portfolio of minority investments in the global food delivery space and adjacent businesses
Already generated very attractive returns in thedouble-digit and sometimes even in the triple-digit percentages.
35%
21%
16%
10%
7%
11%
Glovo Rappi Deliveroo JET Zomato Others
Total market value1 of € 2.3 bn
1. Market value for private assets is based on the valuation of the last funding round
Q2 2021 Trading Update
Case Studies
2021 Outlook
19
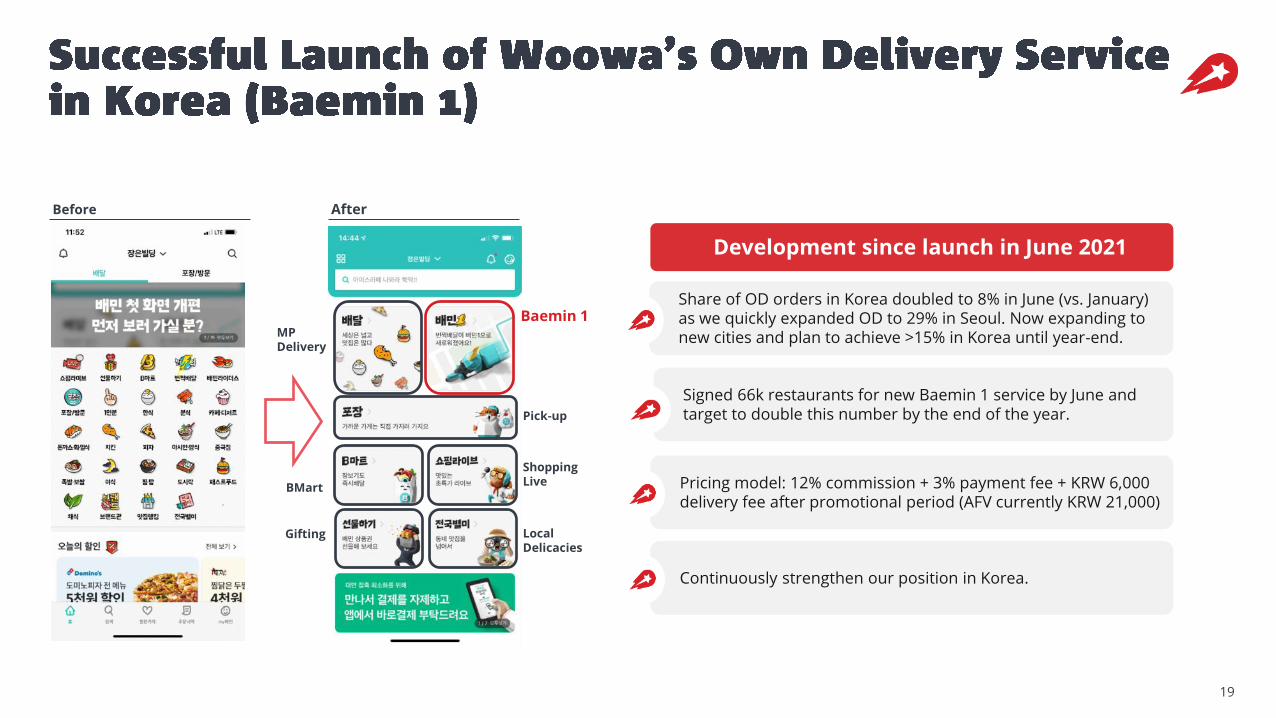
Development since launch in June 2021
Share of OD orders in Korea doubled to 8% in June (vs. January) as we quickly expanded OD to 29% in Seoul. Now expanding to new cities and plan to achieve >15% in Korea until year-end.
Signed 66k restaurants for new Baemin 1 service by June and target to double this number by the end of the year.
Pricing model: 12% commission + 3% payment fee + KRW 6,000 delivery fee after promotional period (AFV currently KRW 21,000)
Continuously strengthen our position in Korea.
MPDelivery
Baemin 1
Pick-up
BMart
Local Delicacies
Gifting
Before After
Shopping Live
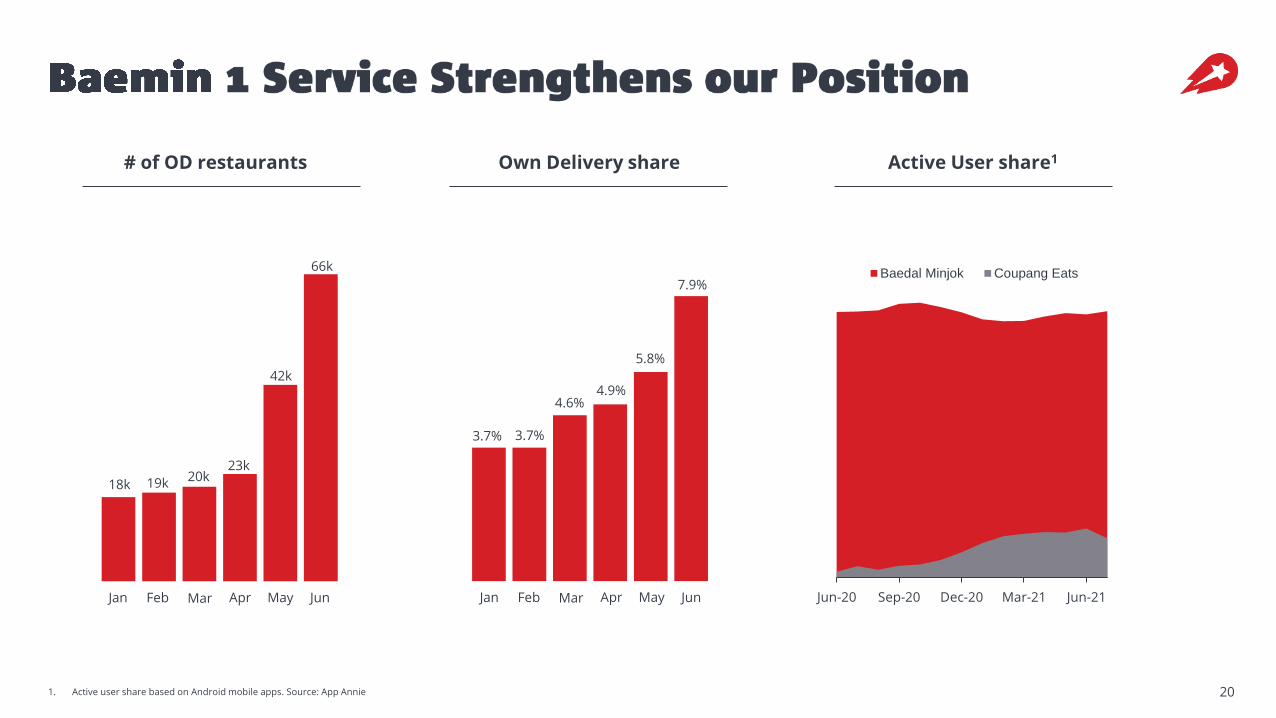
201. Active user share based on Android mobile apps. Source: App Annie
# of OD restaurants Own Delivery share
Mar Apr May Jun
5.8%
7.9%
FebJan
3.7% 3.7%
4.6%4.9%
18k 19k 20k23k
42k
66k
Jun-20 Sep-20 Dec-20 Mar-21 Jun-21
Baedal Minjok Coupang Eats
Active User share1
Mar Apr May JunFebJan
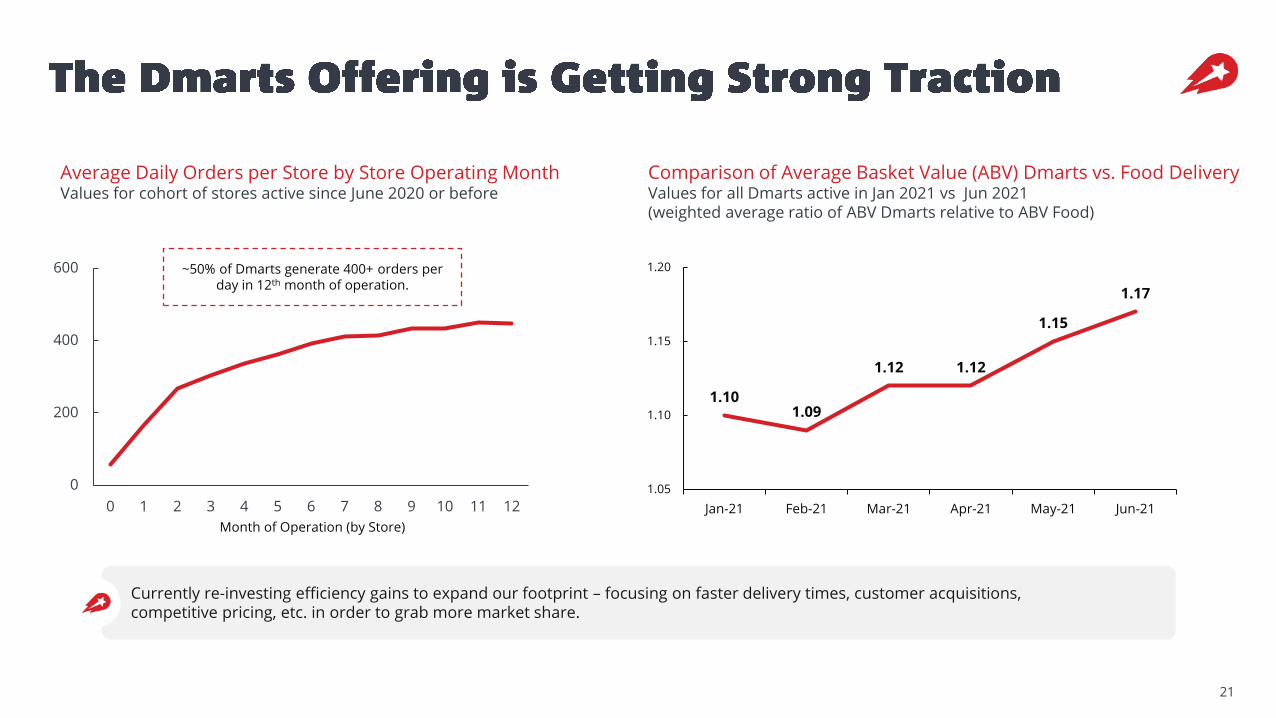
Average Daily Orders per Store by Store Operating MonthValues for cohort of stores active since June 2020 or before
Comparison of Average Basket Value (ABV) Dmarts vs. Food DeliveryValues for all Dmarts active in Jan 2021 vs Jun 2021 (weighted average ratio of ABV Dmarts relative to ABV Food)
0
200
400
600
0 1 2 3 4 5 6 7 8 9 10 11 12
Month of Operation (by Store)
1.101.09
1.12 1.12
1.15
1.17
1.05
1.10
1.15
1.20
Jan-21 Feb-21 Mar-21 Apr-21 May-21 Jun-21
~50% of Dmarts generate 400+ orders per day in 12th month of operation.
21
Currently re-investing efficiency gains to expand our footprint – focusing on faster delivery times, customer acquisitions, competitive pricing, etc. in order to grab more market share.
Q2 2021 Trading Update
Case Studies
2021 Outlook
23
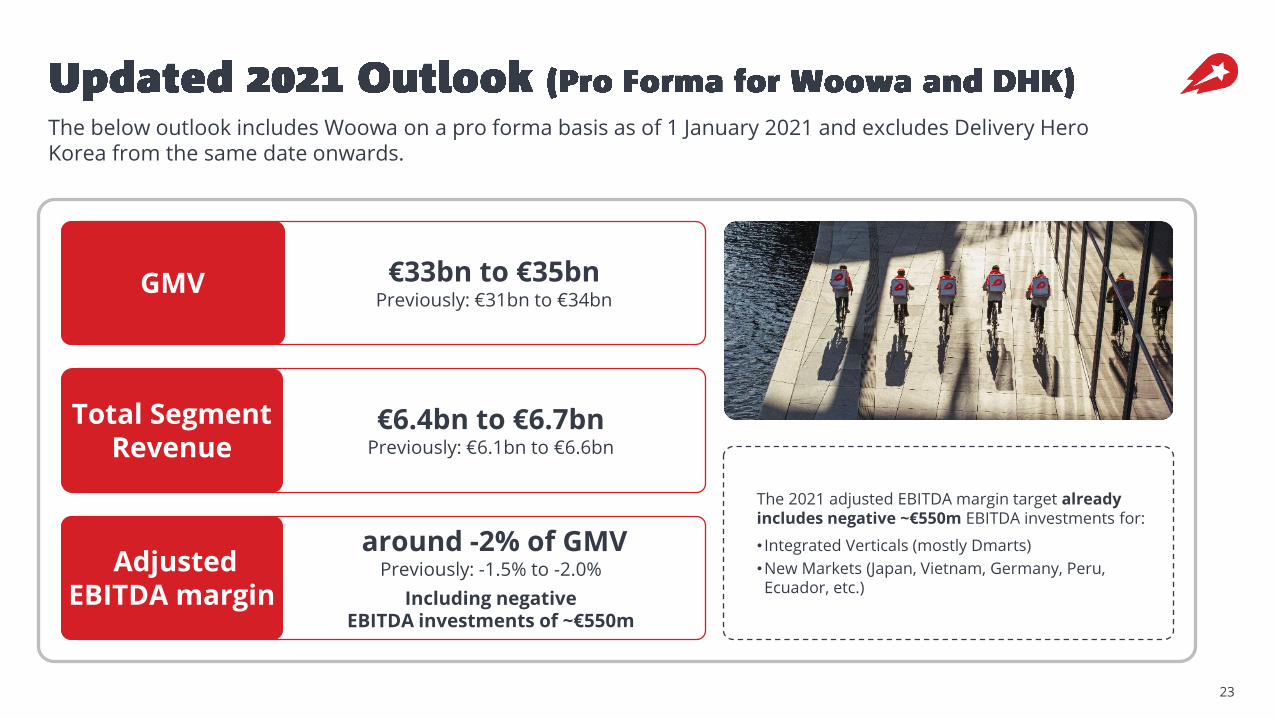
€33bn to €35bnPreviously: €31bn to €34bn
GMV
€6.4bn to €6.7bnPreviously: €6.1bn to €6.6bn
Total Segment Revenue
Adjusted EBITDA margin
around -2% of GMVPreviously: -1.5% to -2.0%
Including negative EBITDA investments of ~€550m
The 2021 adjusted EBITDA margin target already includes negative ~€550m EBITDA investments for:
• Integrated Verticals (mostly Dmarts)
•New Markets (Japan, Vietnam, Germany, Peru, Ecuador, etc.)
The below outlook includes Woowa on a pro forma basis as of 1 January 2021 and excludes Delivery Hero Korea from the same date onwards.

Appendix
25
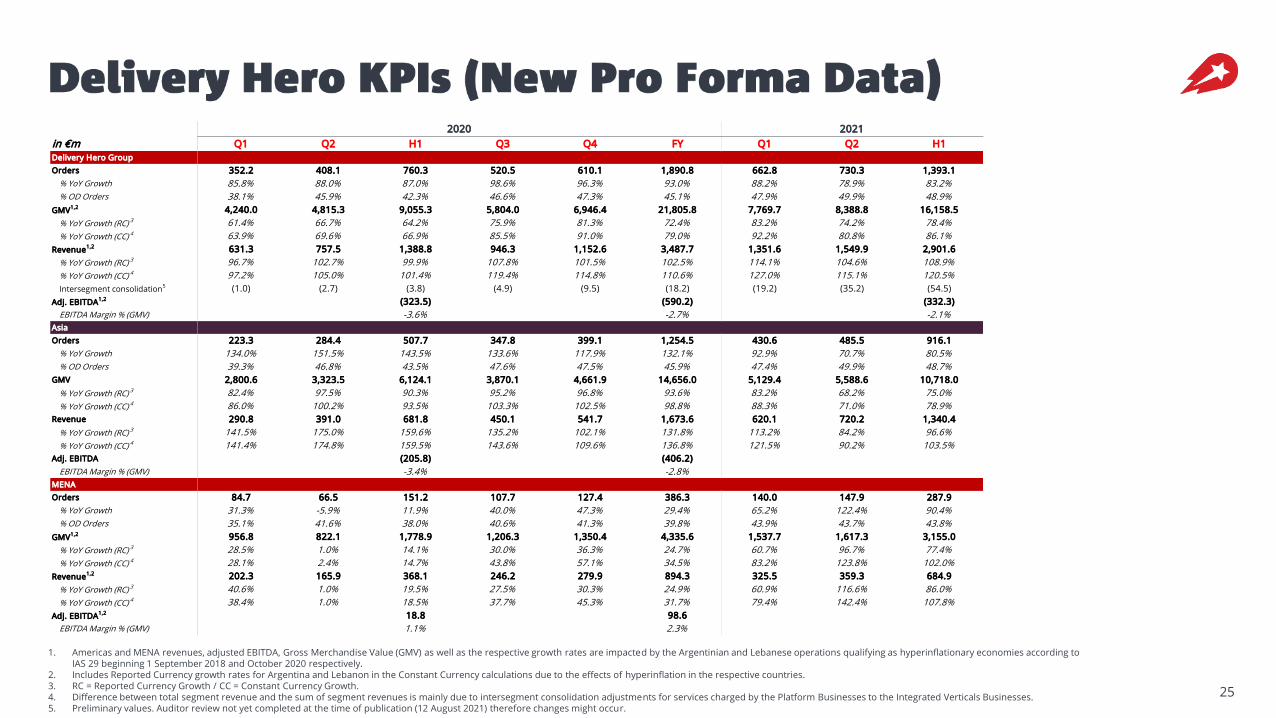
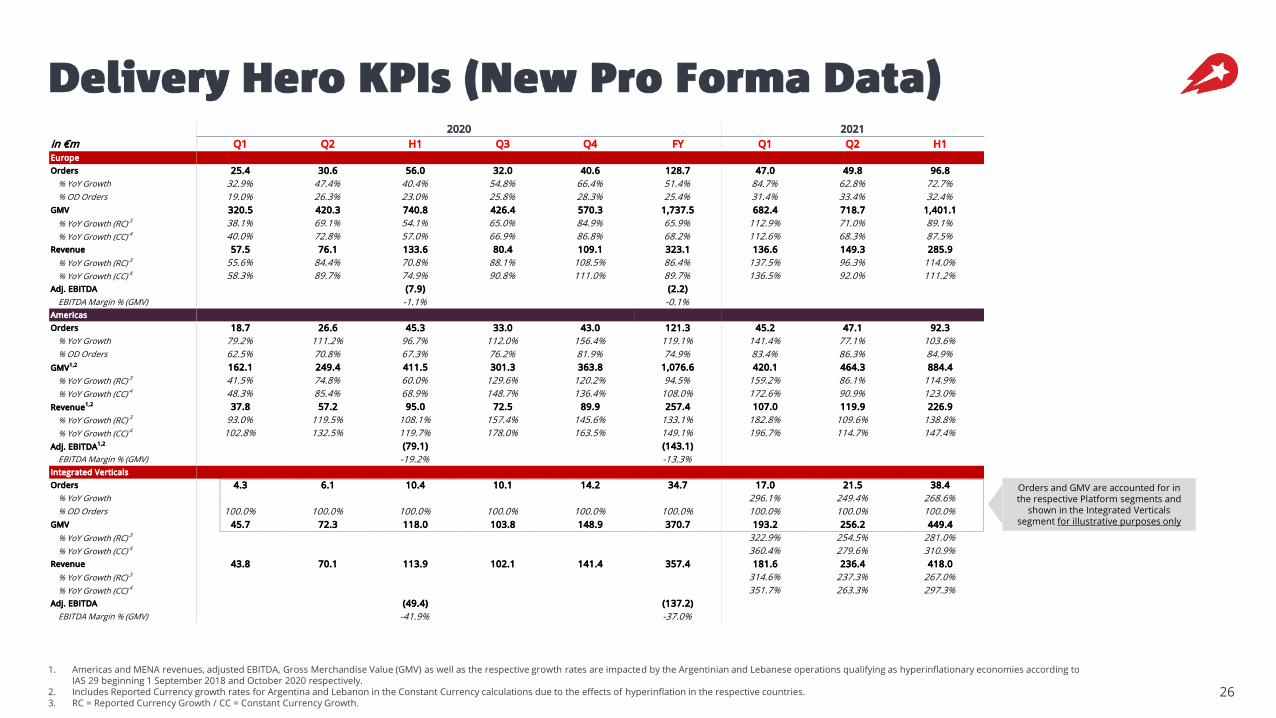
1. Americas and MENA revenues, adjusted EBITDA, Gross Merchandise Value (GMV) as well as the respective growth rates are impacted by the Argentinian and Lebanese operations qualifying as hyperinflationary economies according to IAS 29 beginning 1 September 2018 and October 2020 respectively.
2. Includes Reported Currency growth rates for Argentina and Lebanon in the Constant Currency calculations due to the effects of hyperinflation in the respective countries.3. RC = Reported Currency Growth / CC = Constant Currency Growth.4. Difference between total segment revenue and the sum of segment revenues is mainly due to intersegment consolidation adjustments for services charged by the Platform Businesses to the Integrated Verticals Businesses.5. Preliminary values. Auditor review not yet completed at the time of publication (12 August 2021) therefore changes might occur.
2020 2021
in €m Q1 Q2 H1 Q3 Q4 FY Q1 Q2 H1
Delivery Hero Group
Orders 352.2 408.1 760.3 520.5 610.1 1,890.8 662.8 730.3 1,393.1
% YoY Growth 85.8% 88.0% 87.0% 98.6% 96.3% 93.0% 88.2% 78.9% 83.2%
% OD Orders 38.1% 45.9% 42.3% 46.6% 47.3% 45.1% 47.9% 49.9% 48.9%
GMV1,2 4,240.0 4,815.3 9,055.3 5,804.0 6,946.4 21,805.8 7,769.7 8,388.8 16,158.5
% YoY Growth (RC) 3 61.4% 66.7% 64.2% 75.9% 81.3% 72.4% 83.2% 74.2% 78.4%
% YoY Growth (CC) 4 63.9% 69.6% 66.9% 85.5% 91.0% 79.0% 92.2% 80.8% 86.1%
Revenue1,2 631.3 757.5 1,388.8 946.3 1,152.6 3,487.7 1,351.6 1,549.9 2,901.6
% YoY Growth (RC) 3 96.7% 102.7% 99.9% 107.8% 101.5% 102.5% 114.1% 104.6% 108.9%
% YoY Growth (CC) 4 97.2% 105.0% 101.4% 119.4% 114.8% 110.6% 127.0% 115.1% 120.5%
Intersegment consolidation5 (1.0) (2.7) (3.8) (4.9) (9.5) (18.2) (19.2) (35.2) (54.5)
Adj. EBITDA1,2 (323.5) (590.2) (332.3)
EBITDA Margin % (GMV) -3.6% -2.7% -2.1%
Asia
Orders 223.3 284.4 507.7 347.8 399.1 1,254.5 430.6 485.5 916.1
% YoY Growth 134.0% 151.5% 143.5% 133.6% 117.9% 132.1% 92.9% 70.7% 80.5%
% OD Orders 39.3% 46.8% 43.5% 47.6% 47.5% 45.9% 47.4% 49.9% 48.7%
GMV 2,800.6 3,323.5 6,124.1 3,870.1 4,661.9 14,656.0 5,129.4 5,588.6 10,718.0
% YoY Growth (RC) 3 82.4% 97.5% 90.3% 95.2% 96.8% 93.6% 83.2% 68.2% 75.0%
% YoY Growth (CC) 4 86.0% 100.2% 93.5% 103.3% 102.5% 98.8% 88.3% 71.0% 78.9%
Revenue 290.8 391.0 681.8 450.1 541.7 1,673.6 620.1 720.2 1,340.4
% YoY Growth (RC) 3 141.5% 175.0% 159.6% 135.2% 102.1% 131.8% 113.2% 84.2% 96.6%
% YoY Growth (CC) 4 141.4% 174.8% 159.5% 143.6% 109.6% 136.8% 121.5% 90.2% 103.5%
Adj. EBITDA (205.8) (406.2)
EBITDA Margin % (GMV) -3.4% -2.8%
MENA
Orders 84.7 66.5 151.2 107.7 127.4 386.3 140.0 147.9 287.9
% YoY Growth 31.3% -5.9% 11.9% 40.0% 47.3% 29.4% 65.2% 122.4% 90.4%
% OD Orders 35.1% 41.6% 38.0% 40.6% 41.3% 39.8% 43.9% 43.7% 43.8%
GMV1,2 956.8 822.1 1,778.9 1,206.3 1,350.4 4,335.6 1,537.7 1,617.3 3,155.0
% YoY Growth (RC) 3 28.5% 1.0% 14.1% 30.0% 36.3% 24.7% 60.7% 96.7% 77.4%
% YoY Growth (CC) 4 28.1% 2.4% 14.7% 43.8% 57.1% 34.5% 83.2% 123.8% 102.0%
Revenue1,2 202.3 165.9 368.1 246.2 279.9 894.3 325.5 359.3 684.9
% YoY Growth (RC) 3 40.6% 1.0% 19.5% 27.5% 30.3% 24.9% 60.9% 116.6% 86.0%
% YoY Growth (CC) 4 38.4% 1.0% 18.5% 37.7% 45.3% 31.7% 79.4% 142.4% 107.8%
Adj. EBITDA1,2 18.8 98.6
EBITDA Margin % (GMV) 1.1% 2.3%
26
1. Americas and MENA revenues, adjusted EBITDA, Gross Merchandise Value (GMV) as well as the respective growth rates are impacted by the Argentinian and Lebanese operations qualifying as hyperinflationary economies according to IAS 29 beginning 1 September 2018 and October 2020 respectively.
2. Includes Reported Currency growth rates for Argentina and Lebanon in the Constant Currency calculations due to the effects of hyperinflation in the respective countries.3. RC = Reported Currency Growth / CC = Constant Currency Growth.
Orders and GMV are accounted for in the respective Platform segments and
shown in the Integrated Verticals segment for illustrative purposes only
2020 2021
in €m Q1 Q2 H1 Q3 Q4 FY Q1 Q2 H1
Europe
Orders 25.4 30.6 56.0 32.0 40.6 128.7 47.0 49.8 96.8
% YoY Growth 32.9% 47.4% 40.4% 54.8% 66.4% 51.4% 84.7% 62.8% 72.7%
% OD Orders 19.0% 26.3% 23.0% 25.8% 28.3% 25.4% 31.4% 33.4% 32.4%
GMV 320.5 420.3 740.8 426.4 570.3 1,737.5 682.4 718.7 1,401.1
% YoY Growth (RC) 3 38.1% 69.1% 54.1% 65.0% 84.9% 65.9% 112.9% 71.0% 89.1%
% YoY Growth (CC) 4 40.0% 72.8% 57.0% 66.9% 86.8% 68.2% 112.6% 68.3% 87.5%
Revenue 57.5 76.1 133.6 80.4 109.1 323.1 136.6 149.3 285.9
% YoY Growth (RC) 3 55.6% 84.4% 70.8% 88.1% 108.5% 86.4% 137.5% 96.3% 114.0%
% YoY Growth (CC) 4 58.3% 89.7% 74.9% 90.8% 111.0% 89.7% 136.5% 92.0% 111.2%
Adj. EBITDA (7.9) (2.2)
EBITDA Margin % (GMV) -1.1% -0.1%
Americas
Orders 18.7 26.6 45.3 33.0 43.0 121.3 45.2 47.1 92.3
% YoY Growth 79.2% 111.2% 96.7% 112.0% 156.4% 119.1% 141.4% 77.1% 103.6%
% OD Orders 62.5% 70.8% 67.3% 76.2% 81.9% 74.9% 83.4% 86.3% 84.9%
GMV1,2 162.1 249.4 411.5 301.3 363.8 1,076.6 420.1 464.3 884.4
% YoY Growth (RC) 3 41.5% 74.8% 60.0% 129.6% 120.2% 94.5% 159.2% 86.1% 114.9%
% YoY Growth (CC) 4 48.3% 85.4% 68.9% 148.7% 136.4% 108.0% 172.6% 90.9% 123.0%
Revenue1,2 37.8 57.2 95.0 72.5 89.9 257.4 107.0 119.9 226.9
% YoY Growth (RC) 3 93.0% 119.5% 108.1% 157.4% 145.6% 133.1% 182.8% 109.6% 138.8%
% YoY Growth (CC) 4 102.8% 132.5% 119.7% 178.0% 163.5% 149.1% 196.7% 114.7% 147.4%
Adj. EBITDA1,2 (79.1) (143.1)
EBITDA Margin % (GMV) -19.2% -13.3%
Integrated Verticals
Orders 4.3 6.1 10.4 10.1 14.2 34.7 17.0 21.5 38.4
% YoY Growth 296.1% 249.4% 268.6%
% OD Orders 100.0% 100.0% 100.0% 100.0% 100.0% 100.0% 100.0% 100.0% 100.0%
GMV 45.7 72.3 118.0 103.8 148.9 370.7 193.2 256.2 449.4
% YoY Growth (RC) 3 322.9% 254.5% 281.0%
% YoY Growth (CC) 4 360.4% 279.6% 310.9%
Revenue 43.8 70.1 113.9 102.1 141.4 357.4 181.6 236.4 418.0
% YoY Growth (RC) 3 314.6% 237.3% 267.0%
% YoY Growth (CC) 4 351.7% 263.3% 297.3%
Adj. EBITDA (49.4) (137.2)
EBITDA Margin % (GMV) -41.9% -37.0%
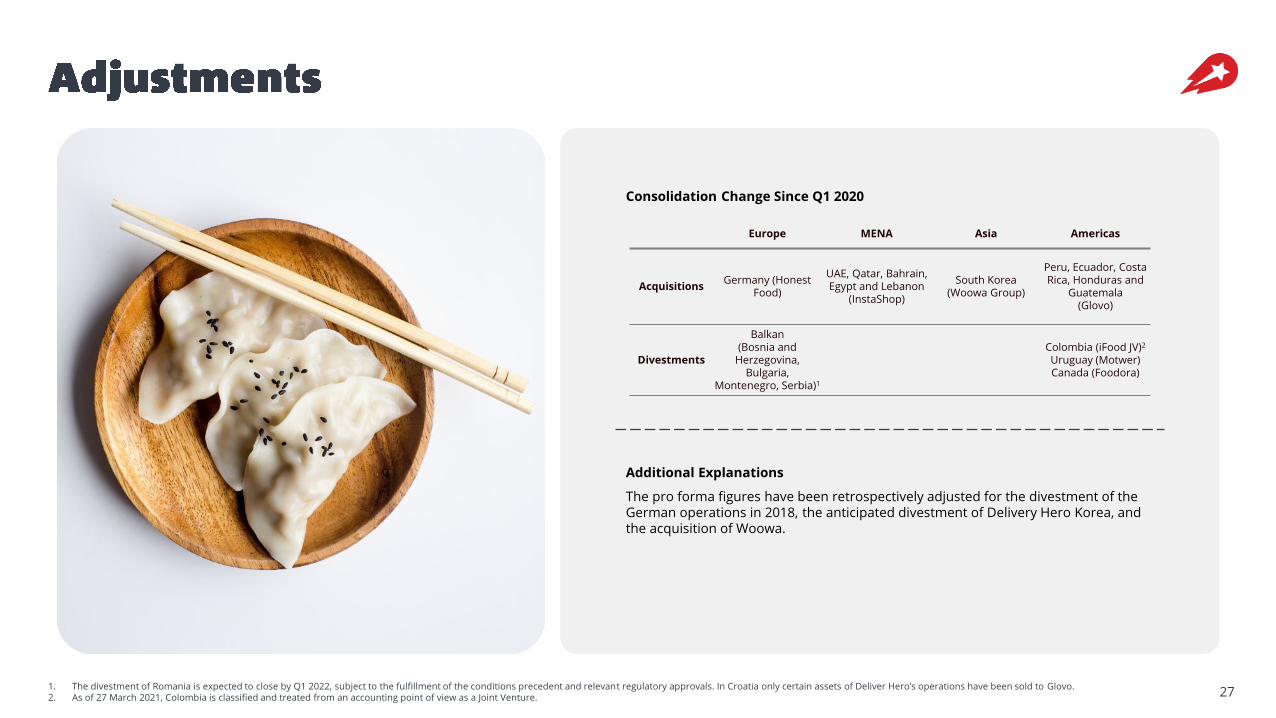
271. The divestment of Romania is expected to close by Q1 2022, subject to the fulfillment of the conditions precedent and relevant regulatory approvals. In Croatia only certain assets of Deliver Hero’s operations have been sold to Glovo.2. As of 27 March 2021, Colombia is classified and treated from an accounting point of view as a Joint Venture.
Additional Explanations
The pro forma figures have been retrospectively adjusted for the divestment of the German operations in 2018, the anticipated divestment of Delivery Hero Korea, and the acquisition of Woowa.
Europe MENA Asia Americas
AcquisitionsGermany (Honest
Food)
UAE, Qatar, Bahrain, Egypt and Lebanon
(InstaShop)
South Korea (Woowa Group)
Peru, Ecuador, Costa Rica, Honduras and
Guatemala (Glovo)
Divestments
Balkan(Bosnia and
Herzegovina, Bulgaria,
Montenegro, Serbia)1
Colombia (iFood JV)2
Uruguay (Motwer)Canada (Foodora)
Consolidation Change Since Q1 2020
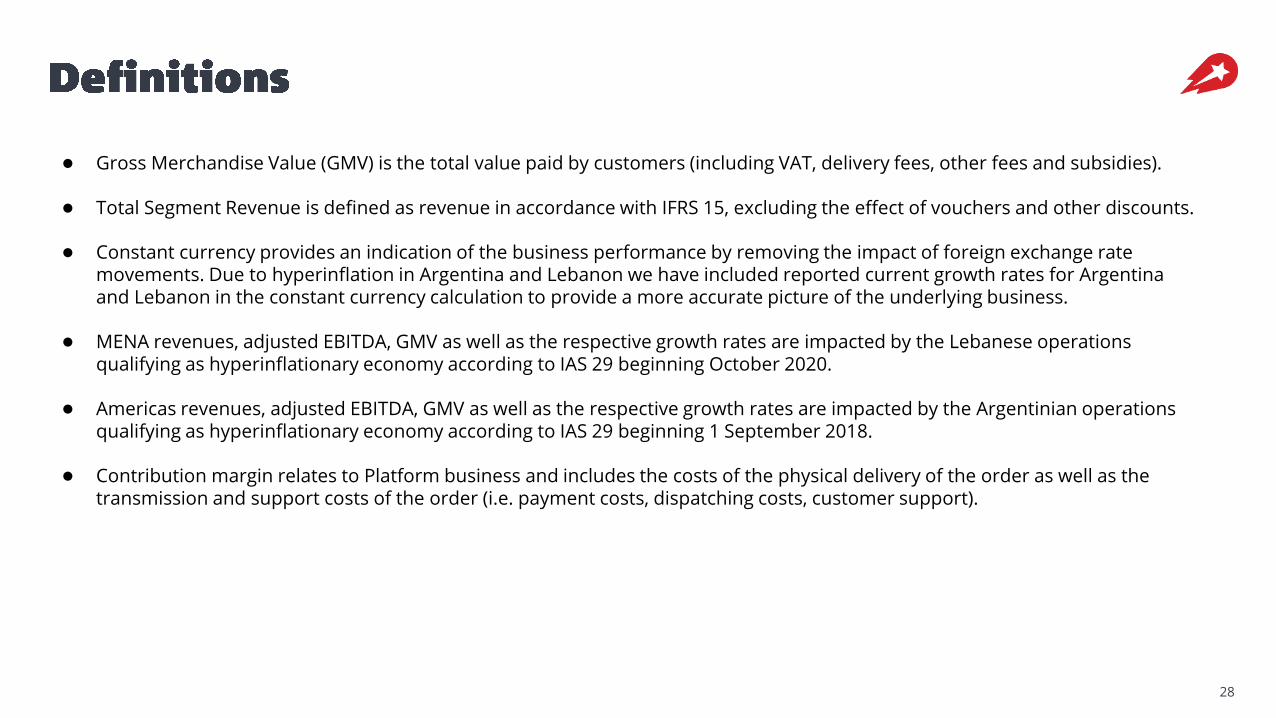
● Gross Merchandise Value (GMV) is the total value paid by customers (including VAT, delivery fees, other fees and subsidies).
● Total Segment Revenue is defined as revenue in accordance with IFRS 15, excluding the effect of vouchers and other discounts.
● Constant currency provides an indication of the business performance by removing the impact of foreign exchange rate movements. Due to hyperinflation in Argentina and Lebanon we have included reported current growth rates for Argentina and Lebanon in the constant currency calculation to provide a more accurate picture of the underlying business.
● MENA revenues, adjusted EBITDA, GMV as well as the respective growth rates are impacted by the Lebanese operations qualifying as hyperinflationary economy according to IAS 29 beginning October 2020.
● Americas revenues, adjusted EBITDA, GMV as well as the respective growth rates are impacted by the Argentinian operations qualifying as hyperinflationary economy according to IAS 29 beginning 1 September 2018.
● Contribution margin relates to Platform business and includes the costs of the physical delivery of the order as well as the transmission and support costs of the order (i.e. payment costs, dispatching costs, customer support).
28

29
Contact
T: +49 (0)30 54 4459 105Oranienburger Straße 70
10117 BerlinGermany
[email protected]://ir.deliveryhero.com
● For the purposes of this notice, “presentation” means this document, its contents or any part of it. This presentation does not, and is not intended to, constitute or form part of, and should not be construed as, an offer to sell, or a solicitation of an offer to purchase, subscribe for or otherwise acquire, any part of it form the basis of or be relied upon in connection with or act as any inducement to enter into any contract or commitment or investment decision whatsoever.
● This presentation is neither an advertisement nor a prospectus and should not be relied upon in making any investment decision to purchase, subscribe for or otherwise acquire any securities. The information and opinions contained in this presentation are provided as at the date of this presentation, are subject to change without notice and do not purport to contain all information that may be required to evaluate Delivery Hero SE. Delivery Hero SE undertakes no obligation to update or revise this presentation. No reliance may or should be placed for any purpose whatsoever on the information contained in this presentation, or any other information discussed verbally, or on its completeness, accuracy or fairness.
● The information in this presentation is of preliminary and abbreviated nature and may be subject to updating, revision and amendment, and such information may change materially. Neither Delivery Hero SE nor any of its directors, officers, employees, agents or affiliates undertakes or is under any duty to update this presentation or to correct any inaccuracies in any such information which may become apparent or to provide any additional information.
● The presentation and discussion contain forward looking statements, other estimates, opinions and projections with respect to anticipated future performance of Delivery Hero SE (“Forward-looking Statements”). These Forward-looking Statements can be identified by the use of forward-looking terminology, including the terms “believes”, “estimates”, “anticipates”, “expects”, “intends”, “aims”, “plans”, “predicts”, “may”, “will” or “should” or, in each case, their negative, or other variations or comparable terminology. These Forward-looking Statements include all matters that are not historical facts. They appear in a number of places throughout this presentation and include statements regarding Delivery Hero SE’s intentions, beliefs or current expectations concerning, among other things, Delivery Hero SE’s prospects, growth, strategies, the industry in which it operates and potential or ongoing acquisitions. By their nature, Forward-looking Statements involve significant risks and uncertainties, because they relate to events and depend on circumstances that may or may not occur in the future. Forward-looking Statements should not be read as guarantees of future performance or results and will not necessarily be accurate indications of whether or notsuch results will be achieved. Similarly, past performance should not be taken as an indication of future results, and nor representation or warranty, express or implied, is made regarding future performance. The development of Delivery Hero SE’s prospects, growth, strategies, the industry in which it operates, and the effect of acquisitions on Delivery Hero SE may differ materially from those made in or suggested by the Forward-looking Statements contained in this presentation or past performance. In addition, even if the development of Delivery Hero SE’s prospects, growth, strategies and the industry in which it operates are consistent with the Forward-looking Statements contained in this presentation or past performance, those developments may not be indicative of Delivery Hero SE’s results, liquidity or financial position or of results or developments in subsequent periods not covered by this presentation. Any Forward-Looking Statements only speak as at the date of this presentation is provided to the recipient and it is up to the recipient to make its own assessment of the validity of any Forward-looking Statements and assumptions. No liability whatsoever is accepted by Delivery Hero SE in respect of the achievement of such Forward-looking Statements and assumptions.