ammonia as carbon free fuel for internalcombustion engine
TRANSCRIPT

Ammonia as carbon free fuel forinternal CombusTion engIne driVen
AgriculTural vEhicle
Work Package 2Deliverable Report
Topic: D2.2
Operational characteristic for the target agricultural vehicleoperated under indoor and outdoor conditions
30.06.2021
Page 1

1 Agriculture vehicle presentation
The subject of the research was a Scout T-15 tractor what presents Fig. 1.1. It is factory-fittedwith a single-cylinder 815 cm3 diesel engine. This unit generates 14.85 hp (10.92kW), which issufficient for most of the simple field and transport work. Power from the engine is transmittedby two belts, which transfer the power to a pulley in the rear of the tractor. The power is thentransferred to a clutch and a gearbox. The tractor has 3 forward gears and 1 reverse gear. Each ofthe gear ratios has two variants: a road allowance (H) and an off-road allowance (L). The type oftransmission depends on the setting of the geared motor, which additionally changes the ratio.
Figure 1.1: Scheme of the new engine mounting plate
1.1 Engine swap
Due to the lack of availability of this engine, it was necessary to replace it with another enginewith similar parameters. In this case, the choice fell on the well-known and widely used compressionignition engine type L-100 - LiFAN - 186F. Detailed parameters of this engine are presented in thetable:
• Engine type - four-stroke, air-cooled
• engine displacement - 418 cm with power 9,5 hp (6,8 kW) / 3,600 rpm
• engine start - manual and electric
• fuel - diesel ON
• diameter x stroke - 86x75
• combustion - direct injection
• lubrication type - oil pump
• capacity of tank - 5,5L
• capacity of oil sump - 1,65L
Page 2

• net weight - 53 kg
• shaft diameter - 25.4 mm.
• starter cables included
• oil air filter
Figure 1.2: Scheme of the new engine mounting plate
On the Fig 1.2 is shown sketch of the new mounting plate for the single cylinder engine. This partwas made from 6mm steel. The Fig. 1.3 shows mounted unit on the tractor. As new engine is morethan three times lighter than old one, there was need to compensate this change in weight distributionof the tractor, as during agricultural operation this change could lead to hazardous situations. Afterconsultation, in accordance to simple calculations, 40kg concrete element was chosen to compensateweight loss and prevent lifting of the front wheels. The look for the tractor front with weight on itpresents Fig. 1.4.
2 Sensors selection
To carry out the research planned in WP2, it was necessary to develop a measurement systemcapable of measuring and recording a range of data necessary to calculate quantities such as powerand torque. As a result of the work carried out, a list and proposed layout of the most importantmeasuring systems was drawn up (Fig. 2.1.
2.1 tractive force sensor
The most important quantity for determining power and torque is the force required to performa given action. Due to the nature of the work planned, a strain gauge system is proposed, with
Page 3

Figure 1.3: View on the retrofited engine
Figure 1.4: View on the front of the tractor
an S-type strain gauge at its heart. Based on experience from similar studies, in order to ensurean adequate reserve of the measuring range, a strain gauge system with a maximum load of 7.5kNwas proposed. The sensor was connected to a signal amplification circuit, which allows the use of astandard 4-20mA signal type.
Page 4

Figure 2.1: View on placement of most important sensors
2.2 Engine and wheel speed estimation
Other important measurement quantities were the rotational speeds (RPM) of the engine shaftand wheels. Simple inductive sensors were used to determine these quantities. The reason for thiswas that, especially in the case of the engine, the use of more advanced measurement methods suchas Encoder was not possible due to limited space. View of the sensors, presents Fig 2.2
As both sensors provide a signal which, based on the measuring equipment, is converted intopulses per minute, it is possible to determine the number of revolutions per minute.This value isuseful in the case of the engine shaft, whereas in the case of wheel speed, it is necessary to convertthese revolutions into distance/road, which allows, based on the number of cycles per unit of time,to determine the speed of the tractor
2.3 Other sensors
Due to the need to verify the field tests under laboratory conditions, there is a need to determinethe engine settings at a given operating point. Due to the fact that, unlike in the case of a sparkignition engine, it is not possible to read the throttle setting, controlled by the throttle cable, itwas necessary to propose another way of reading the parameters necessary to determine the exactoperating point of the engine. For this purpose, a cable-mounted attachment was designed and man-ufactured in FDM technology. A linear potentiometer was mounted in the attachment to determine
Page 5

(a) wheels (b) engine
Figure 2.2: View of the inductive sensors
the position of the throttle cable, and thus the engine setting. The measurement of fuel flow is a veryimportant parameter. For field tests, a flow meter must be used. Preliminary estimates, based onengine power, and fuel energy value, determined the expected operating range of such a flow meter.The expected flow rate should be below 0.1l/min. After market analysis, a rotor flowmeter (Fig. 2.3was used, allowing flow readings in the range of 0.01-0.9 l/min.
Figure 2.3: View on chosen flow meter
Page 6
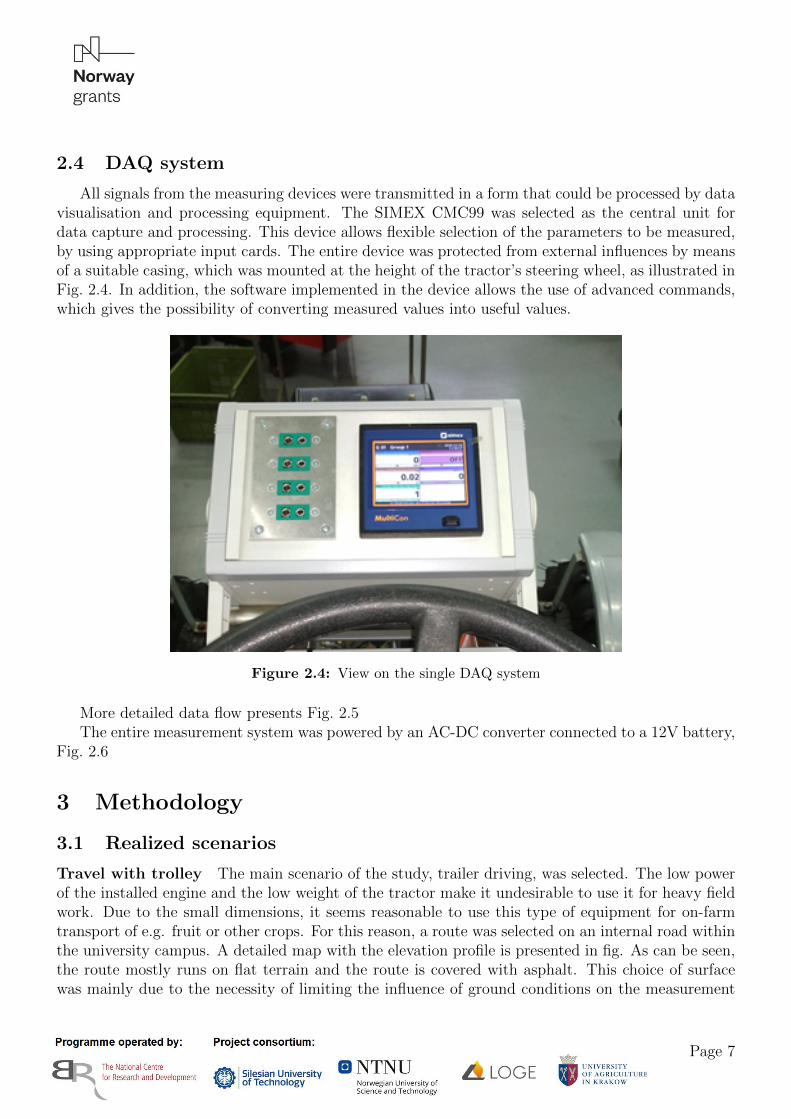
2.4 DAQ system
All signals from the measuring devices were transmitted in a form that could be processed by datavisualisation and processing equipment. The SIMEX CMC99 was selected as the central unit fordata capture and processing. This device allows flexible selection of the parameters to be measured,by using appropriate input cards. The entire device was protected from external influences by meansof a suitable casing, which was mounted at the height of the tractor’s steering wheel, as illustrated inFig. 2.4. In addition, the software implemented in the device allows the use of advanced commands,which gives the possibility of converting measured values into useful values.
Figure 2.4: View on the single DAQ system
More detailed data flow presents Fig. 2.5The entire measurement system was powered by an AC-DC converter connected to a 12V battery,
Fig. 2.6
3 Methodology
3.1 Realized scenarios
Travel with trolley The main scenario of the study, trailer driving, was selected. The low powerof the installed engine and the low weight of the tractor make it undesirable to use it for heavy fieldwork. Due to the small dimensions, it seems reasonable to use this type of equipment for on-farmtransport of e.g. fruit or other crops. For this reason, a route was selected on an internal road withinthe university campus. A detailed map with the elevation profile is presented in fig. As can be seen,the route mostly runs on flat terrain and the route is covered with asphalt. This choice of surfacewas mainly due to the necessity of limiting the influence of ground conditions on the measurement
Page 7

Figure 2.5: Flow of the signals in DAQ system
Figure 2.6: View on AC-DC converter and 12V battery
Page 8

data. The scenario included driving an empty and a loaded trailer (load mass 200kg) The test weremade in different speeds, for test purposes 5,7 and 10 km/h were selected.
Figure 3.1: Map of trolley test track
Figure 3.2: Profile of trolley test track
Agriculture operations - plowing
3.2 Data curation - power and torque
The key information from the tests carried out under operating conditions (field work, transport)is the value of the engine torque under the various operating conditions (speed, load, etc.). Thefollowing presents the calculation procedure for determining the engine torque value.
In order to determine the structure of the work performed by the driving unit, the key values offorces necessary to perform the planned tests were determined, i.e:
• the force needed to overcome the rolling resistance and the losses in the transmission mecha-nisms (gears, clutch), denoted as Ft, [N ]
Page 9

(a) empty troley (b) loaded troley
Figure 3.3: View of tractor with trolley
Figure 3.4: Map of plowing
• the force at the tractor’s coupling point, understood as the operating resistance of the operationscarried out Fz, [N ]
The determination of these forces was done by strain gauge measurement. The sum of the abovementioned forces
Fc = Ft + Fz
determines the working resistance of the tractor + machine set. This value was the basis for calcu-lating the work L, [J ] at a given time t, [s]
L = Fc s
where: L - work done by the drive unit during the test period,Fc - total resistance forces - unit distance during the test in the adopted time intervals [m].
Page 10

(a) (b)
Figure 3.5: View of plowing operation
During the test, current measurements are taken of the tractor speed V, [m/s] at assumed timeintervals t. Based on this information, the distance s [m] was determined
s =V
t
For the work L calculated in this way, it was possible to calculate the actual engine power P, [W ]at the analyzed time intervals from the following relation:
P =L
t
The motor power calculated in this way was used to estimate the motor torque M, [Nm] at a specificshaft angular velocity ω, [rad/s]
M =P
ω
The value of the angular velocity of the motor shaft was determined based on the rotational speedn, [rpm] achieved during tests
ω =(2π n)
60
The estimated values of the engine torque could be used for further analyses taking fuel consumptioninto account.
3.3 Chassis dynamometer tests
The next stage of the research was to carry out a test under controlled conditions to determinethe performance characteristics of the engine, with particular reference to exhaust gas compositionand temperature. For this purpose, a MAHA Chassis dynamometer was used, which allows stableoperating points to be set. Gear 3 was used as the most suitable gear for this type of analysis. Sixengine loads (tractive force) were analysed, for four different engine speeds, thus covering practically
Page 11

the entire operating range of the engine. The configuration of the measurement points is summarisedin TableXX. Flue gas composition was measured with use od Infralts N gas analyser (Saxon JunkalorGmbH). The power and tractive force was noted from the computer screen connected to the chassisdynamometer test.
4 Results
4.1 Field test
Figure 4.1 shows examples of the power and torque values obtained when driving with the trolleyat full load. In order to present the results, 3 speeds have been distinguished, which represent thedifferent phases of the tractor’s operation. The presented results confirm the correlation that thepower required for propulsion will increase with increasing speed. However, the torque is similarat 8.1 and 11.5 km/h. A different data set was obtained for ploughing (Fig 4.2). In this case,the highest power was obtained for lowest speed. The upward trend for torque, although clear, isworth considering the scale for this variable, which oscillates within the measurement error of theequipment. Therefore, it can be assumed that torque is equal in this case for all three analysedoperating points.
Figure 4.1: Dependency of Power and Torque in different speeds of travel with trolley
4.2 Chassis dynamometer test
Figure 4.3 shows the power values at different operating points. The green colour indicatesthe values obtained for the maximum brake loads of the dynamometer, which (600-650N). Whenanalysing the curve of power change with the engine speed, it is easy to see that the highest power isgenerated by the tractor at the engine speed above 3000 RPM. This relationship is consistent withthe data found for L100-type engines. The analysis of torque obtained torque (Fig 4.4) shows that
Page 12

Figure 4.2: Dependency of Power and Torque in different speeds during plow operation
the highest values were obtained at lower values of rotational speed, which is also consistent withthe characteristics found for this type of unit.
Figure 4.3: Power of the vehicle at different loads and engine speeds
Figures form 4.5 4.9 presents exhaust gases composition. On the basis of the data collated, itcan easily be seen that within the maximum engine loads, the quality of the exhaust gases emitteddeteriorates drastically. In particular the emission of carbon monoxide (Fig 4.5) and organic com-pounds (Fig 4.8). It is worth mentioning that at low speeds (1700-2500rpm), the shares of thesetwo exhaust gases components are very unfavourable. The analysis of NO-NOx (Fig 4.7) emissions
Page 13

Figure 4.4: Torque of the vehicle at different loads and engine speeds
showed that, as in the case of the previous components, the proportion of nitrogen compounds inthe exhaust gases is lower for higher values of engine speed.
Figure 4.5: Share of CO in flue gases during test at different loads and engine speeds
The last parameter which is important in terms of peripheral systems (SCR exhaust gas denitri-fication system) is the exhaust gas temperature (Fig 4.10). It is crucial in order to ensure properconditions for catalytic reactions and should be at least 250◦C, but optimally the temperature in thereactor (depending on the manufacturer) should be 300-400◦C). It is evident from the diagrams (Fig.), that in case of a diesel fueled engine, ensuring optimal process conditions will be very difficult,therefore, at these points (if data are confirmed for an ammonia fueled engine), it will be necessaryto apply a reactor heating system.
Page 14

Figure 4.6: Share of CO2 in flue gases during test at different loads and engine speeds
Figure 4.7: Share of NO and NOx in flue gases during test at different loads and engine speeds
Figure 4.8: Share of hudrocarbons (CH) in flue gases during test at different loads and engine speeds
5 Summary
The work presented was based on the design of a measurement system allowing for the measure-ment of basic tractor parameters in field conditions. Tests were carried out for two field operations
Page 15

Figure 4.9: Share of O2 in flue gases during test at different loads and engine speeds
Figure 4.10: Flue gases temperature during test at different loads and engine speeds
Figure 4.11: Fuel consumption during test at different loads and engine speeds
characteristic for this type of equipment, i.e. driving with a trolley and working with a light plough.In both cases, several speed variants were analysed. The next stage was the analysis of operating
Page 16

points on a chassis dynamometer, where it was possible to precisely analyse the composition of ex-haust gases. Twenty-two operating points were analysed, for various engine loads and speeds. Theresults of the field tests made it possible to collate the working points of two field processes charac-teristic of this type of tractor. The results in comparison with the device characteristics show thatthese points are located in the zone of medium loads of the device, which seems to be favourable inrelation to the exhaust gas analysis performed on the chasis dynamometer. Referring to the exhaustgas analysis results, it is worth mentioning that the engine used is a system which seems to workoptimally at higher values of engine rotational speed (above 3000 RPM). The analysis of the exhaustgases showed that at higher loads and speeds, it will be possible to use the SCR system to reducenitrogen oxides.
Page 17