ams capital & philips lighting: will de vries be the …leading philips to register losses of...
TRANSCRIPT
A Work Project, presented as part of the requirements for the Award of a Master Degree in Finance
from the NOVA – School of Business and Economics.
CASE STUDY:
AMS Capital & Philips
Lighting: Will de Vries be the
Genius of the Lamp?
João Filipe Coutinho Alves da Silva, 3165
A Project carried out on the Master in Finance Program, under the supervision of: Professor
Paulo Soares de Pinho
January 16th, 2017
2
Abstract
The following case-study reports the situation involving Royal Philips, Philips Lighting and the
fictitious Hedge Fund AMS Capital Portfolio Manager, Luuk de Vries, as of May, 2016. The
structure is divided between the case story and a teaching note. Present in the case story, the
events involving the three parties until Philips Lighting is carved-out from Royal Philips and
listed trough an IPO are reported. The teaching note intends to tackle de Vries’ question of
buying or not on the IPO and to understand the reasoning behind carving-out. The teaching note
closes favouring the buy and flip the stock strategy.
Key words: Royal Philips; Carve-Out; Initial Public Offering; Philips Lighting
3
Table of Contents
Case Study
AMS Capital & Philips Lighting: Will de Vries be the Genius of the Lamp? .................................... 5
Philips’ journey: From light revolution to technology disruption ....................................................... 6
AMS Capital ........................................................................................................................................ 9
Light and Lighting Bulbs Industry .................................................................................................... 10
Healthcare Industry ........................................................................................................................... 11
Philips plans to split itself in two: ..................................................................................................... 12
Philips Lighting ................................................................................................................................. 15
Analysing the opportunity: would it be worth? ................................................................................. 17
The Decision ..................................................................................................................................... 19
Teaching Note
1 – Why is Royal Philips selling its lighting business? Why are they selling equity instead of raising
debt in the capital markets? Relate it with Royal Philips Operating Performance ability to sustain
Value Creation. .................................................................................................................................. 21
2 – What is the relation between Royal Philips and Philips Lighting after the IPO? Is there any
specificity regarding Corporate Governance? ................................................................................... 24
3 – What is a conglomerate discount? In this case, do you consider Royal Philips is suffering from
it? ....................................................................................................................................................... 25
4 – How much is Philips Lighting worth? How much should its share price be? ............................. 27
5 – Should de Vries convince Shuuring to buy at the IPO? If so, should they hold longer the stock or
sell immediately in the first day of trading? If they opt not to buy at the IPO, should they short sell
the stock? ........................................................................................................................................... 28
Appendix
Exhibit 1 – Royal Philips Revenues 1988-2015 ................................................................................ 32
Exhibit 2 – Historical Royal Philips Stock Cumulative Return 2000-2015 ...................................... 32
Exhibit 3 – Royal Philips Income Statement (2013-2015) ................................................................ 33
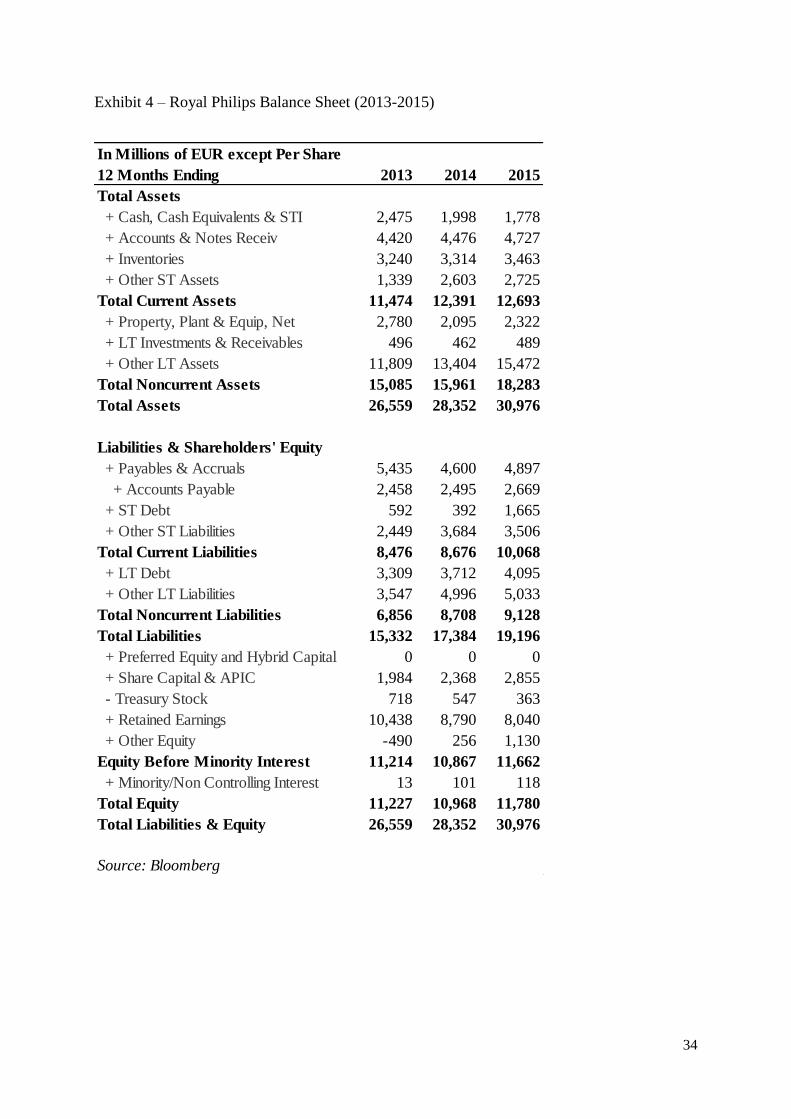
Exhibit 4 – Royal Philips Balance Sheet (2013-2015) ...................................................................... 34
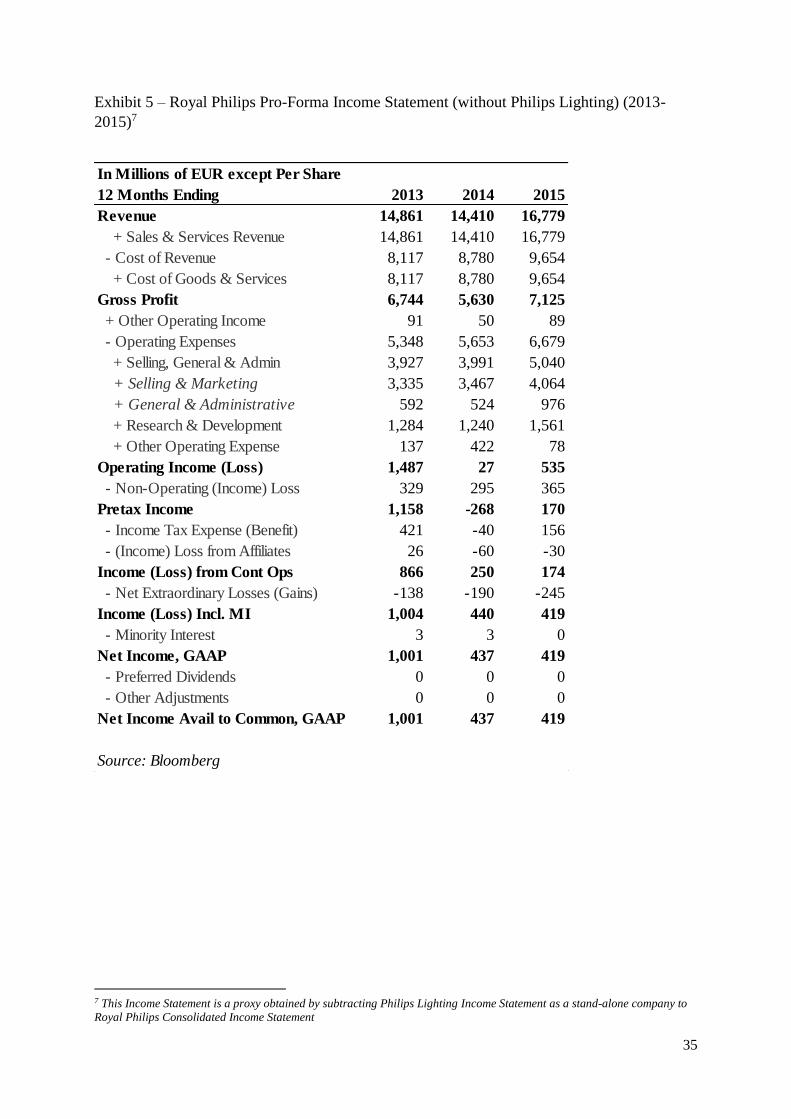
Exhibit 5 – Royal Philips Pro-Forma Income Statement (without Philips Lighting) (2013-2015) ... 35
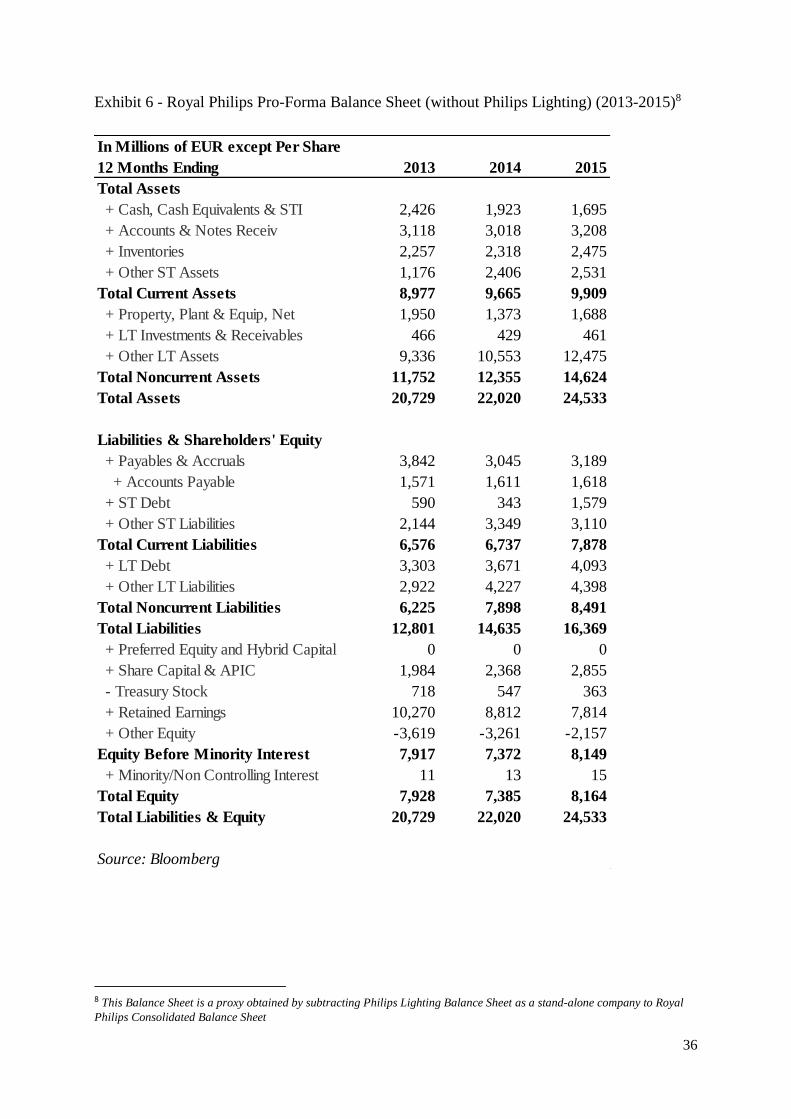
Exhibit 6 - Royal Philips Pro-Forma Balance Sheet (without Philips Lighting) (2013-2015) .......... 36
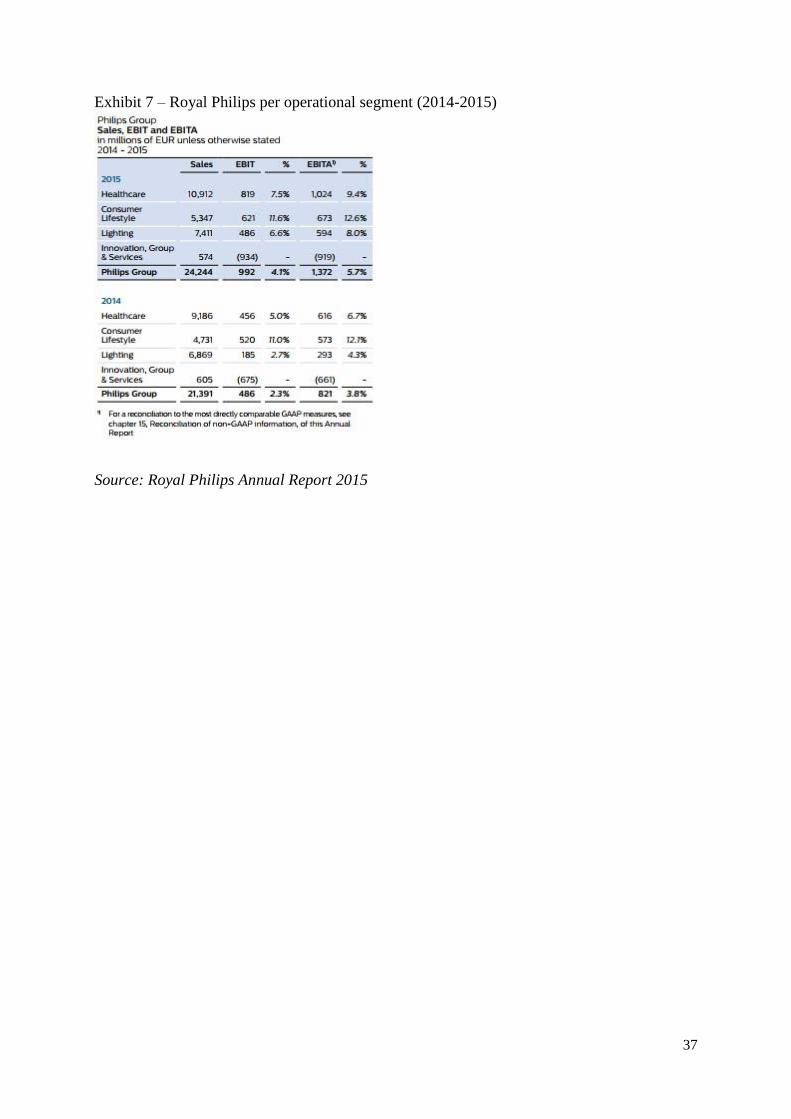
Exhibit 7 – Royal Philips per operational segment (2014-2015) ...................................................... 37
Exhibit 8 – 2015 Philips Group Equity and Debt market conditions ................................................ 38
Exhibit 9 – Total Spin-off return by Market Capitalization .............................................................. 39
Exhibit 10 – Lighting bulbs specifications by type ........................................................................... 41
4
Exhibit 11 – World GDP and Global Lamp Market (2005-2011) ..................................................... 41
Exhibit 12 – Lighting and Lamp Market Revenues (2010-2020) ..................................................... 42
Exhibit 13 – Medical Devices M&A deals........................................................................................ 43
Exhibit 14 – Health and Wellness Market Size (2002-2016) ............................................................ 43
Exhibit 15 – Royal Philips’ Structure ................................................................................................ 44
Exhibit 16 – Philips Lighting Corporate Governance structure as of the Settlement Date ............... 45
Exhibit 17 – Relationship Agreement ............................................................................................... 47
Exhibit 18 – “Carved-Out” Income Statement Philips Lighting (2013-2015) .................................. 49
Exhibit 19 – “Carved-Out” Balance Sheet Philips Lighting (2013-2015) ........................................ 50
Exhibit 20 – Philips Lighting Peers Overview .................................................................................. 51
Exhibit 21 – Royal Philips (after IPO) Peers Overview .................................................................... 52
Exhibit 22 – Royal Philips (before IPO) Peers Overview ................................................................. 54
Exhibit 23 – “Carved-Out” Cash Flow Statement Philips Lighting (2013-2015) ............................. 56
Exhibit 24 – By Measure Philips Lighting (2013-2015) ................................................................... 57
Exhibit 25 – Philips Lighting Sales per geographic cluster (2011-2015) .......................................... 58
Exhibit 26 – Lighting Market M&A deals ........................................................................................ 58
Exhibit 27 – Osram Stock Performance (2013-2016) ....................................................................... 59
Teaching Notes Appendix
TN Exhibit 1 – WACC and ROIC calculations................................................................................. 61
TN Exhibit 2 – Philips Lighting Comparable Multiples ................................................................... 67
TN Exhibit 3 – Philips Lighting Football Field Valuation ................................................................ 67
TN Exhibit 4 – Philips Healthtech Comparable Multiples ................................................................ 68
TN Exhibit 5 – Philips Healthcare Football Field Valuation ............................................................ 69
TN Exhibit 6 – Sum of the Parts ....................................................................................................... 70
Endnotes .................................................................................................................................. 71
5
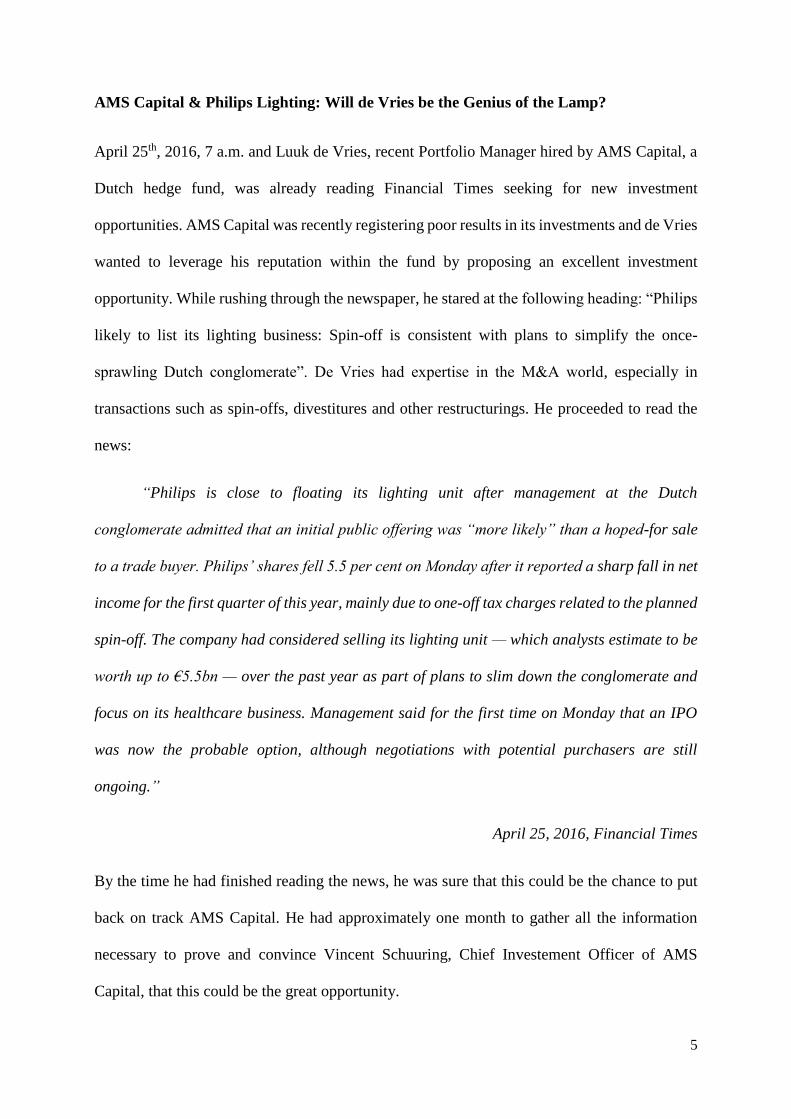
AMS Capital & Philips Lighting: Will de Vries be the Genius of the Lamp?
April 25th, 2016, 7 a.m. and Luuk de Vries, recent Portfolio Manager hired by AMS Capital, a
Dutch hedge fund, was already reading Financial Times seeking for new investment
opportunities. AMS Capital was recently registering poor results in its investments and de Vries
wanted to leverage his reputation within the fund by proposing an excellent investment
opportunity. While rushing through the newspaper, he stared at the following heading: “Philips
likely to list its lighting business: Spin-off is consistent with plans to simplify the once-
sprawling Dutch conglomerate”. De Vries had expertise in the M&A world, especially in
transactions such as spin-offs, divestitures and other restructurings. He proceeded to read the
news:
“Philips is close to floating its lighting unit after management at the Dutch
conglomerate admitted that an initial public offering was “more likely” than a hoped-for sale
to a trade buyer. Philips’ shares fell 5.5 per cent on Monday after it reported a sharp fall in net
income for the first quarter of this year, mainly due to one-off tax charges related to the planned
spin-off. The company had considered selling its lighting unit — which analysts estimate to be
worth up to €5.5bn — over the past year as part of plans to slim down the conglomerate and
focus on its healthcare business. Management said for the first time on Monday that an IPO
was now the probable option, although negotiations with potential purchasers are still
ongoing.”
April 25, 2016, Financial Times
By the time he had finished reading the news, he was sure that this could be the chance to put
back on track AMS Capital. He had approximately one month to gather all the information
necessary to prove and convince Vincent Schuuring, Chief Investement Officer of AMS
Capital, that this could be the great opportunity.
6
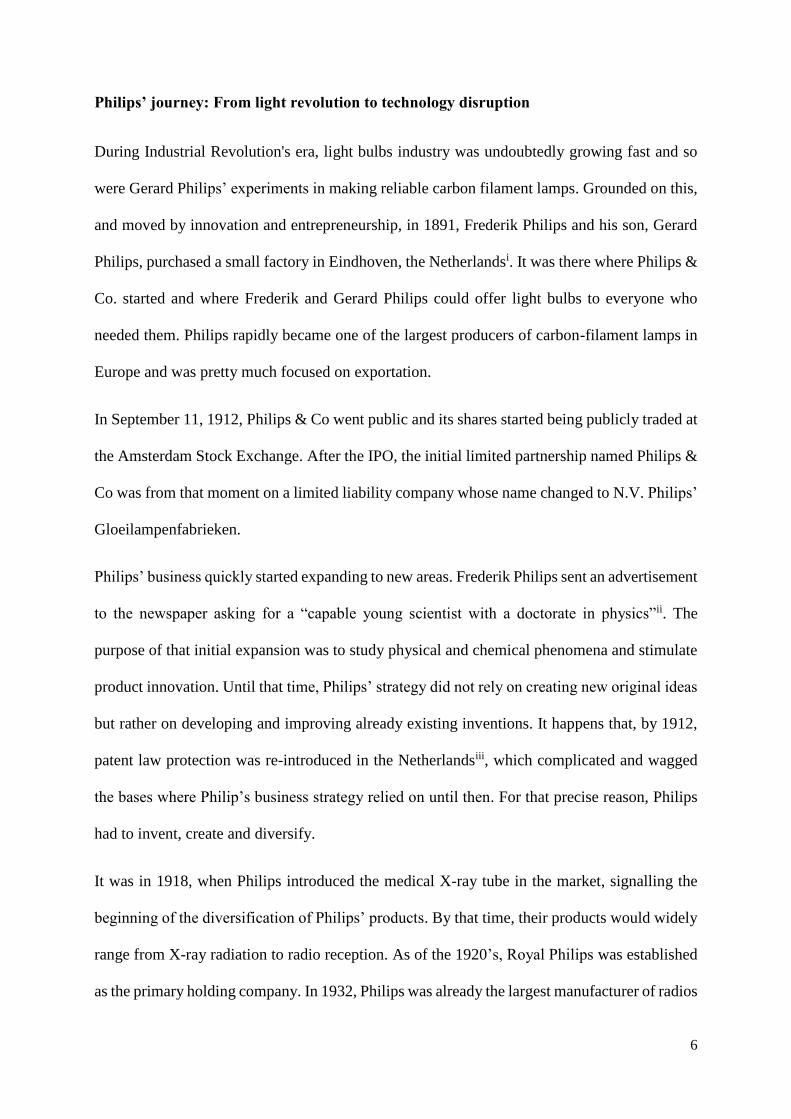
Philips’ journey: From light revolution to technology disruption
During Industrial Revolution's era, light bulbs industry was undoubtedly growing fast and so
were Gerard Philips’ experiments in making reliable carbon filament lamps. Grounded on this,
and moved by innovation and entrepreneurship, in 1891, Frederik Philips and his son, Gerard
Philips, purchased a small factory in Eindhoven, the Netherlandsi. It was there where Philips &
Co. started and where Frederik and Gerard Philips could offer light bulbs to everyone who
needed them. Philips rapidly became one of the largest producers of carbon-filament lamps in
Europe and was pretty much focused on exportation.
In September 11, 1912, Philips & Co went public and its shares started being publicly traded at
the Amsterdam Stock Exchange. After the IPO, the initial limited partnership named Philips &
Co was from that moment on a limited liability company whose name changed to N.V. Philips’
Gloeilampenfabrieken.
Philips’ business quickly started expanding to new areas. Frederik Philips sent an advertisement
to the newspaper asking for a “capable young scientist with a doctorate in physics”ii. The
purpose of that initial expansion was to study physical and chemical phenomena and stimulate
product innovation. Until that time, Philips’ strategy did not rely on creating new original ideas
but rather on developing and improving already existing inventions. It happens that, by 1912,
patent law protection was re-introduced in the Netherlandsiii, which complicated and wagged
the bases where Philip’s business strategy relied on until then. For that precise reason, Philips
had to invent, create and diversify.
It was in 1918, when Philips introduced the medical X-ray tube in the market, signalling the
beginning of the diversification of Philips’ products. By that time, their products would widely
range from X-ray radiation to radio reception. As of the 1920’s, Royal Philips was established
as the primary holding company. In 1932, Philips was already the largest manufacturer of radios
7
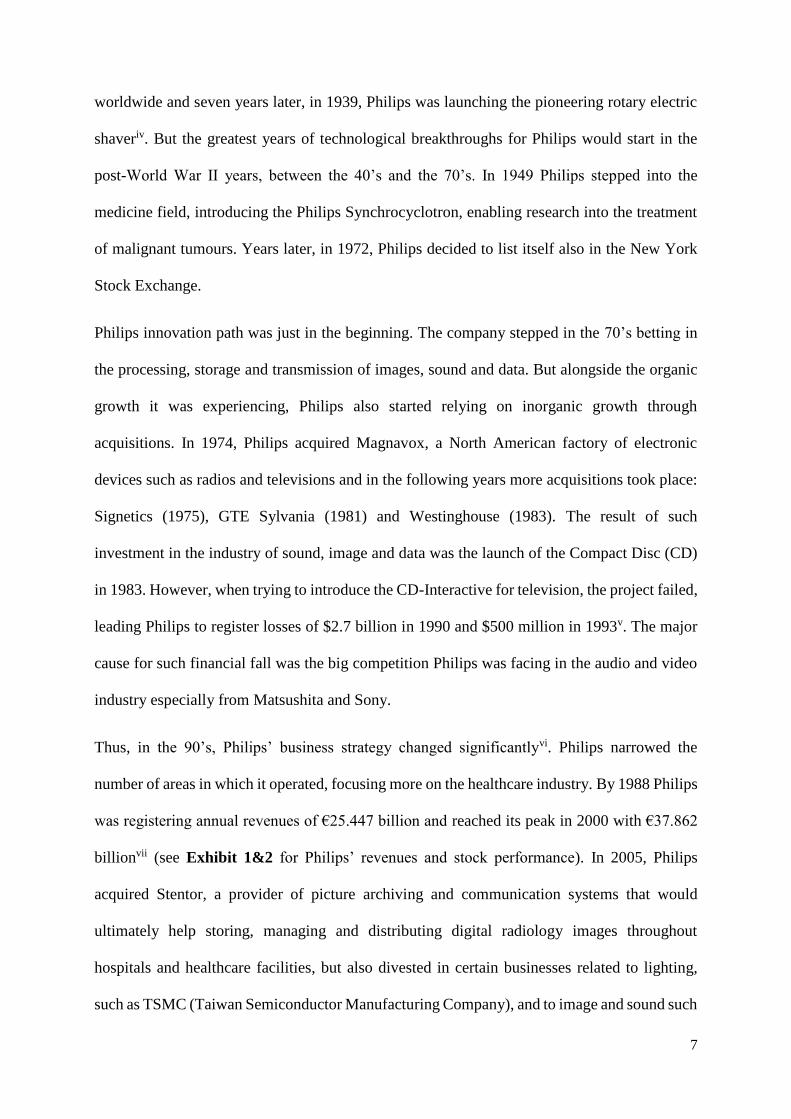
worldwide and seven years later, in 1939, Philips was launching the pioneering rotary electric
shaveriv. But the greatest years of technological breakthroughs for Philips would start in the
post-World War II years, between the 40’s and the 70’s. In 1949 Philips stepped into the
medicine field, introducing the Philips Synchrocyclotron, enabling research into the treatment
of malignant tumours. Years later, in 1972, Philips decided to list itself also in the New York
Stock Exchange.
Philips innovation path was just in the beginning. The company stepped in the 70’s betting in
the processing, storage and transmission of images, sound and data. But alongside the organic
growth it was experiencing, Philips also started relying on inorganic growth through
acquisitions. In 1974, Philips acquired Magnavox, a North American factory of electronic
devices such as radios and televisions and in the following years more acquisitions took place:
Signetics (1975), GTE Sylvania (1981) and Westinghouse (1983). The result of such
investment in the industry of sound, image and data was the launch of the Compact Disc (CD)
in 1983. However, when trying to introduce the CD-Interactive for television, the project failed,
leading Philips to register losses of $2.7 billion in 1990 and $500 million in 1993v. The major
cause for such financial fall was the big competition Philips was facing in the audio and video
industry especially from Matsushita and Sony.
Thus, in the 90’s, Philips’ business strategy changed significantlyvi. Philips narrowed the
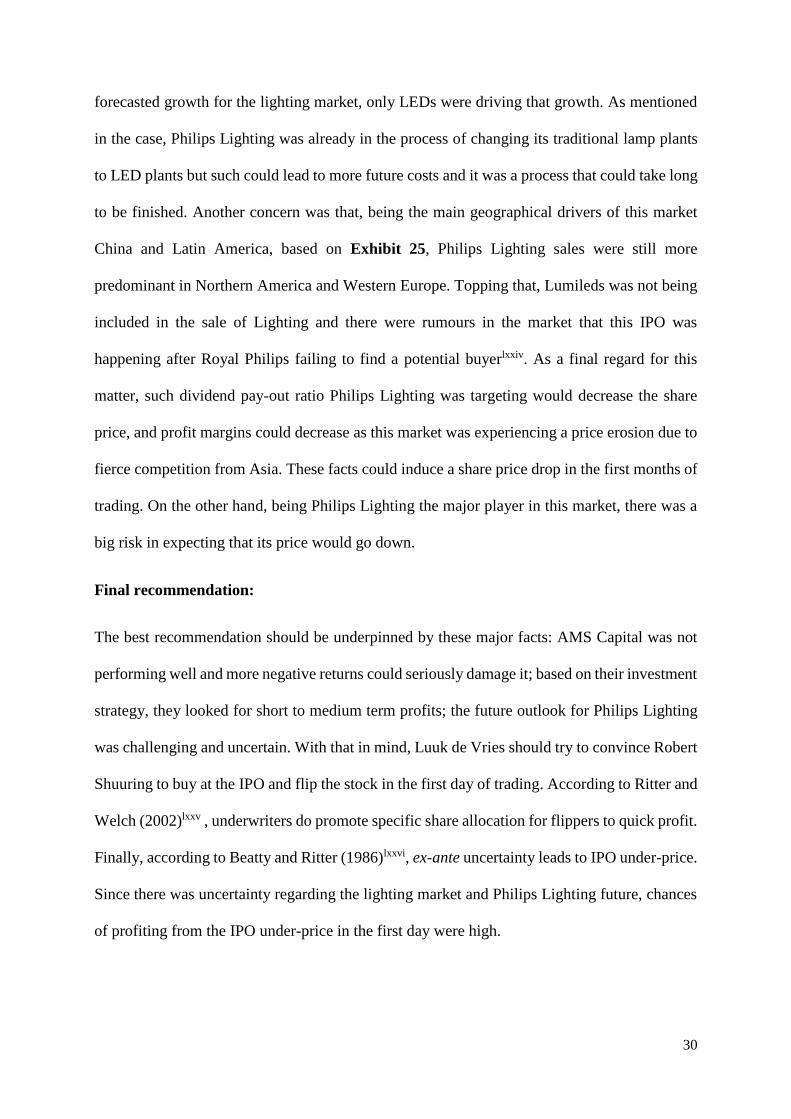
number of areas in which it operated, focusing more on the healthcare industry. By 1988 Philips
was registering annual revenues of €25.447 billion and reached its peak in 2000 with €37.862
billionvii (see Exhibit 1&2 for Philips’ revenues and stock performance). In 2005, Philips
acquired Stentor, a provider of picture archiving and communication systems that would
ultimately help storing, managing and distributing digital radiology images throughout
hospitals and healthcare facilities, but also divested in certain businesses related to lighting,
such as TSMC (Taiwan Semiconductor Manufacturing Company), and to image and sound such
8
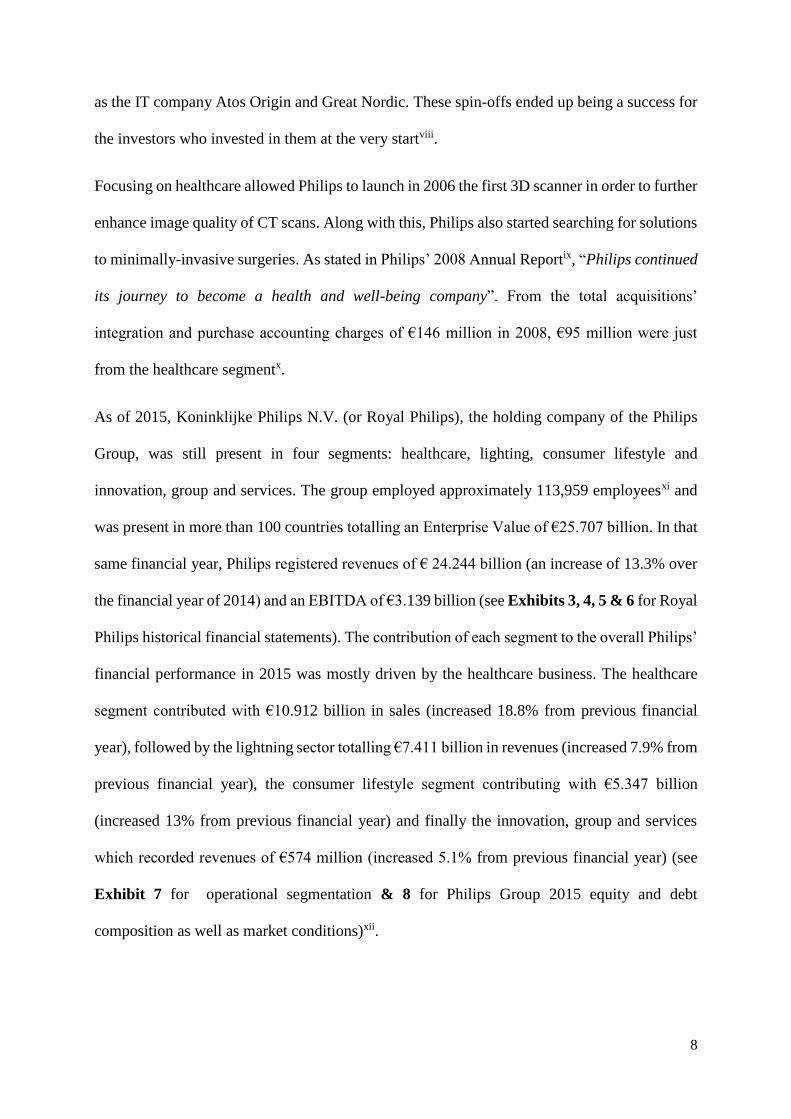
as the IT company Atos Origin and Great Nordic. These spin-offs ended up being a success for
the investors who invested in them at the very startviii.
Focusing on healthcare allowed Philips to launch in 2006 the first 3D scanner in order to further
enhance image quality of CT scans. Along with this, Philips also started searching for solutions
to minimally-invasive surgeries. As stated in Philips’ 2008 Annual Reportix, “Philips continued
its journey to become a health and well-being company”. From the total acquisitions’
integration and purchase accounting charges of €146 million in 2008, €95 million were just
from the healthcare segmentx.
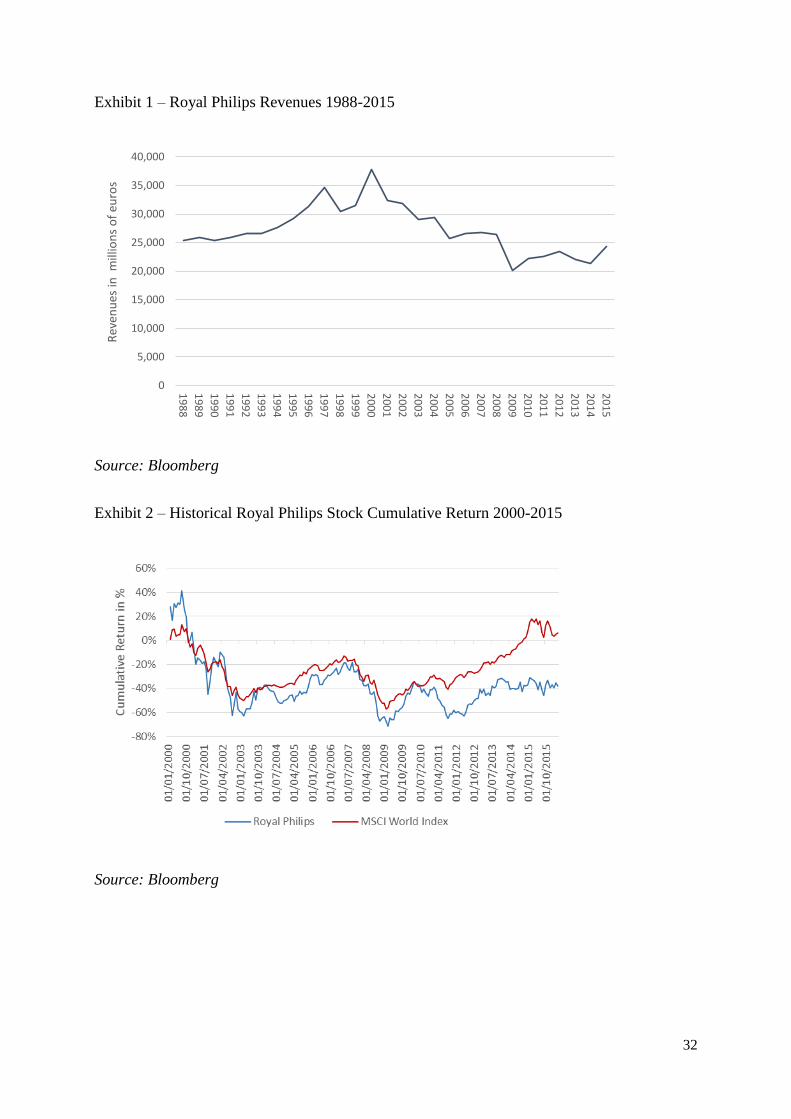
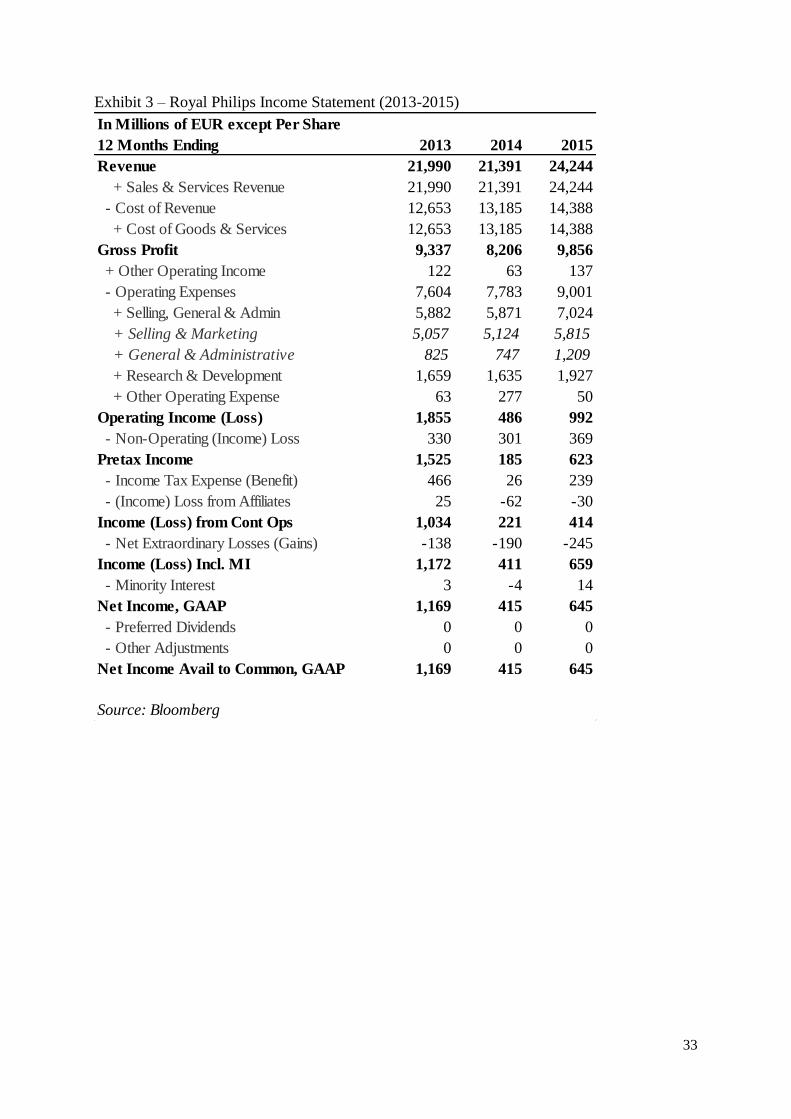
As of 2015, Koninklijke Philips N.V. (or Royal Philips), the holding company of the Philips
Group, was still present in four segments: healthcare, lighting, consumer lifestyle and
innovation, group and services. The group employed approximately 113,959 employeesxi and
was present in more than 100 countries totalling an Enterprise Value of €25.707 billion. In that
same financial year, Philips registered revenues of € 24.244 billion (an increase of 13.3% over
the financial year of 2014) and an EBITDA of €3.139 billion (see Exhibits 3, 4, 5 & 6 for Royal
Philips historical financial statements). The contribution of each segment to the overall Philips’
financial performance in 2015 was mostly driven by the healthcare business. The healthcare
segment contributed with €10.912 billion in sales (increased 18.8% from previous financial
year), followed by the lightning sector totalling €7.411 billion in revenues (increased 7.9% from
previous financial year), the consumer lifestyle segment contributing with €5.347 billion
(increased 13% from previous financial year) and finally the innovation, group and services
which recorded revenues of €574 million (increased 5.1% from previous financial year) (see
Exhibit 7 for operational segmentation & 8 for Philips Group 2015 equity and debt
composition as well as market conditions)xii.
9
AMS Capital
Luuk de Vries started his career at the age of 22 when he was admitted at Goldman Sachs in
Amsterdam as an M&A analyst. During his journey there, he was able to get into several
projects related to spin-offs, divestitures and some other restructurings. De Vries stayed there
for ten years and the learning and knowledge he retrieved from his first job were immense.
Despite being successful at his job and being passionate about the M&A world, de Vries wanted
to try something new where he could possibly add value with his knowledge. In January 2016,
at the age of 32, de Vries was hired as Portfolio Manager at AMS Capital, a hedge fund
headquartered in Amsterdam. AMS Capital main strategy was to usually invest in distressed
companies on the verge of bankruptcy by buying the company’s junk bonds at a very low price
and selling them at a much higher price or alternatively, becoming a shareholder of the company
after the restructuring process.
AMS Capital had been for years a renowned player in the Dutch hedge fund industry but in
more recent years had been struggling for positive performance results. De Vries had just landed
in his new job and the last thing he wanted was to work in a place with decaying reputation.
Hence, he started looking in the market for good investment opportunities that could potentially
leverage again AMS Capital reputation in the Dutch hedge fund industry. However, a bad
recommendation could be critical for de Vries’ reputation.
When rushing through all the news, he read that Royal Philips was about to carve-out and list
its lighting business, through an IPO, by mid-2016. This move was frequently named by the
press as a spin-off, but in fact, it was more similar to an equity carve-out. From his knowledge
in spin-offs, he knew that shares of spun-off companies tended to perform very well and were
a good source of short-term profits. To re-assure himself that he was right, he rushed to his
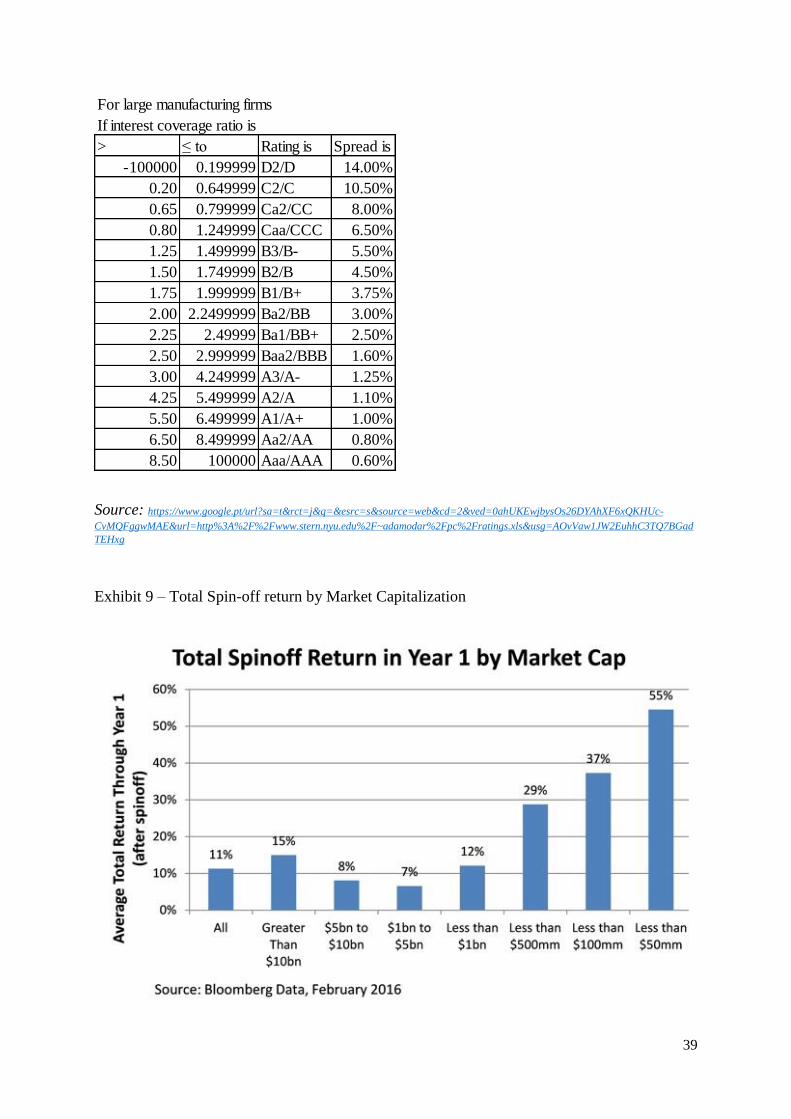
Bloomberg terminal to see the past performances of spin-offs (see Exhibit 9). The results were
10
along with what most studies find: spun-off companies out-perform the marketxiii. De Vries also
knew that this investment was not in line with the usual investment policy of AMS Capital but
would the investment become a success and he would for sure be promoted in the near future.
It was then time to convince the Chief Investment Officer, Vincent Schuuring, to invest in
Philips Lighting shares.
Light and Lighting Bulbs Industry
It goes back to the 1870’s when the first experiments, to build a lighting bulb, conducted by
Thomas Edison and Joseph Swan took place. Throughout the years, the main goal within this
industry was to constantly develop and create new methods to build more efficient light bulbs
that could last longer at a lower production cost. This market grew and innovated itself at a high
pace. From fluorescent lamps to compact fluorescent lamps (CFL) the market was expanding
to satisfy the needs of a growing population. When stepping into the 21st century, one of the
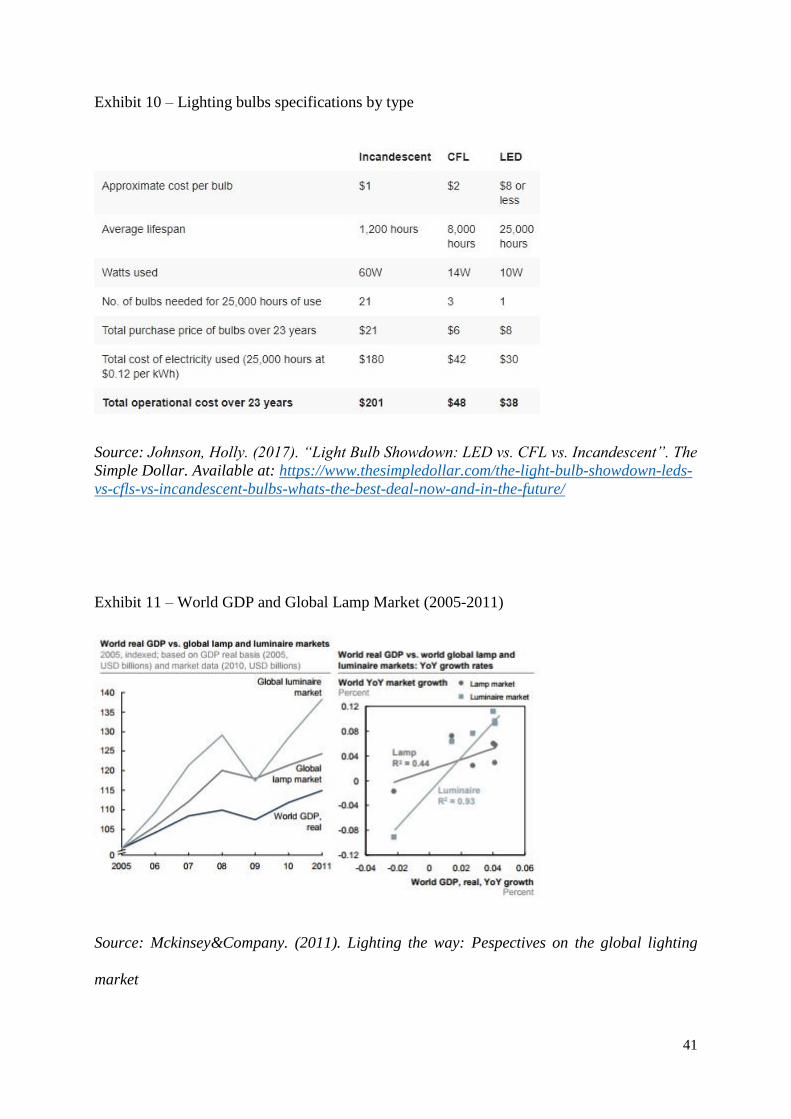
fastest develop lighting technologies was the light-emitting diode (LED) bulbxiv. It presented
itself as the most efficient light on the market (see Exhibit 10 for comparison of different types
of light bulbs)xv. Despite being a growing industry, customers were sensitive to prices. In mid-
1980’s, the first CFLs introduced in the market were being sold at retail prices of $25-35 which
made consumers react very negatively. Only after almost 30 years later would new CFL bulbs
be created and be sold at a unitary cost of $1.74.
Since previous years that was quite clear to see that the global lighting market had a positive
high correlation with the global GDP (see Exhibit 11)xvi which to a certain extent helped to
better understand the future of this industry. Whereas the conventional lamps industry showed
to be a consolidated industry with major players being General Electrics, Osram and Philipsxvii,
the LED lighting market presented itself to be a very dynamic one with fierce competition from
Asian countries. In recent years, countries worldwide had been adopting political measures in

11
what regarded specific technologies in the lighting market. The EU began to accelerate the
switchover to more ecological lighting sources by extending its regulations to ban low-voltage
halogen lampsxviii. That posed a risk to the future of traditional lighting bulbs in the market.
By 2010, the overall lighting market registered approximately $99 billion in revenues and four
years later, in 2014, registered $112 billion. The main growth drivers, in geographic terms, were
China and Latin America accounting in 2014 for approximately 70% of the market share. The
same analysis was applied to the lamp market (a sub-sector of the lighting market) that had
revenues of approximately $15 billion and two years later saw its value increase to
approximately $17 billion (see Exhibit 12 for the outlook of both the Lighting and Lamp
markets)xix. Despite such increase, the fact that modern lamps could last much longer was
causing a reduction in the number of times a customer had to switch lamps. Furthermore, the
LED sector was experiencing a price erosionxx where prices were expected to drop from €4.52
in 2014 to €2.26 in 2020 (a 50% drop)xxi. Revenues in the lighting sector were forecasted to
grow at 3% annually mainly driven by LED-based solutionsxxii.
As of 2016 the lighting market had a broad range of products: conventional lamps
(incandescent, halogen, fluorescent and HID lamps); LED lamps; Luminaires (electrical
devices that produce, control and distribute light); Electronics (units which regulate the current
going through a light source); lighting systems (combination of luminaires, controls and
software) and other lighting systemsxxiii.
Healthcare Industry
The growth this sector was experiencing was immense, especially due to its combination with
technology (healthtech) and by 2002, its worldwide market size was approximately $304.606
billionxxiv. The Healthcare industry presented to be very capital intensive as the total spending
in this sector accounted for 10.4% of the total world GDP in 2015, which corresponded to
12
approximately $7 trillionxxv. Alongside the sector’s growth, M&A activity in this sector was
also rising (see Exhibit 13 for related big deals). In the past recent years, it had been observed
that chronic diseases were rising with special focus to cardiovascular, cancer and respiratory
diseases. Life expectancy had been increasing, causing bigger efforts and investments to treat
more and more citizens. Reaching 2016, the major trends in the healthcare industry were the
rising drugs’ prices (rise of 9% in generics in 2014), the business consolidation through
numerous mergers (following the trend of 2015), the appearance of health apps such as Teladoc
which saw its membership increase from 1.9 million in 2013 to 8.1 million in 2014, derived
from the market penetration of health apps, cybersecurity was becoming more important than
ever and finally, more and more, healthcare was becoming a political aspect especially between
republicans and democrats in the USAxxvi.
In 2016, this sector reached a market size of $703.647 billion, reflecting a growth rate of 131%
between 2002 and 2016 (see Exhibit 14)xxvii. Even though, this sector was still in need for more
innovation and, as of 2016, governments, health plans and life science companies were
experiencing higher costs with inconsistent resultsxxviii.
Philips plans to split itself in two:
It was September 2014, and Philips took the strategic decision to sell its lighting businessxxix.
The Dutch Conglomerate announced its interest in splitting Philips into two companies: one
focused on healthcare and technology (healthtech), and the other one on lightingxxx. The group
believed each sector had its particular customer needs, trends and value drivers. According to
Philips, the management team was still trying to figure out if an IPO would be more beneficial
or not for shareholder value creation than a direct sale to an investorxxxi:
“I do appreciate the magnitude of the decision we are taking, but the time is right to
take the next strategic step for Philips, as we continue on our transformation, to become the
13
global leader in HealthTech and shape the future of the industry, we will combine our vibrant
Healthcare and Consumer Lifestyle businesses into one company. At the same time, giving
independence to our Lighting solutions business will better enable it to expand its global
leadership position and venture into adjacent market opportunities.”
Frans van Houten, Royal Philips CEO, London meeting, Sep. 2014
Philips’ shares had been underperforming the market and were down 9% in 2014. After
becoming public Philips’ intention to sell its lighting business, its shares rose to €24.07 in
Amsterdamxxxii, reflecting an increase of approximately 4%.
Philips had already previous intentions to divest the lighting business. As of 2014, Royal Philips
combined the Philips Lumileds LED components and automotive lighting components
operations into a stand-alone companyxxxiii. Plus, Philips tried to sell an 80.1% stake of
Lumileds to a consortium led by GO Scale Capital, a Chinese investment fund, which was
offering $2.9 billion for the business stakexxxiv. Despite strong efforts by both parties to seal the
deal, the US authorities did not authorize the salexxxv. According to Philips, the company was
not allowed to disclose the real reasons for such deny by the Committee on Foreign Investment
in the United States (CFIUS), despite the major publicly known cause being concerns with
national securityxxxvi. Such failure in the sale of Lumileds acted as a sort of repellent for
potential buyers for the lighting businessxxxvii. Hence, only after more than half a year did Philips
announced the IPO, after failing to find a buyerxxxviii.
The separation was publicly announced on the 12th of March 2015, when Frans van Houten,
Philips’ CEO and Chairman of the Board of Management since 2011, announced that Philips
was planning to sell its lightning business to the public through an IPO on Euronext Amsterdam
which would take place the following yearxxxix. Despite becoming two separate distinct
companies, both (Royal Philips Electronics and Philips Lighting) would launch new products

14
under the same brand: Philips. A brand that had strong reputation and that in 2015, for the fourth
year in a row, was considered the most preferred one in LED lighting globally, both in
professional and consumer categoriesxl.
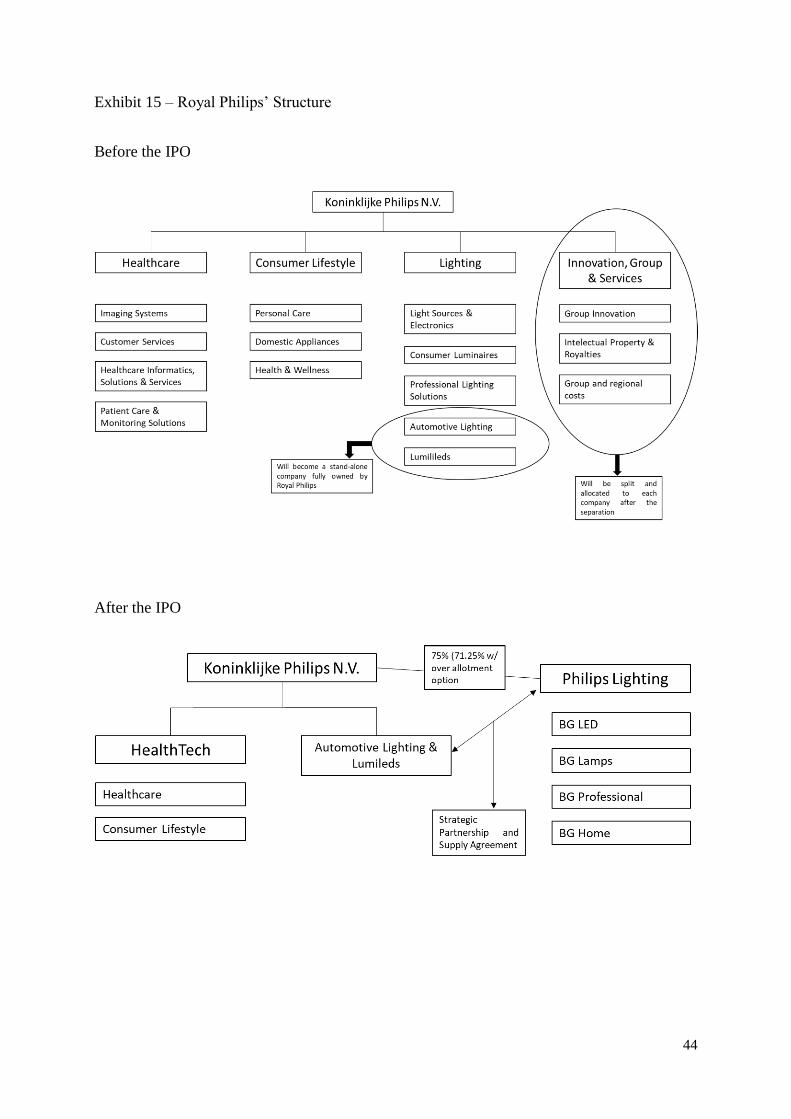
After the split, Royal Philips would run the Healthcare and Consumer Lifestyle businesses
alone, while Philips Lighting would run separately the lighting business with four main
different business groups: BG Lamps (the one corresponding to traditional lamps), BG LED,
BG Professional and BG Home. However, the Lumileds would still continue to be part of Royal
Philips. The parent company wanted to seek other strategic options to attract capital from third
party investors for Lumiledsxli. Thus, any transaction related to that business would go for the
account of Royal Philipsxlii. Despite a separation from the lighting business and Lumileds, both
entities established a strategic partnership and supply agreement1 whereby one was supplier of
each other (Lumileds would supply LED components and Philips Lighting would supply other
lighting components)xliii.
The market participants debated on the reasons behind the split. Frans van Houten assured that,
first of all, the proceeds from the IPO would be used to finance the growth on the healthcare
businessxliv. Secondly, that sale could help to eliminate the so well-known conglomerate
discount, benefiting Philips’s future valuations. Hans Slob, Rabobank analyst, corroborated
saying “it will eliminate the conglomerate discount, I always used a 5 percent discount for the
sum of the parts valuation”xlv.
According to what was agreed in a shareholder circular, Philips would initially only offer a
minority interest of 25% (37.5 million shares) in the IPO followed by more future offers which
would ultimately lead to a total divestment of the lighting businessxlvi (see Exhibit 15 for Royal
1 The agreement contains a purchase commitment whereby Philips Lighting is entitled of purchasing from Lumileds at least 60% of its actual
spend in LED components for a period of four years beginning in February 1st, 2016. The price was provided “inter alia” meaning that the
price had to be equal or below the prices practiced by other relevant suppliers. Under the case where the price is higher than the competitors’, there is another separate compensation agreement between Philips Lighting and Royal Philips.
15
Philips’ structure after the IPO). On February 1st, 2016, occurred the “Separation Date”
between the selling shareholder and the newly named company Philips Lighting Holding B.V.,
the holding company of Philips Lighting. It allocated assets, liabilities, employees and contracts
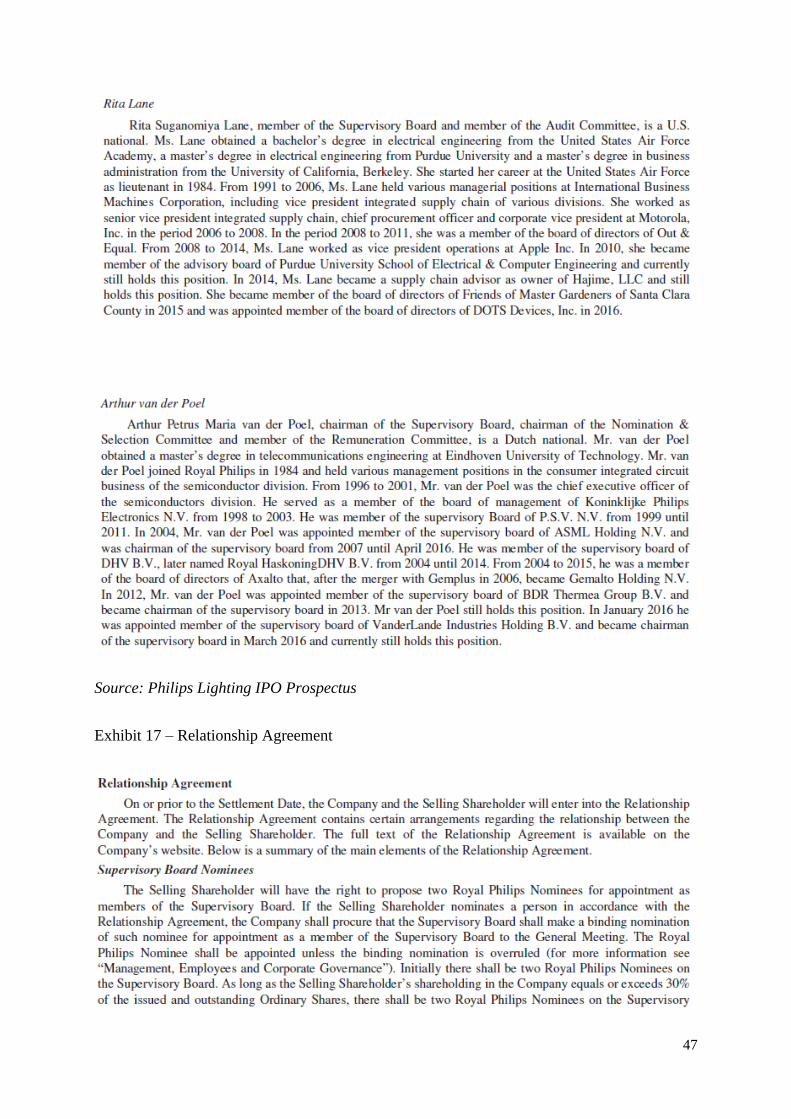
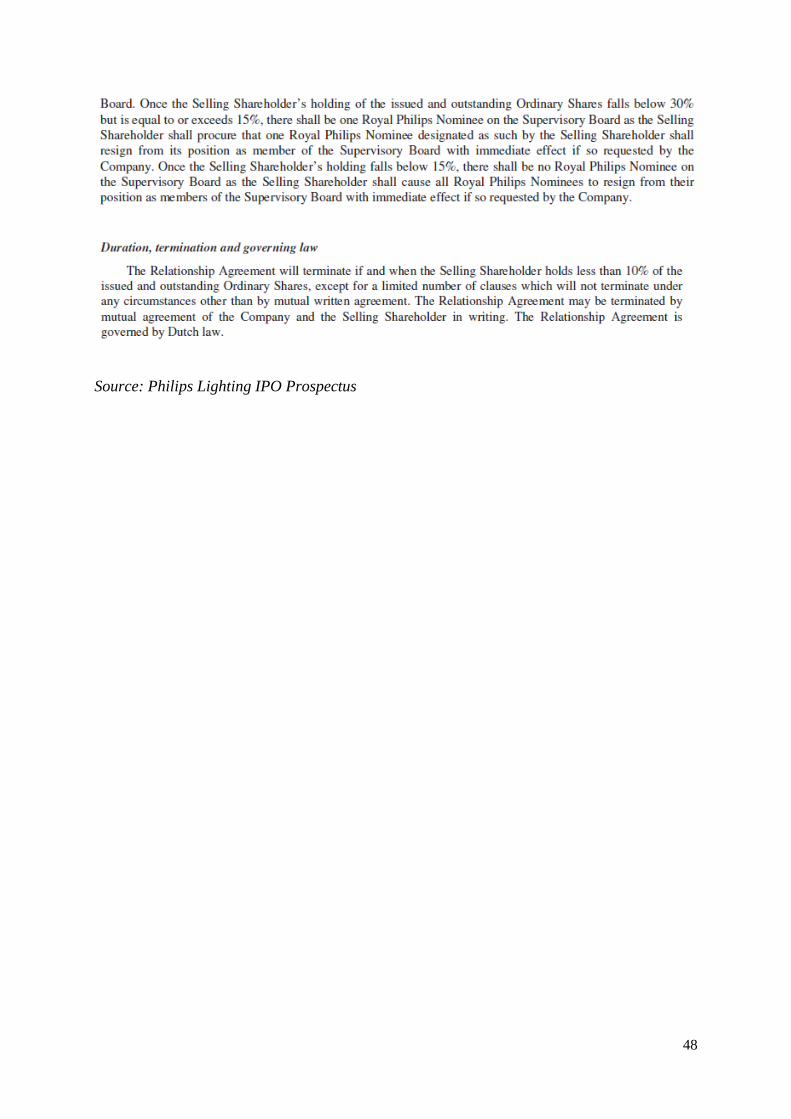
of the former Royal Philips between the new Royal Philips and Philips Lighting. With the
separation, however, a “Relationship Agreement” will be binding the two companiesxlvii (see
Exhibit 16 & 17 for governance structure and the relationship agreement).
“Today’s announcement is an historic one for Philips as we aim to separate our
company into two market-leading companies focused on capturing opportunities in health
technology and connected LED lighting solutions markets, respectively. We believe that the
recent performance of both companies demonstrates that the fundamentals are in place for
long-term profitable growth and that Philips Lighting is well positioned for success as a stand-
alone company”.
Frans van Houten, Royal Philips CEO, Philips Lighting ITF Press Release
Philips Lighting
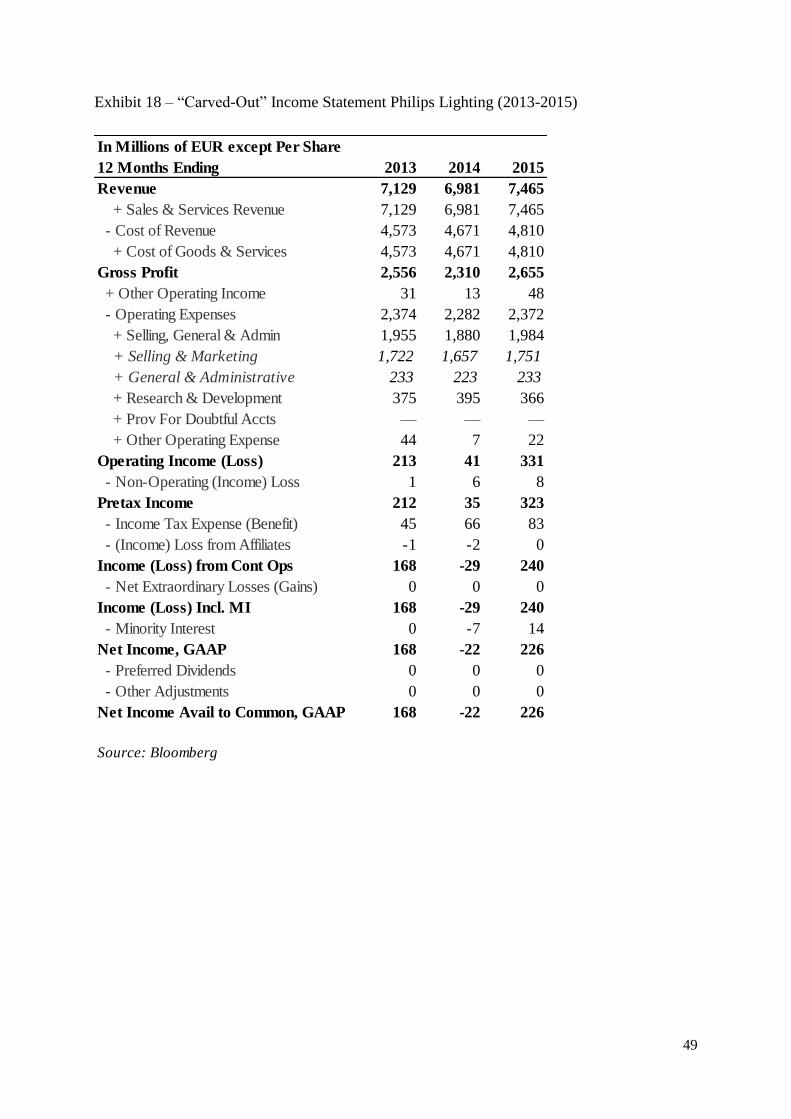
Philips Lighting reported in the year end of 2015 an EBITDA of €646 million2 and its EBIT
amounted to €331 million for the same period (see Exhibit 18 & 19 for Philips Lighting
historical financial statements). Philips Lighting seemed to be well positioned in the sector as
the average EBITDA of the industry was €302.91 million3 (see Exhibit 20, 21 & 22 for peers’
performance and also Royal Philips’ peers)xlviii. By the time of the IPO, Philips Lighting was
expected to have a net financial debt of €950 million which would represent approximately 1.5x
2015 EBITDA4, a multiple way above the sector average of 0.5x EBITDA. The company was
2 The company defines EBITDA as income from operations excluding depreciation, amortization, and impairments of non-financial assets. 3 The average EBITDA of the industry was calculated through a weighted average (by Market Cap) of the Bloomberg referenced competitors
EBITDAs. 4 Philips Lighting realised an EBITDA of €646 million for the year ended 31 December 2015. The ratio assumes approximately €300 million
of cash on balance sheet post completion of the Offering.
16
targeting an annual dividend pay-out ratio from 40% to 50% of the continuing net income5
which would be paid out annually in cash starting in 2017xlix.
Philips Lighting had been investing heavily in R&D to stay at the forefront of technologic
advances. As so, in 31 December 2015, it registered expenses in R&D of 4.9% of its salesl.
Consequently, by the end of 2015, the group had 14,000 patents, a number well above its
competitors. Philips Lighting, in line with Royal Philips’ overall growth strategy, was also
betting on inorganic growth acquiring other companies. As of the end of 2014, Philips had
invested €248 million compared to €178 million in 2013. By the end of 2015, cash for investing
activities amounted to €65 million (see Exhibit 23 for Philips Lighting Cash Flow Statement).
In the first quarter of 2016, BG Lamps unit accounted for most part of the sales amounting to
€615 million, a substantial higher sales value compared to BG LED with almost half of the size
with €355 million in sales (see Exhibit 24). As per geographical cluster, sales in Philips
Lighting have been shifting moderately (see Exhibit 25 for sales by geographical cluster).
As most of its sales were from lamps and not LED’s, Philips had a problem to solve and it was
urgent. The manufacturing plants Philips Lighting had by 2015 were predominately for
conventional lamps which differed significantly from the ones required for LED lamps. From
a total of 60 manufacturing plants in 2008, Philips Lighting was able to reduce its 45
manufacturing plants for traditional lamps to 21 in 2015li. For such to happen, Philips had to
incur in restructuring costs amounting €261 million in the year end of 2014 and €90 million by
the end of 2015. This restructure of manufacturing plants would potentially result in additional
future restructuring costs related to depreciation and impairments, environmental concerns and
transfer and dismissal of employees.
5 Continuing net income is defined as recurring net income from continuing operations, or net income excluding discontinued operations and
excluding material non-recurring items.
17
Analysing the opportunity: would it be worth?
After reading the news, de Vries started searching and analysing the lighting market as well as
Philips Lighting overall performance. Days later, he recalled that Siemens, one of Philips’ main
competitors, had also divested its lighting business, Osram, back in July 2013. It was time for
de Vries to gather some info on the past performance of Osram shares. Overall, M&A activity
in the lighting market was high as industry players wanted to build scale as the market advanced
towards intelligent lighting solutions (see Exhibit 26 for industry related transactions).
Osram issued 104.7 million shares (equivalent to 80.5% of the company’s total shares while
Siemens retained the remaining percentage) at €24.0 eachlii, valuing Osram at €2.5 billion (or
approximately 7.8x6 EV/EBITDA 2012)liii, a considerably lower value compared to the €3.23
billion Siemens was initially expecting. This IPO was particularly difficult as Siemens had been
trying to sell Osram through an IPO since 2011. Due to the lighting market slowdown, the stock
market was too volatile for Siemens to risk it all, making it calling off the IPO several timesliv.
De Vries went further and looked in Bloomberg for Osram stock performance after the listing
date (see Exhibit 27 for Osram stock performance).
When deepening its research about this possible opportunity in making part and subscribing the
IPO, Luuk de Vries thought to himself that it would be better to see how the past performances
were in past Dutch IPOs. What he found was, at least, intriguing. De Vries found that there had
been an average initial under-pricing level of 17.6% and that the median initial return was 5%,
while in 17% of the cases the initial returns were negative. Moreover, in the beginning of 1997
to the 2000’s, the level of under-pricing by the end of the first trading day was 35.8% where
the IPOs significantly underperformed their sector-specific benchmark by 38.4% after 3 yearslv.
6 To reach an EV/EBITDA multiple of 7.8x, it was added to the market capitalization of €2.5 billion, Osram Lighting 2012 Net Debt of
€595.3 million to reach an EV of €3.0953 billion. Subsequently, it was divided by its 2012 EBITDA of €395.4 million.

18
As the IPO date was approaching the market was reacting in the meantime. Contrary to the
beliefs of the CEO, Mr. van Houten, analysts at Jefferieslvi, an investment bank headquartered
in New York, believed that Philips Lighting would have a difficult future as a stand-alone
company due to the fact that 85% of its profits were coming from the sale of traditional bulbs,
a market that was shrinking with the rise of LED lamps sales. Moreover, Barclays analystslvii
were fearing the slow pace of the lighting divestment, considering it would take longer for
Philips to improve its remaining businesses which accounted for two thirds of the Dutch
conglomerate’s revenues. During the period after the announcement of the demerger of the two
companies, Daniel Cunliffe, analyst at Liberum Capital, stated “what I’ve heard is [an
enterprise] valuation of up to €5.5 billion [for Philips’ lighting business]”lviii.
On May 16th, Royal Philips announced in a press release that Philips Lighting shares would be
offered at a price range between €18.50 and €22.50lix. That range was valuing the business at a
market capitalization between €2.78 and €3.38 billion. According to the new company’s CEO:
“The interest we have received from the investor community in Philips Lighting is very
encouraging. As a standalone, listed company we will be committed to further expanding our
global market-leading position in the general lighting market, driving the transition to LED
and connect lighting systems and services, and delivering on our financial outlook. With a
strong cash flow generation, we believe we present a solid investment case”.
Eric Rondolat, Philips Lighting CEO, IPO Launch Press Release
Moreover, the company granted the underwriters, as part of the offering, an over-allotment
option for up an additional 15% of the number of offered shares (“Over-Allotment shares”). In
sum, would the option be converted and the total amount of shares offered would account for
28.75% of the total shares. Both companies, after the split, would be subjected to a lock-up
period of 180 days and Philips’ Board of Management (CEO and CFO of both companies)
19
would be subject to a lock-up of 360 days. The lock-up period makes it impossible, without
permission from the Joint Global Coordinators, to sell, directly or indirectly, ordinary shares
within the period settled. The intentions of Royal Philips consisted in selling the shares to
institutional and retail investors in the Netherlands and to other certain qualified institutional
investors in other countrieslx.
The Decision
It was May 16th and de Vries had to hurry up to decide what to do with all that information he
had gathered for the past month as the offering period had started at that day, 9 a.m., and would
cease for institutional investors by May 26th, 12 a.m.. De Vries had to be quick especially
because he had still to convince Vincent Shuuring to participate in the IPO would he decide
that it was a good opportunity. More than convincing Shuuring to buy at the IPO, de Vries had
also to decide which strategy would better suit this IPO. After all this search during the past
month, should de Vries try to convince Vincent Shuuring to buy at the IPO? At which price? If
yes, should he recommend to flip the stock (buy at the IPO and sell immediately in the first day
of trading) playing with the possible IPO discount? Or would it be more beneficial in this case
to hold longer the stocks as data pointed to good returns for spun-off companies? However, de
Vries knew that this was not a spin-off as the media frequently referred to. Hence, if he decides
not to recommend to buy at the IPO, should they short sell the stock as future prospects for
Philips Lighting were challenging?

20
Teaching Note

21
The following case study has the objective of studying the situation involving Royal Philips,
Philips Lighting and the fictitious Portfolio Manager of AMS Capital Hedge Fund, Luuk de
Vries, as of May 2016. The case will focus on Demerger, Initial Public Offering (IPO), Equity
Carve-Out and Investment Strategy Decisions subjects, making this case appropriate to study
in courses such as Applied Corporate Finance and Mergers & Acquisitions. When solving this
case, students should understand the concept of IPO, the strategic reasoning behind selling
Philips Lighting and the investment opportunities this sale has for profit seeking investors. A
set of proposed questions follows, together with the suggested answers.
1 – Why is Royal Philips selling its lighting business? Why are they selling equity instead
of raising debt in the capital markets? Relate it with Royal Philips Operating
Performance ability to sustain Value Creation.
Part 1 – Why are they selling?
Philips’ culture relied on divesting and selling businesses that struggled to succeed in the
market. Its failure in introducing the CD-Interactive led Philips to understand that a shift in its
strategy was necessary. Therefore, in the 90’s Philips reshaped its operations and began
focusing on the healthcare industry. This industry presented itself to be very attractive and with
potential to grow a lot. By looking at Exhibit 14, it is possible to see how fast the market grew.
On top of that, as stated in the case, this industry had trends that forecasted long term growth
and it was an industry that was still in need for more innovation (contrary to the lighting market
that, by looking at Exhibit 12, shows to be a market with few opportunities). Royal Philips had
already assumed itself as a healthcare company which is noticeable in their 2008 financial
report: “Philips continued its journey to become a health and well-being company”. Looking at
Exhibit 7, it is visible the more prominent importance of the Healthcare sector for Royal Philips
overall performance. Healthcare was contributing with 45% of the total EBITA of the three
businesses combined whereas the Lighting sector was just accounting for 26%.

22
Finally, as observed in Exhibit 2, Royal Philips was underperforming the market in the later
years. Hence there was pressure to do something and reshape the management team and focus.
Two key metrics that provide extremely important information on company’s value creation
are the ROIC (Return on Invested Capital) and the WACC (Weighted Average Cost of Capital).
If WACC is greater than ROIC, then the company is destroying value.
To infer if Royal Philips was indeed destroying value, first it is going to be calculated its WACC
followed by its ROIC. Based on Exhibit 8, one can retrieve the main metrics to calculate the
WACC. As shown in TN Exhibit 1, first, one needs to calculate Royal Philips’ cost of equity
using CAPM model giving a cost of 9.80%. For the cost of debt, it was used Royal Philips’
credit rating for senior debt of BBB+. The spread was then retrieved from the table in Exhibit
8 (correspondent to the credit rating) and added to the risk free rate. The market value of equity
was reached by multiplying its share price by the total number of outstanding shares giving a
value of about €21.606 billion. Finally, to reach the market value of debt, it was assumed the
book value of debt (interest bearing) and treated as a one coupon bond with a coupon set equal
to the interest expenses on all debt and the maturity set equal to the face value weighted average
maturity of debt. The coupon was discounted at the cost of debt of the company. With all the
calculations shown on TN Exhibit 1, a market value of debt of about €6.830 billion is reached.
Assuming corporate taxes of 38.40%, and using the WACC formula, Royal Philips has a
WACC of 7.87%. Additionally, an alternative WACC formula was used to strengthen the
analysis. As for the ROIC, the formula used was (Op.Income*(1-t))/(NWCR+Fixed Assets).
For the Operating Income, an average of the last three years was used to account for the
substantial volatility presented. Based on TN Exhibit 1 calculations, Royal Philips has a ROIC
of 3.03%. Therefore, one can see that Royal Philips was indeed destroying value. In situations
like this, the management team is put under pressure to improve the ROIC which is commonly
done by selling non-performing assets in order to get the ROIC in line with WACC (TN Exhibit

23
1 also shows comparison between value creation of Healthtech business versus the Lighting
one).
Another reason that could be behind this strategic sale is the possible conglomerate discount
being applied to Royal Philips’ stock. Khorana et al (2011)lxi debate on this recent trend where
companies go under corporate restructurings to increase corporate values. More on this will be
analysed in Question 3.
Part 2 - Why selling equity instead of raising debt?
According to Ali, Hashmi and Mehmoodlxii (2016) findings, there is an inverted u-shaped
relation between diversification strategy and performance where too much diversification
creates agency problems and internal inefficiencies. Royal Philips was more in need of
narrowing its scopelxiii than asking for debt in the market as previously founded with ROIC and
WACC comparison. In addition to that, according to a McKinsey&Companylxiv article that
debates about Equity Carve-Outs, they enable full strategic freedomlxv and access to
independent fundinglxvi. According to Frans van Houten, this was their intention:” At the same
time, giving independence to our Lighting solutions business will better enable it to expand its
global leadership position and venture into adjacent market opportunities”. This would
potentiate Philips Lighting future transactions. However, despite carving-out the lighting
business, Royal Philips would still hold 75% of the shares. Royal Philips interests were in fact
still dependent on Philips Lighting performance. Consequently, for a carved-out company, it
can use stock option compensations to improve the company’s performance as they are the
significant part of the total compensation to carve-out executives. This would work as a sort of
mechanism to align interests.
To conclude, in this case, the sale of Philips Lighting works in three ways: enables Royal Philips
to focus in HealThech (gradually, since they would still hold 75% of lighting and probably this
24
focus would not be so visible in the beginning), secondly, uses the proceeds of the sale to
finance investment in its HealthTech business and third it can possibly improve Royal Philips
future valuations. Following this reasoning, selling equity makes more sense than simply
issuing bonds (debt financing) to boost their HealthTech business.
2 – What is the relation between Royal Philips and Philips Lighting after the IPO? Is
there any specificity regarding Corporate Governance?
After the IPO, Royal Philips would hold 75% of Philips Lighting. The ownership structure can
be seen in Exhibit 15. Despite being two distinctive companies after the “Separation Date”,
both entities would launch their products under the same brand: “Philips”, as it would be
advantageous for both companies since “Philips” was a strong brand in the market, and more
important, it was considered the most preferred one in LED lighting globally. This would
potentiate Philips Lighting initial performance as a stand-alone company. Furthermore, assets,
liabilities, employees and contracts of the former Royal Philips were allocated between the new
Royal Philips and Philips Lighting.
By operating in the LED business, Philips Lighting had to maintain a relationship with the
Lumileds and automotive lighting components businesses, which were not included under
Philips Lighting operations, (remained under 100% ownership of Royal Philips) but worked as
its supplier. The strategic partnership and supply agreement contains a purchase commitment
whereby Philips Lighting is entitled of purchasing from Lumileds at least 60% of its actual
spend in LED components for a period of four years beginning in February 1st, 2016. The price
was provided “inter alia” meaning that the price had to be equal or below the prices practiced
by other relevant suppliers. Under the case where the price is higher than the competitors’, there
is another separate compensation agreement between Philips Lighting and Royal Philips.
25
Finally, in terms of governance, Philips Lighting will have its own structure as it can be seen in
Exhibit 16. It is a two-tier board structure consisting in a Board of Management and a
Supervisory Board. The board of management is independent of Royal Philips. However,
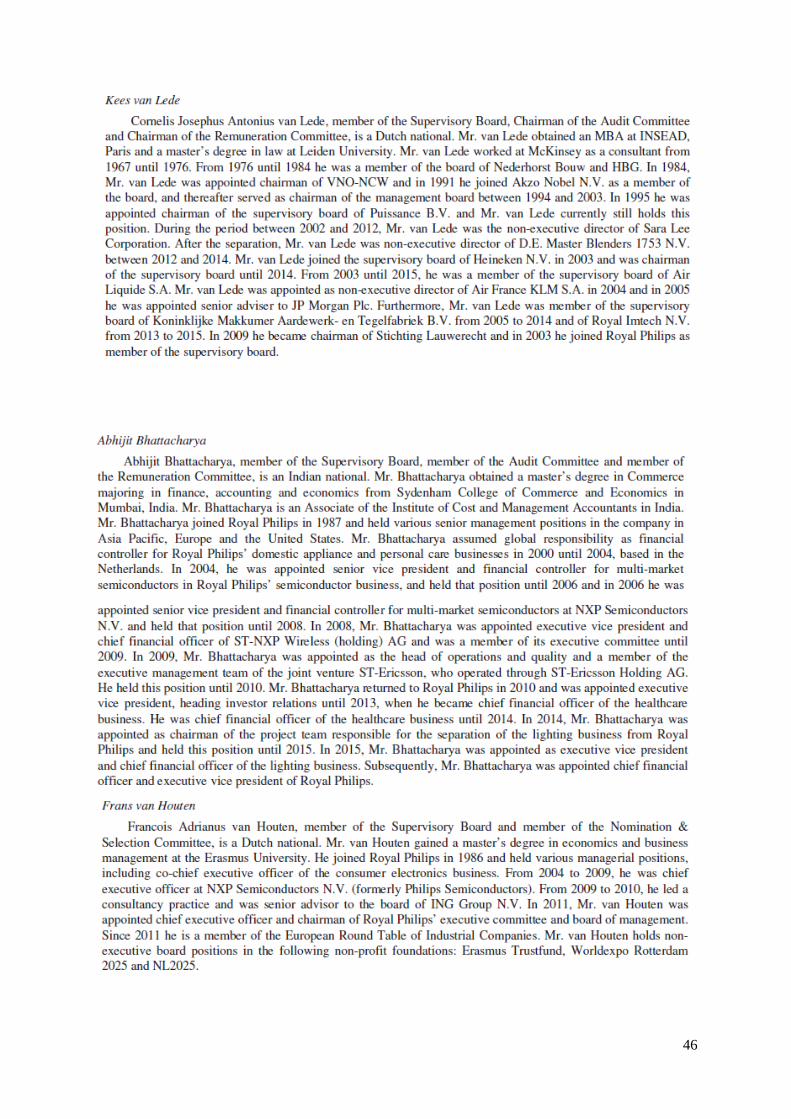
several members of the supervisory board were also executives at Royal Philips. Kees van Lede
was since 2003 member of the supervisory board of Royal Philips, Frans van Houten, at that
time was CEO and Chairman of Royal Philips and Abhijit Bhattacharya was CFO and executive
vice president of Royal Philips. This aspect comes from the Relationship Agreement whereby
Royal Philips, holding more than 30% of Philips Lighting, had the right to nominate two
members to the Supervisory Board. This aspect of governance relationship between parent and
carved-out company is debated by Koller (1990)lxvii. When the parent still holds a controlling
stake in the newly carved-out company, the parent’s executives make sure that the best interests
of the company and shareholders are met. This agreement certifies Royal Philips that Philips
Lighting takes the right decisions for a strong future performance as they still own 75% (or
71.25% with the over-allotment option) of Philips Lighting shares and want to assure they do
not incur in losses.
3 – What is a conglomerate discount? In this case, do you consider Royal Philips is
suffering from it?
Part 1 – What is a conglomerate discount?
Years ago, companies started acquiring different businesses saying it would allow them to
create positive synergies: through cost reduction, risk diversification and revenue upside by
selling complementary products. Along with this phenomenon, another one, related to
conglomerates’ valuation appeared: the conglomerate discount. The conglomerate discount is
nothing more than the conglomerate’s stock price being undervalued relative to its pure-play
competitors. A way to calculate it is by summing up the intrinsic value of each subsidiary and
subtracting the enterprise value of the conglomerate. According to Ingo Walter (2004)lxviii, there
26
seems to exist two main reasons for such to happen. First, it is argued that management allocates
capital inefficiently and foregoes positive NPV projects by not being able to focus on each
business. Secondly, investors usually lack to “have a view” on the pureness of one of each
leading them to avoid these types of stocks.
Part 2 – Does Royal Philips suffer from conglomerate discount?
To evaluate if there is in fact a discount being applied to Royal Philips, it needs to be analysed
if the sum of the parts (Royal Philips in Healthtech and Philips Lighting) is worth more than
the prior conglomerate of Royal Philips. For this measurement, a modified variation of Berger
and Ofek (1995)lxix is going to be used. This version, compares the EV’s of the parts to avoid
possible cash distortions (especially in European conglomerates) that could arise from market
capitalizations (Bernhard and Carsten (2003))lxx. For such, the valuation approach used is going
to be the multiples valuation. The reasons to forego the Discounted Cash Flow Method are the
uncertain, difficult to estimate and high growth rates for the Healthtech industry. Hence, using
the DCF method could induce weak and misleading valuations. To calculate the EV of each
company, it is going to be used the EV/EBITDA as well as the EV/EBIT multiple. According
to a research conducted by McKinsey&Companylxxi, P/E multiples do not account for capital
structure and are based on earnings which include many non-operating items. Regarding the
EV/Sales multiple, it is only useful when companies are recent and with relevant revenues
growth, which is not this case. Hence, the EV/EBITDA poses to be the most appropriate one as
it corrects for the up mentioned problems. The use of EV/EBIT is to account for depreciation
and amortization allocation since healthcare and lighting pose to be capital intensive sectors
and will have high amounts of D&A. To choose comparable peers for each company, several
steps will be taken: analyse which ones have the same core businesses, infer which ones have
comparable and similar relevant sizes and also which ones have the same growth prospects.
Presented also in the case, Exhibits 13 & 26 show similar transactions of companies from the
27
sector of heathtech (medical devices) and lighting (despite lower deal sizes, those are the best
proxies as, according to IMAP research in 2016, the average deal value was $38 million).
Alongside the trade multiples of comparable companies, one may also use transaction multiples
to strengthen the valuation.
Taking into consideration the up mentioned criteria, for Philips Lighting (with revenue growth
of approximately 6.93%), Acuity Brands Inc, Zumtobel Group AB and Osram Light (despite
the negative growth, it is the biggest Philips Lighting’s competitor) will be used as comparable
firms for valuation. Based on TN Exhibit 2 a football field is built to find a range where Philips
Lighting EV can be. Shown in TN Exhibit 3, one can analyse the football field drawn. Solely
based on such information, it is possible to range Philips Lighting EV between €3.33 billion
and €7.77 billion. For this analysis, the Osram IPO was also included in the transaction
multiples. The EV ranges were based on Philips Lighting EBITDA of €646 million and EBIT
of €331 million.
For Philips Healthtech (which registered a revenues growth of approximately 16.4%), assuming
the same criteria, GN Store Nord, Draegerwerk AG&Co and Carl Zeiss Meditec AG will be
used as comparable firms for valuation. Based on TN Exhibit 4 and TN Exhibit 5, following
the same logic and method used in Philips Lighting valuation, Philips Healthtech value would
range between €17.57 billion and €39.32 billion. This valuation assumed €2.492 billion of
EBITDA (subtract €646 million of lighting to the total Royal Philips’ 2015 EBITDA of €3.139
billion) and an EBIT of €535 million. Therefore, the sum of the parts gives an EV ranging
between €20.90 billion and €47.09 billion. When comparing to the reported EV of Royal Philips
of €25.707 billion it is possible to infer that there is a big likelihood of Royal Philips being
valued at discount (see TN Exhibit 6 for graphical analysis).
4 – How much is Philips Lighting worth? How much should its share price be?

28
To infer how much Philips Lighting is worth, it is required to reach its market capitalization
back from the EV which was already obtained in Question 3.The bridge to equity one needs to
develop to reach market capitalization from EV is to add financial investments and cash (cash
and cash equivalents) and then to subtract debt (including LT Liabilities), leases, preference
shares and minority and non-controlling interests. In other words, it is finding the net debt and
subtracting it from the EV. Based on Exhibit 19, Philips Lighting reached a net debt value of
approximately €743 million. Therefore, subtracting net debt to EV gives Philips Lighting a
market capitalization between €2.59 billion and €7.03 billion. It is left to calculate the total
number of shares. In the case it is highlighted that Royal Philips will sell in the IPO 25% of the
shares which corresponds to 37.5 million shares. Mathematically, one can calculate that 100%
of the shares corresponds to 150 million shares. This returns a price per share range between
€17.26 and €46.87.
5 – Should de Vries convince Shuuring to buy at the IPO? If so, should they hold longer
the stock or sell immediately in the first day of trading? If they opt not to buy at the
IPO, should they short sell the stock?
Buy at the IPO and hold the stock:
There are some facts that turn this investment as a favourable one and others that not. Given
the range between €18.50 and €22.50 per share Royal Philips was predicting to offer the stock,
Philips Lighting was being valued at a market value between €2.78 and €3.38 billion.
Mentioned in the case, Daniel Cunliffe, analyst at Liberum Capital, stated that what was being
debated in the market was an EV up to €5.5 billion. According to Questions 3 & 4 calculations,
Philips Lighting share price range was pointing for an IPO under-pricing. Mentioned in the
case, in past Dutch IPOs in the 2000’s, the under-priced IPOs tended to underperform the
market by 38.4% after 3 years. But there are also facts that turn this investment strategy
desirable. Osram IPO, as it can be seen in Exhibit 27, was a success in the long term. It beat
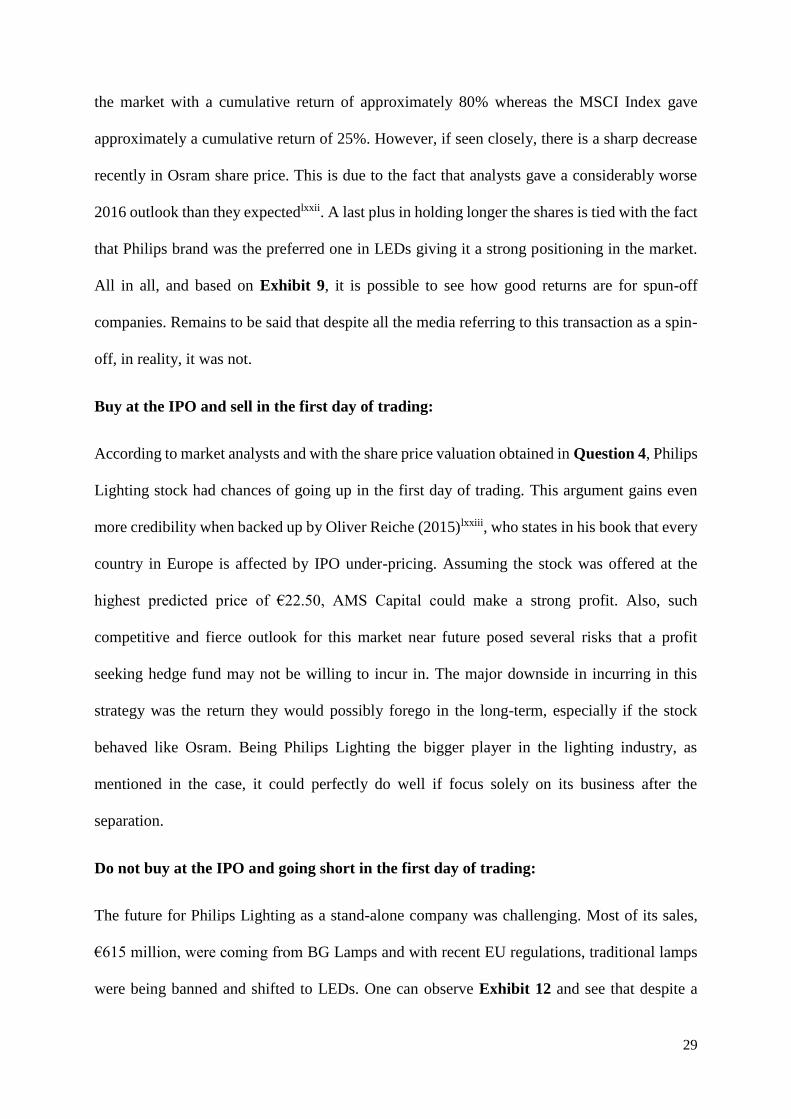
29
the market with a cumulative return of approximately 80% whereas the MSCI Index gave
approximately a cumulative return of 25%. However, if seen closely, there is a sharp decrease
recently in Osram share price. This is due to the fact that analysts gave a considerably worse
2016 outlook than they expectedlxxii. A last plus in holding longer the shares is tied with the fact
that Philips brand was the preferred one in LEDs giving it a strong positioning in the market.
All in all, and based on Exhibit 9, it is possible to see how good returns are for spun-off
companies. Remains to be said that despite all the media referring to this transaction as a spin-
off, in reality, it was not.
Buy at the IPO and sell in the first day of trading:
According to market analysts and with the share price valuation obtained in Question 4, Philips
Lighting stock had chances of going up in the first day of trading. This argument gains even
more credibility when backed up by Oliver Reiche (2015)lxxiii, who states in his book that every
country in Europe is affected by IPO under-pricing. Assuming the stock was offered at the
highest predicted price of €22.50, AMS Capital could make a strong profit. Also, such
competitive and fierce outlook for this market near future posed several risks that a profit
seeking hedge fund may not be willing to incur in. The major downside in incurring in this
strategy was the return they would possibly forego in the long-term, especially if the stock
behaved like Osram. Being Philips Lighting the bigger player in the lighting industry, as
mentioned in the case, it could perfectly do well if focus solely on its business after the
separation.
Do not buy at the IPO and going short in the first day of trading:
The future for Philips Lighting as a stand-alone company was challenging. Most of its sales,
€615 million, were coming from BG Lamps and with recent EU regulations, traditional lamps
were being banned and shifted to LEDs. One can observe Exhibit 12 and see that despite a
30
forecasted growth for the lighting market, only LEDs were driving that growth. As mentioned
in the case, Philips Lighting was already in the process of changing its traditional lamp plants
to LED plants but such could lead to more future costs and it was a process that could take long
to be finished. Another concern was that, being the main geographical drivers of this market
China and Latin America, based on Exhibit 25, Philips Lighting sales were still more
predominant in Northern America and Western Europe. Topping that, Lumileds was not being
included in the sale of Lighting and there were rumours in the market that this IPO was
happening after Royal Philips failing to find a potential buyerlxxiv. As a final regard for this
matter, such dividend pay-out ratio Philips Lighting was targeting would decrease the share
price, and profit margins could decrease as this market was experiencing a price erosion due to
fierce competition from Asia. These facts could induce a share price drop in the first months of
trading. On the other hand, being Philips Lighting the major player in this market, there was a
big risk in expecting that its price would go down.
Final recommendation:
The best recommendation should be underpinned by these major facts: AMS Capital was not
performing well and more negative returns could seriously damage it; based on their investment
strategy, they looked for short to medium term profits; the future outlook for Philips Lighting
was challenging and uncertain. With that in mind, Luuk de Vries should try to convince Robert
Shuuring to buy at the IPO and flip the stock in the first day of trading. According to Ritter and
Welch (2002)lxxv , underwriters do promote specific share allocation for flippers to quick profit.
Finally, according to Beatty and Ritter (1986)lxxvi, ex-ante uncertainty leads to IPO under-price.
Since there was uncertainty regarding the lighting market and Philips Lighting future, chances
of profiting from the IPO under-price in the first day were high.

31
Appendix
32
Exhibit 1 – Royal Philips Revenues 1988-2015
Source: Bloomberg
Exhibit 2 – Historical Royal Philips Stock Cumulative Return 2000-2015
Source: Bloomberg
0
5,000
10,000
15,000
20,000
25,000
30,000
35,000
40,000
19
88
19
89
19
90
19
91
19
92
19
93
19
94
19
95
19
96
19
97
19
98
19
99
20
00
20
01
20
02
20
03
20
04
20
05
20
06
20
07
20
08
20
09
20
10
20
11
20
12
20
13
20
14
20
15
Rev
enu
es in
mill
ion
s o
f eu
ros
33
Exhibit 3 – Royal Philips Income Statement (2013-2015)
In Millions of EUR except Per Share
12 Months Ending 2013 2014 2015
Revenue 21,990 21,391 24,244
+ Sales & Services Revenue 21,990 21,391 24,244
- Cost of Revenue 12,653 13,185 14,388
+ Cost of Goods & Services 12,653 13,185 14,388
Gross Profit 9,337 8,206 9,856
+ Other Operating Income 122 63 137
- Operating Expenses 7,604 7,783 9,001
+ Selling, General & Admin 5,882 5,871 7,024
+ Selling & Marketing 5,057 5,124 5,815
+ General & Administrative 825 747 1,209
+ Research & Development 1,659 1,635 1,927
+ Other Operating Expense 63 277 50
Operating Income (Loss) 1,855 486 992
- Non-Operating (Income) Loss 330 301 369
Pretax Income 1,525 185 623
- Income Tax Expense (Benefit) 466 26 239
- (Income) Loss from Affiliates 25 -62 -30
Income (Loss) from Cont Ops 1,034 221 414
- Net Extraordinary Losses (Gains) -138 -190 -245
Income (Loss) Incl. MI 1,172 411 659
- Minority Interest 3 -4 14
Net Income, GAAP 1,169 415 645
- Preferred Dividends 0 0 0
- Other Adjustments 0 0 0
Net Income Avail to Common, GAAP 1,169 415 645
Source: Bloomberg
34
Exhibit 4 – Royal Philips Balance Sheet (2013-2015)
In Millions of EUR except Per Share
12 Months Ending 2013 2014 2015
Total Assets
+ Cash, Cash Equivalents & STI 2,475 1,998 1,778
+ Accounts & Notes Receiv 4,420 4,476 4,727
+ Inventories 3,240 3,314 3,463
+ Other ST Assets 1,339 2,603 2,725
Total Current Assets 11,474 12,391 12,693
+ Property, Plant & Equip, Net 2,780 2,095 2,322
+ LT Investments & Receivables 496 462 489
+ Other LT Assets 11,809 13,404 15,472
Total Noncurrent Assets 15,085 15,961 18,283
Total Assets 26,559 28,352 30,976
Liabilities & Shareholders' Equity
+ Payables & Accruals 5,435 4,600 4,897
+ Accounts Payable 2,458 2,495 2,669
+ ST Debt 592 392 1,665
+ Other ST Liabilities 2,449 3,684 3,506
Total Current Liabilities 8,476 8,676 10,068
+ LT Debt 3,309 3,712 4,095
+ Other LT Liabilities 3,547 4,996 5,033
Total Noncurrent Liabilities 6,856 8,708 9,128
Total Liabilities 15,332 17,384 19,196
+ Preferred Equity and Hybrid Capital 0 0 0
+ Share Capital & APIC 1,984 2,368 2,855
- Treasury Stock 718 547 363
+ Retained Earnings 10,438 8,790 8,040
+ Other Equity -490 256 1,130
Equity Before Minority Interest 11,214 10,867 11,662
+ Minority/Non Controlling Interest 13 101 118
Total Equity 11,227 10,968 11,780
Total Liabilities & Equity 26,559 28,352 30,976
Source: Bloomberg
35
Exhibit 5 – Royal Philips Pro-Forma Income Statement (without Philips Lighting) (2013-
2015)7
7 This Income Statement is a proxy obtained by subtracting Philips Lighting Income Statement as a stand-alone company to
Royal Philips Consolidated Income Statement
In Millions of EUR except Per Share
12 Months Ending 2013 2014 2015
Revenue 14,861 14,410 16,779
+ Sales & Services Revenue 14,861 14,410 16,779
- Cost of Revenue 8,117 8,780 9,654
+ Cost of Goods & Services 8,117 8,780 9,654
Gross Profit 6,744 5,630 7,125
+ Other Operating Income 91 50 89
- Operating Expenses 5,348 5,653 6,679
+ Selling, General & Admin 3,927 3,991 5,040
+ Selling & Marketing 3,335 3,467 4,064
+ General & Administrative 592 524 976
+ Research & Development 1,284 1,240 1,561
+ Other Operating Expense 137 422 78
Operating Income (Loss) 1,487 27 535
- Non-Operating (Income) Loss 329 295 365
Pretax Income 1,158 -268 170
- Income Tax Expense (Benefit) 421 -40 156
- (Income) Loss from Affiliates 26 -60 -30
Income (Loss) from Cont Ops 866 250 174
- Net Extraordinary Losses (Gains) -138 -190 -245
Income (Loss) Incl. MI 1,004 440 419
- Minority Interest 3 3 0
Net Income, GAAP 1,001 437 419
- Preferred Dividends 0 0 0
- Other Adjustments 0 0 0
Net Income Avail to Common, GAAP 1,001 437 419
Source: Bloomberg
36
Exhibit 6 - Royal Philips Pro-Forma Balance Sheet (without Philips Lighting) (2013-2015)8
8 This Balance Sheet is a proxy obtained by subtracting Philips Lighting Balance Sheet as a stand-alone company to Royal
Philips Consolidated Balance Sheet
In Millions of EUR except Per Share
12 Months Ending 2013 2014 2015
Total Assets
+ Cash, Cash Equivalents & STI 2,426 1,923 1,695
+ Accounts & Notes Receiv 3,118 3,018 3,208
+ Inventories 2,257 2,318 2,475
+ Other ST Assets 1,176 2,406 2,531
Total Current Assets 8,977 9,665 9,909
+ Property, Plant & Equip, Net 1,950 1,373 1,688
+ LT Investments & Receivables 466 429 461
+ Other LT Assets 9,336 10,553 12,475
Total Noncurrent Assets 11,752 12,355 14,624
Total Assets 20,729 22,020 24,533
Liabilities & Shareholders' Equity
+ Payables & Accruals 3,842 3,045 3,189
+ Accounts Payable 1,571 1,611 1,618
+ ST Debt 590 343 1,579
+ Other ST Liabilities 2,144 3,349 3,110
Total Current Liabilities 6,576 6,737 7,878
+ LT Debt 3,303 3,671 4,093
+ Other LT Liabilities 2,922 4,227 4,398
Total Noncurrent Liabilities 6,225 7,898 8,491
Total Liabilities 12,801 14,635 16,369
+ Preferred Equity and Hybrid Capital 0 0 0
+ Share Capital & APIC 1,984 2,368 2,855
- Treasury Stock 718 547 363
+ Retained Earnings 10,270 8,812 7,814
+ Other Equity -3,619 -3,261 -2,157
Equity Before Minority Interest 7,917 7,372 8,149
+ Minority/Non Controlling Interest 11 13 15
Total Equity 7,928 7,385 8,164
Total Liabilities & Equity 20,729 22,020 24,533
Source: Bloomberg
37
Exhibit 7 – Royal Philips per operational segment (2014-2015)
Source: Royal Philips Annual Report 2015
38
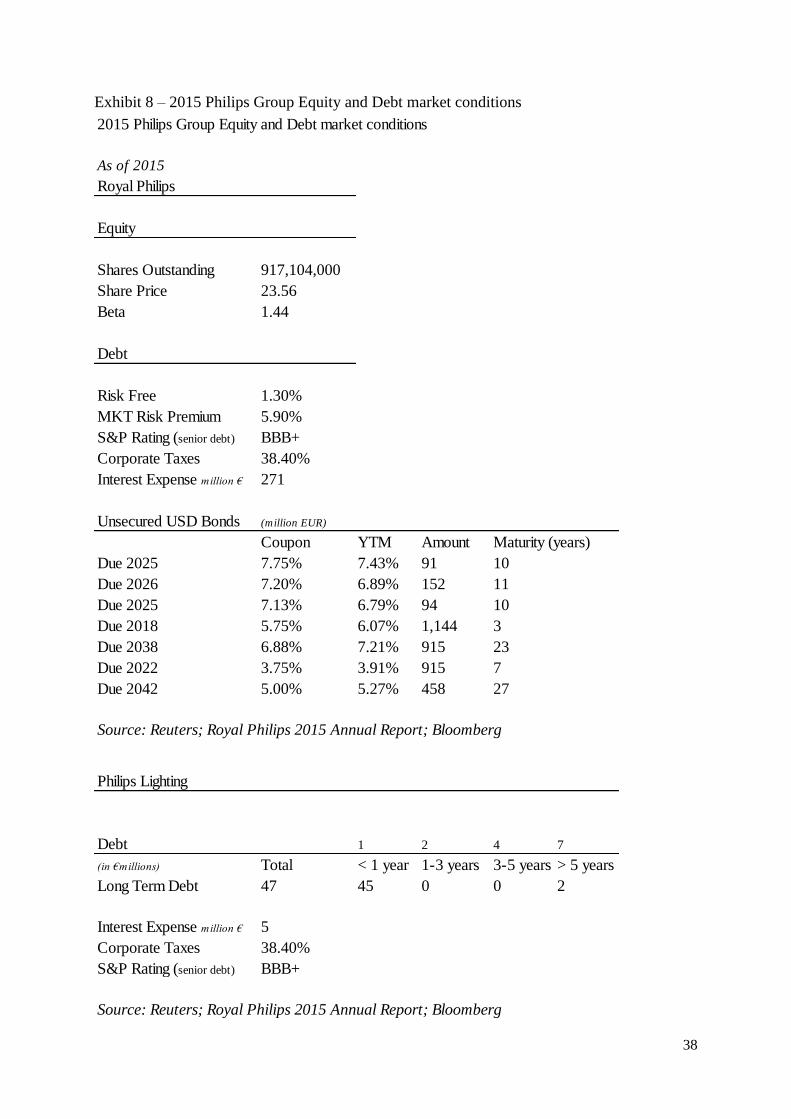
Exhibit 8 – 2015 Philips Group Equity and Debt market conditions
2015 Philips Group Equity and Debt market conditions
As of 2015
Royal Philips
Equity
Shares Outstanding 917,104,000
Share Price 23.56
Beta 1.44
Debt
Risk Free 1.30%
MKT Risk Premium 5.90%
S&P Rating (senior debt) BBB+
Corporate Taxes 38.40%
Interest Expense million € 271
Unsecured USD Bonds (million EUR)
Coupon YTM Amount Maturity (years)
Due 2025 7.75% 7.43% 91 10
Due 2026 7.20% 6.89% 152 11
Due 2025 7.13% 6.79% 94 10
Due 2018 5.75% 6.07% 1,144 3
Due 2038 6.88% 7.21% 915 23
Due 2022 3.75% 3.91% 915 7
Due 2042 5.00% 5.27% 458 27
Source: Reuters; Royal Philips 2015 Annual Report; Bloomberg
Philips Lighting
Debt 1 2 4 7
(in €millions) Total < 1 year 1-3 years 3-5 years > 5 years
Long Term Debt 47 45 0 0 2
Interest Expense million € 5
Corporate Taxes 38.40%
S&P Rating (senior debt) BBB+
Source: Reuters; Royal Philips 2015 Annual Report; Bloomberg
39
Source: https://www.google.pt/url?sa=t&rct=j&q=&esrc=s&source=web&cd=2&ved=0ahUKEwjbysOs26DYAhXF6xQKHUc-
CvMQFggwMAE&url=http%3A%2F%2Fwww.stern.nyu.edu%2F~adamodar%2Fpc%2Fratings.xls&usg=AOvVaw1JW2EuhhC3TQ7BGad
TEHxg
Exhibit 9 – Total Spin-off return by Market Capitalization
For large manufacturing firms
If interest coverage ratio is
> ≤ to Rating is Spread is
-100000 0.199999 D2/D 14.00%
0.20 0.649999 C2/C 10.50%
0.65 0.799999 Ca2/CC 8.00%
0.80 1.249999 Caa/CCC 6.50%
1.25 1.499999 B3/B- 5.50%
1.50 1.749999 B2/B 4.50%
1.75 1.999999 B1/B+ 3.75%
2.00 2.2499999 Ba2/BB 3.00%
2.25 2.49999 Ba1/BB+ 2.50%
2.50 2.999999 Baa2/BBB 1.60%
3.00 4.249999 A3/A- 1.25%
4.25 5.499999 A2/A 1.10%
5.50 6.499999 A1/A+ 1.00%
6.50 8.499999 Aa2/AA 0.80%
8.50 100000 Aaa/AAA 0.60%

40
Source: https://seekingalpha.com/article/3961175-stock-spinoff-performance-market-cap
41
Exhibit 10 – Lighting bulbs specifications by type
Source: Johnson, Holly. (2017). “Light Bulb Showdown: LED vs. CFL vs. Incandescent”. The
Simple Dollar. Available at: https://www.thesimpledollar.com/the-light-bulb-showdown-leds-
vs-cfls-vs-incandescent-bulbs-whats-the-best-deal-now-and-in-the-future/
Exhibit 11 – World GDP and Global Lamp Market (2005-2011)
Source: Mckinsey&Company. (2011). Lighting the way: Pespectives on the global lighting
market

42
Exhibit 12 – Lighting and Lamp Market Revenues (2010-2020)
Source: The Boston Consulting Group. (2015). How to win in a transformig lighting industry

43
Exhibit 13 – Medical Devices M&A deals
Source: IMAP M&A Sector Report 2017
Exhibit 14 – Health and Wellness Market Size (2002-2016)
Source: Passport Euromonitor, Health and Wellness: Euromonitor from trade sources/national
statistics
(in EUR millions)
Date Target Target Description Buyer Size EV/EBITDA
Jul-05 Symmetry Medical Inc. Surgical implants and instruments manufacturer Tecomet Inc. € 497.70 11.83
2012 Synthes Inc. Surgical instruments, implants and biomaterials developer Johnson & Johnson € 13,806.20 10.1
2015 Carefusion Corporation Medical instruments manufacturer Becton Dickinson and Company € 11,401.90 7.05
2015Bio-Reference
Laboratories Inc.Detection, diagnosis, evaluation, monitoring, and treatment
testing servicesOpko Kealth Inc. € 1,358.20 12.14
$-
$100,000
$200,000
$300,000
$400,000
$500,000
$600,000
$700,000
$800,000
2002 2003 2004 2005 2006 2007 2008 2009 2010 2011 2012 2013 2014 2015 2016
Val
ues
in B
illio
n D
olla
rs
44
Exhibit 15 – Royal Philips’ Structure
Before the IPO
After the IPO

45
Exhibit 16 – Philips Lighting Corporate Governance structure as of the Settlement Date
46
47
Source: Philips Lighting IPO Prospectus
Exhibit 17 – Relationship Agreement
48
Source: Philips Lighting IPO Prospectus
49
Exhibit 18 – “Carved-Out” Income Statement Philips Lighting (2013-2015)
In Millions of EUR except Per Share
12 Months Ending 2013 2014 2015
Revenue 7,129 6,981 7,465
+ Sales & Services Revenue 7,129 6,981 7,465
- Cost of Revenue 4,573 4,671 4,810
+ Cost of Goods & Services 4,573 4,671 4,810
Gross Profit 2,556 2,310 2,655
+ Other Operating Income 31 13 48
- Operating Expenses 2,374 2,282 2,372
+ Selling, General & Admin 1,955 1,880 1,984
+ Selling & Marketing 1,722 1,657 1,751
+ General & Administrative 233 223 233
+ Research & Development 375 395 366
+ Prov For Doubtful Accts — — —
+ Other Operating Expense 44 7 22
Operating Income (Loss) 213 41 331
- Non-Operating (Income) Loss 1 6 8
Pretax Income 212 35 323
- Income Tax Expense (Benefit) 45 66 83
- (Income) Loss from Affiliates -1 -2 0
Income (Loss) from Cont Ops 168 -29 240
- Net Extraordinary Losses (Gains) 0 0 0
Income (Loss) Incl. MI 168 -29 240
- Minority Interest 0 -7 14
Net Income, GAAP 168 -22 226
- Preferred Dividends 0 0 0
- Other Adjustments 0 0 0
Net Income Avail to Common, GAAP 168 -22 226
Source: Bloomberg

50
Exhibit 19 – “Carved-Out” Balance Sheet Philips Lighting (2013-2015)
9
9 Other LT Liabilities include pension liabilities, accrued liabilities, deferred revenues, deferred tax liabilities,
derivatives & hedging and miscellaneous liabilities
In Millions of EUR except Per Share
12 Months Ending 2013 2014 2015
Total Assets
+ Cash, Cash Equivalents & STI 49 75 83
+ Accounts & Notes Receiv 1,302 1,458 1,519
+ Inventories 983 996 988
+ Other ST Assets 163 197 194
Total Current Assets 2,497 2,726 2,784
+ Property, Plant & Equip, Net 830 722 634
+ LT Investments & Receivables 30 33 28
+ Other LT Assets 2,473 2,851 2,997
Total Noncurrent Assets 3,333 3,606 3,659
Total Assets 5,830 6,332 6,443
Liabilities & Shareholders' Equity
+ Payables & Accruals 1,593 1,555 1,708
+ ST Debt 2 49 86
+ Other ST Liabilities 305 335 396
Total Current Liabilities 1,900 1,939 2,190
+ LT Debt 6 41 2
+ Other LT Liabilities 625 769 635
Total Noncurrent Liabilities 631 810 637
Total Liabilities 2,531 2,749 2,827
+ Preferred Equity and Hybrid Capital 0 0 0
+ Share Capital & APIC 0 0 0
- Treasury Stock 0 0 0
+ Retained Earnings 168 -22 226
+ Other Equity 3,129 3,517 3,287
Equity Before Minority Interest 3,297 3,495 3,513
+ Minority/Non Controlling Interest 2 88 103
Total Equity 3,299 3,583 3,616
Total Liabilities & Equity 5,830 6,332 6,443
Source: Bloomberg

51
Exhibit 20 – Philips Lighting Peers Overview
Acuity Brands Inc: North American market leader and one of the world’s leading providers of lighting and building
management solutions for commercial, institutional, industrial, infrastructure, and residential applications
throughout North America and select international markets.
Faegerhult AB: develops, produces and market professional lighting solutions for public environments such as
offices, schools, retail areas, industries and hospitals, indoor and outdoor.
Zhejiang Yankon Group Co: Specializes in LED-based commercial lighting, home lighting, office lighting, and
outdoor lighting as one of the largest high-tech businesses in China’s green lighting industry.
Ocean’s King Lighting Scie&Tech Co: China-based company principally engaged in the research, development,
manufacture and distribution of specialty environment lightening equipment. The Company’s products consist of
fixed lightening devices, mobile lightening devices and portable lightening devices.
Zumtobel Group AB: International lighting group and a leading player in the field of innovative lighting solutions
and components. In the lighting business the Group with its Thorn, Zumtobel and acdc brands is the European
market leader.
Thorpe: Specialise in designing and manufacturing professional lighting equipment. Their products are sold
throughout the world.
Dalian Insulator Group: It is a publicly listed “High Tech” company engaged in the research, production and sales
of electrical porcelain and composite insulators, station post insulators and porcelain hardware fittings. It is the
largest transmission line insulator manufacturing enterprise in China.
Osram Light AG: Osram Licht AG manufactures lights. The Company produces lamps, light-emitting diodes
(LEDs), light engines, lighting management systems, specialty lighting, indoor and outdoor LED luminaires,
dimmers, and other related lighting products.
Source: Bloomberg
Data from 31/12/2015
(in million euros except share price) EBITDA Market Cap EV Price Debt
Acuity Brands Inc 364 9,389 9,017 215 315
Fagerhult AB 54 661 755 6 146
Zhejiang Yankon Group Co 57 1,811 1,671 1 67
Ocean's King Lighting Scie&Tech Co 7 1,587 1,472 3 1
Zumtobel Group AB 91 1,013 1,152 23 216
Thorpe 27 389 339 3 0
Dalian Insulator Group 12 521 551 1 40
Osram Licht AG 543 4,061 3,400 39 112
Revenue Beta Tax
(in million euros except share price) EBIT Earnings Revenues Growth Levered Rate
Acuity Brands Inc 325 192 2,337 32.8% 1.44 35%
Fagerhult AB 42 31 418 1.7% 0.99 22%
Zhejiang Yankon Group Co 45 53 607 53.5% 0.48 25%
Ocean's King Lighting Scie&Tech Co 5 10 127 -0.4% 25%
Zumtobel Group AB 24 11 1,357 3.3% 1.30 25%
Thorpe 22 17 119 23.1% 0.30 20%
Dalian Insulator Group 6 5 86 20.5% 0.56 25%
Osram Licht AG 338 166 3,572 -30.5% 0.90 15%
Source: Bloomberg, Reuters, Deloitte

52
Exhibit 21 – Royal Philips (after IPO) Peers Overview
Lifco AB-B SHS: Lifco’s business idea is to acquire and develop market leading, niched companies. Our aim is
to secure that the subsidiaries continuously improve earnings and deliver strong cash flows.
GN Store Nord: The GN Group is a global leader in intelligent audio solutions that let you hear more, do more
and be more than you ever thought possible. Our unique portfolio of medical, professional & consumer audio
solutions – and the deep research & development expertise behind this range of products gives our brands
unprecedented advantages in the med-tech, hearables and intelligent audio field.
Draegerwerk AG & Co: Draegerwerk AG & Company KGAA manufactures medical, safety, and aerospace
equipment. The Company produces ventilators, monitoring equipment, transport incubators, anesthesia machines,
surgical lights, ward equipment, home care equipment, systems for safe breathing in industry, mining and
firefighting, and airplane crew and passenger oxygen systems.
Guerbet: Guerbet's men and women are committed to offering health professionals contrast agents, medical
devices and innovative solutions indispensable to diagnostic and interventional imaging to improve patients'
prognosis and quality of life.
Elekta AB: Elekta is proud to be the leading innovator of equipment and software used to improve, prolong and
save the lives of people with cancer and brain disorders. Our treatment solutions and oncology informatics
portfolios are designed to enhance the delivery of radiation therapy, radiosurgery and brachytherapy, and to drive
cost efficiency in clinical workflows.
Data from 31/12/2015
(in million euros except share price) EBITDA Market Cap EV Price Debt
Lifco AB-B SHS 135 2,095 2,309 23 262
GN Store Nord 234 2,724 3,020 17 314
Draegerwerk AG & Co 158 1,134 1,271 69 354
Guerbet 87 794 1,082 65 342
Elekta AB 131 3,003 3,294 8 538
Carl Zeiss Meditec AG 150 2,321 2,363 29 13
Comet Holding AG 33 518 516 67 20
Osram Light AG 543 4,061 3,400 39 112
Alimak Group AB 43 403 407 9 89
Alfa Laval AB 798 7,073 8,368 17 1,597
Revenue Beta Tax
(in million euros except share price) EBIT Earnings Revenues Growth Levered Rate
Lifco AB-B SHS 118 87 844 12.9% 22%
GN Store Nord 154 108 1,040 5.6% 0.80 24%
Draegerwerk AG & Co 73 25 2,609 7.2% 0.77 15%
Guerbet 58 39 489 19.5% 0.50 33%
Elekta AB 63 15 1,203 2.7% 0.96 22%
Carl Zeiss Meditec AG 131 62 1,040 14.4% 0.41 15%
Comet Holding AG 24 16 264 11.5% 1.27 9%
Osram Light AG 338 166 3,572 -30.5% 0.90 15%
Alimak Group AB 37 14 218 13.6% 22%
Alfa Laval AB 610 410 4,248 10.2% 1.12 22%
Source: Bloomberg, Reuters, Deloitte
53
Carl Zeiss Meditec AG: Our aim is to contribute to progress in medical technology and help healthcare
professionals improve their patients' quality of life. Through cutting-edge innovations and clinically-relevant
software solutions, we support healthcare professionals in setting new standards of care in
ophthalmology/optometry; neuro, ENT, spine, dental and gynecologic surgery; and intraoperative radiotherapy.
Comet Holding AG: The COMET Group is a globally leading Swiss technology firm. For nearly 70 years, we
have been developing and producing innovative high-tech components and systems based on x-ray, radio
frequency and ebeam technology. Consistently able to take advantage of global trends and developments, we grow
continually.
Osram Light AG: Osram Licht AG manufactures lights. The Company produces lamps, light-emitting diodes
(LEDs), light engines, lighting management systems, specialty lighting, indoor and outdoor LED luminaires,
dimmers, and other related lighting products.
Alimak Group AB: he Group has been a pioneer and an industry leader in supplying elevators, hoists and work
platforms based on rack-and-pinion technology for almost 70 years. Alimak has a broad and competitive product
range of vertical access solutions, such as hoists, elevators and building maintenance units (BMU´s).
Alfa Laval AB: Alfa Laval is today a world leader within the key technology areas of heat transfer, separation
and fluid handling. Our company was founded on a single brilliant invention and innovation remains at the heart
of everything we do.
Source: Bloomberg
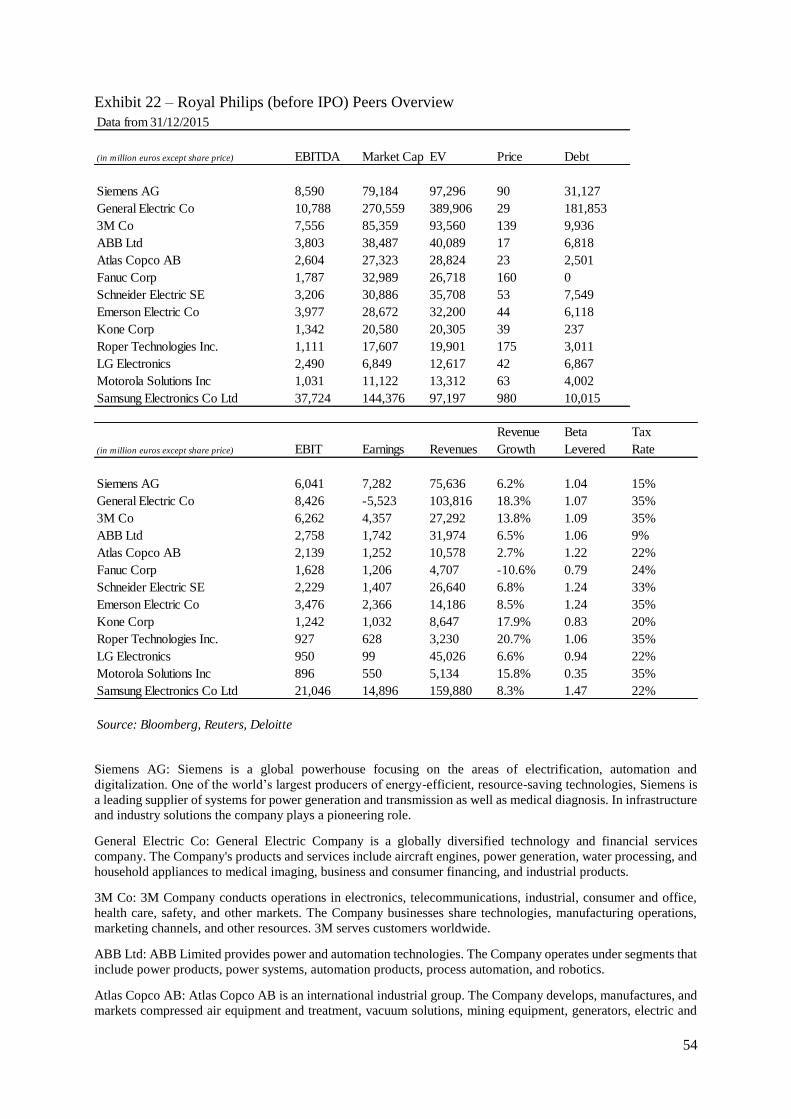
54
Exhibit 22 – Royal Philips (before IPO) Peers Overview
Siemens AG: Siemens is a global powerhouse focusing on the areas of electrification, automation and
digitalization. One of the world’s largest producers of energy-efficient, resource-saving technologies, Siemens is
a leading supplier of systems for power generation and transmission as well as medical diagnosis. In infrastructure
and industry solutions the company plays a pioneering role.
General Electric Co: General Electric Company is a globally diversified technology and financial services
company. The Company's products and services include aircraft engines, power generation, water processing, and
household appliances to medical imaging, business and consumer financing, and industrial products.
3M Co: 3M Company conducts operations in electronics, telecommunications, industrial, consumer and office,
health care, safety, and other markets. The Company businesses share technologies, manufacturing operations,
marketing channels, and other resources. 3M serves customers worldwide.
ABB Ltd: ABB Limited provides power and automation technologies. The Company operates under segments that
include power products, power systems, automation products, process automation, and robotics.
Atlas Copco AB: Atlas Copco AB is an international industrial group. The Company develops, manufactures, and
markets compressed air equipment and treatment, vacuum solutions, mining equipment, generators, electric and
Data from 31/12/2015
(in million euros except share price) EBITDA Market Cap EV Price Debt
Siemens AG 8,590 79,184 97,296 90 31,127
General Electric Co 10,788 270,559 389,906 29 181,853
3M Co 7,556 85,359 93,560 139 9,936
ABB Ltd 3,803 38,487 40,089 17 6,818
Atlas Copco AB 2,604 27,323 28,824 23 2,501
Fanuc Corp 1,787 32,989 26,718 160 0
Schneider Electric SE 3,206 30,886 35,708 53 7,549
Emerson Electric Co 3,977 28,672 32,200 44 6,118
Kone Corp 1,342 20,580 20,305 39 237
Roper Technologies Inc. 1,111 17,607 19,901 175 3,011
LG Electronics 2,490 6,849 12,617 42 6,867
Motorola Solutions Inc 1,031 11,122 13,312 63 4,002
Samsung Electronics Co Ltd 37,724 144,376 97,197 980 10,015
Revenue Beta Tax
(in million euros except share price) EBIT Earnings Revenues Growth Levered Rate
Siemens AG 6,041 7,282 75,636 6.2% 1.04 15%
General Electric Co 8,426 -5,523 103,816 18.3% 1.07 35%
3M Co 6,262 4,357 27,292 13.8% 1.09 35%
ABB Ltd 2,758 1,742 31,974 6.5% 1.06 9%
Atlas Copco AB 2,139 1,252 10,578 2.7% 1.22 22%
Fanuc Corp 1,628 1,206 4,707 -10.6% 0.79 24%
Schneider Electric SE 2,229 1,407 26,640 6.8% 1.24 33%
Emerson Electric Co 3,476 2,366 14,186 8.5% 1.24 35%
Kone Corp 1,242 1,032 8,647 17.9% 0.83 20%
Roper Technologies Inc. 927 628 3,230 20.7% 1.06 35%
LG Electronics 950 99 45,026 6.6% 0.94 22%
Motorola Solutions Inc 896 550 5,134 15.8% 0.35 35%
Samsung Electronics Co Ltd 21,046 14,896 159,880 8.3% 1.47 22%
Source: Bloomberg, Reuters, Deloitte

55
pneumatic tools, and hybrid joining technologies and other assembly systems, as well as offers related equipment
and services.
Fanuc Corp: FANUC Corporation manufactures factory automation (FA) systems, equipments, and robots. The
Company's products include computerized numerically-controlled (CNC) equipment, servo motors, laser systems,
industrial robots, wire-cut electric discharge machines, and CNC drill.
Schneider Electric SE: Schneider Electric SE manufactures power distribution and automation systems. The
Company produces circuit breakers, remote installation management equipment, panelboards, programmable logic
controllers, industrial control products, detectors, human-machine interfaces, and process controls. Schneider's
products are sold various brands.
Emerson Electric Co: Emerson Electric Co. designs and manufactures electronic and electrical equipment,
software, systems, and services. The Company offers its products for industrial, commercial, and consumer
markets worldwide through its network power, process management, industrial automation, climate technologies,
and commercial and residential solutions divisions.
Kone Corp: KONE, Inc. designs, manufactures, and supplies elevators, escalators, autowalks, and automatic
building doors. The company offers passenger, patient/service, freight, marine, and trauma elevators; and loading
docks, automated guided vehicles, and destination control systems. It also provides maintenance and
modernization solutions, and repairs and upgrades.
Roper Technologies Inc: Roper Technologies, Inc. manufactures and distributes industrial equipment. The
Company offers industrial controls, fluid handling, pumps, medical and scientific devices, analytical
instrumentation products, radio frequency identification (RFID) communication technology, and software
solutions.
LG Electronics: LG Electronics Inc. manufactures and markets digital display equipment and home appliances.
The Company produces and markets flat panel televisions, A/V products, washing machines, air conditioners and
refrigerators as well as telecommunications equipment such as smart phones and tablets.
Motorola Solutions Inc: Motorola Solutions, Inc. is a data communications and telecommunications equipment
provider. The Company develops data capture, wireless, infrastructure, bar code scanning, two-way radios, and
wireless broadband networks. Motorola also produces public safety and government products, voice and data
communications products and systems, and wireless LAN securities.
Samsung Electronics Co Ltd: Samsung Electronics Co., Ltd. manufactures a wide range of consumer and industrial
electronic equipment and products such as semiconductors, personal computers, peripherals, monitors, televisions,
and home appliances including air conditioners and microwave ovens. The Company also produces Internet access
network systems and telecommunications equipment including mobile phones.
Source: Bloomberg
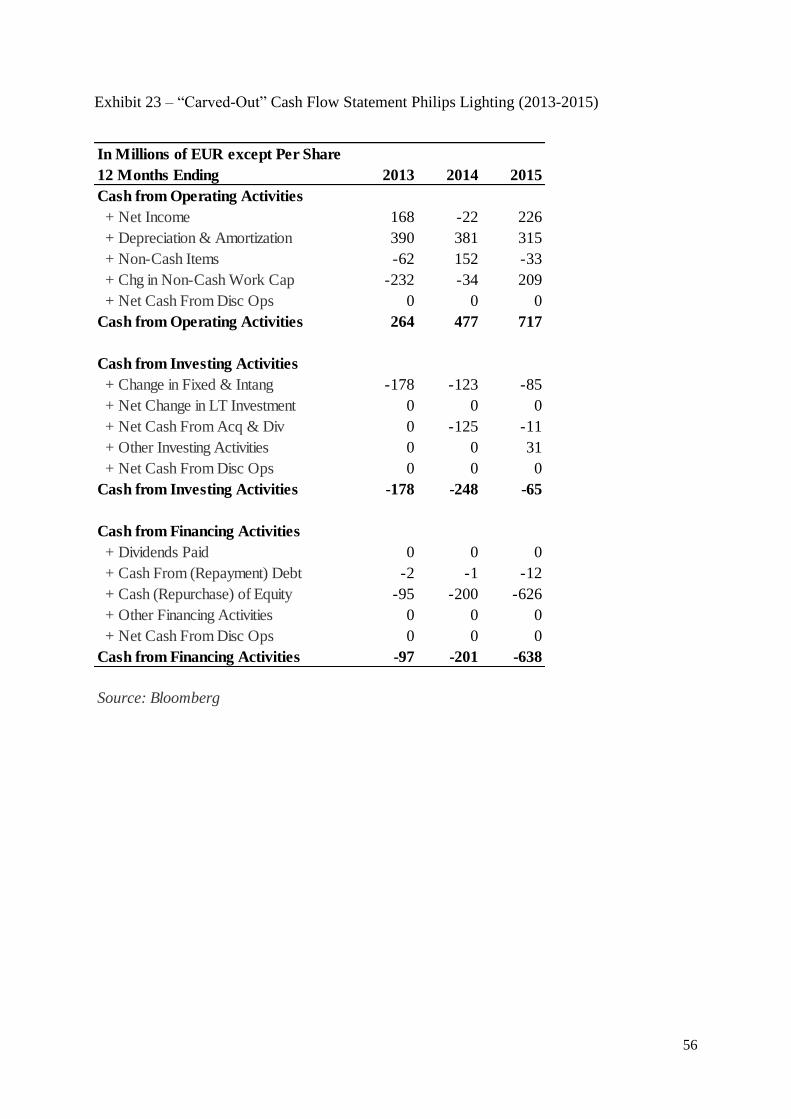
56
Exhibit 23 – “Carved-Out” Cash Flow Statement Philips Lighting (2013-2015)
In Millions of EUR except Per Share
12 Months Ending 2013 2014 2015
Cash from Operating Activities
+ Net Income 168 -22 226
+ Depreciation & Amortization 390 381 315
+ Non-Cash Items -62 152 -33
+ Chg in Non-Cash Work Cap -232 -34 209
+ Net Cash From Disc Ops 0 0 0
Cash from Operating Activities 264 477 717
Cash from Investing Activities
+ Change in Fixed & Intang -178 -123 -85
+ Net Change in LT Investment 0 0 0
+ Net Cash From Acq & Div 0 -125 -11
+ Other Investing Activities 0 0 31
+ Net Cash From Disc Ops 0 0 0
Cash from Investing Activities -178 -248 -65
Cash from Financing Activities
+ Dividends Paid 0 0 0
+ Cash From (Repayment) Debt -2 -1 -12
+ Cash (Repurchase) of Equity -95 -200 -626
+ Other Financing Activities 0 0 0
+ Net Cash From Disc Ops 0 0 0
Cash from Financing Activities -97 -201 -638
Source: Bloomberg
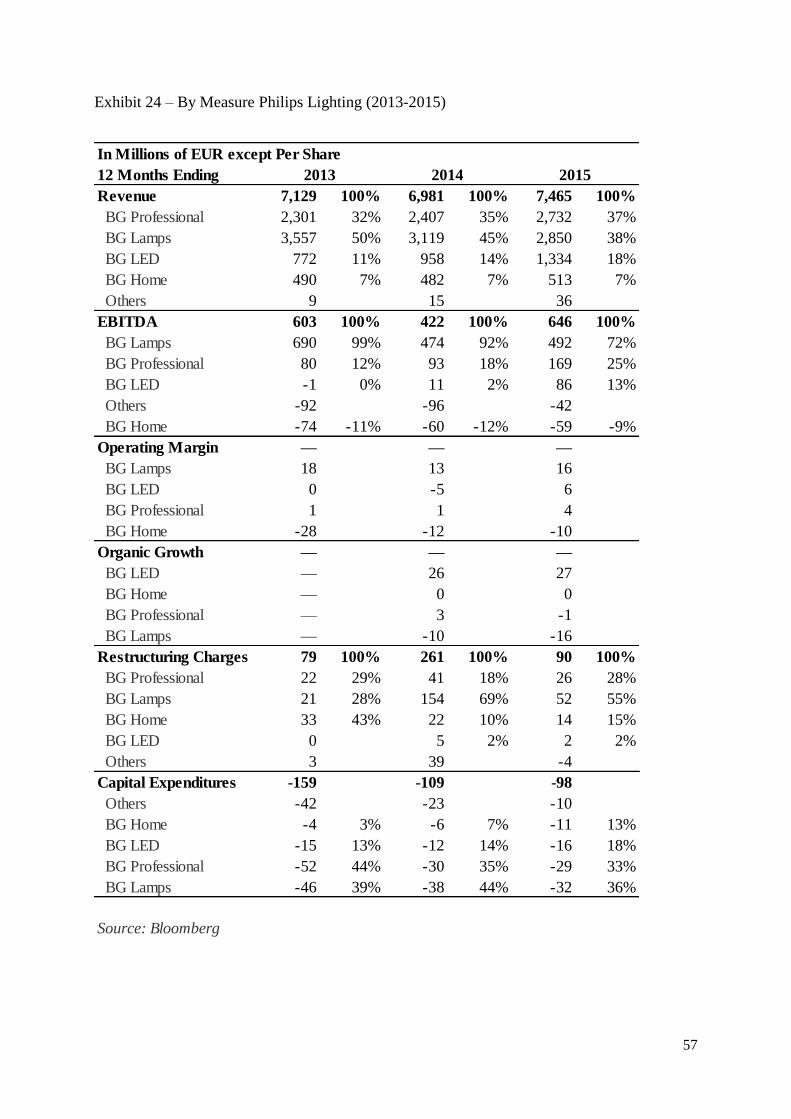
57
Exhibit 24 – By Measure Philips Lighting (2013-2015)
In Millions of EUR except Per Share
12 Months Ending
Revenue 7,129 100% 6,981 100% 7,465 100%
BG Professional 2,301 32% 2,407 35% 2,732 37%
BG Lamps 3,557 50% 3,119 45% 2,850 38%
BG LED 772 11% 958 14% 1,334 18%
BG Home 490 7% 482 7% 513 7%
Others 9 15 36
EBITDA 603 100% 422 100% 646 100%
BG Lamps 690 99% 474 92% 492 72%
BG Professional 80 12% 93 18% 169 25%
BG LED -1 0% 11 2% 86 13%
Others -92 -96 -42
BG Home -74 -11% -60 -12% -59 -9%
Operating Margin — — —
BG Lamps 18 13 16
BG LED 0 -5 6
BG Professional 1 1 4
BG Home -28 -12 -10
Organic Growth — — —
BG LED — 26 27
BG Home — 0 0
BG Professional — 3 -1
BG Lamps — -10 -16
Restructuring Charges 79 100% 261 100% 90 100%
BG Professional 22 29% 41 18% 26 28%
BG Lamps 21 28% 154 69% 52 55%
BG Home 33 43% 22 10% 14 15%
BG LED 0 5 2% 2 2%
Others 3 39 -4
Capital Expenditures -159 -109 -98
Others -42 -23 -10
BG Home -4 3% -6 7% -11 13%
BG LED -15 13% -12 14% -16 18%
BG Professional -52 44% -30 35% -29 33%
BG Lamps -46 39% -38 44% -32 36%
Source: Bloomberg
2013 2014 2015
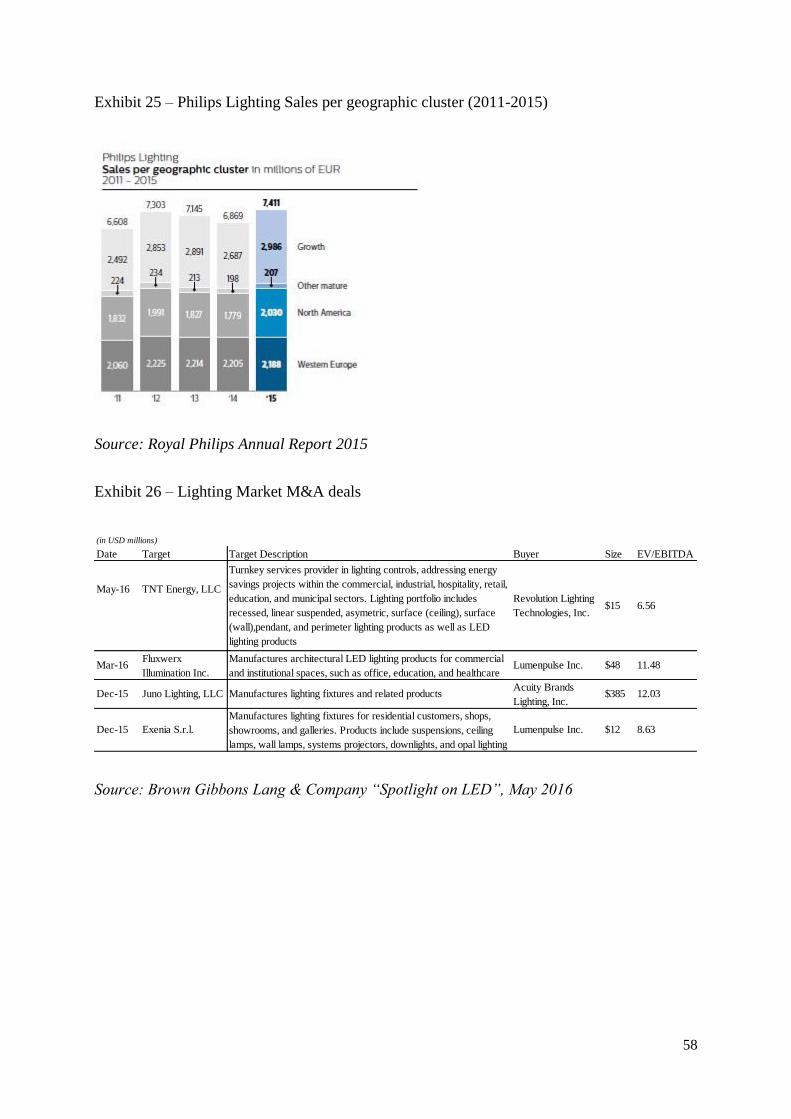
58
Exhibit 25 – Philips Lighting Sales per geographic cluster (2011-2015)
Source: Royal Philips Annual Report 2015
Exhibit 26 – Lighting Market M&A deals
Source: Brown Gibbons Lang & Company “Spotlight on LED”, May 2016
(in USD millions)
Date Target Target Description Buyer Size EV/EBITDA
Manufactures lighting fixtures for residential customers, shops,
showrooms, and galleries. Products include suspensions, ceiling
lamps, wall lamps, systems projectors, downlights, and opal lighting
Dec-15 Exenia S.r.l. Lumenpulse Inc. $12 8.63
Dec-15 Juno Lighting, LLC Manufactures lighting fixtures and related productsAcuity Brands
Lighting, Inc.$385 12.03
6.56
Manufactures architectural LED lighting products for commercial
and institutional spaces, such as office, education, and healthcare
Fluxwerx
Illumination Inc.Mar-16 $48 11.48Lumenpulse Inc.
Turnkey services provider in lighting controls, addressing energy
savings projects within the commercial, industrial, hospitality, retail,
education, and municipal sectors. Lighting portfolio includes
recessed, linear suspended, asymetric, surface (ceiling), surface
(wall),pendant, and perimeter lighting products as well as LED
lighting products
May-16 TNT Energy, LLCRevolution Lighting
Technologies, Inc.$15
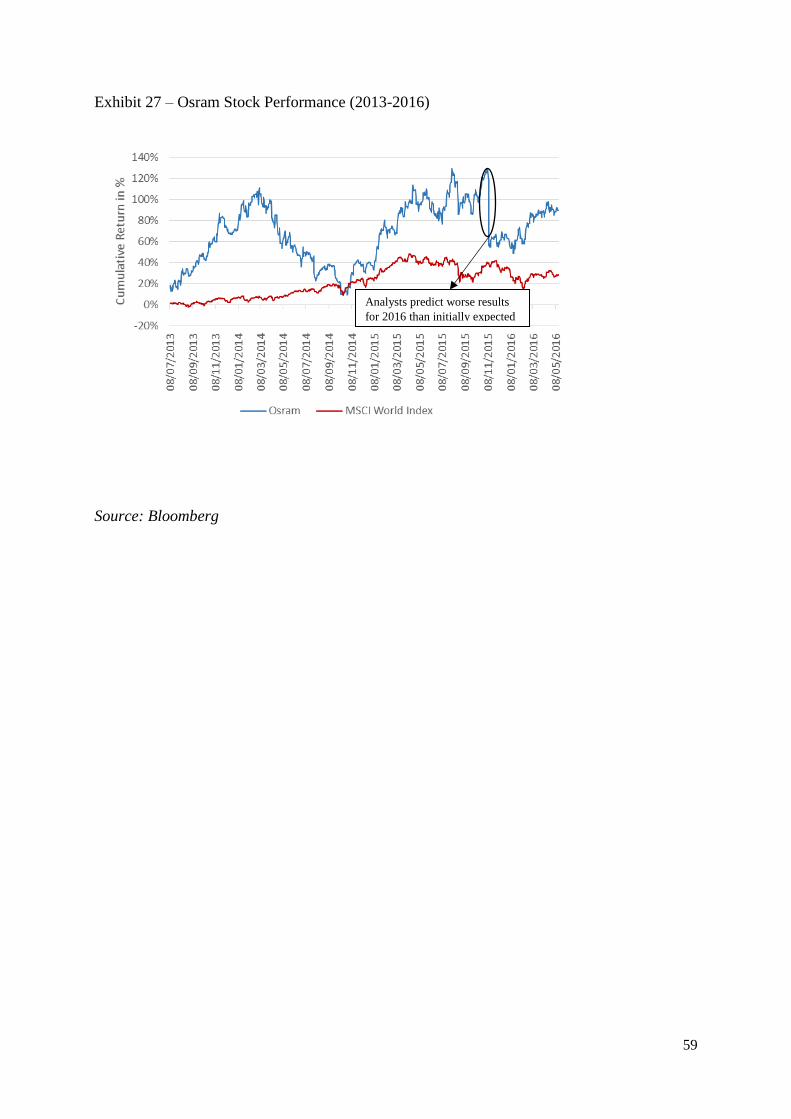
59
Exhibit 27 – Osram Stock Performance (2013-2016)
Source: Bloomberg
Analysts predict worse results
for 2016 than initially expected

60
Teaching Notes Appendix

61
TN Exhibit 1 – WACC and ROIC calculations
WACC and ROIC calculations
Royal PhilipsWACC
Beta 1.44
Risk -Free 1.30%
MKT Risk Premium 5.90%
Corporate Taxes 38.40%
Re= rf+Beta*MRP
Re 9.80%
Rd 2.90%
Market Value of Equity
Shares Outstanding*Share Price € 21,606,970,240
Market Value of Debt
Book Value of Debt (interest bearing) € 5,760,000,000
Interest Expenses (Coupon) € 271,000,000
Average Maturity (t) 12.41
Market Value of Debt = C *((1-1/(1+Rd)^t)/Rd)+(Book Debt/(1+Rd)^t)
Market Value of Debt € 6,830,601,607
WACC 7.87%
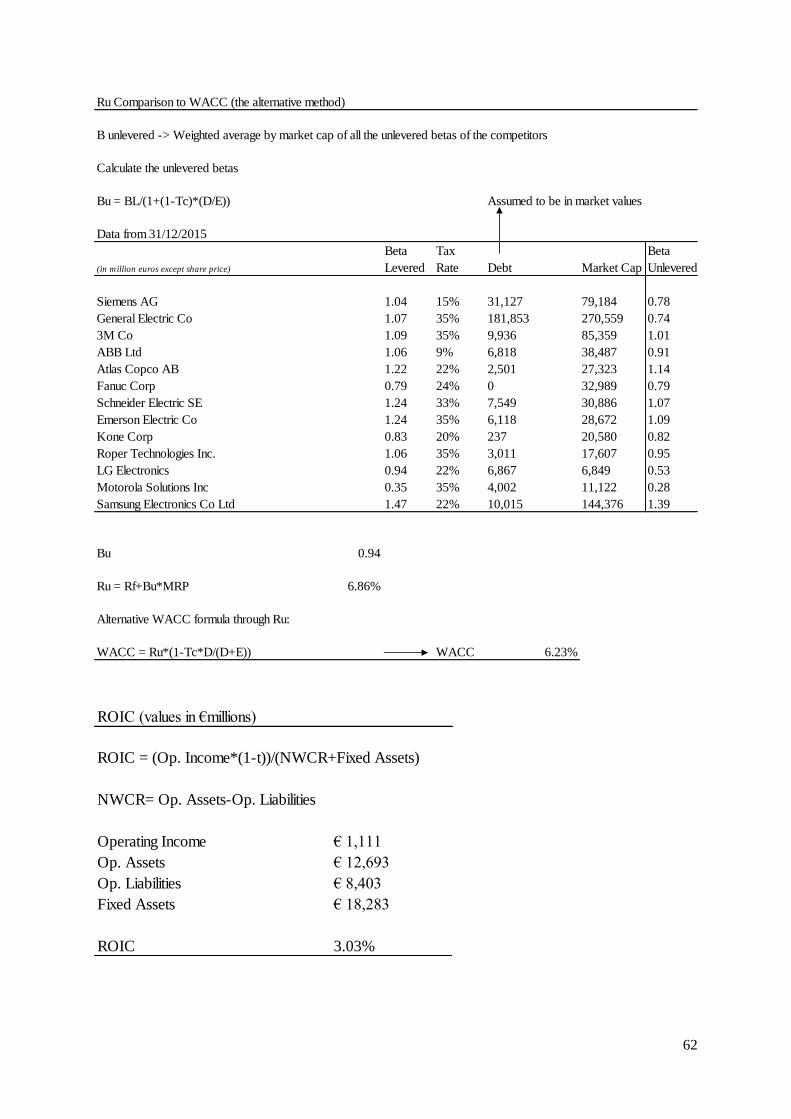
62
Ru Comparison to WACC (the alternative method)
B unlevered -> Weighted average by market cap of all the unlevered betas of the competitors
Calculate the unlevered betas
Bu = BL/(1+(1-Tc)*(D/E)) Assumed to be in market values
Data from 31/12/2015
Beta Tax Beta
(in million euros except share price) Levered Rate Debt Market Cap Unlevered
Siemens AG 1.04 15% 31,127 79,184 0.78
General Electric Co 1.07 35% 181,853 270,559 0.74
3M Co 1.09 35% 9,936 85,359 1.01
ABB Ltd 1.06 9% 6,818 38,487 0.91
Atlas Copco AB 1.22 22% 2,501 27,323 1.14
Fanuc Corp 0.79 24% 0 32,989 0.79
Schneider Electric SE 1.24 33% 7,549 30,886 1.07
Emerson Electric Co 1.24 35% 6,118 28,672 1.09
Kone Corp 0.83 20% 237 20,580 0.82
Roper Technologies Inc. 1.06 35% 3,011 17,607 0.95
LG Electronics 0.94 22% 6,867 6,849 0.53
Motorola Solutions Inc 0.35 35% 4,002 11,122 0.28
Samsung Electronics Co Ltd 1.47 22% 10,015 144,376 1.39
Bu 0.94
Ru = Rf+Bu*MRP 6.86%
Alternative WACC formula through Ru:
WACC = Ru*(1-Tc*D/(D+E)) WACC 6.23%
ROIC (values in €millions)
ROIC = (Op. Income*(1-t))/(NWCR+Fixed Assets)
NWCR= Op. Assets-Op. Liabilities
Operating Income € 1,111
Op. Assets € 12,693
Op. Liabilities € 8,403
Fixed Assets € 18,283
ROIC 3.03%
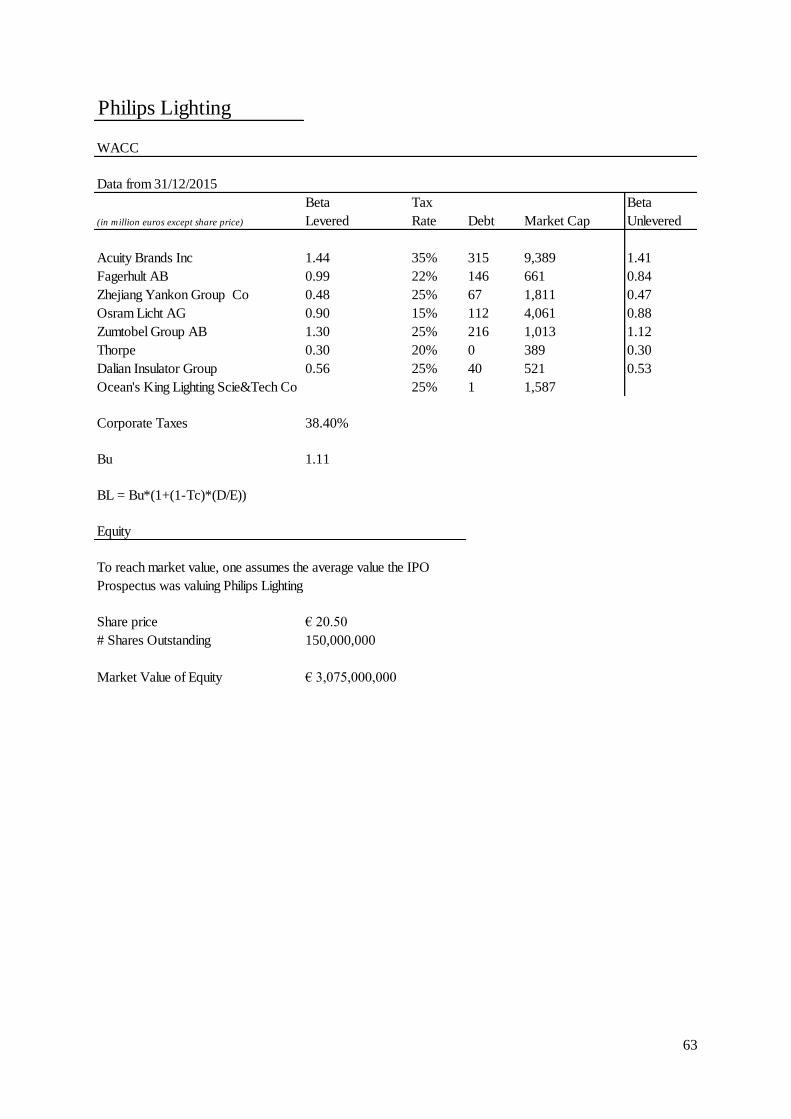
63
Philips Lighting
WACC
Data from 31/12/2015
Beta Tax Beta
(in million euros except share price) Levered Rate Debt Market Cap Unlevered
Acuity Brands Inc 1.44 35% 315 9,389 1.41
Fagerhult AB 0.99 22% 146 661 0.84
Zhejiang Yankon Group Co 0.48 25% 67 1,811 0.47
Osram Licht AG 0.90 15% 112 4,061 0.88
Zumtobel Group AB 1.30 25% 216 1,013 1.12
Thorpe 0.30 20% 0 389 0.30
Dalian Insulator Group 0.56 25% 40 521 0.53
Ocean's King Lighting Scie&Tech Co 25% 1 1,587
Corporate Taxes 38.40%
Bu 1.11
BL = Bu*(1+(1-Tc)*(D/E))
Equity
Share price € 20.50
# Shares Outstanding 150,000,000
Market Value of Equity € 3,075,000,000
To reach market value, one assumes the average value the IPO
Prospectus was valuing Philips Lighting

64
Debt
Rd 2.90%
Market Value of Debt
Book Value of Debt (interest bearing) € 88,000,000
Interest Expenses (Coupon) € 5,000,000
Average Maturity (t) 1.26
Market Value of Debt = C *((1-1/(1+Rd)^t)/Rd)+(Book Debt/(1+Rd)^t)
Market Value of Debt € 90,975,595
As one already has D and E, it is now possible to find BL
BL 1.13
Re 7.94%
WACC 7.77%
ROIC (values in €millions)
ROIC = (Op. Income*(1-t))/(NWCR+Fixed Assets)
NWCR= Op. Assets-Op. Liabilities
Operating Income € 195
Op. Assets € 2,784
Op. Liabilities € 2,104
Fixed Assets € 3,659
ROIC 2.77%
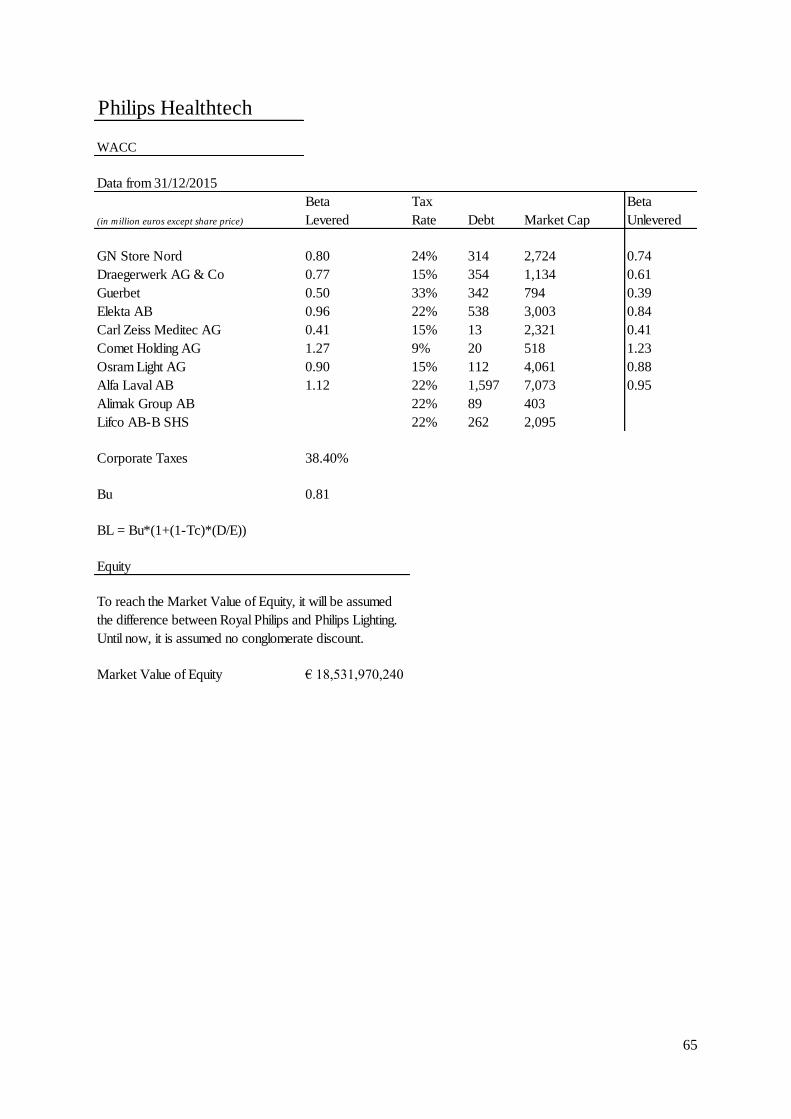
65
Philips Healthtech
WACC
Data from 31/12/2015
Beta Tax Beta
(in million euros except share price) Levered Rate Debt Market Cap Unlevered
GN Store Nord 0.80 24% 314 2,724 0.74
Draegerwerk AG & Co 0.77 15% 354 1,134 0.61
Guerbet 0.50 33% 342 794 0.39
Elekta AB 0.96 22% 538 3,003 0.84
Carl Zeiss Meditec AG 0.41 15% 13 2,321 0.41
Comet Holding AG 1.27 9% 20 518 1.23
Osram Light AG 0.90 15% 112 4,061 0.88
Alfa Laval AB 1.12 22% 1,597 7,073 0.95
Alimak Group AB 22% 89 403
Lifco AB-B SHS 22% 262 2,095
Corporate Taxes 38.40%
Bu 0.81
BL = Bu*(1+(1-Tc)*(D/E))
Equity
Market Value of Equity € 18,531,970,240
To reach the Market Value of Equity, it will be assumed
the difference between Royal Philips and Philips Lighting.
Until now, it is assumed no conglomerate discount.
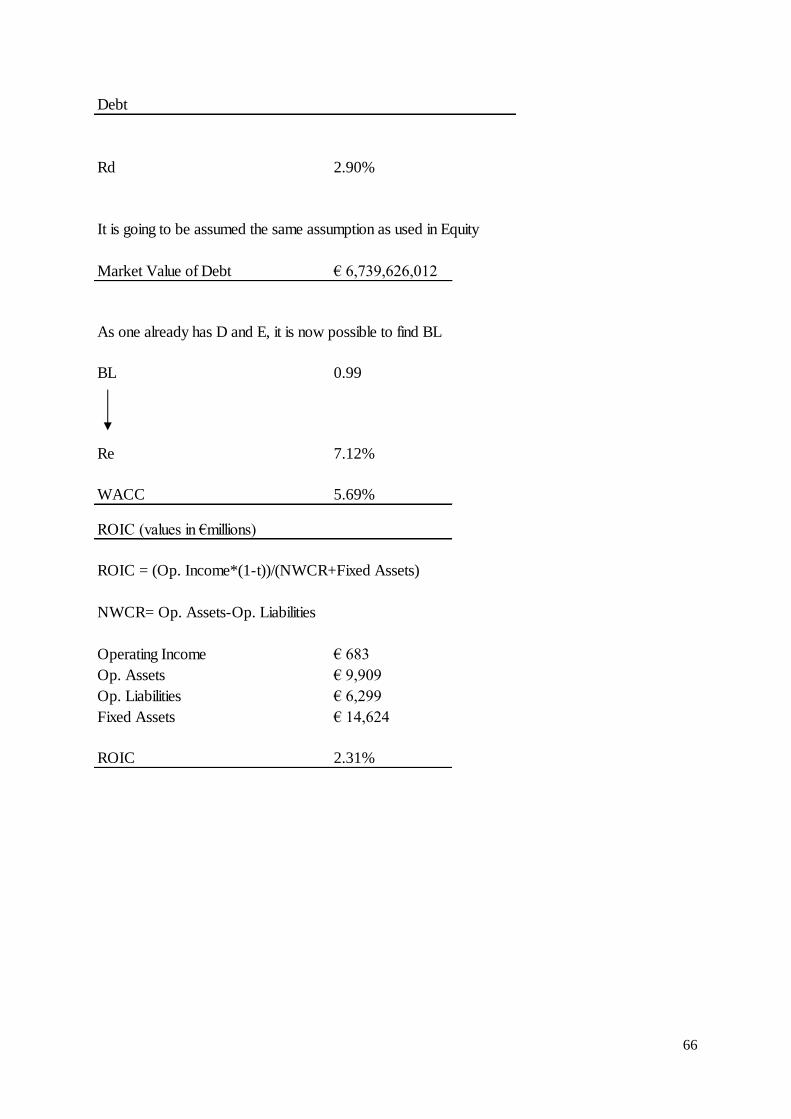
66
Debt
Rd 2.90%
It is going to be assumed the same assumption as used in Equity
Market Value of Debt € 6,739,626,012
As one already has D and E, it is now possible to find BL
BL 0.99
Re 7.12%
WACC 5.69%
ROIC (values in €millions)
ROIC = (Op. Income*(1-t))/(NWCR+Fixed Assets)
NWCR= Op. Assets-Op. Liabilities
Operating Income € 683
Op. Assets € 9,909
Op. Liabilities € 6,299
Fixed Assets € 14,624
ROIC 2.31%

67
TN Exhibit 2 – Philips Lighting Comparable Multiples
TN Exhibit 3 – Philips Lighting Football Field Valuation
Multiples Range
Data from 31/12/2015
(in million euros except share price) EBITDA Market Cap EBIT EV Price Earnings Sales
Acuity Brands Inc 364 9,389 325 9,017 215 192 2,337
Zumtobel Group AB 91 1,013 24 1,152 23 11 1,357
Osram Licht AG 543 4,061 338 3,400 39 166 3,572
(in million euros except share price) EV/EBIT EV/Sales EV/EBITDA P/E
Acuity Brands Inc 27.75 3.86 24.74 48.96
Zumtobel Group AB 48.38 0.85 12.61 89.09
Osram Licht AG 10.06 0.95 6.26 24.46
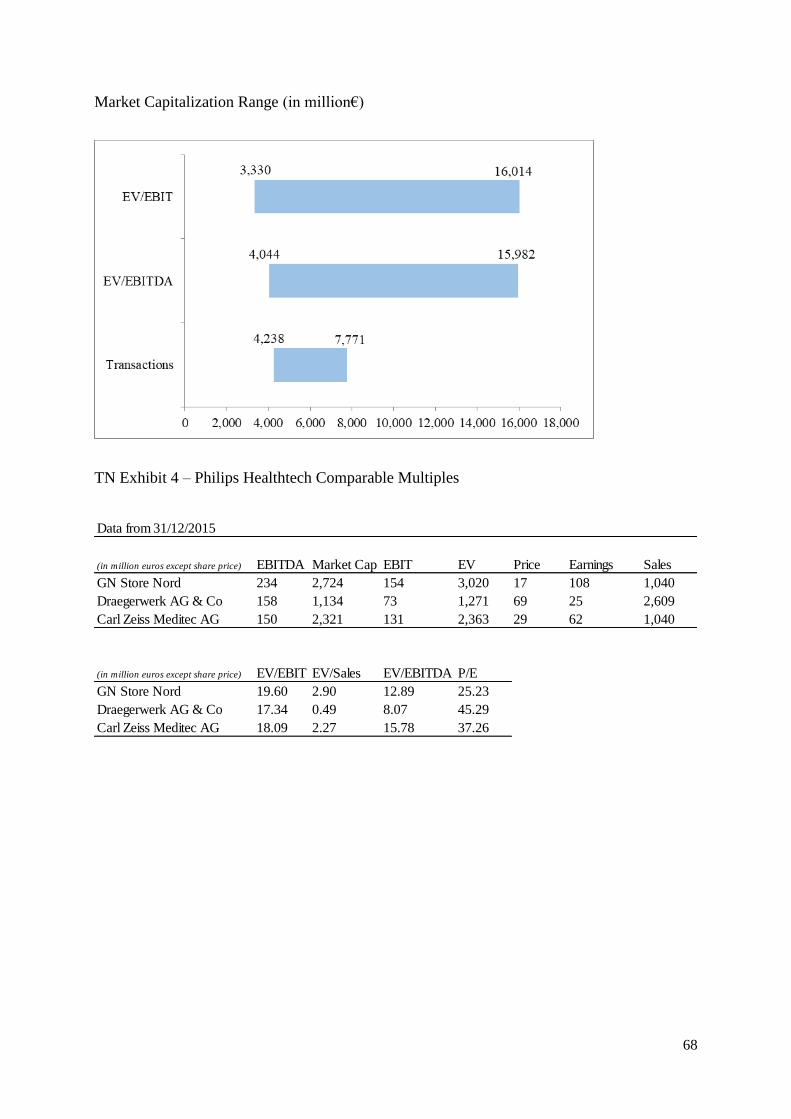
68
Market Capitalization Range (in million€)
TN Exhibit 4 – Philips Healthtech Comparable Multiples
Data from 31/12/2015
(in million euros except share price) EBITDA Market Cap EBIT EV Price Earnings Sales
GN Store Nord 234 2,724 154 3,020 17 108 1,040
Draegerwerk AG & Co 158 1,134 73 1,271 69 25 2,609
Carl Zeiss Meditec AG 150 2,321 131 2,363 29 62 1,040
(in million euros except share price) EV/EBIT EV/Sales EV/EBITDA P/E
GN Store Nord 19.60 2.90 12.89 25.23
Draegerwerk AG & Co 17.34 0.49 8.07 45.29
Carl Zeiss Meditec AG 18.09 2.27 15.78 37.26
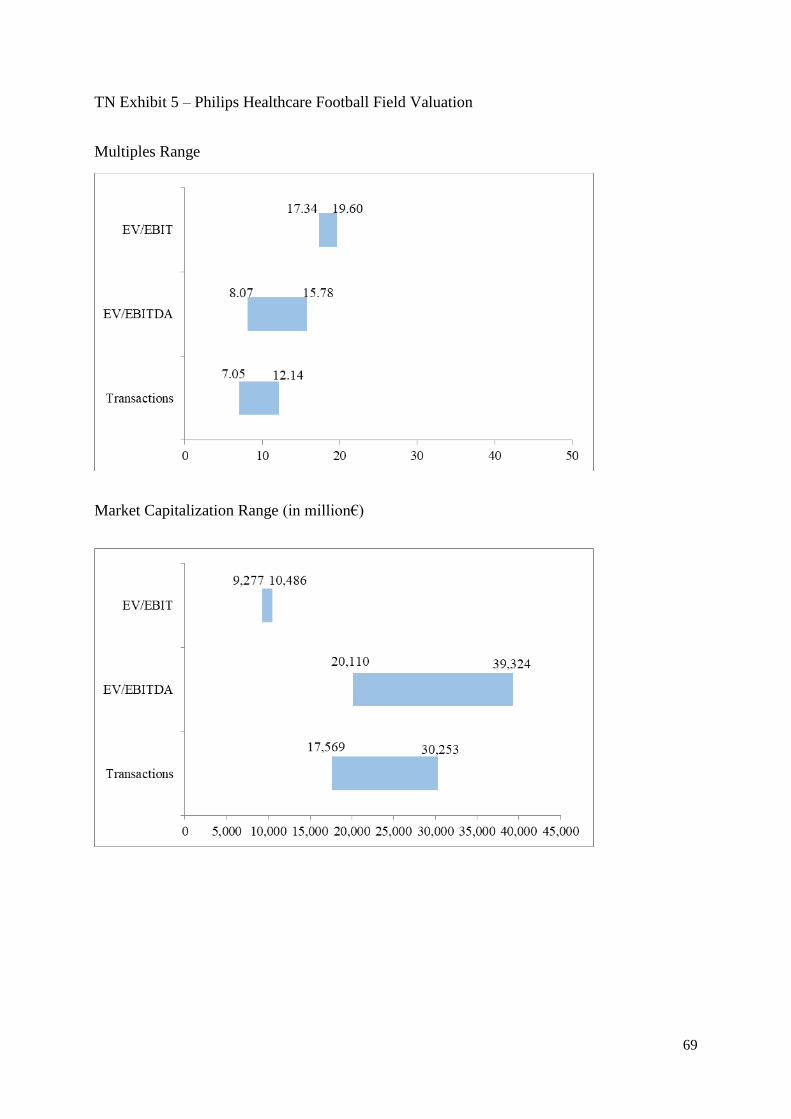
69
TN Exhibit 5 – Philips Healthcare Football Field Valuation
Multiples Range
Market Capitalization Range (in million€)

70
TN Exhibit 6 – Sum of the Parts
Actual EV
71
Endnotes
i Philips Company Official Website. Our Heritage. Available at: https://www.philips.com/a-
w/about/company/our-heritage.html (Accessed 16/12/2017) ii Delft, Dirk. (2014). “100 years of Philips Research”. Europhysics News. 45, 27-31 iii Ibid. ii iv Ibid. i v Chandler, Alfred. (2005). Shaping the industrial century: The remarkable story of the evolution of the modern
chemical and pharmaceutical industries. 301. Cambridge: Harvard University Press vi Marlow, Ben. (2016). “Philips begins plans for €5bn float of century-old lighting arm”. The Telegraph.
Available at: http://www.telegraph.co.uk/business/2016/03/07/philips-begins-plans-for-5bn-float-of-century-old-
lighting-arm/ (Accessed 17/12/2017) vii Bloomberg (17/12/2017) viii Volteler, Thom., Gale, Thomson. (2003). International directory of companies histories. Vol.50. Detroit ,
Mich: St. James Press. ix Philips 2008 Annual Report. (2008). Because health and well-being matters people. Available at:
www.philips.com/annualreport2008 x Ibid. viii xi MarketLine. (2016). Company Profile: Koninklijke Philips N.V.. Available at: www.marketline.com (Accessed
17/12/2017) xii Philips 2015 Annual Report. (2015). Creating two companies with a bright future. Available at:
www.philips.com/annualreport2015 xiii Roger, Rüdisüli., Amden SG. (2005). “Value Creation of Spin-offs and Carve-outs”. Wirtschaftswissenschaftlichen
Faculty, University of Basel xiv Matulka, Rebecca., Wood, Daniel. (2013). “The History of the Light Bulb”. Department of Energy. Available
at: https://energy.gov/articles/history-light-bulb (Accessed 17/12/2017) xv Johnson, Holly. (2017). “Light Bulb Showdown: LED vs. CFL vs. Incandescent”. The Simple Dollar.
Available at: https://www.thesimpledollar.com/the-light-bulb-showdown-leds-vs-cfls-vs-incandescent-bulbs-
whats-the-best-deal-now-and-in-the-future/ (Accessed 17/12/2017) xvi Mckinsey&Company. (2011). Lighting the way: Pespectives on the global lighting market xvii Bryant, Chris. (2015). “Industrial giants caught in LED headlights”. Financial Times. Available at:
https://www.ft.com/content/9e6d199a-3065-11e5-91ac-a5e17d9b4cff (Accessed 17/12/2017) xviii Ibid. xiv xix The Boston Consulting Group. (2015). How to win in a transformig lighting industry xx Bryant, Chris. (2012). “Lighting revolution shakes up industry”. Financial Times. Available at:
https://www.ft.com/content/962714b6-4611-11e2-ae8d-00144feabdc0 (Accessed 17/12/2017) xxi Philips Lighting IPO Prospectus. P.55 xxii Ibid.xvi xxiii Philips Lighting IPO Prospectus. P.171 xxiv Euromonitor International. (2002). Health and Wellness Dashboard. Available at:
http://fesrvsd.fe.unl.pt:2117/portal/dashboard/index (Accessed 17/12/2017) xxv Deloitte. (2017). 2017 global health care outlook: Making progress against persistent challenges xxvi Lorenzetti, Laura. (2015). “Here’s How Your Health Care Is Going to Change in 2016”. Fortune. Available
at: http://fortune.com/2015/12/16/health-care-trends-2016/ (Accessed 17/12/2017) xxvii Ibid. xxi xxviii Ibid. xxii xxix Reuters. (2016). “Philips Plans to IPO at Least 25% of Its Huge Lighting Business”. Fortune. Available at:
http://fortune.com/2016/05/03/philips-lighting-business-ipo/ (Accessed 17/12/2017) xxx Bray, Chad. (2016). “Philips to Pursue I.P.O of Lighting Business in Amsterdam”. The New York Times.
Available at: https://www.nytimes.com/2016/05/04/business/dealbook/philips-to-pursue-ipo-of-lighting-
business-in-amsterdam.html?mcubz=0 (Accessed 17/12/2017) xxxi Robinson, Duncan. (2016). “Philips likely to list its lighting business”. Financial Times. Available at:
https://www.ft.com/content/1c3c47d2-0ac3-11e6-9456-444ab5211a2f (Accessed 17/12/2017) xxxii Deutsch, Anthony., Escritt, Thomas. (2014). “Breaking with tradition, Philips splits off lighting”. Reuters.
Available at: https://www.reuters.com/article/us-philips-spin-off/breaking-with-tradition-philips-splits-off-
lighting-idUSKCN0HI0FV20140923 (Accessed 17/12/2017) xxxiii Bray, Chad. (2014). “Philips to Combine Lighting Units Into Stand-Alone Company”. The New York Times.
Available at: https://dealbook.nytimes.com/2014/06/30/philips-to-combine-lighting-units-into-standalone-
company/?mtrref=undefined&gwh=F5E5354E9B1C8B8FBB4BE6E043AE6811&gwt=pay (Accessed
17/12/2017)

72
xxxiv Jackson, Gavin., Thomson, Jennifer. (2016). “Philips plans to spin off lighting business”. Financial Times.
Available at: https://www.ft.com/content/33f5fa4e-1121-11e6-91da-096d89bd2173 (Accessed 17/12/2017) xxxv Sterling, Toby. (2016). “U.S. blocks Philips’ $3.3 billion sale of Lumileds to Asian buyers”. Reuters.
Available at: https://www.reuters.com/article/us-philips-lumileds-sale/u-s-blocks-philips-3-3-billion-sale-of-
lumileds-to-asian-buyers-idUSKCN0V02D4 (Accessed 17/12/2017) xxxvi Storm, Darlene. (2016). “US invokes “national security” to stop sale of Philips LED unit to Chinese”.
Computerworld. Available at: https://www.computerworld.com/article/3026198/security/us-invokes-national-
security-to-stop-sale-of-philips-led-unit-to-chinese.html (Accessed 17/12/2017) xxxvii Groningen, Elco. (2016). “Philips Said to Face Headwinds on Sale of Lighting Business”. Bloomberg.
Available at: https://www.bloomberg.com/news/articles/2016-02-02/philips-said-to-face-headwinds-on-sale-of-
lighting-business (Accessed 17/12/2017) xxxviii Groningen, Elco. (2016). “Philips to Sell Lighting Via IPO After Failing to Find Buyer”. Bloomberg.
Available at: https://www.bloomberg.com/news/articles/2016-05-03/philips-to-list-lighting-division-after-
finding-no-buyer (Accessed 17/12/2017) xxxix Bray, Chad. (2015). “Philips to Spin Off Lighting Business in I.P.O”. The New York Times. Available at:
https://www.nytimes.com/2015/03/20/business/dealbook/philips-to-spin-off-lighting-business-in-
ipo.html?mcubz=0 (Accessed 17/12/2017) xl Philips IPO Press Release. (2016, May 3) xli Bray, Chad. (2016). “Philips Calls Off Sale of Controlling Stake in LED Business”. The New York Times.
Available at: https://www.nytimes.com/2016/01/23/business/dealbook/philips-lumileds-go-
lighting.html?mcubz=0 (Accessed 17/12/2017) xlii Philips Lighting IPO Prospectus. P. 92 xliii Ibid. xxxvii xliv Ibid. xxxv xlv Deutsch, Anthony., Escritt, Thomas. (2014). “Breaking with tradition, Philips splits off lighting”. Reuters.
Available at: https://www.reuters.com/article/us-philips-spin-off/breaking-with-tradition-philips-splits-off-
lighting-idUSKCN0HI0FV20140923 (Accessed 17/12/2017) xlvi Ibid. xxx xlvii Philips Lighting IPO Prospectus. P.90 xlviii Philips Lighting IPO Prospectus. Selected Historical Financial Information xlix Philips Lighting IPO Prospectus. Dividend Policy l Philips Lighting IPO Prospectus. P.131 li Philips Lighting IPO Prospectus. P.183 lii (2013). “Siemens shareholders make profit in Osram IPO”. Deutsche Welle. Available at:
http://www.dw.com/en/siemens-shareholders-make-profit-in-osram-ipo/a-16935805 (Accessed 18/12/2017) liii Osram Listing Prospectus. P.80 liv Peters, Laura. (2011). “Slower market growth affects Osram IPO, hurts public companies”. LEDs Magazine.
Available at: http://www.ledsmagazine.com/articles/2011/09/slower-market-growth-affects-osram-ipo-hurts-
public-companies.html (Accessed 18/12/2017) lv Doeswijk, R.Q. et al. (2006). “25 years of dutch IPOS: an examination of frequently cited IPO anomalies
withins main sectors and during hot- and cold issue periods”. De Economist, 154:405-427 lvi Jackson, Gavin. (2016). “Philips plans to spin off lighting business. Financial Times. Available at:
https://www.ft.com/content/33f5fa4e-1121-11e6-91da-096d89bd2173 (Accessed 19/12/2017) lvii Reuters. (2016). “Philips Plans to IPO at Least 25% of Its Huge Lighting Business”. Fortune. Available at:
http://fortune.com/2016/05/03/philips-lighting-business-ipo/ (Accessed 19/12/2017) lviii Jackson, Gavin. (2016). “Philips plans to spin off lighting business”. Financial Times. Available at:
https://www.ft.com/content/33f5fa4e-1121-11e6-91da-096d89bd2173 (Accessed 19/12/2017) lix Philips IPO Press Release. (2016, May 16) lx Phiilps Lighting IPO Prospectus. The Offering lxi Khorana, Ajay., et al. (2011). “Spin-offs: Tackling the Conglomerate Discount”. Journal of Applied Corporate
Finance, 23 (2011) 90-101 lxii Ali, Sajid. et al. (2016). “Corporate diversification and firm performance: An inverted U-shaped hypothesis”
International Journal of Organizational Leadership, 5 (2016) 381-398 lxiii De Aenlle, Conrad. (2006). “Conglomerates: When synergies collide”. The New York Times. Available at:
http://www.nytimes.com/2006/04/07/your-money/conglomerates-when-synergies-collide.html?mcubz=0
(Accessed 18/12/2017) lxiv Annema, André. et al. (2001). “Do carve-outs make sense?”. Mckinsey&Company website. Available at:
https://www.mckinsey.com/business-functions/strategy-and-corporate-finance/our-insights/do-carve-outs-make-
sense (Accessed 16/12/2017)
73
lxv (2016). “Ducth electronics giant Philips plans to split business”. BBC News. Available at:
http://www.bbc.com/news/business-29324406 (Accessed 18/12/2017) lxvi Cave, Andrew. (2015). “Royal Philips chief executive plans to divide and conquer”. The Telegraph.
Available at:
http://www.telegraph.co.uk/finance/newsbysector/mediatechnologyandtelecoms/electronics/11547423/Royal-
Philips-chief-executive-plans-to-divide-and-conquer.html (Accessed 18/12/2017) lxvii Koller, Tim. et al. (1990). “Creating Value through Divestitures”. In Valuation: Measuring and Managing
the Value of Companies, ed. John Wiley & Sons, inc., 483. New Jersey lxviii Walter, Ingo. (2004). Mergers and Acquisitions in Banking and Finance: What Works, What Fails, and Why.
89. New York: Oxford University Press lxix Berger, Philip., Ofek, Eli.(1995). “Diversification’s effect on firm value”. Journal of Financial Economics 37
(1995) 39-65 lxx Schweltzer, Bernhard., Reimund, Carsten. (2003). “Conglomerate discount and cash distortion: New evidence
from Germany”. Leipzig Graduate School of Management lxxi Koller, Timothy. et al. (2005). “The right role for multiples in valuation.”. Mckinsey&Company website.
Available at: https://www.mckinsey.com/business-functions/strategy-and-corporate-finance/our-insights/the-
right-role-for-multiples-in-valuation (Accessed 16/12/2017) lxxii Webb, Alex. (2015). “Osram Shares Tumble as 2016 Outlook Disappoints Investors”. Bloomberg. Available
at: https://www.bloomberg.com/news/articles/2015-11-11/osram-shares-tumble-as-short-term-outlook-
disappoints-investors (Accessed 18/12/2017) lxxiii Reiche, Oliver. (2015). The Phenomenon of IPO Underpricing in the European and U.S. Stock Markets.
Hamburg: Anchor Academic Publishing lxxiv Equity Research, Zack. (2016). “Philips (PHG) Lighting IPO Unit at Over $3 Billion”. NASDAQ. Available
at: http://www.nasdaq.com/article/philips-phg-lighting-ipo-values-unit-at-over-3-billion-cm627532 (Accessed
18/12/2017) lxxv Ritter, Jay., Welch, Ivo. (2002). “A Review of IPO Activity, Pricing, and Allocations”. The Journal of
Finance, Vol. LVII, No.4. P.1821 lxxvi Beatty, Randolph., Ritter, Jay. (1986). “Investment banking, reputation, and the underpricing of initial public
offerings”. Journal of Financial Economics, Vol.15 (1986) 213-232