an analysis of the relationship between macroeconomic
TRANSCRIPT

an a n a l y s is o f t h e r e l a t io n s h ip b e t w e e n m a c r o e c o n o m ic
INDICATORS AND THE FLOW OF FOREIGN DIRECT INVESTMENTS IN
KENYA.
f rLitnufr*
BY MOKAYA GIDEON NYAMWEYA
D61/P/8110/02
A RESEARCH PROJECT SUBMITTED IN PARTIAL FULFILMENT OF THE
REQUIREMENTS FOR THE DEGREE OF MASTER OF BUSINESS
ADMINISTRATION, SCHOOL OF BUSINESS, UNIV ERSITY OF NAIROBI.
.* •**««* UW
MAY 2006

DECLARATION
1 declare this project is my original work and has not been submitted fo rade 'igree j
other university
S i g n e d ^ ________________ 2±M ° b
MORAYA GIDEON NY AM WE Y A
D61/P/8110/02
This project has been submitted for examination with my approval as the un * Vcrsi
supervisor.
ANYANGU MOSES
LECTURER U.O.N

TABLE OF CONTENTSPage
Declaration.........................................................................................................it
Dedication..........................................................................................................v
Acknowledgement............................................................................................ v>
List of Tables....................................................................................................vii
List of figures...................................................................................................v“ i
Abstract........................................................................................................... *x
INTRODUCTION
1.1 Background ...............................................................................................1
1.2 Statement of the Problem.......................................................................... 7
1.3 Objectives of the Study............................................................................ 8
1.4 Justification of the Study...........................................................................9
1.5 Scope of the Study..................................................................................9
LITERATURE REVIEW
2.1 Theoretical Literature............................................................................1 •
2.2 Empirical Literature ...............................................................................13
2.3 Link between Macroeconomic Indicators and FDI.................................24
RESEARCH DESIGN AND METHODOLOGY
3.1 Research Design..................................................................................... 28
3.2 Population.............................................................................................. 28
3.3 Model Development............................................................................. 29
3.4 Data Analysis Procedure....................................................................... 33
iii

DATA ANALYSIS AND FINDINGS
4.1 Introduction........................................................................................... 35
4.2 Means and standards deviations of variables......................................... 35
4.3 FDI Inflow Analysis............................................................................... 37
4.4 Correlation Analysis of the variables..........................................................38
4.5 The Model.................................................................................................. 41
4.6 Multicolincrality, Ilomoscedasticity and Hcterosccdasticity.....................44
4.7 Conclusion................................................................................................. 49
SUMMARY, CONCLUSION AND RECOMMENDATION
5.1 Summary............................................................................................... 51
5.2 Discussion............................................................................................... 51
5.3 Conclusion................................................................................................ 54
5.3 Limitations of the study ......................................................................... 56
5.4 Recommendations for further studies...................................................... 56
References................................................................................................ 57
Appendix I Pearson correlation Analysis of the variables.............................. 62
Appendix II Coefficients of the model............................................................ 63
IV

DEDICATION
To my family, especially my father whose wisdom and wise counsel have been the
cornerstone in my quest for knowledge.
V

ACKNOWLEDGEMENT
1 wish to extend my sincere appreciation to many whom in different and varied ways
have helped to make this project prolific and have contributed to its completion. A few of
these people deserve to be mentioned.
My sincere gratitude goes to my supervisor Mr. Moses Anyangu whose professional
guidance and expeditiousness greatly contributed to the development of this project.
I am also grateful to the members o f staffofthe School o f Business ( UON) for their
support and advice.
My gratitude also goes to M r. Mwangi for his support in the Data analysis using the
SPSS version. Sincere thanks also go to Mr. Ogeto for the data collection role played in
the research. My gratitude to my classmates Moses, Chris, Juma for their suggestions and
discussion. My grateful thanks to my wife Lucy for the unlimited support she gave me in
the period spent on the MBA course.
There arc other people who assisted me but have not been mentioned. To them all 1 am
grateful.
VI

Page
4.2.1
4.4.14.5.14.5.2
Descriptive Statistics on I'DI inflows and specifiedmacroeconomic variables........................................Variables picked for the model...............................Model summary......................................................Anova analysis for the model..................................
LIST OF TABLES
.3540.41.43
VII

LIST OF FIGURES Page
1 1 1 Trend ofFDl flow in Kenya......................................... 54.3.1 FDI Inflow Kenya 1990 to 2005..................................374.6.1 Normality of the Error Term...................... 444.6.2 Autocorrelation.............................................................454.6.3 Scatter plot................................................................... 464.6.4 FDI Inflow and GDP growth rate................................ 474.6.5 FDI Inflow and the NSF. index.................................... 4S4.6.6 FDI inflow and inflation rate....................................... 49
viii

a b s t r a c t
The research sought to look at specific macro economic determinants that
affect the Foreign Direct Investment (FD1) inflow to Kenya. The logic being
that each country is structurally diverse and that there are substantial
discrepancies in the basic macroeconomic variables that characterize an
economy. The study therefore sought to determine the critical
macroeconomic indicators and their relationship to the flow of FDIs to
Kenya and to develop a regression model to predict the level of FDI based
on the identified macroeconomic indicators.
The study was restricted to the K enyan economy between the years 1 990
and 2005, the period being judgmentally selected as it is more relevant to the
current situation. Due to the fact that the FDI inflow depends on a number of
macroeconomic determinants, multiple linear regression was used to
determine the important variables that influence FDI inflow to kenya.
Research findings from the Data Analysis indicate that the main
macroeconomic indicators that affect FDI inflow to Kenya include inflation,
NSE Index, Annual GDP growth rate, total external debt, total exports, tax
on International transactions and total imports. High Inflation and taxes on
international transactions continuously created negative distortions to the
Kenyan economy reducing FDI Investors. On the other hand, increased
volumes o f trade (import and export) have positively signaled to openness of
trade and therefore more FDIs to Kenya. Similarly the findings reflect that
higher external debt is positively related to FDI inflow to Kenya since
increased multilateral donor funding to the Kenyan government helps to
IX

boost investor confidence hence higher FDI inflows through Multinational
Enterprises.
Contrary' to the previous literature, the FDI inflow to Kenya has been
negative to (iDP growth. This is explained by the fact that the Kenyan
government has tended to dispose its stake in parastatals to foreign investors
in periods when the economic growth is low in order to get more binding to
bridge the budgetary- gap hence increased FDIs. The findings further reveal
that high NSE Index levels negatively relate to the FDI inflow to Kenya.
The findings opens the way for further research on the impact of FDI
inflows to reduction of poverty levels in Kenya as well as the impact of FDI
inflows to the stock market in Kenya.

CHAPTER ONE
INTRODUCTION
1.1 BackgroundThe movement of capital around the world has captured the attention of the
policymakers and researchers in both developing and developed countries.
Cross border capital flows have gravitated towards the destinations that are
susceptible to lucrative opportunities (Zahir, 2003). This capital movement
is known as Foreign Direct Investments (FD1) which refers to resources
brought into a host country by Multinational Enterprises (MNE). FDI flows
arc basically in the follow ing forms:
• Initial capital, equity capital or purchase of shares by investors in a
host country including investment in plant and equipment,
• Reinvested earnings from the initial investment, and
• Intraeompany loans and debt transactions or referred to as borrowings
and lending of funds between parent and affiliate enterprises.
FDI stimulates domestic investments and facilitates improvements in human
capital and institutions in the host country. Borenzstcin ct al (1998)
examined the role of FDI in promoting economic growth using endogenous
growth model and analyzed FDI flow's from industrial countries to sixty-nme
developing countries during the years 1970 to 1989. Hie results show that
FDI is a more important vehicle of economic growth than domestic
investment. FDI is also an important vehicle for technology transfer from
developed countries to developing countries (Karbasi, ct al 2005).
1

According to Meier (1994), FDI has played an important role in developing
economies which are characterized by lack of skilled manpower, capital and
infrastructure problems. They also sutler from high foreign debt repayment,
poor primary commodity prices and fluctuations in official assistance
restraining economic growth. This has an effect of reducing domestic
savings level. These economics suffer foreign exchange and saving gaps that
can be filled by foreign capital inflows.
FDI brings in an inflow of foreign exchange and new technology, generates
local value added and employment, infuses labour, marketing and
managerial skills, and contributes to taxes and royalties. For a developing
country, the inflow of foreign capital may be significant not only in raising
productivity and real wages of a given labour force but also increase the
number employed (Ayanwale and Bamire,2000).
FDI is associated with diffusion of imported skills and efficiency. Domestic
firms become more competitive as they become suppliers of foreign firms
upstream and buyers of products downstream. It offers the most efficient
way to take advantage of growth opportunities offered by the global
economy where firms increase efficiency and have direct access to the
global networks of their parent companies (Kaminski and Riboud, 2000).
Successful MNKs have been shown to have significant demonstration and
synergy effects on domestic firms. There exists spillover efficiency benefits
from foreign owned firms to locally owned ones (Blomstrom and Pcrsson.
1983).

FDI has been shown to have a positive relationship with GDP and thus the
economic growth in the absence of financial repression and trade distortions
(Fry, 1993). According to Kaminski et al (2000), FDI led restructuring
contributed enormously to expand Hungarian exports which was crucial to
tackle the serious balance of payments crisis in 1995.
Nevertheless, FDI has been noted to lower domestic savings by stifling
competition through exclusive production agreements by the governments.
In the long run, activities of foreign investments may reduce foreign
earnings on both the current and capital accounts. The current account may
deteriorate due to large importation of intermediate products and capital
goods, while the capital accounts may worsen because of profit repatriation.
Additionally, tax concessions, investment allowances, public subsidies and
tariff protection ofien provided by the governments, may mean the public
revenues from corporates may be less than expected (Wanjala, 2001).
The concern therefore is how- to attract flows of FDIs to different countries
because the benefits of the capital inflows outweigh the costs.
It has been argued that the economic reforms in many African countries,
including Kenya, have been incomplete and thus have not fully convinced
foreign investors. Kenyan economic survey (2002) notes that the lion's share
of Kenyan’s budgetary resources is gobbled up by public debt serviced at a
rate of Kshs. 30 billion per year and thereby crowding out expenditure and
creating a budget deficit. As a result, investment in development,
infrastructure, or other productive areas, is inhibited. In order to cut on debt
burden and budget deficits the government can invite foreign direct
3

investment on a massive scale to create productive global scale capacity in
infrastructure and industry and thus fill in the budget deficit gap.
Kenya’s economic performance had weakened in the 1990s because of the
failure by the government to sustain prudent macroeconomic policies, a slow
pace o f structural arrangements and persistent governance problems (IMF
report, 2000).
The often lax fiscal policy on crucial macroeconomic indicators namely;
taxation, money supply, interest rates and foreign exchange led to a rapid
build up of short term government domestic debts from a low of just KShs.
100 billion in 1994 to KShs. 289.4 billion by June 2003, according to the
Central Bank of Kenya (OBK) Annual report of the year 2004. This led to a
decline in savings rate translated to lending rates of in excess of twenty
percent i n real terms. This together with other i nflationary costs o f doing
business in Kenya brought about by corruption, a deteriorating infrastructure
and an inefficient parastatal sector (utilities and transportation) depressed
foreign confidence to do business in Kenya. Withdrawal of aid to the
government by the main foreign donors such as the International Monetary
Fund (IMF) and the World Bank slackened FDI flow and thus the economic
growth fell from 4.8% in 1995 to a mere negative 0.2% in 2000 (IMF 2000).
It then picked to a high of 5.2 percent in 2005. Reflected below is a graph
showing the FDI status in Kenya between 1985 to 2005, against the growth
pattern.
4

Graph 1.1.1
TREND OF Fl)l FLOW IN KENYA
8%
7%
6%. 11)1 Outflow
5% — FDI Inflow4%
“ rctm-miv yiimlh
3%2%
1%
1983-1995 2001 2002 2003 2004YEARS
Source: UNCTAD (2005) Flow overview, selected years
The graph indicates that FDIs were repatriated in the late 1990s as the
economic growth deteriorated up to 2002 and improved as soon as the
economic environment changed under new leadership which boosted foreign
investors’ confidence. As a result, FDIs to Kenya reached a peak ol 81
million US dollars in 2003. Nevertheless, the situation seems to be
deteriorating again.
According to UNCTAD (2005), most African countries, including Kenya,
concentrated policies on adjustment programmes over the past two decades
that failed to boost growth or reduce poverty levels, and by stalling
5

diversification and shrinking public investment, actually added to the
reduction of FDIs.
A Study by Karbasi et al (2005) indicate that FDI flows, both in developing
and developed countries, are affected by; economic growth, trade levels,
and macroeconomic policy variables, namely; inflation, taxation, interest
rates and government budgetary implementation.
A study by Wanjala (2001) on the determinants of FDI in Sub-Saharan
Africa (SSA) with inferences to Kenya shows that factors like the returns
(captured by GDP growth), taxation policy, and openness to economy are
significant factors affecting FDI flows across developing countries. He
further found out that country specific effects were relevant, which shows
that FDI to real GDP ratio is affected by other individual country
characteristics.
Wanjala (2001) concluded that there was need to do more studies on
economic and social factors and how they impact on FDI Hows in Kenya,
and whether these capital inflows play any role on reducing poverty levels.
According to the CBK Annual report (2004), some of the major
macroeconomic indicators monitored by the CBK that affect economic
growth include inflation, GDP levels, foreign and domestic investment
levels, trade level and government fiscal activities. This research paper will
seek to identify the most important macroeconomic factors that impact on
the flow of foreign direct investment to Kenya. It will seek to show that
proactive economic policies can generate FDI interest
6

1.2 Statement of the Problem
According to CBK Annual Report (2004), the net inward FDI flows to
Kenya sank to a low of US dollar 0.1 billion in 2003. Jiwaji (2004) noted
that Kenyans had paid and continue to pay a very high price both in
budgetary and economic costs for the Financial indiscipline of the 1990s
which was characterized by high Fiscal deficits, excessive domestic
borrowing that pushed interest rates up, and imprudent macroeconomic
policies that drove the foreign investors away. Such condemnation assumes
that an association exists between macroeconomic policy indicators and flow
of foreign direct investments.
Wheeler et al (1992), Markowiski et al (1995), Chakrabarti (2001) have
come up with results supporting the relevance of market related variables on
FDI flows such as GDI’, GDP per capita, inflation, government budgetary
implementation, trade and interest rates. Econometric tests performed by
UNCTAD (1998) reveal that the market size related variables remained the
dominant influence on inward l-DI even in the 1990s. Although many
aggregate econometric studies have been conducted, a broad based
consensus on the major determinants of FDI has been elusive. This lack of
consensus can be partly attributed to the lack of reliable and accurate data on
FDI flows and its potential determinants, particularly at country’ level and
sectoral level and the fact that empirical work has analyzed FDI
determinants by pooling a group of countries that may be structurally
diverse, that is, there could be substantial discrepancies in the basic
macroeconomic variables that characterize an economy. Further, little
7

research work has been done in Kenya on the determinants of FDI flow into
the country.
Of concern to us, therefore, is the extent to which these macroeconomic
indicators namely GDP, interest rates, inflation, exchange rate and
government expenditure levels identified by various scholars have on the
flow of foreign direct investment in Kenya. Do the changes in
macroeconomic indicators have any foreign direct investment signal in the
Kenyan environment?
1.3 Objectives of the Study
The broad objective of this study is to determine the relationship between
the various macroeconomic variables and the flow of FDI in Kenya. Specific
objectives will be;
• To determine the critical macroeconomic indicators and their
relationship to the flow of the FDIs to Kenya, and
• To develop a regression model that could be used to predict the level
of FDI based on the identified critical macroeconomic indicators
identified above.
8

1.4 Justification of the study
A proper understanding of macroeconomic determinants is expected to
enhance the capacity of policymakers to create a business friendly
environment and attract higher FD1 inflows with strong links to growth of
domestic economy. The study will highlight the areas of focus in
maintaining fiscal and monetary discipline in order to attract the much
needed foreign investments thus help the government in identifying
opportunities to expand its competitive strength to increase Kenya’s share of
global FDI. Financial intermediaries will appreciate the information
contained w'ithin the document and utilize it to plan financial strategies
based on shifts in the economic environment explained herein.
The study will be useful to international donors and organizations such as
International Monetary Fund and the World Bank who are interested in the
development of the emerging countries based on sound macroeconomic
policies.
Finally the research will add to the body of knowledge not only in finance
but in other areas of specialization and develop a better appreciation of the
forces impacting on economic growth in Kenya.
1.5 Scope of study
The study will cover the Kenyan economy from 1990 to 2005.This period
covers the era of distortions of macroeconomic policy variables brought
about by changes in leadership, privatization of major state corporations
9

leading to increase in foreign investor interest and introduction of d <>nor
related structural programmes that impacted on policy issues in the
management of the Kenyan government.
The early period of 1990s is noted to have been of mega comiption scandals
that affected foreign investment confidence in the Kenyan economy. It -was
followed by the mid 1990s where structural adjustment programmes w e r e
introduced to the economy by the multilateral donors. The late 1990s re f l ects
the period when the effects of the withdrawal of donor programmes* and
mismanagement of the economy were felt including capital flight. The year
2002 to 2005 on the other hand reflected leadership change that translated to
macroeconomics policy changes and increased donor confidence that
revived the economy though with mixed results.
10

CHAPTER TWO
LITERATURE REVIEW
The chapter will review previous theoretical and empirical literature on
macroeconomic determinants of FDI, highlight the linkage between
macroeconomic variables and foreign direct investments and conclude with
a review of the model building approach using regression analysis.
2.1 Theoretical Literature
Neoclassical theory
This theory explains capital flows with differentiated rate of returns across
countries leading to capital arbitrage where capital seeks highest returns.
Cockcroft and R iddell ( 1991) argue that future c apital flows depend on a
package of direct incentives which influence return, security of investment,
tax regimes, investment code or guidelines and overall macroeconomic
policies including those relating foreign exchange, domestic borrowing by
foreign firms, wages and employment regulations. The theory emphasizes
that addressing t he problem of legal infrastructure, labour, legislation and
taxation policy, price controls and exchange rate levels will improve
investment climate.
Portfolio theory
Portfolio theory takes into account the element of uncertainty that is missing
in other theories. Investors arc postulated to consider not only returns but
II

also the risk in selecting the portfolio to invest in. This theory is based on the
fact that fluctuations in rates of returns on capital within and even more so
between countries arc not perfectly correlated. Risks may therefore be
reduced by a diversification of portfolios, that is. diversification across
countries.
Theory of Institutional FDI fitness
Wilhems (1998) stipulates that FDI is determined less by intransigent
fundamentals than by institutional variables more amenable to change
namely policies, laws and their implementation. The institutions that
contribute to FDI fitness arc governments, markets, education and socio-
culture.
Organizational and Internalization Theory
According to this approach, foreign firms have oligopolistic powers on host
county markets. Firms choose an investment location because of
comparative advantage. Meier (1994) notes that foreign investment may also
be taken to gain control, thus MNHs engage in FDI to get external markets,
firm linkages, integration, transfer over inputs hence creating barriers of
entry to new competitors.
According to internalization theory firms keep operations internal through a
hundred percent subsidiary because they want to control risk and retain
control, market share pricing and economics of centralization that reduce
costs through FDI (Meier. 1994).
12

2.2 Empirical literature
According to Dunning (2002). FDI in developing countries has shifted from
market seeking and resource seeking FDI to more (vertical) efficiency
seeking FDI. Due to globalization-induced pressure on prices, MNEs are
expected to relocate some of their production facilities to low cost
developing countries with less inflation.
Ekpo (1996) incorporated uncertainty in his model to explain determinants
of FDI in Nigeria. Variables considered included income per capita, credit
rating, uncertainly (proxicd by inflation), policy reversals (proxied by debt
service), institutional and political factors and world rate of returns on
investment (proxied by long term US interest rates. Political regime change,
real per capita income, rale of inflation, world interest rates, credit rating and
debt service explained the various FDIs in Nigeria.
Wilhems (1998) tested the Fitness theory using an econometric cross section
analysis across 67 emerging economics. Hie analysis showed that the
government and market variables were the most significant determinants of
FDI inflows. Government fitness was reflected in economic openness with
only minimal trade and exchange rate controls. The theory used, suggest that
every nation has the opportunity to identify and expand its competitive
strength to increase its share of global FDI. The more the government does
to provide economic and i nfrastructural framework conducive to FDI, t lie
more FDI will be obtained.
13

Lewis (W79) as quoted by Wanjala (2001) argues that the prime
determinants of I-1)1 are economic considerations and that political variables
are of secondary importance. He tasted a model for 25 developing countries
from Africa, Asia and Latin America for the period between 1965-1967 and
found that the significant factors were GNP per capita, balance of payment
and capabilities of the government (as measured by share of taxes).
Nunnenkamp (2002) in his empirical study on determinants of FDI in
developing countries found that the traditional market related determinants
arc still dominant factors shaping the distribution of the FDI. Further, he
noted that the non traditional determinants such as cost factors,
complementary factors of production and openness to trade though mostly
revealing the expected correlation with FDI, have typically not become more
important with proceeding globalization. Noteworthy though, is that his
results were supported by the findings of Noorbakshsi, et al (2001); that the
availability of local skills has become a relevant pull factor of FDI in the
process of globalization. Efforts to provide better education and training
would not only enhance the economic growth efforts of FDI in developing
countries as shown by Borrensztcin, ct al (1998) but are also likely to induce
higher FDI inflows.
litis paper will therefore dwell on the macroeconomic determinants that
have been identified in previous literature with a focus on their importance
to the Kenyan economy.
14

Taxation
The aim of government taxation policies has remained multi disciplinary
with respect of attracting foreign investment at every stage. The main
objectives are:-
• Transference of managerial skills and advance technology to accelerate
pace of industrialization.
• Rural urban integration widening the process of development.
• Sectoral specific incentives to boost sectors strategically crucial like
agriculture and tourism.
• Promotion oriented incentives that enhance, export orientation,
employment generation, skill development and domestic value added
activities.
Foreign investors are more concerned with higher rate of after tax returns
and net worth of invested capital. Taxation measures directly affect the cost
of capital and hence affect the incentive to invest in specific projects. The
environment facing foreign firms will be different in each nation and
therefore the FDl flow. B igger taxation incentives as fiscal measures w ill
attract FDIs through the MNEs.
To attract the foreign investors, successive governments in any country,
offer various investments incentives in the form of tax concessions (tax
expenditure) and direct expenditure on infrastructural provisions. The
taxation policy of a host developing country has a great relevance for
multinational enterprises (MNES) involvement in the production activities.
It is perceived to be a significantly influential factor in determining the
15

inflow of foreign investment through the cost o f capital and the resulting
after tax return (Zahir, 2003).
The concept of tax expenditure is being used widely in the budgets of every
country as an alternative tool to provide financial reliefs to an economic
agent by increasing tax credits and tax relief (Ahmed, 1997).
Taxation therefore is a fiscal incentive that has a positive relationship with
the FDI offered by the host country (Nishat and Anjum, 1998). Further,
empirical studies have found a significant negative relationship between FDI
and the cost of capital plus taxation in both developing and developing
countries (Root and Ahmed, 1979). Overly, a lower tax burden would make
the investments, both domestic and foreign more profitable.
Gross Domestic Product (GDP)
Gross Domestic Product (GDP) is the total market value of goods and
services produced within a given country after deducting the cost of goods
utilized in the process of production according to the New Zealand Institute
of Economic Research (2006). It indicates at a glance, a country’s market size.
Real GDP per capita is often used as an indicator of how well off a country
is since it is a measure of average real income in the country. However, GDP
only covers market sector activities and does not take account of negative
elfects of economic activity like environmental degradation. In Kenya,
reflecting the impact of various policy and governance measures over 2003-
16

2005 periods, the economy recovered during the financial year with real
GPP growth improving from 1.8% in 2003 to 5.2 percent in 2005. The
economic growth is shown by the increase in real GPP. The CBK annual
report 2004 notes that as a result the investor confidence was regained with
the resumption of donor aid which is expected to impact positively to the
FPI flows.
However, real GPP growth is expounded by the major underlying sectors of
the economy. As noted in the monthly economic reviews published by
Central Bank of Kenya, economic growth relics on the tourism, transport
and communication, agriculture, manufacturing, trade, building and
construction. For example. Central Bank of Kenya Monthly Economic
Review for August 2005 notes that the GDP growth was 5.2 percent in 2005
up from 2.8 percent in 2003 mainly due to growth in tourism and transport
and communication by 15.1 percent and 9.1 percent respectively. In the
same period horticulture grew by 13.2 percent, the tea sector by 10.5
percent, manufacturing by 4 .1 percent, trade by 9.5 percent and construction
by 13.5 percent.
It’s noteworthy that factors like drought can impact negatively on the GDP
growth by affecting economic sectors especially agriculture. Terrorism
affects tourism while a strong local currency affects exports like horticulture
products. GDP growth rate is therefore an overall phenomenon explaining
the entire economy and it is used by investors to study the suitability of the
economic environment in terms of market size and returns.
17
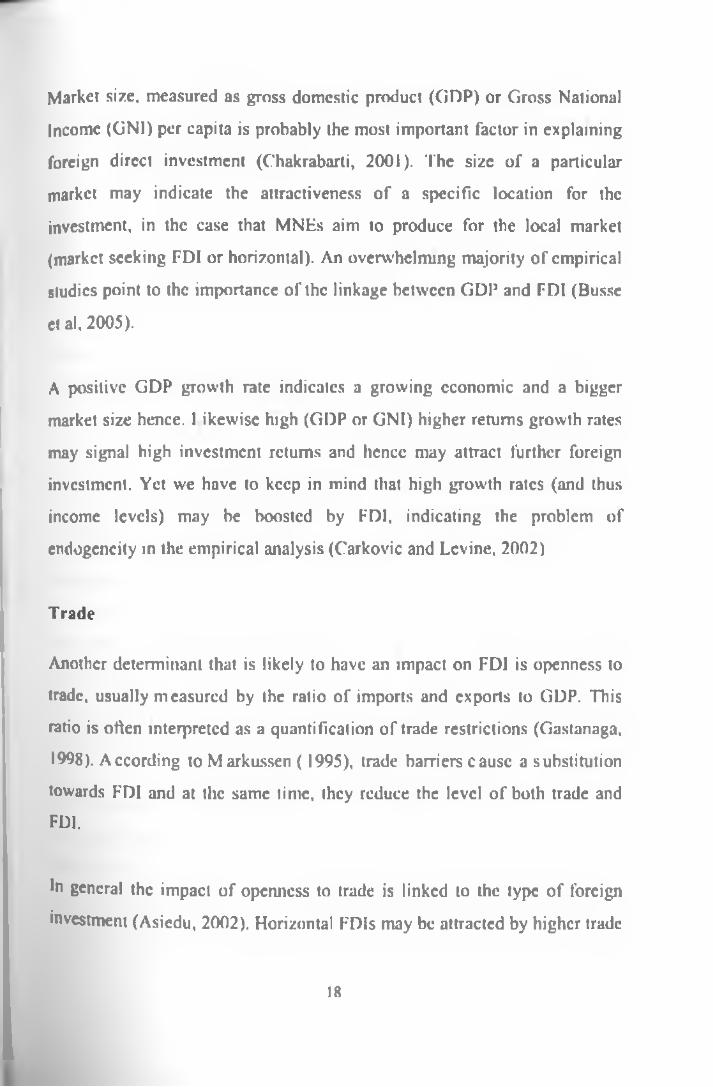
Market size, measured as gross domestic product (GDP) or Gross National
Income (GNI) per capita is probably the most important factor in explaining
foreign direct investment (Chakrabarti, 2001). The size of a particular
market may indicate the attractiveness of a specific location for the
investment, in the case that MNEs aim to produce for the local market
(market seeking FDI or horizontal). An overwhelming majority of empirical
studies point to the importance of the linkage between GDI* and FDI (Busse
ct al, 2005).
A positive GDP growth rate indicates a growing economic and a bigger
market size hence, l ikewise high (GDP or GNI) higher returns growth rates
may signal high investment returns and hence may attract further foreign
investment. Yet we have to keep in mind that high growth rates (and thus
income levels) may be boosted by FDI. indicating the problem of
endogeneity in the empirical analysis (Carkovic and Levine, 2002)
Trade
Another determinant that is likely to have an impact on FDI is openness to
trade, usually measured by the ratio of imports and exports to GDP. This
ratio is often interpreted as a quantification of trade restrictions (Gastanaga,
1998). According to Markussen (1995), trade barriers cause a substitution
towards FDI and at the same time, they reduce the level of both trade and FDI.
In general the impact of openness to trade is linked to the type of foreign
investment (Asiedu, 2002). Horizontal FDIs may be attracted by higher trade
18

harriers as they also protect the output of the foreign investor in the local
market against imports of competitors (tariff jumping hypothesis).
Conversely, MNF.s engaged in export oriented investment (vertical FDI)
may favour investing in a relatively open economy since trade barriers
increase transaction costs. Also trade restrictions may be linked to other
forms of policy imperfections, particularly in developing countries, such as
exchange rate controls, leading to a reduction of foreign investment inflows.
Overall, openness to trade may thus be positively or negatively associated
with FDI, depending on the country sample. The empirical evidence, on the
other hand, suggests that a positive link can be expected (Chakrabarti, 2(K)I).
Kconomic growth (changes in GDP levels)
Borensztain (1998) employed a data set of FDI inflows from the
Organization for Economic Cooperation and Development (OECD) member
countries to 69 less developed countries (LDC). The results indicate that FDI
is an effective conduit of technology diffusion to LDCs as well as economic
growth when there is a sufficient amount of human capital. Hence
Borcnzstein ct.al (1998) found that FDI positively correlates with economic
growth.
Similar studies by Campos and Kinoshita (2002) investigating the effects of
IDIs on 25 transitional economies of the former soviet bloc indicate that
FDI is a significant factor in economic growth. It must be observed that
there is an endogenous problem between FDI and economic growth rate (Carkovic ct al 2002).
19

Inflation and Interest rate
Economic survey of Kenya (2002) describes inflation as the sustained rise in
money prices generally. The consumer price index (CPI) is the main
estimator of the inflation rate. It is a macroeconomic indicator for general
economic and social analysis and is a tool used in wage and tax negotiation
and indexation, it is also a deflator of expenditure i.e. by deflating nominal
values (current costs) of goods and services by the prevailing CPI, the real
/constant value can be established.
The interest rates on the other hand have long been recognized as important
for the economy. Periods of stable interest rates have generally been more
favourable for both local and foreign investments. In Kenya, the base rate is
the rate at which the Central Bank of Kenya lends to other financial
institutions. Banks and other financial institutions usually follow the lead of
the CBK by adopting the base rate and this in turn affects the price at which
funds are made available to institutions and individuals and hence affects the
investment levels by investors within Kenyan money and capital markets.
Interest rates are supposed to moderate so as to cool down inflation and also
not to compromise the secondary trading of government securities. Inflation
in Kenya has been on the increase from 2004. As a result of the sustained
increase in fuel prices worldwide, a restructuring o f the transport systems in
Kenya and increases in food prices caused by drought, inflation stood at
19% by the end of March (The Standard Daily, March 31, 2005).
20
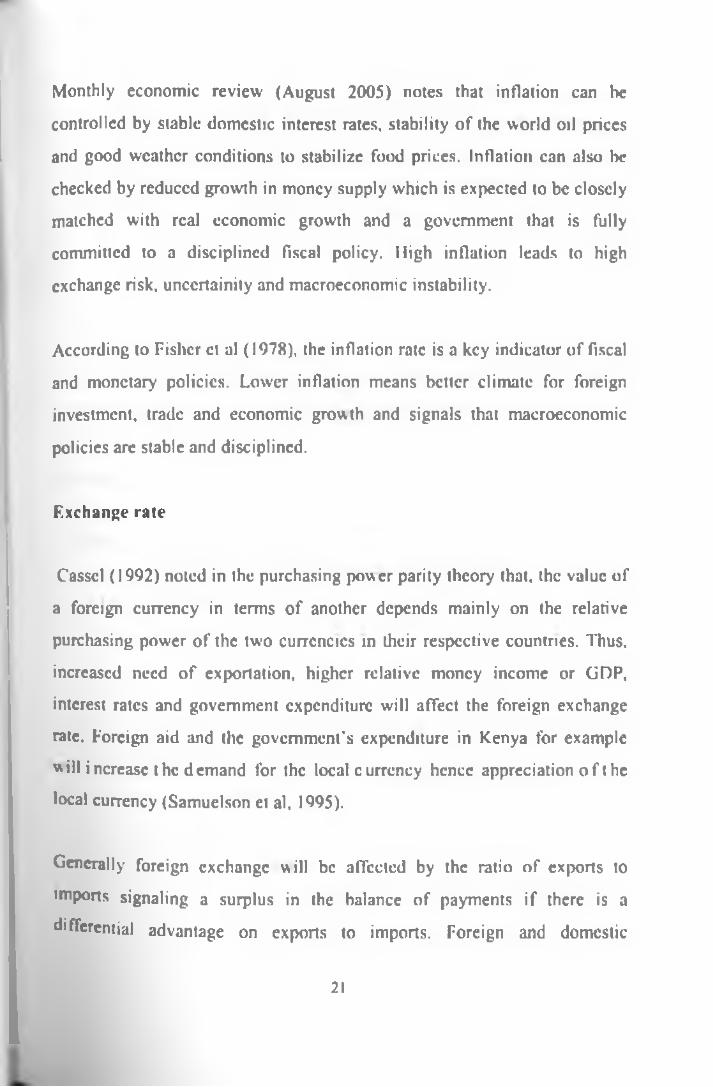
Monthly economic review (August 2005) notes that inflation can he
controlled by stable domestic interest rates, stability of the world oil prices
and good weather conditions to stabilize food prices. Inflation can also lx*
checked by reduced growth in money supply which is expected to be closely
matched with real economic growth and a government that is fully
committed to a disciplined fiscal policy. High inflation leads to high
exchange risk, uncertainly and macroeconomic instability.
According to Fisher et al (1978), the inflation rate is a key indicator of fiscal
and monetary policies. Lower inflation means better climate for foreign
investment, trade and economic growth and signals that macroeconomic
policies are stable and disciplined.
Exchange rate
Cassel (1992) noted in the purchasing power parity theory that, the value of
a foreign currency in terms of another depends mainly on the relative
purchasing power of the two currencies in their respective countries. Thus,
increased need of exportation, higher relative money income or GDP,
interest rates and government expenditure will affect the foreign exchange
rate. Foreign aid and the government’s expenditure in Kenya for example
will increase the demand for the local curreney hence appreciation o f the
local currency (Samuelson et al. 1995).
Generally foreign exchange will be affected by the ratio of exports to
imports signaling a surplus in the balance of payments if there is a
differential advantage on exports to imports. Foreign and domestic
2 t

repayments will depreciate a currency while repatriation abroad of private
capital will sustain depreciation. A favorable balance of trade and increased
foreign exchange reserves will appreciate the local currency (Monthly
Economic review. January 2006)
According to Central Bank of Kenya (C'BK) report for 2004, the
competitiveness of a country’s exports is a function of money factors of
which international value of its currency is one. If foreign demand is
responsive to domestic prices, a strong currency lowers demand abroad for
local goods w hilc a weaker c urrcncy h as t he opposite e ffect. For F Dls to
benefit from exchange rate differences will therefore depend on the whether
the MNEs arc export oriented (market seeking) or services oriented
(efficiency seeking)
Trade restrictions may be linked to other forms of policy imperfections such
as exchange rate controls leading to a reduction of the foreign investment
inflow's. A strong host country currency lowers the ability of exporting and
thereby increases the chances of imbalance of trade of a nation due to a
lower money reserve levels. Overall the importance of the exchange rate lies
m the stability of the host country currency. Unusual appreciations and
depreciations increases uncertainly on the value of goods being imported or
exported hence reduced investor confidence .Exchange rate volatility has a
negative influence to FDI inflow.
22

Government Budget Implementation
Developing countries, including Kenya, have severe debt problems which
continue to depress both domestic and foreign investment. They spent
significant amounts to service debt and thus end up with perennial budget
deficits. These deficits arc serviced by domestic and foreign borrowing that
increase interest rates and uncertainties of doing business. These fiscal
imbalances can be controlled by attracting FDls to seal the deficit gap
through investment in ailing public enterprises. The government can
encourage more foreign investments in key sectors like transport and
communication, health and education by facilitating a better business
environment Strict fiscal policy can reduce government borrowing from
domestic and foreign financiers which will stabilize interest rates and reduce
uncertainties of doing business in Kenya.
Domestic Investments
One of the important questions often raised is whether FD1 augments a host
country’s capital investment or crowds out domestic investment. Karbasi, ct
al found out that there is positive interaction between FDI and domestic
investment which means that the domestic investment is not crowded out in
developing countries which are usually in budget deficits and require
assistance, litis is a subject of scrutiny in future empirical studies.
23

2.3 Link between the Macroeconomic Indicators and FDI in Kenya
A considerable number of variables discussed above show relatively
persistent results with respect to their influence to foreign investment.
Market size, measured as Gross Domestic Product (GDP) or Gross National
Income (GNI) per capita is probably the most important factor in explaining
foreign investment (Chakrabati. 2001). The size of a market may indicate the
attractiveness of a specific location for the investment, in the case of a
multinational corporation aims to produce for the local market (horizontal or
market seeking FDI). Likewise high GDP or GNI growth rates may signal
high investment returns and hence may attract further foreign investment.
According to Central Rank of Kenya Annual report (2004), the Kenyan
economy has experienced a swing in its growth rate. In 1995, the real GDP
rate for Kenya stood at 4.8 percent, it slowed down to a negative 0.2 percent
in 2000 and then picked up to 5.2 percent in 2005. The changes arc mainly
explained by the loss of donor confidence in the economic management of
Kenya between 1995 and 2001. The change of leadership in 2002
experienced variations in various economic policy measures and
introduction o f t conomic R ecovery S trategy for Wealth a nd K mployment
Creation (ERSWLC). The growth to 5.2 percent i s according to the C BK
reports attributable to the restoration of the relationship with the
development partners and resumption of a poverty reduction facility
programme with the International Monetary Fund which revamped the
sectors of education, health and agriculture. It w ill therefore be of interest in
this study to see whether the GDP growth has been matched with an increase
or decrease in the FDI flow.
24

Another determinant that is likely to impact on FDI is openness to trade
measured by the ratio of imports and exports to GDP. This ratio is often
interpreted as a quantification of trade restriction (Gastanaga, 1998).
Horizontal FDls may be attracted by higher trade barriers as they also
protect the output of the foreign investor in the local market against imports
of competitors (tariff jumping hypothesis). On the other hand. MNEs
engaged in export oriented investment or vertical FDI may favour open
economy since trade barriers increase transaction costs. Further trade
restrictions may be linked to policy imperfections such as exchange rate
controls. Openness to trade may therefore be either positively or negatively
associated to FDI (Chakrabati, 2001).
As per the leading Economic Indicators Booklet for Central Bureau of
Statistics Kenya (2006), trade opportunities have been extended with the
opening to the American market for textile products under the African
Growth Opportunity Act (AGOA) till 2007. The expansion of the European
Union Market to include ten other countries hence the largest market bloc
has similarly provided export opportunities to Kenyan products which are
not charged any duty. Other positive developments likely to attract FDls are
the reversal of the adverse travel restrictions by the UK and the downgrading
of the negative advice by the USA. The regional integrations like COMESA
and East Africa Cooperation (EAC) have increased exports from Kenya to
the regions by 55 percent or KShs 66 billion in 2005, an attractive aspect for
FDls (Daily Nation, April 22 2005).
25

Further, the government of Kenya has reduced the number of licenses
required by foreigners to invest in Kenya. It is noteworthy though that in the
years 2004/2005 the exports of goods grew by 8.4 percent while the imports
grew by 19.1 percent. This narrowed the surplus in the balance of payments
and as per Gastinaga (1998). a higher ratio of imports to exports may reflect
a trade restriction which is inhibitivc to FDI flow.
Further market attraction is enhanced if a country has consistent
macroeconomic policy in place. Of importance are boosting of the growth
rates of an economy by small budgets, low trade deficits, low inflation and
stable interest rates in order to reduce the risk premium for foreign
investment decrease transaction costs and hence boost FDI inflows.
As per the CBK annual reports, inflation rose from 2.28 percent in 2003 to
8.18 percent in 2004 and currently is 19.9 percent. This negative impact is
attributable to drought that increased food prices and persistent increases in
world oil prices. H igh i nflation rate and interest rates will be expected to
impact negatively on the FDI flows especially given that it increases the risk
premium to FDIs.
On the fiscal front, the government has in the period 2002-2005 increased
revenue collection from KShs. 160 billion to over KShs. 240 billion in 2005
which have accompanied increases in both development and recurrent
expenditure. There also has been a reduced pressure on external debt
servicing following a rescheduling of the debt owed to the Paris club
creditors from KShs 30 billion in 2002 to 22.5 billion in 2005 (Central Bank
of Kenya annual reports 2004). This i s expected to create space for more
L
26

resources to be directed to infrastructure so as to attract FDIs in Kenya. The
study will thus check how annual surplus or deficit as a percentage of the
GDP impacts on the F;DI Hows in Kenya.
The research therefore will look at the following explanatory variables in a
regression model: CiNI per capita, stock market indices, ratio of imports and
exports to GDP, inflation, interest rates, fiscal balance, external debt, degree
of openness, debt service and taxation.
27
CHAPTER THREE
RESEARCH DESIGN AND METHODOLOGY
3.1 Research Design
This is a quantitative research utilizing secondary data sourced from;
❖ Economic Survey and Statistical Abstracts for the Republic of Kenya
❖ Central Bank of Kenya Publications
❖ United Nations Conference on Trade and Developmcnt(UNCTAD)
Reports for 2005 and previous years
❖ World Bank and International Monetary' Fund Publications.
The data sourced was annual in nature.
3.2 Population and Sampling Procedures
The population consists of the data of the variables identified in the literature
review for Kenya. This includes GDP Data, Real exchange rate, fiscal
balance, external debt, and taxation, degree o f openness, debt service and
stock exchange index. The Data was in Kenyan shillings and sourced
annually.
28
The study was restricted to the Kenyan economy for the period between
|9 ()0 and 2005. This period has been judgmcntally selected as it is more
relevant to the current situation
3.3 The Model
Due to the fact that FDI flow depends on a number of variables, multiple
linear regression is considered the best technique in determining the most
important variables that influence the flow of FDI in Kenya. The model to
be developed will reveal the existing relationship between the
macroeconomic predictors and the flow of FDI. The model follows that of
Levine and Renelt (1992) who used the initial level of income, investment
rate, the secondary school enrollment rate and rate of population growth as
standard variables in their regression model.
Generally, in multiple linear regression, the first step is the selection of
potential predictor variables (Hanke et al, 2003). Any variable that might
add to the accuracy of the model is included. After a seemingly complete list
of potential predictors has been compiled, the next step is to screen out the
predictor variables since a predictor variable;
• May not be fundamental to the problem, that is, there may be no
plausible relationship between the predictor and the response
variables,
• May be subject to large measurement errors.
• May duplicate other predictor variables thus creating the problem of
multicollinearity, or
29

• May he difficult to measure accurately or accurate data may be
unavailable or costly.
The final step is to shorten the list of predictor variables so as to obtain the
best selection of variables. The calculations in multiple regression analysis
arc ordinarily performed using statistical software such as SPSS.
The general regression model has the response variable related to the
predictor variables by;
Y = po + Pi X i + P2X2 + .... + (3,Xk + c
Where;
i) for the fth observation, Y ■ Y, and Xj, X2, ...» Xk are set values X.i,
Xa,...Xn,
ii) the c’s are error components that represent the deviations of the response
from the true relation. They arc unobservable random variables accounting
for the effects of other factors on the response. The errors arc assumed to be
independent and each is normally distributed with mean zero and unknown
standard deviation o.
iii) the regression coefficients pi, p2, .... Pk that together locate the
regression function are unknown.
Given the data, the regression coefficients can be estimated using the
principle of least squares.
30

From the predictor variables identified in the preceding sections we have the
regression model expressed as;
FDI - ^Market Size, Real Exchange Rate. Fiscal Balance, External
Debt, Taxation, Openness, Debt Service , Stock Exchange Index)
This can therefore be expressed as;
FDI = Ph + pi Market Size + p? Real Exchange Rate + p3 Fiscal
Balance + p4 Total External Debt + p5 Taxation + p6 Openness + p7
Debt Service f p8 Stock Exchange Index + P v Annual Inllation + Pm
Tax from International.
Explanatory Variables
Market size
Real GDP is used as proxy. Foreign firms choose investment in countries
with a bigger market and hence high returns. A positive GDP growth rate
indicates a growing economy and bigger market size hence high returns.
Real Exchange Rate
Real Exchange Rate (RER) is defined as the nominal exchange rate adjusted
for inflation. Exchange rate is expected to affect FDI on the firm’s cash
flows, expected profitability and attractiveness of domestic assets to foreign
31
investors. Devaluation affects profitability of local firms by raising the price
levels and raising the cost of imported inputs.
Exchange rate volatility leads to high exchange risk, uncertainty and
macroeconomic instability. On the other hand devaluation will increase FD1
if investment i s e xport o riented. The c fleet of R ER c annot be d etermined
before the data analysis.
Fiscal Balance
This refers to either surplus or deficit in the government budget. If the
budget deficits arc financed by domestic borrowing they will reduce FDI by
increasing the opportunity cost of retained earnings through increased real
interest rates. FDI will be encouraged by the deficit expansionary effects..
The effect can not be postulated till alter the study.
External Debt
Most African countries have severe debt problems which depress both
domestic and foreign investments .FDI can be used to substitute external
borrowing to fill the gap of savings and foreign exchange. High debt will
reflect need for foreign exchange through FDI.
Taxation
Taxation policy is important in the initial investment among countries. Tax
revenue from international transactions as proportion of total tax revenue is
32

used to reflect tax burden imposed on foreign investors. The higher the
taxation levels the lower the FDI. A negative relation is postulated.
Degree of Openness
Ease of investment is related to fewer restrictions of trading. Openness is the
total of exports and imports. The higher imports and exports the higher the
FDI thus a positive correlation is postulated.
Debt Service
Debt service can be seen to discourage both domestic and foreign investment
through crowding out effect on government expenditure. There is
considerable uncertainty when debt is being serviced from the countries own
resources. Debt service is used capture the liquidity and solvency constraints
imposed by the debt burden. The higher Debt service the greater the
uncertainty and therefore less FDI.A negative correlation is postulated.
Stock Exchange Index
It is widely believed that stock market activities reflect a country’s market
size and growth status. It also signals to the government and investors the
“feel good” factor prevailing in the economy. Annual percentage growth
rales of the NSH-20 INDFX as proportion to GDP will be used. A higher
ratio will be postulate greater investor confidence and therefore higher FDI.
33

Multiple linear regression was used in the analysis of the data. SPSS version
|2 software was used to carry out the analysis. Multiple linear regression is
ideal in the situation where many predictor variables arc considered. The
challenge w as to reduce the number of variables to only those which have
significant influence on the response variable. The principle of least squares
was used to determine the unknown coefficients in the regression model.
A thorough residual analysis was carried out to ensure that the basic
assumptions of regression analysis are not violated. This includes the
assumptions of independence of the error term; homosccdasticity, which
refers to the error term exhibiting constancy of variance; and normality of
the error term. Further, the variance inflation factors (VIF) was be used to
check on the existence of multicolhnearity. Multicollinearity refers to the
linear relationship between two or more predictor variables. This
phenomenon is not desirable in regression analysis. The F-test was used to
test the relationship between the key independent and dependent variables.
3.4 Data Analysis Procedure
34

CHAPTER FOUR
DATA ANALYSIS AND FINDINGS
4.1 Introduction
In this chapter, quantitative data were analysed with regard to the variables
namely; FDI Inflow, GDP Growth rate, GDP Absolute Market Value,
Exchange rate. Base lending rate. Fiscal Balance Total External Debt, Total
Tax Revenue, lax from International Transactions, Total Exports, Total
Imports, Debt Service, NSE Index, and Annual Inflation. Data were
analyzed using the SPSS version software. The backward regression
approach was used in the model building. This approach allows us to
evaluate all possible regression model for the given set of independent
variables. The criterion used in selecting the best regression model is the one
with the highest adjusted (Levine et al 2003). The findings arc presented
below:
4.2 Means and Standard Deviations of Variables
Table 4.2.1: Descriptive Statistics on FDI Inflows and specified macroeconomic variables.
Mean Std. Deviation NPDI Inflow 2,800,727,000.0000 2,583,721,091.63808 16GDPGrowthRate 2.6625 1.76404 16
GDP Absolute 682,352.3625 380,092.24620 16Exchange Rate 61.2444 18.38213 16Basel.ending Rate 23.6113 12.84137 16
Fiscal Balance -14.3757 11.66493 16
35

Total External Debt 316.2234 111.48933 16
Total Tax Revenue 143.8813 48.67957 16
Tax Inter Trans 36.9256 18.62165 16Total Exports 114.2981 65.29106 16Total Imports 179.9375 96.70157 16Debt Service 25.1563 8.85141 16NSE Index 2455.73938 1254.35290 16Annual Inflation 15.25000 10.60321 16
Table 4.2.1 above shows that the data was taken through a descriptive
statistics model where the mean and standard deviation of both the predictor
variable and explanatory variables was done.
According to the analysis, the PDI inflow' has a mean figure of Ksh
2,800,727,000.00 against a standard deviation of Kshs 23,583,721,091.63
reflecting a high variance of the data generally. This can be attributed to the
volatile nature of the inflow' of FDI in Kenya, in the period of study. For
example in 1999, the FDI inflow to Kenya was Ksh 3,091, 200,000 while in
the following year. It shot up to Kshs 9,933,378.000 according to the
International Monetary Fund statistics (2003).
36

4.3 FDI Inflow Analysis
Graph 4.3.1 FDI Inflow to Kenya 1990 to 2005.
FDI Inflow
♦ f Dt inflow
Graph 4.3.1 indicates the pattern of the FDI inflow over the years 1990 to
2005. Noteworthy observation here include the fact that FDI inflow tended
to be low in the pre-election years of 1991. 1996 and 2001 then rose steeply
in the post election years of 1995, 1999 and 2003.
These tends to reflect the fact the International Donors like IMF and World
Bank the MNEs through FDIs have tended to reduce their funds flow into
the country in the years prior to election because of the general fear that a lot
of this funding may be relocated to support the elections rather than the
hinds objective. These sentiments then tend to affect the FDI inflows in the
year 1991, 1996 and 2001 when the flow deteriorates drastically. This points
to the direction that the FDI inflow is also strongly affected by the political
atmosphere.
37

4.4 Correlation Analysis of the variables
Appendix I attached explains the correlation results of the variables after the
analysis. According to the table, the GDP growth rate in Kenya has a
negative correlation to the FD1 inflow of approximately -9.3%. This is
contrary to the cross-county studies done showing that GDP growth rate is a
positive factor to the FDI inflow. This can be attributed to the fact that low
growth rate reduces investors confidence to the government and in a
desperate step to increase investors inflow and reduce budgetary gaps, the
government disposed its assets in parastatals.
It's noteworthy that in the year 20(H) for example, the government of Kenya
disposed off 40% of its stake in Safaricom to Vodafone. Vodafone as a
result paid Ksh 1.543 billion as a licence fee to Communications
Commission of Kenya. Further, in the same year the government was paid
by Kencell a license fee of Ksh 3.0 billion, by Kencell being a French
investor in Kenya. This inflow of foreign exchange to Kenya helped to fill
the budget deficit gap the government had in 2000. Further the disposal of
40% Safaricom equity to Vodafone increased FDI inflow in that year, hence
the high figure of FDI inflow ofkshs 9,933, 378,000 in the year 2000
Further the correlation analysis shows that, FDI inflow is positively
correlated to the Total External Debt, Total imports and Total exports while
it is negatively correlated to Tax on International transactions. Inflation and
NSE Index.
38

Foreign Direct Investments (FDI) is however also negatively correlated with
economic adversities like high inflation as suggested by Table 2. This results
match with that identified by Wheeler (1992), Makiniski (1995) and
Chakrabati (2001). This is built from the fact that inflation increases the cost
of doing business and the related risks hence a disincentive for investing
FDIs to Kenya.
Foreign Direct Investments is negatively related to NSH Index levels
because investors are shy to invest on overpriced shares in the NSE index
symbolized by the growth in the Index levels. The foreign investors will tend
to buy when the prices are low and the index low. hence the low FDI in
relation to NSE Index.
39

Tabic 4.4.1: V ariables picked for the model
Model Variables 1 meted Variable* Removed Method1
Annuul Inflation. . NSF. Index. Annual GDP in % . total External Debt, Total Fx ports. Tax on International Tianuctioiu, Total lmpom<a)
Enter
2Fiscal ll.il.mte flackwaid (criterion Probability o f
F-to-remove .100),3
Lending Rule Baekwaidf criterion. Probability o f F-to-remove >= .100)
4Exchange Rate Backward ( criterion Probability o (
F-to-remove >- 100)
5Absolute GDP Backward ( criterion Probability o f
F-to-remove >* 100)6
Total Tax Uuckwurd ( criterion Probability o f F-to-remove x* 100)
7• Total Imports Duckwurtl (criterion Probability o f
F-to-remove >= .100)8
Total Exports Backward ( criterion Probability o f F-to-remove^ .100)
9Tax on International Transaction* Backward 1 criterion Probability o f
F-to-remove >- .100).10
Annuul GDP in % Backward (criterion: Probability of F-to-remove >- .100)
IIAnnual Inflation Backward (criterion: Probability o (
F-to-remove >• .100).
a All icqucstcd variables entered, b Dependent Variable FDI Inflow
Table 4.4.1 above presents the variables that have been analyzed that affect
the FDI inflow to Kenya. Out of the eleven variables, seven variables were
picked out that explain the FDI inflow to Kenya. They arc inflation.
Absolute GDP NSE Index, Total External Debt. Tax on International
transactions. Total Imports, and Total Exports and GDP growth rate.
40

4.5 The Model
Following the correlation analysis done in Appendix 2 and the subsequent
variables picked out, the analysis came up with the following model
summary:-
Table 4.5.1 Model Summary
Model R R SquareAdjusted R Square
Std. Error of the Estimate
1 .906(a) .820 .101 2449376481.4662 .905(b) .820 .324 2123542476.6673 .902(c) .813 .440 1933450859.8314 .898(d) .806 .515 1800092625.0955 .894(e) .800 .571 16919281‘>0.1756 .891(0 .794 .613 1606961351.0317 •844(g) .712 .521 1788950419.5118 .843(h) .710 .566 1702892183.3159 .812(i) U>59 .535 1762664131.98310 .795(j) .632 .540 1753098450.12811 .731 (k) 1.534 .463 1893624099.306
The best model is the model with the highest value of the adjusted R square. Therefore model 6 has been selected
The model’s predictor variables are; the Constant, Annual Inflation, NSF. Index, Annual GDP in %, Total External Debt, Total Exports, Tax on International Transactions, Total Imports
The R Square value for the selected model is 0.794 which is the best among the twelve models. This implies that the model’s predictor variables explain approximately 79.4 percent of the variances in FD1 inflow.
Appendix II attached presents the coefficients for the model.
From the analysis of the / statistic of the individual predictor variable, it is seen that the Total Exports and Total Imports are not relevant in the model (t
41

values o f-1.783 and 1.776 respectively) and hence these variables have been eliminated. (t critical = 1.860).
ITic selected model therefore becomes;
FDI inflow - 8.17E+I09 1.14E+109GDP growth rate + 3.35E+107 TotalExternal Debt - 1.784E+IO*Tax on International Transactions - 1.265E+I06NSE index - 2.219E+I08 Inllation rate
42

Table 4.5.2: ANOVA Analysis for the model
Model Sum of Square* .If Mean Square F S.*6 Rcgrrvuon
Residual
794756219209759 00000000 206585982ft96561
7
8
11353660274425130 1 000 000
25821247837070130
4 397 027(f)
oooonooo 00.000Total 100134220190632
000000.000 IS
Predictors: (Constant), Annual Inflation, NSE Index, Annual GDP in %, Total External Debt. Total Exports, Tax on International Transactions, Total Imports
From the ANOVA table, it is clear that the regression model selected is significant. This is because the F value for the model (4.397) is greater than F critical (3.505). Note that a = 0.05.

4.6 Miilti-colinearitv, Momosccdasticity and lleteroscedasticity
A residual analysis was arrived out to ensure that the basic assumptions of
regression analysis are not violated. This includes assumptions of
independence of error term, constancy of error term and normality of t he
error term.
Graph 4.6.1: Normality of the Error term
Histogram
Dopendent Variable: FDI Inflow
Regression Standardized Residual
The histogram shows that the assumption of normality of the error term has
not been violated. This is further supported by the normal probability plot
shown below. The multicolincarlity assumption has therefore not been
44

violated where there is a linear relationship between two or more predictor
variables.
Graph 4.6.2: Autocorrelation
Normal P-P Plot of Regression Standardized Rosidual
Dependent Variable: FDI Inflow
Graph indicates Normality plot of the regression model indicates the
independence of the error term. It shows that the probability of the
autocorrelation between the dependent variable (FDI) and the independent
variables identified is low. This ensures that the problem of autocorrelation
in the analysis is taken care of.
45

Graph 4.6.3: Scatter plot
Scattorplot
Dependent Variable: FDI Inflow
Regression Standardized Residual
Graph 4.6.2 above indicates the residual plot docs not seem to depict any apparent pattern. Thus, it can be assumed that the model has not violated the homoscedasticity assumption which refers to the error term exhibiting constancy of variance.
46

Graph 4.6.4 FDI Inflow and GDP growth rateM M I-- - ---------- --------------
------fOI Mow *. KIM B — «nnu»l OOT Onovi X
There is need lor further research into the relationship between FDI inflow and GDP growth rate. This is because the relationship exhibited from this analysis seems not to be in line with expectations. FDI Inflow and GDP growth rate seems to be moving in opposite direction as can be seen from the regression equation sign.
47

Graph 4.6.5: FDI Inflow and the NSE Indexwoo
1000
too
. . II5
I 400
too
Grapli 4.6.4 above indicates that FDI is negatively related to the nse in NSH
index levels because investors arc shy to invest in overpriced shares in the
NSE index depicted by growth in the Index levels. The foreign investors will
buy w hen t he prices o f s hares a re low or u nder-priccd d epicted b y a low
NSE Index figure. I lencc the negative relationship.
48

Graph 4.6.6 FDI Inflow and inflation rate
M M U N
• M l IM > 1 M ) '* » • ' • * • U N 1MT i m U N MOO 7001 JOOJ >001
-tnnuM t Inflations • r D* Inflow in Kgfl* n
From Ciraph 4.6.5, FDI is negatively related with economic adversities like
high intlation. This is built from the fact that Inflation increases the cost of
doing business and the related risks hence a disincentive for FDI inflows
4.7 Conclusions
In a nutshell, the data analysis brings out the fact that FDI Inflows to Kenya
is negatively affected by high inflation figures, high taxation levels on
international transactions and high NSE Index figures which depict over
priced shares. The research findings show that FDI Inflow's arc increased by
high imports/exports levels. This is attributed to the fact that such increases
depict openness to trade and markets. FDI Inflow is also positively related to
increased Total external Debt attributable to the fact that increased loan
facilities by the major multilateral agencies like IMF and World Bank
49

reflects increased confidence on the economy and hence the trickle down
effect on foreign investors including MNEs which increases the FDI Inflows
to Kenya. FDI inflows to Kenya arc depicted as negatives affected the GDP
growth rate. This is attributable to the fact that when GDP growth rate is
low, there is less Donor confidence and therefore less funding from
Multilateral Donors. This leads to budgetary deficit gap that pushes the
government to sell its stakes on parastatals to MNF.s in order to fill the
budgetary gap. The trend therefore leads to higher FDI inflows to Kenya
when GDP growth rate is low. An example is the year 2000 when the FDI
Inflow was at a peak of Ksh nine billion while the GDP growth rate was at a
low of 0.4%.
50

CHAPTER FIVE
SUMMARY, CONCLUSION AM) RECOMMENDATIONS
5.1 Summary
The two objectives of the study were to determine the critical macro
economics indicators and their relationship to the flow of FDIs to Kenya and
to develop a regression model that could be used to predict the level of FD1
flow based on the identified macro economics indicators. To satisfy the
objectives of the study, the secondary data was collected from established
sources of Central Rank of Kenya and Central Bureau of Statistics. The data
was analyzed using the SPSS software which brought out descriptive
statistics, tables, histograms, means, standard deviations and a model which
were used to draw conclusions on the findings.
5.2 Discussion
5.2.1 Total External Debt and Fiscal imbalance on FDI Inflow
The research findings arc presented in chapter four and the following
conclusions w ere drawn in the light of the objectives of the study.
According to findings in the previous chapter, developing countries
including Kenya have severe debt problems which continue to depress both
domestic and foreign investment. The Data analysis indicates that Foreign
Direct Investments have been mainly attracted by a suitable business climate
in Kenya i.c the importance of a suitable economic environment
51

The findings on this research postulate that FDI Inflow is heavily affected by
the high inflation, high Taxation levels for international Transactions, high
NSH Index figures which depict overpriced shares. The research findings
show that FDI Inflows are increased by imports and exports figures
showing increased openness to trade in Kenya.
The fiscal imbalances faced by the Kenyan government over the years has
forced it to dispose its stake in the government owned parastatals to foreign
investors, typical cases being Safaricom stake of 40% sold to an MNE
Vodafone in 2000, Kenya Airways 50 percent state sold to KI.M in 1995.
This attracted huge capital flow to Kenya in 1995 of Kshs 1,846,020,000 and
Kshs 9,933,378 in the year 2000, and is contrary to the theory that increased
GDP growth increases FDI inflow. In the Kenya n scenario the GDP growth
rate was 0.4% in 2000 while the FDI inflow was very high explained by the
fact that the government when hard passed tend to dispose its slakes in
parastatals to foreign investments.
Additionally the findings postulate that higher external debt levels from the
major donor bodies like IMF and World Bank helps to boost the investors
confidence hence higher FDI inflow through MNE’S. This is why there is a
positive relationship between external debt levels and FDI inflow. For
example bad relations with the World Bank and IMF between 1991 to 1994
led to low FDI flow in those years and subsequently the less FDI flow in
those years.
52

5.2.2 Pre/post elections and FDI Inflow
It has also been noted from the study that FDI inflows tended to be going
down in the pre-election period meaning that lack of investor confidence and
uncertainties brought by leadership changes in the pre-election years 1991,
1976. and 2002 played a big role in the fall of the FDI inflow in 1992 to Ksh
217.260.000 from 527, 716.0(H) in 1991, fall of FDI inflows from Ksh
1.846.020.000 in 1995 to 715, 260,000 in 1996 and a fall in FDI levels from
Ksh 9,933,378.000 in 2000 to Ksh 3.960,936,000 in 2001, all these being
prediction years. The donors uncertainty and worries that much of the
money borrowed by the government in the pre- election years might be used
for election campaigns meant loss in IMF and World Bank support and
hence this little investor confidence trickled down to less MNE’s confidence
to bring in FDI to Kenya. Indeed, the FDI inflow to Kenya has been highly
twisted with election years. In immediate post election period of 1995 and
2003, it is noted that FDI inflow to Kenya increased to Ksh 1,846,020 and
Ksh 6,150,330,000 respectively.
5.2.3 Government divestiture and FDI Inflow
Further it is noted from the FDI trend that in the latter years from 1995
onwards, the government with the assistance of world financial bodies came
up with restructuring programs that emphasized in the need of the
government to privatize most of their interest private investments and
concentrate on provision of services. Subsequently the government in 1995
sold part of its shareholding in Kenya Airways to KLM of 50% stake hence
the high level of FDI Inflow in 1995 of Kshs 1,846,020.000. in the
subsequent years the government sold to the public including foreigners it
53

equity stake in Kenya Airways (1998), Mumias Sugar (2000), Kenya
Commercial Rank (2001), KenOen (2006), Safaricom (2000). These
investments in the aforesaid period increased the FDI Inflows to Kenya
through equity investment by donors.
5.3 Conclusions
The Data Analysis has depicted that increased cost of doing business in
Kenya through high inflation and taxation costs are the main impediment of
reduced FDI inflows to Kenya. This is captured in the years 1991 to 1994
when the inflation reached a peak of 46% while FDI was at its lowest.
Inflation and higher taxation are therefore a disincentive for FDI inflows to
Kenya..
Further, the analysis has captured the fact that the other factors notably the
pre and post election fever highly affects the flow of the FDIs i.c. the
multilateral donors will tend to reduce their assistance before the elections in
fear of misuse of funds and release them soon after. 'This had a trickle down
effect on the MNEs confidence to bring in more funds hence the fall of F DIs
in 1991, 1996 and 2002 and their rise in 1998 and 2003.
Also, it has been noted that through the government divestiture program,
which started in 1995 improved the flow of FDIs to Kenya through
agreements with MNEs i.c. Safaricom/Vodafonc, Kenya Airways
Commercial Bank and Kenya Airways. This distinctly improved FDI
inflows figures in 1996, 1998 and 2002.
54

Its noteworthy though that the government divestiture program was driven
by the fact that they had budgetary deficits rather than the fact that they were
creating an environment to attract FDIs. Indeed the flow of FDI into Kenya
according to the Standard Daily of 23 August 243 August 2006, has
deteriorated in 2004 and 2005 to the advantage of the neighbours Uganada
and Tanzania because of the poor state of the infrastructure and high cost of
doing business through inflation and taxation which drives even Kenyan
investors away to the negihbouring countries. The Daily paper reported that
Kenya only attracted 46 new investors in 2005 compared to 237 of Uganda
and 270 new investments in Tanzania.
In a nutshell, FDI inflow in Kenya has largely been dependent to a
multifaccd number of causes. The research draws the overall conclusion that
high i n flat ion a nd t axation causes 1 ower FDI I nflow w hile h igher i mports
and exports levels increase FDI inflow. This high FDI inflow however are
fundamentally caused by underlying reasons notably, political
reasons! pre/post election) government divestiture programs aimed at
reducing budget deficits and improvement in the state of infrastructure that
decreases the cost of doing business in Kenya.
The FDI inflow analysis further brings out the fact that high NSH Index
figures do not translate to more FDI inflow rather they depict that the NSF
market shares arc overpriced and therefore most foreign investors will shy
away and wait for a bearish market showing that they are looking for under
priced shares.
55

Further it has been observed that FDI inflows to Kenya is positively related
to imports and exports depicting that there is openness to trade and markets.
Also higher total external debts attributable to increased loan facilities by the
major multilateral agencies like IMF and World Bank reflects increased
donor confidence to the economy and this trickles down to foreign
investments through MNHs. Hence increased Multilateral lending increases
FDI inflows in Kenya depicted by the periods 1995, 1996 and 2003.
5.4 Limitations of the study
rhe extent of the study was limited to varying data collected from different
sources hence the reliability and accuracy of data on the variables was a
major hiccup. Also, improperly kept data on the macro economic variables
in the Central Bureau of Statistics meant that data collection took longer
because it had to be cross checked to other sources of the same data. This
time impediment limited the degree of analysis of the data.
5.5 Recommendations for further research
FDI inflows are very important in creating wealth in the country through job
creation, a stable economy and poverty levels. Future research can be carried
out on how various economic sectors like agriculture, tourism, transport and
communication impact on FDI inflow to Kenya. The effect of corruption on
FDI inflow to Kenya is also an area of probable study. Further research can
be done on the relationship between FDI inflow to Kenya and the Stock
market performance.
56

REFERENCESAhmed. Qazi Massod (1997). The influence of Tax Expenditures on Non-residential
Investment: Unpublished PHD Dissertation, University of Bath.
Alizcra, K., Mohamadi, E and Ghofrani. S. (2005). Impact of Foreign Direct
Investment and Trade on Economics Growth. Economics Research Forum paper,
Egypt.
Asicdu, E (2002) On the Determinants of Foreign Direct Investment to
developing countries: Is Africa different? World Development 30(1): 107-119.
4.Ayanwalc B. and S.A Bamirc (2000).lnfluence of Direct Foreign Investment on
Farm l evel Productivity in the Nigerian Anglo-Allied Sector. An African Economic
Research Consortium Report.
Borcns/tcin, E., De Gregorio. J and J.W I.cc, (1998). " How Foreign Direct
Investment affects economic growth.” Journal of International Economics 45, (1998)
115-135.
Blonigen, B. (2006). Foreign Direct Investment Behavior of Multinational
Corporations: National Bureau of Economic Research.
Blonistrom M. and H.Persson (1983).Foreign Direct Investment and Spillover
Efficiency in an underdeveloped Economy; Evidence from the Mexican
manufacturing industry World Development Vol II.no 6.
Carkovic. M and R. Levine. (2002). “Docs Foreign Direct Investments Accelerate
Economics Growth” (Unpublished).
5 7

Central Bank of Kenya (2004). Annual Report.
Chakraharti. Avik (2001). The Determinants of Foreign Direct Investment.
Sensitivity Analyses of Cross Country Regressions, Kyklos, Vol 54. No. 1
Cockrufl.L and CR Ridcll [1999J. Foreign Direct Investment in Sub Saharan
Africa. World Bank Policy. Research and External Affairs Working Papers.
No.619
Ekpo H.A. [1996]. Government Policy and private Foreign Investment in
Nigeria, 1960-1994. An African Economic Research Consortium Paper.
Fisher, S., and F.Modigliani (1978). "Towards an Understanding of the Real Effects
and Costs of Inflation". Itwirtscha Fllichcs Archiv 4; 810-33.
Gastanaga, Victor. Jeffrey Nuget and Bistra Pashamora (1998). Host Country
Reforms and I DI inflows: How much difference do they make? World Development,
Vol.26. No7. pp. 1299-1314.
International Monetary Fund [2000. Kenyas Economic and Financial
Performance Indicators.
Harvey Jack [1993]. Modern Economics; Sixth Edttion.
Jackson. Sharon. Stefan Markowiski (1995). The attractiveness of countries to
Foreign Direct Investment. Implications for the Asia-Pacific Region. Journal of
World Trade 29(5): 159-179.
Karbasi, Mohamadi E.. and Samane Gholrani. [2005]. Impact of Foreign Direct
Investment and Trade on F.conomics Growth. Economics Research Forum
paper. Egypt.
58

Kokko. A. (2002). Globalization and FDI Incentives Paper presented at the Annual
Bank Conference on Development Economics in Europe, Oslo. Mimeo.
Levin D. Krchbiel.T, Mark Berenson (2003). Business Statistics, third edition person
Education Inc, Delhi.
Markoswi, Stefan (1995). The Attractiveness off Countries to Foreign Direct
Investment. Implications for the Asia-Pacific Region. Journal of World Trade
29(5); 159-179.
Markusen, James R (1995). The boundaries of Multinational Enterprises and the
theory of international trade. Journal of Economic Perspectives. 9(0) 169-189.
Mathias 13. and Hefeker, C. (2005). Political Risk, Institutions and Foreign
Direct Investment, HWWA discuss paper No.315 Hamburg I nstitute of International
Economics.
Mcir. G.M.fl994]. Private Foreign Investment in Deseloping Countries; Policy
Perspectives. International Center for Economic Growth. Occasional Paper no. 59.
San Francisco, California.
Monthly Economic Review. August 2005. Central Bank of Kenya publication.
Monthly Economic Review, January 2006. Central Bank of Kenya publication
Mutoko, Regina (2005). Research paper on Treasury hill interest rates and
stock market prices. University of Nairobi.
New Zealand Institute of Economic Research (2006). GDP: its measurement and
59

meaning NZIER publication.
Nishat. Muhammad and Anjum Aqeel, (1998). The Empirical Determinants of Direct
Foreign Investment, Savings and Development, XXII (4).
Nunncn Kamp. Peter (2001). Foreign Direct Investments in developing countries :
what policy matters should not do aud what economists don't know Kiel Institute of
World Economics, Discussion paper 380.Kiel.
Nunncn Kamp Peter. (2002). Determinants of FDI in developing countries: ‘Has
globalization c hanged the r ulcs o f t he g ante' A Kiel working paper No. 1122 (Kiel
Institute of World Economics. Germany).
Root, Franklin, R and Ahmed. A. Ahmed. (1979). Empirical Determinants or DF1 iu
Developing Countries, Economic Development and cultural change. 27 (4).
Schneider, Friedrich and Bruno Fiey (1985). Economic and Political Determinants of
Foreign Direct Investment, World Development, Vol 13, No2, pp 161-175.
The Daily Nation April 22^ 2005. The East African Integration, a daily publication
The Standard March 31'', 2006. Interest rates on the decline, a daily publication.
The Standard August 23,J 2006. Kenya lags in FDI inflows, a daily publication
UNCTAD (1998). World Investment Report
UNCTAD [2005 World Investment Report.
Wanjala C (2001) A research paper on the determinants of FDI in Subsaharan Africa University of Nairobi
60

Wheeler. D and Ashoka Mody [1992). International Investment l ocation
Decisions; The case of US firms. Journal of International Economics, Vol 33,
No.l, pp 57-76.
l evin D. Krchbiel. T. Mark Benson (2003). Business statistics, third Edition Pearson
Education Inc, Delhi.
Wilhems K.S.S [1998|. Foreign Direct Investment and its Determinants are
emergency consumers. African Economic Policy Paper, No.9.
World Investment Report (2000), Cross Borders Mergers and Acquisitions and
Development, UNCTAD.
Zahir Shah. (2003) Fiscal Incentives, the cost of capital and Foreign Direct
Investment in Pakistan: a neo-classical approach. Pakistan Institute of Development
F.conomics Conference (PIDE).
61

Appendix I: Pearson Correlation Analysis of the variables
FDI InflowAnnual GDP in % Absolute GDP
ExchangeRate
LendingRate
FiscalBalance
Total External Debt , Total Tax
TaxonlntcniaiiociTransactions
P&irtonCorrelation
FDI Inflow 1.000 -093 639 .673 -439 -J10 573 1 509 '.556Annual GDP in S -093 1000 284 017 -404 004 .227 1 344 1 -.027Absolute GDP 639 2)44 1 000 .850 -435 -592 .790 885 505Exchange Rate 673 .017 850 1 000 -097 -431 929 887 758Lending Rale -439 •404 -.435 -.097 1 000 015 -.091 -231 -163Final Balance -310 004 -.592 -431 015 1.000 -.251 -344 030Total External Deb* 573 .227 .790 929 -.091 --251 1.000 927 708Total Tax 509 344 885 .887 -73. -344 .927 1000 665Tax on International T ransact lo o t $56 -.027 50$ .758 -163 .030 .706 665 1 000
Toul Exports .635 ,6 4 969 876 -.311 -562 797 887 561Total Imports 622 257 947 889 -308 -498 836 .924 .663NSF. Index -044 495 324 333 021 .089 573 621 270Annual Inflation -.548 -J9 . -.550 -429 735 -.003 -424 -.513 -673
62

Appendix II : Coefficients for the model
Mode! Unstandardi/cd Coefficients Coefficient: t St* ConetiUrans Colltneanty Statistics
B Sid Error BetaZero-order Partial Pan Tolerance VIF
6 (Constant) 8171375870.995 3311724116.113 2 467 039Annual GDP m% -1140385391932 476826131348 -.779 -2392 044 -093 -646 -384 243 1 4 110Total External Debt 33520121 075 12014502.625 1 446 2790 024 573 .702 448 .096 | 10422Tax onInternational -178390498.300 79711224 236 -1 286 -2 237 056 .556 -620 -359 .078 12 805TransactionsTotal Exports -8J73J967 736 48076870.330 -1167 -1 783 .112 635 -533 -286 017 j 57135Total Imports 58648270 010 130239I6 6S0 1195 1.776 .114 .612 532 .285 .017 59139NSE Index •1265481 710 543604 390 -.614 •2 328 .048 -044 -635 -374 .370 2-701Annual Inflation -261851531.813 93034362.868 -1.075 -2 815 .023 •548 -705 -452 .177 | 5.653 1
j Dependent Vviable: FDI Inflow
63