an analysis ofwater use in minnesota - minnesota … analysis ofwater use in minnesota ... a plan...
TRANSCRIPT

An Analysis of Water UseIn Minnesota
Report to the
Legislative Commission on Minnesota Resources
by the
Department of Natural Resources
Division of Waters
November, 1987
This document is made available electronically by the Minnesota Legislative Reference Library as part of an ongoing digital archiving project. http://www.leg.state.mn.us/lrl/lrl.asp

Report to theLegislative Commission on Minnesota Resources
An Analysis of
Water Use
In Minnesota
November, 1987
P. Gi lmer Young
Department of Natural Resources
Division of Waters

An Analysis of Water Use in Minnesota
Acknowledgements
The author would like to thank the Legislative Commission onMinnesota Resources for providing funds for this project. I amindebted to Hedia Adelsman, original project manager, for herinsight in all phases of this project. Also deserving much creditis Monte Rude, data specialist extraordinaire, for his enthusiasticpursuit of all things quantifiable. Many thanks go to FeliciaWhi te for her dil igent typing of numerous drafts of thi s document.
i i;

, \
v
Conclusions and Recommendations •••..•••••••••••• 41
1
45
6
8
43
35
25
32
viivii
· . . . 23
· . . . • 8
• • • • • 7
. . . . . . . . . . . . . . . . . . . . . . . .
. . . . . . . . . . . . . . . . . . . . . . . . . . .
• • • • • • • • • • • • • • • • • • • • • e • • • • •
Standard Industrial ClassificationReported Water Use . • • • • • • •Estimated Water Use • • • • • • . . • • • • • • • •Aggregation into Economic Sectors •.•••••••Disaggregation of Public Water Supply Withdrawals.Residential Water Use •Consumptive Water Use ••Variations in Water Use .
Table of Contents
List of Tables . . . . . . . . • . . . . . . . . . . . . . . . .
Appendix • . • . . . . . . . . . . . . . . . . . . . . . . . . . 44
Introduction . . . . . . . . . . . . . . . . . . . . . . . . . . . 1
Objecti ve •
List of Figures
References
Methodology ..•...............•..
1985 Water Withdrawal Aggregations

Table
1
2
3
4
5
6
7
8
9
10
11
12
13
14
1516
17
Figure
1
2
List of Tables
Estimated Water Use - Minnesota Mining and
Manufacturing Co.Economic Sectors Used by IPASS
Ground Water Withdrawals (Straight Method)
Surface Water Withdrawals (Straight Method)
Aggregation Techniques for End Use MethodGround Water Withdrawals (End Use Method)
Surface Water Withdrawals (End Use Method)
Residential Water Use
Consumption Assumptions
Ground Water Consumption (Straight Method)
Surface Water Consumption (Straight Method)
Ground Water Consumption (End Use Method)
Surface Water Consumption ( End Use Method)
1985 Ground Water Withdrawals by Region
1985 Surface Water Withdrawals by Region1985 Ground Water Withdrawals by Watershed
1985 Surface Water Withdrawals by Watershed
List of Figures
Minnesota Economic Regions
Minnesota's 39 Principal Watersheds
vii
6
9
10
11
1721
22
24
27
28
29
30
31
37
3739
40
2
38

Introduction
This report is a product of the Water Allocation and ManagementProgram, a two-year project funded by the Legislative Commissionon Minnesota Resources. The goal of this project was to developa plan that will guide the allocation and management of water inMinnesota. Accomplishing this goal required a thorough understanding of the use of water in the state. This report describesthe methods used to analyze Minnesota water use and the resultswhich were obtained.
The results of this analysis were used as inputs to a computersimulation model of the Minnesota economy developed by the Department of Agricultural Economics of the University of Minnesota andthe Natural Resources Research Institute at Duluth. This Interactive
.Policy Analysis Simulation System (IPASS) model (formerly SIMLAB)analyzes the economic value of water to the state and the impactsof changes in water supply on economic production.
Objective
The primary objective of this analysis was to provide water use data for thewater module used by IPASS. The requirements of the model strictly defined boththe type of data collected and the format in which it was presented. All wateruse data had to be made compatible with the economic data of the model.
The IPASS model treats water as a necessary input for economic production. Eachunit of output requires a specific volume of water as an input. The total waterdemand for each sector is determined by the average volume required per unit ofproduction and the total number of units produced.
There are seventy-four economic sectors in the model; these sectors areaggregates of Standard Industrial Classifications (SIC's). IPASS actuallyincludes six models: one state model and five sub-state regional models. Theregional boundaries define the general economic subregions of the state(Figure 1). The base year of the models is 1982 - the most recent year forwhich complete economic data are available.
-1-

FIGURE 1. tvlINNESOTA ECONOMIC REGIONS
clay
II st.louIS
II
I
I ~Ii---=----'----~ INORTHEAST
cass
'I-:=:---,.....J 0"", tllli
.~ ": '-IllES........-'--_'-,_--J'
houston~ fillmorefreeoorn
goodhue ! wabasha
Naseca ,sreele . dodge Iolmsted I
SOUTHEASTI i
)
"""'on\ - ...=n':-----1"
\~::=-:cc--~\5neflAlrr'E
, ~P!!'!!P."""~
~AL,
steams
cot1l:rlllood
fI!!!!!IIt----'--- "'C leod
swift
lac QUI parle
"" IoN medicine
-2-

The water use data needed for the model were:
1. The total volumes of water withdrawn by each economicsector, by region, by resource (either surface or groundwater) in 1982;
2. The volumes of water withdrawn for household use, byregion, by resource, in 1982;
3. Any changes in withdrawal which would occur in responseto various scenarios, such as a drought.
A second objective of this analysis was to aggregate the volumes of waterwithdrawn for each of the economic regions and for the thirty-nine principalwatersheds in the state, so that comparisons could be made between withdrawals,volumes required for instream uses (for recreation, fish and wildlife habitat,navigation, waste assimilation, etc.), and total water suppl ies. Thiscomparison did not utilize IPASS, since the computer simulation does not operateat the watershed level. These aggregations were completed using 1985 water usedata in order to incorporate any possible changes in water use since 1982 and tomake the most recent information on water withdrawals available to waterresource managers.
For the purposes of the study, water withdrawal was defined as "water removedfrom the ground or diverted from a surface-water source for use" (Solley, Chase,and Mann, 1983). Water consumed is "water that is no longer available becauseit has been evaporated, transpired, incorporated into products or crops,consumed by man or 1ivestock, or otherwi se removed from the water environment"(Ibid). The acre-foot is used as the basic unit of water measurement. One.acre-foot is the vol ume of water it takes to cover one acre of 1and with onefoot of water, or 325,851 gallons.
-3-
Methodology
As the agency responsible for the regulation of water withdrawals, the MinnesotaDepartment of Natural Resources (DNR) is the primary source of water use data inthe State. The DNR Division of Waters collects and stores withdrawal data aspart of its water appropriation permit program. Minnesota Statute 105.41requires an appropriation permit for any withdrawal in excess of 10,000 gallonsper day or 1,000,000 gallons per year. Only domestic use by fewer thantwenty-five people ;s exempt from the permit requirement. Permit holders mustsubmit annual reports of the volumes of water withdrawn. These pumpage data arestored .on the State Water Use Database System (SWUDS), which is maintained bythe DNR on a PRIME computer at the St. Paul office' of the U.S. GeologicalSurvey. For this project, SWUDS datafiles were modified and downloaded to anIBM-XT personal computer. Data were stored and analyzed using INFO, a databasemanagement system produced by Henco Software, Inc.
The procedures used to generate the water use data can be summarized as follows:
1. Code of all records of water use by Standard IndustrialClassification (SIC).
2. Verify the accuracy of reported withdrawal data.
3. Estimate volumes of unreported water use.
4. Aggregate data by region into seventy-four economic sectors.
5. Disaggregate volumes of water withdrawn by municipal supplysystems according to the end use among the sectors.
6. Estimate volumes of household water use from all sources.
7. Estimate volumes of water consumed based on volumes of waterwithdrawn and the type of use.
-4-

8. Estimate variations in water use in response to variousscenarios.
Each step in this analysis will be described separately.
Standard Industrial Classifications
The IPASS model uses aggregations of data based on Standard IndustrialClassifications (SIC·s). Therefore each record of water use had to be codifiedby its SIC according to the Standard Industrial Classification Manual, 1972edition. In some cases, this coding was complicated by the nature of the wateruse or the way in which some uses are evaluated by the model. Four uses whichrequired special consideration were air conditioning, irrigation, lake levelmaintenance, and use by the 3M Company.
Circulating groundwater through cooling systems is a common method of airconditioning in Minnesota. Categorization of this use of water was based on theownership of the building being cooled. Owner-occupied buildings were codedaccording to the SIC of the owner. Buildings owned by a real estate managementfirm but occupied by one or more other firms were coded under SIC 6512,"0perators of non-residential buildings".
Water used for irrigation of agricultural crops was coded under the generalcategory 0100, "Agricultural production". Often, farmers rotate their crops,planting corn one year and soybeans the next, for example. Use of the generalcategory acknowledges this fact, allowing the data to be applicable for morethan one year. If it was known that only one crop was cultivated, the operationwas classified accordingly. Thus, wild rice irrigators were coded as 0119,apple orchards as 0175, etc.
It was necessary to distinguish among the types of organizations that pump waterto raise or lower the levels of lakes and wetlands. Public agencies were codedas 9511 or 9512, "Administration of environmental quality programs"; privateorganizations were usually coded as 6552, "Real estate subdividers anddevelopers". Private organizations using water for wildlife management werecoded as 0971, "Hunti ng and trappi n9, and game propagati on" • '
-5-

Minnesota Mining and Manufacturing (3M Company) presented a special problem forcoding because of the wide variety of its products and its numerousmanufacturing plants. Determining the quantities of water used for each productat each plant was impractical. Therefore t reported water use for all 3M plantsin the Minneapolis/St. Paul metropolitan area was arbitrarily assigned as shownin Table 1.
Table 1
11,2451,138
9491,462
881307
Name
Paper coating and glazingChemicals and chemical preparationsMiscellaneous plastic productsAbrasive productsElectronic componentsPhotographic equipment and supplies
Estimated Water Use - Minnesota Mining and Manufacturing Co.
Appropri ati on(acre-feet)SIC
264128993079329136793861
Reported Water Use
All DNR water appropriation permit holders are required to monitor and reportthe volumes of water pumped during each calendar year. Rates of compliance withthis provision of the permits are about 85% among agricultural irrigation waterusers and 95% among all other users. Although the volumes of water reported arerequired to be accurate to within 10%, no method of confirming this degree ofaccuracy is available. Flow meters are required only for pumping rates greaterthan 1500 gallons per minute. ~ost pumpage below that rate is estimated basedon the capac i ty of the pump. Since the actua1 capac i ty of a pump genera11 Ydeclines over time, the accuracy of this estimation method is questionable atbest. Skepticism regarding the accuracy of reported data must be tempered bythe understanding that they are the best numbers available.
In an attempt to minimize the introduction of errors into the analysis, thecomputer datafiles containing pumpage data were compared to the original wateruse reports submi tted by permi t ho 1ders for all uses other than i rri ga ti on.Thi s check was used to veri fy the accuracy of data entry and to locate andcorrect any arithmetic errors made by the permit holder. Irrigation reports
-6-

were not verified because of the large number of users (approximately 4,000) andthe relatively small volumes of water used by each irrigation permit holder.
Estimated Water Use
For those uses where reported pumpage data were not available, it was necessaryto estimate water withdrawal based on other sources of information. Uses forwhich data are not available at the DNR fall into three major categories:1) appropriations of water below levels requiring a permit, 2) unauthorizedappropriations of water in excess of minimum levels, 3) appropriation by validpenni t ho lders who fai 1 to report use. Oi fferent procedures were used toestimate pumpage volumes for each of these categories.
A DNR permit is required for the pumping of more than 10,000 gallons per day orone million gallons per year. The major uses excluded by these minimum levelsare self-supplied residences and most livestock operations. Estimates of theseuses were based on county level statistics and aggregated into regional andstatewide totals. Methodologies for estimating residential water use are
described later in this report.
The amounts of water used for raising livestock were taken from estimates madeby the U.S. Geological Survey. County populations of twenty different livestockcategories were multiplied by average daily water consumption per animal type.For the model, these county totals were then combined into dairy and poultry use(economic sector one) and meat and animal use (sector two). In accordance withthe U.S. Geological Survey's estimates, it was assumed that 85% of all livestockoperati ons use ground water for thei r dri nking water suppl ies, except turkeyfarms, which are assumed to use ground water exclusively (Trotta).
It is difficult to determine the volumes of water used by non-permitted waterappropriators in the state. The fact that these users have no permit means thatthe DNR is unaware of their water use or that their use is known and the DNR hasbeen unable to bring them into compliance with the permit requirements. Whereappropriate, other state agencies were consulted and their lists of water userswere compared to lists of DNR permit holders. The Minnesota Pollution ControlAgency, which regulates water discharge, was a source of information on uses ofall types. The Minnesota Department of Health, which regulates drinking supply
-7-

systems, provided information on mobile home parks, apartment complexes, andcampgrounds. Annual volumes of water were estimated based on the MPCA or MDHdata available.
For those water users under permit who did not submit the required annual reportof water use for 1982, es timates were made based on reports submitted inprevious or subsequent years (where available), or on the volumes of waterauthori zed to be taken under thei r permi ts. Estimates were not made forirrigation permits because farmers may not irrigate their crops every year. Somewater appropriators who were operating without a permit in 1982 have since beenbrought under compl iance. Estimates of their use were made based on the; r~eported use in SUbsequent years or on their authorized appropriation amounts.
Aggregation into Economic Sectors
IPASS uses aggregates of data based on standard industrial classifications. The74 economic sectors and their corresponding SIC's are listed in Table 2. Wherea SIC is allocated among two or more sectors, the fraction allocated to eachsector is given ("*" indicates multiplication). Each computer record ofestimated and reported withdrawal is coded by SIC, source (either surface orground water), and location. These data were agg~egated into the appropriatesector using INFO software prog~anming. Ground and surface withdrawals weretotalled separately. All summations were done according to geographic regionand then combined to yield a statewide total. Results are given in Tables 3 and4. As will be explained below, these are not the final aggregations used in theIPASS model. In order to distinguish these results from other data, they willbe referred to as the results of the "straight" method, because they comestraight from reported water use data.
Disaggregation of Public Water Supply Withdrawals
The economic sector that withdraws water is not necessarily the same sector thatactually uses the water to produce a unit of output. For instance, public watersupply systems, which are included in Sector 61, provide water to almost allother sectors. In order for IPASS to evaluate the total wate~ requirements foreach sector, the water withdrawn by public water supply systems had to be brokendown to reflect its end use among the seventy-four sectors, use by private

TABLE 2. ECONOMIC SECTORS USED BY IPASS
NO. TITLE
DAIRY &. POULTRY
2 MEAT &. ANIMAL PROD.
3 GRAINS
4 OTHER CROPS
5 FOR. FISH. PROD.6 AG. FOR. FISH. SERV.7 IRON ORE MINING8 NONFERR. MINING9 COAL '" PEAT
10 OIL" NAT. GAS11 STONE,CLAY12 OTHER MINING13 NEW CONSTRUCTION
14 MAINT. & REPAIR15 ORDN. & RELATED16 MEAT PRODUCTS17 DAIRY PRODUCTS18 CANNED,FROZ.PROC.19 GRAIN MILLING20 BAKERY PRODUCTS21 ALCH.BEV,SOFT DRNK22 OTHER FooD,TOBBACCO23 TEXTILE GOODS24 APPAREL, FABR.25 LOGGING26 SAWMILLS27 OTHER WOOD PRODUCTS28 FURNITURE29 PULP &PAPER30 PAPERBOARD CONT.31 PRINTING & PUBL.32 CHEMICAL & ALLIED33 PETR. REFINING34 RUBBER PROD.35 LEATHER PRODUCTS36 GLASS,STONE,CLAY37 PRIM. STEEL PRODUCTS38 IRON &. STL. FOUNDRY39 PRIMARY COPPER40 OTHER PRIM. METALS
41 FABRICATED METALS42 FARM MACHI NARY43 MACHINE SHOPS44 OTHER NONELECTRIC.45 COMPo ,OFF.MACHINES46 SERVo ,IND. MACHINES47 ELECTRICAL MACHINES48 MOTOR VEHICLES49 OTHER TRANSPORT.50 PROF., SCIENTIFIC51 OPT.OPHTH. ,PHOTO.52 MISC. MANUFACTURING53 RAILROAD TRANSPORT.54 LOCAL TRANSIT55 TRUCK TRANSIT56 AIR TRANSPORTATION57 OTHER TRANSPORT.58 COMMUNICATIONS59 ELECTRIC UTILITIES60 GAS UTILITIES61 WATER AND SANITATION62 WHOLE TRADE63 RETAIL TRADE64 FINANCE,INSURANCE65 REAL ESTATE66 HOTELS ,ETC.67 BUSINESS SERVICES
68 EAT & DRINK ESTABL.69 AUTO REPS.70 FILMS AND RECREATION71 HEALTH SERVICES72 EDUC. NONPROFIT73 FED,STATE, LOCAL ENT.14 SCRAP,USED&SECOND
SIC CODES
024,0251-0253, .5*0259, .25*0291, .167*0219.25*01910211-0214, .5*0219,0271,0272, .5*0279,.25*0191, .167*0259.25*02910111,0112,0115, .5*0119,1*0139, .25*0191, .167*0219,.161*0259, .25*0291.5*0119,0116,016,0173,0179,018,0131-0134, .3*0139,.25*0191, .167*0219, .25*0291, .166*0259, 0175081-084,091,0970254,071,072,075,076,076,085,092,.5*0279101,106102-105, .5*108,1091111,1211, .5*1112,.5*12131311,1321141,142,144,145, .5*148,149147.85*(15,16,17), .5*108,.5*1112,.5*1213,.33*138,.5*148, .5*6552.15* ( 15, 16 , 17) , 1215, .61*138348,3761,3795201202203,2091,2092204205208206,207,2095,2097,2098,2099,2122 (EXCEPT FOR 225)225,23241242243,244,2452,24925261-264,266265272829303132331332,339,34623331,3351,3357,33623332,3333,3334,3339,336(EXCEPT3362),3353-33583463,334341-345,3465,3466,3469,347,349352359351,353-35635735836,3825371(EXCL.3716)3716,372-375,3792,3799,2451.3764,3769381,3822-3824.3829,384,387383,385-3863940,474 .. 25*4789.661*4142,.25*47894544,46,471,4723.4722,4782-4784, .5*478948491 .. 8*4931, .1*4932, .33*4939492, .1*4931, .8*4932, .33*4939494-497, .1*4931, .1*4932, .33*493950,5152-57,59,7396,804260,61,62-64,67(EXCL.6732)65(EXCL.5*6552),6672,762-764,8361731-737,7391-7395,7397,7399,769,81,89(EXCEPT FOR 8922)58,707578,7980(EXCL.8042},074,6732,82,832,833,835,8399.84,86,8922.33*41,4311 •. 17*613
-9-

TABLE 3. GROUND WATER WITHDRAWALS-STRAIGHT METHOD(Acre-feet)
NORTH WEST CENTRAL METRO SOUTH TOTAL***** **** ******* ***** ***** *****
1 DAIRY & POULTRY 3541.3 5214.6 6779.7 1255.6 6100.8 22892.0
2 MEAT & ANIMAL 3435.8 15496.7 6554.5 2699.0 16119.4 44305.43 FOOD/FEED GRAIN .13004.7 50046.2 33293.1 15731.4 5178.4 117253.84 OTHER CROPS 20.6 39.9 49.4 648.1 8.6 766.65 FOR/FISH PRODS 34.7 6.1 48.8 25.2 0.0 114.86 AG/FOR/FISH SER 1304.3 15.3 257.8 920.7 11699.8 14197.97 IRON ORE MINING 504.8 0.0 0.0 0.0 0.0 504.88 NONFERROUS MINE 0.0 0.0 0.0 0.0 0.0 0.09 COAL & PEAT 0.0 0.0 0.0 0.0 0.0 0.0
10 OIL & NAT. GAS 0.0 0.0 0.0 0.0 0.0 0.011 STONE & CLAY 140.6 1371. 2 66.6 1139.5 60.2 2778.112 OTHER MINING 0.0 0.0 0.0 0.0 0.0 0.013 NEW CONSTRUCTN 0.3 0.0 0.0 161.7 0.0 162.014 MAINT. & REPAIR 0.0 0.0 0.0 28.5 0.0 28.515 ORDNANCE & REL 0.0 0.0 0.0 1828.4 0.0 1828.416 MEAT PRODUCTS 15.0 600.0 1055.1 276.2 3164.9 5111.217 DAIRY PRODUCTS 307.8 689.6 3128.1 1572.2 2979.3 8677.018 CANNED & FROZEN 0.0 224.0 772.7 465.6 3418.4 4880.719 GRAIN MILLING 16.9 1797.4 16.9 2852.5 70.3 4754.020 BAKERY PRODUCTS 0.0 0.0 15.3 30.1 0.0 45.421 BEVERAGES 0.0 0.0 59.5 10138.4 1043.4 11241. 322 OTHER FOOD/TOB 18.4 15.3 56.8 2267.9 4112.6 6471.023 TEXTILE GOODS 0.0 0.0 0.0 0.0 171.6 171. 624 APPAREL/FABRICS 0.0 0.0 0.0 0.0 0.0 0.025 LOGGING 0.0 0.0 0.0 0.0 0.0 0.026 SAWMILLS 0.0 0.0 0.0 0.0 0.0 0.027 WOOD PRODUCTS 6.1 0.0 0.0 664.4 0.0 670.528 FURNITURE 80.7 0.0 0.0 16.9 0.0 97.629 PULP & PAPER 2206.5 0.0 15.3 16265.1 21. 2 18508.130 PAPERBOARD CONT 0.0 0.0 0.0 37.1 0.0 37.131 PRINT & PUBLISH 0.0 0.0 85.6 1194.4 0.0 1280.032 CHEMICAL/ALLIED 27.6 1282.8 0.0 3281.9 15.3 4607.633 PETROL REFINING 28.2 0.0 67.8 7215.9 0.0 7311.934 RUBBER PRODUCTS 0.0 0.0 128.3 3726.5 797.6 4652.435 LEATHER PRODUCT 0.0 0.0 0.0 0.0 484.6 484.636 CLAY/STONE/GLAS 1.2 156.8 34.4 2398.0 194.9 2785.337 PRIM STEEL PROD 4.3 0.0 0.0 529.1 0.0 533.438 IRON/STEEL FOUN 0.0 0.0 290.0 333.3 33.1 656.439 PRIMARY COPPER 0.0 0.0 0.0 0.0 0.0 0.040 OTHER METALS 0.0 0.0 0.0 69.0 0.0 69.041 FABRIC. METALS 81. 6 0.0 0.0 3779.3 423.8 4284.742 FAm{ MACHINERY 0.0 0.0 0.0 227.1 16.9 244.043 MACHINE SHOPS 0.0 0.0 0.0 0.0 0.0 0.044 NONELECT MACH 0.0 0.0 0.0 403.6 0.0 403.645 COM/OFFICE MACH 0.0 0.0 0.0 708.3 80.4 788.746 SERVo IND. MACH 0.0 0.0 0.0 0.0 1.2 1.247 ELECTRIC MACH. 0.0 0.0 481.5 3636.0 509.4 4626.948 MOTOR VEHICLES 0.0 0.0 0.0 0.0 0.0 0.049 OTHER TRANSPORT 0.0 0.0 0.0 0.0 0.0 0.050 PROF/SCIENTIFIC 0.0 0.0 0.0 3414.4 16.6 3431.051 OPT.OPHTH.PHOT. 0.0 0.0 0.0 306.9 0.0 306.952 MISC.MANUFACTUR 0.0 0.0 0.0 372.6 0.0 372.653 RAILROAD TRANS 1.5 0,0 16.9 93.3 0.3 112. °54 LOCAL TRANSIT 0.0 I). a 0.0 0.0 0.0 0.055 TRUCK TRANSIT 0.0 15.3 15.3 926.2 1.2 958.056 AIR TRANSPORT. 0.0 0.0 0.0 2178.0 0.0 2178.057 OTHER TRANS. 0.0 0.0 0.0 0.0 0.0 0.058 COMMUNICATIONS 0.0 0.0 0.0 593.2 0.0 593.259 ELECTRIC UTIL. 595.1 28.5 573.6 801. 3 21587.2 23585.760 GAS UTILITIES 0.0 1.2 0.0 167.9 0.0 169.161 WATER & SAN!T. 23418.4 29722.5 25906.9 142558.4 61305.0 282911.262 WHOLESALE TRADE 0.0 87.5 0.0 68.7 102.5 258.763 RETAIL TRADE 0.0 4.6 0.0 1602.3 15.3 1622.264 FINANCE/INSUR. 0.0 0.0 0.0 3203.6 0.0 3203.665 REAL ESTATE 238.8 251.3 443.5 9466.9 520.2 10920.766 HOTELS/SERVICES .105.9 84.4 42.4 1860.4 37.4 2130.567 BUSINESS SERVo 4.0 33.1 6.1 0.0 71. 5 114.768 EAT/DRINK ESTBL 0.0 0.0 4.6 0.0 14.1 18.769 AUTO REPAIRS 0.0 0.0 0.0 0.0 0.0 0.070 FILM/RECREATION 133.5 179.2 577.9 3970.2 413.4 5274.271 HEALTH SERVICES 222.5 17.8 264.2 4961.2 824.9 6290.672 EDUC/NON-PROFIT 62.9 9.8 803.4 634.0 648.5 2158.673 GOVERNMENT 752.2 43.6 450.8 5937.1 22.7 7206.474 SCRAP 0.0 0.0 0.0 0.0 0.0 0.0
TOTAL 50316.2 107434.7 82362.8 269643.5 142286.9 652044.1
-10-

TABLE 4. SURFACE WATER WITHDRAWALS-STRAIGHT METHOD(Acre-feet)
NORTH WEST CENTRAL HETRO SOUTH TOTAL***** **** ******* ***** ***** *****
1 DAIRY & POULTRY 0.0 0.0 0.0 0.0 0.0 0.02 MEAT & ANIMAL 133.8 0.0 0.0 0.0 0.0 133.83 FOOD/FEED GRAIN 18937.5 11520. O· 4047.9 1126.9 3947.5 39579.84 OTHER CROPS ' 11.0 13.2 '8.3 35.3 16.6 84.45 FOR/FISH PRODS 0.0 145.8 0.0 0.0 0.0 145.86 AG/FOR/FISH SER 776.4 0.0 1263.8 0.0 0.0 2040.27 IRON ORE MINING 250917.1 0.0 0.0 0.0 0.0 250917.18 NONFERROUS MINE 0.0 0.0 0.0 0,0 0.0 0.09 COAL & PEAT 0.0 0.0 0.0 0.0 0.0 0.0
10 OIL & NAT. GAS 0.0 0.0 0.0 0.0 0.0 0.011 STONE & CLAY 1268.7 555.5 543.5 21883.9 4752.2 29003,812 OTHER MINING 0.0 0.0 0.0 0.0 0.0 0.013 NEW CONSTRUCTN 1238.3 27.3 0.0 0.9 11. 4 1277.914 MAINT. & REPAIR 0.9 4.6 0.0 0.0 1.8 7.315 ORDNANCE & REL 0.0 0.0 0.0 6.1 0.0 6.116 MEAT PRODUCTS 0.0 11.7 0.0 0.0 214.5 226.217 DAIRY PRODUCTS 0.0 175.5 1729.6 0.0 0.0 1905.118 CANNED & FROZEN 0.0 0.0 0.0 0.0 0.0 0.019 GRAIN MILLING 0.0 0.0 0.0 0.0 0.0 0.020 BAKERY PRODUCTS 0.0 0.0 0.0 0.0 0.0 0.021 BEVERAGES 0.0 0.0 0.0 0.0 0.0 0.022 OTHER FOOD/TOB 0.0 1212.8 4.6 0.0 0.0 1217.423 TEXTILE GOODS 0.0 0.0 0.0 0.0 0.0 0.024 APPAREL/FABRICS 0.0 0.0 0.0 0.0 0.0 0.025 LOGGING 0.0 0.0 0.0 0.0 0.0 0.026 SAWMILLS 0.0 0.0 0.0 0.0 0.0 0.027 WOOD PRODUCTS 6.4 0.0 0.0 0.0 0.0 6.428 FURNITURE 0.0 0.0 0.0 0.0 0.0 0.029 PULP & PAPER 72483.1 0.0 5038.8 0.0 0.0 77521.930 PAPERBOARD CONT 0.0 0.0 0.0 0.0 0.0 0.031 PRINT & PUBLISH 0.0 0.0 0.0 0.0 0.0 0.032 CHEMICAL/ALLIED 399.0 0.0 0.0 0.0 0.0 399.033 PETROL REFINING 0.0 0.0 0.0 0.0 0.0 0.034. RUBBER PRODUCTS 0.0 0.0 0.0 0.0 0.0 0.035 LEATHER PRODUCT 0.0 0.0 0.0 0.0 0.0 0.036 CLAY/STONE/GLAS 304.7 69.4 197.3 0.0 0.0 571.437 PRIM STEEL PROD 53019.0 0.0 0.0 0.0 0.0 53019.038 IRON/STEEL FOUN 0.0 0.0 0.0 0.0 0.0 0.039 PRIMARY COPPER 0.0 0.0 0.0 0.0 0.0 0.040 OTHER METALS 0.0 0.0 0.0 0.0 0.0 0.041 FABRIC. METALS 0.0 0.0 0.0 0.0 260.9 260.942 FARM MACHINERY 0.0 0.0 0.0 0.0 0.0 0.043 MACHINE SHOPS 0.0 0.0 0.0 0.0 0.0 0.044 NONELECT MACH 0.0 0.0 0.0 0.0 0.0 0.045 COM/OFFICE MACH 0.0 0.0 0.0 0.0 0.0 0.046 SERVo IND. MACH 0.0 0.0 0.0 0.0 0.0 0.047 ELECTRIC MACH. 0.0 0.0 0.0 0.0 0.0 0.048 MOTOR VEHICLES 0.0 0.0 0.0 191.5 0.0 191.549 OTHER TRANSPORT 0.0 0.0 0.0 0.0 0.0 0.050 PROF/SCIENTIFIC 0.0 0.0 0.0 0.0 0.0 0.051 OPT.OPHTH.PHOT. 0.0 0.0 0.0 0.0 0.0 0.052 MISC.MANUFACTUR 0.0 0.0 0.0 0.0 0.0 0.053 RAILROAD TRANS 3.7 0.0 0.0 0.0 0.0 3.754 LOCAL TRANSIT 0.0 0.0 0.0 0.0 0.0 0.055 TRUCK TRANSIT 0.0 0.0 0.0 0,0 0.0 0.056 AIR TRANSPORT. 0.0 0.0 0.0 0.0 0.0 0.057 OTHER TRANS. 26.4 0.0 0.0 0.3 0.0 26.758 COMMUNICATIONS 0.0 0.0 0.0 0.0 0.0 0.059 ELECTRIC UTIL. 152485.4 68143.1 279840.2 502155.3 390805.6 1393429.660 GAS UTILITIES 10.7 0.0 0.0 0.0 8.6 19.361 WATER & SANIT. 33593.3 9694.9 5410.8 181367.6 1964.4 232031.062 WHOLESALE TRADE 0.0 0,0 0.0 0.0 0.0 0.063 RETAIL TRADE 0.0 0.0 0.0 0.0 0.0 0.064 FINANCE/INSUR. 0.0 0.0 0.0 0.0 0.0 0.065 REAL ESTATE 0.0 0.0 0.0 142.4 0.0 142.466 HOTELS/SERVICES 157.4 0.0 1.8 0.0 0.0 159.267 BUSINESS SERVo 0.0 0.0 0.0 0.0 0.0 0.068 EAT/DRINK ESTBL 0.0 0.0 0.0 0.0 0.0 0.069 AUTO REPAIRS 0.0 0.0 0.0 0.0 0.0 0.070 FILM/RECREATION 231. 7 385.8 184.7 334.8 116.3 1253.371 HEALTH SERVICES 0.0 0.0 0.0 0.0 0.0 0.072 EDUC/NON-PROFIT 64.8 2.8 18.7 15.3 0.0 101.673 GOVERNMENT 214.8 58.0 9715.2 1022.6 877.4 11888. a74 SCRAP 0.0 0.0 0.0 0.0 0.0 0.0
TOTAL 586284.1 92020.4 308005.2 708282.9 4q2977.2 2097569.8
-11-

households t and use at the treatment plants operated by the utilities
themselves.
The first step in this procedure was to survey all public water supply systemsin the state (See Appendix) to determine:
1. the amount of water supplied for residential, commercial,industrial, recreation, and treatment use, and
2. more detailed information regarding the large water users
supplied by the utility.
A similar survey was sent to all DNR appropriation permit holders who use waterfor any purpose other than public water supply or irrigation. This survey (SeeAppendix) requested information regarding:
1. the product or service provided by the user (to determineor confirm the assigned standard industrial classification),
2. the use to which the water is put,
3. the volumes purchased from a public supply system (if any),
4. the percent of water withdrawn which is consumed, and
5. the water disposal method.
The response rate for both surveys was fair. Forty percent of municipal surveyforms were returned, while thirty percent of the industrial surveys werereturned. A limited effort was made to follow up on non-respondents. Citieswi th popul ati ons greater than 10,000 were contacted by telephone or through asecond letter. The three largest electric utilities in the state (NorthernStates Power, Minnesota Power, and Ottertail Power) were contacted a second timeby letter, but no response was received.
-12-
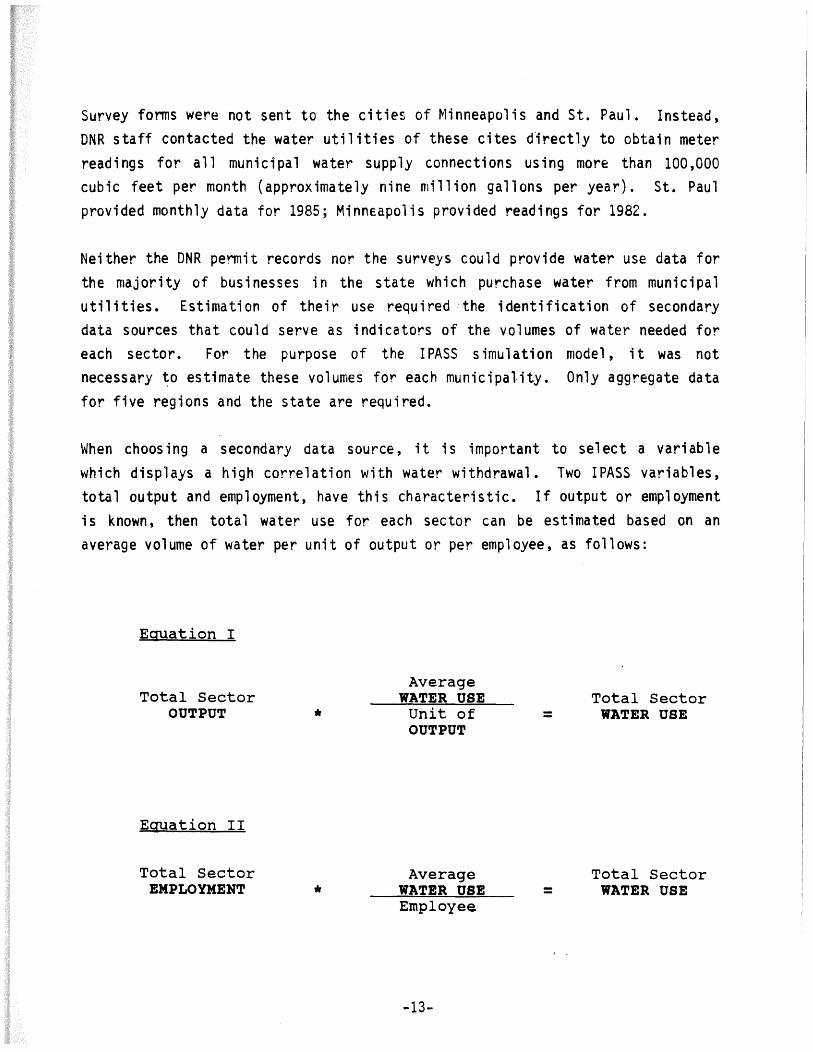
Survey forms were not sent to the cities of Minneapolis and St. Paul. Instead,DNR staff contacted the water utilities of these cites directly to obtain meterreadings for all municipal water supply connections using more than 100,000cubic feet per month (approximately nine million gallons per year). St. Paulprovided monthly data for 1985; Minneapolis provided readings for 1982.
Neither the DNR permit records nor the surveys could provide water use data forthe majority of businesses in the state which purchase water from municipalutilities. Estimation of their use required ,the identification of secondarydata sources that could serve as indicators of the volumes of water needed foreach sector. For the purpose of the IPASS simulation model, it was notnecessary ~o estimate these volumes for each municipality. Only aggregate datafor five regions and the state are required.
When choosing a secondary data source, it is important to select a variablewhich displays a high correlation with water withdrawal. Two IPASS variables,total output and employment, have this characteristic. If output or employmentis known, then total water use for each sector can be estimated based on anaverage volume of water per unit of output or per employee, as follows:
Equation I
Total SectorOUTPUT
Equation II
Total SectorEMPLOYMENT
•
•
AverageWATER USEUnit ofOUTPUT
AverageWATER USEEmployee.
-13-
=
=
Total SectorWATER USE
Total SectorWATER USE
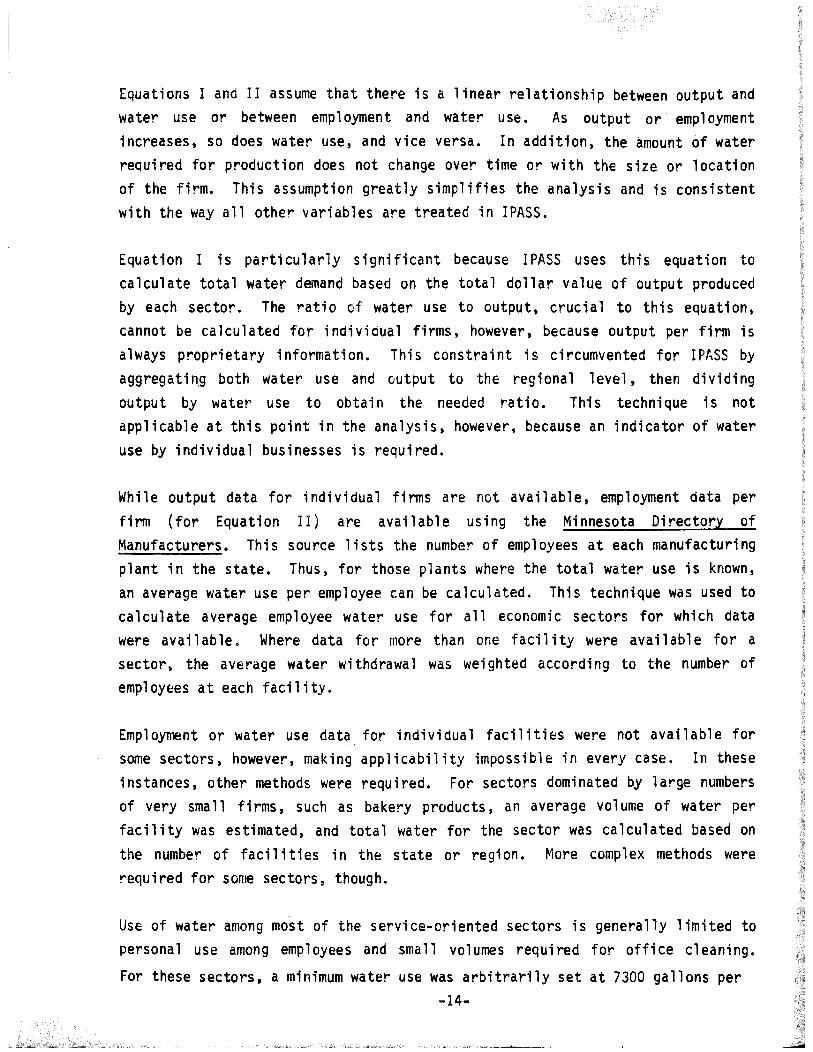
Equations I and II assume that there is a linear relationship between output andwater use or between employment and water use. As output or employmentincreases, so does water use, and vice versa. In addition, the amount of waterrequired for production does not change over time or with the size or locationof the firm. This assumption greatly simplifies the analysis and is consistentwith the way all other variables are treated in IPASS.
Equation I is particularly significant because IPASS uses this equation tocalculate total water demand based on the total dollar value of output producedby each sector. The ratio of water use to output, crucial to this equation,cannot be calculated for individual firms, however, because output per firm isalways proprietary information. Thi s constrai nt is ci rcumvented for IPASS byaggregating both water use and output to the regional level, then dividingoutput by water use to obtain the needed ratio. This technique is notapplicable at this point in the analysis, however, because an indicator of wateruse by individual businesses is required.
While output data for individual finns are not available, employment data perfinn (for Equation II) are available using the Minnesota Directory ofManufacturers. This source lists the number of employees at each manufacturingplant in the state. Thus, for those plants where the total water use is known,an average water use per employee can be calculated. This technique was used tocalculate average employee water use for all economic sectors for which datawere available. Where data for more than one facility were available for asector, the average water withdrawal was weighted according to the number ofemployees at each facility.
Employment or water use data for individual facilities were not available forsome sectors, however, making applicability impossible in every case. In theseinstances, other methods were required. For sectors dominated by large numbersof very small firms, such as bakery products, an average volume of water perfacility was estimated, and total water for the sector was calculated based onthe number of facilities in the state or region. More complex methods wererequired for son~ sectors, though.
Use of water among most of the service-oriented sectors is generally limited topersonal use among employees and small volumes reqUired for office cleaning.
For these sectors, a minimum water use was arbitrarily set at 7300 gallons per-14-

year per employee. In a few sectors, water use was expected to be greater thanthis minimum value but no data were available to determine an averageconsumpti on. Average use per employee in ,these ins tances was assumed to be thesame as the amounts used by employees in sectors which involved similaractivities. Thus, for example, non-ferrous mining was assumed to require thesame amount of water as sand and gravel operations. Finally, no average wateruse per employee was estimated for those sectors not expected to use municipalwater supplies (such as irrigation) or for which total water use was accountedfor based on reported and estimated use for individual facilities (such aselectric utilities).
Table 5 shows the method used to calculate the total water use and the averagewater use per employee for each IPASS sector. The following descriptionssummarize the estimation methods used:
Gallons per Animal:
Reported plus Estimated:
Reported:
No Wa ter Use:
Minimum Gallons per Employee:
Total water use was calculated based on anaverage water use per animal times the totalnumber of animals in each region.
Total water use was assumed to be the sum ofall water use reported by permitted users andestimates for known but non-reporting users.
Total water use was assumed to be the sum ofall wa ter use reported by permi tted users.Assumes all users are covered by permit.
IPASS economic datafiles indicate no outputfor these sectors, therefore no water use wasestimated.
Assumes all water use for these sectors isfor personal use by employees and for officecleaning. Average annual employee usederived from sample data.
-15-

Average Gallons per Employee: Average annual water withdrawal p~remployee
calculated using the formula~
Number of Firms in Sector:
Si mi1 ar to (X):
Reported plus a MinimumGallons per Employee:
Sum of Volume of water withdrawn by sample firmsSum of Number employees in sample firms.
This number was then multiplied by the totalnumber of employees in that sector to obtainan estimate of total water use.
An average volume of water used by firms inthis sector was derived from sample data.Total water use was estimated by multiplyingthi s average by the total number of fi rmslisted in the Minnesota Directory ofManufacturers.
Sample data were not available for these sectors,therefore average water use was assumed to be thesame as that of Sector (X) with similaroperations.
It is assumed that for most firms in thesesectors, the only water used is for personal useby, employees and for office cleaning. However,some firms in these sectors use water for purposesnot directly related to production. These usesinclude circulation of water through coolantsystems for air conditioning, lawn watering,irrigation of golf courses, and snow making forskiing facilities. Reported water use by permitholders was added to minimum water use peremployee to estimate total water use.
-16-

Table 5. Aggregation Techniques for End Use Method
AverageWater Use
per EmployeeSector Name (gallons/year) Estimation Method Used
1 Dairy & Poultry N.A. Gal./Animal2 Meat &Animal N.A. Gal./Animal3 Food/Feed Grain N.A. Rep. + Est.4 Other Crops N.A. Rep. + Est.5 Forest/Fish Products 7,300** Rep.6 Agri./Forest/Fish Services 1,112,800** Rep.7 Iron Ore Mi ni ng 9,407,000** Rep.8 Non-ferrous Mining N.A. No Water Use9 Coal &Peat Mining N.A. No Water Use
10 Oil &Natural Gas Mining 7,300 Min. Gal./Emp.11 Stone &Clay Mining 7,059,441** Rep.12 other M; n; ng N.A. No Water Use13 New Construction 7,300 Rep.14 Maintenance &Repair 7,300 Min. Gal./Emp.15 Ordnance &Related 107,140 Gal./Emp.16 Meat Products 252,060 Gal./Emp.17 Dai ry Products 612,570 Gale/Emp.18 Canned &Frozen 420,870 Gal./Emp.19 Grain Milling 1,089,700 Gal./Emp.20 Bakery Products 220,133** No. of Firms21 Beverages 1,036,800 Gal./Emp.22 Other Food/Tobacco 2,107,605** No. of Firms23 Textile Goods 234,874 Gal./Emp.24 Apparel/Fabrics 7,300 Min. Gal./Emp.25 Logging 7,300 Min. Gal./Emp.26 Sawmills 7,300 Min. Gal./Emp.27 Wood Products 68,054 Gal./Emp.28 Furniture 56,121 Gal./Emp.29 Pulp and Paper 1,193,000 Gal./Emp.30 Paperboard Containers 192,000 Gal./Emp.31 Printing & Publishing 204,570 Gal./Emp.
-17-

Table 5 (cont.)
AverageWater Use
per Employee
Sector Name (gallons/year) Estimation Method Used
32 Chemical & A" ied 500,310 Gal./Emp.
33 Petroleum Refining 2,427,800 Gal./Emp.
34 Rubber Products 385,540 Gal./Emp.
35 Leather Products 188,780 Gal./Emp.
36 Glass, Stone, Clay 170,340 Gal./Emp.
37 Primary Steel Products 14,461,000 Gal./Emp.
38 Iron &Steel Foundary 537,000 Gal./Emp.
39 Primary Copper 537,000 Similar to 38
40 Other Primary Metals 300,000 Gal./Emp.
41 Fabricated Metals 646,650 Gal./Emp.
42 Farm Machinery 141,960 Gal./Emp.
43 Machine Shops 7,300 Gal./Emp.
44 Other Nonelectric Machines 26,964 Gal./Emp.
45 Computers, Office Mach. 24,855 Gal./Emp.
46 Service Industry Machines 13,285 Gal./Emp.
47 Electrical Machines 132,430 Gal./Emp.
48 Motor Vehicles 121,430 Gal./Emp.
49 Other Transportation 66,512 Gal./Emp.
50 Professional, Scientific Equip. 81,973 Gal./Emp.
51 Optical, Ophthalmic,photographic 81,973 Simil ar to 50
52 Miscellaneous Manufacturing 81,973 Similar to 50
53 Railroad Transportation 8,500* Gal./Emp.
54 Local Transit 7,300 Min. Gal./Emp.
55 Truck Trans it 7,300 Min. Gal./Emp.
56 Air Transportation 86,212* Gal./Emp.
57 Other Transportation 7,300 Min. Gal./Emp.
58 Communications 37,820* Gal./Emp.
59 Electric Utilities 46,532,000** Rep. + Est.
-18-
I
L
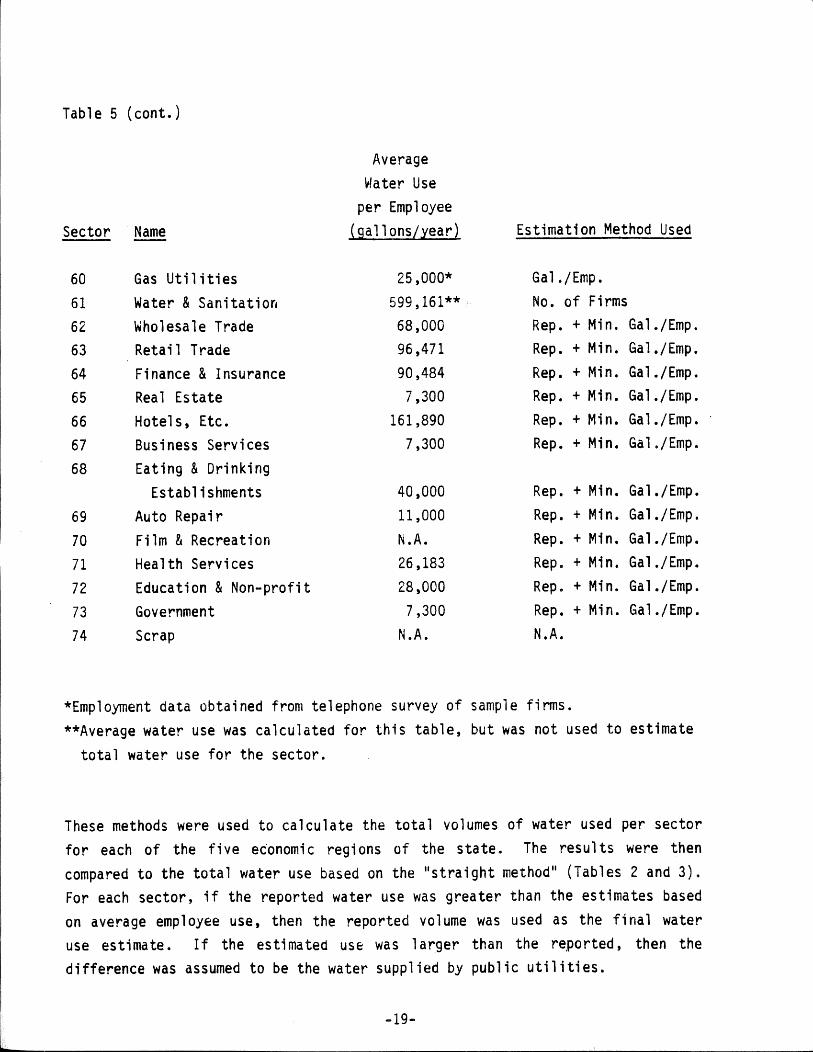
Table 5 (cont.)
Average~Iater Use
per EmployeeSector Name (gallons/year) Estimation Method Used
60 Gas Utilities 25,000* Gal./Emp.
61 Water &Sanitation 599,161** No. of Firms
62 Wholesale Trade 68,000 Rep. + Min. Gal./Emp.
63 Retail Trade 96,471 Rep. + Min. Gal./Emp.
64 Finance &Insurance 90,484 Rep. + Min. Gal./Emp.
65 Real Estate 7,300 Rep. + Min. Gal./Emp.
66 Hotels, Etc. 161,890 Rep. + Min. Gal./Emp.
67 Business Services 7,300 Rep. + Min. Gal./Emp.
68 Eating &DrinkingEstablishments 40,000 Rep. + Min. Gal./Emp.
69 Auto Repair 11,000 Rep. + Min. Gal./Emp.
70 Film &Recreation N.A. Rep. + Min. Gal./Emp.
71 Health Services 26,183 Rep. + Min. Gal./Emp.
72 Education &Non-profit 28,000 Rep. + Min. Gal./Emp.
73 Government 7,300 Rep. + Min. Gal./Emp.
74 Scrap N.A. N.A.
*Employment data obtained from telephone survey of sample firms.**Average water use was calculated for this table, but was not used to estimate
total water use for the sector.
These methods were used to calculate the total volumes of water used per sectorfor each of the five eC'onomic regions of the state. The results were thencompared to the total water use based on the "straight method" (Tables 2 and 3).For each sector, if the reported water use was greater than the estimates basedon average employee use, then the reported volume was used as the final wateruse estimate. If the estimated use was larger than the reported, then thedifference was assumed to be the water supplied by public utilities.
-19-

E
The next step in the analysis was to apportion these volumes of water suppliedby public utilities into the amounts withdrawn from ground and surface watersources. Since these were regional totals, there was no direct method ofdetermining the exact source of water for any sector. The only available datawere the total amounts of ground and surface waters withdrawn by municipalitiesin each region. Therefore, for the portion of total sector water withdrawalsthat was supplied by public utilities, the ratio of ground to surface water usewas assumed to be the same as the average ratio of ground to surface withdrawals
by municipalities in the region.
In summary, the following equation was used to reapportion total water use in
each sector according to its end use:
For each sector in each region:
1
AverageWater use *Per Employee
TotalNumber ofEmployees
ReportedWater Use
Water Supplied= by
Municipalities
Water Suppliedby
Municipalities *
Percent ofRegion's municipalWater suppliescoming FromGround water
Ground water= Supplied by
Municipalities
The amount of surface water suppl ied by municipalities is the remainder aftersubtracting the ground water from the total for each sector.
This process, which shall be referred to as the "end use" method, was used tocalculate total water use for each region. The state total is the sum of allregional totals. These results were used for the IPASS model (Tables 6 and 7).
-20-
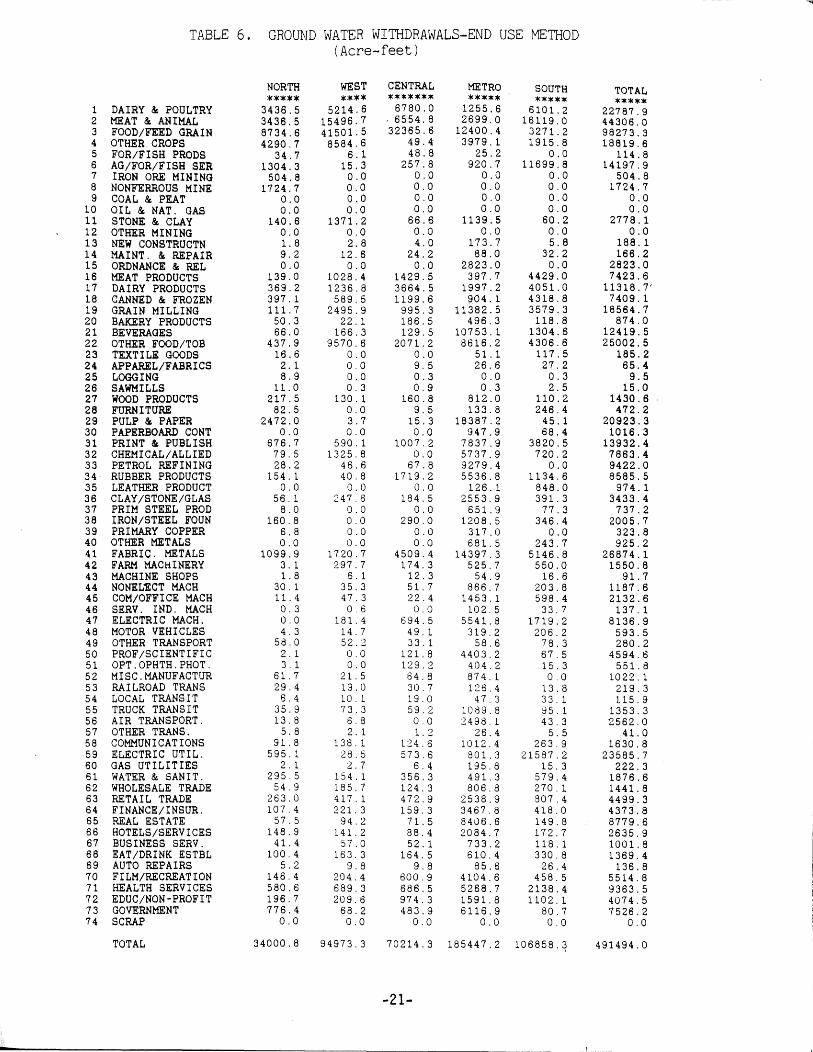
TABLE 6. GROUND WATER WITHDRAWALS-END USE METHOD(Acre-feet)
NORTH WEST CENTRAL METRO SOUTH TOTAL***** **** ******* ***** ***** *****
1 DAIRY & POULTRY 3436.5 5214.6 6780.0 1255.6 6101.2 22787.92 MEAT & ANIMAL 3436.5 15496.7 ·6554.8 2699.0 16119.0 44306.03 FOOD/FEED GRAIN 8734.6 41501. 5 32365.6 12400.4 3271. 2 98273.34 OTHER CROPS 4290.7 8584.6 49.4 3979.1 1915.8 18819.65 FOR/FISH PRODS 34.7 6.1 48.8 25.2 0.0 114.86 AG/FOR/FISH SER 1304.3 15.3 257.8 920.7 11699.8 14197.97 IRON ORE MINING 50·\. 8 0.0 0.0 0.0 0.0 504.88 NONFERROUS MINE 1724.7 0.0 0.0 0.0 0.0 1724.79 COAL & PEAT 0.0 0.0 0.0 0.0 0.0 0.0
10 OIL & NAT. GAS 0.0 0.0 0.0 0.0 0.0 0.011 STONE & CLAY 140.6 1371.2 66.6 1139.5 60.2 2778.112 OTHER MINING 0.0 0.0 0.0 0.0 0.0 0.013 NEW CONSTRUCTN 1.8 2.8 4.0 173.7 5.8 188.114 MAINT. & REPAIR 9.2 12.6 24.2 88.0 32.2 166.215 ORDNANCE & REL 0.0 0.0 0.0 2823.0 0.0 2823.016 MEAT PRODUCTS 139.0 1028.4 1429.5 397.7 4429.0 7423.617 DAIRY PRODUCTS 369.2 1236.8 3664.5 1997.2 4051.0 11318.7'18 CANNED & FROZEN 397.1 589.5 1199.6 904.1 4318.8 7409.119 GRAIN MILLING 111. 7 2495.9 995.3 11382.5 3579.3 18564.720 BAKERY PRODUCTS 50.3 22.1 186.5 496.3 118.8 874.021 BEVERAGES 66.0 166.3 129.5 10753.1 1304.6 12419.522 OTHER FooD/TOB 437.9 9570.6 2071,2 8616.2 4306.6 25002.523 TEXTILE GOODS 16.6 0.0 0,0 51.1 117.5 185.224 APPAREL/FABRICS 2.1 0.0 9,5 26.6 27,2 65.425 LOGGING 8.9 0.0 0.3 0.0 0.3 9.526 SAWMILLS 11.0 0,3 0,9 0,3 2.5 15.027 WOOD PRODUCTS 217.5 130.1 160.8 812.0 110.2 1430.628 FURNITURE 82.5 0.0 9.5 133.8 246,4 472.229 PULP & PAPER 2472.0 3.7 15.3 18387.2 45.1 20923.330 PAPERBOARD CONT 0.0 0.0 0.0 947.9 68.4 1016.331 PRINT & PUBLISH 676,7 590.1 1007.2 7837.9 3820.5 13932.432 CHEMICAL/ALLIED 79,S 1325.8 0.0 5737.9 720.2 7863.433 PETROL REFINING 28,2 46,6 67.8 9279.4 0.0 9422.034· RUBBER PRODUCTS 154.1 40.8 1719,2 5536.8 1134.6 8585,535 LEATHER PRODUCT 0.0 0.0 0,0 126.1 848.0 974.136 CLAY/STONE/GLAS 56,1 247.6 184.5 2553.9 391,3 3433.437 PRIM STEEL PROD 8.0 0.0 0,0 651.9 77.3 737.238 IRON/STEEL FOUN 160,8 0,0 290,0 1208,5 346.4 2005,739 PRIMARY COPPER 6.8 0,0 0.0 317.0 0.0 323.840 OTHER METALS 0.0 0.0 0,0 681.5 243,7 925.241 FABRIC. METALS 1099.9 1720.7 4509.4 14397.3 5146.8 26874.142 FARM MACHINERY 3.1 297.7 174,3 525,7 550.0 1550.843 MACHINE SHOPS 1.8 6,1 12.3 54.9 16.6 91. 744 NONEL1i:CT MACH 30,1 35.3 51. 7 866.7 203.8 1187.645 COM/OFFICE MACH 11. 4 47.3 22.4 1453.1 598.4 2132.646 SERVo IND. MACH 0,3 0.6 0.0 102.5 33.7 137,147 ELECTRIC MACH. 0.0 181.4 694.5 5541.8 1719.2 8136.948 MOTOR VEHICLES 4,3 14.7 49.1 319,2 206.2 593.549 OTHER TRANSPORT 58.0 52.2 33. 1 58,6 78.3 280.250 PROF/SCIENTIFIC 2.1 0.0 121,8 4403,2 67,5 4594.651 OPT.OPHTH.PHOT. 3,1 0,0 129.2 404,2 15,3 551.852 MISC.MANUFACTUR 61. 7 21. 5 64,8 874.1 0.0 1022.153 RAI LROAD TRANS 29,4 19,0 30.7 126.4 13.8 219.354 LOCAL TRANSIT 6.4 10, 1 19.0 47.3 33. 1 115.955 TRUCK TRANSIT 35.9 73.3 59.2 1089.8 95,1 1353.356 AIR TRANSPORT. 13.8 6,8 0.0 2498.1 43.3 2562,057 OTHER TRANS. 5.8 2.1 1.2 26.4 5.5 41. 058 COMMUNICATIONS 91. 8 138. 1 124.6 1012.4 263.9 1630,859 ELECTRIC UTIL. 595,1 28.5 573,6 801.3 21587.2 23585.760 GAS UTILITIES 2. 1 2.7 6.4 195,8 15.3 222,361 WATER & SANIT. 295.5 154. 1 356,3 491.3 579,4 1876.662 WHOLESALE TRADE 54.9 185,7 124.3 806,8 270,1 1441.863 RETAI L TRADE 263,0 417, 1 472.9 2538.9 -307.4 4499.364 FINANCE/INSUR. 107.4 221.3 159,3 3467.8 418.0 4373.865 REAL ESTATE 57.5 94,2 71. 5 8406,6 149.8 8779.666 HOTELS/SERVICES 148.9 141,2 88,4 2084.7 172.7 2635,967 BUSINESS SERVo 41. 4 57.0 52.1 733.2 118,1 1001.868 EAT/DRINK ESTBL 100.4 163,3 164.5 610.4 330,8 1369.469 AUTO REPAIRS 5.2 9,8 9.8 85.6 26.4 136.870 FILM/RECREATION 146.4 204.4 600.9 4104.6 458.5 5514,871 HEALTH SERVICES 580.6 689,3 686.5 5268.7 2138.4 9363.572 EDUC/NON-PROFIT 196,7 209.6 974.3 1591,8 1102.1 4074,573 GOVERNMENT 776.4 68.2 483.9 6116.9 80.7 7526.274 SCRAP 0.0 0.0 0,0 0.0 0.0 0,0
TOTAL 34000,8 94973.3 70214.3 185447.2 106858.~ 491494.0
-21-

Table 8. Residential Water Use(acre-feet)
TotalMunicipal Non-Municipal Self- Ground Surface*Supplies Supply Systems Supplied Water Water Total--
West 22,757.6 224.5 20,920.5 38,304.2 5,598.4 43,902.6Northeast 30,707.0 237.6 19,030.1 31,882.1 18,092.6 49,974.7Central 17,791.3 443.1 21,850.8 37,010.9 3,074.3 40,085.2Metro 213,330.9 1,760.8 63,982.2 159,629.9 119,444.° 279,073.9Southeast 38,451.3 519.8 18,606.1 56,385.2 1,172.0 57 ,577.2
State 323,038.1 3,185.8 144,389.7 323,212.3 147,381.3 470,593.6
*Note: Virtually all surface water use for residential purposes comes frommunicipal water supplies.
If a utility did not respond to the survey, then information regarding thepercentage of water used by households was taken from DNR permit files. Thisinformation is requested from water utilities during the permit applicationprocess. If neither source of information was available, then the percent ofwater for residential use was estimated based on population served and reportedor permitted use. These estimates assumed an average withdrawal of 88 gallonsper person per day.
Private community water supply systems are required to have a DNR waterappropriation permit if they serve more than 25 people. It was assumed that allof the water withdrawn by these systems was used for domestic purposes, so the1982 reported volumes were simply aggregated by region and statewide to accountfor this water use.
A number of private community supply systems are not covered by a DNRappropriation permit, either because they serve fewer than 25 people or becausethey are appropriating in violation of statute. In order to identify theseusers, the 1ist of DNR permits WciS compared to the Minnesota Department ofHealth's (MDH) list of non-municipal community systems. For those systemswithout a DNR permit, the Minnesota Department of Health estimate of annualwater withdrawals was used.
-24-

Good sources of data regarding self-supplied residential use do not exist. Theonly way to estimate this use is by a process of elimination. Total countypopulations are known~ as are the populations served by municipal and privatecommunity supply systems. It was assumed that the remaining populations in eachcounty have thei r own water supp1i es. Therefore, the di fference between thecounty populations and the known population served was multiplied by thestandard estimate of average domestic water use employed by the U.S. GeologicalSurvey (88 gallons per person per day, or 32,120 gallons per year) to estimatetotal self-supplied residential water use for each county. These numbers werethen aggregated into regional and statewide totals.
Consumptive Water Use
Any computer simulation model uses sets of numbers and equations to describe areal-world system. These numbers and equations, by necessity, aresimplifications of the real system they represent. Of all the assumptions builtinto the way IPASS analyzes water, the most significant is the decision to usethe volumes of water withdrawn as a measure of the amounts of water required forth~ production of each unit of output in the economy.
For an individual production facility, withdrawal data are the most accuratereflection of the total amount of water required for production. However,aggregations of withdrawals by more than one facility over-estimate waterrequi rements because they do not account for water whi ch ; s returoned to thesource and then re-used by another production facility. For example, anelectric power generation station uses very large quantities of water forcooling~ but may return more than 97% of the total water withdrawn back into thestream from which it came.
An alternative to the use of withdrawal data in IPASS is the use of the volumesof water consumed by each sector. Aggregations of consumptive water use reflectthe total amount of water which ;s no longer available for use downstream.However, consumption data underestimate total water needs; the fact that coolingwater is returned to a river or lake does not diminish its value to theproduction facility. Analysis of consumptive use is also hampered by a lack ofprimary data. These volumes must be estimated from withdrawal data, addinganother level of uncertainty to their accuracy.
-25-

After weighing the two a1ternati ves, the DNR chose to use withdrawal databecause doing so increases the likelihood that IPASS would identify situationswhere the amount of water available is not sufficient to meet the demands placedupon it. This decision follows the conservative approach used by DNR throughoutthis project. Moreover, the impacts of the choice are less significant forappropriations of ground water, since we assume that only a small percentage ofground water withdrawal is returned to the aquifer source from which it came.
Despite its decision to use withdrawal data for the IPASS simulations, the DNRchose to proceed with an analysis of the consumptive use of water, believingthat the data would be valuable as an information source for water resourcemanagement. Like withdrawal data, consumptive water use data were evaluated twodifferent ways. The "straight" method was based on reported water use from DNRappropriation pennit holders and estimates of unreported use. Water use wascorrelated to the facility making the withdrawal of water from the surface orground water source. All water withdrawn by municipalities was assigned toIPASS sector 59, water utilities. The "end use ll method assigned all waterwithdrawals according to their end use among the 74 sectors or to residentialuse. Estimates of consumptive use were then made based on withdrawal volumes.
For the "straight ll method, a consumption coefficient was assigned to eachappropriation of water based on its standard industrial classification and typeof use. This consumption coefficient was simply an estimate of the percent ofthe water withdrawn which was consumed. For all manufacturing· uses, theconsumption coefficient was taken from the u.s. Department of Commerce, Bureauof the Census, 1982 Census of Manufacturl:s, IIWater Use in Manufacturi ng ll
• Inmost cases, a coefficient was c~lculated for each thr~e digit SIC code. If thethree digit coefficient was not available, the more general two digitcoefficient was used. For non-manufacturing sectors, the value assigned for theconsumption coefficient was based on the end use of the water. These valueswere taken from a variety of sources (See Table 9). The coefficients weremultiplied by the 1982 pumpage data to obtain the estimated consumptive use foreach faci 1i ty. These amounts wer~ then aggregated by economi c sector for eachregion and the state.
-26-

Table 9. Consumption Assumptions
InformationD.N.R. SourceUse Code S.I.C. Use Type % Consumed Key
80-95 100-199 Irrigation except Wild Rice 90 a
96 119 Wild Rice Irrigation 85 a
9 200-299 Livestock 100 a
72 279,921 Hatcheries &Fisheries 10 a
43 1000-1099 Mineral Processing (Metals) 36.8 b
44 1400-1499 Mineral Processing (Sand &Gravel) 13.1 b
51 1500-1799 Construction (not dewatering) 99 a
52 1500-1799 Construction (dewatering) 0 a
40-49 2000-3999 Industrial varies c
20-25 4911 Electric Power Generation varies d
53 4920,4610 Pipeline and Tank testing 3 a
10-16 4941,etc. Waterworks (municipal &private) 10 e
40 7210 Laundry, Cleaning, Garment Services 12 f
73 7999 Snow Making 80 a
30-32 various Air Conditioning 3 f
33-34 various Heating, Coolant pumps 3 f
35 various District Heating 3 f
54 various Landscape Watering (temporary) 80 a
60-69 various Water Level Maintenance 0 a
55,71 various Pollution Confinement 0 a
a. First order approximation.b. The Nation's Water Resources, 1975-2000.c. 1982 Census of Manufactures, Water Use in Manufacturing.d. Westinghouse Hanford Co., Unpublished.e. Solley, Chase, and Mann, 1983.f. Results of DNR telephone survey of individual businesses.
-27-
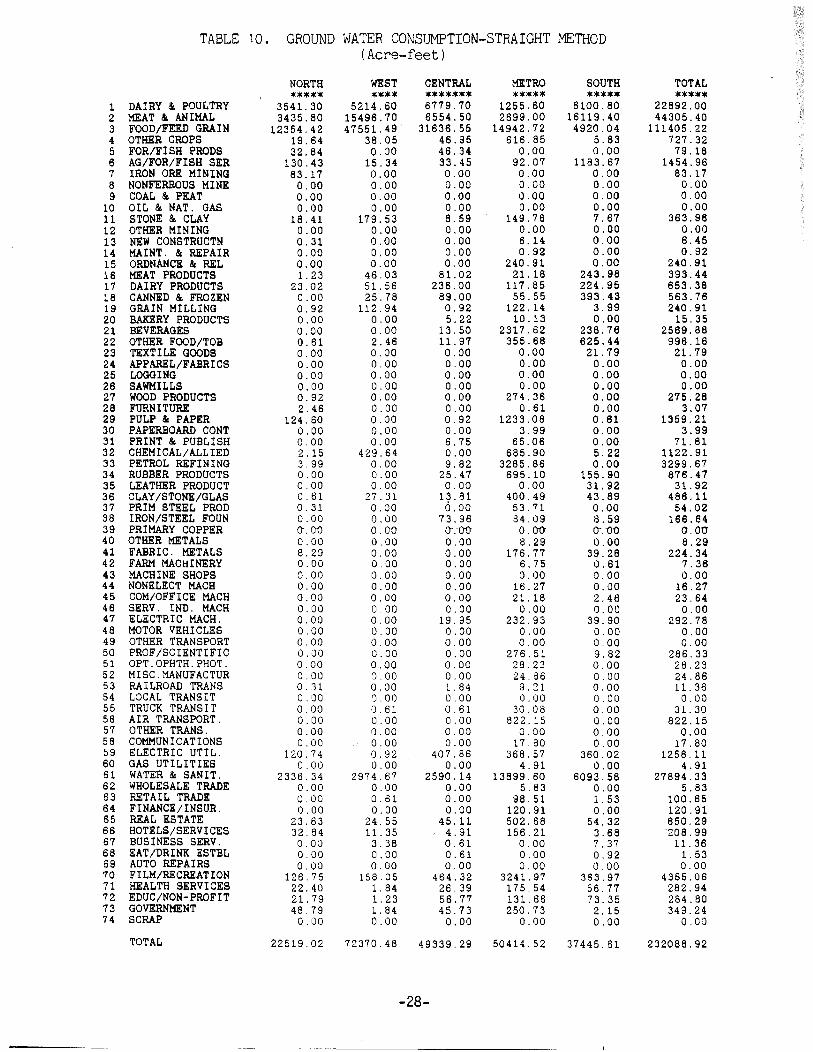
TABLE 10. GROUND WATER CONSUMPTION-STRAIGHT METHOD(Acre-feet)
NORTH WEST CENTRAL METRO SOUTH TOTAL***** **** ******* ***** ***** *****
1 DAIRY & POULTRY 3541.30 5214.60 6779.70 1255.60 6100.80 22892.002 MEAT &. AN lMAL 3435.80 15496.70 6554.50 2699.00 16119.40 44305.403 FOOD/FEED GRAIN 12354.42 47551. 49 . 31636.55 14942.72 4920.04 111405.224 OTHER CROPS 19.64 38.05 46.95 616.85 5.83 727.325 FOR/FISH PRODS 32.84 0.00 46.34 0.00 0.00 79.186 AG/FOR/FISH SER 130.43 15.34 33.45 92.07 1183.67 1454.967 IRON ORE MINING 83.17 0.00 0.00 0.00 0.00 83.178 NONFERROUS MINE 0.00 0.00 0.00 0.00 0.00 0.009 COAL & PEAT 0.00 0.00 0.00 0.00 0.00 0.00
10 OIL & NAT. GAS 0.00 0.00 0.00 0.00 0.00 0.0011 STONE & CLAY 18.41 179.53 8.59 149.76 7.67 363.9612 OTHER MINING 0.00 0.00 0.00 0.00 0.00 0.0013 NEW CONSTRUCTN 0.31 0.00 0.00 6.14 0.00 6.4514 MAINT. &: REPAIR 0.00 0.00 0.00 0.92 0.00 0.9215 ORDNANCE & REL 0.00 0.00 0.00 240.91 0.00 240.9116 MEAT PRODUCTS 1. 23 46.03 81. 02 21. 18 243.98 393.4417 DAIRY PRODUCTS 23.02 51.56 236.00 117.85 224.95 653.3618 CANNED &: FROZEN 0.00 25.78 89.00 55.55 393.43 563.7619 GRAIN MILLING 0.92 112.94 0.92 122.14 3.99 240.9120 BAKERY PRODUCTS 0.00 0.00 5.22 10.13 0.00 15.3521 BEVERAGES 0.00 0.00 13.50 2317.62 238.76 2569.8822 OTHER FooD/TOB 0.61 2.46 11. 97 355.68 625.44 996.1623 TEXTILE GOODS 0.00 0.00 0.00 0.00 21. 79 21. 7924 APPAREL/FABRICS 0.00 0.00 0.00 0.00 0.00 0.0025 LOGGING 0.00 0.00 0.00 0.00 0.00 0.0026 SAWMILLS 0.00 0.00 0.00 0.00 0.00 0.0027 WOOD PRODUCTS 0.92 0.00 0.00 274.36 0.00 275.2828 FURNITURE 2.46 0.00 0.00 0.61 0.00 3.0729 PULP & PAPER 124.60 0.00 0.92 1233.08 0.61 1359.2130 PAPERBOARD CONT 0.00 0.00 0.00 3.99 0.00 3.9931 PRINT & PUBLISH 0.00 0.00 6.75 65.06 0.00 71. 8132 CHEMICAL/ALLIED 2.15 429.64 0.00 685.90 5.22 1122.9133 PETROL REFINING 3.99 0.00 9.82 3285.86 0.00 3299.6734 RUBBER PRODUCTS 0.00 0.00 25.47 695.10 155.90 876.4735 LEATHER PRODUCT 0.00 0.00 0.00 0.00 31.92 31.9236 CLAY/STONE/GLAS 0.61 27.31 13.81 400.49 43.89 486.1137 PRIM STEEL PROD 0.31 0.00 6.00 53.71 0.00 54.0238 IRON/STEEL FOUN 0.00 0.00 73.96 84.09 8.59 166.6439 PRIMARY COPPER 0'. OD 0.00 0.00 0.00 0-. -0-0 cr.OU40 OTHER METALS 0.00 0.00 0.00 8.29 0.00 8.2941 FABRIC. METALS 8.29 0.00 0.00 176.77 39.28 224.3442 FARM MACHINERY 0.00 0.00 0.00 6.75 0.61 7.3643 MACHINE SHOPS 0.00 0.00 0.00 0.00 0.00 0.0044 NONELECT MACH 0.00 0.00 0.00 16.27 0.00 16.2745 COM/OFFICE MACH 0.00 0.00 0.00 21.18 2.46 23.6446 SERVo IND. MACH 0.00 0.00 0.00 0.00 0.00 0.0047 ELECTRIC MACH. 0.00 0.00 19.95 232.93 39.90 292.7848 MOTOR VEHICLES 0.00 0.00 0.00 0.00 0.00 0.0049 OTHER TRANSPORT 0.00 0.00 0.00 0.00 0.00 0.0050 PROF/SCIENTIFIC 0.00 0.00 0.00 276.51 9.82 286.3351 OPT. OPHTH. PHOT. 0.00 0.00 0.00 28.23 0.00 28.2352 MISC.MANUFACTUR 0.00 0.00 0.00 24.86 0.00 24.8653 RAILROAD TRANS 0.31 0.00 1. 84 9.21 0.00 11. 3654 LOCAL TRANSIT 0.00 0.00 0.00 0.00 0.00 0.0055 TRUCK TRANSIT 0.00 0.61 0.61 30. 08 0.00 31.3056 AIR TRANSPORT. 0.00 0.00 0.00 822.15 0.00 822.1557 OTHER TRANS. 0.00 0.00 0.00 0.00 0.00 0.0058 COMMUNICATIONS 0.00 0.00 0.00 17.80 0.00 17.8059 ELECTRIC UTIL. 120.74 0.92 407.86 368.57 360.02 1258.1160 GAS UTILITIES 0.00 0.00 0.00 4.91 0.00 4.9161 WATER & SANIT. 2336.34 2974.67 2590.14 13899.60 6093.58 27894.3362 WHOLESALE TRADE 0.00 0.00 0.00 5.83 0.00 5.8363 RETAIL TRADE 0.00 0.61 0.00 98.51 1. 53 100.6564 FINANCE/INSUR. 0.00 0.00 0.00 120.91 0.00 120.9165 REAL ESTATE 23.63 24.55 45.11 502.68 54.32 650.2966 HOTELS/SERVICES 32.84 11. 35 4.91 156.21 3.68 208.9967 BUSINESS SERVo 0.00 3.38 0.61 0.00 7.37 11.3668 EAT/DRINK ESTBL 0.00 0.00 0.61 0.00 0.92 1.5369 AUTO REPAIRS 0.00 0.00 0.00 0.00 0.00 0.0070 FILM/RECREATION 126.75 158.05 464.32 3241.97 363.97 4355.0671 HEALTH SERVICES 22.40 1. 84 26.39 175.54 56.77 282.9472 EDUC/NON-PROFIT 21.79 1. 23 56.77 131.66 73.35 284.8073 GOVERNMENT 48.79 1.84 45.73 250.73 2.15 349.2474 SCRAP 0.00 0.00 0.00 0.00 0.00 0.00
TOTAL 22519.02 72370.48 49339.29 50414.52 37445.61 232088.92
-28-

-29-

TABLE 12. GROUND WATER CONSUMPTION-END USE METHOD(Acre-feet)
NORTH WEST CENTRAL METRO SOUTH TOTAL
***** **** ******* ***** ***** *****1 DAIRY & POULTRY 3436.5 5214.a 6780.0 1255.6 6101. 2 22787.9
2 MEAT & ANIMAL 3436.5 15496.7 6554.8 2699.0 16119.0 44306.0
3 FOOD/FEED GRAIN 7424.4 35276.3 27510.8 10540.3 2780.5 83532.3
4 OTHER CROPS 3647.1 7296.9 42.0 3382.2 1628.4 15996.7
5 FOR/FISH PRODS 10.5 1.9 14.8 7.7 0.0 34.9
6 AG/FOR/FISH SER 133.0 1.6 26.3 93.9 1193.4 1448.2
7 IRON ORE MINING 80.8 0.0 0.0 0.0 0.0 80.8
8 NONFERROUS MINE 0.0 0.0 0.0 0.0 0.0 0.0
9 COAL & PEAT 0.0 0.0 0.0 0.0 0.0 0.0
10 OIL & NAT. GAS 0.0 0.0 0.0 0.0 0.0 0.0
11 STONE & CLAY 4.2 41. 1 2.0 34.2 1.8 83.3
12 OTHER MINING 0.0 0.0 0.0 0.0 0.0 0.0
13 NEW CONSTRUCTN 0.1 0.1 0.1 5.4 0.2 5.8
14 MAINT. & REPAIR 1.7 2.4 4.6 16.6 6.1 31.4
15 ORDNANCE & REL 0.0 0.0 0.0 369.8 0.0 369.8
16 MEAT PRODUCTS 10.7 79.2 110.1 30.6 341.0 571. 8
17 DAIRY PRODUCTS 27.7 92.8 274.8 149.8 303.8 848.9
18 CANNED & FROZEN 46.1 68.4 139.2 104.9 501. 0 859.5
19 GRAIN MILLING 5.7 127.3 50.8 580.5 182.5 946.8
20 BAKERY PRODUCTS 17.0 7.5 63.0 167.7 40.2 295.4 .
21 BEVERAGES 15.1 38.1 29.7 2462.5 298.8 2844.1
22 OTHER FOOD/TOB 70.9 1550.4 335.5 1395.8 697.7 4050.4
23 TEXTILE GOODS 5.3 0.0 0.0 16.4 37.6 59.3
24 APPAREL/FABRICS 0.3 0.0 1.2 3.4 3.5 8.4
25 LOGGING 1.5 0.0 0.1 0.0 0.1 1.7
26 SAWMILLS 1.5 0.0 0.1 0.0 0.3 2.1
27 WOOD PRODUCTS 89.0 53.2 65.8 332.1 45.1 585.1
28 FURNITURE 2.6 0.0 0.3 4.1 7.6 14.6
29 PULP & PAPER 254.6 0.4 1.6 1893.9 4.6 2155.1
30 PAPERBOARD CONT 0.0 0.0 0.0 102.4 7.4 109.8
31 PRINT & PUBLISH 37.9 33.0 56.4 438.9 213.9 780.2
32 CHEMICAL/ALLIED 18.0 301.0 0.0 1302.5 163.5 1785.0
33 PETROL REFINING 12.7 21. 0 30.6 4185.0 0.0 4249.3
34 RUBBER PRODUCTS 29.0 7.7 323.2 1040.9 213.3 1614.1
35 LEATHER PRODUCT 0.0 0.0 0.0 8.3 56.0 64.3
36 CLAY/STONE/GLAS 9.2 40.6 30.3 418.8 64.2 563.1
37 PRIM STEEL PROD 0.8 0.0 0.0 64.5 7.7 73.0
38 IRON/STEEL FOUN 40.8 0.0 73.7 307.0 88.0 509.4
39 PRIMARY COPPER 0.7 0.0 0.0 32.7 0.0 33.4
40 OTHER METALS 0.0 0.0 0.0 81.8 29.2 111. 0
41 FABRIC. METALS 53.9 84.3 221. 0 705.5 252.2 1316.8
42 FARM MACHINERY 0.1 8.9 5.2 15.8 16.5 46.5
43 MACHINE SHOPS 0.0 0.0 0.0 0.0 0.0 0.0
44 NONELECT MACH 2.0 2.4 3.5 58.9 13.9 80.8
45 COM/OFFICE MACH 0.3 1.4 0.7 43.6 18.0 64.0
46 SERVo IND. MACH 0.0 0.0 0.0 3.5 1.1 4.7
47 ELECTRIC MACH. 0.0 11. 4 43.8 349.1 108.3 512.6
48 MOTOR VEHICLES 0.4 1.5 5.1 32.9 21.2 61. 1
49 OTHER TRANSPORT 4.4 3.9 2.5 4.4 5.9 21.. 0
50 PROF/SCIENTIFIC 0.2 0.0 10.1 365.5 5.6 381.4
51 OPT.OPHTH.PHOT. 0.3 0.0 11. 9 37.2 1.4 50.8
52 MISC.MANUFACTUR 4.1 1.4 4.3 58.6 0.0 68.5
53 RAI LROAD TRANS 3.8 2.5 4.0 16.4 1.8 28.5
54 LOCAL TRANSIT 0.6 1.0 1.9 4.7 3.3 11.6
55 TRUCK TRANSIT 1.2 2.4 2.0 36.0 3.1 44.7
56 AIR TRANSPORT. 5.2 2.6 0.0 941.8 16.3 965.9
57 OTHER TRANS. 0.2 0.1 0.0 0.9 0.2 1.4
58 COMMUNICATIONS 2.8 4.1 3.7 30.4 7.9 48.9
59 ELECTRIC UTIL. 25.0 1.2 24.1 33.7 906.7 990.6
60 GAS UTILITIES 0.1 0.1 0.2 5.7 0.4 6.4
61 WATER & SANIT. 29.3 15.3 35.3 48.6 57.4 185.8
62 WHOLESALE TRADE 1.3 4.3 2.9 18.6 6.2 33.2
63 RETAIL TRADE 16.3 25.9 29.3 157.4 50.1 279.0
64 FINANCE/INSUR. 4.1 8.4 6.1 131.8 15.9 166.2
65 REAL ESTATE 3.4 5.6 4.2 496.0 8.8 518.0
66 HOTELS/SERVICES 21. 4 20.3 12.7 300.2 24.9 379.6
67 BUSINESS SERVo 4.1 5.6 5.2 72.6 11.7 99.2
68 EAT/DRINK ESTBL 8.2 13.4 13.5 50.1 27.1 112.3
69 AUTO REPAIRS 0.5 1.0 1.0 8.6 2.6 13.7
70 FILM/RECREATION 124.4 173.7 510.8 3488.9 389.7 4687.6
71 HEALTH SERVICES 26.1 31. 0 30.9 237.1 96.2 421.4
72 EDUC/NON-PROFIT 32.7 34.8 161. 7 264.2 182.9 676.4
73 GOVERNMENT 2.3 0.2 1.5 18.4 0.2 22.6
74 SCRAP 0.0 0.0 0.0 0.0 0.0 0.0
TOTAL 19250.6 66220.9 43680.9 41566.3 33395.1 204113.9
-30-
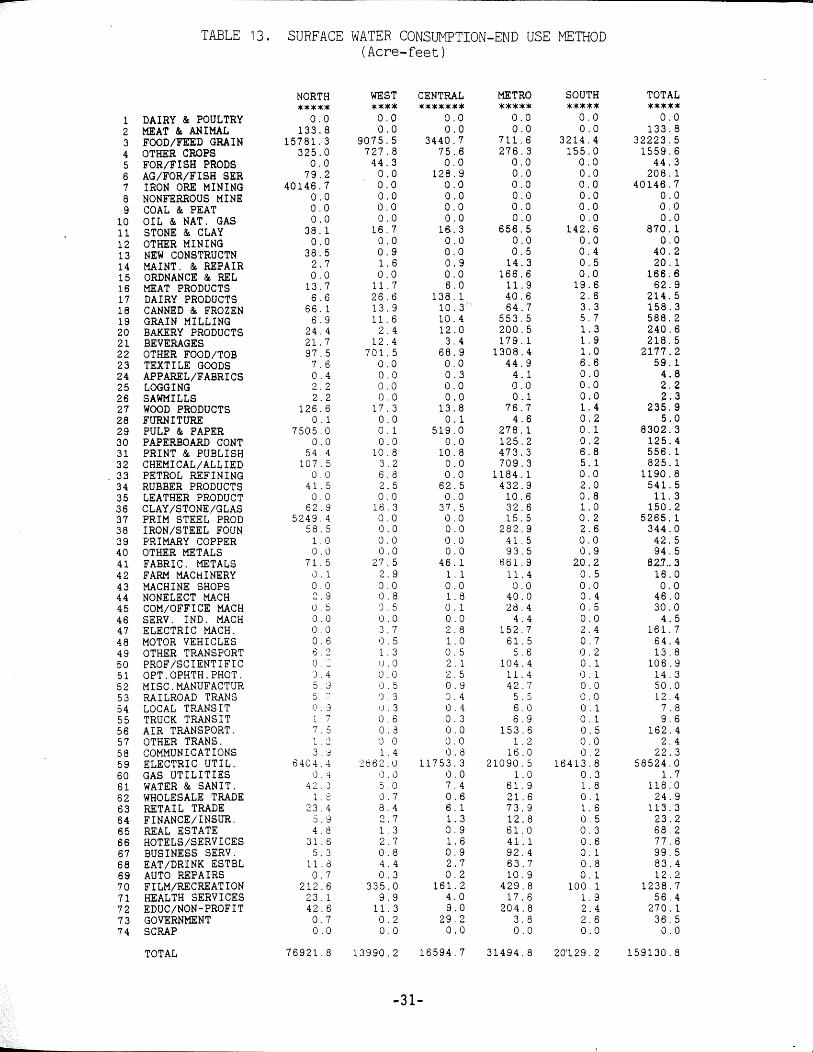
TABLE 13. SURFACE WATER CONSUMPTION-END USE METHOD(Acre-feet)
NORTH WEST CENTRAL METRO SOUTH TOTAL***** **** ******* ***** ***** *****
1 DAIRY & POULTRY 0.0 0.0 0.0 0.0 0.0 0.02 MEAT & ANIMAL 133.8 0.0 0.0 0.0 0.0 133.83 FOOD/FEED GRAIN 15781.3 9075.5 3440.7 711.6 3214.4 32223.54 OTHER CROPS 325.0 727.8 75.6 276.3 155.0 1559.65 FOR/FISH PRODS 0.0 44.3 0.0 0.0 0.0 44.36 AG/FOR/FISH SER 79.2 0.0 128.9 0.0 0.0 208.17 IRON ORE MINING 40146.7 0.0 0.0 0.0 0.0 40146.78 NONFERROUS MINE 0.0 0.0 0.0 0.0 0.0 0.0
9 COAL & PEAT 0.0 0.0 0.0 0.0 0.0 0.0
10 OIL & NAT. GAS 0.0 0.0 0.0 0.0 0.0 0.0
11 STONE & CLAY 38.1 16.7 15.3 656.5 142.6 870.1
12 OTHER MINING 0.0 0.0 0.0 0.0 0.0 0.0
13 NEW CONSTRUCTN 38.5 0.9 0.0 0.5 0.4 40.2
14 MAINT. & REPAIR 2.7 1.6 0.9 14.3 0.5 20.1
15 ORDNANCE & REL 0.0 0.0 0.0 166.6 0.0 166.6
16 MEAT PRODUCTS 13.7 11.7 6.0 11. 9 19.6 62.9
17 DAIRY PRODUCTS 6.6 26.6 138.1 40.6 2.6 214.518 CANNED & FROZEN 66.1 13.9 10.3 64.7 3.3 158.3
19 GRAIN MILLING 6.9 11. 6 10.4 553.5 5.7 588.220 BAKERY PRODUCTS 24.4 2.4 12.0 200.5 1.3 240.621 BEVERAGES 21. 7 12.4 3.4 179.1 1.9 218.522 OTHER FOOD/TOB 97.5 701.5 68.9 1308.4 1.0 2177.223 TEXTILE GOODS 7.6 0.0 0.0 44.9 6.6 59.124 APPAREL/FABRICS 0.4 0.0 0.3 4.1 0.0 4.825 LOGGING 2.2 0.0 0.0 0.0 0.0 2.226 SAWMILLS 2.2 0.0 0.0 0.1 0.0 2.327 WOOD PRODUCTS 126.6 17.3 13.8 76.7 1.4 235.928 FURNITURE 0.1 0.0 0.1 4.6 0.2 5.029 PULP & PAPER 7505.0 0.1 519.0 278.1 0.1 8302.330 PAPERBOARD CONT 0.0 0.0 0.0 125.2 0.2 125.431 PRINT & PUBLISH 54.4 10.8 10.8 473.3 6.8 556.132 CHEMICAL/ALLIED 107.5 3.2 0.0 709.3 5.1 825.133 PETROL REFINING 0.0 6.8 0.0 1184.1 0.0 1190.834 RUBBER PRODUCTS 41.5 2.5 62.5 432.9 2.0 541. 535 LEATHER PRODUCT 0.0 0.0 0.0 10.6 0.8 11. 336 CLAY/STONE/GLAS 62.9 16.3 37.5 32.6 1.0 150.237 PRIM STEEL PROD 5249.4 0.0 0.0 15.5 0.2 5265.138 IRON/STEEL FOUN 58.5 0.0 0.0 282.9 2.6 344.039 PRIMARY COPPER 1.0 0.0 0.0 41.5 0.0 42.540 OTHER METALS 0.0 0.0 0.0 93.5 0.9 94.541 FABRIC. METALS 71. 5 27.5 46.1 661.9 20.2 82.7.. 342 FARM MACHINERY 0.1 2.9 1.1 11.4 0.5 16.043 MACHINE SHOPS 0.0 0.0 0.0 0.0 0.0 0.044 NONELECT MACH 2.9 0.8 1.8 40.0 0.4 46.045 COM/OFFICE MACH 0.5 0.5 0.1 28.4 0.5 30.046 SERVo IND. MACH 0.0 0.0 0.0 4.4 0.0 4.547 ELECTRIC MACH. 0.0 3.7 2.8 152.7 2.4 161. 748 MOTOR VEHICLES 0.6 0.5 1.0 61. 5 0.7 64.449 OTHER TRANSPORT p 'J 1.3 0.5 5.6 0.2 13.8J.
50 PROF/SCIENTIFIC 0- (J.O 2. 1 104.4 0.1 106.951 OPT.OPHTH.PHOT. '). 4 0.0 2.5 11. 4 0.1 14.352 MISC.MANUFACTUR 5 8 0.5 0.9 42.7 0.0 50.053 RAILROAD TRANS 5 'J.3 0.4 5.5 0.0 12.454 LOCAL TRANSIT (1.9 tJ.3 0.4 6.0 0.1 7.855 TRUCK TRANSIT L 7 0.6 0.3 6.9 0.1 9.656 AIR TRANSPORT. 7.5 0.3 0.0 153.6 0.5 162.457 OTHER TRANS. 1.2 o 0 0.0 1.2 0.0 2.458 COMMUNICATIONS 3.3 1.4 0.8 16.0 0.2 22.359 ELECTRIC UTIL. 6404.4 :2862.0 11753.3 21090.5 16413.8 58524.060 GAS UTILITIES I) . 4 I), 0 0.0 1.0 0.3 1.761 WATER & SANIT. 42.) 5.0 7.4 61. 9 1.8 118. a62 WHOLESALE TRADE 1 .;> 0.7 0.6 21. 6 0.1 24.963 RETAIL TRADE 23.4 8.4 6.1 73.9 1.6 113.364 FINANCE/INSUR. 5.9 2.7 1.3 12.8 0.5 23.265 REAL ESTATE 4.8 1.3 0.9 61.0 0.3 68.266 HOTELS/SERVICES 31. 6 2.7 1.6 41. 1 0.6 77.667 BUSINESS SERVo 5.3 0.8 0.9 92.4 0.1 99.568 EAT/DRINK ESTBL 11.8 4.4 2.7 63.7 0.8 83.469 AUTO REPAIRS 0.7 0.3 0.2 10.9 0.1 12.270 FILM/RECREATION 212.6 335.0 161.2 429.8 100.1 1238.771 HEALTH SERVICES 23. 1 9.9 4.0 17.6 1.9 56.472 EDUC/NON-PROFIT 42.6 11.3 9.0 204.8 2.4 270.173 GOVERNMENT 0.7 0.2 29.2 3.8 2.6 36.574 SCRAP 0.0 0.0 0.0 0.0 0.0 0.0
TOTAL 76921.8 13990.2 16594.7 31494.8 20'129.2 159130.8
-31-

For the Itend use\l method, an average consumptive use for each sector wascalculated by dividing the "straight\l consumption by the "straight ll withdrawaltotals. This average was then multiplied by the \lend use lt withdrawal amounts.Use of this method assumes that the way in which water is used by permittedappropriators is representative of the water use of all firms in that economicsector. While this assumption ;s probably valid for manufacturing, it may notbe applicable to those sectors which include permitted uses that consumeabnonnally large or small percentages of their withdrawals. For instance,permitted users in Sector 70, Films and Recreation, include golf courses and skiresorts. These uses consume large portions of the water withdrawn. Estimatesof water us~ in Sector 70 by the "end use\l method assume that the only water usefor all other facilities is for personal use and office cleaning, processeswhich do not consume much water. Therefore, for those sectors in Table 5 whosewithdrawals were estimated by combining reported use and minimum gallons peremployee, consumption was determined by using average consumption for reporteduse plus ten percent of all water use estimated by the Itend use ll method. (Thismethod assumes that ten percent of the water coming from municipal supplies isconsumed. )
Variations in Water Use
Relatively large fluctuations in the volumes of water withdrawn are typical formost water users. Usually these fluctuations are cyclical. If a municipalutility monitors its water use hourly, it would notice a sudden increase indemand during the early morning hours, as residents rise, shower, flush toilets,and prepare breakfast. Demand usually peaks during the work day, tapers off inthe evening, and becomes minimal during the late night and early morning hours.
Many water uses display seasonal fluctuations, with peaks generally occurringduring the summer months. The demand for municipal water supplies increases insummer, primarily because of 1awn watering. Agricultura 1 irrigators typi callywater their crops during the hot months of July and August, using little if anywater in May, June, or September. Use of water for air conditioning also peaksduring the summer.
-32-

F1 uctuati ons in water demand become an important concern for water resourcemanagers when the peak demands create a constraint on available water supplies.The potential for a conflict over water supplies increases when the peak demandsfor several different users occur simultaneously. The recent availability ofcomputerized water use datafiles at the DNR makes it possible to examine thesechanges in water demand. Analysis of monthly, seasonal, or annual fluctuationsis possible for any combination of use types. Unfortunately, the IPASS model isonly able to use annual data. Since seasonal fluctuations probably have thegreatest impact on the water resource, this limitation greatly reduces the valueof IPASS for the water resource manager.
Several factors can cause a change in annual water withdrawals. On a locallevel, the opening or closing of a manufacturing plant with large waterrequirements can have a significant impact on water demands. However, theimpacts of such a change would probably not extend to the regional or statelevel, where the IPASS model would be able to evaluate its effect on theeconomy. An exception might be the decline in the iron ore mining industry inthe Northeast, which has had a profound effect on the regional economy.
A period of economic growth or recession can cause a broader change in wateruse, as perhaps hundreds of plants are opened or closed. Since IPASS assumes alinear relationship between water use and output, a simulation of economicgrowth would result in a proportional increase in the demand for water. Whilethe validity of this assumption is debatable, it is useful as a firstapproximation of changes in water demand.
From a water management perspective, an interesting topic is changes in waterdemand in resp(;mse to climatological or hydrological changes. We know thatwater supply changes in response to changes in precipitation. Do water demandschange as well? For instance, do specific industries use more water during adrought? The DNR chose to look at the impacts of drought conditions on threewater uses: electric power generation, air conditioning, and irrigation.
The DNR was unable to obtain any substantial data regarding the impacts ofdrought on water use by electric power generation plants. Questionnaire's weremailed to the three largest utilities in the state, but no written responseswere received. One utility representative responded by telephone, but he was
-33-
unwilling to provide any specific data. The representative was~bl~to\s'tate
that the use of mechanical air conditioners does create a lar.ge increase jnelectric demand during the sUlTlller. This increased use, however, isc(i\.lsed byhigh temperatures and humidity, rather than by a lack of precipitation(drought). Furthermore, there is little increase in water demand associatedwith an increase in electric demand, at least in the short tenn. Only thebringing on line of an additional plant would significantly affec.t the demandfor water in the State. Finally, even if an unusually hot time period increasedwater demand, the impact of this change would be negligible c:ompared to theannual water use for the sector.
Ground water is used to cool a significant number of buildings in the TwinCities metropolitan area. The DNR used two different methods to analyze theimpacts of drought on this water use. First, a telephone survey was cQnductedof four of the largest users of ground water air conditioning systems.According to these users, the difference between a normal use of water and anabnorma1 use cau'sed by drought (or more likely, by high temperatures) woul d beless than ten percent. Second, stati sti ca1 tests were conducted to determinewhether there was any correlation between changes in reported water use andclimatic events. This analysis found no significant difference in water usebetween 1976, a drought year, and 1981, 1982, or 1983, years of fairly normalprecipitation. The analysis was limited by a small sample size and significantdifference in time bt!tween the drought year and later years. Technologicalchanges could have occurred between 1976 and 1981 which would have an effect onthe volumes of water withdrawn.
In order to analyze the impacts of drought on water use for agriculturalproduction, the DNR examined reported water use data from a sample ofseventy-two irrigation permits in west central Minnesota. The results showed nosignificant difference in the amount of water applied for varying levels ofrainfall. This was tht:: case for both annual and May-to-September rainfallamounts. In all samples, however, more water was used during dry periods(precipitation levels less than fifteen inches) than during normal or wetperiods. More importantly, since the total amount of irrigated crop land in the
-34-
•
state accounts for less than two percent of all cul tivated acres, even adoubling of water use during a drought would have only a minimal impact on total
crop production.
In thi sana lys is of the three uses of water most 1; ke ly to be affected by adrought, no significant differences in withdrawals were found, even in 1976, one
of the four driest years of this century. Discussion with some water usersindicated that some correlation may exist between high temperatures and
increased water withdrawals. However, there may be no direct climatological orhydrological connection between high temperatures and low water availability, so
it is difficult to determine the usefulness of an analysis relating the two.For the purpose of this study, the results of our analysis showed that theamounts of water required for production should not be adjusted for the IPASS
simulation of drought conditions.
1985 Water Withdrawal Aggregations
The second objective of this analysis was to aggregate water withdrawal data by
region and by principal watershed so that comparisons could be made betweenwater use and available water supplies. If a comparison shows that thepotential exists for a confl ict over avai lable suppl ies in certain geographicareas, then these areas can be targeted for more i ntens i ve water management
activities. These comparisons are discussed in The Value of Water To Minnesota,Volume I of the Water Allocation and Management project report to the
Legislative Commission on Minnesota Resources.
It was not necessary to itemize the water withdrawals by the seventy-foureconomic sectors used by IPASS, so the 1985 data were aggregated into eight
major use categories (Tables 14-17). Withdrawals for mining operations were
further broken down into mine processing and dewatering. Water use inmanufacturing was broken down into seven subcategories of use.
The aggregation techniques used were similar to those used for the "straightmethod" of aggregation for the IPASS analysis. The volumes of water used were
correlated with the entity which withdrew water, rather than the end user.Thus, the volumes of water withdrawn by public utilities' are included under
-35-

II mun ici pal iti es ll and no attempt was made to de:tennine whether .thi swater wasused by private households or any specific economic sector. The Ciggrega1:ions donot include estimates of the volumes of water withdrawn for rural domestic orlivestock use because of the difficulty in estimating human and animalpopulations for individual watersheds. Watershed boundaries are shown in Figure
2.
-36-

TABL
E14
.19
85GR
OUND
WAT
ERW
ITHD
RAW
ALS
BYRE
GION
(Acr
e-fe
et)
IRU
"ACT
URl
tEN
IlERE6I~
NIN
ltEIlE
llATE
RIIIl
IIIR
IliA
TIIIl
FOOD
TEXT
IlES
IOlII
O£I
UC
Il.1E
Tli.
IlACH
llERV
llTI£
RTO
TIlL
IiUIIC
IPAL
ELEC
TRIC
ClJ
IER
Clli
.Gl
NERN
£NT
OTtE
RSTO
Tli.
lEST
......
4252
5.3
2884
.315
.3U
12.6
U•••
U28
32.2
3321
9.5
4.3
467.
418
.719
.679
887.
IIII
RTI£
AST
16'1.
4•••
1143
8.1
n6
.4I.
e23
13.1
97.3
8'1.
'I.
eI.,
3215
.72\
lS18
.'I33
752.
545
3.3
833.
211
m.I
7147
6.2
CENT
IR.
241.
5...
291'
lB.3
4222
.8•••
llU
226.
229
1.1
463.
1I.'
5Jil3
.124
427.
767
4.5
1473
.74'1
8.1
87.8
6189
6.7
METR
O12
82.7
•••28
285.
116
553.
91.
124
261.
7'14
91.1
4213
.118
72.6
225'1
.158
651.
313
9'170
.471
5.5
1']g
17.9
2382
.111
725.
925
28Jl
l.8Sl
IIllf1
lST
64.8
I.'68
'13.7
1344
3.3
195.
221
.211
5'1.4
449.
353
7.7
16.6
1642
2.7
7204
2.1
939.
419
73.'
67.8
1182
3.2
11ll2
26.7
TOTl
i.16
78.4
•••11
0J32
.337••
721
'.526
696.
'111
586.
650
41.3
2873
.422
15.6
8648
5.0
2'le
l1B
.636
076.
3m
15
.237
99.9
2469
1.7
5755
17.4
I W -. I
TAPL
E15
.19
85SU
RFAC
EW
ATER
WIT
HDRA
WAL
SBY
REGI
ON(A
cre-
feet
)
~~ACTURING
NIlE
---
-=
==
==
==
=RE
6IIJ
lN
INIII
lIlW
lTEJ
IIIIl
IRRl
liATI
(WFO
ODTE
XTIlE
SIO
lDCH
9IIC
Al
IilET
li.IlA
CHlt£
R\'
OTl£
Rm
TAL
~'NICIPI\L
ELEC
TRIC
CIJIl
IIlER
CIAL
GlNE
RNEN
fllT
I£RS
TOTA
L
lEST
1514
.2...
1821
5.1R
2211
.3•••
•••15
1.3
•••I.
'1.
123
52.6
1189
l.1!1
459H
.44.
616
.6'11
.872
161.
3M
IRTI
£AST
1873
78.'1
5454
4.6
2977
7.1
lUI
1.1
854(
11.3
1315
.941
121.
1I.
e11
.113
3837
.238
378.
916
1585
.412
81.6
422.
187
2.5
6870
78.2
CENr
IR.
226.
236
.825
84.3
245.
2•••
1117
2.0
3@87
.6I.
'•••
I.'
1451
4.8
5472
.738
9834
.124
1.3
2611
.'113
41.2
4168
51.2
METR
O'11
7.1
2474
9.7
621.
2lU
iI.
e'.1
64.4
I.'
1.1
%.4
168.
817
7185
.244
8118
.6'.
121
72.5
'.165
3824
.1SI
lITI£
AST
1881
.136
2U12
78.2
1.1
1.1
U1.
129
6.1
•••U
296.
11.
151
1154
.2U
237'1
.68.
652
1621
.7
TOTl
L1'1
1'116
.282
95:5
.144
474.
924
46.5
U'16
513.
346
1'1.
341
416.
21.
1%
.415
1151
.723
2827
.915
5566
6.5
1526
.576
12.6
2313
.I22
7143
4.4

FIGURE 2. MINNESOTA'S 39 PRINCIPAL WATERSHEDS
3937
WATERSHED UNITS
1. St. louis 21. Pomme de Terre2. Lake Superior 22. Lac: Qui Parte3. Rainy Lake 23. Chippewa4. Uttle Fork 24. Yellow Medicine5. Big Fork 25. Redwood6. Lake 01 the Woods 28. Cottonwood7. Mustlnka-Bof. de SlOUll 27. Blue Eorth8. otter Tall 28. Mlnnssota-Hawk Creek9. BuffClio 29. Lower Minnesota
10. WIld Rice 30. Kettle11. Red Lake 31. Snake12. Middle 32. Lower St. croiX13. Two 33. Metropolitan14. Roseau 34. Cannon15. Mlsslnlppl Headwatlll1l 35. Zumbro16. Crow Wing 36. Root17. Crow 37. Cedar18. Rum 38. De. Moine.19. Mfsslsslppl-Sauk 39. Rock20. Big Stone
36
-38-

TABL
E16
.19
85GR
OUND
WAT
ERW
ITHD
RAW
ALS
BYW
ATER
SHED
(Acr
e-fe
et)
IAlF
II:TU
RIM
JIII
NEIIl
TEIlS
I£D
IIINI
MJ
IEIlT
EAIM
JIR
RI6I
lTII»
lFI
IJDTE
XTIL
ESIO
JIID
£IIIC
Il.IE
TIl.
1R:I1
INER
YO
llER
TOTI
l....
..IC
IPll.
B.EC
TRIC
Cll
lU:U
I.li
lMII
Ea
II11E
lISTO
TIi.
1Sf
tOO
lS8.
91.
1U
11.1
'.197
.93
U1.
1U
I.'12
8.9
6363
.63J
218.
312
.'Z2
B.9
1.5
3996
2.1
2lA
<E!IJ
lIERI
OR•••
•••U
•••U
U...
UU
.,....
9.8
...8.
9•••
...18
.73
WH
YUI
<E•••
•••U
••••••
••••••
I.e
'.1...
•••&
7•••
9.5
8.'
...28
1.2
~LI
T1l£
FORK
••••••
U•••
U::K
.3U
U•••
•••::K
.352
.8U
...6.
1...
113.
25
BIll
FeIlK
U•••
'.1
•••...
•••U
••••••
...•••
81.4
......
......
81.4
6lA
<ElIE
IIQ
lS...
...•••
•••U
U'.
1...
••••••
•••0
4.9
•••...
I.'...
434.
97
IUiT
IIIU
I-5
IOOX
......
129.
2I.'
U•••
••••••
•••...
•••79
11.8
...1.
6•••
...92
8.6
8OT
TER
TAIL
UU
6433
.645
1.1
I.'
'.1
•••I.
'•••
fU45
1.1
3291
.73.
427
.32.
5...
U&
9.6
9Ilf
FIl.O
...•••
MO.
7•••
U'.1
1II.'
11.1
•••'.
1•••
2735
.3...
7.1
9.2
•••35
'J8.3
1.W
ILD
RICf
•••II.'
34.1
69.4
'.1
lUI
••••••
I.'•••
69.4
1128
.5U
27.9
••••••
1251
.811
lED
LAIE
......
68.4
11.7
••••••
66.3
IUU
•••78
••21
51.1
U26
.4...
1.2
2J24
.112
11I1
11U
...•••
123.
1U
'.11
'.11
•••11
.11ll.
llll.
ll1.
17:
:K.9
1.1
U...
U87
8.1
13
00
11.11
U1.1
1II•
•1.
1I.'
Ull.
ll...
U•••
452.1
1I.'
••••••
...45
2.•
14IO
i£R
I••
1I.'
UU
I.iI
11.1
...I.
llll.
ll...
...3'.
l2.8
...11
.4...
I'"4
IU15
IIISS
IEAI
lIIlT
ERS
U...
272.
53.
7U
117.
7U
35.3
UI.'
146.
715
14.5
534.
318
3.2
4,3
983.
.96
38.5
16C
OW
IMJ
161.
5U
1144
8.1
815.
1I.
ll...
1l.1
1l.1
1l.1
...81
5.1
4321
.3..
997
.94.
951
.6U
i84J
9.4
17CI
lOII
23.1
...11
891.
721
77.4
I.'I.
'91
1.2'.ll
334.
5...
261'
.199
15.1
31.3
47.3
17.2
...22
195.
7I
18lU
IIU
3•••
825.
829
3.7
U1.
117
.239
7.1
1.1
I.'7I
lI.1
4111
.9"I
295.
224
.9...
6I4J
9.1
w 1.0
19M
ISS
-5IU
(44
.8...
2684
ll.2
1145
.6U
21::K
.l21
.92
9U
I.e
•••35
11.6
9o\fi
i.864
3.2
935.
191
7.8
1.5
4234
3.9
I2
tBI
BST
!»E
••1
•••15
88.5
78.3
'.1
1.1
...'.
llll.
eU
78.3
747.
6•••
•••...
I.'
2414
.321
IUIE
IETE
RRE
•••U
8455
.4...
......
I.'
U•••
••••••
1281
.3•••
35.6
1.8
3.1
9717
.222
lII:
fIJI
MIl.
E•••
...93
5.4
1559
.3'.1
1'.
1•••
1.1
••••••
1559
.311
22.6
'.1
8.'
U•••
3.'i2
5.2
23D
iIPPB
AU
•••13
626.
8•••
...•••
12.6
...•••
...12
.626
34.1
...7.
4...
15.3
1629
6.1
24Y
EllO
lllED
lCl1
lE...
...11
7.2
5.5
'.1
••••••
••••••
U5.
545
1.4
...3.
1...
I.'57
7.3
25lE
DIm
I•••
••••••
•••U
••••••
U•••
••••••
988.
8•••
..3
...•••
989.
126
CO
TT
llIm
l"I
•••14
ll8.7
351.
2...
•••38
.7...
1.1
U38
1.9
6451
.422
4.'
9.2
U•••
1155
4.2
27L
IEfA
IIlH
••••••
1529
.821
4ll.
5•••
•••...
•••21
.2•••
2161
.718
122.
4U
131.
7...
15.7
2196
1.3
28III
NN-H
lII<
CR38
.7•••
128.
933
9.7
•••1.1
138
.7...
UU
371.
456
49.5
•••11
8.8
•••U
6298
.329
lOIIE
RIII
NI(S
OTA
299.
5•••
1193
.8~.9
•••49
.191
1.8
64.1
111.
132
4.4
6746
.453
859.
953
.113
31.7
685.
623
13.'
6M81
.931
KET1
lE...
...II
.'1.
1•••
'.1
67.8
UU
'.1
67.8
666.
3I.
'lS
I16
8.5
::K.I
1116
.631
!HIK
E...
'.1
•••U
iI.'•••
I.'U
1.1
U...
791.
8I.
'7.
7•••
...79
9.4
32lO
IIER
STCI
IIIX
4911
.7...
371.
910
2.5
1.1
976.
5'.1
...•••
•••1.
79••
8464
.613
8.4
1535
.17t
9.2
7.4
128M
.33J
IETI
IJIIIL
ITAN
464,
6•••
1358
5.I
1248
1.6
11.11
2323
6.1
8785
.637
51.7
1221
.517
64.6
5123
9.1
8111
99.5
677.
315
234.
'95
2.9
94«i
.517
1577
.834
CIIN
IIIW•••
'.1
6955
.668
9.2
5.5
I.e
316.
7I.
e31
2.7
16.6
1261
.71.
77t.8
...77
6.7
8.'
1.1
1977
2.8
35llJ
IIllIO
4,3
•••37
.721
52.2
IU...
838.
14.
353
.1•••
2947
.716
545.
654
4.1
431.
534
.758
7.7
2113
3.3
3Ii
ROOT
"I'.
1'1.
215
29.2
18'1.
7•••
352.
944
5.'89
.1•••
2615
.897
87.9
'.3
261.
9'.
611
896.
223
161.4
J37
I'IIlA
R•••
•••2113.~
2447
.1...
...'.
6•••
••••••
24U
.7lW
.4J
•••15
.324
.213
9.'
12fi1
1.7
38lIE
SIII
lIES
'.1
I.'8l
2.5
lE..3
15.3
1.1
1.1
1.1
•••...
31.6
2589
.8•••
15.3
U'.1
3459
.23
9m
......
449.
115
.3...
•••...
u...
...15
.368
74,3
I.'12
.31.
6•••
7351
.:1
41TO
TAl
1678
.4I.
e11
1332
.333
279.
321
1.5
2661
5.7
1158
1.1
4911
7.627
42.1
2115
.681
581.
'329
1155
.336
168.
621
77.3
.137
99.9
2467
4.8
5699
64.2

TABL
E17
.19
85SU
RFAC
EW
ATER
WIT
HDRA
WAL
SBY
WAT
ERSH
ED(A
cre-
feet
)
MAt
lFAC
TURI
t«iM
INE
==
--=
==
==
==
==
==
---=
==
==
-~TEI&£D
MIN
lNiDE~TERINi
IRRI6ATI~
FOOD
TEXT
ILES
WOOD
CI19
IICA
lM
ETIl.
MOCH
INER
VO
llER
TOTf
l."H
ICIM
..EL
ECTR
ICCO
fIEA
CIfl.
SlV
Ellff
OT
On£
RS
TOTI
l.
1ST
UlJ
IS8M
88.5
3838
7.2
54.4
8.t
1.1
1182
7.5
1181
.869
6.6
I.'
e.e
1368
5.9
172i
8.8
4833
1.9
152.
22.
1e.
'19
8631
.'2l~
SJPE
RIOR
1863
13.6
1.0
4.1
8.0
0.0
0.0
15.3
e.0
1.8
8.8
15.3
1994
1.3
i.8
24.9
396.
587
1.3
1215
66.9
3RA
INY~
141.
211
184.
80.
'•••
0.0
4559
7.5
11.2
0.1
e.'
e.'
4566
8.7
1228
.8e.'
45.7
•••'.9
5816
9.2
4LI
TTlE
FORt<
e.01.
1•••
0.0
0.0
0 ••
0••
8.0
I.'
•••I.'
1.1
e.'4.
68.
1•••
4.6
581
6FO
RKI.
t•••
66.9
0.t
I.t
I.'
0.t
t.'t.
'e.
8•••
••••••
••••••
e.'66
.9
61A
<E~.mos
'.e
0.8
426.
98.
00.
00.
lAI.
•0•
•I.
e1.
0I.
'1.1
1'.1
'.81.
8•.
142
6.9
7IU
iTlN
<A-S
IOUX
I.'
•••10
.1II.
t0.
00.
01.
10.
10.
0I.e
••••••
•••I.'
I.'
•••t8
.18
OTTE
RTA
IL'.11
0.0
179.
80.
80.
00.
01.
80.
00.
0i.
1e.
017
71.4
4226
2.6
•.1
•.1
'.8
~13.8
9Il.
fHl.O
45.1
•••34
4.9
2.1
0.8
0 ••
139.
60
.'0.
1'.e
141.
728
77.1
1.2
e.••••
e.'
3411
.tII
WIL
DRI
CE24
5.5
0.0
70.8
8.0
0.~
0.0
1.0
0.0
0.0
e.1'.
0'.
0I.
•8.
18.
1•••
315.
5
1110~
1048
.4•••
2469
6.2
32.8
1.1
0.0
56.5
0.1
0.0
0.'
89.3
6582
.1•••
I.'
1.1
•••32
328.
'12
MID
DLE
1.0
••0
liS
.I)
2145
.20.
00.
00.
00.
00.
00.
021
45.2
375.
60.
18.
1I.
•••
126
26.4
13n
il0•
•I.
•0.
t10•
•0.
00.
"0.
00.
00.
00.
0e.
0•••
I.ee.'
e.1
I.'
I.'14
ROS£
OO0.~
0.0
~.0.
0.0
~.~
0.0
~.I
0.0
0.0
0.0
0.'
'.0
•••I.
•0.
0I.e
•••15
"ISS
t£ADW
ATER
S36
.534
28.9
e~6.9
0.0
0.0
2797
6.3
7.1
4642
3.4
0."
0.0
744'
*i.8
0.e
1122
53.5
1~.2
23.3
e.1
2*tl
t9.9
11)
CIO
IW
lt«i
0.0
0.0
2866
.30.
0~.1
0.0
it0
0.0
0.0
0.0
8••
'.0
8.•
e.I
0.0
I.'28
66.3
11CR
OW93
.03£
,.845
0.B
240.
60.
00.
01.
00.
00.
00.
024
8.6
••8
0.'
1.5
e.•~34t.2
2t6
3.'
18Rt
Jl27
.30.
083
.8I.~
0.0
0.1
0.1
0.0
0.0
0.0
'.1
0.'
0.e
e.•
253.
81
.130
4.9
19.u
ss-S
AtJK
109.
9Q
UI2&
38.6
0.0
0.8
1117
2.0
3171
.70.
00.
00.
014
343.
754
72.7
3898
34.0
238.
823
58.1
'.34W
J96.
128
BI6
ST
M1.
00.
0~.e
1.0
0.0
0.0
~..
0.0
0.0
0.0
0.0
0.0
~.8
e.'
0.'
e.'
2949
.8I
21!O
lE~
TERR
E0.
0@•
•H
i.6
0.0
0.0
0.8
0.0
0.0
0.0
0.1
0.0
e.'
•••4.
68.
9e.
'38
.1~
22lO
C00
1M
ILE
42.4
0.0
162.
7'.
00.
00.
00•
•'.
00.
e'.0
0••
0.0
e.I
t.t
'.0e.e
285.'
0 •23
OiIPPE~
I.'
8.1
427.
10.
10.
00.
00 •
•I.e
••1
I.•
e.'
•••I.
'I.e
6.1
I.'
433.
324
YEL.L
t:-.fE
DIC
IN[
1.1
0.8
83.8
21.8
0.~
0.~
0.0
0.1
0.0
0••
21.8
364.
980
6.8
e.•0.
01
.1t2
n.3
25IE
IMKJ
D99
.18•
•38.~
0.0
0.1
li4.e
0.8
0••
0.0
0.'
I.'
I.e•••
e.e1.
5e.
'll
S.7
26C
OT
IlJtm
)18
.6'.
036
5.9
1i4.0
0.0
0.0
1i4••
0.0
0.0
•••0.
10.
0•••
'.1
8.t
0.'
444.
427
!LIE
EART
H14
4.5
e.'
316.
40.
00.
10.
10.
00.~
0.0
lit1
litII
0.8
3231
7.2
0.0
I.'
0.8
3277
8.2
28IU
NtH
Al<
CRe.
0~.e
260.
38•
•8.
00.
0I.
•e•
•I.
•e.
00.
00.
00.
1I.e
e.•I.
•26
1.2
2'9L.
ll'fR
..IN
tESJ
TA23
36.7
8386
.315
2.5
0."
1.8
0.'
0.0
10.0
0.0
0.0
~.8
•.8
7;37
1.8
lit.
603.
3e.e
8576
9.6
JeKE
TTLE
..~16
43.7
3.7
8.0
0.~
0.0
0.0
••0
0.0
0.0
8.1l
0.e0.
'I.
•flU
'0.
016
47.4
31!N
lI<E
0.0
0.1
0.8
0.0
Ii...
0.•
0.0
0.0
e.e0•
•8•
•0.
'•••
0.'
0.e
e.'
•••32
LM
RST
CROI
X0.
0e.e
101.
9It
"0.
00
.00•
•e.
'0
.'It•
•t.e
0.0
2583
17.1
t.I
1528
.0t.
'25
9947
.'33
I£TR
OPIl.
.ITAN
69.0
1772
2.8
326.
80.
00.
~0.
064
.40.
00.
'96
.416
0.8
1n~S.2
5948
99.1
I.'
41.1
0.'
7895
15.'
34C
IN04
0.0
2344
.622
1.8
0.0
0.0
0.•
0••
0.0
0.0
•.ll
I.'
0.0
0.0
t.1
327.
58.
62'
9il.6
35ItM
BRO
91.t
e.'9
0)lU
I0
.00.
00•
•0.
1I.
•0.
'•••
0.1
168.
51.
10.
08.
826
8.8
.L
36RO
OT73
.10.
019
4.3
0.0
0.0
0.0
0.1
296.
10.
0i.
•29
6.1
0.0
0.t
t.'
•••e.
'56
3.4
37IE
)AR
0••
8.•
~.l
0.0
0.0
0.0
0.'
0.8
••••••
e.'
I.'
••••••
0.0
0.8
328.
138
DES
l(IIN
ES26
.4t.
071
.24.
00.
0ft
04.
30
.'0.
0i.'
8.3
0.0
i.1
0••
••0
91.8
197.
639
m<
15.3
•••45
2.3
8.1
itt
e.'7.
4e.
11.
1•••
7.4
I.'•••
'.8'.
8'.
147
5.1
48TO
TIl.
1919
16.2
8295
5.1
'"47
4.9
2446
.50.
096
573.
346
19.3
4741
6.2
0.0
96.4
1511
51.1
2328
27.9
1555
666.
515
26.5
5551
.423
13••
2268
382.
2
,

Conclusions and Recommendations
In this ana1ysi s, the total vol umes of water withdrawn and consumed in eacheconomic region in Minnesota were evaluated. These volumes were broken downamong seventy-four economic sectors and household demand. The results of theanalysis were used as inputs to IPASS, a computer simulation model of the stateeconomy. In addition, a more general evaluation of water use in each region andwatershed in the state was conducted. The results of this phase of the projectwere used in the water balance analysis of the main report to the LegislativeCommission on Minnesota Resources, entitled The Value of Water to Minnesota.
In addition to their value in providing information for use in the IPASScomputer simulations, the methods of analysis used and the results obtained bythis project have intrinsic value to water resource managers. For instance,knowledge of the average volume of water used per employee in each economicsector can be used to estimate total water requirements for a proposedindustrial facility. An understanding of the breakdown of end uses of watersupplied by municipal utilities is useful in allocating water resources duringperiods of short supply. Estimates of consumptive water use are helpful indetermining the net volumes of water withdrawn by a surface water appropriator.
The results of any analysis are only as good as the data used in theirderivation. Future analyses of this type would benefit from improved datasources. The largest source of uncertainty in determining the volumes of waterused in the state is the unknown number of users who appropriate water without aDNR permit. Two options are available which might improve compliance with~'innesota statutes regulating the use of water. First, a public educatiprogram could be used to notify citizens of the requirements under the lawto stress the importance of timely and accurate reporting of water use.program could also improve the quality of the information provided by ex;permit holders. Second, the DNR should expand its enforcement effortsto bring non-permitted water users into compliance with State statutes.
-41-
While Minnesota is far ahead of most other states in collecting and analyzingwater use data, there are some useful water measures which are not collected butcould improve the evaluation of individual permit applications and utilizationof computer simulation models such as IPASS. The DNR should obtain informationregarding the actual costs of water withdrawal from a variety of ground andsurface water sources, and the withdrawal and consumptive water requirements forvarious industrial processes in terms of engineering efficiency. This wouldenable the DNR to more realistically develop standards for reasonable use andwater conservation.
-42-

References
Estimated Water Usage of Power Plants - Minnesota. Westinghouse Hanford Co.!Unpublished document! 1985.
Minnesota Directory of Manufacturers 1985-1986. Burnsville, MN: NelsonMarketing Services Inc., 1985.
The Nation's Water Resources, 1975-2000, Volume 3: Analytical Data. SecondNational Water Assessment by the U.S. Water Resources Council, 1978.
1982 Census of Manufactures, Water Use in Manufacturing. U.S. Dept. ofCommerce, Bureau of the Census Document MC82-5-6. Washington, D.C.:Government Printing Office, 1986.
Olson, Patricia L., and Henry G. Drewes, Statewide Instream Flow Evaluation,Department of Natural Resources, In press.
PC INFO User's Guide. Waltham, MA: Henco Software, Inc. Revision 9, 1985.
Solley, Wayne B., Edith B. Chase, and William B. Mann IV. Estimated Use ofWater in the United States in 1980. U.S. Geological Survey Circular 1001,1983.
Standard Industrial Classification Manual. OfficeStatistical Policy Division. Washington,Office, 1972.
of Management and Budget,D.C.: Government Printing
Trotta, Lee. Methods Used in Estimating Livestock Water Use For 1982 Data Year.Unpublished document, U.S. Geological Survey, 1985.
The Value of Water to Minnesota. Report to the Legislative Commission onMinnesota Resources, Volume I. Dept. of Natural Resources, 1987.
-43-

Appendix
Cover letter and forms used inDNR Wat~r Allocation Survey
~45-

~~T~T~©U'%~DEPARTMENT ,OF NATURAL RESOURCES
BOX J'-, 500 LAFAYETTE ROAD • ST, PAUL MINNESOTA • 55146
DNR INFORMATION(612) 296·6157
January 17, 1986
Dear Minnesota Water User:
The Department of Natural Resources would like tOtenlist your cooperation in aspecial study of water use in Minnesota. The Water Allocation Project, fundedby a grant from the Legislative Commission on Minnesota Resources, is examiningthe value of water to the state's economy. Among the questions we wish toanswer are:
1. How much water is available for use in Minnesota?2. How much water is currently being used?3. How important is water to Minnesota industry? commerce? recreation?
agriculture? private use?4. How much water will we need in future years?5. What would happen if we had a repeat of the drought of the 1930's?
A number of issues and events prompted us to begin this study. First, water hasbecome a major concern of the 1980's - much like energy was in the 1970's.Second, despite the abundance of clean water in the state, there are areas,particularly in western Minnesota, where available supplies do not meet demand.Third, every year, more communities are discovering that their water supplieshave become contaminated and are unfit for use. Fourth, potentially severewater shortages in some western states have spawned discussions of large-scalediversions from water-rich states such as ~innesota. Fifth, thanks to theinformation and processing fees we have received from water appropriation permitholders, we now have ready access to water use data on our computerized storagefil es.
One of the goals for this project is to gain a better understanding of the waysin which water is used in the state. Therefore, we would appreciate your takingthe time to complete the survey form on the reverse of this page.
Participation in this survey is optional; it is not required under theprovisions of your permit. Furthermore, the information you provide isconfidential; the data we collect will only be released to the public inaggregated form. If you have any questions, comments, or suggestions regardingthe surveyor the project, please enclose them with the form or call me at612/297-3899. You may submit the form along with your annual report of wateruse.
Thank you,
-47-
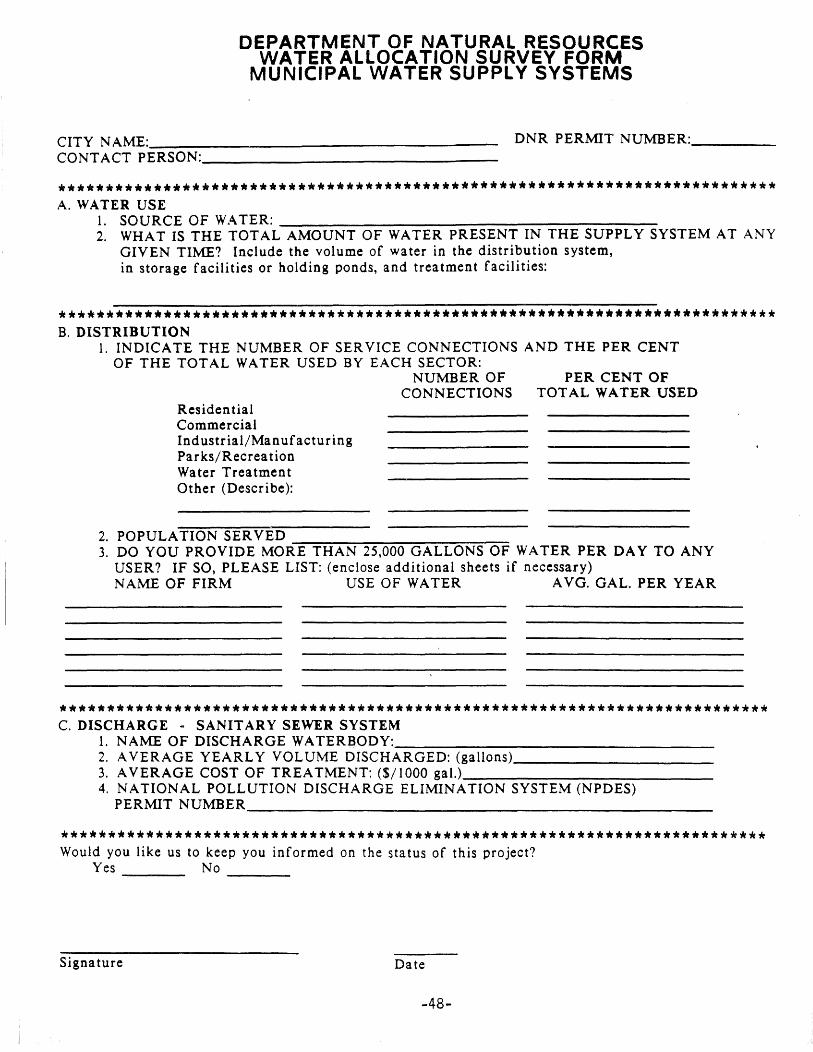
DEPARTMENT OF NATURAL RESOURCESWATER ALLOCATION SURVEY FORM
MUNICIPAL WATER SUPPLY SYSTEMS
CITY NAME: _
CONTACT PERSON: ----------
DNR PERMIT NUMBER: _
********•••••*•••*••••••••••••••••******•••*•••••••*•••••********.*•••*****A. WATER USE
1. SOURCE OF WATER: _
2. WHAT IS THE TOTAL AMOUNT OF WATER PRESENT IN THE SUPPLY SYSTEM AT ANYGIVEN TIME? Include the volume of water in the distribution system,in storage facilities or holding ponds, and treatment facilities:
****••••**••••***.*••**.*.**.*****••*.*********.*****•••••••••••••*********B. DISTRIBUTION
1. INDICATE THE NUMBER OF SERVICE CONNECTIONS AND THE PER CENTOF THE TOTAL WATER USED BY EACH SECTOR:
NUMBER OF PER CENT OFCONNECTIONS TOTAL WATER USED
Residen tialCommercialInd ustr ia1/Ma n ufa cturin gPar ks/Recrea tionWater TreatmentOther (Describe):
2. POPULATION SERVED _3. DO YOU PROVIDE MORE THAN 25,000 GALLONS OF WATER PER DAY TO ANY
USER? IF SO, PLEASE LIST: (enclose additional sheets if necessary)NAME OF FIRM USE OF WATER AVG. GAL. PER YEAR
***.***••••**.***.**********••***********.***.*••••**.******.******••*****C. DISCHARGE - SANITARY SEWER SYSTEM
1. NAME OF DISCHARGE WATER130DY: _2. AVERAGE YEARLY VOL UME DISCHARGED: (gallons) _3. AVERAGE COST OF TREATMENT: ($/1000 gal.) _4. NATIONAL POLLUTION DISCHARGE ELIMINATION SYSTEM (NPDES)
PERMIT NUMBER _
*.*****•••••*•••••*.******.************.***********.**********.***********Would you like us to keep you informed on the status of this project?
Yes No ----
Signature Date
-48-

Before use: _
After use: _
--------------------------
DEPARTMENT OF NATURAL RESOURCESWATER ALLOCATION SURVEY FORM
FIRM NAME: DNR PERMIT NUMBER: _
FACILITY NAME: CONTACT PERSON: _CITY OR TOWNSHIP: COUNTY: _
TYPE OF FIRM: _
STANDARD INDUSTRIAL CLASSIFICATION(S) (IF KNOWN): _NAME OF PRODUCTS OR SERVICES: _
•••••••••••*••*••••••••••••••*••••••*.*•••••••••••••*****.**••••••••*••••••A. WATER USE
1. SOURCE OF WATER: _
2. USE OF WATER: (Be specific. If water is used for cooling, indicate what is being cooled.)
3. WHAT IS THE TOTAL AMOUNT OF WATER PRESENT IN THE SYSTEM AT ANY GIVEN
TIME? Include the volume of water in the distribution system, in storage facilities or holdingponds, and processing equipment: _
4. IS THE WATER RECYCLED OR REUSED FOR ANOTHER PURPOSE? PLEASE DESCRIBE:
••******••**.*•••••••••••••••••••••••••••••••••••••••••••••••••••••••••••••B. OTHER WATER SUPPLIES
1. LIST ANY OTHER SOURCES OF WATER FOR THIS FACILITY: _
2. AVERAGE VOLUME USED PER YEAR: _
3. USE OF THIS WATER: _
4. IF YOU PURCHASE THIS WA TER (e.g., from a municipality) WHAT IS YOUR AVERAGECOST? ($/1000 gal.) _
•••••••••••••••••••••••••••••****••••••••••••••••••••*•••••••••••••••••••••C. CONSUMPTION
HOW MUCH OF THE TOTAL AMOUNT OF WATER WITHDRAWN FROM ALL SOURCES IS NOT
DISCHARGED: (Le., how much water is consumed by your operation?)Per cent: Average total volume per year (gallons): _
*•••••••••••••*•••••••••*.** •••••*••••••*•• **••••••*•••••••••••••••••••••••D. TREATMENT AND DISPOSAL
1. DESCRIBE ANY TREATMENT REQUIRED FOR YOUR WATER SUPPLIES:
Treatment Cost
$ /1000 gal.
$ ! 1000 gal.
2. WHERE IS THE WATER DISCHARGED? PER CENT
Municipal storm sewer system (city)
Holding pond to (name)
River, stream, lake, ditch (name)Other (describe)National Pollutioq Discharge Elimination System Number (NPDES): _
•••••••••••••••••••••••*******.****.*•• *.~•• **••••••••••••••*••••••••••••*.Would you like us to inform you of the status of this project?Yes No _
Signature Date
-49-