an assessment of key costs and benefits associated with ... · pdf file1 2013 an assessment of...
TRANSCRIPT

1
2013
An assessment of key costs and benefits associated with the Ethanol Production Grants program A Report for the Department of Industry
Bureau of Resources and Energy Economics
February 2014

2
Contents
Contents .................................................................................................................................... 1 Figures ....................................................................................................................................... 2 Tables ......................................................................................................................................... 2 Executive summary ................................................................................................................... 3 1. Introduction ...................................................................................................................... 5 2. Overview of the EPG program and Australian ethanol industry ...................................... 5
2.1 The EPG program ............................................................................................................ 5 2.2 The Australian ethanol industry ...................................................................................... 7 2.3 The economics of Australian ethanol production ......................................................... 10
3. Key costs and benefits .................................................................................................... 13 3.1 Key costs ........................................................................................................................ 14 3.2 Key benefits ................................................................................................................... 16
4. Concluding remarks ........................................................................................................ 21 References ............................................................................................................................... 23
Figures
Figure 1: Ethanol Production Grants Program, production and grant payments ..................... 8 Figure 2: Petrol sales, by type, and total sales of automotive gasoline, Australia .................... 9 Figure 3: Ethanol blended petrol sales as a proportion of total petrol sales, 2005−06 to 2012-13 ............................................................................................................................................... 9 Figure 4: Volume of starch exports and ethanol fuel production in New South Wales .......... 10
Tables
Table 1: Summary of estimated EPG program costs and benefits (2012-13) ........................................... 3 Table 2: Ethanol production and the Ethanol Production Grant program ............................................... 7 Table 3: Ethanol production facilities in Australia .................................................................................... 7 Table 4: Estimated maximum price for ethanol, 2012-13 ...................................................................... 11 Table 5: Estimated ethanol production cost, 2012-13 ........................................................................... 12 Table 6: Estimated net revenue from ethanol, 2012-13 ........................................................................ 13 Table 7: Environmental benefit of emissions saved from E10 sales displacing RULP sales, 2012-13 .... 18 Table 8: Health benefit of E10 estimated from sales in Sydney, Melbourne, Brisbane and Perth * ...... 20 Table 9: Industry profit on ethanol-blended fuel not passed on to consumers ..................................... 21

3
Executive summary
In 2012-13 Australian-produced ethanol supplied around 1 per cent of the total road transport fuel market in Australia. The predominant petrol-ethanol blend (E10) is largely sold in New South Wales and Queensland and accounted for around 14 per cent of total petrol sales in 2012-13.
The Australian ethanol industry is small and highly concentrated with one producer located in New South Wales and two producers in Queensland. Manildra, which is the largest producer, supplies around 69 per cent of Australian production.
Ethanol sold as a road transport fuel attracts an equivalent rate of excise to petrol (38.143 cents per litre). However, the Ethanol Production Grants (EPG) program provides Australian ethanol producers with a full rebate on excise payments making their production effectively excise free.
The EPG program has been in operation since 2002 and is scheduled to continue to 2021 when it will be reviewed. The EPG program is only available for domestic producers with the full excise applied to imported ethanol making it uncompetitive compared with domestic producers even where it may be lower cost.
BREE has assessed the key costs and associated benefits from the operation of the EPG program for the year 2012-13. These are presented in Table 1 below.
Table 1: Summary of estimated EPG program costs and benefits (2012-13)
Production 284 million litres
Costs
EPG payments $108 million
Benefits
GHG abatement 0.39 million tonnes CO2-e abated @ effective cost of
$274 per tonne of CO2-e.
Health (reduced air pollution) $10.6 million p.a. and declining
Energy security Negligible (possibly even slightly negative)
Regional employment An estimated 160-200 direct jobs @ a cost of around
$545k to $680k per job.
Feedstock production Negligible
Pass-through benefit to motorist An E10 excise discount of an average 2 cents per litre – valued at around $63 million on 2012-13 sales.
While this is not a comprehensive cost-benefit analysis taken over the projected lifetime of EPG program, this report provides a robust picture of its current impact noting that future benefits and costs can be expected to largely scale over time with changes in production.
Since the inception of the EPG program ethanol production for transport fuel in Australia has grown from 56.8 million litres to a peak of 319 million litres in 2010-11. Since then production (and consumption) has fallen to 284 million litres in 2012-13. The installed production capacity of the three producers is 440 million litres.
4
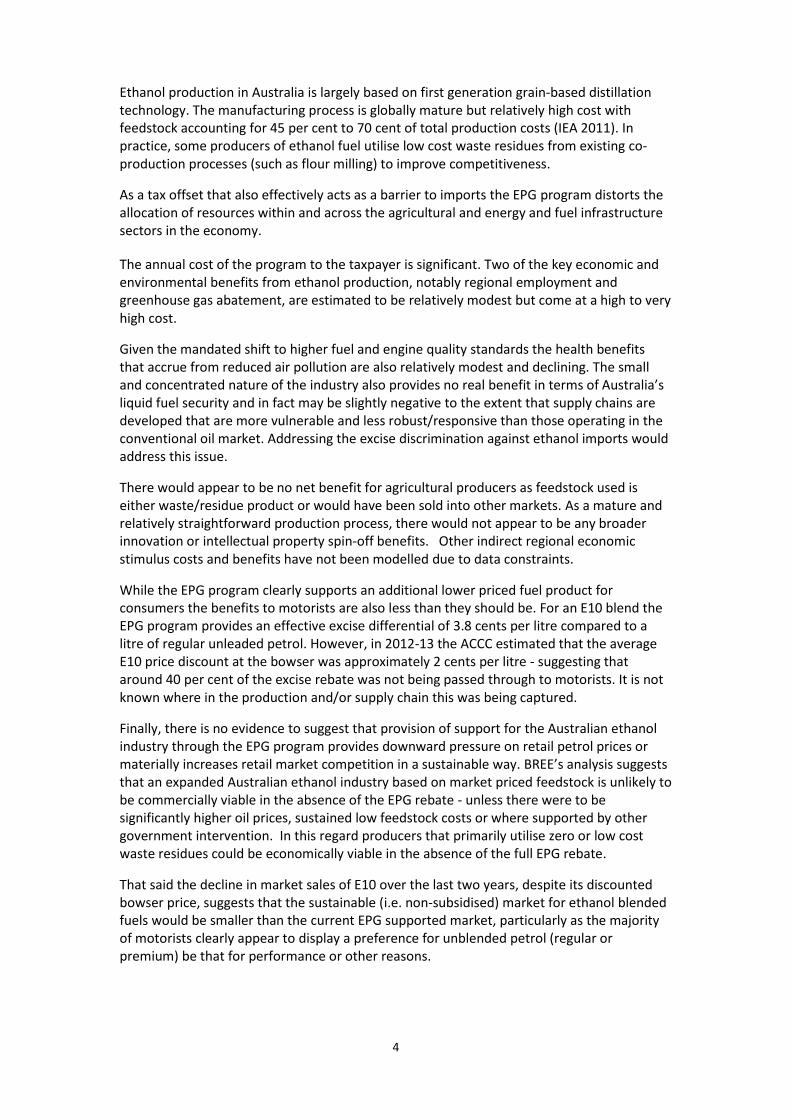
Ethanol production in Australia is largely based on first generation grain-based distillation technology. The manufacturing process is globally mature but relatively high cost with feedstock accounting for 45 per cent to 70 cent of total production costs (IEA 2011). In practice, some producers of ethanol fuel utilise low cost waste residues from existing co-production processes (such as flour milling) to improve competitiveness.
As a tax offset that also effectively acts as a barrier to imports the EPG program distorts the allocation of resources within and across the agricultural and energy and fuel infrastructure sectors in the economy.
The annual cost of the program to the taxpayer is significant. Two of the key economic and environmental benefits from ethanol production, notably regional employment and greenhouse gas abatement, are estimated to be relatively modest but come at a high to very high cost.
Given the mandated shift to higher fuel and engine quality standards the health benefits that accrue from reduced air pollution are also relatively modest and declining. The small and concentrated nature of the industry also provides no real benefit in terms of Australia’s liquid fuel security and in fact may be slightly negative to the extent that supply chains are developed that are more vulnerable and less robust/responsive than those operating in the conventional oil market. Addressing the excise discrimination against ethanol imports would address this issue.
There would appear to be no net benefit for agricultural producers as feedstock used is either waste/residue product or would have been sold into other markets. As a mature and relatively straightforward production process, there would not appear to be any broader innovation or intellectual property spin-off benefits. Other indirect regional economic stimulus costs and benefits have not been modelled due to data constraints.
While the EPG program clearly supports an additional lower priced fuel product for consumers the benefits to motorists are also less than they should be. For an E10 blend the EPG program provides an effective excise differential of 3.8 cents per litre compared to a litre of regular unleaded petrol. However, in 2012-13 the ACCC estimated that the average E10 price discount at the bowser was approximately 2 cents per litre - suggesting that around 40 per cent of the excise rebate was not being passed through to motorists. It is not known where in the production and/or supply chain this was being captured.
Finally, there is no evidence to suggest that provision of support for the Australian ethanol industry through the EPG program provides downward pressure on retail petrol prices or materially increases retail market competition in a sustainable way. BREE’s analysis suggests that an expanded Australian ethanol industry based on market priced feedstock is unlikely to be commercially viable in the absence of the EPG rebate - unless there were to be significantly higher oil prices, sustained low feedstock costs or where supported by other government intervention. In this regard producers that primarily utilise zero or low cost waste residues could be economically viable in the absence of the full EPG rebate.
That said the decline in market sales of E10 over the last two years, despite its discounted bowser price, suggests that the sustainable (i.e. non-subsidised) market for ethanol blended fuels would be smaller than the current EPG supported market, particularly as the majority of motorists clearly appear to display a preference for unblended petrol (regular or premium) be that for performance or other reasons.
5
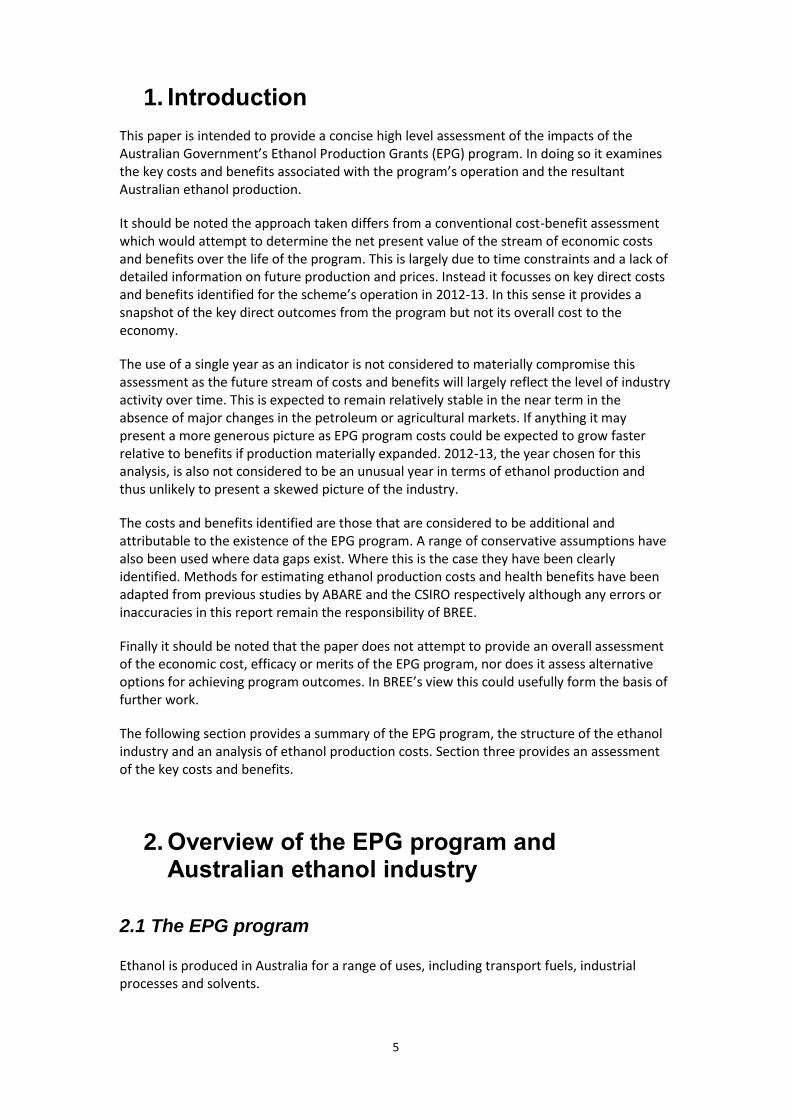
1. Introduction
This paper is intended to provide a concise high level assessment of the impacts of the Australian Government’s Ethanol Production Grants (EPG) program. In doing so it examines the key costs and benefits associated with the program’s operation and the resultant Australian ethanol production.
It should be noted the approach taken differs from a conventional cost-benefit assessment which would attempt to determine the net present value of the stream of economic costs and benefits over the life of the program. This is largely due to time constraints and a lack of detailed information on future production and prices. Instead it focusses on key direct costs and benefits identified for the scheme’s operation in 2012-13. In this sense it provides a snapshot of the key direct outcomes from the program but not its overall cost to the economy.
The use of a single year as an indicator is not considered to materially compromise this assessment as the future stream of costs and benefits will largely reflect the level of industry activity over time. This is expected to remain relatively stable in the near term in the absence of major changes in the petroleum or agricultural markets. If anything it may present a more generous picture as EPG program costs could be expected to grow faster relative to benefits if production materially expanded. 2012-13, the year chosen for this analysis, is also not considered to be an unusual year in terms of ethanol production and thus unlikely to present a skewed picture of the industry.
The costs and benefits identified are those that are considered to be additional and attributable to the existence of the EPG program. A range of conservative assumptions have also been used where data gaps exist. Where this is the case they have been clearly identified. Methods for estimating ethanol production costs and health benefits have been adapted from previous studies by ABARE and the CSIRO respectively although any errors or inaccuracies in this report remain the responsibility of BREE.
Finally it should be noted that the paper does not attempt to provide an overall assessment of the economic cost, efficacy or merits of the EPG program, nor does it assess alternative options for achieving program outcomes. In BREE’s view this could usefully form the basis of further work.
The following section provides a summary of the EPG program, the structure of the ethanol industry and an analysis of ethanol production costs. Section three provides an assessment of the key costs and benefits.
2. Overview of the EPG program and Australian ethanol industry
2.1 The EPG program
Ethanol is produced in Australia for a range of uses, including transport fuels, industrial processes and solvents.

6
In volume terms ethanol represents a small component of Australia’s transport fuel mix; around 1 per cent of the road transport fuel market with ethanol blended fuels (largely E10) making up around 14 per cent of total petrol sales.
As ethanol is a relatively high cost transport fuel to produce in Australia (see section 2.3), the existence of the industry has to a large extent depended on Australian Government assistance under the EPG program along with past programs targeted at supporting conversion of fuel infrastructure.
At the state level only the New South Wales Government operates an ethanol fuel supportive framework with a legislated ethanol supply mandate of 6 per cent for wholesale companies and a requirement for retailers with 20 or more outlets to offer ethanol product for sale.
While ethanol sales in New South Wales are clearly below the 6 per cent mandate target and it remains unclear how it will be enforced, the policy has provided the impetus for a roll-out of retail and distribution level infrastructure that has facilitated a greater take-up of ethanol fuels compared to other jurisdictions. That said, it is questionable as to whether the 6 per cent mandate alone would provide a sufficient market underpinning for domestic producers.
The EPG program, which is administered by the Department of Industry, commenced in September 2002 and is scheduled to be reviewed in 2021. According to the programs guidelines its stated objective is to:
a. encourage the use of environmentally sustainable ethanol fuel as an alternative transport fuel in Australia;
b. increase the capacity of the ethanol industry to supply the transport fuel market;
and
c. improve the long term viability of the ethanol fuel industry in Australia.
Ethanol used for road transport attracts the same rate of fuel excise as applies to petrol (38.143 cents per litre). However, the EPG program provides a full reimbursement of excise for ethanol produced and supplied for transport use in Australia from locally derived feedstocks making it effectively excise free.
In practice this means that the EPG program provides Australian producers (and E10 consuming motorists) with what is in effect a tax payer subsidy equivalent to the foregone excise payments on displaced petrol sales while also economically locking out ethanol imports from the Australian market, even where these may be lower cost.
Table 2 details the equivalent rate of fuel excise and EPG payments to ethanol producers.
7
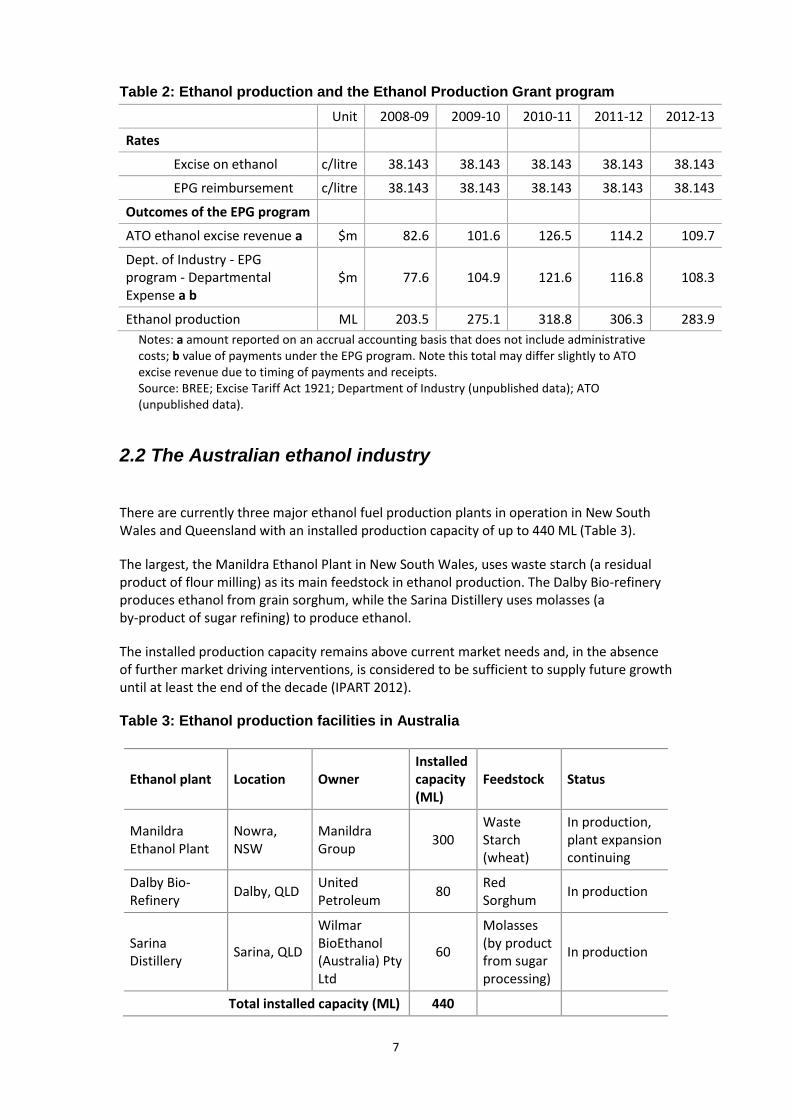
Table 2: Ethanol production and the Ethanol Production Grant program
Unit 2008-09 2009-10 2010-11 2011-12 2012-13
Rates
Excise on ethanol c/litre 38.143 38.143 38.143 38.143 38.143
EPG reimbursement c/litre 38.143 38.143 38.143 38.143 38.143
Outcomes of the EPG program
ATO ethanol excise revenue a $m 82.6 101.6 126.5 114.2 109.7
Dept. of Industry - EPG program - Departmental Expense a b
$m 77.6 104.9 121.6 116.8 108.3
Ethanol production ML 203.5 275.1 318.8 306.3 283.9
Notes: a amount reported on an accrual accounting basis that does not include administrative costs; b value of payments under the EPG program. Note this total may differ slightly to ATO excise revenue due to timing of payments and receipts. Source: BREE; Excise Tariff Act 1921; Department of Industry (unpublished data); ATO (unpublished data).
2.2 The Australian ethanol industry
There are currently three major ethanol fuel production plants in operation in New South Wales and Queensland with an installed production capacity of up to 440 ML (Table 3).
The largest, the Manildra Ethanol Plant in New South Wales, uses waste starch (a residual product of flour milling) as its main feedstock in ethanol production. The Dalby Bio-refinery produces ethanol from grain sorghum, while the Sarina Distillery uses molasses (a by-product of sugar refining) to produce ethanol.
The installed production capacity remains above current market needs and, in the absence of further market driving interventions, is considered to be sufficient to supply future growth until at least the end of the decade (IPART 2012).
Table 3: Ethanol production facilities in Australia
Ethanol plant Location Owner Installed capacity (ML)
Feedstock Status
Manildra Ethanol Plant
Nowra, NSW
Manildra Group
300 Waste Starch (wheat)
In production, plant expansion continuing
Dalby Bio-Refinery
Dalby, QLD United Petroleum
80 Red Sorghum
In production
Sarina Distillery
Sarina, QLD
Wilmar BioEthanol (Australia) Pty Ltd
60
Molasses (by product from sugar processing)
In production
Total installed capacity (ML) 440

8
Notes: Current as at 1 December 2013. The ethanol producer Dalby was taken over by United Petroleum and is now part of this larger entity. Two other producers – Schumer and Tarac - operated between 2003-04 and 2008-09 but since have ceased claiming the EPG payments. Source: Biofuels Association of Australia
Figure 1 compares the production of ethanol fuel for transport purposes and grant payments to the three producers in the market in 2012-13. Ethanol production for the transport market in 2012-13 totalled 283.9 million litres, a decrease of 7.3 per cent from production levels in 2011-12 (Department of Industry).
Figure 1: Ethanol Production Grants Program, production and grant payments
Notes: Manildra is easily the largest producer and in 2012-13 it accounted for 69 percent of ethanol production in Australia. Source: Department of Industry
In 2012-13, petrol sales in Australia totalled 18.7 billion litres, a decrease of 4.8 per cent from consumption levels in 2011-12 (Figure 2). Ethanol-blended petrol (EBP) accounted for 13.8 per cent of total petrol sales in 2012-13.
50
100
150
200
250
300
20
40
60
80
100
120
Manildra EthanolPlant
Dalby Bio-Refinery
Sarina Distillery Total (AllGrantees)
Millionlitres
$ million
2012-13
Ethanol Production Grants (LHS) Fuel Ethanol Production (RHS)

9
Figure 2: Petrol sales, by type, and total sales of automotive gasoline, Australia
Notes: * includes sales of ethanol-blended petrol (EBP), regular unleaded petrol (RULP), and premium unleaded petrol (PULP) as well as proprietary brand petrol sales. Source: Australian Petroleum Statistics
Figure 3 shows EBP sales as a percentage of total petrol sales for New South Wales, Victoria, Queensland and Australia. In 2012-13, sales in New South Wales remained stable relative to 2011-12 at 11 per cent of total sales. However, EBP sales decreased significantly in Queensland and Victoria. Given EBP sales are primarily E10, ethanol comprised around 3.5 per cent of sales in New South Wales and 1.4 per cent of total petrol sales in 2012-13.
Figure 3: Ethanol blended petrol sales as a proportion of total petrol sales, 2005−06 to 2012-13
Source: Australian Petroleum Statistics
In practice, producers of ethanol fuel may exploit their comparative advantage and utilise low cost waste residues from existing production processes, or alternatively minimise production in other ways. For example, since 2001 Manildra has produced ethanol for the fuel market largely from waste starch which is a by-product of carbohydrate produced in flour milling.
5
10
15
20
25
2002-03 2004-05 2006-07 2008-09 2010-11 2012-13
billionlitres
Regular unleaded Premium unleaded
Ethanol-blended fuel Total - Automotive Gasoline *
4
8
12
16
2005-06 2006-07 2007-08 2008-09 2009-10 2010-11 2011-12 2012-13%
Australia NSW (incl. ACT) QLD Vic

10
In addition to revenue associated with ethanol production, producers also earn income from domestic sales and exports of waste from ethanol production that is turned into protein-rich livestock feed. Figure 4 shows the volume of starch exports and ethanol fuel production in New South Wales from 2002-03 to 2012-13. The volume of starch exports from New South Wales show an upward trend since 2002-03, and have remained robust despite a fall in ethanol fuel production from 2010-11 to 2012-13. The export earnings from starch out of New South Wales amounted to $219.9 million in 2012-13, around double the value of total payments to producers under the EPG program of $108 million.
Figure 4: Volume of starch exports and ethanol fuel production in New South Wales
Source: Department of Industry (unpublished data); ABS, 5465.0 - International Trade, Australia - Information Consultancy Subscription Service
International ethanol production
There exists a very substantial international ethanol industry, especially with producers such as Brazil and the United States. Brazil for example had around 440 ethanol production facilities in operation. Brazil produced over 24.5 billion litres of fuel ethanol in 2008 (from sugar cane) and is the world’s largest ethanol exporter and the lowest-cost producer. In comparison the US produced over 34 billion litres of fuel ethanol from corn. Both these countries provide heavy subsidies to their ethanol industries. All motor gasoline sold in Brazil since 1993 has been blended with 18 to 25 percent ethanol.
2.3 The economics of Australian ethanol production The economic viability of domestic ethanol production is determined by the revenue that ethanol can obtain in the fuel market (along with any other revenues from by-products), the costs of production, and taxes or subsidies applicable to ethanol.
The principal factors determining these are oil prices and the resulting prices of petrol, prices of saleable by-products and the cost of feedstock (molasses, wheat, and sorghum). Allowance must also be made for capital and general operating and maintenance costs.
50
100
150
200
250
50
100
150
200
250
2002-03 2004-05 2006-07 2008-09 2010-11 2012-13
MLMt
Starch exports (LHS) Ethanol fuel production (RHS)

11
Ethanol pricing
Because ethanol blended fuel and petrol are market substitutes, the maximum price that producers are able to obtain is set by the pre-tax domestic petrol price rather than by its cost of production.
Taking into account the fact that the energy content (‘energy density’) of ethanol is 68 per cent of that of unleaded petrol (i.e. one litre of ethanol is equivalent to 0.68 litres of petrol in energy terms), the maximum price a petrol distributor would be prepared to pay for a litre of ethanol is 68 per cent of the price of a litre of petrol (less taxes and charges). This maximum price is also referred to as the ‘threshold price’. However, as the EPG program provides a full excise rebate it is also appropriate in this instance to include the value of the rebate in determining the effective maximum possible price that Australian ethanol producers can attract.
Table 4 sets out the estimated maximum ethanol prices with and without the EPG excise rebate. This is based on average Sydney regular unleaded prices for 2012-13.
Working back from an average terminal gate price of $1.35 per litre (which includes fuel excise and GST), this shows that the maximum or threshold price for ethanol in the absence of the EPGs would be $0.57 cents per litre (68 per cent of the pre-tax petrol price).
However, the maximum revenue Australian producers can receive under the EPG program rises to $0.95 per litre ($0.57 a litre plus the 38.143 cent a litre excise rebate). This does not include any post-terminal gate costs such as transport or retail margin as these do not affect relative wholesale prices. However a lack of available data meant that the analysis does excludes any specific ethanol fuel handling costs (such as separate mixing or handling facilities).
Table 4: Estimated maximum price for ethanol, 2012-13
Unit Price
average Sydney petrol price (terminal gate) a $/L 1.35
average Sydney petrol price (ex. excise and GST) $/L 0.84
pre-EPG ethanol ‘threshold price’ b c $/L 0.57
domestic ethanol unit revenue with EPG b c d $/L 0.95
Notes: a The terminal gate price refers to the wholesale price of petrol. It excludes transport costs, retailers’ margins, but is GST-inclusive (Australian Institute of Petroleum (AIP)); b The energy density of ethanol is 68 per cent that of petrol; c GST-exclusive; d The threshold price is the product of the excise exclusive petrol price and the energy density of ethanol relative to unleaded petrol. Source: BREE; AIP.
Ethanol production costs
Australian ethanol is produced through the distillation of three different feedstocks depending on the facility. A breakdown of production cost estimates in 2012-13 for each feedstock type is shown in Table 5. This analysis assumes that market rates (set by domestic or international agriculture markets) have been paid for feedstock inputs.

12
This confirms that feedstock is the largest component of ethanol production costs. The exception to this is where zero or low cost waste or residue material from associated co-production processes (such as flour milling) are used for feedstock. The cost of this type of material is unknown but is likely to be less than the cost of the primary feedstock to the production process.
Ethanol producers also have to pay grain transport and storage costs for feedstock. Transport costs will vary greatly depending on the proximity of the ethanol facility to the source of feedstock. Based on the Stock Feed Manufacturers Council estimates of transport and storage costs ranging from $20 to $50 a tonne in 2005 (SFMCA 2005), a transport and storage cost of $43 a tonne is assumed in this paper for wheat and sorghum. However, ethanol producers in close proximity to feedstock suppliers may incur much lower transport and storage costs. Transport and storage costs of $22 a tonne are assumed for molasses.
In addition to feedstock costs, ethanol producers incur labour, energy and other variable costs and capital costs. Modifying estimates previously provided in Cuevas-Cubria (2012) and taking into account information provided by proponents of new ethanol production facilities, non-feedstock variable costs are estimated at around 9 cents a litre and amortised capital costs are estimated at around 10 cents a litre.
Table 5: Estimated ethanol production cost, 2012-13
Cost item Unit Molasses Wheat Sorghum
Feedstock price $/t 150 a 306 b 284 b
Feedstock transport & storage c $/t 22 43 43
Ethanol yield per tonne of feedstock L/t 280 d 382 e 437 e
Feedstock cost $/L 0.61 0.92 0.75
Other variable costs f $/L 0.08 0.09 0.09
Amortised capital costs g $/L 0.10 0.10 0.10
Gross cost of production h $/L 0.78 1.10 0.93
By-product price h $/t 178 178 178
By-product yield per litre of ethanol h t/L 0.9 0.9 0.9
By-product revenue h $/L 0.16 0.16 0.16
Net cost of production i $/L 0.62 0.94 0.77
Notes: a Reported average export price for molasses. Molasses is not traded in a formal market and it is difficult to observe prices (source: http://www.dawn.com/news/1032579/rising-output-and-export-of-molasses); b ABARES 2012-13 estimate; c Based on information provided in Cuevas-Cubria (2012) of estimates of feedstock transport & storage. It is assumed that there are no transport costs for molasses. The assumed molasses storage costs are equivalent to producing ethanol for six months a year and doubling capital costs per litre; d Based on information provided in O'Hara (2010); e Based on information provided in Wylie (2008); f Includes labour costs, energy costs and costs of non-feedstock inputs. Based on information provided in Cuevas-Cubria (2012), adjusted for inflation using ABS Cat. No. 6401.0 - Consumer Price Index, Australia; g Based on information provided in Cuevas-Cubria (2012) of estimates of capital costs provided by biofuels projects proponents which have been adjusted for inflation;
13
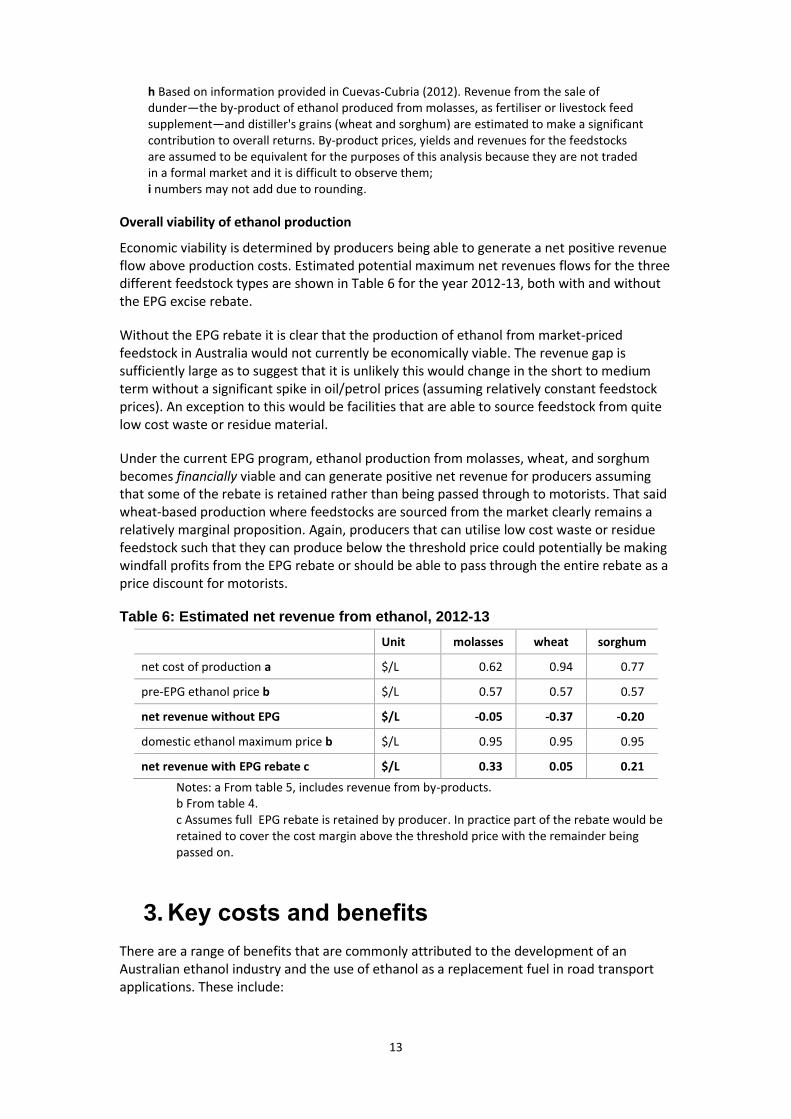
h Based on information provided in Cuevas-Cubria (2012). Revenue from the sale of dunder—the by-product of ethanol produced from molasses, as fertiliser or livestock feed supplement—and distiller's grains (wheat and sorghum) are estimated to make a significant contribution to overall returns. By-product prices, yields and revenues for the feedstocks are assumed to be equivalent for the purposes of this analysis because they are not traded in a formal market and it is difficult to observe them; i numbers may not add due to rounding.
Overall viability of ethanol production
Economic viability is determined by producers being able to generate a net positive revenue flow above production costs. Estimated potential maximum net revenues flows for the three different feedstock types are shown in Table 6 for the year 2012-13, both with and without the EPG excise rebate.
Without the EPG rebate it is clear that the production of ethanol from market-priced feedstock in Australia would not currently be economically viable. The revenue gap is sufficiently large as to suggest that it is unlikely this would change in the short to medium term without a significant spike in oil/petrol prices (assuming relatively constant feedstock prices). An exception to this would be facilities that are able to source feedstock from quite low cost waste or residue material.
Under the current EPG program, ethanol production from molasses, wheat, and sorghum becomes financially viable and can generate positive net revenue for producers assuming that some of the rebate is retained rather than being passed through to motorists. That said wheat-based production where feedstocks are sourced from the market clearly remains a relatively marginal proposition. Again, producers that can utilise low cost waste or residue feedstock such that they can produce below the threshold price could potentially be making windfall profits from the EPG rebate or should be able to pass through the entire rebate as a price discount for motorists.
Table 6: Estimated net revenue from ethanol, 2012-13
Unit molasses wheat sorghum
net cost of production a $/L 0.62 0.94 0.77
pre-EPG ethanol price b $/L 0.57 0.57 0.57
net revenue without EPG $/L -0.05 -0.37 -0.20
domestic ethanol maximum price b $/L 0.95 0.95 0.95
net revenue with EPG rebate c $/L 0.33 0.05 0.21
Notes: a From table 5, includes revenue from by-products. b From table 4. c Assumes full EPG rebate is retained by producer. In practice part of the rebate would be retained to cover the cost margin above the threshold price with the remainder being passed on.
3. Key costs and benefits
There are a range of benefits that are commonly attributed to the development of an Australian ethanol industry and the use of ethanol as a replacement fuel in road transport applications. These include:
14
Regional and industry development and employment
Reduced greenhouse gas emissions
Better health outcomes through lower air pollution
Enhanced energy security
Against these must be measured the cost of the program and the cost of potential resource allocation distortions in the economy.
Given that the on-going viability of the industry appears heavily dependent on the EPG program, it is reasonable to associate the majority of costs and benefits from ethanol production and consumption to the EPG program. This does not include those costs (such as construction, infrastructure conversion etc) or benefits incurred in prior years to establish the industry as these are considered to be sunk in nature.
Finally, it should be noted that a comprehensive cost-benefit assessment would require regional or national economic modelling to properly assess the range of direct and indirect gains or losses across different sectors of the economy.
Due to data constraints a partial approach focussing on the key identifiable impacts has been prepared. For this reason it is not appropriate to simply sum presented costs against benefits to assess the overall merit of the program.
3.1 Key costs
As the EPG rebate changes relative prices for fuels it acts as a distortion in Australian transport fuel and agricultural markets. However, this means that there are a range of associated costs.
Foregone excise revenue
A key cost of the EPG program is the revenue loss to Government in the form of the rebates paid to producers. As noted in section 1 this totalled around $108 million in 2012-13. While the EPG program can be regarded as a fiscally neutral program (i.e. EPG outlays are matched to excise receipts for fuel grade ethanol), it is in effect a transfer payment from taxpayers to Australian ethanol producers (and ethanol consuming motorists) with a subsequent cost to the budget from the loss of excise that would have been otherwise paid. Economic loss However, payments under the EPG program are not a measure of overall economic cost as these transfers flows through (at least in part) through producers into the economy with resultant distortion of resources, investment and expenditure. In addition the requirement for imported ethanol suppliers to pay fuel excise effectively locks out competition from lower cost overseas producers in the domestic market. As this means Australian consumers only have access to the higher cost fuels this also incurs an economic loss on the economy.
Given that the analysis suggests that the industry is likely to be uneconomic in the absence of the EPG, it is likely that the program imposes material distortions and cost in the economy. However, as noted previously to fully assess broader economy-wide costs would require the use of a computable general equilibrium model or similar tool which was unavailable to BREE in the timeframe of this report.

15
Previous work by ABARE in 2010 in relation to the costs and prices of Brazilian ethanol imports demonstrated that the landed price of imports is competitive with, and in some cases, lower than the prices of Australian domestic production1. The ABARE work assumed an Australian exchange rate of US88 cents (which is similar to levels of the current exchange rate). Including the transport costs to Australia and the 5 per cent ad valorem duty applying to imports, ABARE estimated the cost of Brazilian imports to be around 69 cents a litre. At the time this compared with costs for Australian-produced ethanol at around 80 cents a litre. Both of these calculations are pre-excise and GST. This is consistent with updated production costs presented in Section 2.3.
While this study has not attempted to model the cost of import exclusion in GDP or consumer welfare terms it may be potentially material.
Competition with food production
Given the comparatively small scale and structure of Australia’s ethanol industry feedstock competition with other producers (food or cattle feed) thus far does not appear to be a significant issue.
It is important to note that industrial-grade wheat flour and molasses are by-products of industrial processes used in agriculture. The feedstocks used in Australia to produce ethanol, predominantly based on waste starch and C-molasses, have limited impact on other markets because the products are regarded as residues. While sorghum is an agricultural product, the overall effect of small levels of feedstock used in ethanol production on agricultural markets and prices is limited. That said there is the potential of some localised price pressure on the cost of sorghum in the Dalby area.
Significant expansion of the industry could begin to introduce local competition and price pressures in grains and feedlot markets although this is considered unlikely over the medium term.
Reduced competitiveness of alternative fuels
The EPG program also imposes another distortion by reducing the competitiveness of other alternative fuels and emerging fuels.
This market distortion arises since these sort of alternative fuels have the full excise rate of 38.143 cents per litre applied to them, in contrast to ethanol which has an effective zero excise rate. As a result, there is a significant cost advantage for ethanol versus other alternative fuels (except for biodiesel) of close to 40 cents per litre.
Government policies that currently support many first generation production and their relatively high costs could also be viewed as an impediment to the development of second generation biofuels. For example, the goals of some current policies that support the industry with capital grants are not always in alignment with policies that foster innovation to further develop the production and process technologies (Sims et al. 2010; Batten & O’Connell 2007).
1 Compared to production costs for wheat-based ethanol in Table 5.

16
These alternative fuels include some of the emerging and potential fuels that are being examined in the current Australian Liquid Fuels Technology Assessment (ALFTA) study.
Similar to other indirect costs described above, it is difficult to be definitive over the magnitude of these possible costs. However, a better understanding of this issue may be gained once the ALFTA study is finalised. This work will provide more specific information on the approximate costs of these emerging alternative fuels.
3.2 Key benefits
As noted previously there are a range of benefits often cited to support the case for on-going assistance to Australian ethanol producers. It should be noted that as ethanol fuel currently comprises only around 1 per cent of Australia’s transport fuel market this will tend to significantly constrain the size of the various benefits available from its use. In addition, the social/economic value of some benefits (such as greenhouse gas (GHG) abatement or air pollution reduction) should be tested against the cost of achieving these outcomes through lower cost approaches.
It is also important in areas such as employment to identify the additional benefits. That is to say the extra benefit (in this case jobs) created due to the program rather than those that may simply have been moved from one part of the economy to another due to resource diversion -such as jobs transporting feedstock.
Regional and Industry development
It is evident that the support offered by the EPG program has led to the establishment of a small Australian ethanol transport fuel industry. This has also resulted in regional investment and ongoing employment. As noted previously the full economic benefits of this are not assessed in this paper.
However, it is possible to assess to an approximate order the direct employment in the industry in 2012-13. This provides a sense of the ongoing impact of the measure. Even in this regard the data is partial as information around employment is not generally publicly available and there are no specific reporting requirements placed on the industry beyond evidence to support grant claims.
BREE estimates that around 160 to 200 people are employed in ethanol production at the three sites. A newspaper feature from 2010 reported that the Dalby plant employed around 60 staff to produce ethanol (sourced from http://www.queenslandcountrylife.com.au/news/agriculture/agribusiness/general-news/dalby-celebrates-ethanol-anniversary/1760116.aspx). Based on its production level relative to the production of Dalby (which is the closest producer by size), Wilmar Bioethanol is assumed to employ about 20-30 staff within its ethanol operation. Again using a scaling approach Manildra is estimated to employ about 80 to 120 people.
What cannot be readily assessed are the additional indirect employment benefits. A previous study by BTRE reported very generous estimates of possible indirect job creation which report a very high employment multiplier benefit (see BTRE 2003).

17
However BREE considers that these estimates should not be translated for this study for a range of reasons. First, the study was undertaken over a decade ago and before the industry was firmly established. This suggests that the estimates are projections of potential employment rather than a reporting of actual employment creation. Secondly, on the balance of direct vs indirect jobs estimated by BTRE it is not possible to reconcile the direct and indirect classifications from that study to the employment reported at Dalby. Extrapolation of these ratios could therefore result in mis-counting. In this regard the study also noted that it is likely that the indirect estimate included some jobs which were not likely to be additional.
At the full cost of the EPG program in 2012-13, this would equate to between $545 000 to $680,625 per estimated direct job in 2012-13. Allowing for the possibility of creating as many again indirect jobs (160 to 200), this would equate to between $272 500 and $340 625 per job.
As a globally mature production process first generation ethanol technologies are not considered to provide any significant broader benefit to Australia in terms of possible innovation or knowledge creation benefits.
Second generation technologies, such as the conversion of lignocellulose (woody or fibrous plant material) to a range of fuels including ethanol and synthetic diesel hold a richer potential for large scale alternative fuel supply. However, these are not yet market ready and still under commercial development. There may be potential for Australian industry or researchers to capture intellectual capital from their development.
Greenhouse gas emissions reductions
The use of ethanol in blended fuel applications such as E10 reduces the overall GHG emissions associated with petrol consumption.
Australia’s National Greenhouse Gas Inventory guidelines indicate that carbon dioxide emissions from the combustion of ethanol produced from molasses, wheat and sorghum should be zero rated (See Department of Environment GHG inventory methods at http://www.environment.gov.au/). This is because it is assumed that the volume of carbon dioxide released during combustion is reabsorbed through the plant growth cycle in feedstock production. However there are small levels of other GHG emissions, such as methane and nitrous oxide, are associated with combustion of ethanol fuel.
Estimates of GHG emissions are made by multiplying the physical quantity of fuel combusted by a fuel-specific energy content factor and a fuel-specific emission factor. Table 7 displays the various emission factors and emissions for each GHG associated with the combustion of ethanol blended E10 fuel in 2012-13. To determine the level of overall emission reduction it is necessary to subtract the emissions from E10 use from the emissions that would have been seen from the combustion of an equivalent (in energy terms) amount of unleaded petrol.
It should be noted that there are also GHG emissions associated with the production of ethanol and which should be included if considering the full lifecycle emission profile. This would reduce the GHG emission reduction benefit obtained from the use of ethanol. However, these are difficult to generalise across different facilities (and should be compared

18
to lifecycle emissions from producing unleaded petrol) and so have been excluded from this analysis.
A range of assumptions were also made in estimating these emissions including: (1) 10 per cent ethanol is always used in E10; (2) no weights are applied to the age of the vehicle fleet; and, (3) the overall fuel efficiency of the vehicle fleet is assumed to be not affected by the use of E10.
As shown in Table 7 the net emissions saved from E10 sales displacing RULP sales in 2012-13 are estimated at 398,031 tonnes CO2-e. This equates to less than 0.1 per cent of Australia’s total emissions in 2012-13.
Table 7: Environmental benefit of emissions saved from E10 sales displacing RULP sales, 2012-13
Amount of ethanol used in E10 (sales of ethanol fuels used in transport) a
kilolitres 256,947
Energy content factor b GJ/kL 23.4
Emission factors of ethanol c
Carbon Dioxide (CO2) kg CO2-e/GJ 0.0
Methane (CH4) kg CO2-e/GJ 1.2
Nitrous Oxide (N2O) kg CO2-e/GJ 2.2
Emissions
Carbon Dioxide (CO2) tonnes CO2-e 0.0
Methane (CH4) tonnes CO2-e 7,215
Nitrous Oxide (N2O) tonnes CO2-e 13,228
Emissions from ethanol used in E10 in transport tonnes CO2-e 20,443
Ethanol sales to petrol equivalent a kilolitres 175,806
Energy content factor b GJ/kL 34.2
Emission factors of gasoline c
Carbon Dioxide (CO2) kg CO2-e/GJ 66.7
Methane (CH4) kg CO2-e/GJ 0.6
Nitrous Oxide (N2O) kg CO2-e/GJ 2.3
Emissions
Carbon Dioxide (CO2) tonnes CO2-e 401,037
Methane (CH4) tonnes CO2-e 3,608
Nitrous Oxide (N2O) tonnes CO2-e 13,829
Emissions from petrol used in transport tonnes CO2-e 418,473
Net emissions saved from E10 sales displacing RULP sales
tonnes CO2-e 398,031
Total EPG payments in 2012-13 $ 108,862,000
Cost of abatement under the EPG program in 2012-13
$/tonne CO2-e 274
19
Notes: a Australian Petroleum Statistics, Table 3A. Sales of petroleum products, Australia; b National Greenhouse and Energy Reporting (Measurement) Determination 2008 (Schedule 1); c All emission factors incorporate relevant oxidation factors (sourced from the DIICCSRTE’s National Inventory Report). Source: BREE, Australian Petroleum Statistics; Department of the Environment; National Greenhouse and Energy Reporting (Measurement) Determination 2008.
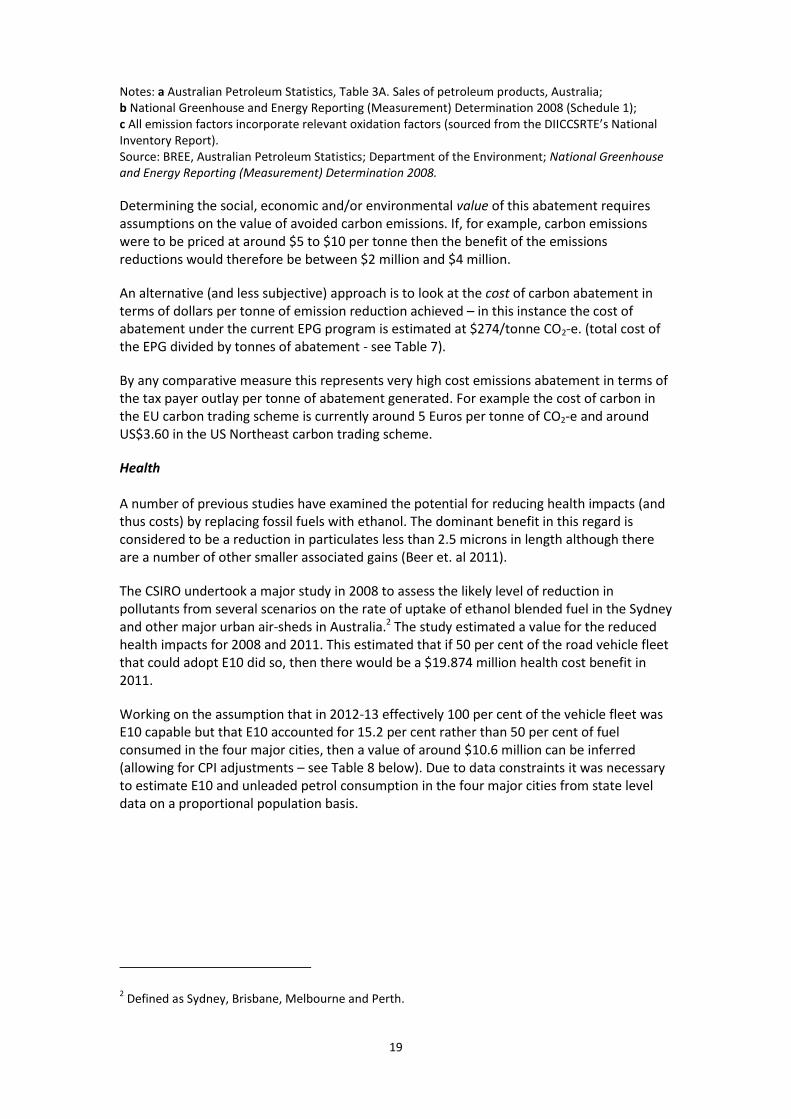
Determining the social, economic and/or environmental value of this abatement requires assumptions on the value of avoided carbon emissions. If, for example, carbon emissions were to be priced at around $5 to $10 per tonne then the benefit of the emissions reductions would therefore be between $2 million and $4 million.
An alternative (and less subjective) approach is to look at the cost of carbon abatement in terms of dollars per tonne of emission reduction achieved – in this instance the cost of abatement under the current EPG program is estimated at $274/tonne CO2-e. (total cost of the EPG divided by tonnes of abatement - see Table 7).
By any comparative measure this represents very high cost emissions abatement in terms of the tax payer outlay per tonne of abatement generated. For example the cost of carbon in the EU carbon trading scheme is currently around 5 Euros per tonne of CO2-e and around US$3.60 in the US Northeast carbon trading scheme.
Health A number of previous studies have examined the potential for reducing health impacts (and thus costs) by replacing fossil fuels with ethanol. The dominant benefit in this regard is considered to be a reduction in particulates less than 2.5 microns in length although there are a number of other smaller associated gains (Beer et. al 2011).
The CSIRO undertook a major study in 2008 to assess the likely level of reduction in pollutants from several scenarios on the rate of uptake of ethanol blended fuel in the Sydney and other major urban air-sheds in Australia.2 The study estimated a value for the reduced health impacts for 2008 and 2011. This estimated that if 50 per cent of the road vehicle fleet that could adopt E10 did so, then there would be a $19.874 million health cost benefit in 2011.
Working on the assumption that in 2012-13 effectively 100 per cent of the vehicle fleet was E10 capable but that E10 accounted for 15.2 per cent rather than 50 per cent of fuel consumed in the four major cities, then a value of around $10.6 million can be inferred (allowing for CPI adjustments – see Table 8 below). Due to data constraints it was necessary to estimate E10 and unleaded petrol consumption in the four major cities from state level data on a proportional population basis.
2 Defined as Sydney, Brisbane, Melbourne and Perth.

20
Table 8: Health benefit of E10 estimated from sales in Sydney, Melbourne, Brisbane and Perth *
2012-13 Unit Sydney Brisbane Melbourne Perth
Estimated petrol sales ML 3837 1902 3552 1488
Estimated total E10 sales ML 1335 182 49 0
E10 proportion of state total petrol sales % 34.8 9.6 1.4 0
Attributed proportion of value of health benefit in 2012-13 b
$ million 8.1 2.2 0.3 0.0
Notes: * assumed 100 per cent take up by motorists of E10 in unleaded ready vehicles and no weights are applied to the age of the vehicle fleet. a estimates based on information provided in Beer (2011). b estimates based on information provided in Beer et.al (2011) adjusted for inflation using ABS Cat. No. 6401.0 - Consumer Price Index, Australia; Source: BREE; Australian Petroleum Statistics; ABS, 3101.0 Australian Demographic Statistics, Jun 2013; ABS Cat. No. 6401.0 Consumer Price Index, Australia; Beer (2011).
The CSIRO and Beer et al both noted that these benefits are reducing over time as Australia implements new Euro 5 mandatory standard with higher grades of fuel. For new car models in Australia, this higher standard was introduced on 1 November 2013 (New Pollution Standards for Vehicles, Press Release, 2011). For all car models in Australia, the new Euro 5 mandatory standard will be introduced from 1 November 2016. Once fully implemented in 2018, the new laws will cut a new car’s maximum allowable emissions of particulate matter, by up to 90 per cent.
Energy security
Proponents of alternative fuels, including ethanol, suggest that there are energy security benefits for Australia, in producing fuels domestically and reducing reliance on international imports of crude or refined fuels.
The Energy White Paper 2012 noted that there were no tangible energy security benefits provided by the small Australian alternative fuel industry given the proven and robust and reliable supply chains provided by the international petroleum market. In fact, it noted that a shift to domestically produced alternative fuels could actually increase supply risks (i.e. reduce energy security) where this is based on a small number of producers with poor supply resilience. This was borne out by the industry’s inability to supply demand during the 2012 Queensland floods due to loss of crops and transport difficulties. This concern would be removed if the excise discrimination against imports was addressed allowing ethanol fuel distributors access to a broader set of suppliers.
Given the small size of the ethanol supply within the transport fuel market, that the international petroleum market functions well in balancing supply and demand, and also the availability of other alternative fuels such as liquid petroleum gas (LPG) and compressed natural gas (CNG), we consider that the suggested benefits for energy security from producing ethanol (or similar biofuels - as an alternative to petrol), are negligible.
The benefit to motorists
An objective of the EPG program is to incentivise take up of ethanol blended fuels by providing an excise discount for motorists at the bowser.

21
Given the on-going price differential between E10 and regular unleaded fuel the EPG does provide motorists with an additional lower priced product. However, this benefit does not appear to be as large as it might be.
As E10 comprises 10 per cent ethanol that is excise free, this suggests that motorists should receive a 3.8143 cents per litre discount relative to regular unleaded petrol.
In 2012-13 the average nominal differential between petrol prices for regular unleaded petrol (RULP) and E10 amounted to 2.0 c/litre (ACCC (2013)). This leaves an estimated 1.8143 c/litre which is not being passed through to the motorist (i.e. it is being absorbed by the production and/or supply chain). Based on production levels in 2012-13 BREE estimates that this is valued at around $42 million (Table 9).
Table 9: Industry profit on ethanol-blended fuel not passed on to consumers
2012-13
Rate of ethanol excise a c/litre 38.143
Rate of ethanol excise on a litre of E10 c/litre 3.8143
Av. nominal RULP–E10 differential b c/litre 2.0
Difference RULP–E10 differential and excise rate on ethanol c/litre 1.8143
Industry profit on ethanol-blended fuel not passed on to consumers $ million 42.0
Notes: a Subitem 10.20 in Item 1 of the Excise Tariff Act 1921 - The Schedule b ACCC (2013) Source: BREE; Australian Petroleum Statistics; ACCC.
There is insufficient information to determine where in the production or supply chain this may be occurring but it is possible that in large part this may reflect the need of producers to use the EPG to cover the cost margin above the threshold price. It should be noted that despite the availability of a lower priced fuel, it is clear from sales data in Section 2.2 that E10 sales have stabilised over the last two years with the majority of motorists continuing to prefer either regular or premium unleaded fuels. This may be related to relatively stable petrol prices, lingering concerns over engine performance or for other reasons. As E10 and petrol prices are set in reference to international oil prices and local retail factors rather than production costs (ACCC 2013) there is no evidence that competition from ethanol supplies has any downward impact on conventional petrol prices or that it promotes additional competition in the retail petrol or distribution industries.
4. Concluding remarks
As noted previously this paper does not attempt to provide a comprehensive assessment of the economic cost of the EPG or its overall policy effectiveness or merits. However it does provide a reasonably well formed picture of the programs key costs and benefits and on the state of the ethanol industry and provides for the following conclusions:
22
Ethanol use in the Australian road transport sector appears to have stabilised at around 1 per cent of overall fuel consumption. E10 as a blended fuel accounts for around 13.8 per cent of petrol sales.
The Australian ethanol industry is small and is concentrated in three producers in New South Wales and Queensland. Current and projected production profiles suggest that expansion of the industry is unlikely without further government intervention to underpin or incentivise such investment.
Ethanol production for transport fuel is unlikely to be economic in the absence of the EPG program (except where sourced from low cost waste or residual product) suggesting further large scale industry growth is unlikely.
The industry receives a significant transfer payment in the form of the EPG. Only around 60 per cent of this benefit flows through to discounted petrol prices for motorists with the rest of the subsidy being absorbed by production and/or supply industries.
The range of non-market benefits is considered to be marginal and high cost with GHG abatement costing tax payers around $274 per tonne of CO2-e abatement and job creation costing several hundred thousand to over half a million per job per year.
There is considered to be some health benefit but this is diminishing with the move to higher fuel and engine standards. There are no apparent energy security or broader innovation or knowledge creation benefits. The discrimination against ethanol imports is likely to be imposing economic cost on motorists and the economy and reduces our energy security situation.

23
References
ABARES 2013 Agricultural commodities: December quarter 2013, Australian Bureau of Agricultural and Resource Economics and Sciences, Canberra. ABARE BRS 2010 Economic viability of ethanol production in Australia, Canberra. ACCC 2013 Monitoring of the Australian petroleum industry, December 2013. Batten, D & O’Connell, D 2007 Biofuels in Australia: Some economic and policy considerations, A report for the Rural Industries Research and Development Corporation, November 2007 Beer, T, Carras, J, Worth, D, Coplin, N, Campbell, P, Jalaludin, B, Angove, D, Azzi, M, Brown, S, Campbell, I, Cope, M, Farrell, O, Galbally, I, Haiser, S, Halliburton, B, Hynes, R, Jacyna, D, Keywood, M, Lavrencic, S, Lawson, S, Lee, S, Liepa, I, McGregor, J, Nancarrow, P, Patterson, M, Powell, J, Tibbett, A, Ward, J, White, S, Williams, D & Wood, R 2011 The Health Impacts of Ethanol Blend Petrol, Energies 2011, 4, p. 352-367. CSIRO (Commonwealth Scientific and Industrial Research Organisation), BTRE (Bureau of Transport and Regional Economics) and ABARE (Australian Bureau of Agricultural and Resource Economics) 2003, Appropriateness of a 350 ML Biofuels Target, Report to the Australian Government, Department of Industry, Tourism and Resources, Canberra, December. Cuevas-Cubria, C 2012 The impact of Australian ethanol policy on agriculture: examining limiting factors, AARES 2012 Conference paper. Department of Resources, Energy and Tourism 2012 Energy White Paper 2012 Australia’s energy transformation, Commonwealth of Australia 2012 International Energy Agency (IEA) 2011 Technology Roadmap - Biofuels for Transport Independent Pricing and Regulatory Tribunal (IPART) 2012 Ethanol supply and demand in NSW: Other Industries – Final Report March 2012 O'Hara, Ian Mark 2010 The potential for ethanol production from sugarcane in Australia. In Proceedings of the Australian Society of Sugar Cane Technologists, Australian Society of Sugar Cane Technologists, Bundaberg, Queensland, pp. 600-609. Sims, R, Mabee, Saddler, J & Taylor, M 2010 An overview of second generation biofuel technologies, Bioresource Technology, 101 (2010) 1570–1580 Stock Feed Manufacturer’s Council of Australia (SFMCA) 2005 Submission to the Biofuels Taskforce, June 2005. Wylie, P 2008 Managing sorghum for high yields: A blueprint for doubling sorghum production, March 2008.

24