an assessment of maryland’s vulnerability to flooding assessment of maryland's...
TRANSCRIPT

Maryland Department of the Environment Flood Hazard Mitigation Section 1800 Washington Blvd. Baltimore, MD 21230-1718 1-800-633-6101
For more information, contact:
An Assessment Of Maryland’s Vulnerability To Flood Damage
John M. Joyce Flood Hazard Mitigation Section
Maryland Department of the Environment and
Michael S. Scott, PhD Eastern Shore Regional GIS Cooperative
Salisbury University
August 2005

An Assessment of Maryland’s Vulnerability to Flooding Page i
Executive Summary...........................................................................1
Part I. History of Flooding and Flood Mitigation.....6
History of Flood Hazard Mitigation in Maryland...............................................6
History of Flooding in Maryland ......................................................................10 Table 1. Flooding history of Maryland ....................................................................10
Flooding and the 100-year Floodplain in Maryland........................................12
Part II. Floodplain Development ..........................................16
Structures in the Floodplain ............................................................................16 Table 2. Structures and people in floodplains in Maryland ..........................................17
Structures Subject to Coastal Erosion ...........................................................18
State Buildings in the Floodplain ....................................................................19
State Schools Subject to Flooding..................................................................20
Other Critical Services and Local Public Buildings Subject to Flooding ....21 Table 3. Schools subject to flooding ......................................................................22
Part III. Modeled Flood Vulnerability Estimates.....23
Software.............................................................................................................24
Data Needed ......................................................................................................25
Procedures ........................................................................................................26
Flooding Scenarios and Damage Estimates ..................................................27 Table 4. Flood zone area versus total area of a subdivision in square miles ...................28 Table 5. Building damage by percent damaged in thousands of square feet...................30 Map 1. Potential building damage resulting from riverine and coastal flooding in thousands of square feet .......................................................................................................31 Table 6. Building damage by occupancy category in thousands of square feet ...............32 Map 2. Residential building damage in thousands of square feet .................................33 Map 3. Government building damage in thousands of square feet................................34 Map 4. Commercial building damage in thousands of square feet ................................35

An Assessment of Maryland’s Vulnerability to Flooding Page ii
Map 5. Industrial building damage in thousands of square feet ....................................36 Table 7. Building damage by construction type category in thousands of square feet .......37 Map 6. Masonry building damage in thousands of square feet.....................................38 Map 7. Concrete building damage in thousands of square feet ....................................39 Map 8. Steel building damage in thousands of square feet .........................................40 Map 9. Wood building damage in thousands of square feet ........................................41 Table 8. Building damage by percent damaged in numbers of buildings ........................43 Map 10. Potential building damage resulting from riverine and coastal flooding by numbers of buildings .......................................................................................................44 Table 9. Building damage by occupancy category in numbers of buildings .....................45 Map 11. Residential building damage in numbers of buildings .....................................46 Table 10. Building damage by construction type category in numbers of buildings ...........47 Map 12. Masonry building damage in numbers of buildings ........................................48 Map 13. Wood building damage in numbers of buildings ............................................49 Table 11. Direct economic losses from buildings in thousands of dollars .......................51 Map 14. Direct economic losses from building damage in thousands of dollars ...............52
Accuracy of Data...............................................................................................53
Improving Accuracy with Local Data ..............................................................53
Part IV. Mitigation Strategies..................................................55
Regulations .......................................................................................................55
Maryland Model Floodplain Management Ordinance ....................................55
Local Mitigation Planning ................................................................................57
Floodplain Management Database and Repetitive Loss Project ..................58 Table 12. Repetitive loss properties in Maryland by county as of November 30, 2004.......59
Mapping Risk – Floods and Tropical Storm Surges ......................................60
Flood Insurance ................................................................................................61
Dams and the State Dam Safety Program ......................................................62
Maryland Stormwater Management Regulations ...........................................63
Maryland Wetlands and Wetland Regulations................................................65
Growth Management – Critical Areas, Sensitive Areas, Smart Growth .......66

An Assessment of Maryland’s Vulnerability to Flooding Page iii
Sea Level Rise Response Strategy .................................................................67
“No Net Adverse Impact” Watershed Planning .............................................68
Part V. Flood Mitigation Projects in Maryland.........71
State Projects ...................................................................................................71 Table 13. Comprehensive Flood Management Grant funds ........................................72 Table 14. Flood grant program acquisitions by county ...............................................73
Federal Projects ...............................................................................................75 Table 15. Major US Army Corps of Engineers flood protection projects in Maryland .........75
Part VI. Funding Mitigation ......................................................77
Sources of Funding for Mitigation ..................................................................77
Part VII. Recommendations.....................................................78
Flood Grant Program .......................................................................................78
Coordination .....................................................................................................78
No Adverse Impact ..........................................................................................78
Wetlands ...........................................................................................................79
Planning ............................................................................................................79
Tax Incentives ..................................................................................................79
Protection of Floodplains ................................................................................79
Sea-level Rise ...................................................................................................79
Acknowledgements .........................................................................80
References...............................................................................................81
Appendix A............................................................................................A-1
100-year Flood Zone and Direct Economic Losses from Buildings by Census Block for Each Subdivision in Maryland
An Assessment of Maryland’s Vulnerability to Flooding Page iv
Appendix B............................................................................................B-1
Detailed HAZUS-MH Flood Vulnerability Modeling Results for Each Subdivision in Maryland
Appendix C............................................................................................C-1
List of State-Owned Buildings in the 100-year Floodplain

An Assessment of Maryland’s Vulnerability to Flooding Page 1
Executive Summary History of Flooding and Flood Mitigation in Maryland
Maryland has had a long history of flood hazard mitigation. Since 1933, Maryland has sought to assure public safety and avoid damage by regulating development projects proposed for the floodplain. In its history, Maryland has been subject to its share of major flooding events from the first recorded flood on May 11, 1860 in Baltimore City along Jones Falls to the devastating floods caused by the tidal surge of Hurricane Isabel in mid-September 2003.
The state is prone to three types of flooding: nontidal flooding (flooding from rivers and streams), tidal flooding (flooding from tides and storm surges), and coastal high hazard flooding (the addition of wave action to tidal flooding). The area that has a 1% chance of being flooding in any given year (known as the 100-year floodplain) gets the most attention with regard to flood mitigation as this area is regulated by local flood ordinances adopted by communities in the National Flood Insurance Program (NFIP). In Maryland, the percent of land area in each county that is floodplain varies from 55.8% in Dorchester County to 4.6% in Garrett County, as estimated using the Q3 digital flood zone maps. However, this statistic neither shows the amount of building stock exposure within that floodplain, nor the varying dynamics of tidal versus nontidal flooding and their impact on potential losses. Indeed, the average age of the Flood Insurance Rate Maps (FIRM) in Maryland used to determine these floodplains was 19 years old. Clearly, more up-to-date and accurate flood studies are needed. Exposure of Maryland’s Built Environment to Flooding
To be vulnerable to flood damage, there must be a structure or some other object of value in harm’s way as well as the possibility of flooding. Two methods of estimating the degree of vulnerability of Maryland’s built environment to flooding were used to tally the built environment exposure. In one, communities were asked to estimate the number of structures within the 100-year floodplain. In the other, digital floodplain maps were overlain with tax parcel assessment information using MDProperty View. Using these methods, an estimate of 68,217 structures are located within the floodplain in the state of Maryland, with these buildings representing almost $8 billion in assessed value.
Coastal erosion is another important factor to consider when examining the exposure of the built environment to flooding. Here, however, reports and estimates conflict. In a 1994 Department of Natural Resources study, it was estimated that 2,500 structures were subject to long-term erosion but that many of these are located on bluffs and are not subject to flooding. On the other hand, FEMA’s Evaluation of Erosion Hazards report estimates 25% of homes and other

An Assessment of Maryland’s Vulnerability to Flooding Page 2
structures within 500 feet of the coast will fall victim to the effect of erosion within the next 60 years.
More information on buildings and critical services located in the floodplain
can be found in the Maryland Hazard Mitigation Plan, prepared by the Maryland Emergency Management Agency (MEMA). Modeled Flood Vulnerability Estimates
In order to provide a systematic examination of the vulnerability of Maryland’s built environment to riverine and coastal flooding, the Eastern Shore Regional GIS Cooperative (ESRGC) at Salisbury University was asked to undertake a vulnerability modeling effort. Using FEMA’s HAZUS-MH hazard vulnerability analysis modeling software, the ESRGC sought to generate maps and tables of Maryland’s potential for loss related to buildings from flooding on a county-by-county basis. This potential for loss, or the degree of vulnerability, was measured using four different factors: amount of county land area in susceptible to a 100-year flood, the amount of square footage of buildings potentially damaged, the number of buildings potential damaged, and the amount of direct economic losses related to buildings. These four measures of loss help give a more complete picture of the very complex issue of vulnerability to floods.
Completion of the HAZUS-MH vulnerability scenario modeling for every
county (and Baltimore City) in Maryland yielded a picture of varying degrees of vulnerability to flooding throughout the state. Regarding the physical nature of the flood zone, over 1,328 square miles of the state fall within the 100-year flood zone. In other words, 13.4% of the land area of the state is vulnerable to a 100-year flood event. These flood zone size estimates are comparable to those completed using the Q3 digital flood zone maps (see above).
One measure generated by HAZUS-MH to express potential vulnerability
is the amount of square feet of damage to buildings in the event of a 100-year flood. The results of the modeling effort reveal that 109,665,000 square feet of Maryland building stock will potentially be damaged in the event of a 100-year flood. Worcester County has the most building stock in harm’s way with over 21 million square feet or 19.4% of the total for the state. The other subdivisions that are the most vulnerable with regard to buildings are Anne Arundel, Prince George’s, Baltimore, and Baltimore City. The majority of damage to buildings in the state of Maryland will be to residential buildings. In fact, about 86% of all the potential damage from the 100-year flood comes from residential buildings. One can also break down the potential building damage by the type of building construction. While construction types are much more widespread than occupancy categories, wood (62%) and masonry (28%) dominate steel (7%) and concrete (3%) in terms of damaged buildings.
An Assessment of Maryland’s Vulnerability to Flooding Page 3
If one examines the level of vulnerability using the number of buildings potentially damaged by a 100-year flood, rather than the amount of damaged square feet, the pattern is similar but more evenly distributed. The county with the most buildings damaged is Anne Arundel, followed by Worcester, Baltimore, Prince George’s, and Washington. However, only Anne Arundel and Worcester made up more than 10% of the state’s total number of buildings damaged (44,755).
Finally, one can characterize the level of vulnerability from coastal and
riverine flooding in Maryland using the amount of direct economic losses related to buildings. This measure includes monetary losses from the buildings themselves (structural damage, contents damage, and inventory loss) as well as monetary losses from the use or disuse of those buildings (losses related to relocation, capital, wages, and rental income). The result of the HAZUS-MH model for all the subdivisions in Maryland shows that $8.12 billion is vulnerable to loss from a 100-year flood. Even more notable is that just 3 counties (Prince George’s – $1.28B, Worcester – $1.03B, Anne Arundel – $0.92B) account for almost 40% of the total direct economic losses related to buildings. Strategies for Mitigating Flood Damage
Given the flood damage vulnerability potential for much of the state of Maryland, it is prudent to adopt well-considered and appropriate measures to mitigate the potential damage. The state agencies most involved with floodplain hazard management, namely Maryland Department of the Environment (MDE), Maryland Department of Natural Resources (MDNR), and Maryland Emergency Management Agency (MEMA), have been collaborating for some time on a variety of flood mitigation strategies. These include
• Maryland Model Floodplain Management Ordinance • Local mitigation planning • Analysis of repetitive flood loss properties • Risk mapping exercises for floods and storm surges • National Flood Insurance Program • State Dam Safety Program • Stormwater management regulations • Wetlands regulations • Sea level rise response strategy • Growth management and, • “No Net Adverse Impact” watershed planning

An Assessment of Maryland’s Vulnerability to Flooding Page 4
Maryland’s Efforts to Mitigate Flood Damage
The Comprehensive Flood Management Grant Program (CFMGP) has been used to acquire structures, install flood-warning systems, construct flood control projects, and other flood mitigation projects over the years. Between 1980 and 2002, a total of approximately $32 million in cost-share funding has been provided by the state for flood management. This funding was used to leverage up to 75% in Federal funds. In addition, beginning in 1946, federal agencies have carried out major flood mitigation projects in Maryland. These projects include dam, levee, and channel construction projects conducted by the Army Corps of Engineers, removal of structures by the National Park Service, and the restoration of waterways by the Natural Resource Conservation Service. Report Recommendations
Therefore, given that Maryland’s predicted vulnerability to flooding impacts tens of thousands of structures and multi-billion dollars in economic loss, more must be done to mitigate the potential flooding impacts. Specifically, this report makes nine policy recommendations:
1. The State’s Flood Management Grant Program needs to be able to fund a wider range of activities than in the recent past. Although acquisitions should remain the primary focus of the program, flood studies, mapping, planning efforts, and other forms of mitigation should also be considered for grant funds when appropriate and cost effective.
2. The State Flood Management Grant Program needs a reliable, dedicated source of funding to fund mitigation projects. Other states (Virginia, West Virginia) place a surcharge on flood insurance policies of 1-5% to fund state mitigation efforts. A yearly surcharge of 3% on Maryland flood insurance premiums would yield approximately $500,000 per year for the program.
3. There needs to be better coordination of state agencies involved in disaster mitigation and mitigation planning to prevent duplication of effort and better use of state resources.
4. A “No Adverse Impact” policy should be implemented through the local planning and permitting process with state assistance. Future development would be predicated upon the principle that existing development will not be harmed by greater flood heights from the adverse impact of new development.
5. In conjunction with sea level rise and the preservation of wetlands, the current policy of armoring shorelines needs to be examined.
6. Dynamic local planning will be important to lowering future vulnerability to flooding. Much can be done at the local level to improve local ordinances and policies to mitigate future disasters.

An Assessment of Maryland’s Vulnerability to Flooding Page 5
7. The state should provide support and strong tax and grant incentives to individuals and communities that undertake measures that result in proven future savings in disaster recovery costs.
8. Greater emphasis needs to be placed on maintaining riverine floodplains and their associated wetlands and steep slopes in their natural vegetation to maintain the vital functions of these important ecosystems.
9. No state policy to deal with the consequences of sea level rise has been articulated. The state needs to take action to articulate policies to mitigate the effects of sea level rise. Among these should be additional elevation of all new buildings (freeboard requirement) and establishment of setback zones from eroding shorelines.

An Assessment of Maryland’s Vulnerability to Flooding Page 6
Part I. History of Flooding and Flood Mitigation History of Flood Hazard Mitigation in Maryland Maryland has had a long history of flood hazard mitigation. The state saw that it had a legitimate interest in assuring that floodplains are not unduly restricted, and that it had a right and responsibility to regulate encroachment. A program was initiated in 1933 by the enactment of the Waterway Construction Law (Article 8-803 of the Natural Resources Article, Annotated Code of Maryland) requiring that a person must obtain a permit if proposing any change to the course, current, or cross section of any stream or body of water in the state, except tidal waters. The primary objective of the permit program is to assure the public safety and damage avoidance when projects are proposed in the floodplain. In addition, the permit program addresses environmental and living resource concerns. The permit program was administered under the Water Resources Administration in the Department of Natural Resources for many years, and, in 1992, the nontidal wetlands review was combined with the floodplain review under the Nontidal Wetlands and Waterways Division. In 1995, these functions were transferred to the Maryland Department of the Environment, (COMAR 26.17.04). Originally, the requirement applied to the 50-year floodplain, but the 100-year floodplain standard was adopted in 1976 to be consistent with the federal requirements. In 1968, Congress passed the National Flood Act, which established the National Flood Insurance Program (NFIP). This act made specified amounts of flood insurance, previously unavailable from private insurers, available under federal auspices. At this time, the Federal Insurance Administration (FIA) of the U. S. Department of Housing and Community Development administered the NFIP. A community could join the program by applying for coverage and agreeing to adopt land use control measures intended to reduce future flood losses. However, the FIA was slow in producing the flood insurance studies necessary to delineate the 100-year floodplain and set actuarial insurance rates. When Hurricane Camille hit in August 1969, only four communities had qualified for the program. In response, the Emergency Flood Insurance Program was enacted in 1969 to allow communities to immediately enter the program without a detailed study, making flood insurance available if they agreed to adopted land use measures to reduce flood losses. Using data at hand, flood hazard boundary maps were produced depicting the approximate 100-year floodplain to give communities some idea of the areas they must regulate. Later, flood insurance studies were conducted, using detailed methods to delineate the 100-year floodplain and set actuarial premium rates. The Act was not very effective in restricting development in floodplains, since people felt they would receive disaster relief and did not need flood insurance. Also, the FIA was slow in making the flood hazard boundary maps available.

An Assessment of Maryland’s Vulnerability to Flooding Page 7
The NFIP was further enhanced by the passage of the Flood Disaster Protection Act of 1973. The Act increased the limits of coverage, extended the emergency program, and set a requirement for purchase of flood insurance for all federally supervised lending institutions making loans for construction in flood prone areas. Persons in nonparticipating communities were denied federal assistance in the form of grants, loans, and mortgages on buildings in the flood hazard area. The requirement for flood insurance is implemented through lenders, who, to receive any federal assistance, must secure the loans with flood insurance. Flood prone communities were identified, notified of their eligibility to participate, and given until December 31, 1975, to apply. However, the program was still slow to catch on because many local officials did not understand the value of the NFIP or the process to apply and adopt regulations. In 1973, Maryland passed the Flood Disaster Protection Act in response to the devastation caused by Hurricane Agnes in June of 1972. It established the Flood Disaster Coordinating Office within the Department of State Planning to coordinate state recovery planning from Agnes. Its role was to coordinate the recovery effort and agencies conducting studies and investigations of flooding problems in Maryland, including the Federal Insurance Administration (FIA), U. S. Army Corps of Engineers, U. S. Geological Survey, U. S. Soil Conservation Service, and the Maryland Department of Natural Resources. By 1973, many of the riverine watersheds in Maryland having serious flooding problems were in some phase of study. Studies were done on a watershed basis, not on a jurisdictional basis as required by the FIA. However, the issue of coastal flooding and tidal inundation was not addressed. An Army Corps survey of the Chesapeake Bay was made in 1963, but contained no provisions to do any studies, although it noted the entire shoreline was vulnerable to damage from abnormal tides and wave action from severe storms. A State Soil Conservation Committee was established in 1937 under the State Board of Agriculture, and moved to the Maryland Department of Agriculture when it was established in 1972. The Committee worked with the 24 Soil Conservation District offices in Maryland on soil and water problems, including watershed protection and flood prevention projects, as well as river basin studies. By 1974, 41 projects had been approved, including 19 dams and 22 flood prevention and drainage ditch projects. The Soil Conservation Service also completed flood insurance studies for the FIA, while the U. S. Geological Survey did the Flood Hazard Boundary Maps.
The Water Resources Administration (WRA) in the Maryland Department of Natural Resources (DNR) was responsible for water resource management activities. In addition to permitting responsibilities, DNR was charged with a program to control the waters of the state and cooperate with federal agencies in matters pertaining to flood control under COMAR 8-901. Included was providing assistance to local governments in drafting land use regulations pertaining to

An Assessment of Maryland’s Vulnerability to Flooding Page 8
areas subject to flooding and conducting floodplain studies to support this effort. DNR was to act as the State Coordinating Office for the NFIP.
As of March 27, 1974, 39 Maryland jurisdictions were eligible for emergency coverage in the NFIP. Two jurisdictions, Prince George's County and Ocean City, were in the regular program. However, preliminary flood hazard boundary maps had been issued to only six jurisdictions. Maryland passed the Flood Control and Watershed Management Act of 1976 to provide the foundation for watershed planning for flood management. Five goals were established:
(1) reduction of existing flood hazards, (2) prevention of future flood hazards, (3) adequate emergency preparedness, (4) preservation of the environmental quality of watersheds, and (5) reduction of economic and social losses.
The Act also stated the need for better coordination among agencies having
flood hazard mitigation responsibilities. It mandated the development of a list of priority watersheds to be studied for the 100-year flood and the preparation of local flood management plans. The Act created a comprehensive flood management grant program (CFMGP) within DNR which could use proceeds from state debt, upon approval of the Board of Public Works, to fund watershed studies and flood control and watershed management capital projects. However, no funding was provided until 1980. The Act was amended in 1980 to authorize $7.5 million in bond revenue for implementation of capital projects. Amendments in 1981 allowed this money to be used for technical studies. As the technical studies and flood management plans were completed, the need for capital projects became apparent, as well as the need for additional funding. The law and implementing regulations encourage acquisition and removal of flood prone structures, while recognizing that structural control measures may be required in certain circumstances. In 1982, the General Assembly authorized an additional $1.5 million in bond funding for the CFMGP. The state funded almost $30 million to the CFMGP for cost shared grants in the period 1980 - 1991, after which the flood grant program was suspended due to budgetary constraints. However, after two major flooding events in 1996, the program became active again, with funding in 1998 until 2003. The development of the Storm Surge Model for the Chesapeake Bay by the Virginia Institute of Marine Sciences in 1978, allowed the development of tidal water surface elevations for different frequency floods by generating a model storm surge up the Chesapeake Bay. The Federal Emergency Management Agency (FEMA), which had taken over the FIA, developed WHAFIS, a computer

An Assessment of Maryland’s Vulnerability to Flooding Page 9
program to determine wave height elevations for coastal areas in 1981. These technologies advanced the development of Flood Insurance Studies for coastal areas in Maryland, which were completed by WRA in the early 1980's.
In 1981, the General Assembly created the Emergency Management Advisory Council, including representatives from state agencies, county and municipal representatives, and emergency managers, to advise the Governor on emergency management matters. The Department of State Planning had previously been given a coordinating role after Hurricane Agnes in 1972 for flood recovery planning and prevention programs within various state and local agencies. The State Hazard Mitigation Office was delegated to WRA in DNR by FEMA, and tasked with a variety of pre-disaster and post-disaster responsibilities. Included was leading the State Hazard Mitigation Team, preparing federally required hazard mitigation plans, and identifying mitigation projects. In 1995, the State Hazard Mitigation Office was moved to the Maryland Emergency Management Agency (MEMA), which now leads the state's involvement in post-flood response and mitigation activities. It is responsible for preparing the preliminary damage estimates for the Governor to request a Disaster Declaration and serves as the Governor's Authorized Representative during disasters. The state of Maryland, through WRA, worked closely with FEMA in coordinating the NFIP at the local level. When the Community Assistance Program - State Support Services Element (CAP-SSSE) was created in 1980 as part of the National Flood Insurance Act, FEMA delegated responsibility to WRA to implement the NFIP in the state of Maryland. The Governor delegated the functions of the State Coordinator for the NFIP to WRA. Regular funding was created by 1985 to provide technical assistance to communities for adopting and implementing floodplain management ordinances. Planning funds were provided in the early 1980's for developing a master plan of mitigation and public education activities. Currently, the State Coordinating Office, now in Water Management Administration of the Maryland Department of the Environment, serves 116 communities participating in the NFIP in the state. The Coordinating Office visits participating communities every 2-3 years to assure adequate implementation and enforcement of local floodplain management ordinances. In 1989, FEMA determined that a resolution to accept the state's permit in lieu of local ordinances was not sufficient. This resolution had been used in a number of small towns for years. In 1990, a State Model Floodplain Management Ordinance was developed incorporating both the NFIP and state requirements, and a major effort began to have all communities adopt a new ordinance over the next two years. The Coordinating Office provides general technical assistance to citizens about flood insurance, flood mitigation, building standards, flood mapping, and flood safety.

An Assessment of Maryland’s Vulnerability to Flooding Page 10
History of Flooding in Maryland
Table 1 lists the major historical flooding events in Maryland: Table 1. Flooding history of Maryland
Year Date Description 1860 May 11 First recorded flood occurred along Jones Falls with heavy damage
to the City's business district and bridges over Jones Falls. 1868 July 24 Jones Falls again flooded Baltimore City with heavy loss of life and
property. Patapsco River flooded Ellicott City. 1876 Unknown "Centennial Storm" noted in Wicomico County. 1889 June Susquehanna and Potomac Rivers largest flood of record to date
(50 to more than 100-year recurrence interval). 1911 August 4 Herring Run through Baltimore County and City. 1923 July 23 Patapsco River flooded greater than in 1868. Ellicott City
under water. March 28-30
Potomac was 20 feet above normal due to snowmelt and intense rainfall, devastating parts of Cumberland (recurrence interval 20 to more than 100-year).
1924
May Potomac flooded Cumberland; Antietam Creek flooded Hagerstown.
1933 August 23-24 Flooding on Eastern Shore due to hurricane. Thirteen deaths, $12.3 million damage (recurrence interval 10 to more than 100-year).
March 4 Spring thaw floods Carroll and Howard Counties. July 9
Aberdeen, Havre de Grace, and Elkton flooded; Roads and bridges in Southern Maryland washed out.
1934
September Federalsburg flooded 9 feet above normal. 1936 March 17-19 Snow melt and heavy rainfall causes most extensive flooding of
Potomac and Susquehanna Rivers, especially Cumberland, Hancock, Williamsport, Point of Rocks, Port Deposit, and Havre de Grace. Losses of $5 million. (Recurrence interval 20 to greater than 100-year).
January Potomac floods Hancock April
"Northeaster" causes extensive flooding statewide. Damage to Cumberland, Williamsport, Baltimore, Dundalk, Washington, DC, Chestertown, Salisbury, and southern Maryland.
1937
October Anacostia River floods Hyattsville, Bladensburg, and other parts of Prince George's County. Gwynns Falls and Patuxent River cause minor floods. A week later Potomac floods Cumberland and Hancock and parts of Southern Maryland flooded.
August Rains flood Dundalk, Parkton, and southern Maryland. 1942 October Potomac floods Cumberland, Hancock, Williamsport, and Point of
Rocks. Washington, DC had floods 17.6 above normal. Patapsco floods Ellicott City.
1945 July Minor flooding throughout state due to extended rainfall. 1948 Minor flooding on Eastern Shore 1949 July Minor flooding in Hagerstown, Frederick, and Baltimore Counties.

An Assessment of Maryland’s Vulnerability to Flooding Page 11
Year Date Description 1954 October 14-
16 Hurricane Hazel dumped heavy rains on North Branch of the Potomac River, causing flooding from Cumberland to Washington, DC. Savage River Dam, built in 1951 prevents more extensive damage. Other areas of state suffer damage. Winds of over 100 mph reported on Eastern Shore. Six deaths; $11.5 million damage. Recurrence interval 25 to greater than 100-year storm.
1955 August 12-13 Hurricane Connie dumps heavy rains on Eastern Shore of over 10 inches. Baltimore - Washington area flooding.
1958 August 26 Heavy rains cause dam failure on Marshyhope Creek, flooding Federalsburg.
July Tropical storm Brenda causes flooding in St. Mary's County. August Potomac and Wills Creek flood Cumberland.
1960
September 12-13
Hurricane Donna causes flooding on Eastern Shore, especially to Ocean City. Two deaths.
1962 March 6-7 "Northeaster" causes extensive flooding on Eastern Shore. Called the most destructive extra-tropical storm experienced on East Coast. Two thirds of Ocean City's population evacuated, with one death.
1966 September Minor flooding throughout state of 10-year frequency. 1967 August Federalsburg and Greensboro severely flooded. 1970 April Minor flash flooding in Cumberland.
August 1-2 Heavy flooding in Laurel, Westminster, Ellicott City, and Baltimore as a result of thunderstorms. Fourteen deaths and $6.5 million in losses. Recurrence interval 25 to more than 100-year.
1971
Sept. 11-12 Heavy rains in Central Maryland, especially Howard County cause $4 million in losses.
1972 June 21-24 Hurricane Agnes, the worst flood in 36 years, and estimated to be the 100-year flood in many places, floods many parts of state. Damage estimated to be several hundred million dollars and 19 lives lost. Severe damage in Ellicott City, Port Deposit, Cumberland, Williamsport, Point of Rocks, and Baltimore City and County. Deaths -19; losses $80 million; recurrence interval 50 to greater than 100-year.
1974 Dec. 1 Storms and tidal surges cause damage statewide, especially on the Western Shore of the Bay.
1975 September 23-26
Hurricane Eloise causes flooding especially in Monocacy and Patapsco River basins with $6.2 million damages. Recurrence interval 10 to greater than 100-year storm.
Feb. 24-26
Snowmelt and intense rainfall causes flooding especially in Pocomoke River - 50 -100-year storm.
1979
Sept. 5-6 Hurricane David floods Rock Creek, Jones Falls, East Branch Herbert Run. Recurrence interval 50 to greater than 100-years.
March 28-29 Statewide flooding and intense coastal erosion, especially along lower Chesapeake Bay. Two deaths.
1984
August 13 Heavy thunderstorms from Harford to Frederick Counties, especially in Baltimore area.
Aug. 18
Remnants of Hurricane Danny flood St. Mary's Co with 10 inches of rain.
Sept. 27
Hurricane Gloria floods Eastern Shore with storm surge, especially Ocean City.
1985
Nov. 4-7 Hurricane Juan combined with stationary front causes flooding statewide, but especially in Potomac river basin. One death and $5 million (nontidal) and $16 million (tidal) damages. Recurrence interval 2 - more than 100-year.

An Assessment of Maryland’s Vulnerability to Flooding Page 12
Year Date Description June 23 Thunderstorms cause flash flooding in Allegany Co. July 6 Statewide flooding, but most severe in Elkton.
1989
August 20 Thunderstorms dump 10 inches of rain in Pocomoke River area. 1992 Jan. 4
Dec. 11
Northeaster caused severe beach erosion in Ocean City - Assateague area. West Ocean City area experiences floods (Snug Harbor, Eagle's Nest, Frontier Town). Heavy rains in Cecil Co. cause flooding especially of Main Street in Elkton by Big Elk Creek
1993 Nov. 28
Heavy rains (5 inches) cause flooding in Frederick area (Monacacy River).
1995 June Thunderstorms in Westernport, Allegany Co. cause runoff from surrounding mountains.
Jan. 19-20
Heavy rains and snow melt cause widespread flooding in Western MD (AL, GA, WA, FR counties) and in Cecil County, esp. Port Deposit and Farr Creek.
June
Isolated thunderstorms flood parts of Frederick Co. especially Emmitsburg.
1996
Sept. 6 Remnants of Hurricane Fran cause widespread flooding in Western MD, especially George's Creek. $1.7 million in damages.
1999 Sept. 16 Hurricane Floyd causes widespread flooding on Eastern Shore, especially in northern portions. Damages $14 million, and greater than 500 year flood in places.
2000 Sept. Local thunderstorms flood SW Cumberland from stormwater off Haystack Mountain.
2003 Sept. 18-19 Remnants of Hurricane Isabel cause widespread tidal surge flooding, esp. in middle portion of Bay. Close to 100-year flooding. Riverine flooding minor.
2004 July Local thunderstorms cause isolated flooding in Baltimore City and Harford Co, especially Havre de Grace.
Flooding and the 100-year Floodplain in Maryland Land adjacent to any water body is subject to flooding. Flooding is a result of unusually high water levels associated with meteorological events. Flood is defined under the NFIP regulations as "a general and temporary condition of partial or complete inundation of normally dry land areas from the overflow of inland or tidal waters or the unusual and rapid accumulation or runoff of surface waters from any source". The term "flood stage" refers to the level at which waters begin to rise above riverbanks. High water is generally not considered to be a problem until it begins to adversely affect people or their property.
There are three general classifications of types of flooding:
• Nontidal Flooding - flooding from rivers, streams, etc., with gravity flow downstream.

An Assessment of Maryland’s Vulnerability to Flooding Page 13
• Tidal Flooding - flooding by slowing rising water from tides and storm surges.
• Coastal High Hazard Flooding - flooding from static tidal flooding with the addition of waves of at least three feet.
Most of Maryland's inland nontidal watersheds are relatively small in area. Prolonged or intense rains run off quickly, accumulating in tributary streams and main channels within hours. The waters typically rise quickly often resulting in flash flooding, but fall just a quickly as the water moves on downstream. Studied nontidal floodplains have designated floodways, where the deepest and high velocity waters will flow during the 100-year flood. A few watersheds are extensive enough that waters may stay above flood stage for several days to a week. These include the Potomac, Susquehanna, and Monocacy Rivers.
Waters in tidal areas often rise and fall much more slowly and predictably, and may be influenced by tidal cycles, extensive low-pressure weather systems, and strong prolonged onshore winds. Although more extensive areas may be flooded, flow is not as strong as nontidal rivers experience, since large gradients do not exist. Erosive forces are not as strong, unless high wave energies are experienced. Tidal flooding affects extensive areas of low relief along the Chesapeake Bay and its tributaries and the back bays behind the Atlantic coast. Flooding along the Atlantic coast and the Chesapeake Bay caused by tropical storms, hurricanes, and northeasters may be very severe with high waves on top of strong tidal surges.
The 100-year floodplain is the one percent chance per year flood area mapped by the Federal Emergency Agency (FEMA). Since this is a probability statement, it should be understood "100-year floods" may occur more frequently than once every 100 years. The 100-year floodplain is the area regulated by local floodplain ordinances adopted by communities that are in the National Flood Insurance Program (NFIP). Technically, only the outer edge of the 100-year floodplain has a 1% risk of flooding. The risk rises for sites closer to the flooding source and at lower elevations. There are areas within the mapped 100-year floodplain that may flood more frequently and to greater depths than others, even though people think of the entire 100-year floodplain as having the same risk. Flood maps and elevations are based on estimates of the 100-year flood discharge, determined by a number of techniques and based on a point in time. Factors such as the size of the watershed, the availability of stream gage records, and the level of detail used in the mapping and the model contribute to the uncertainty of the 100-year discharge estimates. Subsequent changes in land use in the watershed and to the stream channel and its floodplain will contribute further uncertainty. After a flood discharge rate is determined, a hydraulic model computes the elevation of the 100-year flood within an accuracy of 0.5 to 2.0 feet, depending on the accuracy of the topography, frictional losses,

An Assessment of Maryland’s Vulnerability to Flooding Page 14
and hydrology used. Once the elevation of the 100-year flood is determined, it is mapped on a topographical map, which again varies in precision and level of detail.
The accuracy of the 100-year floodplain boundary is influenced most strongly by the quality of the 100-year discharge estimates. The next most significant factor is the quality of the topographic mapping. The Galloway Report estimated that probable nationwide standard error for base flood elevation mapping is 23% of the base flood depth. This value, translated into an average depth, amounts to about 3 feet. Thus, the floodplain line shown on a map is not absolute; structures located within several feet vertically of the 100-year flood elevation may be at risk. In flat areas, structures located within several hundred feet or more horizontally of the 100-year floodplain line also may be at risk.
The standard error is increased by the age of the Flood Insurance Studies (FIS), and the fact that they were based on the existing development at the time of the study. A FIS provides the technical documentation to support flood elevations printed on the Flood Insurance Rate Maps (FIRMs). Any area that has experienced significant watershed and/or floodplain development may experience flooding different from that predicted by the study. In 2004, the average age of FIRMs in Maryland was 19 years, indicating a great need to update the studies and maps. Better technology is available today to more accurately evaluate the risk, and it should be used in updating the older studies.
The 100-year floodplain in Maryland is shown in the figure below. The percent of land area in each county that is floodplain varies from 55.8% in Dorchester County down to 4.6% in Garrett County. However, the percentages do not reflect the seriousness of the flooding problems. Tidal areas have extensive flat areas flooded by shallow waters with little or no current, but may be much more extensive. Riverine areas may have steep gradients where water flows at very high velocities and to greater depths, with extreme erosive forces. Coastal high hazard areas have enough fetch over large water bodies to create waves of 3 feet or more. These different flooding scenarios will result in different flooding problems and damages.

An Assessment of Maryland’s Vulnerability to Flooding Page 15

An Assessment of Maryland’s Vulnerability to Flooding Page 16
Part II. Floodplain Development Structures in the Floodplain
Estimates of the built environment have been made using two methods,
shown in Table 2. One was taken from the Community Assistance Visit (CAV) records, in which communities are asked to estimate the number of structures in their floodplains. County estimates may not be accurate, and in many cases we do not know how they were derived. A few counties were unable to provide any estimates. Another estimate was taken by overlaying the Q3 digital floodplain lines onto parcel information from MDProperty View, which does provide a consistent methodology throughout the state. There are a number of problems with the overlay, namely that the fit is not always good, and we are not sure where the improvements are on the parcel of land. However, we do have concrete data on the types of improvements and more importantly, the value of the improvements. The community estimates were significantly lower than those provided by the overlays. The population estimates were taken from applying the average number of persons per household in each county from 2000 census data to the number of improvements in the floodplain. However, it should be noted that not all the improved structures are residential, so the method would provide an over-estimate of floodplain population. Approximately 30% of flood insurance policies nationally are written for areas outside the 100-year floodplain.
It would seem to be reasonable to average the two results (57,795 +
78,638)/2 to estimate the total number of structures in the floodplain for Maryland, which gives a result of 68,217 structures.
The percent of property in Maryland covered by flood insurance policies is nearly 74%, which is far above the national average of about 30%. The insurance policy count is higher than expected, but is likely to be skewed by the fact that over half the policies in Maryland are in Worcester County, mainly Ocean City. In multiple occupancy units, there may be a number of policies per building. Some policies may cover the building, while others cover the contents of each unit within the building. Thus, one building would have multiple flood insurance policies. If the data from Worcester County is eliminated, the policy coverage drops to 47% statewide. Analysis of the data indicates that the more developed counties with more housing stock also have higher rates of flood insurance coverage, while in some of the rural counties rates may drop below 30%.

An Assessment of Maryland’s Vulnerability to Flooding Page 17
Table 2. Structures and people in floodplains in Maryland
People Structures
County CAV Overlay CAV Overlay
Value of Improvements
(2001)
Flood Insurance Policies (2002)
Percent Policies
Allegany 2420 2973 - 1265 $76,947,040 419 33.1Anne Arundel
10088 16067 3983 6063 $691,534,340 4406 72.7
Baltimore City
6000 4000 1672 1653 $640,920,560 900 54.4
Baltimore 16323 15213 6712 6184 $630,154,881 2962 47.9Calvert 1523 3300 579 1134 $123,665,770 558 49.2Caroline 390 1608 158 609 $46,807,801 185 30.4Carroll 2288 1352 1103 481 $58,158,060 146 30.4Cecil 5096 6179 2210 2280 $171,198,955 823 36.1Charles 1098 1739 1037 608 $76,642,190 275 45.2Dorchester 6550 7264 2750 2761 $237,910,750 1179 38.3Frederick 682 3672 294 1350 $366,260,240 321 23.8Garrett 104 1211 31 475 $41,959,550 139 29.3Harford 1960 4504 741 1656 $184,647,550 608 36.7Howard 1740 2520 956 930 $179,293,170 339 36.5Kent - 2756 4 1183 $110,788,300 445 37.6Montgomery 750 5559 277 2090 $577,218,670 1059 50.7Prince George's
10300 7491 4045 2734 $479,081,120 984 36.0
Queen Anne's
2800 7829 1205 2988 $344,088,796 1878 62.9
Saint Mary's 2705 3411 1105 1254 $109,075,140 592 47.2Somerset 7900 10523 316 4440 $243,355,070 1488 33.5Talbot 5273 4503 2228 1941 $311,748,620 1822 62.9Washington 2900 2221 1051 903 $109,596,840 264 29.2Wicomico - 3003 2 1187 $110,272,270 401 33.8Worcester 17500 74913 6375 32152 $2,068,494,400 28792 89.5
TOTALS 133097* 193813 57795* 78638 $7,989,820,083 50394 64.1 Note * indicates totals data is adjusted by adding the average number of people and structures for the missing counties. Lastly, the value of the improvements on improved land in the 100-year floodplain was calculated from overlays of the floodplain lines on MDProperty View data by county. The total gross value of all the improvements exposed to flooding is close to $8 billion. However, this figure does not reflect the amount of damage that would occur from the 100-year flood. The actual damages would depend on the depth of flooding, the elevation of buildings, presence of

An Assessment of Maryland’s Vulnerability to Flooding Page 18
basement, and other factors, such as erosion, and would be based on depth-damage curves for different building uses.
Structures Subject to Coastal Erosion
In 1994, the Department of Natural Resources estimated that approximately 2,500 structures are subject to long-term erosion. Many of the structures are located on bluffs and are not subject to flooding. The report noted that lack of consistent erosion zone delineations makes it difficult to estimate the number of buildings in Maryland reasonably expected to be subject to coastal erosion over a 30-year period. The estimate is based on the fact that of the 3,700 miles of shoreline of the Chesapeake Bay in Maryland, less than 8%, or 273 miles, is deemed to be eroding at rates of 2 feet/year. The estimate does not include Ocean City because the joint town, state, and Army Corps protection project there is expected to protect structures from 100-year erosive forces. The report estimated that approximately 127,500 buildings are subject to flood damage, which is double the more recent estimate above of 68,217 structures.
Coastal erosion is a natural process; sandy beaches naturally migrate
inland. Structures built on them will be lost over time unless expensive measures are taken to preserve them. Ocean City is built on a barrier island, part of a system of barrier islands that protect the East Coast from the ocean waves. The natural process is for the dunes to retreat as sea level rises or the land subsides. Fenwick Island has migrated an average of 2 feet per year landward. With houses in the way, there is no place for the dunes to migrate. Ocean City is maintained by an expensive process of beach nourishment, or pumping sand from out in the ocean back onto the beach as it is lost. In other areas, retreat is more likely the solution to coastal erosion.
A national report, Evaluation of Erosion Hazards, provides a
comprehensive assessment of coastal erosion and its impact on people and property. The report, prepared by the Heinz Center for Science, Economics and the Environment for FEMA, projects that approximately 25% of homes and other structures within 500 feet of the U.S. coastline will fall victim to the effect of erosion in the next 60 years. Thus, long- term erosion will likely affect areas like Ocean City.
Especially hard hit will be Atlantic and Gulf of Mexico coastlines, which are expected to account for 60% of the losses nationwide. Costs will average half a billion dollars per year, and could be considerably higher if additional development is allowed in high erosion areas, according to the report.
The report recommends that FEMA develop maps identifying coastal
erosion hazard areas and include the cost of expected erosion losses when setting flood insurance rates, based on measured erosion rates. Coastal High

An Assessment of Maryland’s Vulnerability to Flooding Page 19
Hazard Zones would include risk factors for both flood and erosion, with premium surcharges for erosion. In addition, setback standards would be established and communities would be required to impose standards for new development. Under the recommendations, erosion insurance could be provided to bluff areas.
Currently, only Calvert County has any regulations governing setbacks
from the edge of cliffs.
State Buildings in the Floodplain State buildings on state land in the floodplain are not subject to local review, but must submit plans for floodplain review under the State Waterway Construction Permit process. This is supposed to insure that state development will meet at least the minimum requirements of the NFIP. Otherwise, any state development should be submitted for local floodplain review and approval. The local permit should satisfy the requirements of the NFIP.
Based on a 1987 legal opinion regarding flood management review of state projects, it was noted that the state DNR had review authority of flood control measures in state construction projects under Section 8-905 of Natural Resources Article until its repeal in 1984. The new Subtitle 9A Flood Control and Watershed Management replaced it. Section 8-9A-04 (a) provides that DNR "assure that state construction projects meet the requirements of this subtitle". This was interpreted to mean that DNR will assure that state construction projects comply with state flood control law. In other words, plan approval for correct elevation in a floodplain lies within DNR by state law, thus exempting these projects from local review. Therefore, the state review would have to incorporate the minimum NFIP standards, and more stringent local standards would not apply. State permit jurisdiction does not extend into tidal floodplain areas, however. The adequacy of the state project review process was called into question by FEMA in 1990, after permits were issued by the state for construction in the FEMA floodway. The state defended its permit review process, maintaining that in many respects the review exceeds NFIP requirements by requiring an analysis based on ultimate development, that structures be elevated one foot above the 100-year flood elevation, and the "no rise" rule on improved property. The state admitted that their regulations do not explicitly reference the floodway delineated on the FEMA maps. Although no changes were made to the state regulations, a policy was instituted to resolve any floodway issues to be consistent with the NFIP requirements. At the same time, it was noted that state construction within tidal floodplains is guided by policies within each constructing agency. DNR pledged to work with state agencies to put in place clear standards for the tidal floodplains

An Assessment of Maryland’s Vulnerability to Flooding Page 20
comparable to the nontidal floodplain requirements. The two largest construction agencies, the Department of General Services and the State Highway Administration have worked to assure that that their projects either avoid the floodplain or are consistent with NFIP requirements. Other agencies have volunteered to send plans for floodplain review. Often plans are submitted to local jurisdictions for review, as well. Any projects receiving federal funding must comply with Executive Order 11988, issued in May 1977. It charged federal agencies to assert leadership in reducing flood losses by avoiding actions located in or adversely affecting floodplains, unless there is no practicable alternative, or to mitigate losses if avoidance is not practicable. Guidelines were established in an eight step review process: (1) determine if proposed action is in floodplain, (2) provide public review, (3) identify and evaluate alternatives to floodplain, (4) identify impacts, (5) minimize threats to life and property and preserve and restore natural and beneficial floodplain values, (6) reevaluate alternatives, (7) issue findings, and (8) implement the action. Federal actions that increase annual losses from floods or adversely affect floodplains are contrary to EO 11988 and should not be funded or undertaken. If a practicable alternative exists outside the floodplain, the proposed action must not be located in the 100-year floodplain (or 500-year floodplain for critical actions.) In 1990, a project was undertaken by Water Resources Administration, DNR to inventory all state owned structures in the 100-year floodplain. This was undertaken in conjunction with the General Services Administration to assure that state buildings were adequately insured and if any mitigation measures might be employed to protect them. The resulting database is shown in Appendix C. Where possible, elevations of the lowest floor or entry point of floodwaters were obtained and compared to the 100-year water surface elevations. State Schools Subject to Flooding Out of approximately 1,200 public schools in Maryland, only a few are in the floodplain. In 1985, the Oldtown School in Allegany County received extensive damage when high discharges from the South Branch of the Potomac River created a blockage which caused the main stem of the Potomac to back up rapidly and flood the school with approximately 8 feet of water, along with several homes in Oldtown. As a result of negotiations with FEMA, this school was the only presidentially declared disaster for a single building in FEMA history. The state agreed to develop a plan to assess the flood risk of all public schools in the state and the procedure by which local school boards select future school sites. The plan developed guidelines to insure adequate identification of floodplains and wetlands in the school site selection process. The NFIP State Coordinator must comment on the proposed school sites prior to the commitment of funding.

An Assessment of Maryland’s Vulnerability to Flooding Page 21
The effort also identified schools in the state subject to flooding. Of those identified, 7 were considered to have flood risks from moderate to severe, and 6 others to be marginally affected. A few only had athletic fields or access routes subject to flooding. The three that have the most severe flood risk are the Oldtown School, the Westernport School, and the Flintstone School (situated less than 5 feet from the eroding stream bank of Flintstone Creek). A plan to move vital records to the second floor for permanent storage and to move damageable equipment to the second floor if floods threaten was developed for the Oldtown School. The warning and response plan included an inward opening door to escape a flood (since the last adults to leave had difficulty getting the outward opening doors to open). Fire codes require all doors to open outward, which could constitute a hazard during flooding. The Westernport School received a state grant of $100,000 to floodproof the lower level, which included flood shields over the windows and doors. However, the school received significant damage in the September 1996, flood, even though the shields were in place, since the seals on the closures had not been maintained. The rubber gaskets exposed to sunlight will deteriorate and must be replaced periodically. A plan to place gabion protection along the eroding stream bank at Flintstone School was never implemented.
The Cross County Elementary School in Baltimore underwent extensive renovations and incorporated much flood protection into the design. Other schools may have had renovations to reduce the potential flood damages and risks because of the increased awareness. No known new schools have been built in the floodplain since the procedures were implemented. Table 3 lists the schools in Maryland that are known to be subject to flooding by being in the 100-year floodplain or have flooded in the past. Other Critical Services and Local Public Buildings Subject to Flooding
Maryland Emergency Management Agency (MEMA) has prepared the Maryland Hazard Mitigation Plan. This plan includes data on state and local buildings in the 100-year floodplain, including hospitals, fire, police, and other local critical services. The plan can be accessed on the MEMA website at www.mema.state.md.us/programs/mitigation. The data have been georeferenced and located on maps by county. Chapters 8, 9, and 10 are devoted to flooding from flash and riverine flooding, coastal storms, and dam failure respectively. Building values were estimated from MDProperty View and contents from the agency occupying the building to determine total exposure.

An Assessment of Maryland’s Vulnerability to Flooding Page 22
Table 3. Schools subject to flooding
County School Comments Allegany Westernport
Elementary First floor floodproofed in 1990. Damage in Sept. 1996. History of frequent flooding -Potomac River
Oldtown School Extensive damage 11/85 - Potomac River Flintstone School Close to Flintstone Creek. Has flooded. Northeast Elementary Dry Run Tributary Bel Air Elementary Riverine - Unnamed tributary of Potomac Baltimore City Beechfield Elementary
#246 Riverine - Maidens Choice. History of frequent flooding
Cross Country Elementary 247
Riverine - Western Run
Baltimore Co. Southeastern Tech Tidal flooding- Peach Orchard Cr. Dorchester South Dorchester K-8 Tidal flooding Garrett Friendsville
Elementary Riverine - Youghiogheny River
Harford Havre de Grace Elementary
Riverine - Lilly Run
Kent Rock Hall Middle Fringe of tidal Prince George’s
Paint Branch Elementary
Riverine - Paint Branch
Forest Heights Elementary
Riverine - Oxen Run
Somerset Tylerton School Tidal flooding Ewell Elementary Tidal flooding Crisfield Elementary Tidal flooding
MEMA is working with Towson University to develop the Emergency Management Mapping Application (EMMA) to enable the emergency management community to access and display relevant and real-time information on a map before, during, and after an incident occurs. Built using ESRI's ArcIMS software, EMMA is a secure, content and tool-rich, Web-based GIS application that enables the emergency responders to identify incident locations from the field, generate location-specific reports, visualize incident locations via a map, perform site-specific analysis, and coordinate response efforts. Using a simple Web browser, such as Internet Explorer, EMMA provides basic and advanced tools for map visualization, location analysis, and report generation.

An Assessment of Maryland’s Vulnerability to Flooding Page 23
Part III. Modeled Vulnerability Estimates
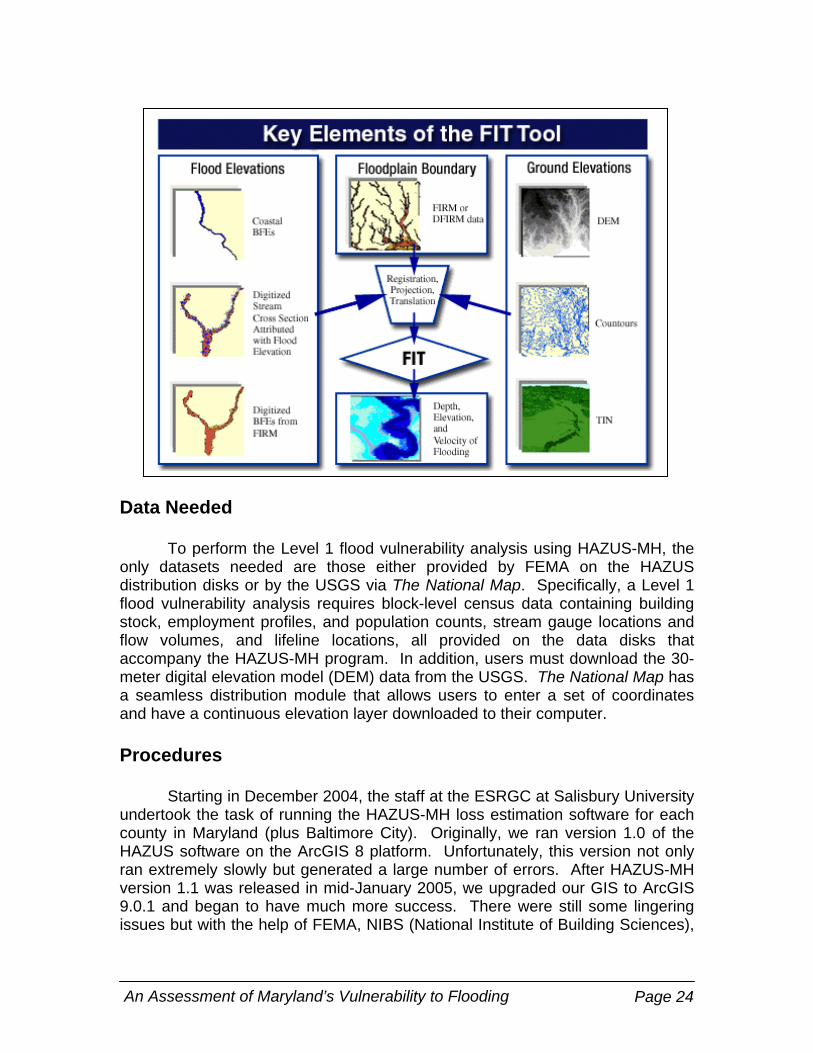
In order to provide a systematic examination of the vulnerability of Maryland’s built environment to riverine and coastal flooding, the Eastern Shore Regional GIS Cooperative (ESRGC) at Salisbury University was asked to undertake a vulnerability modeling effort. Using FEMA’s HAZUS-MH hazard vulnerability analysis modeling software (see below), the ESRGC sought to generate maps and tables of Maryland’s potential for loss related to buildings from flooding on a county-by-county basis. This potential for loss, or the degree of vulnerability, was measured using four different factors: amount of county land area in susceptible to a 100-year flood, the amount of square footage of buildings potentially damaged, the number of buildings potential damaged, and the amount of direct economic losses related to buildings. These four measures of loss help give a more complete picture of the very complex issue of vulnerability to floods. Software FEMA developed a hazard vulnerability analysis software package, HAZUS-MH, which can be used to estimate the potential losses from earthquakes, wind, and floods. There are three levels of analysis that can be performed for floods. Level 1 is the most basic level of analysis. Supplied datasets can be used for this type of analysis. A Level 2 analysis is a slightly more detailed analysis that requires more accurate building information. Finally, a Level 3 analysis is the most detailed level of analysis. To do the flood analysis, FEMA developed software components to support HAZUS-MH. The Flood Information Tool (FIT) was designed to support the integration of local data. InCAST is a building inventory tool that allows the user to prepare building information for entry into HAZUS. The Building Information Tool (BIT) was developed to take large databases and extract information needed for HAZUS. For example, MDProperty View information could be imported for use in HAZUS using the BIT.
An Assessment of Maryland’s Vulnerability to Flooding Page 24
Data Needed To perform the Level 1 flood vulnerability analysis using HAZUS-MH, the only datasets needed are those either provided by FEMA on the HAZUS distribution disks or by the USGS via The National Map. Specifically, a Level 1 flood vulnerability analysis requires block-level census data containing building stock, employment profiles, and population counts, stream gauge locations and flow volumes, and lifeline locations, all provided on the data disks that accompany the HAZUS-MH program. In addition, users must download the 30-meter digital elevation model (DEM) data from the USGS. The National Map has a seamless distribution module that allows users to enter a set of coordinates and have a continuous elevation layer downloaded to their computer. Procedures Starting in December 2004, the staff at the ESRGC at Salisbury University undertook the task of running the HAZUS-MH loss estimation software for each county in Maryland (plus Baltimore City). Originally, we ran version 1.0 of the HAZUS software on the ArcGIS 8 platform. Unfortunately, this version not only ran extremely slowly but generated a large number of errors. After HAZUS-MH version 1.1 was released in mid-January 2005, we upgraded our GIS to ArcGIS 9.0.1 and began to have much more success. There were still some lingering issues but with the help of FEMA, NIBS (National Institute of Building Sciences),

An Assessment of Maryland’s Vulnerability to Flooding Page 25
and ABS Consulting (the author of the software), we were able to solve almost all of them. The first step of a vulnerability model run is to create a new study area, which involves choosing the correct hazard (flood), state, and county from a series of dialog boxes. Only a county level analysis is available when examining a flood hazard; this is not the case with other hazards. Once a county study area has been created, we open it and launch HAZUS-MH. Once in HAZUS-MH, the first step is to determine if a county should be examined for riverine flooding vulnerability, coastal flooding vulnerability, or both. In Maryland, nine counties (Allegany, Caroline, Carroll, Frederick, Garrett, Howard, Montgomery, Prince George’s, & Washington) are subject to riverine flooding only. The other 14 (plus Baltimore City) are subject to both coastal and riverine flooding. Next, the extent of the digital elevation model (DEM) for the study area needed to be determined, and the dataset downloaded. We used the coordinates generated by HAZUS-MH as the minimum bounding rectangle to select the DEM from The National Map at seamless.usgs.gov. This selected DEM then downloaded automatically as a ZIP file, which was uncompressed in the working directory of the study area and HAZUS-MH was pointed to its location. The third step is one of the more crucial decisions in the execution of the vulnerability model – the selection of an appropriate minimum stream drainage area size (in square miles). The minimum stream drainage area size essentially functions as a “resolution” setting in the model. The potential range of area size runs from 0.25 sq miles (local scale) to 400 sq miles (regional scale). As with any resolution, the trade-off is size versus detail. A small stream drainage area size will encompass many small streams and creeks and examine them for their flooding potential. However, it is easy to overwhelm the software with too much detail, making a model run difficult to finish. On the other hand, choosing a large stream drainage area size ensures the model will finish easily, as there may be only a few drainage areas that meet the size criteria. Unfortunately if the area size is too large, many important streams reaches may be omitted, thus under-reporting the level of vulnerability. Our strategy to select the minimum stream drainage area size was to choose the smallest possible size without creating an overwhelming number of reaches. Through empirical testing, we found that a reasonable number of reaches was between 60 and 80 total reaches. For most of the counties in Maryland, this yielded a minimum drainage basin size of around 4 to 6 square miles. They ranged, however, from 1 square mile in Baltimore City to 10 square miles in Frederick County. In our limited experimentation, we found that dropping the minimum stream drainage area below 4 square miles for a county of

An Assessment of Maryland’s Vulnerability to Flooding Page 26
“average” size created many more very small reaches without having a large impact on vulnerability results. The fourth step of a HAZUS-MH model run is the creation of a study case. Within a given study area (like a county), one can have multiple study cases, each examining different drainage basins, municipalities, or some other pertinent subdivision. For this analysis, we created one study case per county that contained all of the river reaches and coastline segments (if appropriate) available. This study case would contain all of the results for a given county, and yield vulnerability maps of the county as a whole. Subsequently, we completed the hydrologic analysis for all of the river reaches in the study area. This process is more completely outlined in the HAZUS-MH Flood Model Technical Manual, included with the HAZUS-MH software release. The major steps involve automatically delineating the drainage area for each stream reach, determining the stream gauges that are either upstream or downstream of each reach, and finally calculation the flow volume for the entire set of stream reaches in the study case. Sixth, in order to correctly calculate the extent of the 100-year coastal flood hazard zone, we characterized the shoreline in each county that fronts either the Chesapeake Bay or the Atlantic Ocean. Characterization of the shoreline involves picking the type of coast and the flooding characteristics for each coastline segment. The type of coast consists of both the degree of wave exposure (from sheltered to full exposure) and the shoreline morphology (from rocky to small dunes to large dunes to flood protection structure). The flooding characteristics involve recording the 10-year, 50-year, 100-year, and 500-year flood height, plus any wave heights (if available). This data was taken from the most recent flood study completed for each Maryland subdivision. Next, we calculated the extent and degree of the 100-year flood hazard. The calculation of the riverine and coastal flood hazard are accomplished in separate processes. For the riverine flood hazard, a hydraulics analysis is completed, the details of which are best explained by the HAZUS-MH Flood Model Technical Manual. To summarize the important methodological steps of the riverine hydraulics analysis: the model approximates the floodplain associated with a stream reach, finds the upstream and downstream limits of that approximated floodplain, generates a set of cross-sections, and associates those cross-sections with flood elevations and discharge values.
The process to assess the coastal flood hazard depth and extent is
different than the riverine case but similar to the approach used by FEMA to determine coastal flood zones. The two generalized steps are drawing transects perpendicular to the shoreline and running one or more of three FEMA models (dune/bluff erosion, wave height, and wave run-up) to calculate flood depths and extents. The decision of which models are to be run is a function of the shoreline

An Assessment of Maryland’s Vulnerability to Flooding Page 27
characteristics and the wave conditions. The result of both the coastal and the riverine flood hazard determination is two flood depth grids for a particular recurrence interval that can be used to intersect the demographic data to estimate loss. When examining both coastal and riverine flooding in the same county, the model picks the “predominant” flooding mechanism and its associated flood depth when intersecting the flood zone with the demographic data. Eighth, we ran five different analyses of the potential flood vulnerability namely count of damaged buildings by type, count of damaged buildings by occupancy, amount of building damage (in square feet) by type, amount of building data by occupancy, and the amount of direct economic losses from damage to buildings (in dollars). These analyses intersect the census block data with the flood depth information to create an estimate of amount and degree of damage to buildings as well as the resulting potential economic losses. These analyses suffer from similar caveats as any polygon interpolation process. Certainly, any analysis will be dependent on good quality input data. In HAZUS-MH, the quality of input census data is not known but is probably similar to the US Bureau of the Census itself. More importantly however, the location of buildings within a census block is not known. Therefore, any block that is not completely contained in the flood zone must be assumed to have its characteristics evenly distributed throughout it – often an incorrect assumption. What follows is a summary of those analysis results, examining the extent of the flooding vulnerability in the state of Maryland on a county-by-county basis. For a more detailed discussion of a given county’s results, please see Appendix B (downloadable from www.esrgc.org). For even more detail, the actual HAZUS-MH scenario model may also be downloaded from the same site. Flooding Scenarios and Damage Estimates
Completion of the HAZUS-MH vulnerability scenario modeling for every county (and Baltimore City) in Maryland yielded a picture of varying degrees of vulnerability to flooding throughout the state. Regarding the physical nature of the flood zone, over 1,328 square miles of the state fall within the 100-year flood zone (Table 4). In other words, 13.4% of the land area of the state is vulnerable to a 100-year flood event. The county with the largest flood zone according to HAZUS-MH is Dorchester (353.1 sq miles) while the county/city with the smallest flood zone is Baltimore City (5.2 sq miles). As a percentage of the overall area of the county, the largest flood zone area is also Dorchester County with 61% of the county defined as 100-year flood zone. Only one other county has more than half of its total area in the 100-year flood zone (Somerset) but several other counties, such as Worcester, Wicomico, Montgomery, and Talbot counties have significant (more than 15% of total area) expanses of flood zone.

An Assessment of Maryland’s Vulnerability to Flooding Page 28
Table 4. Flood zone area versus total area of a subdivision in square miles
County Flood Zone
Area (sq mi)
Total Area (sq mi)
% of Total
Allegany 17.76 430.54 4.1% Anne Arundel 42.12 417.98 10.1% Baltimore City 5.19 81.03 6.4% Baltimore 41.56 607.67 6.8% Calvert 13.73 216.87 6.3% Caroline 14.96 324.24 4.6% Carroll 20.30 452.37 4.5% Cecil 25.00 355.31 7.0% Charles 36.64 461.55 7.9% Dorchester 353.10 578.54 61.0% Frederick 41.02 667.50 6.1% Garrett 19.09 657.56 2.9% Harford 47.13 445.05 10.6% Howard 13.74 253.51 5.4% Kent 17.51 281.66 6.2% Montgomery 84.86 507.19 16.7% Prince George's 33.05 487.87 6.8% Queen Anne's 23.86 374.12 6.4% Somerset 191.14 329.42 58.0% St. Mary's 28.07 363.84 7.7% Talbot 43.87 270.98 16.2% Washington 42.98 467.85 9.2% Wicomico 63.56 380.52 16.7% Worcester 108.11 476.39 22.7% TOTAL 1,328.35 9,889.57 13.4%
Of course, the size of the flood zone is but one measure of vulnerability.
As it is the intersection of the potential hazard and the social system that creates the potential for loss, a more accurate method for expressing the level of vulnerability is to report the potential damage from a 100-year flood event. One such measure is the amount of square feet of damage to buildings in the event of a 100-year flood. The results of the HAZUS-MH modeling effort reveal that 109,665,000 square feet of Maryland building stock will be potentially damaged in the event of a 100-year flood (Table 5). As one can see from the table and the resulting map (Map 1), Worcester County has the most building stock in harm’s way with over 21 million square feet or 19.4% of the total for the state. The other subdivisions that are the most vulnerable with regard to buildings are Anne Arundel, Prince George’s, Baltimore, and Baltimore City. Those subdivisions that are least vulnerable are Carroll, Caroline, Kent, and Garrett. Another important statistic to notice from Table 5 is the ratio of substantial damage to total damaged. For instance, Somerset County’s overall amount of building damage is moderately high (6th in the state) but 68% of the damage is predicted to be

An Assessment of Maryland’s Vulnerability to Flooding Page 29
“substantial” (more than 50% damaged). Other counties with a large amount of potential substantial damage are Dorchester, Washington, St. Mary’s and Calvert.
As we break down the total square feet of potential building damage by
county into different categories of occupancy, a clearer picture of the dimensions of the flood vulnerability emerges (Table 6). First, of the occupancy categories tracked by HAZUS-MH (agricultural, commercial, educational, governmental, industrial, religious/non-profit, and residential), only commercial, governmental, industrial, and residential categories garnered more that 0.5% of the overall total damage. The others are insignificant in terms of either their exposure to the 100-year flood zone or in their distribution generally. Next, one will quickly realize that the majority of damage to buildings in the state of Maryland will be to residential buildings. In fact, about 86% of all the potential damage from the 100-year flood comes from residential buildings. Spatially, the residential damage pattern looks similar to the total damage (Map 2). Looking at other categories yields somewhat different results. For example, the distribution of governmental building damage (Map 3) shows the importance of the public service sector in Prince George’s County. The distribution of commercial building damage (Map 4) shows Baltimore City more vulnerable. Actually, Cecil, Allegany, Frederick, and Garrett counties and Baltimore City have the distinction of having less than 80% of their damage amount coming from residential impacts. Finally, mapping the damage to industrial buildings shows Anne Arundel, Prince George’s, Washington, and Baltimore City as the location of many vulnerable industrial areas (Map 5).
One can also break down the potential building damage by the type of
building construction. While construction types are much more widespread than occupancy categories, wood (62%) and masonry (28%) dominate steel (7%) and concrete (3%) (Table 7). In general when these patterns are mapped (Maps 6, 7, 8, and 9), the overall distribution of vulnerability remains the same with certain jurisdictions showing different anomalies. Examples are Baltimore City having more exposure with steel buildings than its neighbors (Map 8) but relatively less wood buildings in the floodplain (Map 9).

An Assessment of Maryland’s Vulnerability to Flooding Page 30

An Assessment of Maryland’s Vulnerability to Flooding Page 31

An Assessment of Maryland’s Vulnerability to Flooding Page 32

An Assessment of Maryland’s Vulnerability to Flooding Page 33

An Assessment of Maryland’s Vulnerability to Flooding Page 34

An Assessment of Maryland’s Vulnerability to Flooding Page 35

An Assessment of Maryland’s Vulnerability to Flooding Page 36

An Assessment of Maryland’s Vulnerability to Flooding Page 37

An Assessment of Maryland’s Vulnerability to Flooding Page 38

An Assessment of Maryland’s Vulnerability to Flooding Page 39

An Assessment of Maryland’s Vulnerability to Flooding Page 40

An Assessment of Maryland’s Vulnerability to Flooding Page 41

An Assessment of Maryland’s Vulnerability to Flooding Page 42
If one examines the level of vulnerability using the number of buildings
potentially damaged by a 100-year flood, rather than the amount of damaged square feet, the pattern is similar but more evenly distributed (Table 8). The county with the most buildings damaged is Anne Arundel, followed by Worcester, Baltimore, Prince George’s, and Washington (Map 10). However, only Anne Arundel and Worcester made up more than 10% of the state’s total number of buildings damaged (44,755). Again, several counties had a large number of buildings vulnerable to substantial damage including Somerset (72%), Dorchester, St. Mary’s, and Calvert.
Once we break down the total number of buildings damaged into their
occupancy categories, we were surprised to learn that only the residential category accounted for more than 0.5% of the total number of buildings (Table 9). Thus, agricultural, commercial, governmental, industrial, and religious/non-profit buildings each represented less than 0.5% of the total. This shows much more about the uncertainty of the HAZUS-MH model results than it does the profile of Maryland’s vulnerability. Because the “number of buildings” calculations are subject to significant rounding errors (i.e. trying to avoid having 0.524 of a building), the model will generate thousands of square feet of damage (see Table 6 above) but no “whole” buildings to count. For what it’s worth, the map (Map 11) of residential building counts shows a very similar pattern to the map of the total number of damaged building map (Map 10). This should be expected as residential buildings make up 99.5% of the total building count.
Separating the building counts into their construction type yields yet more
insight into the distribution of building vulnerability to the 100-year flood in Maryland (Table 10). Although only the masonry and wood constructions types had results that were more than 0.5% of the total (28% and 72% respectively), the maps (Maps 12 and 13) show that construction techniques in the floodplain do vary around the state. One is much more likely to find a masonry house in the flood zone in the Midstate than on the Eastern Shore, for example (Map 12). Wood construction accounts for vulnerable buildings throughout the state (Map 13).

An Assessment of Maryland’s Vulnerability to Flooding Page 43

An Assessment of Maryland’s Vulnerability to Flooding Page 44

An Assessment of Maryland’s Vulnerability to Flooding Page 45
Table 9. Building damage by occupancy category in numbers of buildings. Only categories representing more that 0.5% of the total damage are reported.
Residential All County Substantial Total Substantial Total
% Substantial
% of Total
Allegany 8 727 8 731 1.1% 1.6%Anne Arundel 606 7,013 606 7,038 8.6% 15.7%Baltimore City 194 2,352 200 2,384 8.4% 5.3%Baltimore 315 3,993 315 3,999 7.9% 8.9%Calvert 181 1,008 181 1,008 18.0% 2.3%Caroline 10 105 10 105 9.5% 0.2%Carroll 1 138 1 138 0.7% 0.3%Cecil 4 558 4 561 0.7% 1.3%Charles 17 531 17 533 3.2% 1.2%Dorchester 424 1,247 424 1,247 34.0% 2.8%Frederick 106 2,181 106 2,191 4.8% 4.9%Garrett 35 276 35 276 12.7% 0.6%Harford 35 1,622 35 1,631 2.1% 3.6%Howard 0 1,628 0 1,633 0.0% 3.6%Kent 13 146 13 146 8.9% 0.3%Montgomery 40 2,184 40 2,189 1.8% 4.9%Prince George's 146 3,810 146 3,855 3.8% 8.6%Queen Anne's 14 647 14 647 2.2% 1.4%Somerset 1,944 2,678 1,946 2,680 72.6% 6.0%St. Mary's 158 781 158 781 20.2% 1.7%Talbot 61 869 61 869 7.0% 1.9%Washington 454 3,606 457 3,623 12.6% 8.1%Wicomico 42 438 42 438 9.6% 1.0%Worcester 593 6,007 593 6,052 9.8% 13.5%TOTAL 5,401 44,545 5,412 44,755 12.1% 100.0%

An Assessment of Maryland’s Vulnerability to Flooding Page 46

An Assessment of Maryland’s Vulnerability to Flooding Page 47

An Assessment of Maryland’s Vulnerability to Flooding Page 48

An Assessment of Maryland’s Vulnerability to Flooding Page 49

An Assessment of Maryland’s Vulnerability to Flooding Page 50
Finally, one can characterize the level of vulnerability from coastal and riverine flooding in Maryland using the amount of direct economic losses related to buildings (Table 11). This measure includes monetary losses from the buildings themselves (structural damage, contents damage, and inventory loss) as well as monetary losses from the use or disuse of those buildings (losses related to relocation, capital, wages, and rental income). The result of the HAZUS-MH model for all the subdivisions in Maryland shows that $8.12 billion is vulnerable to loss from a 100-year flood. Even more notable is that just 3 counties (Prince George’s – $1.28B, Worcester – $1.03B, Anne Arundel – $0.92B) account for almost 40% of the total direct economic losses related to buildings. Examining Table 11, one can see that while all have significant losses, their components are different. In Prince George’s County, a large number of commuters to Washington, DC would be displaced in the event of a major flood, causing significant wage losses. On the other hand, nearly half of Worcester County’s loss stems from structural damage to the buildings themselves. Finally, examination of the map (Map 14) shows that the middle portion of the state has somewhat higher potential for economic loss in the event of a 100-year flood than either Western Maryland (except Washington), Southern Maryland, or the Eastern Shore (except Worcester).
The summation of the results of the HAZUS-MH flood vulnerability
modeling effort is only one part of the story and generalizes a very complex interplay between natural system and sociodemographic structure. Included in Appendix A is the 100-year flood zone and direct economic losses by block for each subdivision in the state of Maryland. Through these 48 maps, one can not only examine the potential impact of flood waters on large swaths of the land surface around the Chesapeake Bay and the Atlantic Ocean (i.e. Dorchester County, Map A19 and Somerset County, Map A37) but also the unfortunate location of increasing levels of development in flood-prone areas like Anne Arundel (Map A4), Queen Anne’s (Map A36), and Worcester Counties (Map A48). Indeed, the spread of our urban areas into suburban counties (Baltimore County, Map A8; Montgomery County, Map A32; and Prince George’s County, Map A34) brings the potential damage to structures, contents, and livelihoods to existing flood zones. Some solace may be taken in that many of the counties on the Eastern Shore with extensive 100-year flood zones have not yet significantly developed, leaving the door open to structural mitigation techniques (i.e. elevated foundations).

An Assessment of Maryland’s Vulnerability to Flooding Page 51

An Assessment of Maryland’s Vulnerability to Flooding Page 52

An Assessment of Maryland’s Vulnerability to Flooding Page 53
Accuracy of Data
The accuracy of this study and its results are a major concern. The source of concern about the accuracy of the results is threefold: the HAZUS-MH modeling software, the underlying processing assumptions and the underlying data. First, the path to completing this study was fraught with significant, often fatal errors within HAZUS-MH. Although the authors and distributors of the software were most gracious in their attempt to fix all of the major errors we encountered, it is only reasonable to assume that other non-fatal (and therefore undetected) errors have occurred within the program’s algorithms. Just looking at some of the specific results such as Talbot County’s maximum flood depth being almost 70 feet when the highest elevation found in the county is only 77 feet (Map A41) or the general results regarding numbers of damaged buildings versus the amount of damaged square feet of buildings are enough to give one pause.
Second, some of the underlying processing assumptions are worrisome.
For example, because of a lack of high-quality network of stream gauges in many parts of Maryland, often the hydrologic profile for a stream reach is being interpolated from one stream gauge, perhaps not even on the reach being modeled. While this may work, there has not been enough independent field research to conclude that the method is consistently accurate.
Third, one has to assume the data underlying the analysis is error-free in
order to conclude the results are accurate. One can almost guarantee that the data input to the model, particularly those collected as part of huge national data collection efforts, are not error-free. One can actually see this in some of the flood zone maps (i.e. Montgomery County, Map A31), where the model is creating a very deep flooded area along a river. This is almost assuredly the underlying DEM including the height of a bridge over the river as the actual land surface height, thus creating a “dam” where none exists. Census block data, for all the valiant efforts of the US Bureau of the Census, contains some errors in their raw counts. Unfortunately, it is very difficult to determine the location and significance of these errors, particularly when examining the output of a complex modeling process like that used in HAZUS-MH. Improving Accuracy with Local Data
The potential exists, however, to significantly increase the accuracy and the precision of this research. This study completed a HAZUS-MH Level 1 Analysis of the 100-year flood vulnerability in the state of Maryland, meaning that only existing and available national datasets were used to calculate results. This manifests itself most significantly in the use of a digital elevation model with 30-meter cells and generalized census block enumerations. HAZUS-MH has the ability to dig much deeper and generate much more accurate and precise vulnerability calculations using local datasets. For example, using the highly-

An Assessment of Maryland’s Vulnerability to Flooding Page 54
precise and highly-accurate LiDAR (Light Detection And Ranging) elevation data should generate much more accurate stream reaches and stream profiles. Using information on assessed taxable properties from the Maryland Department of Planning and the Maryland Department of Taxation and Assessment rather than generic building information should refine the results considerably.
There are some caveats, however, when considering the use of local data.
First, not all types of data (like LiDAR elevations) are available throughout the state, making statewide comparisons difficult. Second, as one increases the resolution of the data, the size of the data balloons. Using LiDAR as an example, the 2-meter DEM of Somerset County alone is over 1.2 GB in size. This will considerably increase the amount of time it takes to run a simulation. Third, local data may not be in an appropriate form. The MDP/MDAT assessed property locations are stored as property centroids. It is probable that many properties would be considered out of the floodplain because the centroid does not fall within the flood polygon, yet a majority of the property may indeed fall within the hazard zone.
All of this points to the use of a HAZUS-MH Level 2 Analysis (using local
data) as a refinement of the initial Level 1 analysis. For example, Ocean City, Maryland is a well-known, national example of the potential folly of building a major tourist destination on a mobile barrier island. Despite tremendous efforts at the federal, state, and local level, the Level 1 analysis suggests that much of Ocean City is still vulnerable to a 100-year flood (Map A47). These results beg for further exploration with a more accurate and precise Level 2 Analysis to further refine the exact location and characteristics of Ocean City’s flooding vulnerability
An Assessment of Maryland’s Vulnerability to Flooding Page 55
Part IV. Mitigation Strategies Regulations Neither state nor federal regulations preclude development in the 100-year floodplain. The minimum NFIP requirements address how to build in the floodplain to prevent damage to structures, but not that structures should not be placed in the floodplain. Performance standards allow use of land while minimizing hazards to human life and property damage. The minimum requirements would allow a building in the floodway, if it did not increase flood heights. Floodplains of waters that flow downhill under gravity are regulated by both the state and local jurisdictions. The state's program focuses on engineering analysis to show that new floodplain development will not increase hazards on existing improved property. State jurisdiction does not extend into tidal floodplains. However, flood maps depict the source of flooding, and a number of areas that are normally considered tidal would be overwhelmed by riverine flooding during the 100-year flood, and would come under state jurisdiction. In tidal areas, only the local permit, issued under the local floodplain management ordinance, is required. An excellent source of information for construction in the coastal V Zone is FEMA 55: Coastal Construction Manual, which was revised June, 2000. In the body of this technical document are the regulations for the proper techniques for building in the Coastal V Zone. It is advisable to use the techniques in this manual for construction in A-zones subject to wave action, as well. Maryland Model Floodplain Management Ordinance
The Maryland Model Floodplain Management Ordinance, adopted by most local jurisdictions in the NFIP, is more restrictive than the minimum NFIP regulations. The ordinance clearly states that new buildings and fill are not to be permitted in floodways. Any floodway development must receive a Conditional Letter of Map Revision (CLOMR) from FEMA and meet the following conditions:
(1) no reasonable alternative must exist outside the floodway, (2) encroachment into the floodway in the minimum necessary, (3) the development will be able to withstand the 100-year flood with minimal damage, and (4) the development will not increase downstream or upstream flooding or erosion. The amount of fill allowed in the floodplain is limited to 600 cubic yards per
lot to discourage disruption of drainage patterns and diversion of runoff onto neighboring properties, since issuance of the local permit may not increase flooding onto neighboring properties.

An Assessment of Maryland’s Vulnerability to Flooding Page 56
Subdivision regulations in the Model Ordinance prohibit the subdivision of new lots in nontidal floodplains unless a building pad outside the floodplain can be identified for each lot. In tidal floodplains, the subdivision plan must show that the higher land is considered for development before floodplain lots may be considered. High priority should be given to clustering development out of the floodplain. Floodplains should be reserved as natural areas in the open space requirements for subdivisions, if at all possible. Preserving floodplains as natural areas preserves the natural beneficial functions they provide and has high amenity value to the community. It is important to note that structures built in the floodplain are not only subject to damage from flooding, but development in the floodplain reduces flood storage capacity, increasing flood heights, and increasing downstream flooding.
One of the most important, but least used, provisions in the Model
Ordinance is the "Avoidance and Minimization” clause which directs local permitting officials to work with applicants to move a proposed structure out of the floodplain, if possible. If it must be in the floodplain, then the impacts to the floodplain should be minimized.
In Coastal High Hazard Areas (V-zones) the Model Ordinance requires an
alternatives analysis that requires the applicant to demonstrate that: (1) no reasonable alternative exists outside the V-zone, (2) the encroachment on the V-zone is the minimum necessary, (3) the development will withstand the 100-year wind and water loads
without damage, (4) the development will not create an additional hazard to existing
structures, and (5) any natural dune system will not be disturbed.
Existing buildings in V-zones shall not be substantially improved or
expanded horizontally or vertically unless the entire foundation system is certified by a professional engineer or architect as being capable of supporting the existing building and the proposed improvement during the 100-year storm. There is a requirement to track cumulative improvements, so that this provision will be implemented.
The state model incorporates a one-foot freeboard requirement on new
buildings. This is consistent with the state permit requirement in nontidal areas. In tidal areas, communities may wish to consider a greater freeboard requirement on new construction in light of sea level rise projections of approximately three feet over the next century. Implementing a greater freeboard requirement now will avert much more costly mitigation in the future to save structures that will be flooded more frequently than present.

An Assessment of Maryland’s Vulnerability to Flooding Page 57
Some local regulations are more restrictive than others concerning floodplain development. For example, Anne Arundel, Baltimore, Caroline, Carroll, Frederick, Harford, Howard, Montgomery, and Prince George's Counties do not allow new buildings in their nontidal floodplains. A few communities prohibit any new development in the floodplain, such as Fruitland and Chesapeake City. Some communities have adopted greater freeboard requirements, such as Ocean City and Carroll County. On the other hand, some communities have failed to adopt any freeboard requirement, including Dorchester, Somerset, and Worcester Counties. Local Mitigation Planning Until recently, local mitigation planning efforts had been in response to requirements for both federal and state funding, and were used to justify a project for which the local jurisdiction was seeking funding. A comprehensive plan of how the county intended to make itself resistant to flooding was not a likely result. However, FEMA has been evolving toward adopting a comprehensive planning requirement as a requirement for federal funding, first under the Flood Mitigation Assistance Program, now for the Hazard Mitigation Grant Program and for new pre-disaster mitigation programs.
MDE and MEMA sponsored a workshop on October 6, 1999, to begin the process of local planning to mitigate all hazards to which the local jurisdiction may be subject. Planners, Emergency Managers, and NFIP Coordinators attended and were encouraged to work together to develop and implement all hazard plans for their county. The Maryland Hazard Mitigation Manual was presented to participating counties, which closely parallels North Carolina's recent effort, with their permission. Maryland and North Carolina both experience similar hazards, and North Carolina was ahead of Maryland in mitigation planning. The Manual describes how to develop a plan and gives a number of tools and techniques for mitigating natural hazards.
MEMA published the Maryland Hazard Analysis in January 2000, which
outlined potential hazards, vulnerabilities and risks for each county in the state, based on frequency and severity of the hazard. From this, a relative risk was derived for 15 different hazards. The hazards that were assigned the highest risk potential for Maryland are:
(1) flash or riverine flooding, (2) hurricane and tropical cyclone, (3) winter weather, and (4) fire and explosion. The Disaster Mitigation Act, passed by Congress in 2000, amended the
Robert T. Stafford Disaster Relief and Emergency Assistance Act by adding a

An Assessment of Maryland’s Vulnerability to Flooding Page 58
mitigation planning requirement. It requires local governments to develop and submit compliant mitigation plans as a condition of receiving Hazard Mitigation Grant Program (HMGP) project grants after a disaster declaration. Prior to this, only Flood Mitigation Assistance project funding required a flood mitigation plan. Also, states with approved Enhanced State Mitigation Plans could qualify for additional mitigation funding. For disasters declared after November, 2004, HMGP funds will not be available to local jurisdictions without approved hazard mitigation plans.
MEMA has been assisting local jurisdictions in developing mitigation plans
to meet these requirements. MDE supplied the repetitive loss data it generated to incorporate into the plans to identify some viable projects. DNR supplied information on sea level rise. Floodplain Management Database and Repetitive Loss Project To assist local planning efforts, MDE has compiled data useful in floodplain management planning, using funding from FEMA received through MEMA. The data was compiled in ArcView format and consists of data layers, which can be overlain on digitized and orthorectified quarter quadrangle aerial photography (DOQQ). Layers used include MDProperty View and the Q3 digital floodplain line. This has allowed the development of guidance maps for local planning which have been distributed to many of the small towns whose flood maps were out of date or insufficient due to annexations or other reasons. Some data analysis in this report and in our newsletter to local floodplain managers is derived from this database. Examples include the percent of land area that is floodplain in each county, the number of parcels in the floodplain, improvements in the floodplain, and the repetitive loss data. ArcView software was used by MDE to show the areas that were flooded during Hurricane Floyd to determine if waters reached beyond the 100-year flood lines.
With a grant from FEMA, a Corvallis Microtechnology, Inc. CMT-Z33 dual-frequency Global Positioning System (GPS) was purchased in 2000. It is an all- purpose high precision GPS for surveying and GIS data collection. It consists of a base station in one backpack system and a rover unit in another backpack, with a radio link between the two GPS receivers, and a field data recorder for each. In addition, a laser range finder was added to the system to allow readings to remote points not accessible to the GPS equipment, due to loss of satellite coverage under trees and near structures. This equipment allows accurate determination of elevation and position, for the repetitive loss project, high water marks, etc. The repetitive loss project was undertaken to provide a statewide list of priority projects for mitigation funding. The repetitive loss data was supplied by the National Flood Insurance Program and is a list of properties experiencing two

An Assessment of Maryland’s Vulnerability to Flooding Page 59
or more flood insurance claims of at least $1,000 within a 10-year period since 1978.
Data was collected on each repetitive loss property in the state, including elevation and latitude/longitude information, the source and type of flooding, the depth of flooding, the lowest point of entry of water, the date the structure was built and whether or not it has a basement. We will use the GIS database to target areas of high repetitive loss and set priorities for funding. We can use it to immediately justify proposed projects - all information to develop the benefit/cost analysis will be in the database. It should help determine when community or area wide solutions are more appropriate than individual solution. Table 12 is a listing of the number of repetitive loss properties in Maryland by county. A number of repetitive loss properties have been added to the repetitive loss list as a result of damage by Isabel in 2003, after the project was completed in 2002. The additional properties have not been visited, but many were mitigated by elevating the property. Table 12. Repetitive Loss Properties in Maryland by County as of November 30, 2004
County FEMA Mitigated Repetitive Losses
FEMA Non-mitigated Repetitive Losses
TOTAL per County
Allegany 7 19 26 Anne Arundel 0 70 70 Baltimore City 4 39 43 Baltimore 7 111 118 Calvert 2 30 32 Caroline 0 0 0 Carroll 0 12 12 Cecil 0 36 36 Charles 0 8 8 Dorchester 0 32 32 Frederick 3 22 25 Garrett 1 16 17 Harford 4 8 12 Howard 0 4 4 Kent 0 6 6 Montgomery 0 36 36 Prince George's 1 0 1 Queen Anne's 0 21 21 Somerset 1 12 13 St. Mary's 0 5 5 Talbot 0 13 13 Washington 6 57 63 Wicomico 0 2 2 Worcester 48 75 123 TOTAL 84 634 718

An Assessment of Maryland’s Vulnerability to Flooding Page 60
Mapping Risk - Floods and Tropical Storm Surges Maryland's flood risk was originally mapped in the 1970's on the Flood Hazard Boundary Maps distributed by the Department of Housing and Urban Development based on the best available information at the time, although a few local studies had been undertaken. The maps were designed to give communities who wished to join the Emergency Phase of the National Flood Insurance Program (NFIP) some guidance as to the hazard areas they needed to regulate to be in the program. In most cases, flood insurance studies using hydrologic and hydraulic methods were later conducted to refine the risk and to allow communities to enter the Regular Program. When studies were completed, new Flood Insurance Rate Maps (FIRMS) and Flood Boundary and Floodway Maps (FBFM) were issued by the Federal Emergency Management Agency, who took over the NFIP. These used the best available base maps at the time, usually the U. S. Geologic Survey quadrangle topographic maps, often with a 20-foot contour interval. In studies and maps issued since January 1985, the Floodway information is included on the FIRM and only one map is issued. Also, the vertical datum used is being converted from National Geodetic Vertical Datum of 1929 (NGVD) to the North American Vertical Datum of 1988, with 1991 revision (NAVD 88,91). Under the NFIP regulations, once the floodway is delineated by a detailed study, no encroachment is allowed which would cause any increase in the 100-year flood elevation. This area is reserved for the discharge of the 100-year flood without impediment. Floodplain areas outside the floodway may be developed under the provisions of the ordinance adopted by the local jurisdiction to be in the NFIP. A large number of areas were not studied by costly detailed methods. These approximate floodplain areas show the extent of the floodplain, based on best available methods, but no 100-year flood elevations are available. Currently, most studies are outdated, with the average age of flood insurance studies in Maryland being 19 years old. New studies are now provided in a digital format, called a countywide D-FIRM. By 2005, only two countywide D-FIRMs have been produced in Maryland: Harford County and St. Mary’s County. Further refinement of the flood hazard hinges on replacement of the current topographic base maps with more refined topography - down to 2-foot contour intervals. Where discharges and riverine characteristics have changed, restudy may be necessary. The development of accurate digital topography is critical to better refinement of the flood risk through the use of current hydrologic and hydraulic modeling and the refinement of floodplain lines. FEMA has been lobbying Congress to appropriate additional funding to update the flood maps. Up to now, funding to update maps has been severely limited, and very little has been accomplished. FEMA's Map Modernization effort calls for substantial funding. A bill was proposed for Congress to appropriate an additional $300 million per year for 3 years, starting in 2003, for this effort;

An Assessment of Maryland’s Vulnerability to Flooding Page 61
however, Congress reduced the amount to $150 million for 2003 and 2004. The 2005 budget is for $200 million and the time frame has been extended to at least 5 years. The State Coordinating Office is trying to promote the development of improved topographical modeling using LIDAR technology to support FEMA's Map Modernization effort. If the better topography is available, it will be used by FEMA in creating the new D-FIRMs and will be critical to better definition of flooding risk. Although we have been unable to obtain state funding to support this effort, we have been trying to coordinate local, federal, and state efforts to assure that any data generated will meet Map Modernization standards. Hurricane inundation maps were created for the Chesapeake Bay and Atlantic Coastal areas of Maryland to show areas that would be inundated by the storm surge from different categories of hurricanes in 1988. The project was a cooperative effort among the National Oceanic and Atmospheric Administration (NOAA), the Army Corps, and DNR. NOAA supplied the data for the maps, the Army Corps produced the maps, and DNR distributed the 18 maps to the 16 coastal counties, Baltimore City, and Ocean City. The maps predict the inundation zones for Saffir-Simpson Category 1 through 4 hurricanes. Storm surges range in height from 3-5 feet for a Category 1 storm to 13-18 feet for a Category 4 storm. Hurricane inundation maps are now available in a digital format that can be overlain in a Geographical Information System (GIS). Maps are provided in the Maryland Hazard Analysis. Flood Insurance Any resident of a community participating in the National Flood Insurance Program (NFIP) can purchase flood insurance. It is a good way to protect from property losses in areas subject to flooding. Flood insurance can be purchased on both the building and contents. For example, a tenant may purchase content coverage, while the landlord may purchase a policy on the building. Any participating insurance agency may sell and service a flood insurance policy, but all policies go through the NFIP.
The mandatory purchase of flood insurance requirement is implemented through the lender. Federal law requires that all loans written on structures in designated flood hazard areas be secured by flood insurance, at least up to the value of the loan, or, if the loan exceeds the maximum amount of flood coverage available, to the maximum flood insurance coverage available. If the lender does not meet the requirement during an audit, fines can be levied. The lender is responsible for making a flood determination for each loan, but may delegate this responsibility to a flood determination company. The buyer of the property has

An Assessment of Maryland’s Vulnerability to Flooding Page 62
the opportunity to purchase flood insurance, but if they fail to do so, the lender can "force place" flood insurance. This allows the lender to purchase a policy from any source (not necessarily the NFIP) and charge the cost to the homeowner. The cost of a flood insurance policy is based on a number of factors, such as when a structure was built, the flood zone it is in, its elevation, and if a basement is present. All structures are classified as either pre-FIRM or post-FIRM. A pre-FIRM structure was built prior to the local jurisdiction adopting any regulations and joining the NFIP. These structures are placed in a subsidized pool in which the risk is unknown. The premium is based on the flood zone and presence of a basement. Structures built after the adoption of floodplain regulations by the local jurisdiction must submit an elevation certificate in which a surveyor or engineer certifies the elevation of the lowest floor and that the structures is in compliance with floodplain regulations. The premium will be based on the actuarial risk from the elevation certificate. If the lowest floor is above the 100-year elevation, premiums will be reduced, if it is below, premiums will be much greater. Structures in coastal high hazard areas or V-zones, where waves are a factor, pay higher rates than structures that are in A-zones. Structures that are outside flood hazard areas (C- or X-zones) can purchase flood insurance at much lower premiums. In order to collect on a claim, there must have been a general condition of flooding, that is, other properties in the immediate vicinity must have flooded. If an isolated flooding incident occurs, flood insurance may be denied. Coverage for sewage and drain backup may be purchased as a rider on homeowner's policies. Property owners who have received federal disaster assistance aid must carry flood insurance to cover future losses, since no aid will be allowed in the future, except that provided by flood insurance. Dams and the State Dam Safety Program The Maryland Waterway Construction Act, passed in 1933, also governed the construction and operation of dams in Maryland. It placed on the dam owner the responsibility of constructing and maintaining a safe facility, as well as a requirement for a state permit, currently under COMAR 26.17.04. It also gave the Water Resources Commission authority to require the owner of a reservoir, dam, or waterway obstruction to remove or repair any structure deemed to be unsafe. In 1964, the Department of Water Resources assumed these duties, and in 1973, the Department of Natural Resources was formed and the functions were moved to the Water Resources Administration. In 1995, the functions were moved to Maryland Department of the Environment.
Federal legislation didn't come until the 1972 National Dam Inspection Act to inventory and inspect nonfederal dams to protect human life and property.

An Assessment of Maryland’s Vulnerability to Flooding Page 63
However, it was not until 1977 that funding became available to the Army Corps to inspect dams, starting with the 9,000 "high" hazard nonfederal dams identified. In 1979, this function was shifted to the Federal Emergency Management Agency. The Dam Safety Division in the Water Management Administration of MDE currently oversees dams in Maryland, issuing permits and inspecting dams. Maryland has a total of 376 dams, characterized based on the potential damage that could occur if the dam were to fail. There are 56 "high" hazard (loss of life and extensive property damage likely), 79 "significant" hazard (extensive property damage but no loss of life likely), or 235 "low" hazard (no loss of life or significant property damage likely). Downstream development in the danger reach affects the dam's classification and is not advised. Dams must develop emergency warning and evacuation plans to mitigate the effects of a dam failure. Most dams (72%) in Maryland are small earthen dams. The Dam Safety Division is in the process of producing digital dam break flood maps for all the high hazard dams in the state. These will be available to local jurisdictions to use to prevent development in these high hazard areas. Maryland Stormwater Management Regulations Stormwater management regulations have as one of the goals to help prevent flooding, but the design standards are geared to the water quality effects of the 2-year and 10-year flood. The stormwater devices are not usually designed to accommodate the really big floods. Design standards specify that the devices must pass the 100-year flood safely, however. Many are designed with additional capacity to retain floodwaters. The new regulations are stressing proper construction, and requiring as-built documentation, as well as periodic inspection and maintenance. Many of the past failures had to do with insufficient maintenance, although improper construction was a factor. The new regulations de-emphasize the flood control function, in favor of water quality and channel erosion control functions. However, the regulations allow more environmentally friendly nonstructural Best Management Practices, such as natural area conservation, buffers, infiltration, reduction of impervious cover, and environmentally sensitive development. Keeping as much of the runoff on the site and allowing it to infiltrate does have a flood attenuating function. By reducing the impervious surfaces, keeping the runoff on site, and allowing it to infiltrate the soil, we are helping to prevent flood damage. New regulations governing stormwater management (SWM) programs were implemented statewide by July 1, 2001, under COMAR 26.17.02. The goal is to maintain the predevelopment characteristics of runoff as nearly as possible after development, and to reduce stream channel erosion, pollution, siltation and
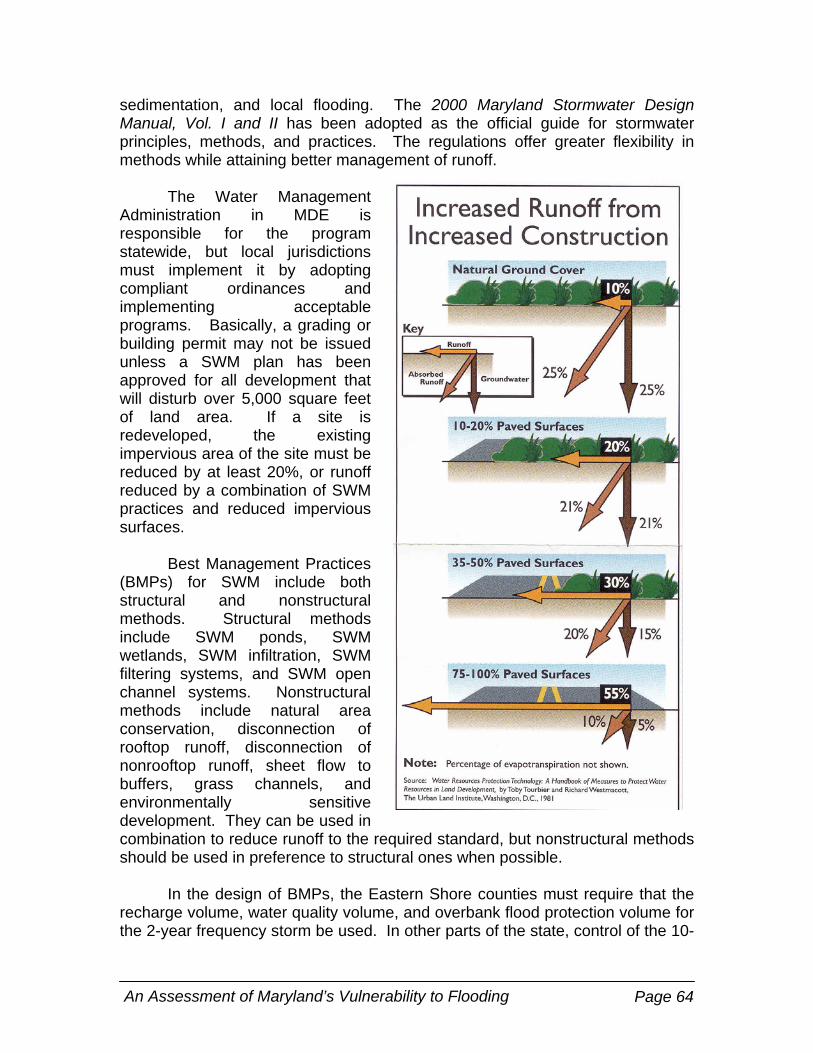
An Assessment of Maryland’s Vulnerability to Flooding Page 64
sedimentation, and local flooding. The 2000 Maryland Stormwater Design Manual, Vol. I and II has been adopted as the official guide for stormwater principles, methods, and practices. The regulations offer greater flexibility in methods while attaining better management of runoff. The Water Management Administration in MDE is responsible for the program statewide, but local jurisdictions must implement it by adopting compliant ordinances and implementing acceptable programs. Basically, a grading or building permit may not be issued unless a SWM plan has been approved for all development that will disturb over 5,000 square feet of land area. If a site is redeveloped, the existing impervious area of the site must be reduced by at least 20%, or runoff reduced by a combination of SWM practices and reduced impervious surfaces.
Best Management Practices (BMPs) for SWM include both structural and nonstructural methods. Structural methods include SWM ponds, SWM wetlands, SWM infiltration, SWM filtering systems, and SWM open channel systems. Nonstructural methods include natural area conservation, disconnection of rooftop runoff, disconnection of nonrooftop runoff, sheet flow to buffers, grass channels, and environmentally sensitive development. They can be used in combination to reduce runoff to the required standard, but nonstructural methods should be used in preference to structural ones when possible. In the design of BMPs, the Eastern Shore counties must require that the recharge volume, water quality volume, and overbank flood protection volume for the 2-year frequency storm be used. In other parts of the state, control of the 10-

An Assessment of Maryland’s Vulnerability to Flooding Page 65
year frequency storm is required. (The 2-year frequency storm is about 3.3 inches of rain in 24 hours, while the 10-year would be associated with 5.2 inches in 24 hours, but varies somewhat by county.) Development in watersheds designated as interjurisdictional flood hazard watersheds (Carroll Creek, Gwynns Fall, and Jones Falls and their tributaries) may not increase the downstream peak discharge of the 100-year frequency storm event (about 7.4 inches in 24 hours). All ordinances must provide for periodic inspections and maintenance of all completed stormwater management devices to insure proper functioning. Enforcement procedures must be in place to ensure that deficiencies indicated by inspections are rectified. Maryland Wetlands and Wetland Regulations Maryland has roughly 600,000 acres of wetlands (10% of the land area), based on a 1982 survey, approximately 50% of the pre-settlement estimate of 1.2 million acres. Of this, 250,000 acres of salt and brackish water wetlands, and 340,000 acres of palustrine (mainly nontidal) wetlands were identified. Wetlands are extremely important for the many functions they provide: habitat for wildlife, enhance water quality, flood control, water recharge, and recreation and aesthetics. Some wetlands fall among the world's most productive ecosystems and the productivity of the Chesapeake Bay depends on the input of detritus from wetlands. Wetlands provide significant water storage during periods of flooding and release the water stored slowly to lower peak flows and maintain base flows. Emergent wetlands protect many shorelines from erosion. Historically viewed as wastelands to be filled in, the attitude towards wetlands has changed since the 1970s to be viewed as valuable natural resources to be preserved. Significant wetland losses were associated with human activities until regulations were instituted in the 1980s. Passage of the Maryland Nontidal Wetlands Act in 1989 greatly reduced wetland losses from human activity. However, wetland losses continue to occur as a result of sea level rise and land subsidence. For example, studies by the University of Maryland on the Blackwater Wildlife Refuge show that approximately 3,460 acres of marsh were converted to open water between 1938 and 1989. These losses will continue to result from natural causes and are exacerbated by man-made barriers preventing wetlands from migrating landward as sea level rises. The 1970 Tidal Wetlands Act regulates "state" wetlands (all lands lying below the mean high water line) and "private" wetlands (lands extending shoreward from mean high water line, subject to periodic tidal flooding, and support aquatic growth) under COMAR 26.24 Tidal wetlands are delineated on maps showing the state's jurisdiction. Property owners have the right to control erosion and gain access to navigable waters from their land.

An Assessment of Maryland’s Vulnerability to Flooding Page 66
The Nontidal Wetlands Act of 1989 requires that a permit be obtained after
1990 for any impact to a wetland or its 25-foot buffer under COMAR 26.23. The goal is no net loss, and a gain in wetlands. The applicant must demonstrate that the impact cannot be avoided, and if any wetlands are destroyed, the applicant must create additional wetlands or pay into a state wetland creation fund.
Growth Management - Critical Areas, Sensitive Areas, Smart Growth In 1984, the Critical Area Law passed the state legislature. The Act established a 1000-foot strip of land around the Chesapeake Bay and its tidal tributaries for special protection efforts to help prevent further degradation of the water quality and resources of the Bay. In Maryland, 60 counties and municipalities lie within the Critical Area. The Critical Area Commission established requirements that would be implemented at the local level. Most important among these was the extra protection afforded by maintaining a natural vegetated 100-foot buffer along the shoreline of tidal waters, wetlands, and tributary streams. Development is severely limited in the buffer and natural vegetation maintained or planted. In the Critical Area, zoning overlays of Intensely Developed Areas (IDA), Limited Development Areas (LDA), and Resource Conservation Areas (RCA) were established, based on current development on December 1, 1985. Resource Conservation Areas were afforded the highest protection, allowing only one residence per 20 acres. Regulations adopted limit impervious surfaces and stormwater runoff, as well as provide for storage to achieve water quality goals by maintaining pre-development runoff. In 2002, the Legislature passed the Atlantic Coastal Bays Protection Act, which added the coastal bays to the Chesapeake Bay Critical Area Program. This extended similar protections to the coastal bays behind Ocean City and Assateague. Like the Critical Areas Program, a local protection program consistent with the state law is implemented in Worcester County.
The Maryland Economic Growth, Resource Protection, and Planning Act of 1992 required, among other requirements, that local jurisdictions incorporate a sensitive area component into their comprehensive plans. The sensitive area component had to contain "goals, objectives, principles, policies, and standards to protect from the adverse effects of development, sensitive areas, including the following: (1) streams and their buffers, (2) 100-year floodplains, (3) habitats of threatened and endangered species, and (4) steep slopes." The act encouraged local jurisdictions to adopt plans and regulations to prevent development in stream valleys and floodplains and give a high priority to their protection. The Act helped local floodplain management ordinances by adding additional reasons to prevent floodplain development and maintain the natural beneficial functions of

An Assessment of Maryland’s Vulnerability to Flooding Page 67
floodplains. Other tools to prevent development in sensitive areas, such as transferable development rights, clustering, and flexible regulations, were suggested.
This Act also implemented the "Smart Growth" provisions designed to
promote growth in established developed areas of the state to prevent sprawl. State agencies with permitting and funding responsibilities are to review proposed development to ascertain that smart grow provisions are met. Among these is that all environmental permits are reviewed to ascertain that sensitive areas are protected.
Sea Level Rise Response Strategy The Coastal Zone Management Program in the Department of Natural Resources (DNR), released a document in 2000, which sets forth the policy and implemental framework for reducing Maryland's vulnerability to sea level rise in the coming years. The report notes that sea level rise rates along Maryland's coastline of approximately one foot in the last century are nearly twice those of the global average.
Global warming could increase the rate to as much as 3 feet over the next century. It is difficult to separate the effects of sea level rise from those of land subsidence, but both contribute to greater flooding of low-lying lands. In addition to increasing the rate of sea level rise, global warming is expected to increase the severity and frequency of storms. Coastal flooding will increase, submerging
tidal wetlands, increasing erosion of shorelines, and damaging structures in low-lying areas.
Sea level response planning is needed in Maryland; the state's current
capabilities do not adequately address the three primary impacts of sea level rise (erosion, flooding, and wetland loss), and little is being done to prevent adverse effects. The report refers to sea level planning as the "ultimate planning challenge". Maryland's vulnerability should be assessed, and strategies need to be developed to accommodate for the expected effects of this sea level rise. Additional freeboard, establishment of coastal erosion setback zones, and further preservation of low-lying wetland areas are some possible strategies to accommodate. The policy of armoring coastlines needs to be re-evaluated. A "do nothing" attitude will lead to unwise decisions and increased risk over time.

An Assessment of Maryland’s Vulnerability to Flooding Page 68
The report is authored by Zoe Johnson, and is available from the Coastal Zone Management Program at DNR (410) 260-8730 or on the web at www.dnr.state.md.us/bay/czm/index/html
An article in the Natural Hazard Observer by Klaus H. Jacob of the Lament-Doherty Earth Observatory at Columbia University focuses on futuristic hazard and risk assessment. The author comments that the latest scientific knowledge must be applied when estimating future hazards and risks. He notes that this is not the case for flood zones mapped decades ago, and no attempt is made to evaluate future risk exposures. The East Coast will be exposed to an increasing frequency of coastal storm surge floods, attributed to global warming and sea level rise. The U.S. Global Climatic Change Program models predict sea level increases of 1-3 feet by the year 2100. These estimates take into account local land subsidence, melting of alpine glaciers and icecaps, and the thermal expansion of warming oceans. More surprising, the 1-3 feet of sea level rise will cause storm surges less than 20 feet in height 2-10 times more often, with an average of 3 times more often, by the year 2100. If billions of dollars are invested in new structures without accounting for sea level rise, hundreds of billions of dollars in future losses will occur. The author concludes that the best mitigation is to avoid placing new or refurbished structures and assets at too low an elevation. This will require planning, with flood elevations that will protect the housing stock into the future, as well as tough zoning enforcement. With proper execution, critical components will be placed at sufficiently high elevation to protect them into the future and prevent staggering losses. “No Net Adverse Impact” Watershed Planning
Citing the fact that annual flood losses in the United States continue to worsen, now totaling $6 billion, in spite of federal flood control and the National Flood Insurance Program, a new approach is being proposed by Larry Larson and Doug Plasencia. In an article entitled: No Adverse Impact: A New Direction in Floodplain Management Policy, they suggest a new “no adverse impact” floodplain policy. The Association of State Floodplain Manager's supports the concept.
A "no adverse impact floodplain" is one in which the action of one property owner or community does not adversely affect the flood risks for other properties or communities as measured by the increased flood stages, increased flood velocity, increased flows, or the increased potential for erosion and sedimentation, unless the impact is mitigated as provided for in a community or watershed based plan. It requires anyone proposing new development to

An Assessment of Maryland’s Vulnerability to Flooding Page 69
mitigate the effect so that no increased harm will result to existing development. This policy will decrease the creation of new flood damages and promote wise use of floodplains. Alternatively, if a watershed management plan allows and compensates for the development, such as through a regional stormwater management facility, the development may be permitted.
Current federal policy has not come to grips with how to prevent new
development from creating flooding problems on existing development. While the NFIP debates how to construct in the floodplain, it does not consider whether the development itself is making flooding conditions more severe. Little attention is paid to the pushing of flood waters onto other land when floodplains are filled, or when the watershed outside the floodplain is developed and the newly increased runoff is allowed to flow freely downhill. The NFIP allows new development to cause an increase in the level of future floods, but ignores that level for the next development. When a building is constructed in the floodplain, its lowest floor elevation is based on data that is 15 years or older, regardless of the amount of development in the interim, and could be well below the current true 100-year flood elevation. The cumulative effects of floodplain and watershed development over these years could drastically increase flood heights, but the building is only required to be elevated to the flood elevation existing at the time the study was done.
Using future development conditions in floodplain mapping is one strategy.
The report cites a study in Mecklenberg County, NC. By updating the FEMA map computer models to 2000 land use conditions, flood heights increased 2-3 feet. However, when ultimate land use in the watershed was loaded into the models, flood height increased another 2-3 feet. The maps will not keep up with development, and new buildings will not be protected from flooding, using the federal requirements. A study done on McAlpine Creek estimated that investing $250,000 in ultimate floodplain studies and basing regulations on better data, prevented $16 million in flood damage.

An Assessment of Maryland’s Vulnerability to Flooding Page 70
The no adverse impact floodplain, based on no increased flood risk, as measured by flood stages, flood velocity, flow, and erosion and sedimentation, is being espoused as a new national standard for all programs affecting floodplains. It promotes local planning initiatives that would insure that future development in both the floodplain and the watershed are part of a locally adopted plan. The effects of the development must be mitigated by the plan, or it could not be permitted.
This program is highly recommended for consideration to prevent future
flooding problems from development.

An Assessment of Maryland’s Vulnerability to Flooding Page 71
Part V. Flood Mitigation Projects in Maryland State Projects
The Comprehensive Flood Management Grant Program (CFMGP) has been used to acquire structures, install flood-warning systems, construct flood control projects, and other flood mitigation projects over the years. Initially, the focus was on completing flood studies to define the hazard. In addition, watershed-wide flood management plans are required to justify projects. In order to approve a project, the state requires that a flood management plan be submitted by the local jurisdiction, which defined the flooding problem and outlined the proposed project as the best solution to the problem. In some cases, the state shared in the cost of the plan.
State funds are leveraged by federal mitigation funds, which are available
after a Disaster Declaration and generally pay up to 75% of the project cost, if approved. After a disaster declaration, a fund equal to 15% of the total disaster expenditures by FEMA is made available to the state for mitigation. In these

An Assessment of Maryland’s Vulnerability to Flooding Page 72
cases, the CFMGP will pay half of the 25% local share of the project cost. The program has paid up to 50% of the cost of projects until a regulatory change in 1999, which increased the state payment up to a maximum of 75% when no federal cost share is available.
Communities are asked to submit a yearly list of proposed projects, which are rated in priority by the state in May and funded as Program funds permit. Funding for the program has varied widely year to year as interest in flood mitigation has waxed and waned. Flood events generally increase funding, while years of budget deficits and no major flooding have caused Program funding to decrease or the Program to become inactive. As of the beginning of 2003, a total of approximately $32 million has been funded by the state for the cost share program, as shown in Table 13. Table 13. Comprehensive Flood Management Grant funds
Funding Source Amount Comprehensive Flood Management Loan of 1980 $ 7,500,000 Comprehensive Flood Management Loan of 1982 $ 1,500,000 Comprehensive Flood Management Loan of 1983 $ 3,500,000 Comprehensive Flood Management Loan of 1984 $ 1,000,000 Comprehensive Flood Management Loan of 1986 $ 1,500,000 Comprehensive Flood Management Loan of 1987 $ 1,500,000 Comprehensive Flood Management Loan of 1988 $ 3,000,000 Comprehensive Flood Management Loan of 1989 $ 4,000,000 MD Consolidated Capital Bond Loan - 1990 $ 2,500,000 MD Consolidated Capital Bond Loan - 1991 $ 2,900,000 MD Consolidated Capital Bond Loan - 1998 $ 969,000 MD Consolidated Capital Bond Loan - 1999 $ 33,000 Hurricane Floyd Disaster Assistance - PAYGO - 2001 $ 283,323 MD Consolidated Capital Bond Loan - 2001 $ 1,250,000 MD Consolidated Capital Bond Loan - 2002 $ 667,000
TOTAL $32,102,323 After the initial investment in studies and mapping to define the flood risk
in conjunction with the NFIP, the Program has turned to seeking solutions to flooding problems. The primary focus is to acquire flood prone structures in the 100-year flood plain and remove them. The structures are removed and the land must be dedicated to open space uses after acquisition. To qualify, a structure must have a history of flooding above the 1st floor or get a least a foot of flooding around the foundation. The program has authority to do emergency acquisitions of flood-damaged homes immediately after a flood.

An Assessment of Maryland’s Vulnerability to Flooding Page 73
In addition to the acquisition of flood prone buildings, the CFGMP has funded flood-warning systems in Allegany County, Baltimore City, Baltimore County, Howard County, and Prince George’s County. Structural solutions to flooding that have been funded include levees and floodwall, detention structures, channel improvements, dam repairs, and flood gates and valves.
The most involved and costly project undertaken by the CFMGP was the Carroll Creek Project in the City of Frederick. The flood control project is designed to prevent flooding in downtown Frederick by diverting up to 100-year floodwaters through a 1.3 mile long underground conduit system. A small portion of the streamflow is diverted to an above ground channel that is the centerpiece of a linear urban greenway through the City. This project began in 1983 and was completed in the late 90s at a cost of approximately $60 million. Final removal of the protected area from the floodplain did not occur until 2002.
Table 14 lists the acquisition projects that have been undertaken with the grant program: Table 14. Flood grant program acquisitions by county
County Year Watershed Number Type Location
ALLEGANY 1983 Fairgo 3 Homes Moss Ave, Ellerslie
ALLEGANY 1986 Wills Creek 8 Homes Locust Grove
ALLEGANY 1987 Wills Creek II 6 Homes Locust Grove
ALLEGANY 1989 Wills Creek II 5 Homes Locust Grove
ALLEGANY 1997 George's Creek 13 Homes Nikep, Pekin. Barton, Midland
ALLEGANY 1997 George's Creek 9 Homes Lonaconing
ALLEGANY 1999 Wills, Bradford 12 Homes Cumberland-LaVale, Locust Grove
ALLEGANY 2000 Dry Run I 16 Homes Valley Road, Cumberland
ALLEGANY 2000 George's Creek 2 Homes Barton, Moscow
ALLEGANY 2000 Dry Run 2 18 Homes Valley Road, Cumberland
ALLEGANY 2001 George's Creek 20 Homes Various, mainly Gilmore
ALLEGANY 2001 Dry Run 1 Homes Valley Rd
ALLEGANY 2002 George's Creek 11 Homes Midland, Lonaconing, Nikep
ANNE ARUNDEL 1984 Patapsco 6 Homes Lakeview Ave.
ANNE ARUNDEL 1985 Brooklyn Park 19 Townhomes Meadow & Old Riverside Rd
BALTIMORE CITY 1983 Gwynns Falls 15 Homes Maisel St., Hollins Ferry Rd
BALTIMORE CITY 1984 Jones Falls 40 Homes Falls, Asbury Rd, Mattfeldt
BALTIMORE CITY 1984 Jones Falls 1 Industrial Rockland Ind.
BALTIMORE CITY 1987 Jones Falls 1 Industrial MD Bolt & Nut
BALTIMORE 1981 Patapsco 11 Homes Landsdown - Research Ave.
BALTIMORE 1981 Roland Run 25 Homes Cliffedge Rd.,
BALTIMORE 1982 Roland Run 12 Homes Morris Ave.
BALTIMORE 1982 Brien Run 12 Homes Victory Villa - Runway Ct
BALTIMORE 1982 Red House Run 1 Home
BALTIMORE 1982 Roland Run 2 Homes W. Seminary Ave.

An Assessment of Maryland’s Vulnerability to Flooding Page 74
County Year Watershed Number Type Location BALTIMORE 1983 Brien Run 3 Homes Victory Villa - Runway Ct.
BALTIMORE 1983 Herbert Run 12 Homes Leeds Ave, Ridge Dr.
BALTIMORE 1983 Gwynns 8 Homes Queen Anne Rd.
BALTIMORE 1983 Gwynns 10 Homes Same area as above
BALTIMORE 1983 Little Falls 7 Homes Parkton - York Rd & Hyde Rd
BALTIMORE 1983 Moores Run 8 Homes E. Biddle St, 62nd St.
BALTIMORE 1984 Moores Run 12 Homes Same area as above
BALTIMORE 1986 Gunpowder 20 Homes Ensor Mill Rd
CALVERT 1986 North Beach 2 Homes Bay Ave. @ 5th St.
CALVERT 2001 Chesapeake Bay 1 Home Webster Drive, Cove Pt.
CAROLINE 2001 Choptank 5 Homes Sunset Ave, Greensboro
CARROLL 2001 Pipe Creek 1 Commercial Junk yard in Detour
CECIL 2001 Big Elk Creek 13 Homes Farr Creek, Elkton
FREDERICK 1998 Potomac River 5 Homes Homes - Point of Rocks
FREDERICK 2001 Potomac River 1 Home Home - Point of Rocks
FREDERICK 2002 Potomac River 10 Homes Homes - Point of Rocks
GARRETT 1998 Potomac River 6 Homes Homes - Shallmar
GARRETT 1999 Youghiogheny 1 Home 2527 Hutton Rd, Crellin
GARRETT 1999 Bradley Run 1 Home 450 Liberty Rd, Oakland
GARRETT 2000 Youghiogheny 17 Homes Crellin
HARFORD 1986 Deer Creek 2 Homes Walters Mill Rd.
HARFORD 1990 Grays Creek 3 Homes Montreal Ave, Phila. Rd
HARFORD 1990 Bynum Run 3 Homes Wheel Rd, Cedar La
HARFORD 1999 James Run 2 Homes 4125-7 Philadelphia Rd
HARFORD 1999 Plumtree 1 Home 3203 Shawnee La.
HOWARD 1990 Patapsco 3 Homes Tiber/Hudson
HOWARD 1990 Patapsco 2 Taverns Sykesville taverns
HOWARD 2002 Deep Run 2 Homes Harwood Park
KENT 2000 Chester River 3 Homes Millington, Montabello Lake
MONTGOMERY 1982 Rock Creek 8 Homes Various locations in watershed
PRINCE GEORGE'S 1983 Bald Hill 6 Homes Good Luck Rd.
PRINCE GEORGE'S 1986 SW Branch 4 Homes Homes
PRINCE GEORGE'S 1986 Piscataway 22 Homes Clinton Acres
PRINCE GEORGE'S 1986 Henson 35 Homes Homes
PRINCE GEORGE'S 1986 NW Branch 9 Duplex Homes 38th St., Hyattsville
PRINCE GEORGE'S 1986 Tinkers 2 Homes Coolidge Dr.
PRINCE GEORGE'S 1987 Folly Branch 2 Homes Glendale
PRINCE GEORGE'S 1999 Various 3 Homes Hyattsville, Bowie
QUEEN ANNE'S 2002 Chester River 1 Home Sassafrass St, Millington
ST. MARY'S 1997 St. Mary's River 1 Home Great Mills WASHINGTON 2001 Potomac River 5 Homes Main St., Hancock TOTAL 531

An Assessment of Maryland’s Vulnerability to Flooding Page 75
The greatest success story of federal, state, and local government cooperation occurred in Westernport, MD. In September 1996, George's Creek overflowed its blocked channel onto Front Street and ran down Main Street. An estimated 27 structures were substantially damaged. Quickly, Allegany County, State Highway Administration, and Natural Resource Conservation Service responded with a plan and the funding to acquire and remove those homes within 5 months. Now, a Town park is where flood prone homes used to be. Federal Projects Federal agencies have carried out some major flood mitigation projects in Maryland. The Army Corps of Engineers has been involved in a number of projects and are listed in Table 15. Typically, the Corps of Engineers funds and builds structural projects such as levees, floodwalls, dams, and stream channel stabilization. Due to differences in how their benefit to cost ratio is calculated compared to FEMA’s, the Corp does not generally fund acquisition of structures, but can fund floodproofing. The Corps is charged with the responsibility of regulating wetlands and navigable waterways and wetland mitigation is a product of their accomplishments. Table 15. Major U.S. Army Corps of Engineers flood protection projects in Maryland
Project County Date Description Kitzmiller Levee GA 1963 5,800 ft of levee; 30 ft of retaining wall; 4,700 ft channel
improvements along Potomac River. Bloomington Lake
GA
1962
Dam 2,130 feet across valley of North Branch Potomac River; 296 feet high; storage of 130,900 acre-feet, of which 32,200 acre-feet is flood control.
Savage River GA 1949 Dam 1,050 feet long and 184 feet high. Storage capacity 20,000 acre-feet; seasonally used for flood control.
Cumberland AL 1946 Channelization of Wills Creek for 1.6 miles. Channel improvements of Potomac River of 1,7 miles. Levees and floodwalls along Potomac; pumping stations, pressure conduits, and small dam.
Anacostia PG 1954 Levees along 28,100 feet of Anacostia River and Northeast and Northwest Branch. Flood control channels of 14,400 feet; pumping stations.
Anacostia PG 1972 Upstream of previous project; included channel improvements by realigning, widening and deepening channels of Northwest Br (5,610 ft.), Northeast Br (7,200 ft), Indian Creek (7,600 ft).
Oxon Run PG 1962 Channel improvements of 4,160 feet; drop structure at upstream end; and approximately 1,500 feet of earth levee to protect Town of Forest Heights.
Upper Marlboro PG 1963 Channel improvements of Western Branch (4,028 ft of channel improvement, 1,350 ft of earth levee, 160 ft of floodwall) and Collington Branch (1,335 ft of channel improvements, 500 ft of levee, 150 ft of floodwall) of the Patuxent River.

An Assessment of Maryland’s Vulnerability to Flooding Page 76
The National Park Service (NPS),
under the U.S. Department of Interior, has been proficient in removing structures from the floodplain that fall within the C&O Canal National Historical Park. Nearly half of the structures removed by the Park Service appear on the state repetitive loss list. Another federal agency that has been active in the acquisition of homes and the restoration of waterways is the Natural Resource Conservation Service (NRCS), under the U.S. Department of Agriculture. NRCS has contributed nearly $2 million to restoring the Dry Run watershed, and was a major contributor to the Westernport acquisition project in Allegany County.
No. Structures County
Removed Repetitive Loss
Allegany 1 1 Montgomery 1 0 Washington 22 10
TOTALS 24 11

An Assessment of Maryland’s Vulnerability to Flooding Page 77
Part VI. Funding Mitigation Sources of Funding for Mitigation Federal
• Federal Emergency Management Agency o Hazard Mitigation Grant Program o Flood Mitigation Assistance Program
• National Park Service o Rivers and Trails Assistance Program
• Natural Resources Conservation Service • U.S. Army Corps of Engineers • Department of Housing
o Community Development Block Grant State
• Maryland Department of the Environment o Comprehensive Flood Management Grant Program o Nontidal Wetlands and Waterways Mitigation
• Department of Housing and Community Development o Community Development Block Grant Program
• Maryland Emergency Management Agency Administers FEMA Program in the state
• Maryland Department of Planning Local (County)
• County Commissioners or County Council • Department of Emergency Services • Department of Planning and Zoning • Department of Public Works
Local (Municipal)
• Mayor and City/Town Council • Town Planning or Engineering Dept.

An Assessment of Maryland’s Vulnerability to Flooding Page 78
Part VII. Recommendations Flood Grant Program
1. The State’s Flood Management Grant Program needs to be able to fund a wider range of activities than in the recent past. Although acquisitions should remain the primary focus of the program, flood studies, mapping, planning efforts, and other forms of mitigation should also be considered for grant funds when appropriate and cost effective. Internal Revenue Service policy dictates that bond funds can no longer be used to fund projects that are not capital projects, so alternative funding will be required.
2. The State Flood Management Grant Program needs a reliable, dedicated
source of funding to fund mitigation projects. Currently, funding waxes and wanes with flood events and budget crunches. Other states (Virginia, West Virginia) place a surcharge on flood insurance policies of 1-5% to fund state mitigation efforts. A yearly surcharge of 3% on Maryland flood insurance premiums would yield approximately $500,000 per year for the program. We urge the legislature to consider such a dedicated source of funding for the future of the program, in addition to bond funds.
Coordination
3. There needs to be better coordination of state agencies involved in disaster mitigation and mitigation planning to prevent duplication of effort and better use of state resources. The roles of each agency should be defined and agencies need to communicate and work together to gain a consensus and articulate a consistent state policy. A state agency that can communicate and coordinate effectively with other agencies should be tasked with the coordinating role and given the necessary authority and resources.
“No Adverse Impact”
4. A “No Adverse Impact” policy should be implemented through the local planning and permitting process with state assistance. Future development would be predicated upon the principle that existing development will not be harmed by greater flood heights from the adverse impact of new development. Stormwater management planning will become an integral part of future permits and will need to be strengthened. In obtaining future permits, applicants would have to demonstrate no adverse impact, work with the local jurisdiction to alleviate the impact, or be denied the permit.

An Assessment of Maryland’s Vulnerability to Flooding Page 79
Wetlands
5. In conjunction with sea level rise and the preservation of wetlands, the current policy of armoring shorelines needs to be examined. Wetlands are currently being lost to open waters and will need to have the ability to migrate inland to persevere, or their vital functions will be lost.
Planning
6. Dynamic local planning will be important to lowering future vulnerability to flooding. Much can be done at the local level to improve local ordinances and policies to mitigate future disasters. The minimal present cost of implementing hazard area zoning, freeboard requirements, better building practices, etc., will prevent overwhelming losses in the future, if the local jurisdiction is serious about making itself disaster resistant.
Tax Incentives
7. The state should provide support and strong incentives to individuals and communities that undertake measures that result in proven future savings in disaster recovery costs. Tax incentives and grants should be awarded to individuals and communities that implement proven technologies and methods.
Protection of Floodplains
8. Greater emphasis needs to be placed on maintaining riverine floodplains and their associated wetlands and steep slopes in their natural vegetation to maintain the vital functions of these important ecosystems. Currently, neither the regulations nor the costs of altering these sensitive areas are great enough to prevent destruction of many vital floodplain functions to the state.
Sea-level Rise
9. Sea level rise is a fairly predictable phenomenon with predictable consequences for failure to take appropriate actions. However, no state policy to deal with the consequences of sea level rise has been articulated. The state needs to take action to articulate policies to mitigate the effects of sea level rise. Among these should be additional elevation of all new buildings (freeboard requirement) and establishment of setback zones from eroding shorelines.

An Assessment of Maryland’s Vulnerability to Flooding Page 80
Acknowledgements
The authors would like to thank the many people that made the completion of this report possible. Mr. Joyce would like to thank Kevin G. Wagner for assistance in analysis of some of the data, production of graphics and tables, and review of the text. Dr. Scott would like to thank Melissa Berry for her tireless pursuit of a clean HAZUS-MH model run and Suzanne McArdle for her creation of many of the high-quality cartographic products found in this document. Additionally, thanks go to Cliff Oliver of FEMA, Philip Schneider of the National Institute of Building Sciences, and Neil Blais of ABS Consulting for their response to our pleas for help regarding the HAZUS-MH software. Hopefully, by working together, we helped create a better user experience for HAZUS users in the future.

An Assessment of Maryland’s Vulnerability to Flooding Page 81
References Federal Emergency Management Agency. 2000. Coastal Construction Manual
Vol. I-III. Federal Emergency Management Agency. 1998. National Dam Safety Program:
A Progress Report. 39 pp. Interagency Floodplain Management Review Committee. 1994. Sharing the
Challenge: Floodplain Management into the 21st Century. 191 pp + appendices. (Galloway Report)
Interagency Task Force on Floodplain Management. 1987. Further Advice on
Executive Order 11988: Floodplain Management. 68 pp. Johnson, Z.P. 2000. A Sea Level Response Strategy for Maryland, Report for
DNR. 49 pp. Maryland Coastal Bays Program. 1999. Today's Treasures for Tomorrow - A
Comprehensive Conservation and Management Plan for Maryland's Coastal Bays. 181 pp
Maryland Department of the Environment. 1996. Maryland Dam Safety Manual.
99 pp. Maryland Department of the Environment. 1997 (Supplemented 1999). Maryland
Floodplain Manager's Handbook. 47 pp + inserts. Maryland Department of the Environment. 2000. 2000 Maryland Stormwater
Design Manual - Volumes I & II. Prepared by Center for Watershed Protection
Maryland Department of Natural Resources. 1987. Hazard Mitigation Plan for
Oldtown School. 20 pp + appendices. Maryland Department of Natural Resource and Baltimore District, U S Army
Corps of Engineers. 1989. Recommendations for Flood Damage Reduction - Westernport Elementary School. 34 pp.
Maryland Departments of the Environment and Emergency Management. 1999.
Maryland Hazard Mitigation Manual. 164 pp. Maryland Department of State Planning. 1975. Regulating Flood-Prone Land in
Maryland. 43 pp.

An Assessment of Maryland’s Vulnerability to Flooding Page 82
Maryland Department of State Planning. 1974. Summary of Flood Related Studies in Maryland. 67 pp + appendices.
Maryland Emergency Management Agency. 2000. Maryland Hazard Analysis.
Geomet Report # ET-2878 prepared for MEMA. 386 pp. Maryland Office of Planning. 1993. Preparing a Sensitive Areas Element for the
Comprehensive Plan. Managing Maryland's Growth Series #3. 49 pp. Maryland Office of Planning. 1998. Sensitive Areas II. Managing Maryland's
Growth Series #18. 94 pp. National Wildlife Foundation. 1998. Higher Ground. 194 pp. North Carolina Division of Emergency Management. 1998. Local Hazard
Mitigation Planning Manual. 94 pp. North Carolina Division of Emergency Management. 1998. Tools and
Techniques for Mitigating the Effects of Natural Hazards. 96 pp. Soscia, M.L. 1982. An Assessment of Flood Management Activities in Maryland
Water Resources Administration. 115 pp + appendices. Tiner, R.W. & D.G. Burke. 1995. Wetlands of Maryland. 193 pp.