an assessment of methods used for rhrs scoring - … · an assessment of methods used for rhrs...
TRANSCRIPT

ROCK SLOPE CATCHMENT DITCH EFFECTIVENESS
An Assessment of Methods used for RHRS Scoring
Prepared by:
Thomas D. Eliassen, P.G. VTrans Transportation Geologist
and Ethan Thomas
Temporary Transportation Geologist Assistant
Vermont Agency of Transportation
February 2012


i
Table of Contents ABSTRACT ................................................................................................................................... iii
INTRODUCTION .......................................................................................................................... 1
SLOPE PROFILES ......................................................................................................................... 2
DITCH MEASUREMENTS ........................................................................................................... 2
SUBJECTIVE DITCH EFFECTIVENESS ........................................................................................................... 3
SECTION FACTORS ..................................................................................................................................... 4
ROCKFALL CATCHMENT AREA DESIGN CHARTS (RCAD) ........................................................................... 6
ROCKFALL SIMULATION ............................................................................................................................ 8
RESULTS OF DITCH EFFECTIVENESS COMPARISON ....................................................... 11
ROCKFALL vs 2007 SUBJECTIVE METHOD ............................................................................................... 11
ROCKFALL vs SECTION FACTORS ............................................................................................................. 12
ROCKFALL vs RCAD .................................................................................................................................. 12
DITCH EFFECTIVENESS CONCLUSIONS ............................................................................. 12
REFERENCES ............................................................................................................................. 16
FIGURE 1: DIAGRAM DEPICTING BASIC SETUP OF DITCH MEASUREMENT PROCEDURE. ................................................... 2 FIGURE 2: RESULTS OF SUBJECTIVE DITCH EFFECTIVENESS RATING FROM 2007 RHRS ............................................... 3 FIGURE 3: RITCHIE’S ROCKFALL CATCHMENT DITCH DESIGN CHART (FHWA 1989). .................................................. 5 FIGURE 4: RESULTS OF SECTION FACTOR DITCH EFFECTIVENESS ANALYSIS ................................................................. 6 FIGURE 5: EXAMPLE OF RCAD CHART FOR 80-FOOT 0:25H:1V CUT SLOPE. .................................................................. 7 FIGURE 6: RESULTS OF THE RCAD DITCH EFFECTIVENESS ANALYSIS .......................................................................... 8 FIGURE 7: GRAPHICAL REPRESENTATION OF A ROCKFALL SIMULATION ANALYSIS ....................................................... 10 FIGURE 8: RESULTS OF THE ROCKFALL DITCH EFFECTIVENESS ANALYSIS .................................................................. 11 APPENDIX A DITCH EFFECTIVENESS RATINGS

ii

iii
ABSTRACT
As a means of managing aging rock cuts, a number of states have developed Rockfall Hazard Rating Systems similar to that developed in the 1993 FHWA pooled funded study led by the state of Oregon. One of the parameters within those rating systems is Ditch Effectiveness. Ditch Effectiveness relates the ability of a ditch to retain fallen rock. Assignments of None, Limited, Moderate and Good are made and numeric values are chosen to represent the appropriate rating. In a review of other states RHRS reports, we have identified three existing methods for assigning these values. These methods include 1) Suggestive method - assigning a suggestive value, based on visual observations of the slope and ditch geometry, 2) Section Factor method - calculating a Section Factor whereby individual ditches are measured and compared to the ditch design of Ritchie and 3) RCAD method - comparing individual ditch geometries with design charts contained in the 2001 Oregon/FHWA pooled fund study Rockfall Catchment Area Design guide.
The Vermont Agency of Transportation proposes a fourth method, which involves taking detailed slope and ditch profiles and performing rockfall analyses to calculate a percentage of rocks retained in the catchment ditch. Percentage retained values are entered directly into a RHRS scoring system providing a more quantifiable way to characterize ditch effectiveness. As part of a VTrans periodic re-evaluation of their “A” rated cuts, full length slope profiles and ditch geometries were measured, the information keyed into a rockfall computer simulation program and the resulting ditch effectiveness calculated. These results were compared to values generated using the Subjective, Section Factor, and RCAD methods.
1
INTRODUCTION In 2011, the Vermont Agency of Transportation (VTrans) conducted a scheduled reevaluation of all RHRS “A” ranked rock slopes. During the initial RHRS study performed in 2007, VTrans had collected detailed profiles of all “A” rock slopes. It became apparent during the 2011 study that these detailed profiles (including ditch geometries) could be used in rockfall simulation programs to assist in estimating ditch effectiveness. One key component of highway design is the roadside ditch. Ditches serve many purposes such as drainage, snow storage, recovery zones for errant vehicles and collection area for falling rock. One of the most efficient ways of mitigating rockfall hazards is the construction and use of properly designed catchment ditches. Catchment ditches are used to contain the debris from rockfalls as this prevents that debris from reaching the roadway, where it could cause damage to passing vehicles and/or risk of accident. Ditch effectiveness is one of the categories evaluated within the Preliminary Phase of most Rockfall Hazard Rating Systems (RHRS) and plays a vital role in determining the preliminary ranking for a rock slope. The effectiveness of a catchment ditch should be evaluated by qualified geotechnical engineers or geologists specializing in rock slope hazards/mitigation. Ditch effectiveness can also be empirically estimated from equations and charts found in published studies and evaluated semi-quantitatively by the use of rockfall simulation computer programs. When using semi-quantitative values for determining ditch effectiveness, one needs to estimate the percentage of rocks, from a rockfall context, that reach the roadway or the amount of rock retained (percent retained) within the ditch and establish a range of values that can be used to determine what is “Good”, “Moderate”,” Limited”, or “ Poor” catchment. In many cases, it may not be possible to design a catchment ditch that would retain 100% of a rockfall due to right-of-way considerations or costly design constraints. Many State Departments of Transportation (DOT’s) use either subjective (visual) methods to estimate ditch effectiveness or empirically derived methods such as Section Factor or the Oregon Rockfall Catchment Area Design Chart (RCAD) methods. It is important to note that Section Factor values, (which are based on Ritchie Design Criteria), and the RCAD charts, were created to be used as design charts for rock-slope construction. However, it is possible to use these charts to estimate the amount of rock that might be retained within a ditch (Ditch Effectiveness). VTrans evaluated estimated ditch effectiveness by all three methods as well as a fourth method, a semi-quantitative method whereby actual ditch geometries and slope profiles were input into the rockfall analysis computer program RocFall, developed by Rocscience Inc. of Toronto, Canada. The percentage of rocks retained in the ditch was used to define “Good”, “Moderate”, “Limited”, and “Poor” ditch effectiveness. Refer to Appendix A for the ditch effectiveness ratings of all “A” ranked rock slopes examined in this report.

2
SLOPE PROFILES In order to measure an accurate profile for each “A” ranked rock slope, numerous points on the rock face were measured using a Laser Technology Inc. Impulse 200 LR laser rangefinder with Slope Profiling software. The number of points recorded for each slope evaluated as part of this study ranged from about 20 to 80. The more points that are recorded, the more accurate the slope profile. Some of Vermont’s rock slopes have excessive vegetation on them, making it difficult to obtain an accurate slope profile. When vegetation was too thick to take an accurate slope profile, profiling was postponed until the fall season when the foliage is sparser. Profiles were taken where the slope was highest or showed evidence of overhangs or where there was evidence of past rockfalls.
DITCH MEASUREMENTS The geometry of the ditches at each “A” ranked rock slope was also measured. A section of ditch geometry was generated by measuring the ditch width, starting at the edge of pavement to the toe of the slope, and the ditch depth at each 1 foot increment. Excess vegetation in the ditches was cut down to assure accurate depth measurement. A cord line was marked in 1 ft increments and laid perpendicular to the roadway and rock slope face. The cord was fitted with a line level to assure measurements were referenced to a horizontal datum. The depth of the ditch was measured at each 1 foot increment and recorded in the field notebook (Figure 1). Because ditch geometries can vary across the length of a rock cut, measurements were taken at a location representative of the overall slope and ditch geometry and ideally where the slope profile was taken.
Figure 1: Diagram depicting basic setup of ditch measurement procedure.

3
SUBJECTIVE DITCH EFFECTIVENESS RHRS scores from VTrans’ 2007 RHRS study (Eliassen, T. D., and Springston, 2007) were assigned based on visual observations of ditch width, depth, shape and other properties that would have a bearing on the ability of each ditch to contain falling rocks. Effectiveness was assigned scores as follows: • GOOD = RHR score 3 – Most rockfall occurrences expected to be contained in ditch. Ditch
width and depth generally appear greater than expected rock block(s) size and volume. • MODERATE = RHR score 9 – Ditch expected to contain rockfalls of moderate volume, but
height, shape or size of rock materials raise concern for transport into roadway. • LIMITED = RHR score 27 – Limited ditches appear to be inadequate in containing rockfalls. • NONE = RHR score 81 – Either the toe of the rock cut is immediately adjacent to the
roadway or there is a narrow flat ground surface at the toe of the cut or the ground surface slopes up from the roadway to the toe of cut.
The results of this subjective approach are shown below in Figure 2. Forty-seven ditches were rated as having “Good” ditch effectiveness, thirty-four were rated as having “Limited” ditch effectiveness, twenty-two were rated as having “Moderate” ditch effectiveness, and seven were rated as having “None” ditch effectiveness.
Figure 2: Results of Subjective Ditch Effectiveness Rating from 2007 RHRS
47 Ditches (43%)
22 Ditches (20%)
34 Ditches (31%)
7 Ditches 6%
2007 RHRS Subjective Ditch Effectiveness Rating (110 Total Ditches)
Good Moderate Limited None
4
SECTION FACTORS Section Factors (SF) were originally used by the New York State Department of Transportation (NYSDOT). SF’s are a comparison of the ratio between the required dimensions based upon Ritchie Ditch Criteria (Ritchie 1963) and the actual ditch dimensions at the site. The SF numerical value is calculated as follows: SF = (DR + WR)/(DA+WA); where DR = ditch depth in feet from Ritchie graph, WR = ditch width in feet from Ritchie graph, DA = actual ditch depth in feet, from field measurements, and WA = actual ditch width in feet, measured from toe of the slope to the edge of pavement. This numerical value can range from 1 or less in the best circumstances, to 11 in the worst circumstances. For the purposes of this study, we have defined ditch effectiveness performance (good, moderate, limited and poor) with corresponding SF value ranges: • Good, SF = 0.00 – 1.00 • Moderate, SF = 1.01 – 2.00 • Limited, SF = 2.01 – 3.00 • Poor, SF = 3.01 – 11.00 The New York DOT Rock Slope Rating Procedure states that ditch geometry meeting the Ritchie criteria will reduce the number of rocks escaping the catchment area to a maximum of 15 percent (NYDOT Rock Slope Rating Procedure: Geotechnical Engineering Manual No. 15). This means that ditches with SF values of 1 should retain at least 85% of rockfalls, ditches with SF values of less than 1 should retain greater than 85% of rockfalls, and ditches with SF values greater than 1 are expected to retain less than 85% of rockfalls. The Ritchie Design Criteria were created by Arthur M. Ritchie, Chief Geologist with the Washington State Department of Highways, in 1963. His study was the first attempt at measuring rockfall behavior on highway slopes. He simulated rockfall events by rolling rocks down a slope and measuring their impact distances and rollout distances. Ritchie drew several important conclusions from his study, including the following: 1. A rock’s mode of travel down a slope, regardless of its size or shape, is a function of the
slope’s angle (Figure 3). 2. On steeper slopes, a rocks initial motion is rolling and this quickly changes to bouncing and
even free fall, depending on the slope angle. 3. Rocks that are in free fall seldom have a high bounce height after impact.

5
In addition to these findings, Ritchie prepared an empirical design table of recommended minimum rock catchment width and depth, based on slope height and angle. This table was later adapted into a design chart (refer to Figure 7) in the FHWA publication “Rock Slopes: Design, Excavation, Stabilization” (FHWA 1989).
Figure 3: Ritchie’s Rockfall Catchment Ditch Design Chart (FHWA 1989). All one needs to know to calculate proper catchment ditch width and depth is the overall slope angle and the slope height.
There are limitations with using Section Factors based on Ritchie Ditch criteria to evaluate ditch effectiveness. Section Factors rely heavily on the use of the Ritchie Design Chart. The ditches used to compile this chart were deep, flat-bottomed and had a steep 1V:1.25H fore slope (slope from the edge of roadway to the base of ditch). Ditches with such deep and steep fore slopes do not meet current American Association of State Highway and Transportation Officials (AASHTO) roadside clear zone safety requirements and may not drain properly. The AASHTO Roadside Design Guide states: “Embankment slopes between 1V:3H and 1V:4H may be considered traversable but non-recoverable if they are smooth and free of fixed objects. A clear run-out area is the area at the toe of a non-recoverable slope available for safe use by errant vehicles. Slopes steeper than 1V:3H are not considered traversable and are not considered part of the clear zone”

6
Also, the Ritchie criteria do not take into account massive rockfalls. A large volume rockfall could overwhelm a ditch that meets or exceeds the Ritchie criteria. The rock slopes studied by Ritchie were “rough” production blasted quarry, natural, and roadway slopes with numerous launch features (irregularities on the slope that could redirect falling rock toward the roadway). Today’s rock slopes are generally smoother due to controlled blasting techniques that produce fewer irregularities on the slope that can act as launch features. The Ritchie Design Charts do not go above 130 ft for slope height and because of this six ditches could not be evaluated. These ditches were assigned the maximum score of 11.00 because it was assumed that the higher the slope, the wider and deeper a ditch would have to be to contain a rockfall. The results of the SF evaluation are shown below in Figure 4. Fifty-four ditches were rated as having “Moderate” ditch effectiveness, twenty-three were rated as having “Good” ditch effectiveness, seventeen were rated as having “Limited’ ditch effectiveness, and thirteen were rated as having “Poor” ditch effectiveness.
Figure 4: Results of Section Factor Ditch Effectiveness Analysis
ROCKFALL CATCHMENT AREA DESIGN CHARTS (RCAD) The Rockfall Catchment Area Design Charts were created by the Oregon Department of Transportation (Pierson et al. 2001) as part of an FHWA pooled fund study. These design charts are the result of an extensive research project undertaken by the Oregon DOT. The project consisted of rolling more than 11,250 basalt boulders over quarry slopes of heights ranging from
23 Ditches (22%)
54 Ditches (50%)
17 Ditches (16%)
13 Ditches (12%)
SF Ditch Effectiveness (107 Total Ditches)
Good Moderate Limited Poor

7
40ft - 80ft and slope angles of vertical, 0.25H:1V, 0.5H:1V, 0.75H:1V, and 1H:1V. At least 250 rocks were rolled for each slope arrangement. The RCAD charts provide quick and easy assessment of the effectiveness of a ditch by showing the expected percent retained of rock within that ditch based on rock slope height, rock slope angle and ditch slope angle (Figure 5).
Figure 5: Example of RCAD chart for 80-foot 0:25H:1V cut slope.
The following criteria were used to assign a RHR Score for ditches that were evaluated with the RCAD charts:
• Good, 85% - 100% of rock was retained within the ditch. RHR score of 3. • Moderate, 70% - 84% of rock was retained within the ditch. RHR score of 9. • Limited, 30% - 69% of rock was retained within the ditch. RHR score of 27. • Poor, 0% - 29% of rock was retained within the ditch. RHR score of 81.

8
The primary rock type tested was hard durable basalt that rebounds and rolls well after impact. Softer, less competent rock is expected to have smaller rebound values and shorter roll out distances. Another factor to consider is that not all rockfalls originate at the top of a rock cut, as was tested in the RCAD project. The results indicate that rocks that initiate from points below the maximum height of the cut may not need the entire catchment area width to achieve the same level of containment. The RCAD charts were made for slope heights between 40 ft – 80 ft. Extrapolation of the charts is possible for heights that fall below or exceed the height limits; however extrapolation should be performed with caution. Also, the quarry walls that the tests were conducted on were relatively smooth (although there were some narrow steps on the slopes resulting from drilling each lift). RCAD does not take into account launching features on a slope. The results of the RCAD analyses are shown below as Figure 6. Thirty ditches were rated as having “Good’ ditch effectiveness, nineteen were rated as having “Limited” ditch effectiveness, sixteen ditches were rated as having “Moderate” ditch effectiveness, and five were rated as having “Poor” ditch effectiveness.
Figure 6: Results of the RCAD Ditch Effectiveness Analysis
ROCKFALL SIMULATION A wide variety of rockfall computer simulation programs currently exist. Commonly used 2-D programs include the Colorado Rockfall Simulation Program (CRSP) initially developed by the Colorado Department of Highways and RocFall by Rocscience Inc. of Toronto, Canada. These programs were developed to provide a statistical analysis of probable rockfall behavior and to aid in the design of rockfall mitigation. Both programs use numerical input values assigned to slope and rock properties to simulate rockfall behavior. Empirically derived functions relating
30 Ditches (45%)
16 Ditches (22%)
19 Ditches (26%)
5 Ditches (7%)
RCAD % Retained (70 Total Ditches)
Good Moderate Limited Poor

9
velocity, friction, and material properties are used to simulate the dynamic interaction of the rock and slope. The programs provide estimates of probable velocity, energy and bounce height at various locations on a slope. Rockfall simulation was utilized during this study in developing ditch effectiveness criteria. Rock slope profiles generated in the field using the Laser Technology Slope Profiling equipment and software and ditch geometries measured in the field were collected, recorded in comma delimited format (file extension .csv) and imported into the program RocFall by Rocscience Inc. of Toronto, Canada to evaluate the ability of catchment ditches to retain fallen rocks. The following steps were followed for each slope: • Slope geometries were introduced to each simulation based on measured slope profiles and
ditch geometries. Then, segments of each slope were assigned properties for specific materials which make up the slope. RocFall has assigned the following materials; Asphalt, Bedrock Outcrops, Clean Hard Bedrock, Soil with Vegitation, Talus Covered and Talus with Vegetation. The program provides corresponding values of slope roughness, friction angle and coefficients of normal and tangential restitution for these materials. For this study, Asphalt was assigned for the roadway, Soil with Vegetation for ditches and Clean Hard Bedrock for the rock slope faces.
• Initial starting points for falling rocks were selected by selecting line seeders within the
program. Line seeders represent multiple locations where rock particles fall from the slope. Starting points were distributed randomly along the entire slope face. Initial horizontal and vertical velocities for each rock were set to the value of 0 (rock is at rest and upon running the simulation the rock is set in motion by the effects of gravity). A rock mass was also chosen. For this study, rock blocks with a unit weight of 170 lbs/ft3 and measuring 3’ by 3’ by 3’ were used (total mass of 2,750 lbs). The dimensions referenced were used only to calculate total mass. RocFall does consider cubical shaped rock in its computations.
• Next, the project settings were defined. A total of 100 rocks were chosen for each simulation using a scaling factor for Rn (coefficient of normal restitution) based on the velocities of each falling rock. The RocFall default value for the constant K=30 ft/sec. was used. A discussion of the determination of input parameters for use in the RocFall program is available in the tutorial (http://www.rocscience.com/downloads/rocfall/webhelp/pdf_files/tutorials/RF_adv_tutorial_1.pdf) available through the Rocscience web site.
• After each rockfall simulation, the distribution of rockfall endpoints (where rocks stopped
rolling and came to rest) was evaluated and a percentage of rocks running out of the ditch and passing the edge of the roadway (closest to the slope) were noted.
10
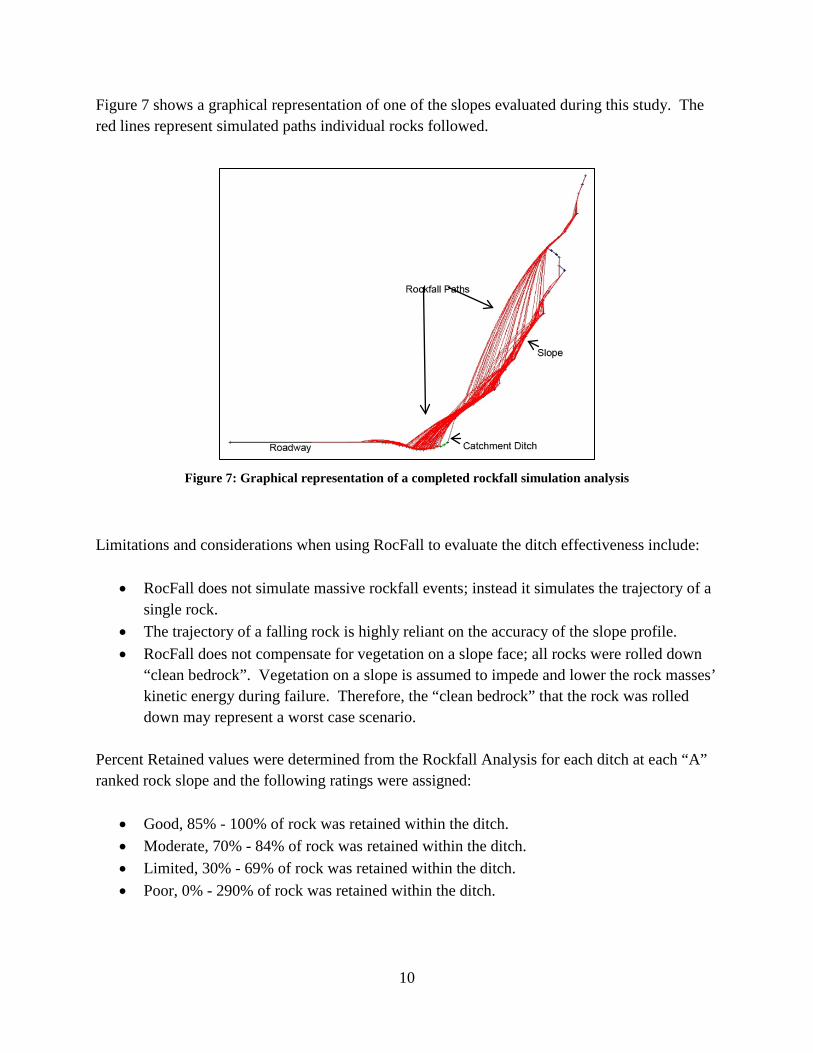
Figure 7 shows a graphical representation of one of the slopes evaluated during this study. The red lines represent simulated paths individual rocks followed.
Figure 7: Graphical representation of a completed rockfall simulation analysis
Limitations and considerations when using RocFall to evaluate the ditch effectiveness include:
• RocFall does not simulate massive rockfall events; instead it simulates the trajectory of a single rock.
• The trajectory of a falling rock is highly reliant on the accuracy of the slope profile. • RocFall does not compensate for vegetation on a slope face; all rocks were rolled down
“clean bedrock”. Vegetation on a slope is assumed to impede and lower the rock masses’ kinetic energy during failure. Therefore, the “clean bedrock” that the rock was rolled down may represent a worst case scenario.
Percent Retained values were determined from the Rockfall Analysis for each ditch at each “A” ranked rock slope and the following ratings were assigned:
• Good, 85% - 100% of rock was retained within the ditch. • Moderate, 70% - 84% of rock was retained within the ditch. • Limited, 30% - 69% of rock was retained within the ditch. • Poor, 0% - 290% of rock was retained within the ditch.

11
RHR Scores for the ditches were determined based on the following calculation:
RHR Score for Ditch Effectiveness = 100 - Rockfall % Retained Value An explanation of why the Ditch Effectiveness RHR Score was calculated this way is discussed in the Results Section. It is recommended that an experienced rock slope engineer/geologist make the determinations for the many variables that RocFall can simulate. The results of the Rockfall Analysis are shown below in Figure 8. Rockfall rated 52 ditches as having “Good” ditch effectiveness, 32 as having “Limited” ditch effectiveness, 13 as having “Moderate” ditch effectiveness, and 12 as having “Poor” ditch effectiveness.
Figure 8: Results of the Rockfall Ditch Effectiveness Analysis
RESULTS OF DITCH EFFECTIVENESS COMPARISON
ROCKFALL vs. 2007 SUBJECTIVE METHOD Fifty percent (55/110 total ditches) of the ditches evaluated with the subjective methods in 2007 matched favorably with the Rockfall analysis. Out of the remaining fifty-five ditches that did not match the Rockfall analysis ratings, 23% (25 ditches) were assigned better ditch effectiveness ratings than what the Rockfall analysis shows. 27% (30 ditches) were assigned worse ditch effectiveness ratings than what the Rockfall analysis shows. Fifteen ditches were evaluated as
52 Ditches (48%)
13 Ditches (12%)
32 Ditches (29%)
12 Ditches (11%)
RockFall % Retained Rating (109 Total Ditches)
Good Moderate Limited Poor

12
“Moderate”, while the Rockfall analysis gives a rating of “Good”. Five ditches were evaluated as “Good”, while the Rockfall analysis gives a rating of “moderate”.
ROCKFALL vs. SECTION FACTORS Fifty percent (54/107 total ditches) of the ditches evaluated with Section Factors match favorably with the Rockfall analysis. Out of the remaining fifty-three ditches that did not match the Rockfall analysis ratings, 15% (16 ditches) were assigned better ditch effectiveness ratings than what the Rockfall analysis shows. 34% (37 ditches) were assigned lower ditch effectiveness ratings than what the Rockfall analysis estimated. It is interesting to note that out of all one-hundred and twenty five total ditches measured in the field, only one ditch (# 105, Montpelier) met the Ritchie Depth requirement. This suggests that Vermont’s ditches were not designed using Ritchie Criteria. It is also interesting to note that the only reason ditches received section factors of 1 and less than 1 was because the widths for these ditches was great enough to compensate for the lack of the required Ritchie Depth.
ROCKFALL vs. RCAD Out of the seventy total ditches evaluated with the RCAD charts, 40% (28 ditches) matched the ratings assigned by the Rockfall analysis. Out of the forty-two remaining ditches that did not meet the Rockfall analysis ratings, 34% (24 ditches) were rated by RCAD as having better ditch effectiveness ratings than the Rockfall analysis estimates. Twenty-six percent (18 ditches) were rated by RCAD as having lower ditch effectiveness ratings than estimated by Rockfall analyses shows. One possible reason the RCAD study identified more ditches with better ditch effectiveness ratings is the lack of the ability to simulate launch features on slopes.
DITCH EFFECTIVENESS CONCLUSIONS The following list shows the limitations and considerations associated with each ditch effectiveness rating procedure:
Subjective Method:
• Ditch Effectiveness is measured based on the field inspector’s observations of ditch geometry, rock slope angle, and rock slope height. Different inspectors of the same site may rate a ditch as having different ditch effectiveness – ditch effectiveness is based on rater’s experience and can be subjective.
• It is often difficult to determine the difference between “Good” ditch effectiveness and “Moderate” ditch effectiveness, and between “Moderate” ditch effectiveness and “Limited ditch effectiveness”.

13
Section Factors:
• Design charts used to calculate SF value are based on the Ritchie Study which used deep, flat-bottomed, steep 1V:1.25H fore sloped ditches. These types of ditches do not meet current AASHTO roadside clear zone safety requirements.
• Ritchie Design Charts do not exceed heights greater than 130 ft. • Original Ritchie Study used “rough” production blasted slopes with numerous
launch features. This can lead to overly conservative results. RCAD:
• The design charts were made for slopes ranging from 40 ft – 80 ft. Extrapolation for heights below and above this range is possible but may result in less accurate assessments of risks.
• The RCAD study initiated rockfalls from the top of the rock slope. In reality, not all rockfalls originate from the top of slopes. Rocks that initiate from points below the maximum height of the cut may not need the entire catchment area width to achieve the same level of containment.
• The slopes used in the study lacked large launch features (although small steps left from drilling different lifts are present), - RCAD does not account for launching features on the slope.
• The rocks tested in the RCAD study were hard, durable basalt, softer rocks are expected to have shorter roll out distances and lower rebound heights.
Rockfall Analysis:
• The trajectory of the rock mass is only as accurate as the slope profile, algorithm and ditch profiles that are put into the simulation – vegetation on slope and in ditch may lead to inaccurate slope profiles and ditch profiles and therefore, create inaccurate ditch effectiveness ratings.
• Adjustments to the simulation for material properties allow the simulation to be calibrated for local geologic conditions.
A limitation associated with Section Factors, RCAD, and the Rockfall Analysis is that these methods do not consider massive rockfall events. A large volume of rock could overwhelm a ditch that has been rated as having “Good” ditch effectiveness. Only the Subjective Method takes this into account.

14
CONCLUSIONS Based on the comparison of four ditch effectiveness rating procedures and their limitations, the authors believe that rockfall simulation provides an equally appropriate and reasonably accurate method to determine the RHR ditch score. The author’s believe that, provided accurate slope profiles are used, rockfall simulation programs do a very good job accurately simulating the path a falling rock will take down each slope. It is imperative that the most accurate slope profiles and most representative ditch geometries be obtained and proper rock property variables be chosen for each simulated rockfall, and that calibration field tests are performed whenever possible. The author’s recommend using the full range of percent passing values for the RHR score to allow for more accurate evaluations of a ditches’ effectiveness where 100 points would represent no rocks were retained within the ditch while a score of 0 points would represent 100% retention within the ditch. In FHWA SA-93-057 (Rockfall Hazard Rating System Participant’s Manual), under 4.3 Scoring System, it is stated:
“When rating a slope, using the full range of points instead of only the set points listed above each column allows the rater greater flexibility in evaluating the relative impact of conditions that are extremely variable. Continuing to use only the set points, however, is not an optimal use of the system, and is not recommended.”
Vegetation on the slope limits the accuracy of the measured slope profile. Therefore, when possible, slope profiles should be taken in the fall when live vegetation is scarce. If there is some vegetation on the slope, it is up to the field inspector to decide to measure the profile or not. If the profile is measured, care should be taken to avoid tree limbs/grass/leaves that may distort the profile. Slope profile data, when returned to the office should be edited by the person who measured the profile as soon as possible, so that erroneous points caused by vegetation interference can be addressed. It is important to reiterate that the Ritchie Catchment Ditch Design Charts and the RCAD charts were created to provide guidance on the adequate width and depth requirements for a catchment ditch design. They are excellent tools to use in this sense. They are also quite valuable in estimating ditch effectiveness, however as VTrans has learned, rockfall simulation using actual measured ditch and slope geometries can provide meaningful estimates of ditch effectiveness as well. The Preliminary Survey used in the 2007 RHRS was based on subjective measures. It may be possible to use the Rockfall method of rating ditch effectiveness in the Preliminary Survey to

15
assist in determining the overall rating of the slope. However, due to the sheer number of rock slopes that would need to be evaluated (3500+ rock slopes in Vermont’s case); taking all of these measurements would be time consuming and therefore prohibitive. Perhaps future advances in slope profiling technology may allow for the cost effective profiling of all slopes. The use of new technology will further the accuracy and efficiency of the RHRS. The use of LIDAR to evaluate discontinuities within a rock mass, measure slope profiles, and measure ditch geometries (2D and 3D) will greatly improve the assessment of the geologic score and ditch effectiveness in the future (Kemeny and Turner, 2008). Further advances in understanding the effect of vegetation on rockfalls and the incorporation of vegetation in computer-based rockfall simulations will create rockfall simulations that more accurately simulate natural behavior.

16
REFERENCES Davis, Jesse W., and Shakoor, Abdul, Evaluation of the Effectiveness of Catchment Ditches Along Ohio Roadways. In Transportation Research Record: Journal of the Transportation Research Board, Geology and Properties of Earth Materials 2005, p. 196-204. Drumm, E. C., M. Mauldon, W. M. Dunne, V. C. Bateman, and B. McCarter. Rockfall Management System for Tennessee: Final Report—Phase II. Tennessee Department of Transportation, Nashville, 2005. www.tdot.state.tn.us/longrange/reports/res1189.pdf. Eliassen, T. D., and Springston, G. E., Rockfall Hazard Rating of Rock Cuts on U.S. and State Highways in Vermont, Research Project RSCH010-974, 2007, 31 p. Federal Highway Administration; 1989; Rock Slopes: Design, Excavation, Stabilization; Publication No. FHWA-TS-89-045; Turner-Fairbank Highway Research Center; McLean VA. Fish, Marc and Lane, Richard, GIS and the New Hampshire Rock Cut Management System. FHWA-NH-RD-12323V, New Hampshire Department of Transportation Bureau of Materials and Research, June 2002. Geotechnical Engineering Bureau. Rock Slope Rating Procedure, Geotechnical Engineering Manual GEM-15, Revision No.1. New York Department of Transportation, April 2007. Hopkins, Tommy C., Beckman, Tony L., Sun, Liecheng, Butcher, Barry, Highway Rock Slope Management Program, Research Report KTC-03-06/SPR-177-98-1F, Kentucky Transportation Center, College of Engineering, University of Kentucky. February 2003. Hoppe, Edward J., and Whitehouse, Derek H., Implementation of the Rock Slope Management Project at the Virginia Department of Transportation, Report No. VTRC 06-R23, Virginia Transportation Research Council, June 2006. Huang, Scott L., Darrow, Margaret M., and Calvin, Peter,. Unstable Slope Management Program: Background Research and Program Inception Phase I Final Report, Alaska State Department of Transportation, 2009. Kemeny, J. and K. Turner. 2008. Ground-Based LiDAR: Rock Slope Mapping and Assessment, Report: FHWA-CFL/TD-08-006, Federal Highway Administration Central Federal Lands Highway Division, Lakewood, CO.

17
Maerz, N.H.; Youssef, A.; Fennessey, T.W.; 2005. New Risk-Consequence Rockfall Hazard Rating System For Missouri Highways Using Digital Image Analysis, Environmental & Engineering Geoscience, Vol. XI, no. 3, pp. 229-249. Pack, Robert T., Boie, Ken, Utah Rockfall Hazards Inventory Phase I, Report No. UT – 03.01, Utah State University, Department of Civil and Environmental Engineering, April 2002. Pack, Robert T., Boie, Ken, Mather, Stoney, Farrell, Jamie, Udot Rockfall Hazard Rating System: Final Report and User’s Manual, Report No. UT – 06.07, Utah State University, Department of Civil and Environmental Engineering, January 2006. Pierson, L.A., Davis, S.A., and Van Vickle, R. Rockfall Hazard Rating System Participant’s Manual. FHWA, U.S. Department of Transportation, November 1993. Pierson, L. A., F. G. Gullixson, and R. G. Chassie. Rockfall Catchment Area Design Guide: Final Report SPR-3(032), FHWA-OR-RD-02-04. Oregon Department of Transportation , January 2002. Pierson, Lawrence A., Beckstrand, Darren L., Black, Brent A., Rockfall Hazard Classification and Mitigation System, FHWA/MT-05-011/8176, Landslide Technology for Montana Department of Transportation, September 2005. Pierson, L. A., C. F. Gullixson, and R. G. Chassie. Rockfall Catchment Area Design Guide, Final Report SPR-3(032), Oregon Department of Transportation-Research Group; FHWA, U.S. Department of Transportation, 2001. Ritchie, A. M. Evaluation of Rockfall and Its Control. In Highway Research Record 17, HRB, National Research Council, Washington, D.C., 1963, pp. 13-28. Rocscience Inc., RocFall Program, http://www.rocscience.com/products/12/RocFall Russell C. P., Santi, P., Humphrey, J. D., Modification and Statistical Analysis of the Colorado Rockfall Hazard Rating System. Colorado School of Mines, Golden.