an automatic apparatus for the determination of … · cately balanced spirometer which descends as...
TRANSCRIPT

AN AUTOMATIC APPARATUS FOR THE DETERMINATION OF OXYGEN CONSUMPTION*
BY PETER R. MORRISON
(From the Biological Laboratories, Harvard University, Cambridge)
(Received for publication, April 19, 1947)
Respirometers have been in use since the earliest days of physiology and an almost infinite variety of types have been described.’ There exists at present, however, no simple flexible apparatus which will follow the changes in oxygen consumption over any considerable period of time with- out requiring laborious attendance. This lack greatly discourages the collection of any large mass of data on oxygen consumption or the routine use of oxygen consumption as a control or as a measure of gross metabolism and thus activity.
The apparatus here described was developed for a study of oxygen con- sumption in small mammals during 24 hour periods and possesses the follow- ing attributes: (1) it is almost completely automatic, requiring attention only at 6 to 12 hour intervals; (2) oxygen consumption is measured during a succession of periods which may be as short as 5 to 10 minutes or as long as desired; (3) the amount of oxygen consumed in each measured period may be quickly changed to accomodate different sized animals or to change the length of t.he period; (4) operation, calibration, and calculation are quick and simple; (5) except for a few simply constructed parts it may be assembled from standard equipment. Its practical utility has been demonstrated in studies which have included more than 75 runs on some ten species of mammals (Morrison and Pearson (6)2). By means of this apparatus the average basal metabolism of the white mouse (Swiss strain, average weight 21 gm., acclimated to 22-24” and measured at 28.5”) was determined to be 7.5 calories per gm. hour. This compares with values of 8.3 (Benedict and Fox (7)), 7.4 (Ebeling and Corey (8)), 7.5 (Davis and van Dyke (9)), 6.8 (Bla,nk (lo)), and 7.1 calories per gm. hour (Benedict and Lee (11)) reported by other authors. Although designed for small animals and applied to a particular closed circuit system, the automatic and recording features are adaptable to any size of appa.ratus and to other types, including those modified for measurem.ent of carbon dioxide produc- tion at longer intervals.
* This study has been assisted by a grant from the Ella Sachs Plotz Foundation. 1 For descriptions of various respirometers see, for example, Krogh (l), Benedict
(24), and Brody (5). 2 Morrison, P. R., unpublished work. Pearson, 0. P., Ecology, 28, 127 (1947).
667
by guest on April 18, 2020
http://ww
w.jbc.org/
Dow
nloaded from

668 APPARATUS FOR 02 DETERMINATION
Principle
A closed system is maintained at constant pressure by means of a deli- cately balanced spirometer which descends as oxygen is consumed. The carbon dioxide produced is absorbed on soda lime in t,he chamber itself and, for small animals, convection and diffusion provide adequate cir- culation. The excursion of the spirometer is limited by two pairs of electri- cal contacts. These act through a relay system to control a gas-tight solenoid valve which is interposed between the spirometer and a reservoir of oxygen and which allows automa& refilling of the spirometer.
The sequence of events in each cycle is as follows: (1) oxygen is con- sumed, and the spirometer decends; (2) the No. 1 (lower) contacts “make,” and the solenoid valTe opens; (3) oxygen flows, and the spirometer rises; (4) the, No. 2 (upper) contacts “make,” and the solenoid vah-e closes; (5) oxygen is consumed, the spirometer descends, and the No. 2 contact’s “break.” The t.ime interval between the make of the No. 1 contacts and the break of the No. 2 pair is recorded on a moving paper st,rip. An electric timer records appropriate intervals on the same &rip. The rate of oxygen consumption for any period is computed from the volume of the spirometer between contacts and the time taken to consume this volume; i.e., from the distance between marks on the record. With successire values a continuous curye describing t’hc rate of oxygen consumption as a function of time may be plotted.
The success of t.his apparatus derives in part from the fact that, time, a quantity which is easily measured with great precision, is the dependent, variable and the volume consumed is fixed. This principle has been applied by Benedict, (2,3) to non-automatic types of respirometcrs. Lewis and Luck (12) have described an apparat.us with a similar basic principle in which an automat’ic siphon arrangement was employed to meter successive volumes of oxygen. Wert,hessen (13) has also described a quit,e elaborate automatic apparatus for this purpose which supplied oxygen electrolytically and embodied a recording ammeter.
Description
A schematic plan of the apparatus is shown in Fig. 1. The chamber and all removable connections were submerged in a large thermost.ated water bath to prevent leaks and fluctuat’ions in temperature. Under this positive water pressure any leak is immediately manifest by the presence of water inside the system. The spirometer and its bath are mounted above the large bath and may be enclosed with it for prot.ection against mechanical injury and temperature changes. Alternatively the spirometcr bath may be mounted directly in the large thermostated bath, although temperature variation here is much less important than in the chamber itself. A change
by guest on April 18, 2020
http://ww
w.jbc.org/
Dow
nloaded from

P. R. MORRISON 669
of 3” is needed to introduce a 1 per cent error, while a change of only O.l- 0.2” in the temperature of the much larger chamber during a single measur- ing period will introduce a like error.
A glass-lined brass chamber of 1 liter volume was generally used, but the dome-shaped top of a vacuum desiccator made a convenient and available substitute. The glass cover or base was sealed to the chamber with petrola- turn, Tvhich was quite satisfactory at these temperatures (up to 30”) and was much easier to remove and clean t)han stiffer lubricants. In addition to the spirometer connection another outlet was provided for sampling.
V o- P
-- - -_ - - - - - -
Fro. 1. A schematic diagram of the apparatus. The cross-hatched area represents a layer of lead to make the closed chamber heavier than water. The trap (2’) is grossly out of proportion, having an actual volume of only 10 t.o 20 cc. Oxygen enters through value 8.
This x-as conveniently done t.hrough a vaccine cap 1vit.h a hypodermic needle. The cap was connected to the outlet through a length of capillary tubing and lay near the bath surface so that samples could be taken with a minimum of disturbance and without wetting t.he sampling syringe. The bottom of the chamber was divided into t,wo concentric sections, holding layers of soda lime and wet calcium chloride respect’ively. The latter functioned to keep t.he humidity within reasonable limits. If such pro- vision is not made, mater Ivill condense and wet the animal’s fur and make it very uncomfortable. Saturated calcium chloride is in equilibrium with a relative humidity of 31 per cent at 25” (Koehler (14)) but the effective
by guest on April 18, 2020
http://ww
w.jbc.org/
Dow
nloaded from

670 APPARATUS FOR 02 DETERMINATION
humidity in the chamber is undoubtedly higher. X small trap was inter- posed between the chamber and the spirometer to catch any moisture which might condense in the connecting tubes or become lodged there through injudicious manipulation of the spirometer. The animal was separnt,ed from the absorbents by a layer of screen which allowed free circulation. Dr. I’. F. Scholander has pointed out that under these con- ditio ns ammonia may be formed from urine in the soda lime. While the soda lime might, be shielded, t.his would reduce the effective circulation in the chamber. It would appear preferable to meet this possibility by wet- ting the calcium chloride with dilute acid or buffer instead of water and thus absorb any ammonia so formed.
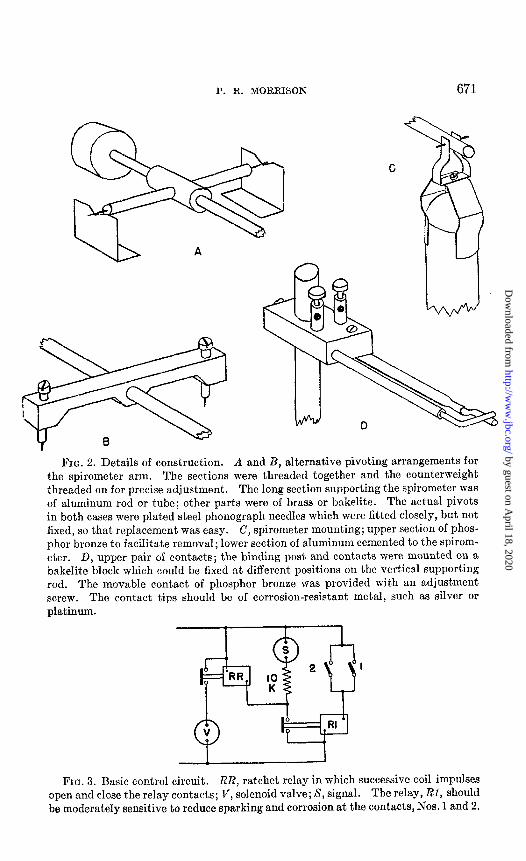
Details of the spirometer mounting and its pivots3 and of the electrical contacts are shown in Fig. 2. Aluminum cigar containers were employed as spirometers in measuring volumes smaller than 15 cc. In this situation a delicate and yet positive action was required, together lvith a mounting which produced no horizontal displacement on rotation (note Fig. 2, B). A ring of wire solder was cemented to the lower edge of the spirometer to insure vertical hanging and solutions of detergent,s (Nacconol, Turgitol, Xepherin) were used in the spirometer bath to lower the surface tension. Larger spirometers (30 to 80 cc.) were constructed of sheet aluminum. It was necessary to lacquer these spirometers to prevent electrolysis by stray currents.
The basic circuit design used in controlling the apparatus is shown in Fig. 3. The coil of a ratchet relay may be energized t.hrough a primary relay by closing either the No. 1 (bottom) or the Eo. 2 (top) pair of cont’acts. Successive closing of this circuit alternately closes and opens t.he relay contacts and thus the solenoid valve. The signal is also actuated through the primary relay. This is important, since time must be measured not merely during filling but until the No. 2 contacts open again. This frees the system from errors due to delayed closing of the solenoid va’lve; such lags have sometimes been observed in practice.
In the circuit shown in Fig. 4 this basic design was modified to per- mit the use of equipment already on hand. The rat’chet relay was replaced by two simple relays, RI and Rd, whose coils and contacts were respectively arranged in series. Once actuated through the Ko. 1 contacts, t,he circuit was self-energizing and remained closed until broken at some other point. This was accomplished through another relay, RS, on closing the No. 2 contacts; an appropriate shunt might also be used. The ratchet relay may also be replaced by a mechanical latch, electrical reset type relay couple. In this case the latch coil is connected through t.he IYo. 1 contacts and the release coil through the No. 2 contacts.
3 I am indebted to Dr. I?. F. Scholander for advice in these mechanical details and to Dr. A. C. Redfield for suggesting this convenient source of tiny spirometers.
by guest on April 18, 2020
http://ww
w.jbc.org/
Dow
nloaded from
P. 12. MORRISON 671
A
FIG. 2. Details of construction. A and B, alternative pivoting arrangements for the spirometer arm. The sections were threaded together and the counterweight threaded on for precise adjustment. The long section supporting the spirometer was of aluminum rod or tube; other parts were of brass or bakelite. The act,ual pivots in both cases were plated steel phonograph needles which were fitted closely, but not fixed, so that replacement was easy. C, spirometer mounting; upper section of phos- phor bronze to facilitate removal; lower section of aluminum cemented to the spirom- eter. D, upper pair of contacts; the binding post and contact,s were mounted on a bakelite block which could be fixed at different positions on the vertical supporting rod. The movable contact of phosphor bronze was provided with an adjustment screw. The contact tips should be of corrosion-resistant metal, such as silver or platinum.
FIG. 3. Basic control circuit. RR, ratchet relay in which successive coil impulses open and close the relay contacts; V, solenoid valve; S, signal. The relay, RI, should be moderately sensitive to reduce sparking and corrosion at the contacts, Nos. 1 and 2.
by guest on April 18, 2020
http://ww
w.jbc.org/
Dow
nloaded from

672 APPARATUS FOR 02 DETERMINAl’ION
Oxygen was supplied from a large reserve spirometer under a very low pressure (1 to 3 cm. of water) rather than directly through a reducing valve. Under these conditions leakage through the closed valve was never ob- served. At first a low voltage signal pen with its auxiliary circuit was used (Fig. 4), but this was subsequently eliminated by the use of direct recording paper4 which utilized 110 volts A.C. through a 10,000 ohm resistor. This elegant recording procedure not only simplifies the circuit (Fig. 3) but also facilitates the use of duplicate set-ups and the simultaneous re- cording of other information, such as activity, feeding, etc.
FIG. 4. Modified control circuit, with simple relays, Rl, RZ, and R3, and a low voltage signal pen, P; other symbols as in Fig. 3.
Procedure
Operation-After the animal was inserted in the chamber, a period of about an hour was allowed for the chamber and the animal to come into equilibrium. During this period the temperature and the carbon dioxide concentration approached their equilibrium values. Fig. 5 shows the appa,rent, oxygen consumption during this period as taken from the record of a flying squirrel (Glaucomys).
During the run samples of air from the chamber may be removed for analysis in the Haldane apparatus or more conveniently by the method of Scholander (15) to insure that the soda lime is absorbing properly and that oxygen is in sufficient, concentration. Because water was used in the spiromet,er baths to avoid any odor which might, disturb t,he sensitive animals under investigation, the oxygen delivered into the chamber was not pure. This diffusion of nitrogen through t,he water baths was added
4 Teledeltos recording paper (type L), used in facsimile recording instruments, is manufactured by the Western Union Telegraph Company, 60 Hudson Street, New York.
by guest on April 18, 2020
http://ww
w.jbc.org/
Dow
nloaded from

P. R. MORRISON 673
to any original impurities in the gas as supplied. Although this does not affect the calibration, over a period of hours it will lower the oxygen tension in the chamber. This may be simply met by periodic withdrawals (one to three per day) of air which is then automatically replaced by oxygen from the spirometer. The withdrawals for analysis often suffice to maintain the oxygen concentration. In practice, the volumes added have corres- ponded to an entering oxygen concentration of 98 to 99 per cent.
ii z . o SPIROMETER
5
z I 6
:: IO A.M. 10:30 II:00
FIG. 5. A record (below) and its conversion into oxygen consumption. Flying squirrel (Glaucomys), December 19. This record immediately follows the insertion of the animal into the chamber and shows a period of very intense activity followed by sleep. The broken rectangles represent consumption of one spirometer of oxygen each. Note the initial lag in the measured oxygen consumption as the system attains equilibrium. This is an extreme case and, in practice, the 1st hour is not used.
Calibration-The amount of gas delivered by the spirometer was de- termined by slowly wit’hdrawing air through the sampling tube into a syringe of appropriate size. With t.he spirometer full at the start, the syringe posit,ions corresponding to t,he break of the Ko. 2 (upper) contacts and the make of the No. 1 (lower) contacts are noted, the difference de- fining the volume. The syringe itself was calibrated by delivery of water or mercury. In converting this volume into amounts of oxygen (expressed as dry gas at 0” and 760 mm. of Hg pressure), the temperature used is that of the calibrating syringe, not, that of the chamber or spirometer, and the entering oxygen is considered to be saturated with water vapor. A spi- rometer calibrat’ion is shown in Fig. 6, which illustrates the delicacy of the tiny spirometers. During the period of free fall of the spirometer no pressure change could be observed (i.e. less than 0.2 mm. of water). After
by guest on April 18, 2020
http://ww
w.jbc.org/
Dow
nloaded from

674 APPARATUS FOR 02 DETERMINATION
the arm strikes the lower contacts, the pressure drops slightly, although the larger part of the additional volume refers to the cont,inued fall of the spirometer until the contacts made. This pressure difference introduces into the calibration a small error which is proportional to the chamber volume and to the square of the relative change in pressure (v(AP/P)‘). This error is completely negligible here, amounting to less than 0.1 c.mm. With the chamber not attached, the effective volume of the spirom- et,er was 0.1 to 0.2 cc. lower and this difference is again a function of the
TOP CONTACT- MADE
TOP CONTACT- BREAK
BOTTOM CONTACT- MAKE
W
5 EFFECTIVE SPIROMETER VOLUME = 15.0 CC
z -2
W
E 0 2 4 6 8 IO 12 14
CC VOLUME WITHDRAWN FIG. 6. Calibration of the spirometer, showing the pressure differential in the
chamber as a function of the spirometer position. The broken curve at the left with a slope of 1 cc. per cm. of water shows the volume referable to a change in pressure in a 1 liter chamber.
chamber volume and the relat,ive pressure change (v(AP/P)). Successive calibrations never differed by more than ~0.1 cc. in 10 cc. and usually gave exactly t,he same value. The spirometer was calibrated at the begin- ning and end of each experiment and routinely showed the same value, even after 50 to 100 operating cycles.
Galculaticm---A section of a record and its conversion into oxygen con- sumption mere shown in Fig. 5. The time signal showed that the recording paper was moving at uniform speed. Each of the dotted rectangles cor- responds t.o tjhe utilization of one spirometer of oxygen and all are thus of equal area. The small distances between the rectangles corresponding to time of filling the spirometer are a little exaggerated in Fig. 5 and usually
by guest on April 18, 2020
http://ww
w.jbc.org/
Dow
nloaded from

P. R. MORRISON 675
amounted to about half a minute. The length of the measured period is inversely proportional t.o the rate of oxygen consumption. This is an advantage in that measurements will ‘be more frequent while the animal is active, at, which time more rapid changes inmetabolism are expected. Since the various conditions of the experiment, the speed of t,he record, the weight of t.he animal and the volume of the spirometer, may be assembled into a single constant, f, the calculation of even a large number of periods is not too laborious. Further, the measurement on the record, a simple distance, is also simple and is only slightly dependent on subjective judgment. If the oxygen consumption in any single period is given by M = f/(mm.), then the average rate over n periods will be, M,,,. = nflZ(mm.). In converting these amounts into units of energy, the advantage of measuring oxygen consumption rather than carbon dioxide production is clear, since the caloric equivalence of the oxygen consumed is much less dependent on the respiratory quotient, varying within less than ~1.5 per cent as the latter (protein-free) varies between 0.77 and 0.88.
DISCUSSION
In designing this particular apparatus attention was given to the well being and comfort of the animal, and several features, notably the generous sized chamber and 6he absence of a pump or fan, were embodied despite a concomitant reduction in sensitivity. This is in contrast to the more usual procedure of defining the conditions of measurement with litt’le re- gard for the animal. However, in view of the close dependence of the metabolism on the degree of activity or respose, it is not unreasonable to regard the comfort of the animal as of comparable importance with the physical characteristics of the system. When this is done, it is necessary to evaluate critically the influence of design on t,he sensitivity and accuracy of the system so t.hat the proper compromise bekeen these two factors may be reached. In defining t.he proper limits of accuracy the fact that the standard deviation of metabolic measurements is of the order of 10 per cent should be borne in mind. In the apparatus described in detail here the standard deviation of minimum or basal values referable to experimental errors is estimated as 2 to 4 per cent.
One important potential source of error results from changes in the carbon dioxide concentration following a change in the metabolic rate. This is a consequence of t.he dependence of the rate of carbon dioxide absorption on t’he carbon dioxide concentration, and in a system in which a fraction of the volume is actively circulated through a ca,rbon dioxide absorber at a rate, T, the following relat.ion will hold,
pg) = (cc. CO2 per min.)
by guest on April 18, 2020
http://ww
w.jbc.org/
Dow
nloaded from

676 APPARATUS FOR 02 DETERMINATION
Because of these changes in the carbon dioxide concentration t.he measured oxygen consumption (M) will lag behind the actual oxygen consumption (A). These relations may be calculated thus, for M = A = 0 at t = 0; and 1z.g. = 1.0:
Since t,he rate of carbon dioxide absorption is the measured rate of oxygen consumption,
M %CO, -=~ r loo
But since the carbon dioxide concentration in the chamber represents the accumulated difference between production and absorption,
%COz __ = 100 s
(A - M)f
where a is t*he volume of the chamber. If these are combined,
d‘ll = c (A - M)& V
and
or ilf - = 1 - &r/a)t A
This function which is of general application to closed circuit systems has been plotted in Fig. 7 for values of r/v (the fractional circulation rate) ranging from 0.05 to 1.0 per minute. The area above each curve represents the difference between production and absorption or the increased amount of carbon dioxide in the chamber. Also shown in Fig. 7 are the average values which would be measured in finite periods of 5, 10, and 20 minutes.
In practice, this function will apply to changes in the rate of oxygen consumption from one level to another, thus, A -+ A + AA (with A = M # 0 at t = 0), and it will describe AM/AA as a function of time. Xega- tive changes or decreases in t,he rate of oxygen consumption will behav-e in the same manner as positive ones. Sudden changes in the oxygen con- sumption mill usually be caused by muscular activity and characterized by a respiratory quotient of 1 .O, but even with different values there is not too great deviat*ion from this function.5
B When the R.Q. is lower than 1.0, one fraction (1 - R.Q.) of the change in oxygen consumption will be seen immediately, while the remaining fraction (=R.Q.) follows the function above. For example, with an R.Q. of 0.80, one-fifth of the change would be manifested at once and four-fifths would follow the relations in Fig. 7.
by guest on April 18, 2020
http://ww
w.jbc.org/
Dow
nloaded from

P. R. MORRISOE; 677
It will be seen that, tfihere is a definite relation between the fractional circulation rate and the shcrtness of period which it is profitable to employ. Thus, even at the high rate of 1.0 per minute (i.e. t.he volume of the chamber circulated each minute) there is litt’le adva,nt,age in using periods shorter than 5 minutes, and at rates lower than 0.25 per minute 10 minute periods appear adequate to follow any cha.nges in the system.
Changes in the temperature of the chamber will cause a similar lag. If the heat, loss from t,he chamber is considered to follow Newton’s law of
1.0
0.8
0.6
e 5 MIN. AVE 0 10 ” ” 8 20 ” ”
TIME IN MINUTES FIG. 7. The relation between the measured oxygen consumption (M) and the actual
oxygen consumption (A) as a function of time at different fractional circulation rates. The curves are computed from the relation, M/A = l- e-(r’e)‘. The points rep- resent average values for successive finite periods and each belongs to the curve di- rectly above.
cooling with the rate of heat transfer proportional to the difference in average temperature inside and outside the chamber, then equations of the same form may be set up to describe the change in temperature with time following a change in heat production. However, a different rate constant, will apply and the volume term mill be replaced by the heat capacity of t,he system. The temperature error so introduced will be VAT/T + 273, where AT is the change in temperature during the measured period.
In the apparatus described in detail here circulation was not effected actively, but passively through convection. It seems clear, however, that
by guest on April 18, 2020
http://ww
w.jbc.org/
Dow
nloaded from

678 APPARATIJS FOR 02 DETERMINATION
under a given set of conditions the rate of absorption should again be proportional to the carbon dioxide concentration. By analogy to the apparatus with active circulation, we can calculate an effective circulation rate, r’, from t’he measured values of oxygen consumption and of carbon dioxide concentration thus,
r’= (OO.CO?permin.)/p$)= (ee.o,permin.)(R.Q.)/~~)
Such experimental values are shown in Fig. 8, together with contours representing different circulation rates. On this basis values for r’ in
f- 5 P
1.6
0.8 1.2 1.6 2.0 2.4
O2 CONSUMPTION IN CC / MIN FIG. 8. The carbon dioxide content of the chamber as a function of the rate of
oxygen consumption. The points represent individusl measured values. The con-
tours show the effective circulation rate, T = (cc. of 02 per minut.e) (R.Q.)/(per cent
CO1), calculated for an R.Q. of 0.80.
this apparatus ranged from 70 to 170 per minute and averaged 110. This corresponds to a fractional circulation rate of about 0.15. The apparent rise in oxygen consumption during a period of relatively constant activity, as is seen in. Fig. 6, reflects these changes in carbon dioxide and temper- ature. The error attributable to temperature (l-2” per cc. of O2 per minute) is about half that due to the accumulation of carbon dioxide and is in the same direction.
In certain species (e.g. the shrew, Blarina, and the bats, Myotis and Eptesicus, in which periods of intense activity alternate with longer periods of almost complete inactivity) the fall in rate of oxygen consumption after a period of activity can be analyzed and compared to the theoretical curves
by guest on April 18, 2020
http://ww
w.jbc.org/
Dow
nloaded from

P. R. MORRISON 679
in Fig. 7. This provides an independent e&mate of the fractional cir- culation rate; values so obtained ranged from 0.08 to 0.15 per minute, in general agreement with those estimated from the carbon dioxide concen- tration (Fig. 8).
The measured oxygen consumption in any given period, then, will differ from the actual rate of consumption. The size of this difference will be related to the levels in the previous periods and particularly in the one immediately preceding. In short peaks of activity considerable error can be introduced; in measuring periods of minimum activity, as for a basal metabolic rate, when the period is usually preceded by others of comparable magnitude, these errors will be small; and in measuring the average rate over a number of periods they will be negligible. These lag or accumulation errors will be added, of course, to any other errors such as calibrat,ion errors or those resulting from changes in the at,mospheric pressure.
SUMMARY
A closed circuit system for the automat,ic measurement of the rate of oxygen consumption is described. The time required to empty a small, accurately calibrated spirometer is recorded kymographically and the spirometer is refilled automatically through an electrically controlled solenoid valve. Some errors inherent in. closed circuit systems in general and their quantitative dependence on the physical characteristics of the system are discussed.
BIBLTOGRAPHY
1. Krogh, A., The respiratory exchange of animals and man, Monographs on bio- chemistry, London (1916).
2. Benedict, F. G., J. Nutr., 3, 161 (1930). 3. Benedict, F. G., and MacLeod, G., .I. Nutr., 1, 343 (1929). 4. Benedict, F. G., a.nd ltiddle, O., J. Nub., 1, 475 (1929). 5. Brody, S., Bioenergetics and growth, New York (1945). 6. Morrison, P. It., and Pearson, 0. I?., Science, 104, 287 (1946). 7. Benedict, F. G., and Fox, E. L., Arch. gee. Physiol., 231, 455 (1933). 8. Ebeling, A. H., and Corey, R. R., J. Exp. Med., 51, 41 (1930). 9. Davis, J. E., and van Dyke, IX. B., J. Biol. Chem., 95, 73 (1932); 100, 455 (1933).
10. Blank, I-I., Arch. ges. PhysioE., 234, 310 (1934). 11. Benedict, F. G., and Lee, It. C., Ann. physiol. ef physicochim. biol., 12,983 (1936). 12. Lewis, H. G., and Luck, J. M., J. Biol. Chem., 103,209 (1933). 13. Werthessen, N. T., J. Biol. Chem., 119, 233 (1937). 14. Koehler, A. E., J. Biol. Chem., 96, 67 (1932). 15. Scholander, P. F., J. Bid. Chem., 146, 159 (1942).
by guest on April 18, 2020
http://ww
w.jbc.org/
Dow
nloaded from

Peter R. MorrisonCONSUMPTION
THE DETERMINATION OF OXYGEN AN AUTOMATIC APPARATUS FOR
1947, 169:667-679.J. Biol. Chem.
http://www.jbc.org/content/169/3/667.citation
Access the most updated version of this article at
Alerts:
When a correction for this article is posted•
When this article is cited•
alerts to choose from all of JBC's e-mailClick here
tml#ref-list-1
http://www.jbc.org/content/169/3/667.citation.full.haccessed free atThis article cites 0 references, 0 of which can be
by guest on April 18, 2020
http://ww
w.jbc.org/
Dow
nloaded from