an experimental analysis of the influence of screen …...an experimental analysis of the influence...
TRANSCRIPT

An experimental analysis of the influence of screen geometry and position on the performance of trash
screens at culvert inlets.
Janice Blanc, Scott Arthur & Grant Wright
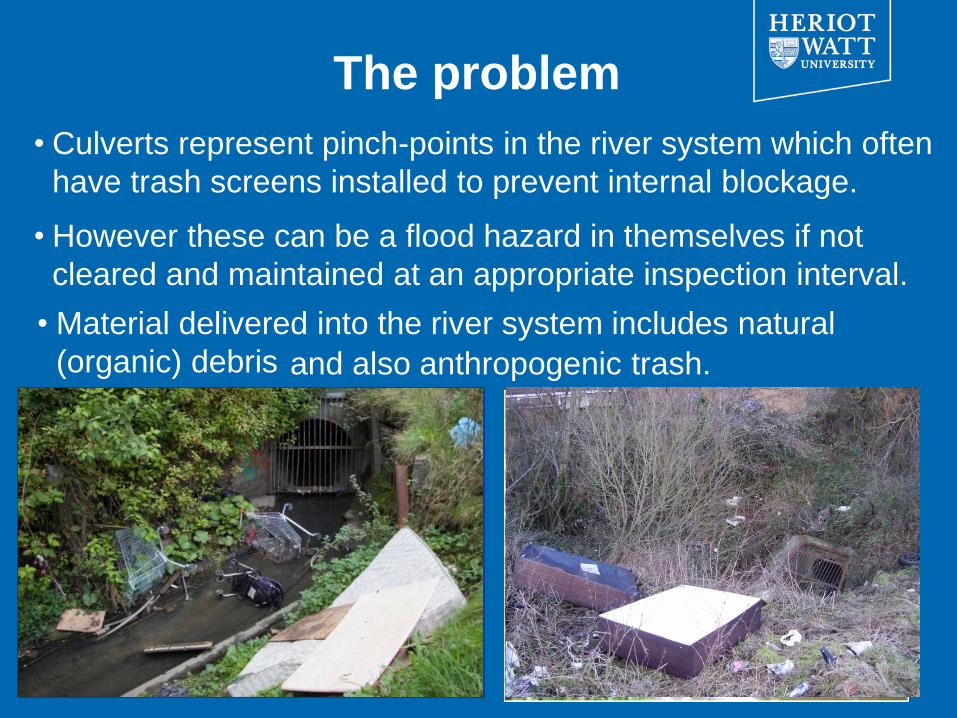
• Material delivered into the river system includes natural
(organic) debris
The problem
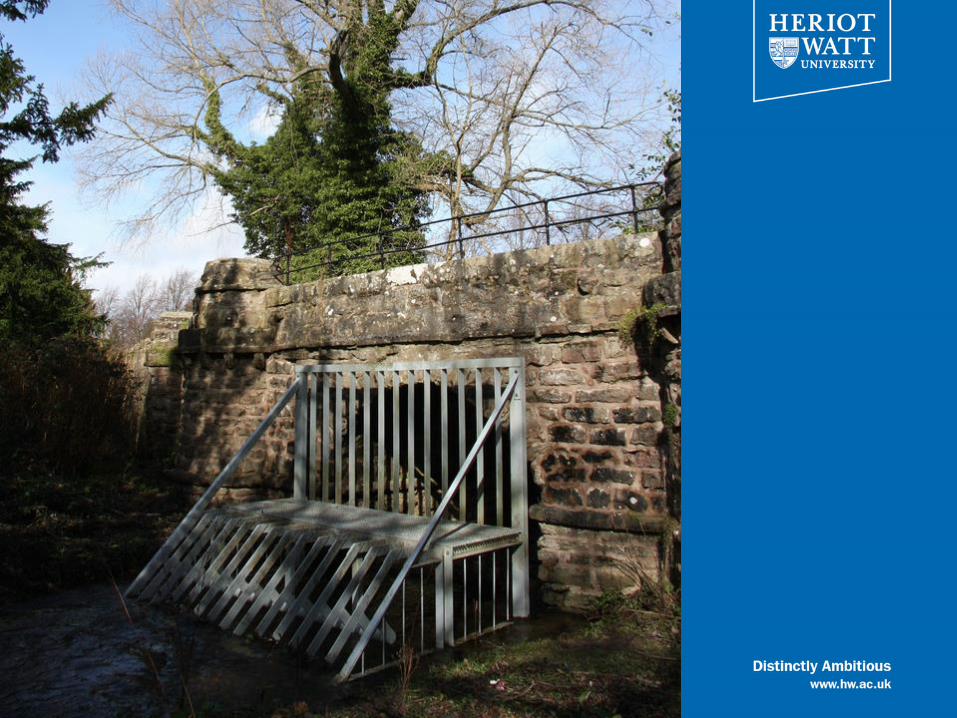
• Culverts represent pinch-points in the river system which often
have trash screens installed to prevent internal blockage.
• However these can be a flood hazard in themselves if not
cleared and maintained at an appropriate inspection interval.
and also anthropogenic trash.


Braid Burn – Edinburgh, Scotland, UK.
[5]

Debris composition – Belfast, UK.
Small
Vegetation
Domestic
Refuse
Large Household
Waste Large Non-Domestic Refuse
Large
Veg.
misc

Culvert Design and Operation
Guide
(CDOG) (CIRIA, 2010)
<commercial publication>
Current guidance
Trash and Security Screen Guide
(TSSG) (EA, 2009)
<available EA website>

Estimating blockage extent
Current best-practice methodology for estimating
potential screen blockage (CDOG and TSSG).

Field Work - Belfast

• 495 Trash Screens – Filtered to 140 with reliable data.
• Inspected on average twice per month.
• Data available: April 2002 - October 2008.
• Screen % area blocked and blockage material type
recorded.
Data-set obtained from Northern Ireland Rivers Agency for Belfast Region
Probability of Blockage at a Screen (Pb) ≈ Frequency of blockage events / # Observations
Annual frequency of
blockage varies
between <2% and
>70%
Therefore some sites
are virtually never
blocked; some are
more than likely to be
blocked
Average Annual Frequency of Blockage by Screen
Probability Equations from Empirical Analysis

Scheme for decision support
calculate SAb using
appropriate equation
compute increase in afflux
determine change in
inundation extent risk not acceptable
reduce debris load
increase
screen size
alter screen
properties A / S
calculate clear screen
area:
SAc = SAt - SAb
select screen
equation from
statistical analysis
risk not acceptable
modify screen
risk not acceptable
reduce debris load
source control risk acceptable
no action

Field Work - Edinburgh
Deonie Allen

Experiment design and methodology

Experiment design and methodology

0
10
20
30
40
50
60
1 2 3
Nu
mb
er
of
succ
ess
fully
tra
nsp
ort
ed d
eb
ris
Monitoring locations (increasing in travel distance)
Dimensions of sucessfully transported debris
150, 10
150, 15
150, 25
350, 10
350, 25
350. 15
750, 10
750, 15
750, 25
Length, Diameter
Learn more – Room 602, 8:30am on Friday

Laboratory Work
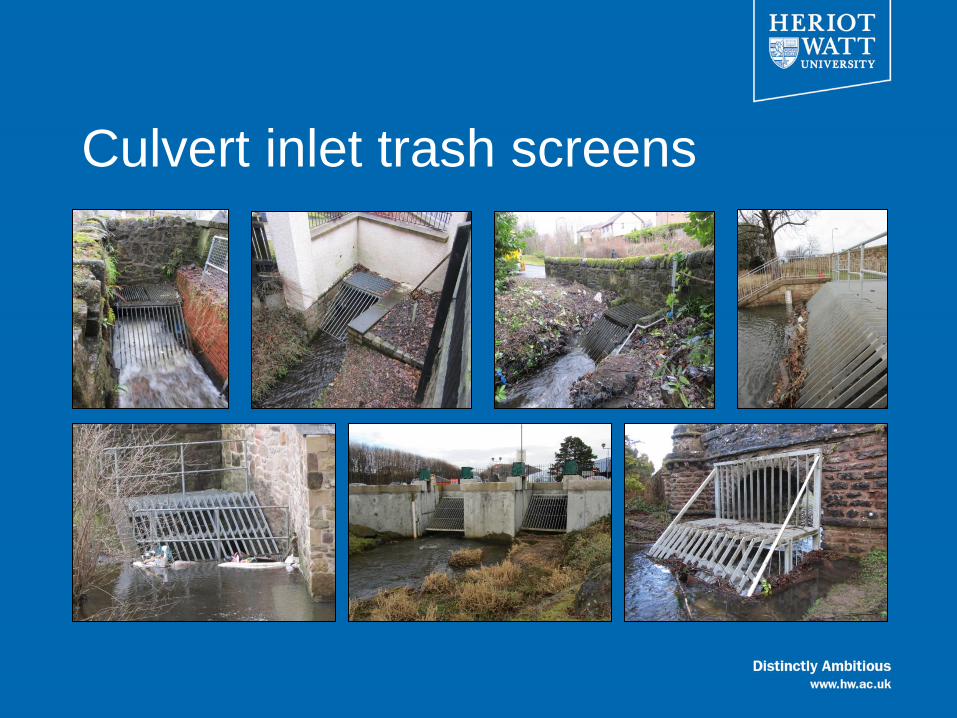
Culvert inlet trash screens

Aims of the project
• To develop a robust physical model that would allow
investigation of trash screen performance.
• To identify which structural elements have an
influence on blockage potential.
• To define blockage potential in terms of influencing
components.
• To assess the impact of the findings on current
screen design guidelines.

Physical model
• Froude scaled model of
circular culvert
• Variable trash screen
arrangement

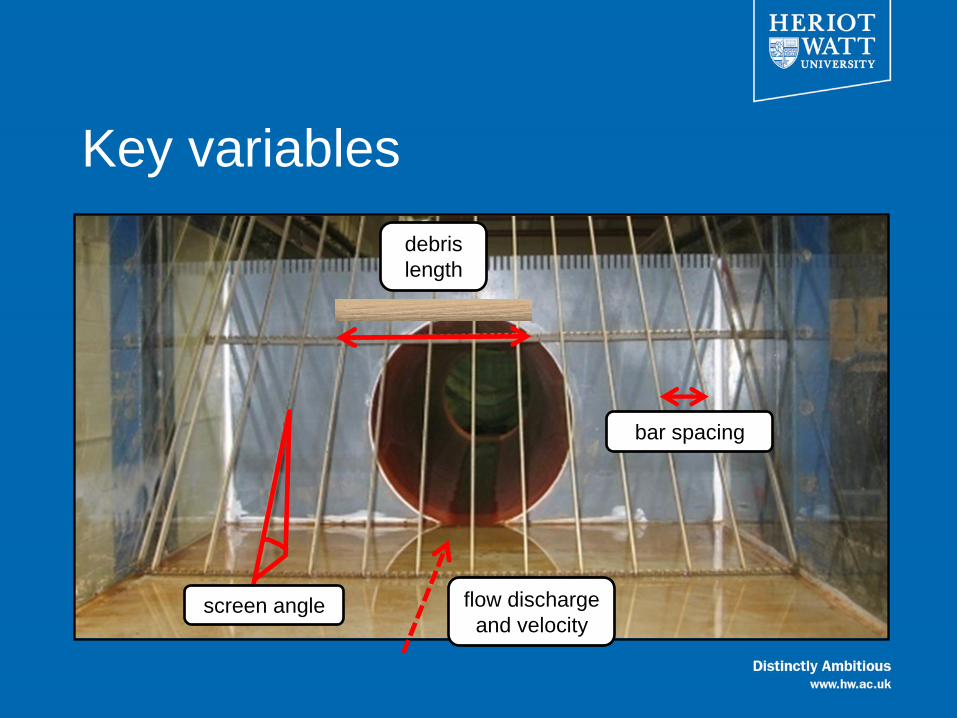
Key variables
screen angle
bar spacing
debris
length
flow discharge
and velocity

Key variables
distance of screen from culvert inlet
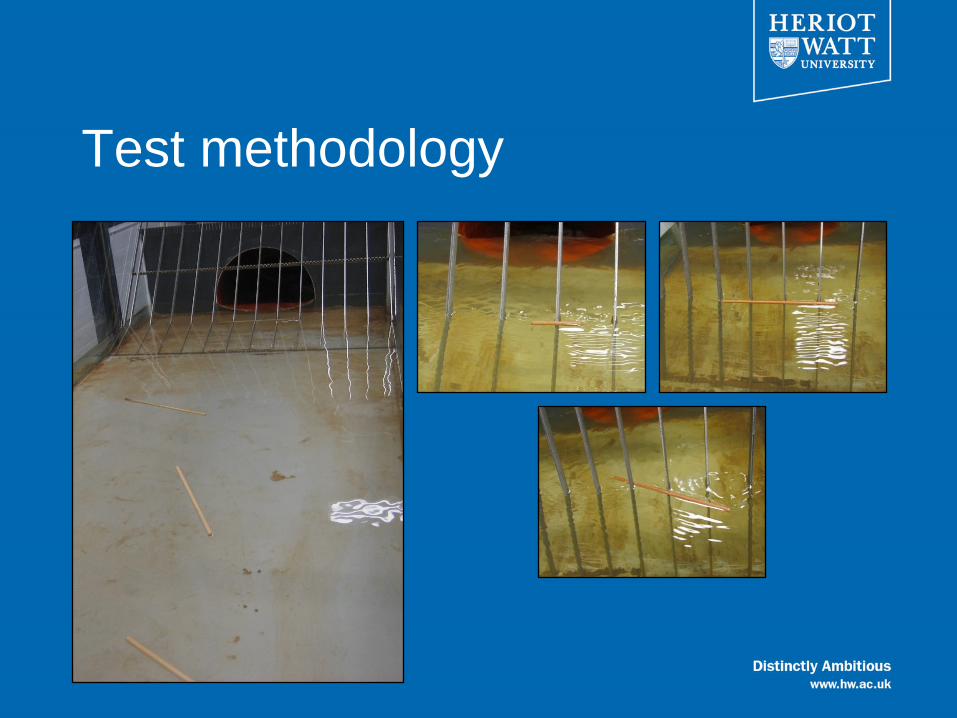
Test methodology

Main findings – bar spacing
Screen angle 60°
Discharge 0.035 m3/s
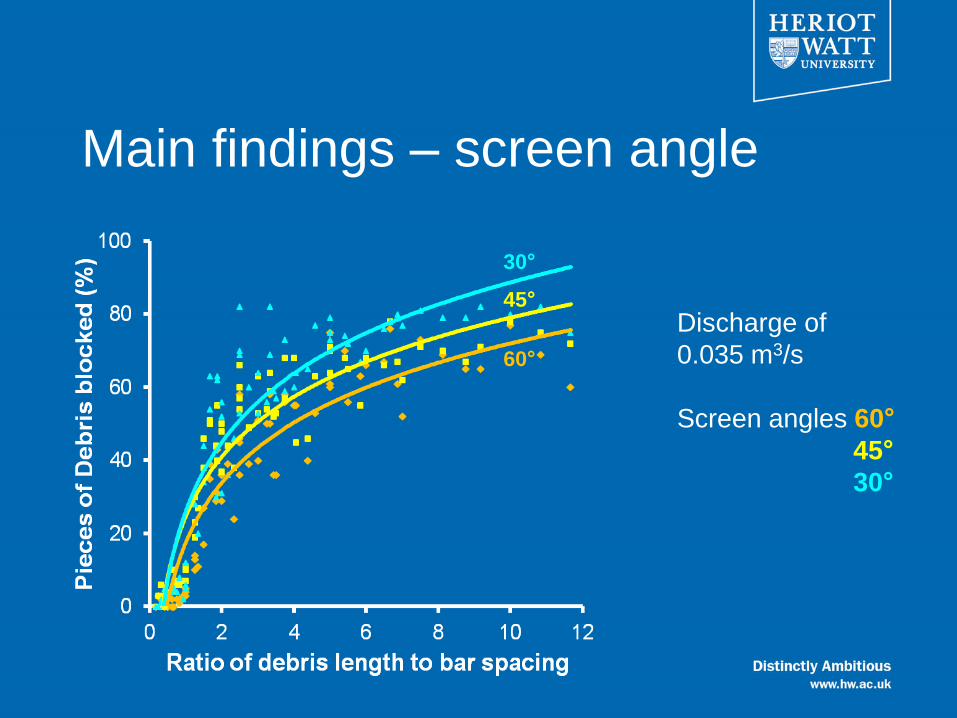
Main findings – screen angle
Discharge of
0.035 m3/s
Screen angles 60°
45°
30°
60°
30°
45°
Key variables
screen angle
bar spacing
debris
length
flow discharge
and velocity
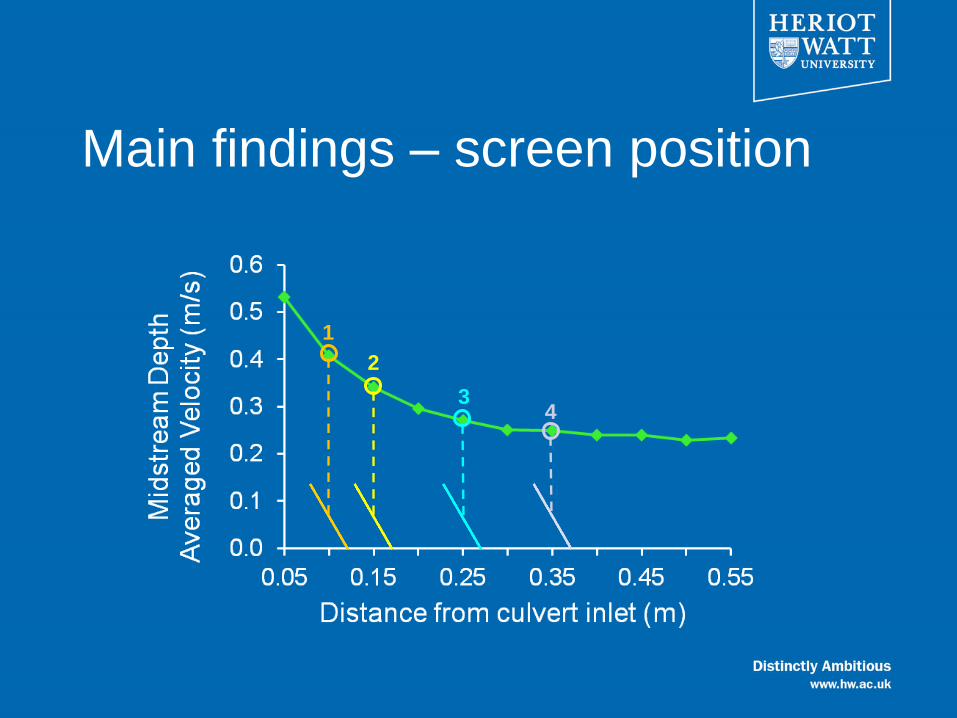
Main findings – screen position
1
3
2
4
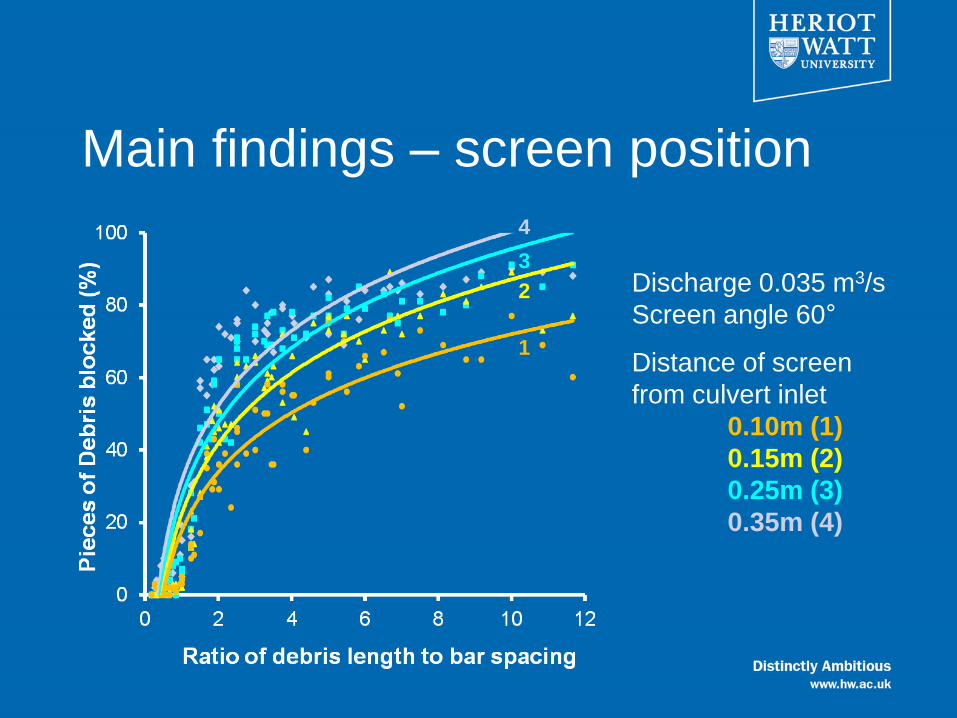
Main findings – screen position
Discharge 0.035 m3/s
Screen angle 60°
Distance of screen
from culvert inlet
0.10m (1)
0.15m (2)
0.25m (3)
0.35m (4)
1
3
2
4

Main findings Screen position
1
3
2
4
Discharge 0.035 m3/s, Screen angle 60°
Distance of screen from culvert inlet
0.10m (1), 0.15m (2)
0.25m (3), 0.35m (4)

Empirical relationship
Significant driving variables: bar spacing,
debris length,
screen position,
screen angle
Full empirical model

Simplified linear models
Offer an acceptable predictive capability
With debris length
Without debris length
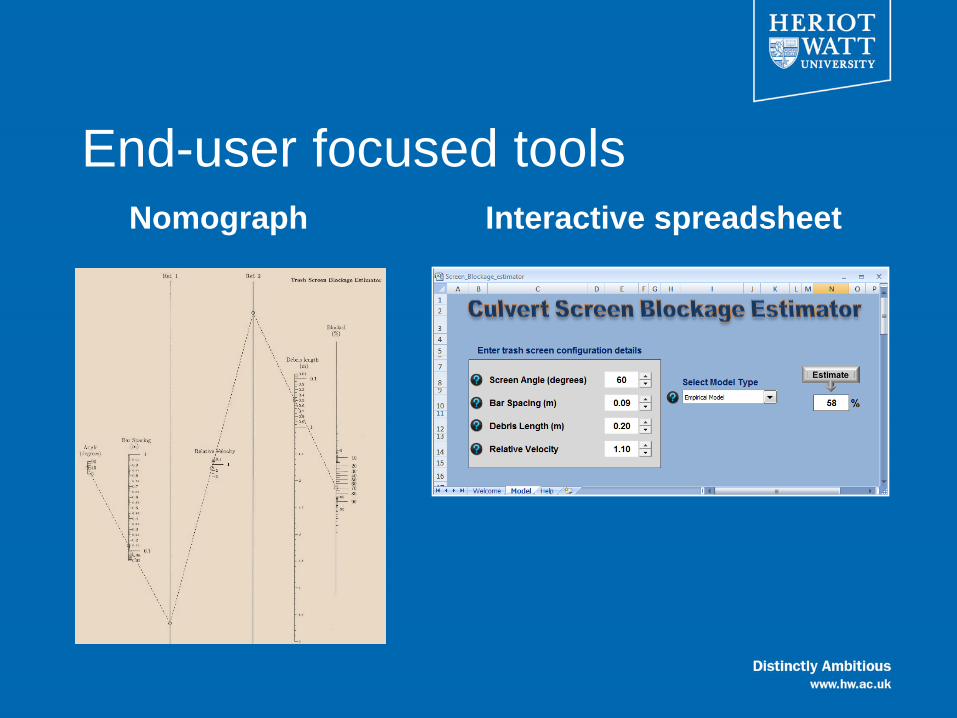
End-user focused tools Nomograph Interactive spreadsheet
An analysis of the performance of trash screens at culvert inlets
The first major experimental assessment of trash screen performance
in hydraulic conditions specific to a culvert inlet has resulted in:
• The development of a novel methodology that can be used to assess
trash screen performance
• The identification of key elements of screen design that influence
blockage by debris
• The development of empirical relationships that define blockage in terms
of contributing factors
• The development of end-user focused tools to aid estimation of blockage
For further information please contact:
Janice Blanc [email protected]

Thank You