an extensive study of slotted aloha-based rfid anti...
TRANSCRIPT

1
An Extensive Study of Slotted Aloha-Based RFIDAnti-Collision Protocols
Vinod Namboodiri‡, Maheesha DeSilva†, Kavindya Deegala†, Suresh Ramamoorthy‡
Abstract—Radio frequency identification (RFID) is used toidentify, track, and manage tagged animate or inanimate objectsautomatically using wireless communication technology. A seriousconcern faced by RFID technology is the collisions that occuramong tag responses when queried by a reader that limits systemperformance significantly. Collisions bring extra delay, a wasteof bandwidth, and extra energy consumption to the interrogationprocess of RFID. This work extensively evaluates the performanceof slotted Aloha based anti-collision protocols (that includes thecurrent standard EPCGlobal Class 1 Generation 2) for passivetags through mathematical analysis, simulations, and practicalexperiments on a testbed. This comprehensive approach allows abetter understanding of the theoretical and practical performanceof RFID systems and the challenges that exist in improvingpractical performance in industrial settings. In particular, itis found that protocol mechanisms for the current standardtheoretically add 10% overhead to the basic frame slotted Alohain ideal conditions. Further, results indicate that factors likeinterference, antenna gain, and protocol implementation canadd 50% additional delay in practical settings. This work alsoperforms a low-level investigation of protocol behavior throughpower measurements and characterizes energy consumption inRFID readers.
Index Terms—RFID, anti-collision protocols, slotted Aloha,EPCGlobal Class 1 Gen 2, performance evaluation.
I. INTRODUCTION
Radio frequency identification (RFID) is used to identify,track, and manage the tagged animate or inanimate objects au-tomatically using wireless communication technology. RFID issimilar to existing barcode identification, but it has additionalfeatures, such as communication without line of sight, largestorage capacity, greater read range, and capability of beingreprogrammable. At some point in our lives, most of us havemade a payment for goods by swiping a credit card, openeda door using a badge, or used the non-stop fast lanes on atoll road. If so, then we have already used RFID technologywithout even noticing it. Other RFID applications include,but are not limited to, supply chain tracking, animal trackingdevices, vehicle tracking, and wrist/ankle bands for infantsecurity. In short, anything that can be tagged is capable ofbeing identified using RFID.
RFID has the capability of scanning multiple objects atthe same time. This improves productivity by reducing thetime taken to identify objects. Some applications are required
‡ Affiliated to Wichita State University; can be contacted atvinod.namboodiri@@wichita.edu (Tel: 001-316-9783922 Fax: 001-316-9783984), and [email protected]
† Currently affiliated to Intel Corporation; were affiliated to WichitaState University when work was carried out. Can be contacted at [email protected], [email protected]
to have high inventory speeds. Hundreds of objects movingon a conveyor belt or applications that read tags on carson a freeway require a very high read speed. RFID has thecapability to read through opaque material without requiringline of sight, thus saving time in processing what wouldotherwise require upward-facing objects. RFID is extremelyappropriate for applications that require tags to be read at largedistances. RFID readers and tags come in various sizes andforms, thus permitting RFID technologies to be used in a broadvariety of situations.
A challenge faced in RFID technology when identifyingmultiple tags simultaneously is collisions among tag responsesto the reader’s query. Such collisions result in the reader beingunable to identify a tag and limits system performance signif-icantly. Tag collisions bring extra delay, waste of bandwidth,and extra energy consumption to the interrogation process ofRFID. Delays that arise due to collisions in RFID systemscreate significant issues and challenges to applications thatrequire a high inventory speed. Hundreds of objects movingby on a conveyor belt and applications that read tags on cars ona freeway require a very high read speed. For example, if theRFID system in a supermarket is delayed due to collisions,only a fraction of the products would be identified in aspecified time by the reader from a cart full of products. Thiscould create chaos in the inventory, bring financial losses tothe companies, and likely cause the companies to put an endto this type of technology. Therefore, RFID system designersand researchers need to analyze and simulate these differentenvironments before deployment to correctly identify variousfactors, such as the number of RFID readers needed, where toplace these readers, etc.
The specific contribution of this work is to fundamentallyunderstand the performance of frame slotted Aloha (FSA)based protocols through mathematical analysis, simulations,and an experimental testbed. Further, the current standard forpassive tags EPCGlobal Class 1 Generation 2 (C1G2) worksbased on the principle of FSA, which makes the study of suchprotocols more meaningful from a practical perspective. Ourgoal is achieved through the following steps:
1) A mathematical model is developed to predict the RFIDtag identification delay based on the frame slotted Aloha(FSA) protocol under both ideal conditions and underinterference.
2) A RFID simulator is developed to validate our analy-sis and confirm the correctness of the simulator. Thissimulator is used to compare the FSA protocol withthe current standard EPCGlobal Class 1 Generation 2(C1G2) protocol. Our results indicate the C1G2 proto-

2
col mechanisms add 10% overhead to the basic FSAprotocol in ideal conditions.
3) An experimental study is performed to calculate thetag identification delay using the C1G2 protocol. Theseresults are then compared with those obtained fromanalysis and simulations of FSA to better understand thedifferences and limitations in performances. Our resultsindicate that practical environments and their limitationscan easily add 50% additional delay in tag identification.
4) An in depth, low-level investigation of C1G2 protocolbehavior is done through power measurements of aRFID reader. These power measurements help character-ize energy consumption of RFID readers and will proveuseful in scenarios where they are battery operated.
The rest of this paper is organized as follows: Section IIprovides background on FSA and its development over theyears starting from its use in packet radio networks and how itworks for RFID. Further, we present details of the workings ofthe current EPCGlobal C1G2 standard based on FSA, and howour contribution differs from that of prior work. In Section III,we mathematically analyze FSA for RFID systems in termsof tag identification delay, under both ideal conditions andunder interfering environments. In Section IV we validate ouranalysis through simulations and compare C1G2 overhead tothat of the FSA protocol. In Section V, we study the tagidentification performance of the EPCGlobal C1G2 through anexperimental testbed and compare and contrast the results withthat of FSA obtained through our analysis and simulations. InSection VI we study the protocol behavior of a C1G2 readerthrough power measurements and quantify energy consumedto read a set of tags. We make concluding remarks in SectionVII.
II. BACKGROUND AND RELATED WORK
We begin this section by providing some background onanti-collision protocols in RFID systems and describe the FSAprotocol as it is applied in RFID systems. We conclude thissection by describing the EPCGlobal C1G2 standard, how itdiffers from the FSA protocol, and how our work differs fromthat of prior work in the area.
A. Anti-Collision Protocols for RFID
RFID anti-collision protocols can be categorized into Alohabased protocols and tree based protocols [1]. Aloha basedprotocols reduce the probability of tag collisions by spreadingout tag responses over time [2]. In the basic or pure Alohaprotocol, tags can respond at any time [3], while in slottedAloha, tags respond only at the beginning of time-slots [4], [5].The frame slotted Aloha (FSA) protocol further groups timeslots into frames within which tags must respond [6], [7]. Theframe-slotted protocol shows the best performance for RFIDsystems among Aloha based protocols due to a tag respondingin a time slot with its ID only once every frame [1]. Alohabased protocols, however, are not deterministic and do nothave analytically provable upper bounds on the time to readall tags. The simplicity of Aloha based protocols, along with
fixed size responses (which helps assign time slot durations ef-ficiently) from tags for reader queries, has led to their adoptionin early RFID based systems and associated standards (e.g.[8]). This has resulted in a fair share of work done with theseprotocols in the research community (e.g. [9], [10], [11]). Veryfew, however, have characterized these protocols completely interms of tag identification delay, including experimentally on atestbed. For example, the work in [12] experimentally studiedtag identification under interfering conditions such as in thepresence of water and metal; the goal was not on the anti-collision protocol itself, but on the impact of interference onread distance. The experimental study in [13] similarly focusedon characterizing system efficiency and reliability. The workby [14] improved tag identification rates by tuning physicallayer operating parameters. These papers did not study aspectssuch as protocol overhead, low-level protocol behavior, andenergy consumption at the reader.
Tree-based anti-collision protocols, on the other hand, pro-vide guarantees on the time required to read all tags in range,and are thus deterministic. Algorithms for arbitration usingtrees have been around for a while [2]. The authors of [15]were one of the first to consider these for reading tags inRFID systems. They analyze a B-ary tree search algorithmextensively, producing analytical results for average time slots,reader messages, and tag responses required to read tags. Thetwo most widely used tree based search protocols are theBinary Tree (BT) protocol [16] and the Query Tree (QT)protocol [17], and are based on classical collision resolutionalgorithms [18], [19]. Both schemes work by splitting tag IDsbitwise using queries from the reader until all tags are read.In the BT scheme, after a reader query, the reader announcesthe outcome: collision, identification or no-answer, based onwhich tags modify their behavior for future queries until alltags are read. The BT scheme relies on tags rememberingresults of previous inquiries by the reader which makes thetags susceptible to their power supply. The work in [20]proposes three energy-aware schemes based on a hybrid of theQT and FSA to identify tags. These schemes allow a reader toadjust protocol parameters to meet user specified identificationdelay constraints while minimizing energy consumed. A recentwork proposed a tree based protocol, BSTSA, that was shownto identify tags much faster than all known RFID protocols[21], but no known practical implementations of this protocolexist. We will, use BSTSA as a reference for comparingFSA and the C1G2 protocol later during our simulation basedevaluations.1 The paper [21] also serves as a useful guide tothe current state of anti-collision protocols.
B. Frame Slotted Aloha applied to RFID
The FSA protocol for RFID is well described in [1] andworks as follows. Each tag that needs to be read shouldhave a unique identification number. The RFID reader in thewait mode will send a Request command, and the tags
1Note that BSTSA is expected to perform better than C1G2; our goal here isto evaluate the widely deployed C1G2 standard extensively, and comparisonswith BSTSA is just another dimension of this goal. We do not proposeimprovements to C1G2 in this work.
3
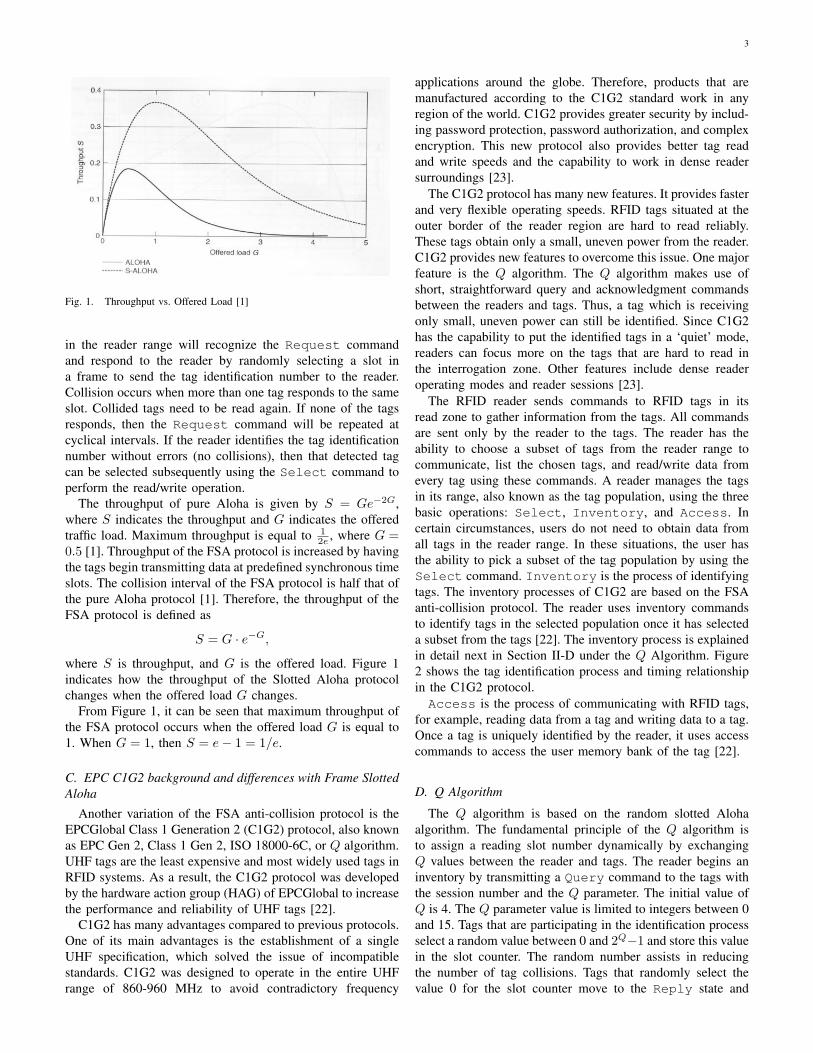
Fig. 1. Throughput vs. Offered Load [1]
in the reader range will recognize the Request commandand respond to the reader by randomly selecting a slot ina frame to send the tag identification number to the reader.Collision occurs when more than one tag responds to the sameslot. Collided tags need to be read again. If none of the tagsresponds, then the Request command will be repeated atcyclical intervals. If the reader identifies the tag identificationnumber without errors (no collisions), then that detected tagcan be selected subsequently using the Select command toperform the read/write operation.
The throughput of pure Aloha is given by S = Ge−2G,where S indicates the throughput and G indicates the offeredtraffic load. Maximum throughput is equal to 1
2e , where G =0.5 [1]. Throughput of the FSA protocol is increased by havingthe tags begin transmitting data at predefined synchronous timeslots. The collision interval of the FSA protocol is half that ofthe pure Aloha protocol [1]. Therefore, the throughput of theFSA protocol is defined as
S = G · e−G,
where S is throughput, and G is the offered load. Figure 1indicates how the throughput of the Slotted Aloha protocolchanges when the offered load G changes.
From Figure 1, it can be seen that maximum throughput ofthe FSA protocol occurs when the offered load G is equal to1. When G = 1, then S = e− 1 = 1/e.
C. EPC C1G2 background and differences with Frame SlottedAloha
Another variation of the FSA anti-collision protocol is theEPCGlobal Class 1 Generation 2 (C1G2) protocol, also knownas EPC Gen 2, Class 1 Gen 2, ISO 18000-6C, or Q algorithm.UHF tags are the least expensive and most widely used tags inRFID systems. As a result, the C1G2 protocol was developedby the hardware action group (HAG) of EPCGlobal to increasethe performance and reliability of UHF tags [22].
C1G2 has many advantages compared to previous protocols.One of its main advantages is the establishment of a singleUHF specification, which solved the issue of incompatiblestandards. C1G2 was designed to operate in the entire UHFrange of 860-960 MHz to avoid contradictory frequency
applications around the globe. Therefore, products that aremanufactured according to the C1G2 standard work in anyregion of the world. C1G2 provides greater security by includ-ing password protection, password authorization, and complexencryption. This new protocol also provides better tag readand write speeds and the capability to work in dense readersurroundings [23].
The C1G2 protocol has many new features. It provides fasterand very flexible operating speeds. RFID tags situated at theouter border of the reader region are hard to read reliably.These tags obtain only a small, uneven power from the reader.C1G2 provides new features to overcome this issue. One majorfeature is the Q algorithm. The Q algorithm makes use ofshort, straightforward query and acknowledgment commandsbetween the readers and tags. Thus, a tag which is receivingonly small, uneven power can still be identified. Since C1G2has the capability to put the identified tags in a ‘quiet’ mode,readers can focus more on the tags that are hard to read inthe interrogation zone. Other features include dense readeroperating modes and reader sessions [23].
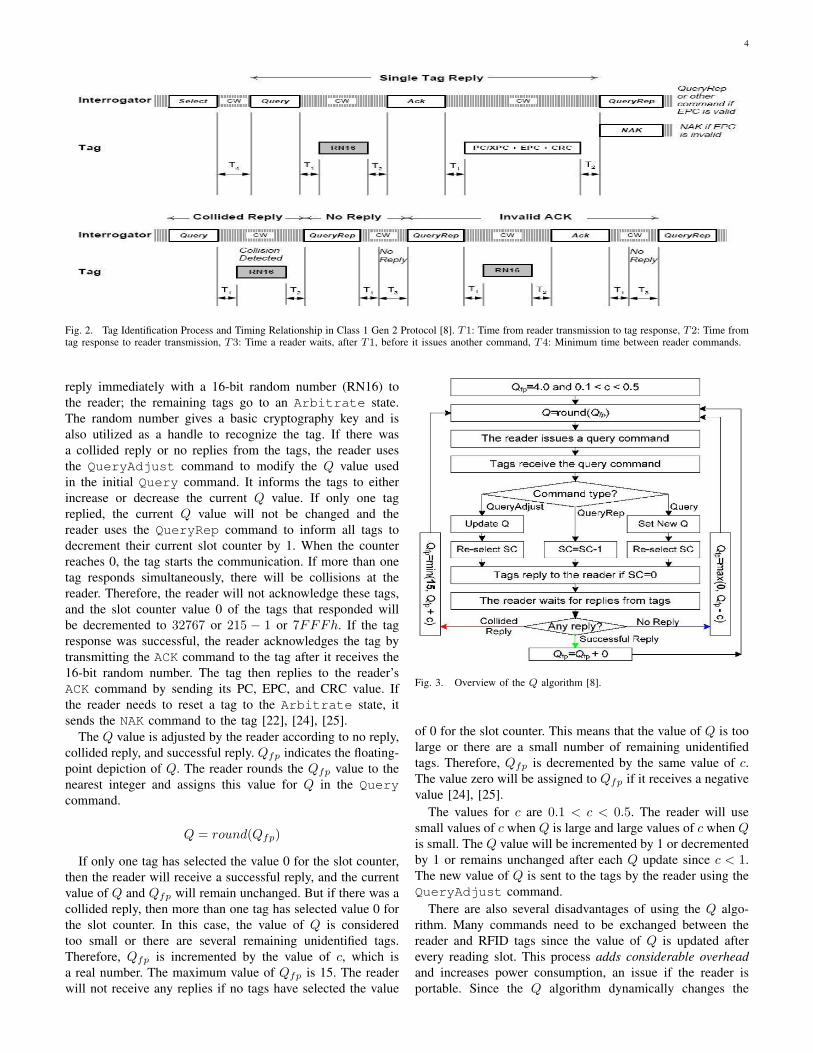
The RFID reader sends commands to RFID tags in itsread zone to gather information from the tags. All commandsare sent only by the reader to the tags. The reader has theability to choose a subset of tags from the reader range tocommunicate, list the chosen tags, and read/write data fromevery tag using these commands. A reader manages the tagsin its range, also known as the tag population, using the threebasic operations: Select, Inventory, and Access. Incertain circumstances, users do not need to obtain data fromall tags in the reader range. In these situations, the user hasthe ability to pick a subset of the tag population by using theSelect command. Inventory is the process of identifyingtags. The inventory processes of C1G2 are based on the FSAanti-collision protocol. The reader uses inventory commandsto identify tags in the selected population once it has selecteda subset from the tags [22]. The inventory process is explainedin detail next in Section II-D under the Q Algorithm. Figure2 shows the tag identification process and timing relationshipin the C1G2 protocol.Access is the process of communicating with RFID tags,
for example, reading data from a tag and writing data to a tag.Once a tag is uniquely identified by the reader, it uses accesscommands to access the user memory bank of the tag [22].
D. Q Algorithm
The Q algorithm is based on the random slotted Alohaalgorithm. The fundamental principle of the Q algorithm isto assign a reading slot number dynamically by exchangingQ values between the reader and tags. The reader begins aninventory by transmitting a Query command to the tags withthe session number and the Q parameter. The initial value ofQ is 4. The Q parameter value is limited to integers between 0and 15. Tags that are participating in the identification processselect a random value between 0 and 2Q−1 and store this valuein the slot counter. The random number assists in reducingthe number of tag collisions. Tags that randomly select thevalue 0 for the slot counter move to the Reply state and
4
Fig. 2. Tag Identification Process and Timing Relationship in Class 1 Gen 2 Protocol [8]. T1: Time from reader transmission to tag response, T2: Time fromtag response to reader transmission, T3: Time a reader waits, after T1, before it issues another command, T4: Minimum time between reader commands.
reply immediately with a 16-bit random number (RN16) tothe reader; the remaining tags go to an Arbitrate state.The random number gives a basic cryptography key and isalso utilized as a handle to recognize the tag. If there wasa collided reply or no replies from the tags, the reader usesthe QueryAdjust command to modify the Q value usedin the initial Query command. It informs the tags to eitherincrease or decrease the current Q value. If only one tagreplied, the current Q value will not be changed and thereader uses the QueryRep command to inform all tags todecrement their current slot counter by 1. When the counterreaches 0, the tag starts the communication. If more than onetag responds simultaneously, there will be collisions at thereader. Therefore, the reader will not acknowledge these tags,and the slot counter value 0 of the tags that responded willbe decremented to 32767 or 215 − 1 or 7FFFh. If the tagresponse was successful, the reader acknowledges the tag bytransmitting the ACK command to the tag after it receives the16-bit random number. The tag then replies to the reader’sACK command by sending its PC, EPC, and CRC value. Ifthe reader needs to reset a tag to the Arbitrate state, itsends the NAK command to the tag [22], [24], [25].
The Q value is adjusted by the reader according to no reply,collided reply, and successful reply. Qfp indicates the floating-point depiction of Q. The reader rounds the Qfp value to thenearest integer and assigns this value for Q in the Querycommand.
Q = round(Qfp)
If only one tag has selected the value 0 for the slot counter,then the reader will receive a successful reply, and the currentvalue of Q and Qfp will remain unchanged. But if there was acollided reply, then more than one tag has selected value 0 forthe slot counter. In this case, the value of Q is consideredtoo small or there are several remaining unidentified tags.Therefore, Qfp is incremented by the value of c, which isa real number. The maximum value of Qfp is 15. The readerwill not receive any replies if no tags have selected the value
Fig. 3. Overview of the Q algorithm [8].
of 0 for the slot counter. This means that the value of Q is toolarge or there are a small number of remaining unidentifiedtags. Therefore, Qfp is decremented by the same value of c.The value zero will be assigned to Qfp if it receives a negativevalue [24], [25].
The values for c are 0.1 < c < 0.5. The reader will usesmall values of c when Q is large and large values of c when Qis small. The Q value will be incremented by 1 or decrementedby 1 or remains unchanged after each Q update since c < 1.The new value of Q is sent to the tags by the reader using theQueryAdjust command.
There are also several disadvantages of using the Q algo-rithm. Many commands need to be exchanged between thereader and RFID tags since the value of Q is updated afterevery reading slot. This process adds considerable overheadand increases power consumption, an issue if the reader isportable. Since the Q algorithm dynamically changes the

5
reading slot number, it requires some time to converge to thebest value, and this also decreases the reading efficiency [26].
E. Our contribution
The FSA protocol for RFID has been well studied byresearchers as mentioned earlier in this section [1], [6], [9],[10], [20]. There have been some recent empirical studiesas well focusing on evaluating the performance of C1G2[12], [13], [14]. The aim of these studies was to understandthe practical performance under various interference scenar-ios, interrogation distances, and physical layer settings. Ourwork on the other hand focuses exclusively on FSA anti-collision protocol performance with the aim to understandthe differences in theory and practice. The theoretical studyallows us to quantify the impact of overhead due to real-world protocol mechanisms on comparison with our practicalstudy. The practical study on comparison with our theoreticalstudy gives insights on limitations imposed by various factorson deployment. Studying the energy consumption of readersis another important contribution that can help vendors orusers make more informed choices about battery life andlatency tradeoffs that may exist. To the best of our knowledge,energy consumption of RFID readers has never been examinedempirically though low-level power measurements.
III. MATHEMATICAL ANALYSIS OF FRAME SLOTTEDALOHA
We begin by analyzing the number of time slots requiredto read m tags in the range of a reader under ideal conditionswith no interference. Subsequently, we extend the analysis toinclude interference as a parameter.
A. Ideal Environment
It is well known that the optimal number of slots per frameto maximize the number of tags read per frame using FSAis equal to the number of tags to be read [10]. Further, thethroughput of the FSA protocol is approximately equal to1/e when the size of the frame equals the number of tagsresponding [2], [10]. So, with 1− 1/e fraction of tags in eachround remaining un-identified, in r rounds we would have(1−1/e)r−1m tags left to be identified from the initial m tags.We want to find out the number of rounds required such thatthe expected number of un-identified tags is less than or equalto 1−γ, where γ is the fraction of tags to be identified. Sincewe seek the minimum number of such rounds, we require
(1− 1/e)r−1m = (1− γ)m (1)
or
r = 1 +log(1− γ)
log(1− 1/e). (2)
By tuning γ to a large value we can approximately findthe expected number of rounds of FSA required to read alltags. Note that this value of number of rounds required isindependent of the number of tags to identify. Thus we haver = R, where R is constant for a given value of γ.
The number of time slots needed to read all tags m in therange of the reader then is simply the sum of un-identifiedtags (or frame size) per round
t(m) =r∑
j=0
m(1− 1/e)j = mR∑
j=0
(1− 1/e)j (3)
For γ = 0.99, the value of R = 10 and the time to read mtags using Equation 3 is 2.685m ≈ e · m. This can also beobtained from the fact that for large γ, R is large which makes∑R
j=0(1− 1/e)j = 1−(1−1/e)R+1
1−1+1/e = e[1− (1− 1/e)R+1] ≈ e.This results in the following lemma:
Lemma 3.1: To read m tags, a reader needs e ·m time slotswith FSA.
B. Interfering Environment
Many tag identification environments are far from ideal.For example, it is well known that presence of water in theidentification area results in many tag responses to be not readby the reader [27]. To take into account the identification delayunder such varying conditions, we introduce a parameter q thatsignifies the probability that any single response is interferedwith and is corrupted when it reaches the receiver.
Again, building on the results of II-B, the throughput perslot for FSA will be when interference is considered is
S = (1− q)Ge−G,
for which we attain maximum throughput for G = 1 equal to(1 − q)/e. Thus, the number of tags un-identified after eachround is m(1 − (1 − q)/e). Analyzing as above for the caseof no interference, we can arrive at the following lemma:
Lemma 3.2: To read m tags considering an interferenceparameter q, a reader needs e
1−q ·m time slots with FSA.
IV. FRAME SLOTTED ALOHA AND C1G2 EVALUATIONSTHROUGH SIMULATIONS
In this section we present results of evaluations of theFSA and C1G2 protocols through simulations. As the C1G2protocol process is fairly complex with many mechanisms, itis more amenable to simulations than mathematical analysis.Thus, in order to compare C1G2 performance to FSA, weincorporated both into our simulator. Our analysis of FSA inSection III will help validate the results of our simulator andvice-versa.
A. Simulation Framework
Our simulator, built using MATLAB (Figure 4), allows theuser to enter the total number of tags that need to be read andthe RFID reader adjusts the number of time slots dependingon the number of RFID tags that must be identified. This willmake the size of the frame equal to the total number of tagsthat must be identified. The simulation will run until all RFIDtags are read successfully.
Tags randomly select a slot to respond to the RFID readerquery. If more than one tag responds to the same time slot,there will be a collision at the reader. As a result, thesecollided tags will not be identified and must be read again.

6
Fig. 4. Our RFID Simulator that allows selection among C1G2 and FSAprotocol and calculates tag identification delay.
0 50 100 150 200 250 300 350 400 450 5000
200
400
600
800
1000
1200
1400
Number of Tags
Tota
l Tim
e (m
s)
Comparison between analytical result and simulator of FSA
AnalyticalSimulator
Fig. 5. Tag identification time with FSA protocol. The results from thesimulator match those of our mathematical analysis well.
The simulator allowed consideration of user-specified valuesof interference, q where each tag response is interfered withthis probability.
B. Simulation Setup
Simulations were run for upto 500 tags in steps of 50. Thesimulator ran each scenario 1000 times with the average valueused as the data point in Figure 4. The slot time was taken as 1ms (corresponding to a data rate of 100 Kbps and 96 bit IDs)for FSA simulations as well C1G2 simulations to allow directcomparison. In practice, slot duration depends on frequency ofcommunication and size of tag ID bitstring. Further, slot timesare variable depending on whether the slot results in a singlesuccessful tag reply or a collision, or ends up being idle. Wewill study the C1G2 protocol with varying slot durations (anda different channel data rate) in Section V when we obtainresults from our experimental testbed.
C. Results for Frame Slotted Aloha
We will consider two cases under the evaluation of FSA,just like we did for our mathematical analysis in Section III:the case with no interference, and the case with interference.
0 10 20 30 40 50 60 70 80 90 1000
100
200
300
400
500
600
Number of Tags
Tota
l Tim
e (m
s)
Identification time with FSA for varying interference levels
q = 0q = 0.05q = 0.1q = 0.25q = 0.5
Fig. 6. Tag identification for FSA using the simulator taking into accountvarying levels of interference.
Ideal, no interference CaseFigure 5 shows the results where the simulation results forvarying number of tags are compared to our analytical model.From Figure 5, the time needed to read m tags can be modeledusing curve fitting techniques as:
t(m) = 2.7006m (4)
As the numeric value of e is equal to 2.71828, our simula-tion results closely match that of the analytical model’s resultsof Lemma 3.1.
Interference caseHere we present results of the FSA protocol when interferenceis present. The simulator allows the user to enter the numberof tags m that need to be read and a probability of interferenceq. Figure 6 shows the values obtained from the simulator forvarious levels of interference. Curve-fitting techniques againshow that time needed to read tags under the interferencescenario closely matches our analytical result in the previoussection of t(m) = e
1−qm.
D. Results for C1G2
The performance of the C1G2 protocol was evaluated usingsimulations to compare against the results of FSA. Two sce-narios were used. The first scenario identifies the delay for tagidentification when the RFID reader knows the total number oftags in the range beforehand. In this case the simulation willrun until all the RFID tags are read successfully. The secondscenario identifies the delay when the RFID reader does notknow the total number of tags in the range beforehand. In thiscase the simulator relies on the value of Q reaching zero withno further replies arriving from tags, indicating that all thetags were read successfully.
The simulation was run for upto 500 tags in incrementsof 50, and each simulation scenario was run 1000 times,and the mean value presented as the data value in our plots.Simulations were run with two different slot times. To comparethe simulation results with the FSA, the same slot duration of1 ms was used. We also compare FSA and C1G2 performancewith a recent tree-based anti-collision protocol called BSTSA

7
0 50 100 150 200 250 300 350 400 450 5000
500
1000
1500
Number of Tags
Tota
l Tim
e (m
s)FSA and C1G2 using the RFID Simulator and reference protocol BSTSA
FSABSTSAClass1 Gen2, Tags Known, C=0.2Class1 Gen2, Tags Known, C=0.3Class1 Gen2, Tags Known, C=0.4Class1 Gen2, Tags Unknown, C=0.2Class1 Gen2, Tags Unknown, C=0.3Class1 Gen2, Tags Unknown, C=0.4
Fig. 7. Tag identification time using C1G2 protocol through simulations withthe assumption of each slot duration to be 1 ms.
[21] that was shown to perform better than a range of otherprotocols, though not in practical scenarios.2
The results in Figure 7 show a linear relationship betweennumber of tags and identification time for the C1G2 protocol,with a relationship of t(m) = 3m. This signifies that the C1G2protocol adds about 3−e
e ×100 = 10.7 % overhead to the basicFSA protocol. This overhead, as also briefly mentioned in [28]but without any evaluation, is mainly due to the restriction ofa frame size to be a multiple of two in C1G2. We find littledifference in results (only a few time slots) between scenarioswhere the cardinality of tags is known versus unknown; thisindicates that the Q algorithm does a good job in estimatingtag population through the tag reading process. Interestingly,the value of c does not seem to make any significant impacton tag identification time. The reference protocol BSTSA , asexpected, performs much better than FSA or C1G2. HoweverBSTSA (a tree-based protocol), as mentioned before, is notoptimized for practical settings and will not be as simpleto implement as FSA or C1G2 with no known experimentalprototype.
V. EXPERIMENTS ON A RFID TESTBED
An experimental study was performed to calculate theRFID tag identification delay using a testbed. In this sectionwe describe our experimental setup, discuss our results, andcompute the additional delay introduced in practical settingscompared to our idealized simulations of Section IV.
A. Experimental Setup
We used the SkyeTek SkyeModule M9 Compact FlashRFID reader that has an 860-960 MHz carrier frequency anda tag communication rate (data rate) of 40 KHz or 40kbps,which is the subcarrier frequency since it uses FM0 basebandas the encoding format for the response-to-reader commands[29]. The inventory or the anti-collision mode of the readerwas used to calculate the delay for tag identification. Thereader chooses all RFID tags in the discovery area until a newRFID tag is found in the area or until the inventory process
2Note that we had to transform BSTSA’s identification time based on our 1ms slot duration for direct comparison; the original results in [21] were basedon channel with a slower data rate corresponding to a slot size of 2.5ms.
� �
������������
����������������������
������������������������������ �������
! � ����
"�#�����
��$$��������
%����&�'�������
�����%����&�'�
�������$����
! �(����)
Fig. 8. Our basic RFID experimental testbed setup.
Fig. 9. Our RFID experimental testbed setup to read large number of tags.A vertical board with tags sticking to it was used.
times out. Our tag placement for a small number of tags is asshown in Figure 8 where tags are in contact with the antenna.For larger number of tags we adopted a vertical flat boardplacement 1 feet away as shown in Figure 9. The flat boardplacement maximizes the surface area for reader signals to falldirectly onto tags without overlaps.
The SkyeTek SkyeModule M9 Compact Flash RFIDreader’s Command Retry system parameter controls howmany times the operation is repeated. This parameter canbe increased to improve reliability and affects the amount oftime the operation takes, which is the timeout value of theinventory. The Command Retry value states the number oftimes a tag command is executed internally in the reader beforeresponding with a failure response. The command is repeatedinternally for the number of times specified, unless there isa successful response. When a successful response occurs,the reader stops repeating the command and sends a successresponse back to the user. SkyeTek suggests setting the Com-mand Retry system parameter to approximately double thenumber of expected tags in the area to optimize the inventoryprocess. But this increases the inventory time unnecessarilysince the time that the reader takes before sending a failuremessage, when a failure occurs, gets increased. Therefore, toreduce unnecessary inventory time, the Command Retry timewas decreased until the shortest time was found, at which thereader could identify all tags in the field.
Random frequency hopping was used for the frequency hop-

8
0 10 20 30 400
200
400
600
800
1000
Number of Tags
Tota
l Tim
e (m
s)Comparison of results from RFID Testbed and RFID Simulator
Testbed27dBmTestbed26dBmTestbed25dBmTestbed24dBmC1G2 with q = 0C1G2 with q = 0.5
Fig. 10. Tag identification time using C1G2 protocol in our testbed. Acomparison with the time for identification by our simulator is shown aswell.
ping sequence since it improves reader performance by issuingthe commands on different frequencies. For the experimentalstudy, a maximum of 40 RFID tags was identified by using thetestbed. This was due to the limitations with the power leveland the receive sensitivity of the SkyeTek M9 RFID reader.
To compare the simulation results with those of the exper-imental results, the slot durations have to be comparable. Wecomputed the slot durations to be used in the simulator usingFigure 2; the slot time to identify a single tag reply is 8 ms,a collided tag reply is 1.90 ms, and idle slot with no reply is0.61 ms.
B. Results and discussionIn Figure 10 we compare the time to identify tags experi-
mentally on our testbed with that of the C1G2 simulator. Thesetestbed experiments were repeated three times with the meanvalues shown. The standard deviation was too small (less than2 ms) to be of significance and hence was omitted in theplots. The transmit power of the reader was varied from 24 to27 dBm, in steps of 1 dBm. For the simulator, we looked atthe ideal case with no interference, and also at the case withinterference q = 0.5. The goal of looking at these two valuesof interference was to better understand where the empiricalperformance lay in comparison to these bounds. We assumedfor these experiments that the number of tags were unknownto the reader and a value of c = 0.2 was used; as seen in theprevious section, the value of c does not seem to make muchimpact on tag identification time.
According to Figure 10, higher transmit powers at the readertake less time to identify tags, the difference becoming moreapparent with greater number of tags to read. Greater strengthof reader’s signal at tags makes their response stronger,increasing the likelihood of identification. We can observe thatour empirical results are closer to those of the simulator withq = 0.5 implying that in practice, interference of tag responsesis a significant component in the delay to identify tags. Thereis a big discrepancy for tag identification times for 0 tags inour plot as empirically it takes more time to determine if atag exists in the field, requiring repeated reader queries.3
3This information has been adjusted into our simulator now; Figure 10 usedresults before the adjustment so that we could discuss this change.
C. Lessons from Empirical Experiments and Limitations ofSimulator
Though we abstracted out the difference in tag identificationtime between the empirical and simulation experiments as dueto interference, there are other factors like antenna gain andprotocol overhead to consider to improve performance. Thesefactors are somewhat difficult to quantify, and seem to vary.We believe that instead of the term interference, we couldcollectively term all these effects (including interference)that add delay over idealized simulation results as ‘practicaloverhead’. We list these factors here so that readers can learnfrom our experiences. The next sub-section will quantify theimpact of this overhead as opposed to an idealized scenario.
1) Antenna Gain: Antenna cable length is a cause fordelay in the RFID testbed. The antenna cable gain/loss isapproximately -0.49 dB per meter, or -0.15 dB per foot, for astandard RG58 coaxial cable. The antenna polarization willalso change the practical tag read time. A linear antennawill add range but requires that the tag is in a specificorientation to the antenna before the reader can detect the tag.A circular polarized antenna in general has less range, but itallows orienting the tag to the antenna in multiple ways. Ourexperiments used an antenna cable of length 1 feet, and anantenna of the circular polarized type.
2) Protocol Overhead: Even though SkyeTek uses theC1G2 protocol to communicate between the reader and tag,it uses SkyeTek specific messages to communicate betweenthe common blade interface board and PC, which in turn addsadditional delay. As mentioned in section 5.2, the SkyeTekspecific Command Retry parameter changes the timeout valueof the RFID reader, which consequently adds more delay tothe RFID testbed tag read time. The commands issued by theRFID reader also seems to have an impact. Depending on thesituation, the reader might select Query, QueryAdjust, orQueryRep on all the queries during the inventory except forthe initial query which will be the command query. Further,tags do not reply as soon as they receive a command from thereader. Tags take some time to change their state, encode data,and backscatter the reply. The rise time, settling time, and falltime of RFID tags also adds delay in practical situations. Priorto inventory, the RFID reader goes through a Select round,which we have not modeled in the simulator. The simulatoralso does not take into account invalid ACKs and invalidRN16s sent by the RFID tags. In practical situations theseinvalid ACKs and invalid RN16s will occur and add moredelay to tag identification time.
D. Comparison with results from simulator
Using curve-fitting of our experimental results, we canmodel our testbed based identification delay for the transmitpower setting of 27 dBm as t(m) = 19m, whereas thecomparable simulation results without interference can bemodeled as t(m) = 10m. Note that these identification delayscannot be compared to our results in Sections III and IV asthe latter were based on constant slot duration fixed at 1 ms;here we are considering non-constant slot durations based onC1G2 protocol mechanisms as explained in Section V-A.

9
If we denote q′ to be probability that the communicationbetween reader and tag is impacted due to a combinationof the factors mentioned above, we estimate q′ by using anexpression of form similar to that in Lemma 3.2, and settingit equal to the observed results from the 27dBm setting in ourtestbed:
10
1− q′m = 19m
giving q′ = 9/19 = 0.474. Thus, impact of interference,antenna gain, and protocol implementation can easily addup to 50% more delay in an actual deployment compared tosimulations of the ideal case of C1G2.
VI. INVESTIGATION OF PROTOCOL BEHAVIOR ANDREADER ENERGY CONSUMPTION
After having explored the tag identification performance ofFSA and C1G2 through a combination of analysis, simula-tions, and empirical measurements, we next turn our attentionto a deeper investigation of protocol behavior and energyconsumption RFID readers using the C1G2 protocol. Readerscome in a variety of form factors these days, which includeshandheld devices and as modules for a smart phone. In suchportable scenarios, battery life is often limited and energyconsumed during the tag identification process becomes im-portant to consider. In prior work in [20], three energy-awareanti-collision protocols based on a tree-based approach wereproposed. Those protocols were never implemented,and henceno practical measurements of power and energy consumptionwere made. As C1G2 is very commonly used, we believe thata measurement of the power and energy consumed by thereader when identifying tags will be an additional interestingcontribution of this work. Such a low-level study also providesuseful insights on protocol operation and timing.
A. Power Measurement Methodology
The circuit and methodology used to measure power con-sumption of the reader is similar to that in [30]. Powerconsumption of a reader is calculated by measuring the voltage(a constant 3.3 Volts) and the current they draw from thesource. In order to measure the current to the card, a 1 ohmresistor is added in series to the supply and the voltage dropacross the resistor is measured using a Tektronix 350MHzdigital oscilloscope.4 As we used a 1 ohm resistor, the voltagedrop across the resistor equals the current drawn by the reader.
B. Investigation of Protocol Behavior
We started our experiment by placing a single tag in thereaders vicinity and then issued a Select Tag command withinventory flag turned on5. Figure 2 depicts the reader queryand tag response sequence including the frame format andwhat to expect from a single tag reply to a readers query. Thecorresponding power pattern is shown in the Figure 11.
4This oscilloscope does not support continuous recording and replaying. Sowe also we made use of Labview software from National Instruments.
5The select command was issued from application software
Fig. 11. Inventory of single tag. Measured peak current levels are also shownthat can be used to calculating power consumption.
Figure 11 shows the energy pattern of a Query cycle (Q =4) with single tag in vicinity. In all our experiments we used aselect command to select the ISO 18000-6C tags (C1G2 tags).As per the C1G2 standard, the reader issues a query commandand then transmits a continuous wave for the tags to power upand respond. The figure shows how the reader used two queryrounds when identifying tags. The same tag is read in bothrounds, with a inventory flag switched after it is identified inone round. Inventory flags, as specified in the C1G2 standard,are useful when tags fall within the interrogation range ofmultiple readers [8]. However, such multiple rounds can addto the identification delay and energy. This can add additionaloverhead and is another factor that should be included withprotocol overhead as discussed in Section V-C.
From Figure 11, we were not able to differentiate thecommand and the continuous wave, so we also captured theRFID reader’s antenna output. Figure 12, shows two differentwaveform patterns. The waveform on the top is the outputsignal measured at the RFID reader antenna and the otherwaveform is the power consumption of the whole readersystem. Both waveforms are captured using different channelin an oscilloscope, so they share a common time domain.From the RFID reader antenna waveform we were able todifferentiate the continuous wave and the commands that arebeing issued. In Figure 12 top portion (antenna waveform),the continuous wave is seen as a straight line and the issuedcommands are represented as spikes. The reception of a packetat the reader is identified by the larger time period for whichthe reader transmits the continuous wave for tags to respond.It is interesting to observe that the reader system consumesmore power when it is transmitting the continuous wave thancommands, though the antenna power levels show otherwise.This implies that during transmission of the continuous wave,the reader communication sub-system consumes more power.The only possible explanation is that, during transmission ofthe continuous wave, the system has to turn on the receiveralong with directional couplers. The RFID system is quiteaware that the only possible time period at which a reply cancome is during the transmission of continuous wave. So itpossibly turns off the receiver at other time periods and turnit on during transmission of the continuous wave.

10
Fig. 12. Reader power consumption during inventory of a single tagalong with reader antenna output (shown on top). Region A representstime period for Select command and Query command. Region B and Crepresent the time period in which the reader transmits the continuous waveand expects a participating tag to reply. Region D represents the time periodfor query repeat command. Region E again represents the time period forwhich the reader transmits the continuous wave and it is in this periodthe participating tag replied (in this instance) with its bit random number(RN). Region F represents the time period in which the reader transmits theacknowledgement. Region G represents the time period in which the readertransmits a continuous wave and the tags replies with its identity (followingthe RN16 sent during Region E).
Fig. 13. Inventory of four tags over two cycles.
Figure 13 represents the power pattern for inventorying fourtags. All four were read in the first cycle, with only three readin the second cycle. We saw no collisions, and assume thefourth tag never responded in the second cycle.
Figure 14 depicts a scenario with collisions in reading 7tags. In the scenario, multiple tags select slot 15 after a QueryRepeat and thereby their replies cause a collision at thatslot. The reader tries to resolve the collision by sending anacknowledgement with the corrupted 16 bit random number itreceived. As this 16 bit random number does not match withany of the tags that participated in colliding slot, there wasno reply from the tags. Then reader transmits a Query Repeatrepeat and moves to the next slot.
C. Energy Consumption of Reader
We begin by keeping the reader fixed at a transmit powerlevel of 27 dBm and vary the tag population size. Figure15 shows the energy consumed as a function of number oftags. A quadratic equation e(m) = p1 · x2 + p2 · x + p3with constants (p1 = −11.18 × 10⁻⁵, p2 = 11.22 × 10⁻³,p3 = 5.48 × 10⁻²) models this pattern very well, as verifiedby curve fitting techniques. This model would be very usefulin estimating energy consumption of readers in scenarios thathave tag populations of the magnitude considered here. Further
Fig. 14. Inventory of seven tags over two cycles.
0 5 10 15 20 25 30 35 400.05
0.1
0.15
0.2
0.25
0.3
0.35
0.4
Number of Tags
Ener
gy (µ
W−s
ec)
Energy Consumed for Varying Tag Populations
Fig. 15. Energy consumed by the reader (set at transmit power level 27dBm) to identify varying number of tags.
work would be required for larger tag populations to see if thesame model can be applied.
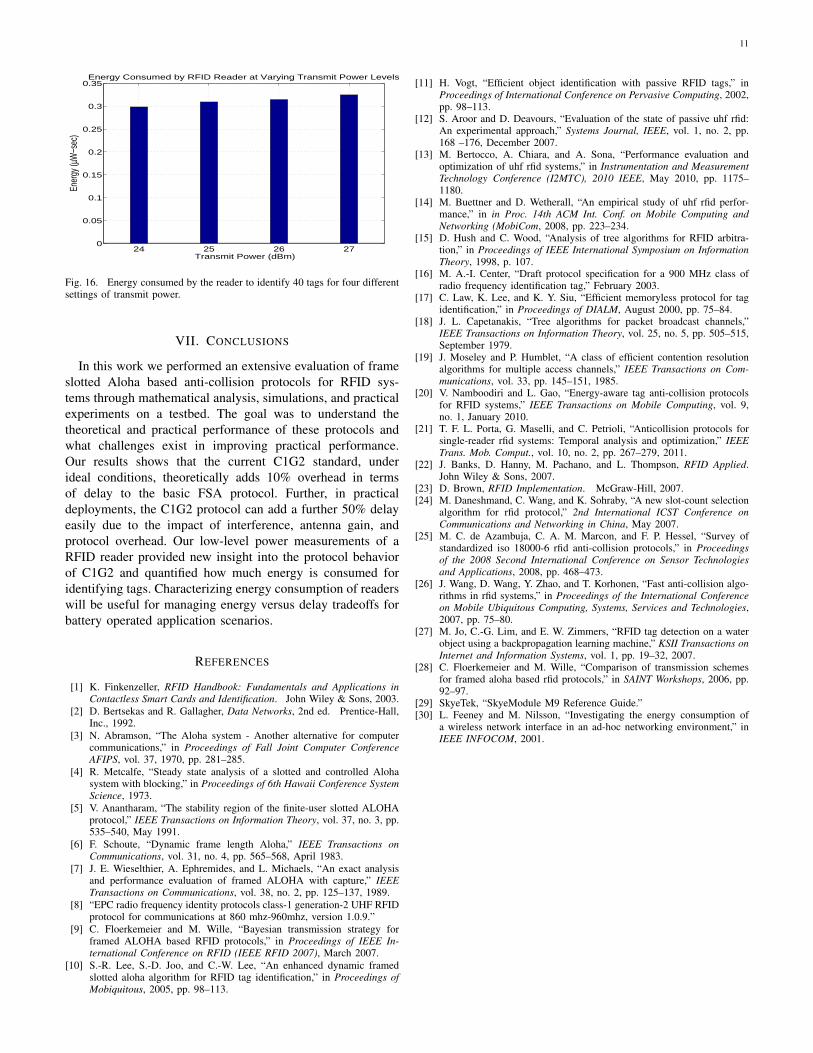
We study the overall energy consumed to identify 40 tags fordifferent values of reader transmit power. In Section V we hadrun the same experiments and observed that tag identificationdelay was smaller for a higher transmit power value. Figure16 shows that energy consumption is also higher at highertransmit powers. Thus, the reduction in identification delaywas not enough to offset the energy lost due to a higher valueof transmit power used. We can conclude from this experimentthat, for settings in which the reader’s power consumption isimportant to consider, lower values of transmit power couldbe employed. If there is an upper bound of tolerable delay, thepower could be set at the lowest possible value such that thedelay bound is met. Comparing Figure 10 and 16 for 40 tags,we could also come to the conclusion that using the maximumtransmit power of 27dBm reduced identification delay by 20%over the transmit power of 24dBm while costing only 10%additional energy. Thus, for scenarios where reducing delay ismore important, higher transmit powers should be used.
11
24 25 26 270
0.05
0.1
0.15
0.2
0.25
0.3
0.35
Transmit Power (dBm)
Ener
gy (µ
W−s
ec)
Energy Consumed by RFID Reader at Varying Transmit Power Levels
Fig. 16. Energy consumed by the reader to identify 40 tags for four differentsettings of transmit power.
VII. CONCLUSIONS
In this work we performed an extensive evaluation of frameslotted Aloha based anti-collision protocols for RFID sys-tems through mathematical analysis, simulations, and practicalexperiments on a testbed. The goal was to understand thetheoretical and practical performance of these protocols andwhat challenges exist in improving practical performance.Our results shows that the current C1G2 standard, underideal conditions, theoretically adds 10% overhead in termsof delay to the basic FSA protocol. Further, in practicaldeployments, the C1G2 protocol can add a further 50% delayeasily due to the impact of interference, antenna gain, andprotocol overhead. Our low-level power measurements of aRFID reader provided new insight into the protocol behaviorof C1G2 and quantified how much energy is consumed foridentifying tags. Characterizing energy consumption of readerswill be useful for managing energy versus delay tradeoffs forbattery operated application scenarios.
REFERENCES
[1] K. Finkenzeller, RFID Handbook: Fundamentals and Applications inContactless Smart Cards and Identification. John Wiley & Sons, 2003.
[2] D. Bertsekas and R. Gallagher, Data Networks, 2nd ed. Prentice-Hall,Inc., 1992.
[3] N. Abramson, “The Aloha system - Another alternative for computercommunications,” in Proceedings of Fall Joint Computer ConferenceAFIPS, vol. 37, 1970, pp. 281–285.
[4] R. Metcalfe, “Steady state analysis of a slotted and controlled Alohasystem with blocking,” in Proceedings of 6th Hawaii Conference SystemScience, 1973.
[5] V. Anantharam, “The stability region of the finite-user slotted ALOHAprotocol,” IEEE Transactions on Information Theory, vol. 37, no. 3, pp.535–540, May 1991.
[6] F. Schoute, “Dynamic frame length Aloha,” IEEE Transactions onCommunications, vol. 31, no. 4, pp. 565–568, April 1983.
[7] J. E. Wieselthier, A. Ephremides, and L. Michaels, “An exact analysisand performance evaluation of framed ALOHA with capture,” IEEETransactions on Communications, vol. 38, no. 2, pp. 125–137, 1989.
[8] “EPC radio frequency identity protocols class-1 generation-2 UHF RFIDprotocol for communications at 860 mhz-960mhz, version 1.0.9.”
[9] C. Floerkemeier and M. Wille, “Bayesian transmission strategy forframed ALOHA based RFID protocols,” in Proceedings of IEEE In-ternational Conference on RFID (IEEE RFID 2007), March 2007.
[10] S.-R. Lee, S.-D. Joo, and C.-W. Lee, “An enhanced dynamic framedslotted aloha algorithm for RFID tag identification,” in Proceedings ofMobiquitous, 2005, pp. 98–113.
[11] H. Vogt, “Efficient object identification with passive RFID tags,” inProceedings of International Conference on Pervasive Computing, 2002,pp. 98–113.
[12] S. Aroor and D. Deavours, “Evaluation of the state of passive uhf rfid:An experimental approach,” Systems Journal, IEEE, vol. 1, no. 2, pp.168 –176, December 2007.
[13] M. Bertocco, A. Chiara, and A. Sona, “Performance evaluation andoptimization of uhf rfid systems,” in Instrumentation and MeasurementTechnology Conference (I2MTC), 2010 IEEE, May 2010, pp. 1175–1180.
[14] M. Buettner and D. Wetherall, “An empirical study of uhf rfid perfor-mance,” in in Proc. 14th ACM Int. Conf. on Mobile Computing andNetworking (MobiCom, 2008, pp. 223–234.
[15] D. Hush and C. Wood, “Analysis of tree algorithms for RFID arbitra-tion,” in Proceedings of IEEE International Symposium on InformationTheory, 1998, p. 107.
[16] M. A.-I. Center, “Draft protocol specification for a 900 MHz class ofradio frequency identification tag,” February 2003.
[17] C. Law, K. Lee, and K. Y. Siu, “Efficient memoryless protocol for tagidentification,” in Proceedings of DIALM, August 2000, pp. 75–84.
[18] J. L. Capetanakis, “Tree algorithms for packet broadcast channels,”IEEE Transactions on Information Theory, vol. 25, no. 5, pp. 505–515,September 1979.
[19] J. Moseley and P. Humblet, “A class of efficient contention resolutionalgorithms for multiple access channels,” IEEE Transactions on Com-munications, vol. 33, pp. 145–151, 1985.
[20] V. Namboodiri and L. Gao, “Energy-aware tag anti-collision protocolsfor RFID systems,” IEEE Transactions on Mobile Computing, vol. 9,no. 1, January 2010.
[21] T. F. L. Porta, G. Maselli, and C. Petrioli, “Anticollision protocols forsingle-reader rfid systems: Temporal analysis and optimization,” IEEETrans. Mob. Comput., vol. 10, no. 2, pp. 267–279, 2011.
[22] J. Banks, D. Hanny, M. Pachano, and L. Thompson, RFID Applied.John Wiley & Sons, 2007.
[23] D. Brown, RFID Implementation. McGraw-Hill, 2007.[24] M. Daneshmand, C. Wang, and K. Sohraby, “A new slot-count selection
algorithm for rfid protocol,” 2nd International ICST Conference onCommunications and Networking in China, May 2007.
[25] M. C. de Azambuja, C. A. M. Marcon, and F. P. Hessel, “Survey ofstandardized iso 18000-6 rfid anti-collision protocols,” in Proceedingsof the 2008 Second International Conference on Sensor Technologiesand Applications, 2008, pp. 468–473.
[26] J. Wang, D. Wang, Y. Zhao, and T. Korhonen, “Fast anti-collision algo-rithms in rfid systems,” in Proceedings of the International Conferenceon Mobile Ubiquitous Computing, Systems, Services and Technologies,2007, pp. 75–80.
[27] M. Jo, C.-G. Lim, and E. W. Zimmers, “RFID tag detection on a waterobject using a backpropagation learning machine,” KSII Transactions onInternet and Information Systems, vol. 1, pp. 19–32, 2007.
[28] C. Floerkemeier and M. Wille, “Comparison of transmission schemesfor framed aloha based rfid protocols,” in SAINT Workshops, 2006, pp.92–97.
[29] SkyeTek, “SkyeModule M9 Reference Guide.”[30] L. Feeney and M. Nilsson, “Investigating the energy consumption of
a wireless network interface in an ad-hoc networking environment,” inIEEE INFOCOM, 2001.