research on stability control algorithm of slotted aloha · research on stability control algorithm...
TRANSCRIPT

Research on Stability Control Algorithm of Slotted ALOHA
Fei Fang and WenchunYu
NeiJiang Normal University, NeiJiang Sichuan 641112, China
Abstract—Because of its simplification, slotted ALOHA is
comprehensive used in the satellite and wireless communication.
While slotted ALOHA is essentially unstable. Therefore various
kinds of control algorithms are applied in order to keep stable
throughput of the communication system. In this paper, p-
Persistent Control Algorithm (pPCA) of slotted ALOHA is
analyzed using binomial distribution model, design of algorithm
is finished and throughput is simulated. Markov Model of
Binary Exponential Backoff (BEB) Algorithm is established on
the basis of which Binary Exponential Backoff Algorithm is
designed whose performance is tested through numerical
analysis and simulation. Finally, Operating principle of Pseudo-
Bayesian Control Algorithm (PBCA) is analyzed utilizing
Poisson distribution model of input stream, corresponding
algorithm is designed and throughput is done simulation test.
Then comparisons are done on the properties of throughput,
adjustment process and complexity of computation among
Binary Exponential Backoff Algorithm, Pseudo-Bayesian
Control Algorithm and p-Persistent Control Algorithm whose
results show that overall performance of Pseudo-Bayesian
Control Algorithm is better than that of the other two. Index Terms—Slotted ALOHA; throughput; stability;
complexity of computation; Markov Model; adjustment process
I. INTRODUCTION
When multiple users share the communication medium
in a communication network, they need to acquire the
right of using the channel by the way of competition. As
an universal Medium Access Control (MAC) Protocol,
ALOHA and slotted ALOHA [1], [2] is widely used in
the environment of multiple user nodes competing for
one communication medium. Nowadays slotted ALOHA
Protocol has been extensively applied to the Random
Access Channel (RACH) of Global System for Mobile
Communication. Otherwise its operation is simple. It is
used in both experimental network developments of ultra-
wideband wireless networks and dynamic spectrum
sharing network based on wireless cognitive technology.
While slotted ALOHA is essentially unstable in which
channel throughput enlarges with the increasing of load
flow when the input load flow gradually increases from 0.
Throughput reaches up to the maximum value when the
input flow reaches to one certain threshold value. At this
time conflicts among these users would become bigger if
input load flow continues increasing in which repetitive
Manuscript received January 26, 2014; revised November 20, 2014. This work was supported by the Sichuan Education Department
under Grant No.13ZA0005. Corresponding author email: [email protected].
doi:10.12720/jcm.9.11.805-814
collision would waste part of band width of system
leading throughput to rapidly decline with the increasing
of input load flow and making the system be kept in an
unstable condition.
In order to solve the problem of instability of slotted
ALOHA, literature [3] proposes that different
retransmission probabilities should be used to keep
system being stable under different overall loads. In
literature [4]-[6], Sarker does research on the influences
of finite retransmission control mechanism on the
stability of slotted ALOHA and studies the range of
system stability under a variety of constraints like
controlling the formation rate of the new packet, allowing
system to keep a certain range of rejecting rate and
allowing transmission channel to have error probability.
Refernce [7] analyzes the system performance of slotted
ALOHA utilizing the collaboration among nodes in the
system, introduces game theory into channel competition
and hereby studies the throughput and delay
characteristics of systems. Literature [8] combining with
physical channel characteristics and signal detection into
consideration, he researches the throughput and stability
of slotted ALOHA on this kind of information channel.
Moreover, Pietrabissa. A and others study the stability of
standard slotted ALOHA and the one with cache and use
convex optimization way to propose a type of conflict
resolver algorithm to lead system to acquire stable
maximum throughput [9]. Rivest R.L proposes Pseudo-
Bayesian Control Algorithm[1]
on the basis of analyzing
slotted ALOHA principle and takes the new arrival
packets as retransmission packets in which all nodes
needing to send data use the same probability to transmit
data. In literature [10], Milosh Ivanovich and others study
the influences of p Persistent Control Algorithm on
throughput of slotted ALOHA under the condition of
non-Poisson arriving and channel transmission having
errors. However, the existing researches on slotted
ALOHA mainly concentrate on how to keep system
being stable. The number of researches on control
algorithms for system stability is so small that just a few
literatures do researches on the algorithm of dynamically
adjust retransmission probability p and Pseudo-Bayesian
Control Algorithm. While as one type of stability control
algorithm, Binary Exponential Backoff Algorithm is
widely used in the CSMA/CD Protocol of wired Ethernet
networks and CSMA/CA Protocol of 802.11 Distributed
Coordination Function [11], [12] whose regulation
perfor-mances have not aroused high concerns from
researchers.
Journal of Communications Vol. 9, No. 11, November 2014
©2014 Engineering and Technology Publishing 805
Email: {fangfei_nj, @163.comywclmxx}

This paper mainly researches the operating principles
of Binary Exponential Backoff Control Algorithm, p
Persistent Control Algorithm and Pseudo Bayesian
Control Algorithm and their performances of ensuring
system stability of slotted ALOHA. On the basis of
Markov Model in Binary Exponential Backoff of slotted
ALOHA, it analyzes the throughputs of system at
different nodes. Through acting the node’s sending data
process as Poisson distribution, it analyzes Pseudo-
Bayesian Control Algorithm principle in which
mathematical analysis and computer simulation are
utilized to test the performance of this algorithm. Packet
transmission of active nodes (nodes having data to
transmit) in this system is taken as a random variable of
binomial distribution to analyze the stability adjustment
principle of p Persistent Control Algorithm and do
simulation testing on the performance of pPCA. Finally
under the environment of multiple types of nodes,
comparisons of system throughput, stability adjustment
time and algorithm complexity are done among the three
control algorithms. (Note: If there are no special
instructions, system throughput in this paper means the
normalized system throughput namely the proportion of
successful transmission during one tile slot.)
II. SLOTTED ALOHA SYSTEM MODE
In the research of this paper, system utilizes a kind of
universal slotted ALOHA protocol, is made up of n nodes
and shares one channel in which channel access uses
slotted ALOHA Protocol. The basic thought is to divide
channel time to discrete slots whose length is the sending
time one frame needs. Each node cannot send data before
slot begins. In addition, the involved nodes in this paper
stand for the active nodes who are waiting for
transmitting packets (not including nodes without
packets). Suppose that active nodes always have packets
to transmit. They would become inactive ones. Nodes in
the system cater for the following assumptions:
1) Each node could perceive that channel is idle before
data transmission begins and immediately acquire
information to successfully transmit or conflict through
incidentally response ACK way when transmission is
ending.
2) Conflicts would appear among nodes when they are
transmitting packets. Then packets would be
retransmitted. New packets could not be transmitted until
blocking packets’ transmission finished.
3) Length of the packet of each node should be less
than the maximum data length that one slot could
transmit.
Fig. 1 System principle diagram of slotted ALOHA
Fig. 2. Throughput S versus G
4) Wireless transmission channel is ideal and it is the
conflict that leads errors of packets to appear.
It is seen from Fig.1 that after one packet arrives at a
certain slot, it begins to transmit at the next slot and
expects that it would not collide with packets sent by
other nodes. If just one packet arrives at one slot
(including new arrival packet and retransmission one),
this packet’s transmission is successful. If two or more
packets arrive at one slot, collision would happen because
colliding packets would be retransmitted at the following
slots. Suppose that time delay of retransmission is enough
random. It may be approximately thought that sum of
retransmission packet process and new arrival packet
process is the Poisson process whose arrival rate is
G G . Then only one packet retransmission
probability exists during one slot which is
0
0
0
0
0
[interval of arrival time ] ( )
exp exp( )
T
T
P T a t dt
G Gtdt G
T T
(1)
Throughput of system GS Ge is defined as the
passing rate of system or the rate of leaving system.
When G is equal to 1, S acquires its maximum value
0.368 as shown in Fig. 2.
III. STABILITY CONTROL ALGORITHM OF SLOTTED
ALOHA
It is seen from Fig. 2 that when the arrival rate of
system G is more than 1, throughput of system would
decrease with the increasing of G. In order to ensure that
system would acquire stable throughput which is close to
the theoretical maximum value, system needs to use some
kind of algorithm to control G at one section close to 1.
Consider that n nodes exist in the system. Data buffer
length of each node is unlimited. New packets are always
waiting for being transmitted after node successfully
transmits one packet.
A. p-Persistent Control Algorithm
Suppose that n nodes transmit data in the system while
m estimate nodes exist in it. Each node transmits data
with probability p=1/m and enters the next slot to
Journal of Communications Vol. 9, No. 11, November 2014
©2014 Engineering and Technology Publishing 806

compete with 1p until data is successfully transmitted.
Assume that each node’s data transmission process is
independent. Data transmission processes of m nodes
could be treated as random variables of the binomial
distribution. When m and n are bigger, the probability of
successful transmission at one certain slot is:
1 1
( )1 1 11 1
1
n n nn
m msucc
n n nP p p n e e
m m m m
1 1
( )1 1 11 1
1
n n nn
m msucc
n n nP p p n e e
m m m m
(2)
Do derivation on the right end of formula (2) and make
it be 0. We acquire that system gets maximum throughput
0.368 when m=n namely p=1/n. Aiming at the above-
mentioned system, its probability of channel idle being is:
1
1 10
n nn
midle
nP p e
m
(3)
Take logarithms away from both sides of (3). We
acquire that:
ln lnidle idle
nP n m P
m (4)
It is seen from (4) that actual node number n of current
system could be acquired as long as exact value of idleP is
obtained. Then nodes of system transmit data with
probability p=1/n which would help acquire throughput
close to maximum theoretical value. In order to do
statistics on the idle probability of channel, a statistic
window should be set which is noted with variable SW. If
the window is designed to be too large, adjustable rate
would become slower. If it is designed too small, error of
probability statistical value would increase.
In the design, our algorithm is as follows:
1) Initialize simulation value n0, calculate p=1/n0,
define a variable s of statistical slot and initialize it to be
0. 2) Determine whether s equals to SW. If yes, s=0 and
turn it to iv).
3) s subtracts 1 which produces even-distributed
random number x in the range (0 1) . Decide
whether x p . If yes, data would be transmitted and
turned to ii).
4) Do statistics on the number of idle slot of one SW
and calculate idleP . If 0idleP , / 2p p . If not,
/ ln idlep p P and turn it to c.
In order to test the performance of p-Persistent Control
Algorithm, we test the performance of the p-persistent
algorithm for slotted ALOHA using the MATLAB.
The relevant parameters of simulation scenario one is
set as follows: SW is set to be 32, system estimate number
of node is 5, actual node numbers of system are
respectively 2, 5, 20, 50, 100 and simulation time is 100
slots and The relevant parameters of scenario two is set as
follows: system estimate number of node is 50, other
parameters is same as scenario one. The simulation result
is show as Fig. 3.
Fig. 3 (a) is the simulation result of scenario one. From
it we can see that the pPCA can get the steady
approximate maximum throughput of slotted ALOHA
after definite adjusting time.But,if the initial estimate
node is small, the bigger the real number of node ,the
throughput of adjustment process is lower. And the time
of adjustment is additional when the actual node of
system is more greater than the initial number of system
node.
Fig. 3 (b) is the simulation result of scenario two. From
it we can see that the pPCA can get the steady throughput
approximate maximum throughput of slotted ALOHA
after definite adjusting time same as scenario 1.But,if the
initial estimate node is bigger,i.e.0 50n ; the smaller the
real number of node ,the throughput of adjustment
process is lower,and the time of adjust is additional when
the actual node of system is more smaller than initial
number ofsystem node.
0 20 40 60 80 1000
0.1
0.2
0.3
0.4
0.5
simulation time(slot)
Thro
ughput(
S)
N=2
N=5
N=20
N=50
N=100
(a) Initialize simulation value
0 5n
0 20 40 60 80 1000.05
0.1
0.15
0.2
0.25
0.3
0.35
0.4
simulation time(slot)
Th
rou
gh
pu
t(S
)
N=2
N=5
N=20
N=50
N=100
(b) Initialize simulation value
0 50n
Fig. 3. Throughtput of p-persistent algorithm in every slot
In the interest of appraisal the colligation capability p-
persistent control algorithm (pPCA), the average
throughput was tested using MATLAB to simulate with
the parameter as fellow: SW is set to be 32, system
estimate number of node is 5, 10, 30, 100; actual node
numbers of system are respectively 2 to 150 and
simulation time is 100 slots. Fig. 4 shows that the system
average throughput depends on initial estimate number of
node n0 and actual number of node n. In particular, the
Journal of Communications Vol. 9, No. 11, November 2014
©2014 Engineering and Technology Publishing 807
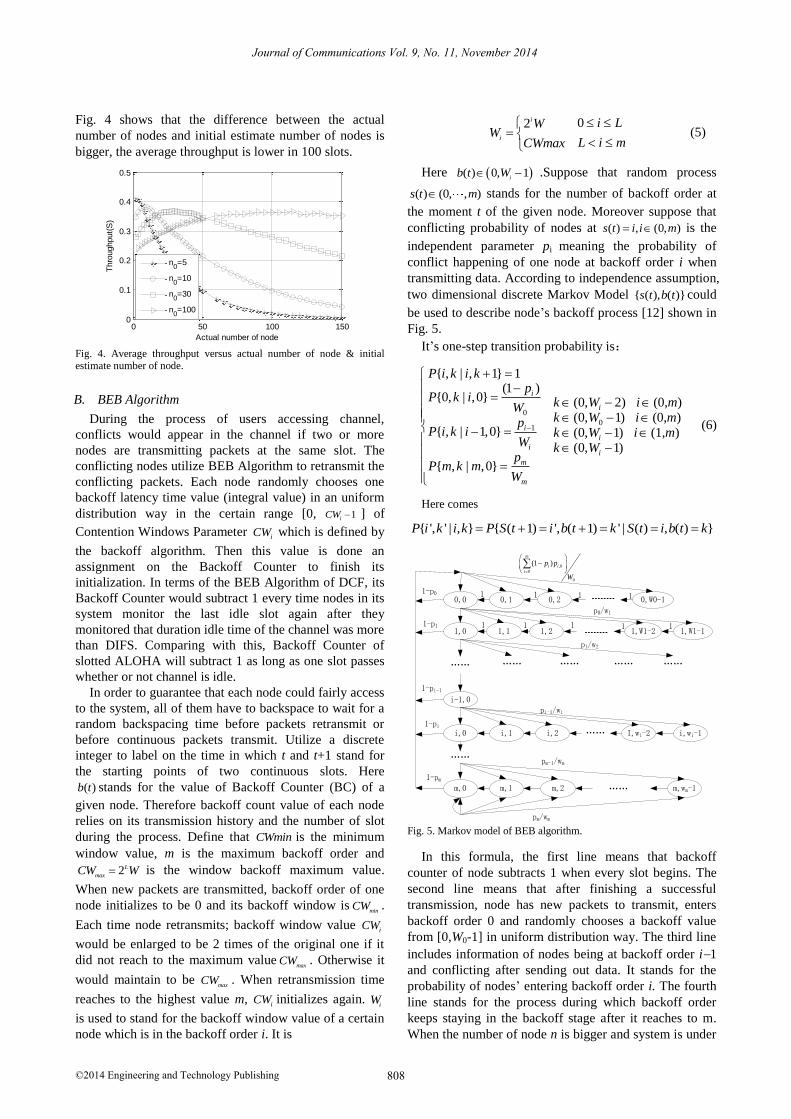
Fig. 4 shows that the difference between the actual
number of nodes and initial estimate number of nodes is
bigger, the average throughput is lower in 100 slots.
0 50 100 1500
0.1
0.2
0.3
0.4
0.5
Actual number of node
Thro
ughput(
S)
n0=5
n0=10
n0=30
n0=100
Fig. 4. Average throughput versus actual number of node & initial estimate number of node.
B. BEB Algorithm
During the process of users accessing channel,
conflicts would appear in the channel if two or more
nodes are transmitting packets at the same slot. The
conflicting nodes utilize BEB Algorithm to retransmit the
conflicting packets. Each node randomly chooses one
backoff latency time value (integral value) in an uniform
distribution way in the certain range [0, 1iCW ] of
Contention Windows Parameter iCW which is defined by
the backoff algorithm. Then this value is done an
assignment on the Backoff Counter to finish its
initialization. In terms of the BEB Algorithm of DCF, its
Backoff Counter would subtract 1 every time nodes in its
system monitor the last idle slot again after they
monitored that duration idle time of the channel was more
than DIFS. Comparing with this, Backoff Counter of
slotted ALOHA will subtract 1 as long as one slot passes
whether or not channel is idle.
In order to guarantee that each node could fairly access
to the system, all of them have to backspace to wait for a
random backspacing time before packets retransmit or
before continuous packets transmit. Utilize a discrete
integer to label on the time in which t and t+1 stand for
the starting points of two continuous slots. Here
( )b t stands for the value of Backoff Counter (BC) of a
given node. Therefore backoff count value of each node
relies on its transmission history and the number of slot
during the process. Define that CWmin is the minimum
window value, m is the maximum backoff order and
2L
maxCW W is the window backoff maximum value.
When new packets are transmitted, backoff order of one
node initializes to be 0 and its backoff window ismin
CW .
Each time node retransmits; backoff window value iCW
would be enlarged to be 2 times of the original one if it
did not reach to the maximum valuemax
CW . Otherwise it
would maintain to be max
CW . When retransmission time
reaches to the highest value m, iCW initializes again. i
W
is used to stand for the backoff window value of a certain
node which is in the backoff order i. It is
02i
i
i LWW
L i mCWmax
(5)
Here ( ) 0, 1i
b t W .Suppose that random process
( ) (0, , )s t m stands for the number of backoff order at
the moment t of the given node. Moreover suppose that
conflicting probability of nodes at ( ) , (0, )s t i i m is the
independent parameter pi meaning the probability of
conflict happening of one node at backoff order i when
transmitting data. According to independence assumption,
two dimensional discrete Markov Model { ( ), ( )}s t b t could
be used to describe node’s backoff process [12] shown in
Fig. 5.
It’s one-step transition probability is:
0
01
{ , | , 1} 1(1 )
{0, | ,0} (0, 2) (0, )
(0, 1) (0, ){ , | 1,0} (0, 1) (1, )
(0, 1)
{ , | ,0}
i
i
i
i
ii
m
m
P i k i kp
P k i k W i mWk W i mp
P i k i k W i mW k W
pP m k m
W
(6)
Here comes
{ ', ' | , } { ( 1) ', ( 1) ' | ( ) , ( ) }P i k i k P S t i b t k S t i b t k
0,0
1,0
i-1,0
……
i,0
m,0
……
0,1 0,2 0,W0-11111
…… …… …… ……
p0/w1
1,1 1,2 1,W1-2 1,W1-11 111 1
i,1 i,2 I,wi-2 i,wi-1……
p1/w2
pi-1/wi
m,1 m,2 m,wm-1
pm-1/wm
……
pm/wm
1-pm
1-pi
1-pi-1
1-p1
1-p0
,0
0
0
(1 )m
i i
i
p p
W
Fig. 5. Markov model of BEB algorithm.
In this formula, the first line means that backoff
counter of node subtracts 1 when every slot begins. The
second line means that after finishing a successful
transmission, node has new packets to transmit, enters
backoff order 0 and randomly chooses a backoff value
from [0,W0-1] in uniform distribution way. The third line
includes information of nodes being at backoff order i1
and conflicting after sending out data. It stands for the
probability of nodes’ entering backoff order i. The fourth
line stands for the process during which backoff order
keeps staying in the backoff stage after it reaches to m.
When the number of node n is bigger and system is under
Journal of Communications Vol. 9, No. 11, November 2014
©2014 Engineering and Technology Publishing 808
stable condition, collision probability of each backoff
stage can be supposed as an independent constant p
namely 0 mp p p . Then the stable probability of
node at each backoff order is acquired:
( ,0)= (0,0) , 0
( 1,0) (0,0).( ,0)
1 1
i
m
Q i Q p i m
Q m p Q pQ m
p p
(7)
0(1 ) ( ,0)0
( , ) ( 1,0) 0
( 1,0) ( ,0)
mj
i
i
p Q ji
W kQ i k pQ i i m
W i mp Q m Q m
(8)
According to the definition of Formula (6), it is simple
to acquire that:
1
0 0
(0,0)( ,0) (0,0) ( ,0)
1
m m i
i i
QQ i Q p Q m
p
( 9 )
Aiming at stable system, probabilities of all conditions
should cater for:
1 1
0 0 0 0
0
1
0
( , ) ( ,0)
1 ( ,0)
2
(0,0) (2 ) 1 (2 ) 1
2 1 1
i iW Wm mi
i j i k im
i
i
mmi
i
W kQ i j Q i
WW
Q i
Q pW P
p p
(10)
Solution is
2 1 2 (1 )
(0,0)1 2 1 1 (2 )m
p pQ
p W pW p
(11)
Then transmission probability of a certain node during
one slot is
0
(0,0)( ,0)
12(1 2 )
(1 2 )( 1) (1 (2 ) )
m
i
m
QQ i
pp
p W pW p
(12)
Under general condition, τ relies on conditional
probability p which means that one node transmits data at
a certain slot and at least one node of the others also does
data transmission at the same time. Then comes:
11 (1 )np (13)
Convert (13) as 1/( 1)*( ) 1 (1 ) np p . This function is
a monotone increasing one in the range (0,1)P and
*(0) 0, *(1) 1 . in (12) is the function of p
expressed by ( )p which is a monotone decreasing
function in the range (0,1)p and (0) 2 / 1W
, (1) 2 / 1 2mW . As (0) *(0) and (1) *(1) , there
must be intersection between ( )p and * ( )p in the
range (0,1)p . Therefore there exists simultaneous
solution between (12) and (13).
As data transmission of slotted ALOHA happens at the
moment slot beginning, successful transmission of
packets, leisure of channel and time of conflict all take
slot as unit. Under the condition of n nodes, probability of
each node sending data is .Thus probabilities of
successful transmission of packets, leisure of channel and
conflict are respectively shown as follows:
1(1 )
(1 )
1
n
succ
n
idle
coll succ idle
P n
P
P P P
(14)
During the backoff process, BEB Control Algorithm of
slotted ALOHA does not monitor whether channel is idle.
While backoff count subtracts 1 each time it goes through
one slot. Therefore throughput rate of system is:
1
.
. .
(1 )
succ
succ idle colln
succ
P SlotS
P Slot P Slot P Slot
P n
(15)
Do derivation on the right side of formula (15) and
make it be 0, we acquire that system gets the maximum
value 1 1
max
1(1 ) 0.368nS e
n
under the condition of
1/ n which acquires the same conclusion with (1).
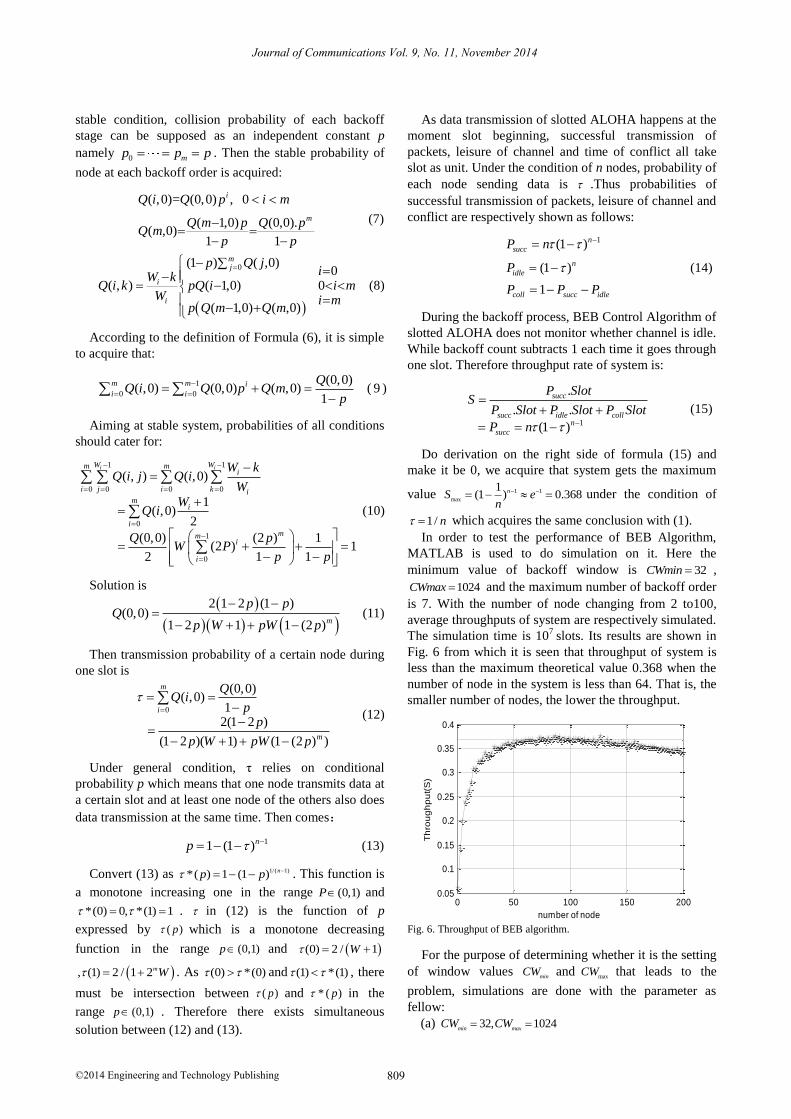
In order to test the performance of BEB Algorithm,
MATLAB is used to do simulation on it. Here the
minimum value of backoff window is 32CWmin ,
1024CWmax and the maximum number of backoff order
is 7. With the number of node changing from 2 to100,
average throughputs of system are respectively simulated.
The simulation time is 107
slots. Its results are shown in
Fig. 6 from which it is seen that throughput of system is
less than the maximum theoretical value 0.368 when the
number of node in the system is less than 64. That is, the
smaller number of nodes, the lower the throughput.
0 50 100 150 2000.05
0.1
0.15
0.2
0.25
0.3
0.35
0.4
number of node
Th
rou
gh
pu
t(S
)
Fig. 6. Throughput of BEB algorithm.
For the purpose of determining whether it is the setting
of window values min
CW andmax
CW that leads to the
problem, simulations are done with the parameter as
fellow:
(a) 32, 1024min max
CW CW
Journal of Communications Vol. 9, No. 11, November 2014
©2014 Engineering and Technology Publishing 809
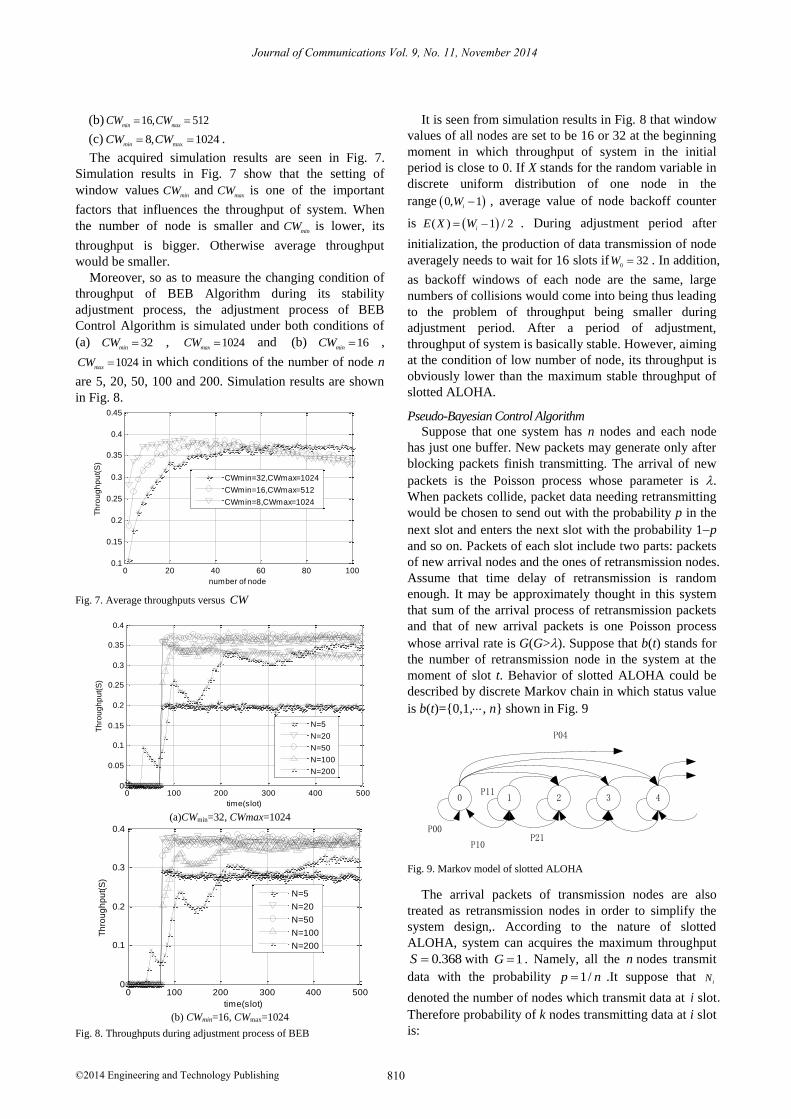
(b) 16, 512min max
CW CW
(c)max
8, 1024min
CW CW .
The acquired simulation results are seen in Fig. 7.
Simulation results in Fig. 7 show that the setting of
window valuesmin
CW andmax
CW is one of the important
factors that influences the throughput of system. When
the number of node is smaller andmin
CW is lower, its
throughput is bigger. Otherwise average throughput
would be smaller.
Moreover, so as to measure the changing condition of
throughput of BEB Algorithm during its stability
adjustment process, the adjustment process of BEB
Control Algorithm is simulated under both conditions of
(a) 32min
CW , 1024max
CW and (b) 16min
CW ,
1024max
CW in which conditions of the number of node n
are 5, 20, 50, 100 and 200. Simulation results are shown
in Fig. 8.
0 20 40 60 80 1000.1
0.15
0.2
0.25
0.3
0.35
0.4
0.45
number of node
Th
rou
gh
pu
t(S
)
CWmin=32,CWmax=1024
CWmin=16,CWmax=512
CWmin=8,CWmax=1024
Fig. 7. Average throughputs versus CW
0 100 200 300 400 5000
0.05
0.1
0.15
0.2
0.25
0.3
0.35
0.4
time(slot)
Th
rou
gh
pu
t(S
)
N=5
N=20
N=50
N=100
N=200
(a)CWmin=32, CWmax=1024
0 100 200 300 400 5000
0.1
0.2
0.3
0.4
time(slot)
Th
rou
gh
pu
t(S
)
N=5
N=20
N=50
N=100
N=200
(b) CWmin=16, CWmax=1024
Fig. 8. Throughputs during adjustment process of BEB
It is seen from simulation results in Fig. 8 that window
values of all nodes are set to be 16 or 32 at the beginning
moment in which throughput of system in the initial
period is close to 0. If X stands for the random variable in
discrete uniform distribution of one node in the
range 0, 1i
W , average value of node backoff counter
is ( ) 1 / 2i
E X W . During adjustment period after
initialization, the production of data transmission of node
averagely needs to wait for 16 slots if0
32W . In addition,
as backoff windows of each node are the same, large
numbers of collisions would come into being thus leading
to the problem of throughput being smaller during
adjustment period. After a period of adjustment,
throughput of system is basically stable. However, aiming
at the condition of low number of node, its throughput is
obviously lower than the maximum stable throughput of
slotted ALOHA.
Pseudo-Bayesian Control Algorithm
Suppose that one system has n nodes and each node
has just one buffer. New packets may generate only after
blocking packets finish transmitting. The arrival of new
packets is the Poisson process whose parameter is .
When packets collide, packet data needing retransmitting
would be chosen to send out with the probability p in the
next slot and enters the next slot with the probability 1p
and so on. Packets of each slot include two parts: packets
of new arrival nodes and the ones of retransmission nodes.
Assume that time delay of retransmission is random
enough. It may be approximately thought in this system
that sum of the arrival process of retransmission packets
and that of new arrival packets is one Poisson process
whose arrival rate is G(G>). Suppose that b(t) stands for
the number of retransmission node in the system at the
moment of slot t. Behavior of slotted ALOHA could be
described by discrete Markov chain in which status value
is b(t)={0,1,, n} shown in Fig. 9
0 1 2 3 4
P00
P10P21
P11
P04
Fig. 9. Markov model of slotted ALOHA
The arrival packets of transmission nodes are also
treated as retransmission nodes in order to simplify the
system design,. According to the nature of slotted
ALOHA, system can acquires the maximum throughput
0.368S with 1G . Namely, all the n nodes transmit
data with the probability 1/p n .It suppose that iN
denoted the number of nodes which transmit data at i slot. Therefore probability of k nodes transmitting data at i slot
is:
Journal of Communications Vol. 9, No. 11, November 2014
©2014 Engineering and Technology Publishing 810

( )!
kn nP N k ei k
(16)
When each node sends data with probability 1/p n ,
probability of slot being idle is:
1 11( ) ( )(1 ) ( )(1 ) =
0 0
k k nP idle P N k P N k e ei in nk k
1 1 1( ) ( )(1 ) ( )(1 ) =
0 0
k k nP idle P N k P N k e ei in nk k
(17)
Under the condition of i slot being idle, probability of k
terminals waiting for sending data is:
( | ) ( ) 1 ( 1)( | )
( ) !
kP idle k P N k n niP N k idle ei P idle k
(18)
Its probability is one Poisson distribution whose
average value is 1n . Similarly, here come k terminals
needing to send data. Probability of successful
transmission is:
1 1 1 1 1( ) ( ) (1 )
0
k N NP succ P N k k e e ei n nk
1 1 1 1 1( ) ( ) (1 )
0
k N NP succ P N k k e e ei n nk
(19)
When one request packet is successfully transmitted at
slot i, probability of 1k packets being in this system is:
( | 1)( 1)( 1| )
( )
11 11 1
( 1)( 1)! ( 1)
1 !
P succ N k N kv vP N k succ
i P succ
k kN nk e knn n k ne
ke
(20)
It is visible that the number of packets k which are
waiting for being transmitted in the system is one random
variable of Poisson distribution whose average value
is 1n . Considering that new arrival request number
during one slot in the system is ( 0.368) , a prior
probability 1 / ip N is given which is related
to ( 1)i iN N .When slot is idle or successful, 1iN is a random
variable of Poisson distribution whose average value
is 1iN . If collision happens, i 1N could be
approximately treated as a random variable of Poisson
distribution whose average value is 1 / ( 2)N ei
.
Therefore sending probability of the next slot may be
adjusted according to the condition of the present slot
whose implementation steps are as follows:
1) Slot 1 is the beginning one. Its node number of
initialized system is n0 in which each node transmits data
with probability p=1/ n0;
2) At slot i, each node sends data with
probability min 1,1 / ip N ;
3) Terminal number needing to send data array at the
next slot may be estimated by the following formula:
1 1
max( , 1), channel is idle or success
channel collission( 2) ,
i
i
i
NN
N e
(21)
4) Each terminal at i+1 slot sends packets with
probability 1/Ni+1.
0 50 100 150 2000
0.05
0.1
0.15
0.2
0.25
0.3
0.35
0.4
0.45
simulation time(slot)
Thro
ughput(
S)
N=5
N=20
N=50
N=100
N=200
(a) Initial number of node 0 5n
0 50 100 150 2000
0.1
0.2
0.3
0.4
simulation time(slot)
Thro
ughput(
S)
N=5
N=20
N=50
N=100
N=200
(b) Initial number of node 0 10n
0 50 100 150 2000.05
0.1
0.15
0.2
0.25
0.3
0.35
0.4
simulation time(slot)
Thro
ughput(
S)
N=5
N=20
N=50
N=100
N=200
(c) Initial number of node 0 50n
0 50 100 150 2000
0.05
0.1
0.15
0.2
0.25
0.3
0.35
0.4
simulation time(slot)
Thro
ughput(
S)
N=5
N=20
N=50
N=100
N=200
(d) Initial number of node 0 100n
Fig. 10. PBCA throughput of slotted ALOHA.
Journal of Communications Vol. 9, No. 11, November 2014
©2014 Engineering and Technology Publishing 811
This algorithm is simulated under MATLAB platform.
Part of terminals change to be active nodes or
communication of some active nodes finishes leading
them to become inactive terminals which makes number
of nodes change. The supposed changing moment t in the
system is the beginning slot 0. Simulation scenarios are
set as follow:
1) The estimated nodes in the system at the beginning
slot (0 0t ) are supposed to be 5, 10, 50, 100.
2) The actual node numbers n of system are
respectively 5, 20, 50, 100,200.
3) Simulation time range is from 1 to 200 whose time
unit is slot.
Fig. 10 shows the throughputs of system during each
slot. Simulation results show that system could be
basically stable on theoretical maximum throughput
going through a period of adjustment. Meanwhile the
figure shows that with difference between actual node
number and initial value increasing, time for adjustment
becomes longer.
IV. PERFORMANCE COMPARISON OF THREE CONTROL
ALGORITHMS
All the three algorithms of BEB Algorithm, PBCA and
pPCA can keep system stable. However, a type of
optimal control algorithm is needed in physical design.
Therefore analytical research should be done among the
three algorithms in the aspects of average throughput of
system, adjustment time and computation complexity.
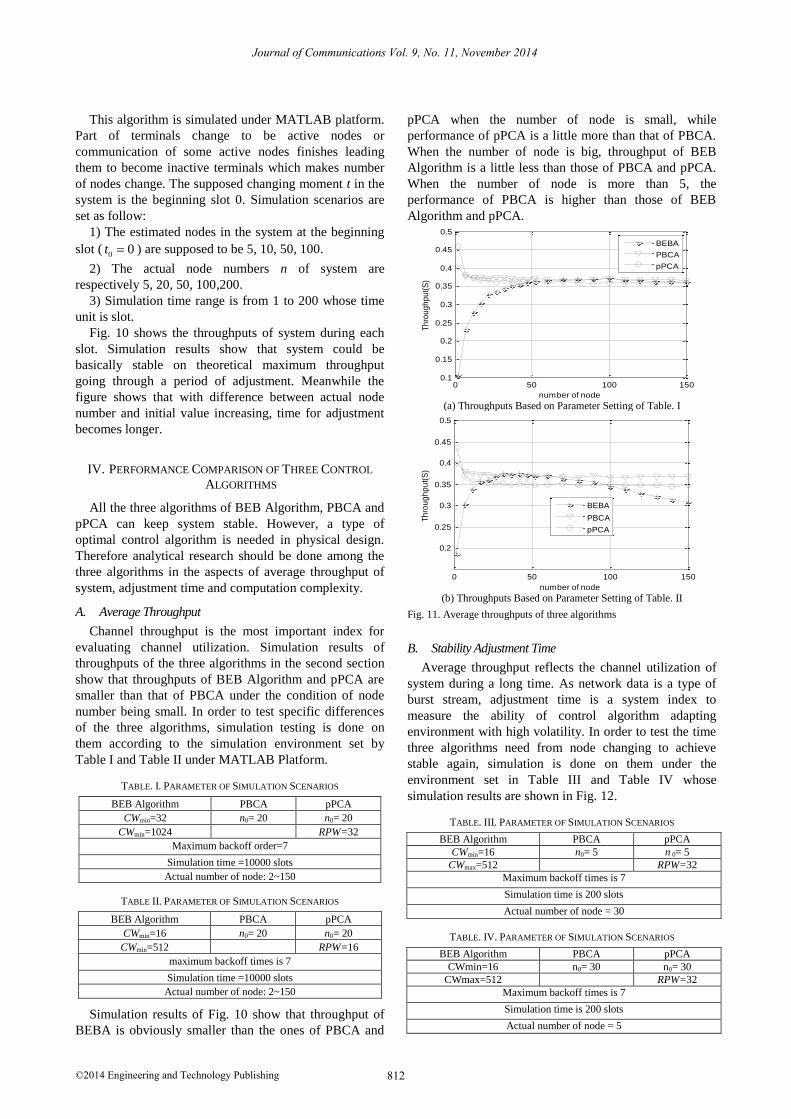
A. Average Throughput
Channel throughput is the most important index for
evaluating channel utilization. Simulation results of
throughputs of the three algorithms in the second section
show that throughputs of BEB Algorithm and pPCA are
smaller than that of PBCA under the condition of node
number being small. In order to test specific differences
of the three algorithms, simulation testing is done on
them according to the simulation environment set by
Table I and Table II under MATLAB Platform.
TABLE. I. PARAMETER OF SIMULATION SCENARIOS
BEB Algorithm PBCA pPCA
CWmin=32 n0= 20 n0= 20
CWmin=1024 RPW=32
Maximum backoff order=7
Simulation time =10000 slots
Actual number of node: 2~150
TABLE II. PARAMETER OF SIMULATION SCENARIOS
BEB Algorithm PBCA pPCA
CWmin=16 n0= 20 n0= 20
CWmin=512 RPW=16
maximum backoff times is 7
Simulation time =10000 slots
Actual number of node: 2~150
Simulation results of Fig. 10 show that throughput of
BEBA is obviously smaller than the ones of PBCA and
pPCA when the number of node is small, while
performance of pPCA is a little more than that of PBCA.
When the number of node is big, throughput of BEB
Algorithm is a little less than those of PBCA and pPCA.
When the number of node is more than 5, the
performance of PBCA is higher than those of BEB
Algorithm and pPCA.
0 50 100 1500.1
0.15
0.2
0.25
0.3
0.35
0.4
0.45
0.5
number of node
Th
rou
gh
pu
t(S
)
BEBA
PBCA
pPCA
(a) Throughputs Based on Parameter Setting of Table. I
0 50 100 150
0.2
0.25
0.3
0.35
0.4
0.45
0.5
number of node
Th
rou
gh
pu
t(S
)
BEBA
PBCA
pPCA
(b) Throughputs Based on Parameter Setting of Table. II
Fig. 11. Average throughputs of three algorithms
B. Stability Adjustment Time
Average throughput reflects the channel utilization of
system during a long time. As network data is a type of
burst stream, adjustment time is a system index to
measure the ability of control algorithm adapting
environment with high volatility. In order to test the time
three algorithms need from node changing to achieve
stable again, simulation is done on them under the
environment set in Table III and Table IV whose
simulation results are shown in Fig. 12.
TABLE. III. PARAMETER OF SIMULATION SCENARIOS
BEB Algorithm PBCA pPCA
CWmin=16 n0= 5 n 0= 5
CWmax=512 RPW=32
Maximum backoff times is 7
Simulation time is 200 slots
Actual number of node = 30
TABLE. IV. PARAMETER OF SIMULATION SCENARIOS
BEB Algorithm PBCA pPCA
CWmin=16 n0= 30 n0= 30
CWmax=512 RPW=32
Maximum backoff times is 7
Simulation time is 200 slots
Actual number of node = 5
Journal of Communications Vol. 9, No. 11, November 2014
©2014 Engineering and Technology Publishing 812

0 50 100 150 2000
0.05
0.1
0.15
0.2
0.25
0.3
0.35
0.4
simulation time(slot)
Th
rou
gh
pu
t(S
)
BEBA
PBCA
pPCA
(a) Throughputs Based on Parameter Setting of Table. III
0 50 100 150 2000.1
0.15
0.2
0.25
0.3
0.35
0.4
0.45
0.5
simulation time(slot)
Th
rou
gh
pu
t(S
)
BEBA
PBCA
pPCA
(b) Throughputs Based on Parameter Setting of Table. IV
Fig. 12. Stability adjustment time of three algorithms
Simulation results of Fig. 12 (a) show that simulation
time of PBCA is smaller than that of BEB and pPCA
when the number of system node is big and bigger than
initial estimated node number. As limited by update
window, adjustment time of pPCA is the longest and that
of BEB presents twice of fluctuation. Results of Fig. 12
(b) show that simulation time of pPCA is still the longest
while that of BEB is the shortest when the number of
system node is small and smaller than initial estimated
node number. However, stable throughputs of BEB and
pPCA are obviously smaller than that of PBCA.
C.
Complexity Analysis of Algorithms
As MAC Layer lies in the bottom position of network
communication system, DSP Chip or Microcontroller are
generally used to finish the relevant algorithms during the
physical design process of MAC Protocol. Limited by
resources of DSP or Microcontroller, functional operation
and floating-point calculation are obviously lower than
multiplication and division. During the adjustment
process of BEB Algorithm, packets are transmitted when
backoff count value iBC
is 0. After conflicts happen,
multiply its backoff window value by 2 and randomly
choose a value from [0, Wi -1] in even-distributed way
which is treated as backoff count value iBC . Then
iBC subtracts 1 each time it goes through one slot.
Therefore this algorithm mainly does simple subtraction.
PBCA corrects the estimated value of nodes in the system
according to the last-time detected channel condition
which needs once of addition and subtraction and once or
twice of multiplication. During the adjustment process of
pPCA, logarithm operation and at least once of division
operation should be done to count the estimated node
number of system. In the design of MAC which is based
on dynamic spectrum sharing communication system,
driving function library based on Linux does not provide
logarithmic function in which Taylor series needs using
to do approximation which also increases computation
complexity. Therefore in terms of calculation complexity,
BEB Algorithm is the most simple, the second PBCA and
pPCA is the most complex.
V. CONCLUSIONS
Through numerical analysis and simulation testing, it
is shown that all of BEB Algorithm, PBCA and pPCA
can realize the stability of slotted ALOHA Protocol.
When node number is small, average throughput and
adjustment time of PBCA are both better than those of
BEB and pPCA. When node number is big, average
throughputs of three algorithms are basically the same
while adjustment time of pPCA is longer. In terms of the
computational complexities of the three algorithms,
pPCA is obviously more complex than the other two.
Comprehensively considering, PBCA is a more excellent
type of stability control algorithm of slotted ALOHA
when node number is small, while BEB Algorithm is
better when node number is large.
REFERENCES
[1] R. L. Rivest, “Network control by bayesian broadcast,” IEEE
Trans. on Information Theory. vol. 33, no. 3, pp. 323-328, Mar.
1993.
[2] T. B. M. Richard, M. Vishal, and R. Dan, “An analysis of
generalized slotted-aloha protocols,” IEEE/ACM Trans. on
Networking. vol. 17, no. 3, pp. 936-949, Mar. 2009.
[3] P. C. Loren, “Control procedures for slotted Aloha systems that
achieve stability,” ACM SIGCOMM Computer Comm. Review. vol.
16, no. 3, pp. 302 -309, Mar. 1986.
[4] J. H. Sarker and H. T. Mouftah, “A retransmission cut-off random
access protocol with multi-packet reception capability for wireless
networks,” in Proc. 3th Int. Conf. on Sensor Tech. and App.,
Athens, 2009, pp. 217-222.
[5] J. H. Sarker, “Stability of random access protocol with newly
generated packet rejection and retransmission cut-off,” in Proc.
Wireless Tele. Symp., Pomana, 2006, pp. 1-7.
[6] J. H. Sarker, “Stable and unstable operating regions of slotted
ALOHA with number of retransmission attempts and number of
power levels,” IEEE Proceedings Communications, vol. 153, no. 3,
pp. 355-364, Mar. 2006.
[7] G. Liva, “Graph-based analysis and optimization of contention
resolution diversity slotted aloha,” IEEE Trans. on
Commu0nications. vol. 59, no. 2, pp. 477-487, Feb. 2011.
[8] P. Jaeok and M. van der Schaar, "Medium access control protocols
with memory," IEEE/ACM Transactions on Networking, vol. 18,
no. 6, pp. 1921-1934, Jun, 2010.
[9] S. H. Wang and Y. P. Hong, "Transmission control with imperfect
CSI information," IEEE Trans. on Wireless Communications, vol.
8, no. 10, pp. 5214-5224,Oct. 2009.
[10] M. Ivanovich, M. Zukerman, and F. Cameron, "A study of
deadlock models for a multiservice medium access protocol
Journal of Communications Vol. 9, No. 11, November 2014
©2014 Engineering and Technology Publishing 813
Journal of Communications Vol. 9, No. 11, November 2014
©2014 Engineering and Technology Publishing 814
employing a slotted aloha signalling channel," IEEE/ACM
Transactions on Networking, vol. 8, no. 6, pp. 800-811, June 2000.
[11] F. Calì, M. Conti, and E. Gregori, "Dynamic tuning of the IEEE
802.11 protocol to achieve a theoretical throughput limit,"
IEEE/ACM Trans. on Networking, vol. 8, no. 6, pp. 785-799, June
2000.
[12] G. Bianchi, "Performance analysis of the IEEE 802.11 distributed
coordination function," IEEE Journal on Selected Areas in
Communications, vol. 18, no. 3, pp. 535-547, Mar. 2000.
Fei Fang was born in Sichuan Province, China,
in 1974. He received the B.S. degree from the
Southwest University of China (SWU),
ChongQing, in 1997 and the M.S. degree from
the ChongQing University of Posts and
Telecommunications of China (CQUPT),
ChongQing, in 2004. He is currently pursuing
the Ph.D. degree with the School of
Communication and Information Engineering,
University of Electronic Science and Technology of China (UESTC).
His research interests include Wireless Local Area Network,
CognCognitive radio Wireless network.
Wen-Chun Yu was born in Sichuan Province,
China, in 1974. He received the B.S. degree
from the Sichuan Normal University of China
(SICNUU), ChenQu, in 1997 and the M.S.
degree from the Southwest Jiaotong
University of China (WJITU), Chendu, in
2009. His research interests include Wireless
Local Area Network Large data processing of
network,Data Mining.