an international perspective on the new ... - productivity · an international perspective on the...
TRANSCRIPT

An International Perspective on the New Zealand Productivity Paradox New Zealand Productivity Commission Working Paper 2014/01
April 2014
Authors: Alain de Serres, Naomitsu Yashiro and Hervé Boulhol
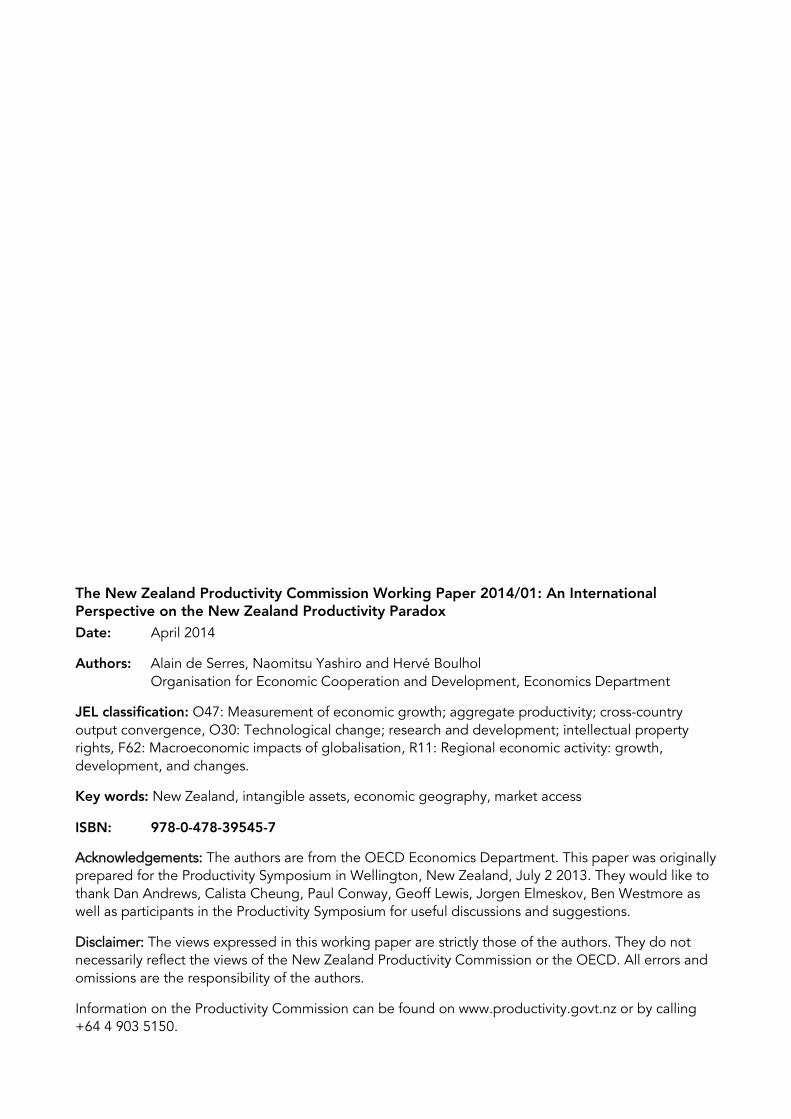
The New Zealand Productivity Commission Working Paper 2014/01: An International Perspective on the New Zealand Productivity Paradox Date: April 2014
Authors: Alain de Serres, Naomitsu Yashiro and Hervé Boulhol Organisation for Economic Cooperation and Development, Economics Department
JEL classification: O47: Measurement of economic growth; aggregate productivity; cross-country output convergence, O30: Technological change; research and development; intellectual property rights, F62: Macroeconomic impacts of globalisation, R11: Regional economic activity: growth, development, and changes.
Key words: New Zealand, intangible assets, economic geography, market access
ISBN: 978-0-478-39545-7
Acknowledgements: The authors are from the OECD Economics Department. This paper was originally prepared for the Productivity Symposium in Wellington, New Zealand, July 2 2013. They would like to thank Dan Andrews, Calista Cheung, Paul Conway, Geoff Lewis, Jorgen Elmeskov, Ben Westmore as well as participants in the Productivity Symposium for useful discussions and suggestions.
Disclaimer: The views expressed in this working paper are strictly those of the authors. They do not necessarily reflect the views of the New Zealand Productivity Commission or the OECD. All errors and omissions are the responsibility of the authors.
Information on the Productivity Commission can be found on www.productivity.govt.nz or by calling +64 4 903 5150.

An International Perspective on the New Zealand Productivity Paradox iii
Abstract New Zealand lags behind advanced OECD countries in productivity and per capita income levels, in spite of what can be characterised as growth-friendly structural policy settings. Using an augmented-Solow growth framework, this paper explores the “productivity paradox”, and identifies the main determinants of New Zealand’s economic under-performance. We find a sizeable contribution from New Zealand’s gap in knowledge-based capital (also referred to as intangible assets) and from its disadvantage in economic geography captured by an indicator of access to markets and suppliers. For instance, New Zealand’s low R&D intensity vis-à-vis advanced OECD countries can explain up to one-third of the productivity gap. The room for catch-up also extends to other types of intangible assets such as information and communication technology (ICT) and managerial practices. Furthermore, unfavourable access to large markets and suppliers of intermediate goods limits New Zealand’s trade intensity, especially its integration with global value chains where intensive transfer of advanced technologies often occurs. Overall, the empirical estimates provided in the paper suggest that remote access to markets and suppliers and low investment in innovation (as measured by R&D intensity) could together account for between 17 to 22 percentage points of the 27 percent productivity gap vis-à-vis the average of 20 OECD countries.

iv An International Perspective on the New Zealand Productivity Paradox
Contents Abstract ..........................................................................................................................................iii
1 Introduction ........................................................................................................................... 1 1.1 The nature and magnitude of the productivity paradox ........................................................ 1 1.2 Roadmap................................................................................................................................. 2
2 The direct contribution of physical and human capital........................................................... 3
3 The role of knowledge-based capital and its growing importance as a source of productivity ........................................................................................................................... 8 3.1 The growth contribution from KBC comes from specific characteristics ............................. 10 3.2 Investment in KBC appears to be relatively low in New Zealand, particularly spending
on R&D .................................................................................................................................. 13 3.3 There is more to innovation than R&D, especially in a country with a highly-developed
service sector ........................................................................................................................ 17
4 In search of a market: the role of geographic distance and its impact on productivity through international trade ................................................................................................. 23 4.1 Low trade intensity may account for a sizeable share of the productivity gap ................... 24 4.2 New Zealand could benefit from further integration into GVCs in innovation-intensive
sectors ................................................................................................................................... 27 4.3 The composition of trade and the degree of interconnectedness also matter ................... 29 4.4 Distance cannot be changed but its impact can be minimised ........................................... 31
5 Concluding remarks ............................................................................................................. 33
References .................................................................................................................................... 35 Tables Table 1 Estimation results from the augmented-Solow model .......................................................... 6 Table 2 The classification of intangible assets: an input (flow) and output (stock) perspective ......... 9 Table 3 The importance of intangible assets as a source of growth: summary of growth
accounting exercises ............................................................................................................ 12
Figures Figure 1 Growth performance indicator for New Zealand ................................................................... 1 Figure 2 Average productivity growth against the initial level, 2001-2011 ......................................... 2 Figure 3 Observed gap in GDP/capita versus the gap predicted from structural policies, 2009 ....... 2 Figure 4 The gap in non-residential investment rate and human capital stock ................................... 4 Figure 5 Country fixed effect and residual from Solow regression ...................................................... 5 Figure 6 Investments in physical and intangible assets as percentage of business sector value-
added, 2010 ........................................................................................................................... 8 Figure 7 R&D as percentage of GDP by sector, 2011 ........................................................................ 13 Figure 8 Country fixed effects from base Solow regression regressed against average R&D
intensity ................................................................................................................................. 15 Figure 9 Relative productivity from Solow model incorporating R&D ............................................... 15 Figure 10 Financial support for private R&D investment ..................................................................... 17 Figure 11 Patents and trademarks ........................................................................................................ 18 Figure 12 The gap in ICT investment rates (New Zealand compared to selected countries) ............. 19 Figure 13 Average management quality score in the manufacturing sector; selected countries ....... 20 Figure 14 The distribution of managerial practices across firms: New Zealand versus the United
States .................................................................................................................................... 21 Figure 15 Additional capital attracted by a firm that increases its patent stock by 10% ..................... 22 Figure 16 Country size and trade intensity ........................................................................................... 25 Figure 17 Indices of access to markets and suppliers, 2010 ................................................................ 25

An International Perspective on the New Zealand Productivity Paradox v
Figure 18 Relative productivity from Solow model incorporating Market and Supplier Access (MASA) and R&D .................................................................................................................. 26
Figure 19 Participation in global value chains (through backward and forward linkage) .................... 28 Figure 20 Market and supplier access and GVC participation, 2009 ................................................... 28 Figure 21 New Zealand’s participation in GVCs by industries, 2009 ................................................... 29 Figure 22 Service value-added as a share of gross exports ................................................................. 30 Figure 23 Barriers to international trade ............................................................................................... 31 Figure 24 The gap between actual export share and share predicted from gravity model
estimates ............................................................................................................................... 32 Figure 25 New Zealand’s trade facilitation performance: OECD indicators ........................................ 33

An International Perspective on the New Zealand Productivity Paradox 1
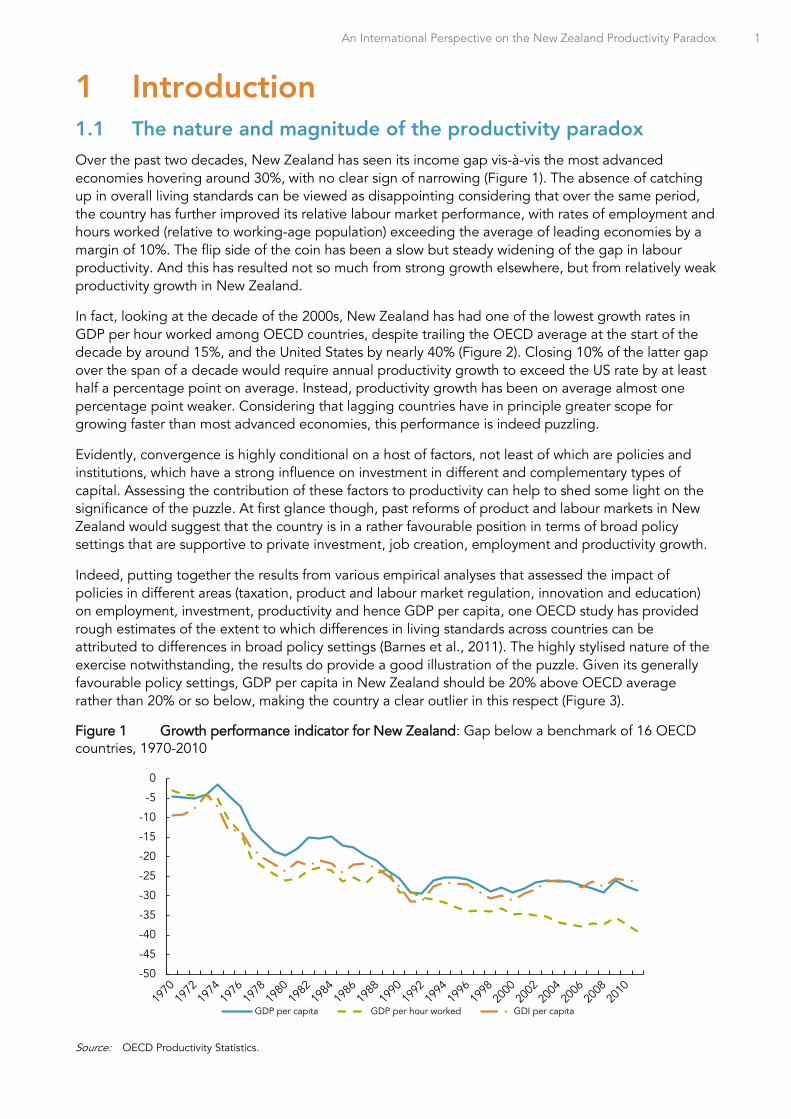
1 Introduction 1.1 The nature and magnitude of the productivity paradox Over the past two decades, New Zealand has seen its income gap vis-à-vis the most advanced economies hovering around 30%, with no clear sign of narrowing (Figure 1). The absence of catching up in overall living standards can be viewed as disappointing considering that over the same period, the country has further improved its relative labour market performance, with rates of employment and hours worked (relative to working-age population) exceeding the average of leading economies by a margin of 10%. The flip side of the coin has been a slow but steady widening of the gap in labour productivity. And this has resulted not so much from strong growth elsewhere, but from relatively weak productivity growth in New Zealand.
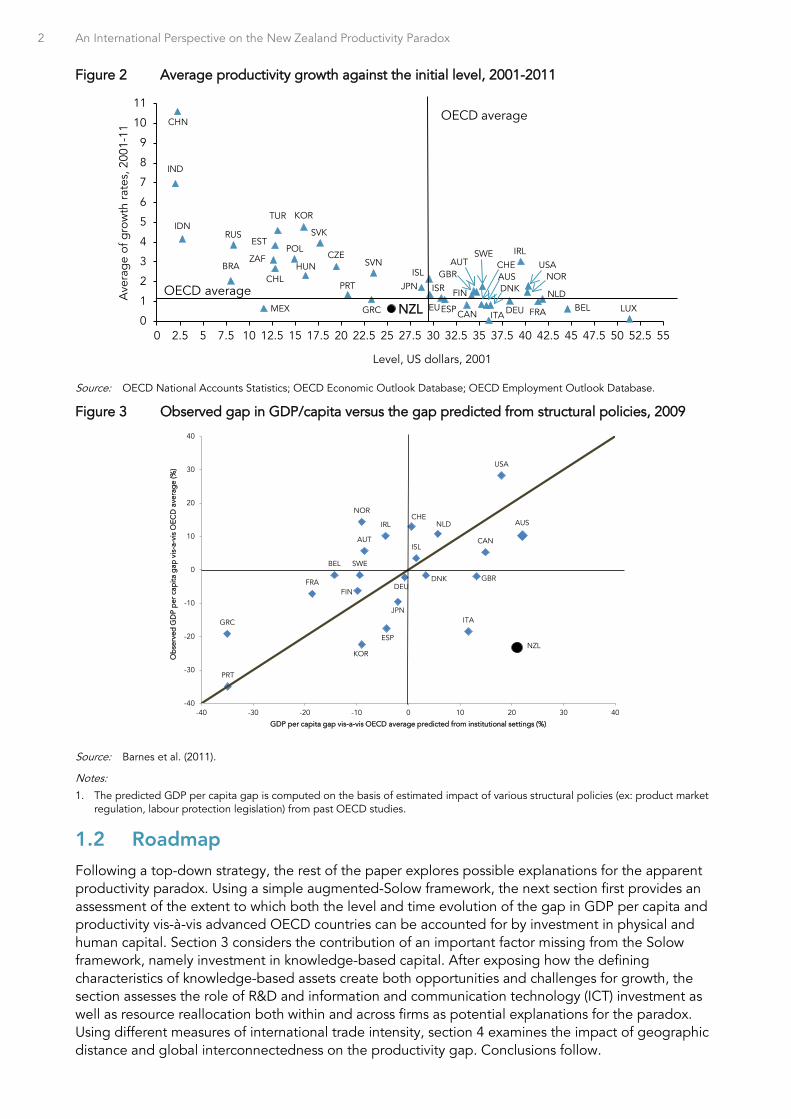
In fact, looking at the decade of the 2000s, New Zealand has had one of the lowest growth rates in GDP per hour worked among OECD countries, despite trailing the OECD average at the start of the decade by around 15%, and the United States by nearly 40% (Figure 2). Closing 10% of the latter gap over the span of a decade would require annual productivity growth to exceed the US rate by at least half a percentage point on average. Instead, productivity growth has been on average almost one percentage point weaker. Considering that lagging countries have in principle greater scope for growing faster than most advanced economies, this performance is indeed puzzling.
Evidently, convergence is highly conditional on a host of factors, not least of which are policies and institutions, which have a strong influence on investment in different and complementary types of capital. Assessing the contribution of these factors to productivity can help to shed some light on the significance of the puzzle. At first glance though, past reforms of product and labour markets in New Zealand would suggest that the country is in a rather favourable position in terms of broad policy settings that are supportive to private investment, job creation, employment and productivity growth.
Indeed, putting together the results from various empirical analyses that assessed the impact of policies in different areas (taxation, product and labour market regulation, innovation and education) on employment, investment, productivity and hence GDP per capita, one OECD study has provided rough estimates of the extent to which differences in living standards across countries can be attributed to differences in broad policy settings (Barnes et al., 2011). The highly stylised nature of the exercise notwithstanding, the results do provide a good illustration of the puzzle. Given its generally favourable policy settings, GDP per capita in New Zealand should be 20% above OECD average rather than 20% or so below, making the country a clear outlier in this respect (Figure 3).
Figure 1 Growth performance indicator for New Zealand: Gap below a benchmark of 16 OECD countries, 1970-2010
Source: OECD Productivity Statistics.
-50
-45
-40
-35
-30
-25
-20
-15
-10
-5
0
GDP per capita GDP per hour worked GDI per capita
2 An International Perspective on the New Zealand Productivity Paradox
Figure 2 Average productivity growth against the initial level, 2001-2011
Source: OECD National Accounts Statistics; OECD Economic Outlook Database; OECD Employment Outlook Database.
Figure 3 Observed gap in GDP/capita versus the gap predicted from structural policies, 2009
Source: Barnes et al. (2011).
Notes:
1. The predicted GDP per capita gap is computed on the basis of estimated impact of various structural policies (ex: product market regulation, labour protection legislation) from past OECD studies.
1.2 Roadmap Following a top-down strategy, the rest of the paper explores possible explanations for the apparent productivity paradox. Using a simple augmented-Solow framework, the next section first provides an assessment of the extent to which both the level and time evolution of the gap in GDP per capita and productivity vis-à-vis advanced OECD countries can be accounted for by investment in physical and human capital. Section 3 considers the contribution of an important factor missing from the Solow framework, namely investment in knowledge-based capital. After exposing how the defining characteristics of knowledge-based assets create both opportunities and challenges for growth, the section assesses the role of R&D and information and communication technology (ICT) investment as well as resource reallocation both within and across firms as potential explanations for the paradox. Using different measures of international trade intensity, section 4 examines the impact of geographic distance and global interconnectedness on the productivity gap. Conclusions follow.
AUS
AUT
BELCAN
CHL
CZE
DNK
EST
FIN
FRADEUGRC
HUNISL
IRL
ISR
ITA
JPN
KOR
LUXMEX
NLD
NZL
NOR
POL
PRT
SVK
SVN
ESP
SWECHE
TUR
GBRUSA
RUS
BRA
CHN
IND
IDN
ZAF
EU
0
1
2
3
4
5
6
7
8
9
10
11
0 2.5 5 7.5 10 12.5 15 17.5 20 22.5 25 27.5 30 32.5 35 37.5 40 42.5 45 47.5 50 52.5 55
Ave
rag
e of
gro
wth
rat
es, 2
001-
11
Level, US dollars, 2001
OECD average
OECD average
AUS
AUT
BEL
CAN
CHE
DEUDNK
ESP
FINFRA GBR
GRC
IRL
ISL
ITAJPN
KOR
NLD
NOR
NZL
PRT
SWE
USA
-40
-30
-20
-10
0
10
20
30
40
-40 -30 -20 -10 0 10 20 30 40
Ob
serv
ed G
DP
per
cap
ita g
ap v
is-a
-vis
OEC
D a
vera
ge
(%)
GDP per capita gap vis-a-vis OECD average predicted from institutional settings (%)
An International Perspective on the New Zealand Productivity Paradox 3
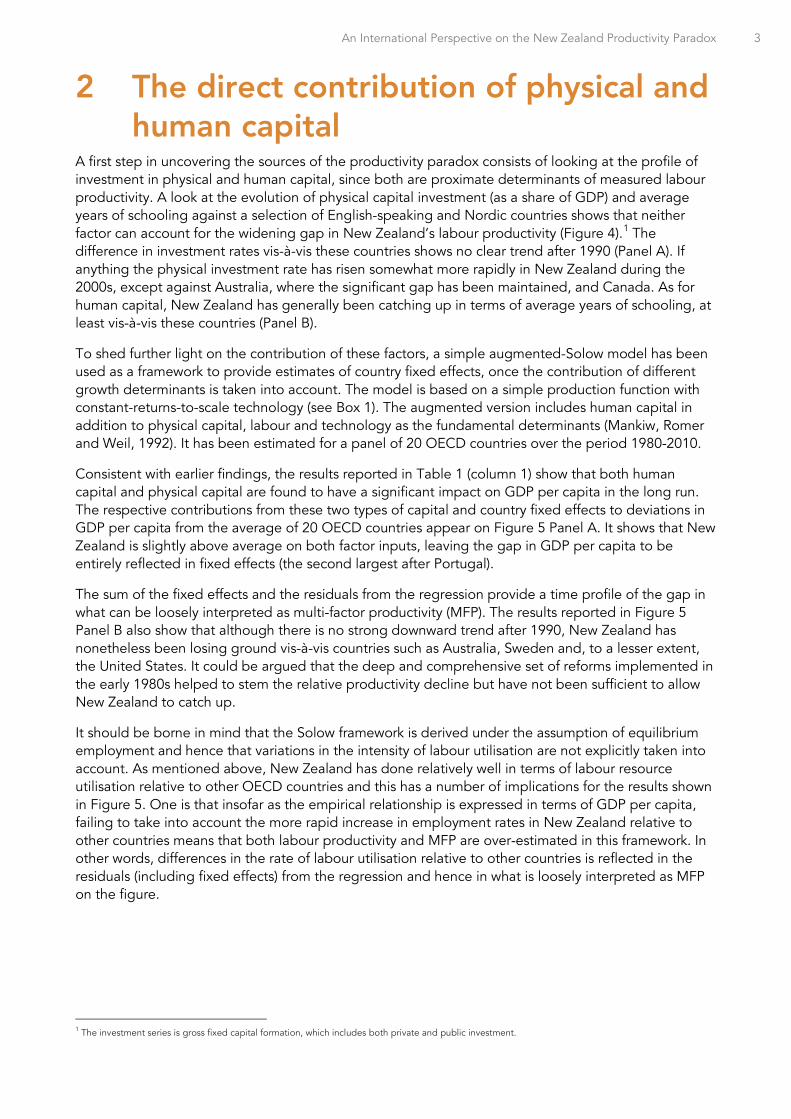
2 The direct contribution of physical and human capital
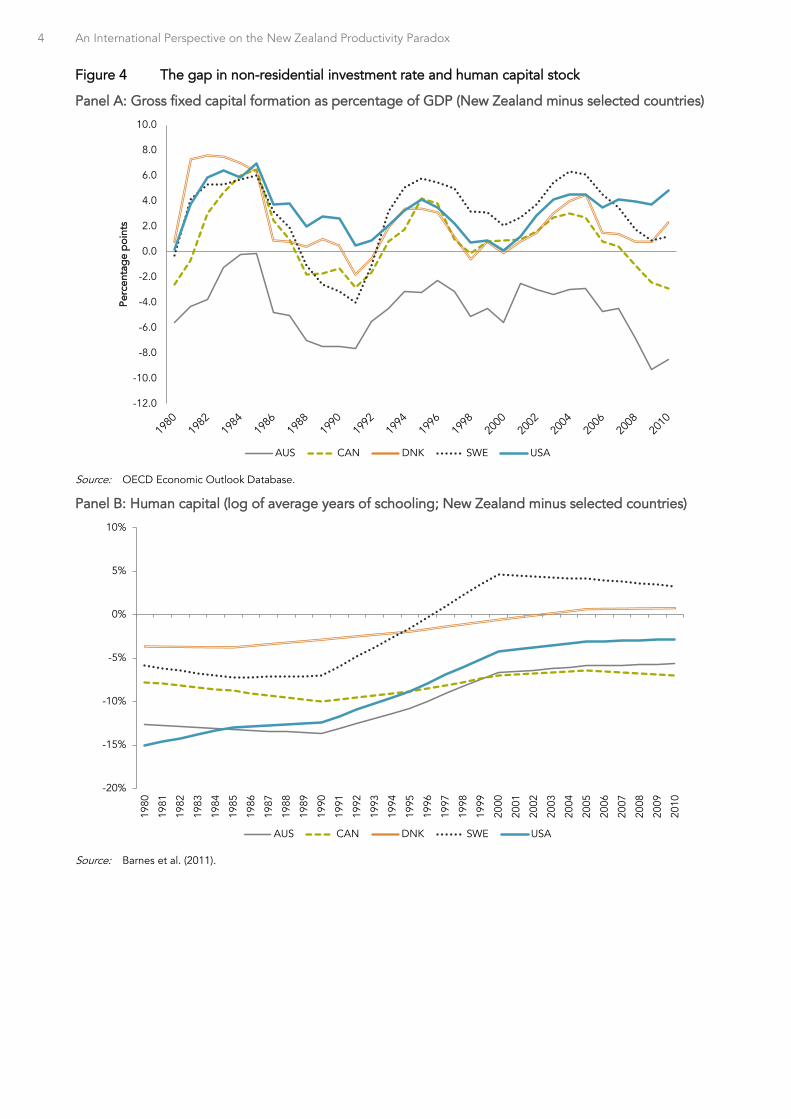
A first step in uncovering the sources of the productivity paradox consists of looking at the profile of investment in physical and human capital, since both are proximate determinants of measured labour productivity. A look at the evolution of physical capital investment (as a share of GDP) and average years of schooling against a selection of English-speaking and Nordic countries shows that neither factor can account for the widening gap in New Zealand’s labour productivity (Figure 4).1 The difference in investment rates vis-à-vis these countries shows no clear trend after 1990 (Panel A). If anything the physical investment rate has risen somewhat more rapidly in New Zealand during the 2000s, except against Australia, where the significant gap has been maintained, and Canada. As for human capital, New Zealand has generally been catching up in terms of average years of schooling, at least vis-à-vis these countries (Panel B).
To shed further light on the contribution of these factors, a simple augmented-Solow model has been used as a framework to provide estimates of country fixed effects, once the contribution of different growth determinants is taken into account. The model is based on a simple production function with constant-returns-to-scale technology (see Box 1). The augmented version includes human capital in addition to physical capital, labour and technology as the fundamental determinants (Mankiw, Romer and Weil, 1992). It has been estimated for a panel of 20 OECD countries over the period 1980-2010.
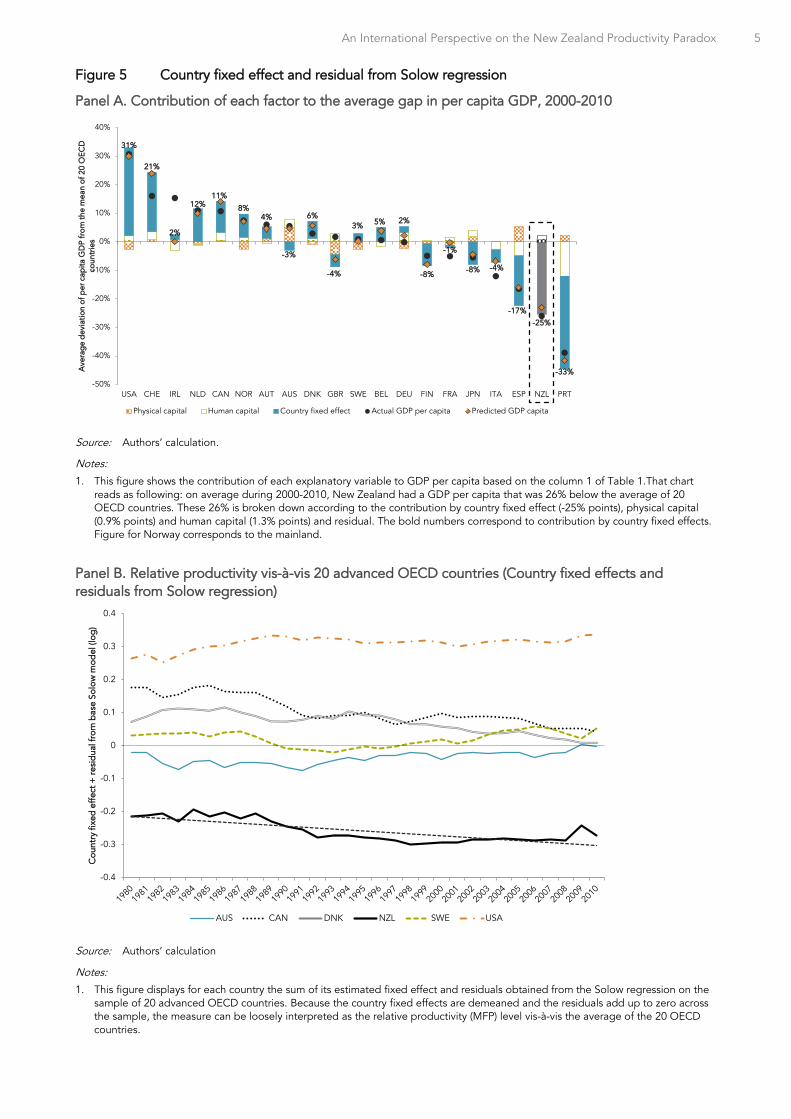
Consistent with earlier findings, the results reported in Table 1 (column 1) show that both human capital and physical capital are found to have a significant impact on GDP per capita in the long run. The respective contributions from these two types of capital and country fixed effects to deviations in GDP per capita from the average of 20 OECD countries appear on Figure 5 Panel A. It shows that New Zealand is slightly above average on both factor inputs, leaving the gap in GDP per capita to be entirely reflected in fixed effects (the second largest after Portugal).
The sum of the fixed effects and the residuals from the regression provide a time profile of the gap in what can be loosely interpreted as multi-factor productivity (MFP). The results reported in Figure 5 Panel B also show that although there is no strong downward trend after 1990, New Zealand has nonetheless been losing ground vis-à-vis countries such as Australia, Sweden and, to a lesser extent, the United States. It could be argued that the deep and comprehensive set of reforms implemented in the early 1980s helped to stem the relative productivity decline but have not been sufficient to allow New Zealand to catch up.
It should be borne in mind that the Solow framework is derived under the assumption of equilibrium employment and hence that variations in the intensity of labour utilisation are not explicitly taken into account. As mentioned above, New Zealand has done relatively well in terms of labour resource utilisation relative to other OECD countries and this has a number of implications for the results shown in Figure 5. One is that insofar as the empirical relationship is expressed in terms of GDP per capita, failing to take into account the more rapid increase in employment rates in New Zealand relative to other countries means that both labour productivity and MFP are over-estimated in this framework. In other words, differences in the rate of labour utilisation relative to other countries is reflected in the residuals (including fixed effects) from the regression and hence in what is loosely interpreted as MFP on the figure.
1 The investment series is gross fixed capital formation, which includes both private and public investment.
4 An International Perspective on the New Zealand Productivity Paradox
Figure 4 The gap in non-residential investment rate and human capital stock
Panel A: Gross fixed capital formation as percentage of GDP (New Zealand minus selected countries)
Source: OECD Economic Outlook Database.
Panel B: Human capital (log of average years of schooling; New Zealand minus selected countries)
Source: Barnes et al. (2011).
-12.0
-10.0
-8.0
-6.0
-4.0
-2.0
0.0
2.0
4.0
6.0
8.0
10.0Pe
rcen
tag
e p
oint
s
AUS CAN DNK SWE USA
-20%
-15%
-10%
-5%
0%
5%
10%
1980
1981
1982
1983
1984
1985
1986
1987
1988
1989
1990
1991
1992
1993
1994
1995
1996
1997
1998
1999
2000
2001
2002
2003
2004
2005
2006
2007
2008
2009
2010
AUS CAN DNK SWE USA
An International Perspective on the New Zealand Productivity Paradox 5
Figure 5 Country fixed effect and residual from Solow regression
Panel A. Contribution of each factor to the average gap in per capita GDP, 2000-2010
Source: Authors’ calculation.
Notes:
1. This figure shows the contribution of each explanatory variable to GDP per capita based on the column 1 of Table 1.That chart reads as following: on average during 2000-2010, New Zealand had a GDP per capita that was 26% below the average of 20 OECD countries. These 26% is broken down according to the contribution by country fixed effect (-25% points), physical capital (0.9% points) and human capital (1.3% points) and residual. The bold numbers correspond to contribution by country fixed effects. Figure for Norway corresponds to the mainland.
Panel B. Relative productivity vis-à-vis 20 advanced OECD countries (Country fixed effects and residuals from Solow regression)
Source: Authors’ calculation
Notes:
1. This figure displays for each country the sum of its estimated fixed effect and residuals obtained from the Solow regression on the sample of 20 advanced OECD countries. Because the country fixed effects are demeaned and the residuals add up to zero across the sample, the measure can be loosely interpreted as the relative productivity (MFP) level vis-à-vis the average of the 20 OECD countries.
31%
21%
2%
12%11%
8%4%
-3%
6%
-4%
3% 5% 2%
-8%
-1%
-8% -4%
-17%
-25%
-33%
-50%
-40%
-30%
-20%
-10%
0%
10%
20%
30%
40%
USA CHE IRL NLD CAN NOR AUT AUS DNK GBR SWE BEL DEU FIN FRA JPN ITA ESP NZL PRT
Ave
rag
e d
evia
tion
of p
er c
apita
GD
P fr
om th
e m
ean
of 2
0 O
ECD
co
untr
ies
Physical capital Human capital Country fixed effect Actual GDP per capita Predicted GDP capita
d
-0.4
-0.3
-0.2
-0.1
0
0.1
0.2
0.3
0.4
Cou
ntry
fixe
d e
ffec
t + r
esid
ual f
rom
bas
e So
low
mod
el (l
og)
AUS CAN DNK NZL SWE USA
6 An International Perspective on the New Zealand Productivity Paradox
Accounting for relatively strong employment growth would imply that the downward trend in New Zealand’s true MFP gap is actually more pronounced than shown on Figure 5, especially after 1990. On the other hand, a second implication concerns the quality aspect of the labour force. One of the characteristics of the relatively good labour market performance of New Zealand is the good integration of low-skilled employees in the workforce. In many countries, especially in Europe, the relatively high measured level of productivity reflects to some extent the low participation of low-skilled workers. According to previous OECD estimates, around 3% of the New Zealand productivity gap vis-à-vis OECD countries during the mid-2000s can be attributed to differences in the labour force composition and the higher share of low-skilled workers (Boulhol and Turner, 2009). Controlling for this factor would slightly narrow the MFP gap in relation to other countries.
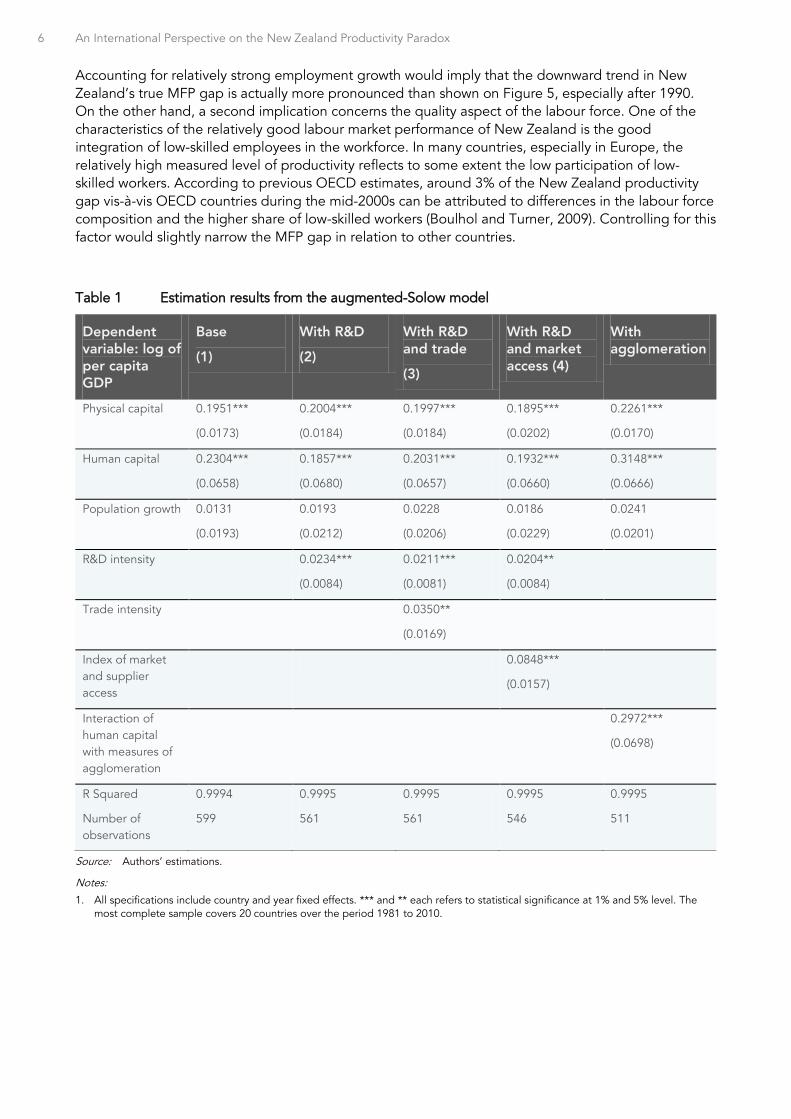
Table 1 Estimation results from the augmented-Solow model
Dependent variable: log of per capita GDP
Base
(1)
With R&D
(2)
With R&D and trade
(3)
With R&D and market access (4)
With agglomeration
Physical capital 0.1951***
(0.0173)
0.2004***
(0.0184)
0.1997***
(0.0184)
0.1895***
(0.0202)
0.2261***
(0.0170)
Human capital 0.2304***
(0.0658)
0.1857***
(0.0680)
0.2031***
(0.0657)
0.1932***
(0.0660)
0.3148***
(0.0666)
Population growth 0.0131
(0.0193)
0.0193
(0.0212)
0.0228
(0.0206)
0.0186
(0.0229)
0.0241
(0.0201)
R&D intensity 0.0234***
(0.0084)
0.0211***
(0.0081)
0.0204**
(0.0084)
Trade intensity 0.0350**
(0.0169)
Index of market and supplier access
0.0848***
(0.0157)
Interaction of human capital with measures of agglomeration
0.2972***
(0.0698)
R Squared
Number of observations
0.9994
599
0.9995
561
0.9995
561
0.9995
546
0.9995
511
Source: Authors’ estimations.
Notes:
1. All specifications include country and year fixed effects. *** and ** each refers to statistical significance at 1% and 5% level. The most complete sample covers 20 countries over the period 1981 to 2010.

An International Perspective on the New Zealand Productivity Paradox 7
Box 1 The empirical approach based on the augmented-Solow model
The Solow (1956) model has been widely used as a theoretical framework to explain differences across countries in income levels and growth patterns. The model is based on a simple production function with constant-returns-to-scale technology. In the augmented version of the model (Mankiw, Romer and Weil, 1992), output is a function of human and physical capital, as well as labour (working-age population) and the level of technology. Under a number of assumptions about the evolution of factors of production over time, the model can be solved for its long-run (steady-state) equilibrium, whereby the path of output per capita is determined by the rates of investment in physical and human capital, the level of technology, and the growth rate of population. In the steady-state, the growth of GDP per capita is driven solely by technology, which is assumed to grow at a (constant) rate set exogenously in the basic model.
For the purpose of this study, the model is first re-estimated with only the basic determinants included in the specification, i.e. proxies for investment in physical and human capital, population growth and technical progress. Then, a number of determinants are added to the benchmark specification throughout the rest of the paper, but the set of additional variables is limited to those related to issues directly addressed in the paper. The reason for leaving other potential variables out is essentially one of parsimony, i.e. to limit the number of specifications, which quickly runs up as each additional determinant is considered. However, this implies that potentially significant control variables are not included, with the risk that this entails in terms of biases and robustness of the results as regards the determinants of economic geography. In order to minimise those risks, all specifications include various combinations of country and year fixed effects and/or linear time trends, all of which are introduced in part to capture omitted variables.
The empirical version of the augmented-Solow model is re-estimated over a panel data set comprising 20 OECD countries and 30 years of observations (1981-2010). In what will serve as the reference model for the rest of the paper, the level of GDP per capita in country i and year t ( tiy )
is regressed on the rate of investment in the total economy ( tiKs , ), the average number of years
of schooling of the population aged 25-64, which is used as a proxy for the stock of human capital ( tihc ) and the growth rate of population ( tin ) augmented by a constant factor introduced
as a proxy for the sum of the trend growth rate of technology and the rate of capital depreciation ( dg + ), with all variables expressed in logs. In principle, a measure of investment in human capital should be used to be consistent with the treatment of physical capital in the basic Solow model. In practice, a proxy for the stock – average number of years of schooling – is used due to the absence of an adequate measure of the flow. However, to ensure consistency with the theoretical model, the measure of stock is introduced both in level and first-difference forms, even in the “level” specification.
The results presented in this paper are based on both a level specification, using a least-square estimator (that corrects for heteroskedasticity and contemporaneous correlations). Due to persistence in the series, control for first-order serial correlation is systematically made when the level specification is estimated. The functional form of the equation is specified as follows:
...,.)(....
1
,
diiuuueedgnLoghcLoghcLogsLogyLog
itititit
ittiititititKit
εερ
γϕβα
+=
++++++∆++=
−
where ie and te are country and year fixed effects, respectively. The parameters α , β , γ are the long-run parameters on the three basic determinants. The parameter ρ is the first-order autocorrelation coefficient used in the level specification.
8 An International Perspective on the New Zealand Productivity Paradox
3 The role of knowledge-based capital and its growing importance as a source of productivity
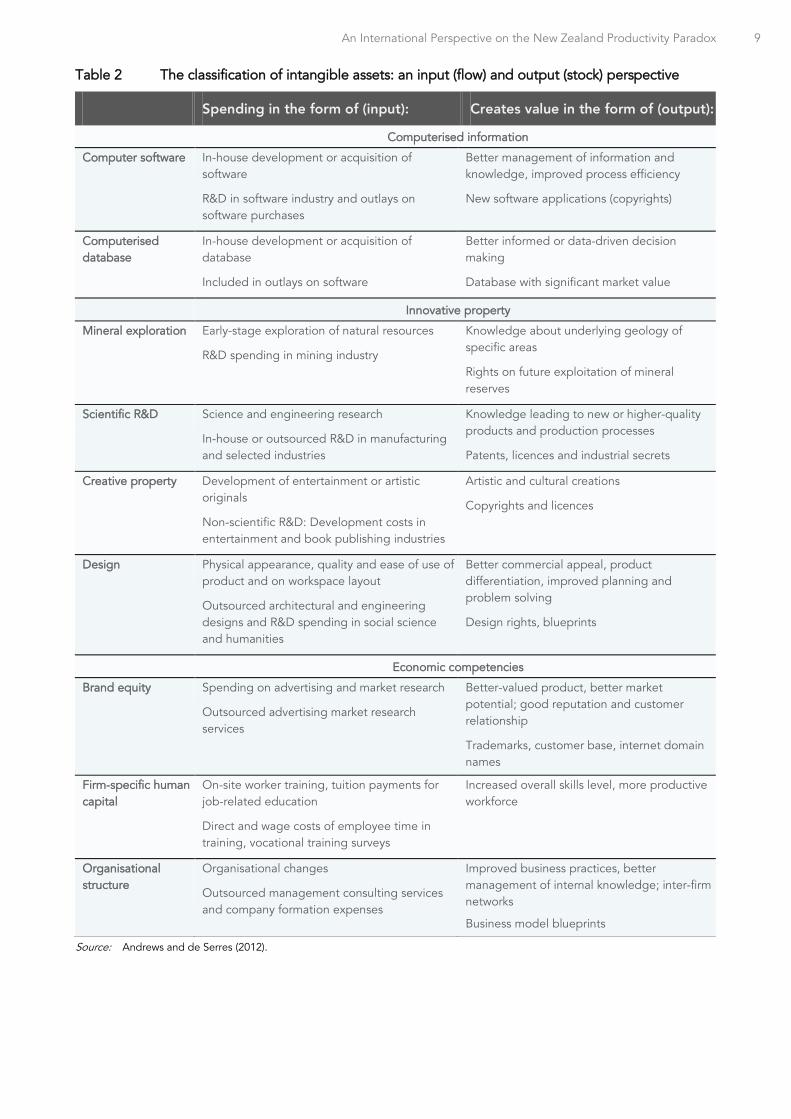
An important factor missing from the basic augmented-Solow framework that could account for the productivity gap is investment in knowledge-based capital (also known as intangible assets). Knowledge-based capital (KBC) encompasses a whole range of assets (or activities aimed at creating such assets) including branding, database development, product design, inter-firm networks, R&D, organisational know-how, etc. Consistent with the approach originally proposed by Corrado, Hulten, and Sichel (2009), these assets are classified under three broad categories: computerised information; innovative property; and economic competencies. For each type of asset included in these categories, a distinction can be made between the effort or input flow that goes into the creation of the asset and the nature of the value or capital stock generated (Table 2), though the one-for-one correspondence between a specific type of investment and the resulting capital stock is sometimes less obvious than suggested2.
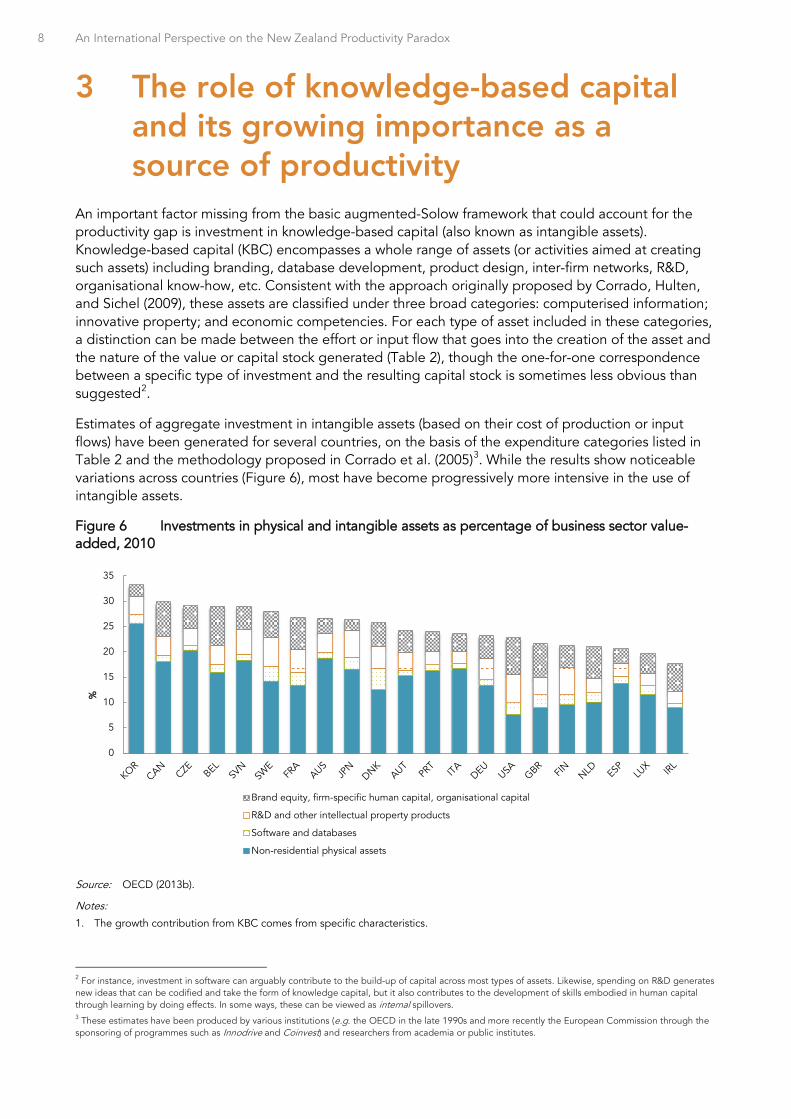
Estimates of aggregate investment in intangible assets (based on their cost of production or input flows) have been generated for several countries, on the basis of the expenditure categories listed in Table 2 and the methodology proposed in Corrado et al. (2005)3. While the results show noticeable variations across countries (Figure 6), most have become progressively more intensive in the use of intangible assets.
Figure 6 Investments in physical and intangible assets as percentage of business sector value-added, 2010
Source: OECD (2013b).
Notes:
1. The growth contribution from KBC comes from specific characteristics.
2 For instance, investment in software can arguably contribute to the build-up of capital across most types of assets. Likewise, spending on R&D generates new ideas that can be codified and take the form of knowledge capital, but it also contributes to the development of skills embodied in human capital through learning by doing effects. In some ways, these can be viewed as internal spillovers. 3 These estimates have been produced by various institutions (e.g. the OECD in the late 1990s and more recently the European Commission through the sponsoring of programmes such as Innodrive and Coinvest) and researchers from academia or public institutes.
0
5
10
15
20
25
30
35
%
Brand equity, firm-specific human capital, organisational capital
R&D and other intellectual property products
Software and databases
Non-residential physical assets
An International Perspective on the New Zealand Productivity Paradox 9
Table 2 The classification of intangible assets: an input (flow) and output (stock) perspective
Spending in the form of (input): Creates value in the form of (output):
Computerised information
Computer software In-house development or acquisition of software
R&D in software industry and outlays on software purchases
Better management of information and knowledge, improved process efficiency
New software applications (copyrights)
Computerised database
In-house development or acquisition of database
Included in outlays on software
Better informed or data-driven decision making
Database with significant market value
Innovative property
Mineral exploration Early-stage exploration of natural resources
R&D spending in mining industry
Knowledge about underlying geology of specific areas
Rights on future exploitation of mineral reserves
Scientific R&D Science and engineering research
In-house or outsourced R&D in manufacturing and selected industries
Knowledge leading to new or higher-quality products and production processes
Patents, licences and industrial secrets
Creative property Development of entertainment or artistic originals
Non-scientific R&D: Development costs in entertainment and book publishing industries
Artistic and cultural creations
Copyrights and licences
Design Physical appearance, quality and ease of use of product and on workspace layout
Outsourced architectural and engineering designs and R&D spending in social science and humanities
Better commercial appeal, product differentiation, improved planning and problem solving
Design rights, blueprints
Economic competencies
Brand equity Spending on advertising and market research
Outsourced advertising market research services
Better-valued product, better market potential; good reputation and customer relationship
Trademarks, customer base, internet domain names
Firm-specific human capital
On-site worker training, tuition payments for job-related education
Direct and wage costs of employee time in training, vocational training surveys
Increased overall skills level, more productive workforce
Organisational structure
Organisational changes
Outsourced management consulting services and company formation expenses
Improved business practices, better management of internal knowledge; inter-firm networks
Business model blueprints
Source: Andrews and de Serres (2012).
10 An International Perspective on the New Zealand Productivity Paradox
3.1 The growth contribution from KBC comes from specific characteristics
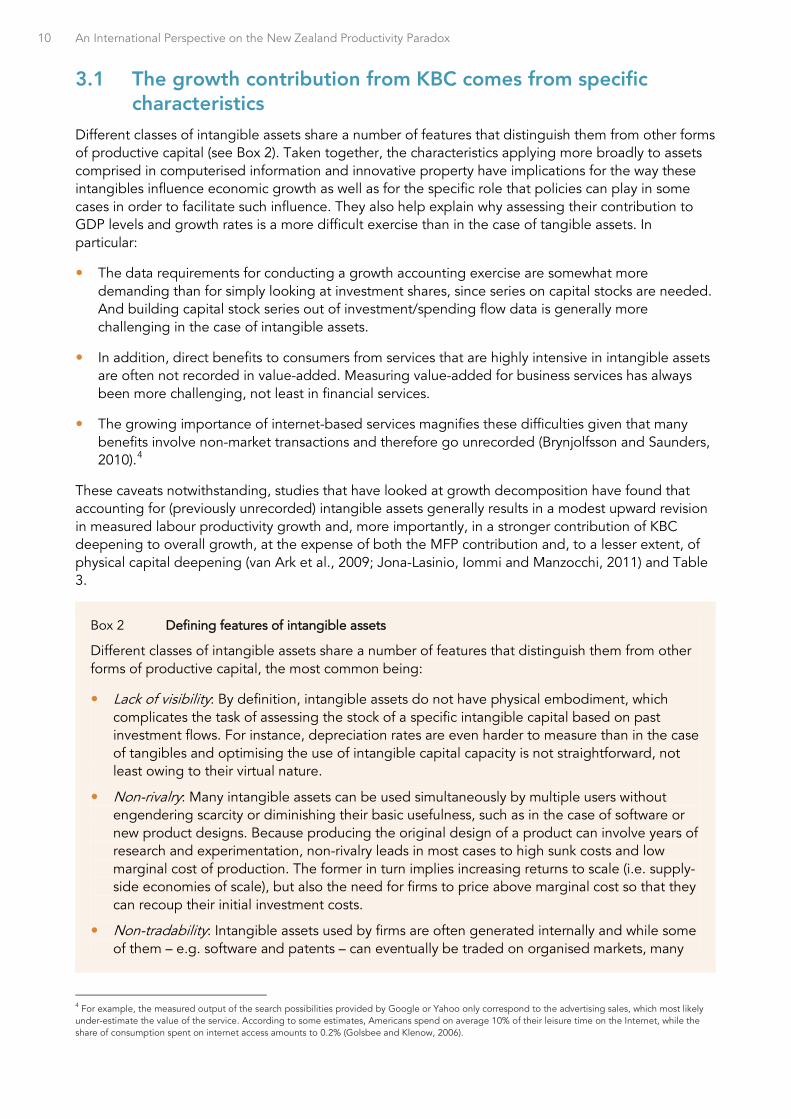
Different classes of intangible assets share a number of features that distinguish them from other forms of productive capital (see Box 2). Taken together, the characteristics applying more broadly to assets comprised in computerised information and innovative property have implications for the way these intangibles influence economic growth as well as for the specific role that policies can play in some cases in order to facilitate such influence. They also help explain why assessing their contribution to GDP levels and growth rates is a more difficult exercise than in the case of tangible assets. In particular:
The data requirements for conducting a growth accounting exercise are somewhat more demanding than for simply looking at investment shares, since series on capital stocks are needed. And building capital stock series out of investment/spending flow data is generally more challenging in the case of intangible assets.
In addition, direct benefits to consumers from services that are highly intensive in intangible assets are often not recorded in value-added. Measuring value-added for business services has always been more challenging, not least in financial services.
The growing importance of internet-based services magnifies these difficulties given that many benefits involve non-market transactions and therefore go unrecorded (Brynjolfsson and Saunders, 2010).4
These caveats notwithstanding, studies that have looked at growth decomposition have found that accounting for (previously unrecorded) intangible assets generally results in a modest upward revision in measured labour productivity growth and, more importantly, in a stronger contribution of KBC deepening to overall growth, at the expense of both the MFP contribution and, to a lesser extent, of physical capital deepening (van Ark et al., 2009; Jona-Lasinio, Iommi and Manzocchi, 2011) and Table 3.
4 For example, the measured output of the search possibilities provided by Google or Yahoo only correspond to the advertising sales, which most likely under-estimate the value of the service. According to some estimates, Americans spend on average 10% of their leisure time on the Internet, while the share of consumption spent on internet access amounts to 0.2% (Golsbee and Klenow, 2006).
Box 2 Defining features of intangible assets
Different classes of intangible assets share a number of features that distinguish them from other forms of productive capital, the most common being:
Lack of visibility: By definition, intangible assets do not have physical embodiment, which complicates the task of assessing the stock of a specific intangible capital based on past investment flows. For instance, depreciation rates are even harder to measure than in the case of tangibles and optimising the use of intangible capital capacity is not straightforward, not least owing to their virtual nature.
Non-rivalry: Many intangible assets can be used simultaneously by multiple users without engendering scarcity or diminishing their basic usefulness, such as in the case of software or new product designs. Because producing the original design of a product can involve years of research and experimentation, non-rivalry leads in most cases to high sunk costs and low marginal cost of production. The former in turn implies increasing returns to scale (i.e. supply-side economies of scale), but also the need for firms to price above marginal cost so that they can recoup their initial investment costs.
Non-tradability: Intangible assets used by firms are often generated internally and while some of them – e.g. software and patents – can eventually be traded on organised markets, many

An International Perspective on the New Zealand Productivity Paradox 11
remain inherently non-marketable, due in part to the difficulty and cost of writing “complete contracts” covering all the possible outcomes. Non-tradability entails the lack of verifiability, particularly from sources external to the firm that invests in intangibles.
Partial-only excludability: In part due to their virtual nature, the property rights of many intangible assets cannot be as clearly defined and well enforced as is the case with tangibles. Insofar as they cannot preclude others from partly enjoying the benefits of these assets, owners do not have full control and may fail to fully appropriate the returns on their investment.
Non-separability: Conversely, intangible assets have in some cases a full value that is firm-specific. Therefore, such assets cannot be separated from the original unit of creation without some loss of value (Jensen and Webster, 2006). One way to think of it is the value that an asset might have in case of bankruptcy procedures.
Knowledge transferability: The conditions under which knowledge can be transferred across firms depend in part on whether it is tacit or codified. To be transferable, tacit knowledge requires some form of embodiment, such as human capital.
The extent to which these characteristics apply to various assets differs across them, as qualitatively reported in the Table below:
Rivalry Tradable (market -based transaction)
Excludability Separability Knowledge transferability
Computerised information Computer software
Fully non-rival
Not for own-account software
Partial only (code-access protected)
Separable High (codified)
Computerised database
Fully non-rival
Not for internally-generated data
Partial only Separable High (codified)
Innovative property
Scientific R&D Fully non-rival
Outsourced R&D services and patents
Partial only Separable High for patents / low for secrets
Creative property
Fully non-rival
Outsourced R&D services and copyrights
Partial only Separable High (codified)
Design Fully non-rival
Outsourced design services and IPR forms
Low for visible products/High for workspace
Separable High (codified)
Economic competencies Brand equity Largely rival Outsourced
marketing services
High/firm-specific
Partly separable Via transfer of firm ownership
Firm-specific human capital
Largely rival Outsourced training
High/firm-specific
Non-separable Via human capital mobility
Organisational structure
Largely non-rival
Outsourced consulting services
Partial only Non-separable Moderate/aspects difficult to codify
12 An International Perspective on the New Zealand Productivity Paradox
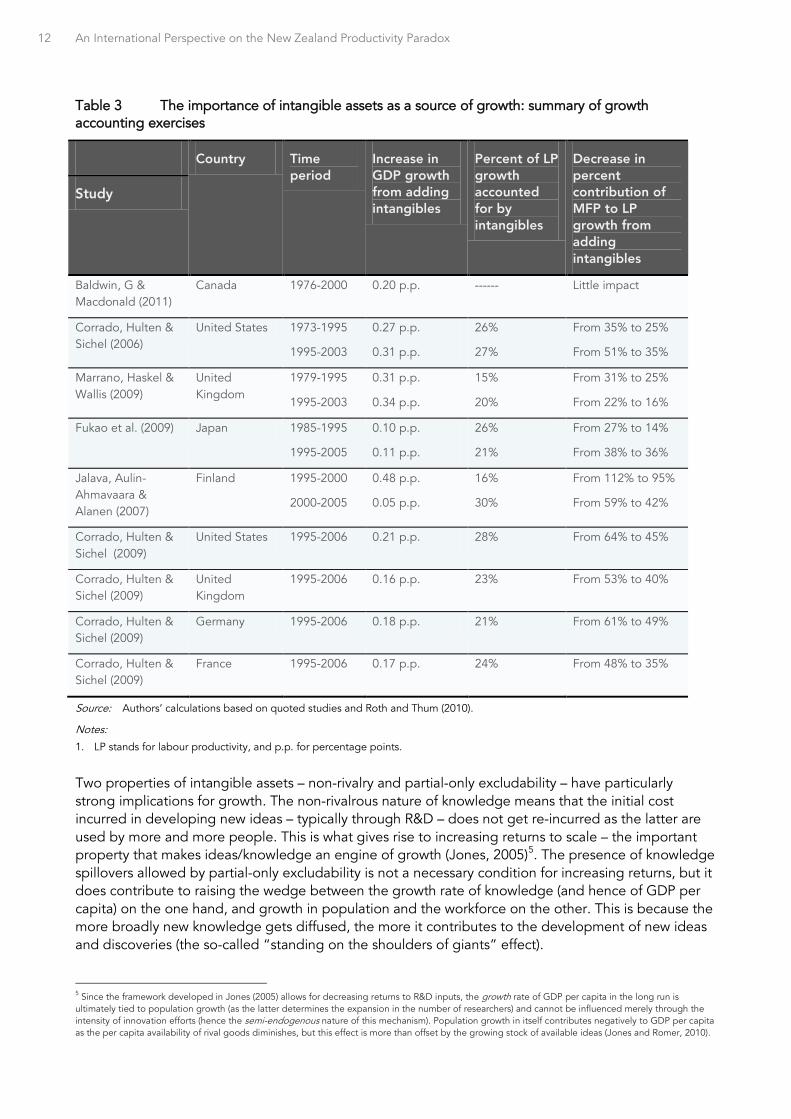
Table 3 The importance of intangible assets as a source of growth: summary of growth accounting exercises
Country Time period
Increase in GDP growth from adding intangibles
Percent of LP growth accounted for by intangibles
Decrease in percent contribution of MFP to LP growth from adding intangibles
Study
Baldwin, G & Macdonald (2011)
Canada 1976-2000 0.20 p.p. ------ Little impact
Corrado, Hulten & Sichel (2006)
United States 1973-1995
1995-2003
0.27 p.p.
0.31 p.p.
26%
27%
From 35% to 25%
From 51% to 35%
Marrano, Haskel & Wallis (2009)
United Kingdom
1979-1995
1995-2003
0.31 p.p.
0.34 p.p.
15%
20%
From 31% to 25%
From 22% to 16%
Fukao et al. (2009) Japan 1985-1995
1995-2005
0.10 p.p.
0.11 p.p.
26%
21%
From 27% to 14%
From 38% to 36%
Jalava, Aulin-Ahmavaara & Alanen (2007)
Finland 1995-2000
2000-2005
0.48 p.p.
0.05 p.p.
16%
30%
From 112% to 95%
From 59% to 42%
Corrado, Hulten & Sichel (2009)
United States 1995-2006 0.21 p.p. 28% From 64% to 45%
Corrado, Hulten & Sichel (2009)
United Kingdom
1995-2006 0.16 p.p. 23% From 53% to 40%
Corrado, Hulten & Sichel (2009)
Germany 1995-2006 0.18 p.p. 21% From 61% to 49%
Corrado, Hulten & Sichel (2009)
France 1995-2006 0.17 p.p. 24% From 48% to 35%
Source: Authors’ calculations based on quoted studies and Roth and Thum (2010).
Notes:
1. LP stands for labour productivity, and p.p. for percentage points.
Two properties of intangible assets – non-rivalry and partial-only excludability – have particularly strong implications for growth. The non-rivalrous nature of knowledge means that the initial cost incurred in developing new ideas – typically through R&D – does not get re-incurred as the latter are used by more and more people. This is what gives rise to increasing returns to scale – the important property that makes ideas/knowledge an engine of growth (Jones, 2005)5. The presence of knowledge spillovers allowed by partial-only excludability is not a necessary condition for increasing returns, but it does contribute to raising the wedge between the growth rate of knowledge (and hence of GDP per capita) on the one hand, and growth in population and the workforce on the other. This is because the more broadly new knowledge gets diffused, the more it contributes to the development of new ideas and discoveries (the so-called “standing on the shoulders of giants” effect).
5 Since the framework developed in Jones (2005) allows for decreasing returns to R&D inputs, the growth rate of GDP per capita in the long run is ultimately tied to population growth (as the latter determines the expansion in the number of researchers) and cannot be influenced merely through the intensity of innovation efforts (hence the semi-endogenous nature of this mechanism). Population growth in itself contributes negatively to GDP per capita as the per capita availability of rival goods diminishes, but this effect is more than offset by the growing stock of available ideas (Jones and Romer, 2010).
An International Perspective on the New Zealand Productivity Paradox 13
3.2 Investment in KBC appears to be relatively low in New Zealand, particularly spending on R&D
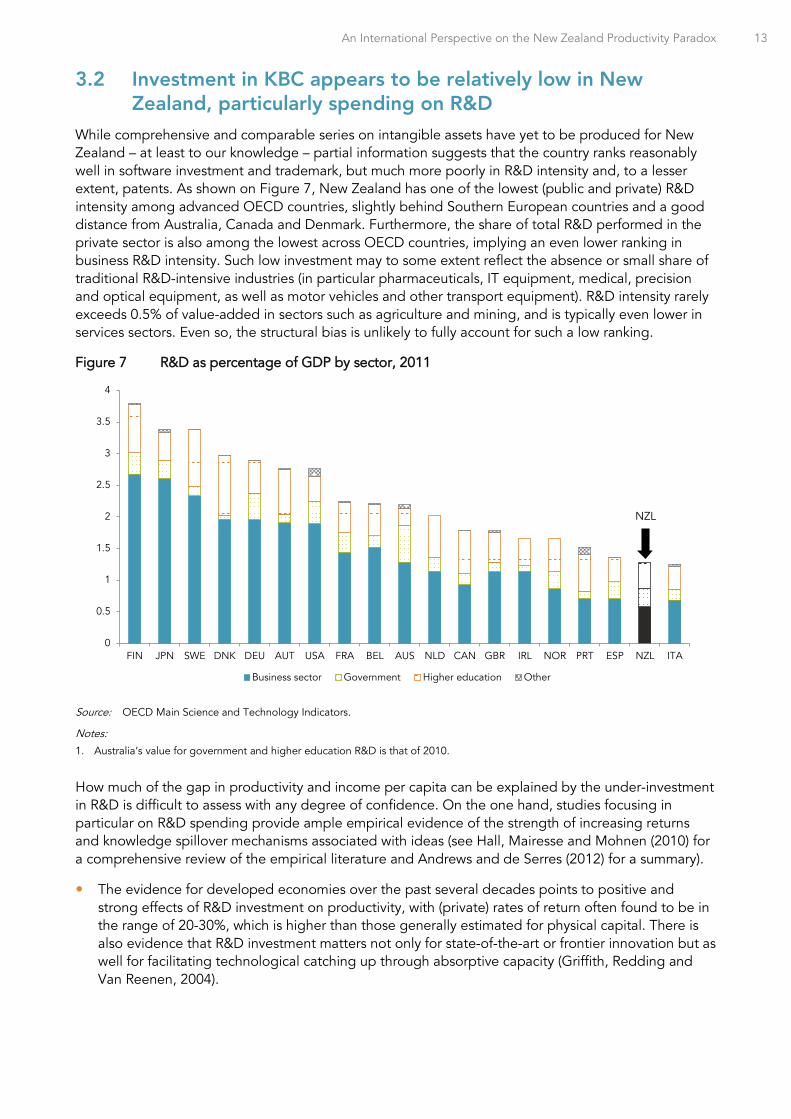
While comprehensive and comparable series on intangible assets have yet to be produced for New Zealand – at least to our knowledge – partial information suggests that the country ranks reasonably well in software investment and trademark, but much more poorly in R&D intensity and, to a lesser extent, patents. As shown on Figure 7, New Zealand has one of the lowest (public and private) R&D intensity among advanced OECD countries, slightly behind Southern European countries and a good distance from Australia, Canada and Denmark. Furthermore, the share of total R&D performed in the private sector is also among the lowest across OECD countries, implying an even lower ranking in business R&D intensity. Such low investment may to some extent reflect the absence or small share of traditional R&D-intensive industries (in particular pharmaceuticals, IT equipment, medical, precision and optical equipment, as well as motor vehicles and other transport equipment). R&D intensity rarely exceeds 0.5% of value-added in sectors such as agriculture and mining, and is typically even lower in services sectors. Even so, the structural bias is unlikely to fully account for such a low ranking.
Figure 7 R&D as percentage of GDP by sector, 2011
Source: OECD Main Science and Technology Indicators.
Notes:
1. Australia’s value for government and higher education R&D is that of 2010.
How much of the gap in productivity and income per capita can be explained by the under-investment in R&D is difficult to assess with any degree of confidence. On the one hand, studies focusing in particular on R&D spending provide ample empirical evidence of the strength of increasing returns and knowledge spillover mechanisms associated with ideas (see Hall, Mairesse and Mohnen (2010) for a comprehensive review of the empirical literature and Andrews and de Serres (2012) for a summary).
The evidence for developed economies over the past several decades points to positive and strong effects of R&D investment on productivity, with (private) rates of return often found to be in the range of 20-30%, which is higher than those generally estimated for physical capital. There is also evidence that R&D investment matters not only for state-of-the-art or frontier innovation but as well for facilitating technological catching up through absorptive capacity (Griffith, Redding and Van Reenen, 2004).
0
0.5
1
1.5
2
2.5
3
3.5
4
FIN JPN SWE DNK DEU AUT USA FRA BEL AUS NLD CAN GBR IRL NOR PRT ESP NZL ITA
Business sector Government Higher education Other
NZL
14 An International Perspective on the New Zealand Productivity Paradox
Finding evidence of spillovers is more challenging than identifying direct R&D effects, not least because knowledge flows across firms can in many cases be fully paid for and therefore do not necessarily correspond to pure spillovers6. Even so, the notion that knowledge spillovers contribute to productivity growth is also receiving growing empirical support. Studies that have tested for spillover effects have generally found them to be large, though often the magnitude of the impact is sensitive to estimation methods and samples.
At the same time, the empirical evidence also underscores that the efficiency of R&D investment and return on patenting at the economy-wide level depends on a wide range of factors, the contribution of which cannot be easily disentangled.
One recent study looked at the impact of R&D and patents on MFP levels over time using aggregate data across 19 OECD countries and finds that both patent and R&D stocks make a significant contribution to long-term productivity (Westmore, 2013). In the case of patents, the effect on MFP is magnified by the share of business enterprise researchers in total employment, which points to the importance of having absorptive capacity to exploit knowledge spillovers.
The results also provide evidence that the returns to patenting – in particular through follow-on innovation – could be diminished by regulations that inhibit firm entry and competition. Consistent with earlier findings (Conway et al., 2006), it finds that the knowledge diffusion process – captured by the speed at which lagging countries close the MFP gap vis-à-vis the leading country – is fostered by lower regulatory barriers to competition and greater openness to trade.
3.2.1 The under-investment in R&D can account for some portion of the gap In order to provide rough estimates of how much of New Zealand’s productivity paradox could be blamed on the R&D gap, the latter variable has been added as a determinant in the basic augmented-Solow specification. The results shown in Table 1 (column 2) point to a statistically significant – albeit economically modest – impact on GDP per capita in the long run. This conforms to general findings from empirical analysis showing that overall the estimated returns to R&D tend to be lower (and more fragile) when the main source of identification is variation in the time rather than the cross-section dimension (Hall, Mairesse and Mohnen, 2010). Furthermore, adding R&D intensity to the set of determinants leads to a reduction in the size of the coefficient on human capital, pointing to some degree of collinearity between the two variables. As a result, the inclusion of R&D intensity does help to reduce the productivity gap, but only by a small margin, despite New Zealand being well below OECD average in this area.
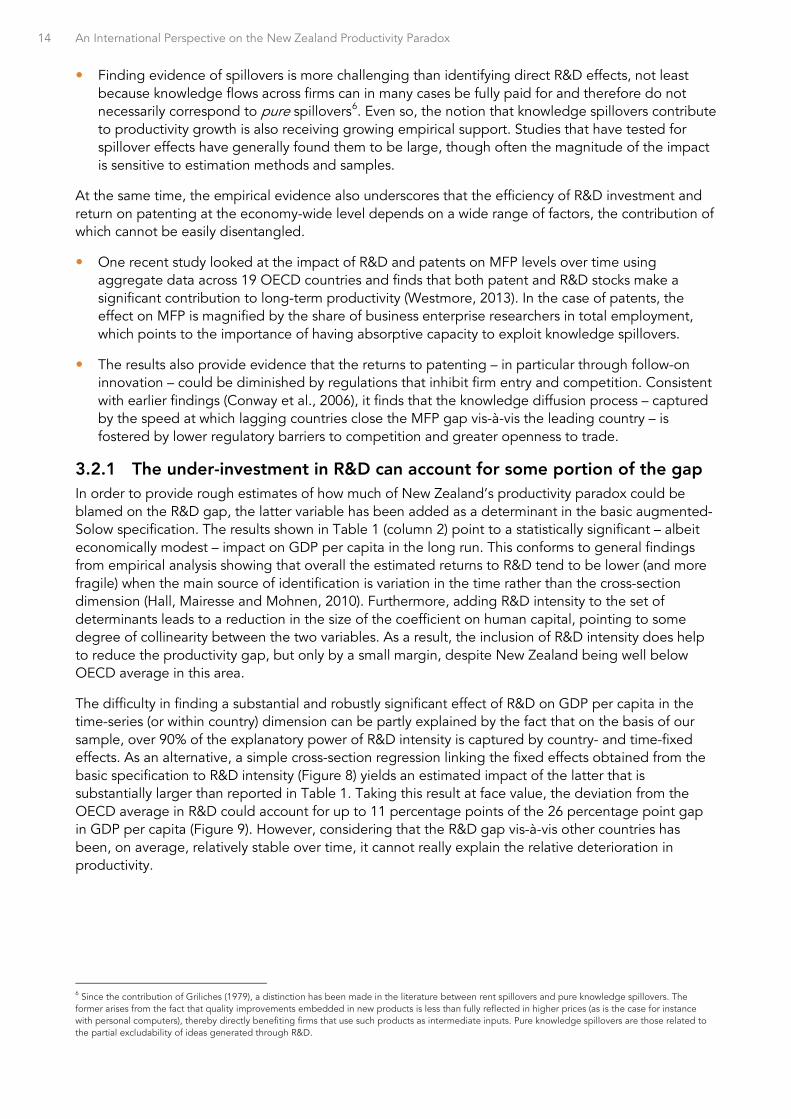
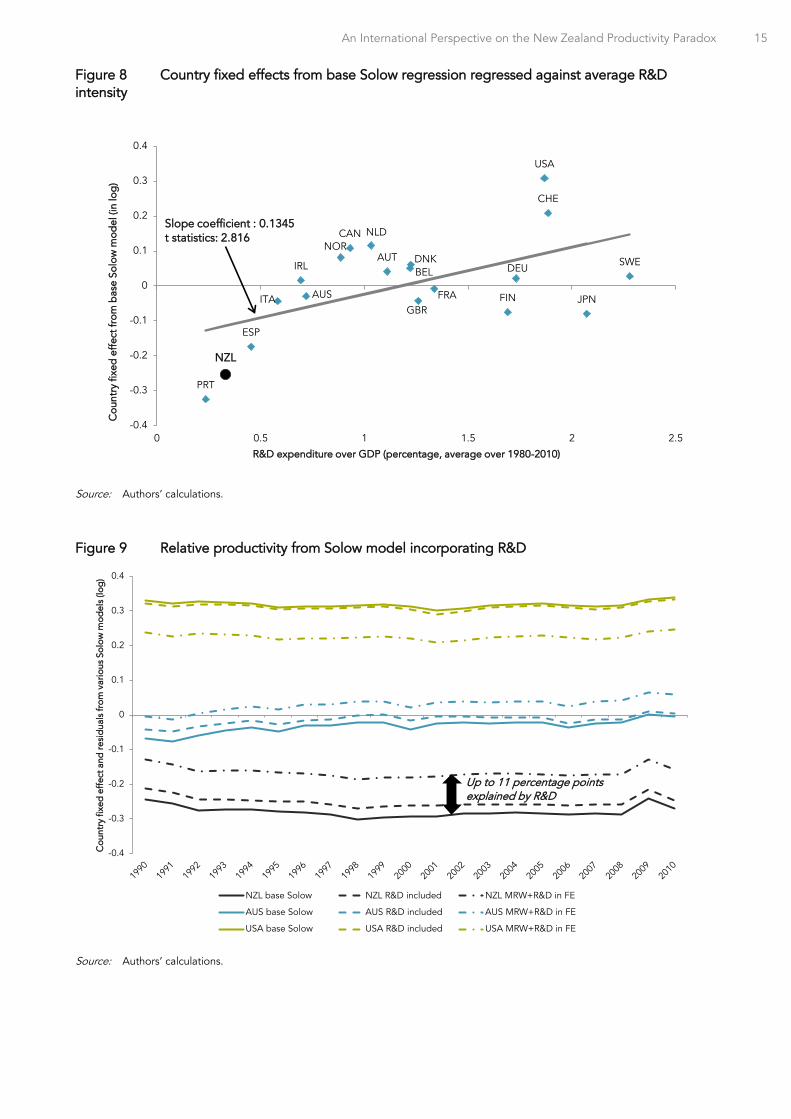
The difficulty in finding a substantial and robustly significant effect of R&D on GDP per capita in the time-series (or within country) dimension can be partly explained by the fact that on the basis of our sample, over 90% of the explanatory power of R&D intensity is captured by country- and time-fixed effects. As an alternative, a simple cross-section regression linking the fixed effects obtained from the basic specification to R&D intensity (Figure 8) yields an estimated impact of the latter that is substantially larger than reported in Table 1. Taking this result at face value, the deviation from the OECD average in R&D could account for up to 11 percentage points of the 26 percentage point gap in GDP per capita (Figure 9). However, considering that the R&D gap vis-à-vis other countries has been, on average, relatively stable over time, it cannot really explain the relative deterioration in productivity.
6 Since the contribution of Griliches (1979), a distinction has been made in the literature between rent spillovers and pure knowledge spillovers. The former arises from the fact that quality improvements embedded in new products is less than fully reflected in higher prices (as is the case for instance with personal computers), thereby directly benefiting firms that use such products as intermediate inputs. Pure knowledge spillovers are those related to the partial excludability of ideas generated through R&D.
An International Perspective on the New Zealand Productivity Paradox 15
Figure 8 Country fixed effects from base Solow regression regressed against average R&D intensity
Source: Authors’ calculations.
Figure 9 Relative productivity from Solow model incorporating R&D
Source: Authors’ calculations.
AUS
AUTBEL
CAN
CHE
DEUDNK
ESP
FINFRAGBR
IRL
ITA JPN
NLDNOR
NZL
PRT
SWE
USA
-0.4
-0.3
-0.2
-0.1
0
0.1
0.2
0.3
0.4
0 0.5 1 1.5 2 2.5
Cou
ntry
fixe
d e
ffec
t fro
m b
ase
Solo
w m
odel
(in
log
)
R&D expenditure over GDP (percentage, average over 1980-2010)
Slope coefficient : 0.1345t statistics: 2.816
-0.4
-0.3
-0.2
-0.1
0
0.1
0.2
0.3
0.4
Cou
ntry
fixe
d e
ffec
t and
resi
dua
ls fr
om v
ario
us S
olow
mod
els
(log
)
NZL base Solow NZL R&D included NZL MRW+R&D in FE
AUS base Solow AUS R&D included AUS MRW+R&D in FE
USA base Solow USA R&D included USA MRW+R&D in FE
Up to 11 percentage points explained by R&D
16 An International Perspective on the New Zealand Productivity Paradox
3.2.2 Innovation policies can only go so far in explaining low R&D investment The next question is how much of the R&D gap can be attributed to innovation-specific policy settings. The properties of intangible assets that give rise to increasing returns and knowledge spillovers also imply that private incentives (returns) to such assets are below socially desirable levels. The range of public policies put in place to correct these market failures include IPR protection, public support for private R&D (either through grants or tax credits), the funding of public research institutions and measures to strengthen linkages with the private sector. These policies should be considered more as complements than as substitutes. For instance, some degree of IPR protection is required to raise appropriability of returns, whereas public support for private investment is needed to compensate for the fact that when firms invest in innovation, they fail to take into account the positive contribution they make to other firms’ stock of knowledge.
Both grants and R&D tax credits have been found to have a statistically significant impact in a recent empirical analysis using data across countries and over time (Westmore, 2013). Still, the estimates point to a relatively modest average impact of these incentives over time, especially in the case of tax credits, and their effectiveness is undermined by frequent policy changes or reversals. The same study finds a significant impact of IPR regime on patents but not on R&D intensity.
Another recent study looking at the impact of policies on MFP growth at the firm level has found that firms in sectors with high R&D intensity tend to grow faster in countries with higher public spending on basic research, more R&D performed by universities and greater collaboration between industry and universities (Andrews, 2013). This underscores the importance of complementarity in the research efforts undertaken by various institutions and agencies.
Overall, the scope for innovation policies to account for New Zealand’s R&D gap is likely to be limited. First, New Zealand already compares favourably to other countries in areas of policies which have been found to have a significant influence on patents, such as the IPR regime and public research. This may partly explain why New Zealand ranks relatively better on patents than R&D spending. Second, data on public support for private R&D indicate wide variation across countries (Figure 10), with New Zealand ranking relatively low. In part, this reflects the absence of a R&D tax credit, although New Zealand is far from being alone in this respect. A number of countries with high R&D intensity do not offer tax incentives (e.g. Finland, Germany and Sweden). Financial support in the form of direct grants is substantial, but again well below the OECD average. In fact, few countries rank as low on both direct and indirect support.
It is difficult to assess the extent to which policy settings are contributing to the R&D gap. New Zealand is likely to be suffering from a lower return on R&D than other OECD countries due to its adverse access to large foreign markets (Crawford et al., 2007). Lack of tax incentives may reinforce such geographical disadvantage in suppressing intensive R&D, especially by the globalised firms that can choose where their innovation activities take place internationally. On the other hand, considering that New Zealand has the highest share of R&D performed by small firms across the OECD,7 its institutions do not seem overall unfavourable to innovation activities by firms. Furthermore, even if New Zealand were to increase its direct support to the OECD average, it would only close a small fraction of its R&D gap, based on the estimates from Westmore (2013).8 Finally, New Zealand is already close to the OECD average in terms of higher education expenditure on R&D and among the top countries as regards business-funded R&D in the higher education and government sectors, a measure of science-industry linkages.
7 The share of firms with fewer than 50 employees in New Zealand’s business R&D was 38% in 2011, which is markedly higher than other OECD countries such as the United States (7.6%), Australia (19.5%) or Canada (23%) (OECD, 2013b). 8 This would imply raising direct public support from 0.04 to 0.07% of GDP (or a 65% jump), which would result in a rise in business spending on R&D from 0.60 to 0.72% of GDP, as compared to an OECD average of 1.46%. Based on the estimates of specification 2 in table 1, this would contribute to narrowing the MFP gap by around 0.3 percentage points based on the low estimate or by 2 percentage points if one assumes the higher estimated impact of R&D on GDP per capita from Figure 8.

An International Perspective on the New Zealand Productivity Paradox 17
Figure 10 Financial support for private R&D investment
Source: OECD (2012).
3.3 There is more to innovation than R&D, especially in a country with a highly-developed service sector
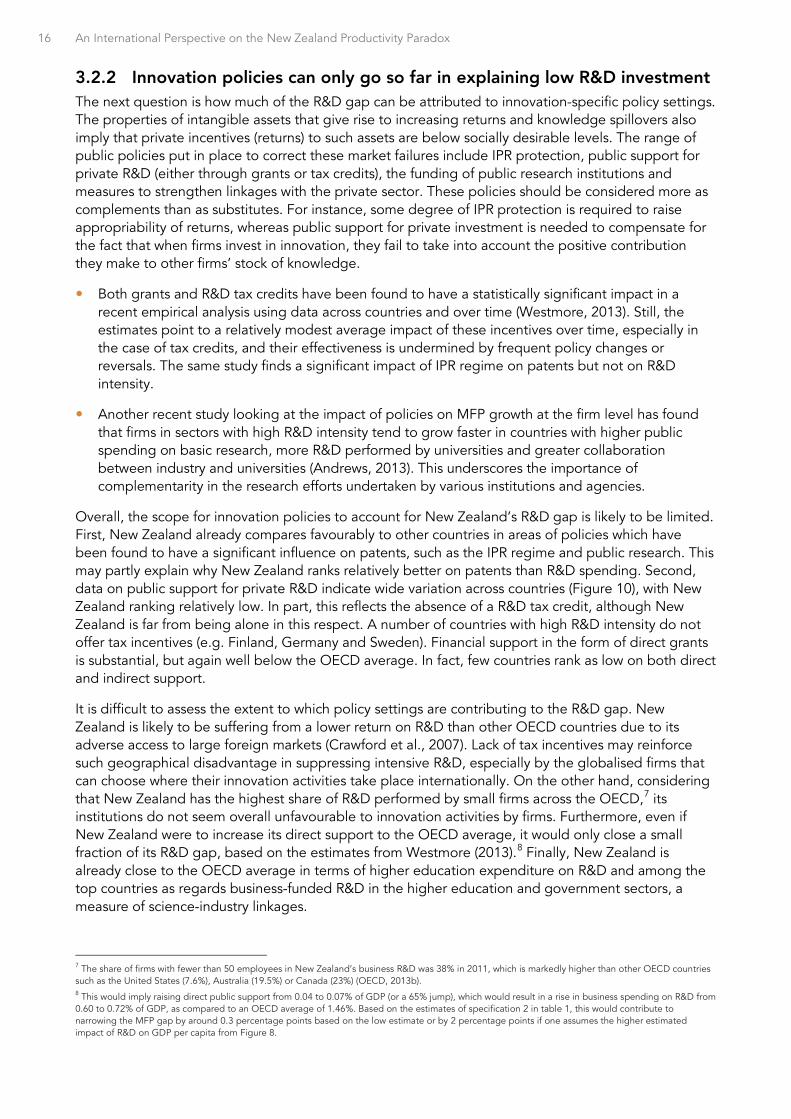
As mentioned above, R&D spending is typically highly concentrated in a relatively small number of manufacturing sectors. Given the high share of services in the New Zealand economy, part of the paradox may well lie in low productivity gains in such sectors. One recent study looking at the sources of the productivity differential vis-à-vis Australia pointed to lower MFP levels and growth in services sectors as the prime culprit (Mason, 2013). Measuring the extent of innovation in services is certainly no easier than in manufacturing but some indications can be obtained from different forms of intellectual properties (patents, copyrights, design rights and trademarks). As indicated earlier, New Zealand is doing comparatively well in trademarks (Figure 11, panel A). However, the share of total trademarks related to services is relatively low (Figure 11, panel B).
Many studies have underscored the importance of investment in ICT in fostering productivity in services. The contribution of ICT investment to the US productivity resurgence since the mid-1990s has been well documented (Oliner and Sicher, 2000). And, if productivity gains in ICT-producing played a major role in the boom phase of the late 1990s, gains in ICT-using services made a more significant contribution during the 2000s (Jorgenson, Ho and Stiroh, 2008) and accounted for a good portion of the gaps in the productivity and growth performance between the two sides of the Atlantic (Van Ark, O’Mahoney and Timmer, 2008; Gordon, 2004).
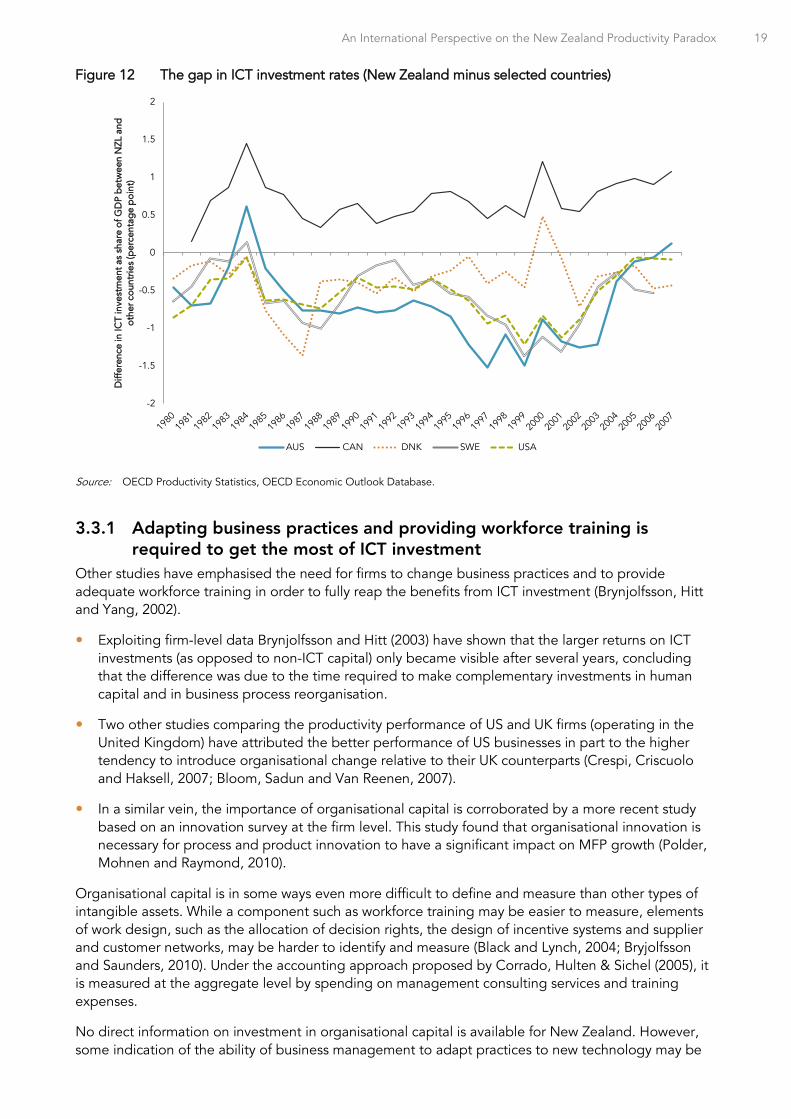
Profiles of ICT investment since the early 1980s provide some evidence of slower capital build-up in New Zealand in this area, as compared to other English-speaking or Nordic countries. With the exception of Canada, ICT investment rates have been systematically lower, with the difference being particularly substantial around the dot.com bubble period of the late 2000s (Figure 12). However, ICT investment rates have steadily gone up in New Zealand and have been comparable to that of those countries in the late 2000s. Indeed, the share of ICT in total non-residential investment was one of the
0
0.1
0.2
0.3
0.4A. Direct public funding of business R&D
Percentage of GDP
2007-09¹ 2002-04²
NZL
-0.1
0
0.1
0.2
0.3
0.4B. Rate of tax subsidies for one dollar of R&D3
2008 2004
NZL
18 An International Perspective on the New Zealand Productivity Paradox
highest among OECD countries in 2009, reflecting a strong share of software and communication equipment (OECD, 2011).
Figure 11 Patents and trademarks
Panel A. Patents and trademark per capita, 2009-2011
Source: OECD STI Scoreboard (2013b)
Panel B. Service-related trademarks applications as a percentage of total applications at USPTO and OHIM (Office for Harmonization in Internal Market), OECD and BRIICS, 1997-99 and 2007-09
Source: OECD STI Scoreboard (2013b).
ARG
AUS
AUT
BEL
BRA
CAN
CHE
CHL
CHN
CZE
DEU
DNK
ESP
EST
EU28
FIN
FRAGBR
GRC HUN
IND
IRL
ISL
ISRITAJPNKOR
LUX
NLD
NOR
NZL
OECD
POL
PRTRUS
SAU
SVK
SVN
SWE
TUR
USA
0
1
10
100
0 1 10 100
Trad
emar
ks a
bro
ad p
er c
apita
Triadic patent families per capita
500
500
IDN
Axes in logarithmic scale
MEX
0
5
10
15
20
25
30
35
40
45
50
2007-09 1997-1999
%%
NZL
An International Perspective on the New Zealand Productivity Paradox 19
Figure 12 The gap in ICT investment rates (New Zealand minus selected countries)
Source: OECD Productivity Statistics, OECD Economic Outlook Database.
3.3.1 Adapting business practices and providing workforce training is required to get the most of ICT investment
Other studies have emphasised the need for firms to change business practices and to provide adequate workforce training in order to fully reap the benefits from ICT investment (Brynjolfsson, Hitt and Yang, 2002).
Exploiting firm-level data Brynjolfsson and Hitt (2003) have shown that the larger returns on ICT investments (as opposed to non-ICT capital) only became visible after several years, concluding that the difference was due to the time required to make complementary investments in human capital and in business process reorganisation.
Two other studies comparing the productivity performance of US and UK firms (operating in the United Kingdom) have attributed the better performance of US businesses in part to the higher tendency to introduce organisational change relative to their UK counterparts (Crespi, Criscuolo and Haksell, 2007; Bloom, Sadun and Van Reenen, 2007).
In a similar vein, the importance of organisational capital is corroborated by a more recent study based on an innovation survey at the firm level. This study found that organisational innovation is necessary for process and product innovation to have a significant impact on MFP growth (Polder, Mohnen and Raymond, 2010).
Organisational capital is in some ways even more difficult to define and measure than other types of intangible assets. While a component such as workforce training may be easier to measure, elements of work design, such as the allocation of decision rights, the design of incentive systems and supplier and customer networks, may be harder to identify and measure (Black and Lynch, 2004; Bryjolfsson and Saunders, 2010). Under the accounting approach proposed by Corrado, Hulten & Sichel (2005), it is measured at the aggregate level by spending on management consulting services and training expenses.
No direct information on investment in organisational capital is available for New Zealand. However, some indication of the ability of business management to adapt practices to new technology may be
-2
-1.5
-1
-0.5
0
0.5
1
1.5
2
Diff
eren
ce in
ICT
inve
stm
ent a
s sh
are
of G
DP
bet
wee
n N
ZL a
nd
othe
r cou
ntrie
s (p
erce
ntag
e p
oint
)
AUS CAN DNK SWE USA

20 An International Perspective on the New Zealand Productivity Paradox
provided by surveys of managerial quality. According to evidence from a survey conducted by Bloom et al. (2012), New Zealand ranks relatively low in managerial quality. While the survey was conducted essentially among manufacturing firms, it could provide an indication of managerial quality in services as well. Based on this survey, the authors have estimated that productivity in manufacturing could be boosted by as much as 10 percentage points if the quality of management was to match that observed in the United States (Figure 13). A look at the distribution of firms according to the quality of their management shows that the weaker average result reflects, to some extent, the possibility for poorly-managed firms to survive as compared to what is happening in the United States (Figure 14).
Figure 13 Average management quality score in the manufacturing sector; selected countries
Source: Andrews, D. and C. Criscuolo (2013).
Notes:
1. The overall management score is an average of responses to 18 survey questions that are designed to reveal the extent to which firms: i) monitor what goes on inside the firm and use this information for continuous improvement ii) set targets and track outcomes; and iii) effectively utilise incentive structures (e.g. promote and rewarding employees based on performance). The estimates in the right panel are calculated from the difference in management score between each country and the United States and the estimated coefficient on the management score term in a firm-level regression of sales on management scores, capital and employment. The sample is based on medium-sized firms, ranging from 50 to 10 000 employees.
2.6 2.8 3.0 3.2 3.4
India
Brazil
China
Greece
Chile
Portugal
Ireland
Poland
Mexico
New Zealand
Australia
France
Italy
United Kingdom
Canada
Sweden
Germany
Japan
United States
Overall management score
0 5 10 15 20
India
Brazil
China
Greece
Chile
Portugal
Ireland
Poland
Mexico
New Zealand
Australia
France
Italy
United Kingdom
Canada
Sweden
Germany
Japan
United States
Estimated boost to productivity from closing

An International Perspective on the New Zealand Productivity Paradox 21
Figure 14 The distribution of managerial practices across firms: New Zealand versus the United States
Source: OECD calculations based on management score data sourced from Bloom et al. (2012).
Notes:
1. Since the number of firms in the underlying dataset varies across countries, the management score distributions are scaled to a common number of firms in each country prior to aggregation. See Figure 13 for details on management score data.
3.3.2 Realising the growth potential of KBC also requires smooth reallocation of tangible resources across firms and sectors
The contribution of organisational changes in increasing the returns to investment in other types of intangible assets as well as ICT shows the importance of flexibly reallocating resources within firms. Likewise, fulfilling the strong growth potential of KBC associated with the returns to scale property also hinges on the ability to reallocate resources – this time across firms – to their most efficient use. Given the inherent difficulties in reallocating intangible assets – again owing to their intrinsic characteristics – the ability to reallocate tangible resources (labour and physical capital) is all the more important (Andrews and de Serres, 2012).
This underscores the importance of framework policies that contribute to the ease and efficiency of labour and capital redeployment. New Zealand is generally well placed in this area but the cost of inadequate policies may be rising with the growing importance of intangible assets. One recent OECD study has exploited a novel database that matches firm-level data on investment and employment with information on patents (Andrews & Criscuolo, 2013). It shows that the ability of firms to raise its physical capital stock in the years after it has issued a patent depends on a broad range of policies across different areas. Among the many policy settings examined, the following turned out to have a significant impact: employment protection legislation, access to venture capital, regulation of professional services, barriers to trade and investment, the cost of bankruptcy legislation and the strength of investor rights. As shown on Figure 15, there is scope in New Zealand for improvement in the first three areas.
0
20
40
60
80
100
120
1 1.5 2 2.5 3 3.5 4 4.5 5
Freq
uenc
y
New Zealand United States
Management score

22 An International Perspective on the New Zealand Productivity Paradox
Figure 15 Additional capital attracted by a firm that increases its patent stock by 10% The estimated impact of various policies on the responsiveness of the firm investment to patenting
Source: Figures for New Zealand are inferred from the coefficient estimates in Andrews & Criscuolo, 2013.
However, there is a limit to which the reallocation of tangible resources can and should compensate for the difficulty in allocating intangible assets. Harnessing the growth potential of intangible assets also requires that they be allocated efficiently, lest the risk of excessive reallocation of labour and physical capital. The latter in turn requires well-functioning mechanisms to ensure that ideas/inventions can be developed and commercialised where it is most efficient to do so. The most efficient strategy for a start-up or individual inventor or entrepreneur with a new idea may be to transfer the rights to exploit the innovation to another firm by bringing the invention on the market for ideas. One natural mechanism for doing this is through the sale of property rights (patents) on a market or via a direct agreement (licensing) with an established firm. While the capacity of these trading arrangements for intangible assets to generate the most efficient outcomes has been questioned – especially in the areas of high-tech products (Bessen, Ford and Meurer, 2011) – there is little reason to believe that New Zealand is worse than other countries in that respect.9
An alternative way for inventors to transfer the rights to develop and commercialise a new idea is to seek a match with an established firm that already has the complementary assets and know-how to do so more rapidly and efficiently. Insofar as this matching can be facilitated by specialised financial intermediaries such as business angels or venture capitalists, the relatively limited access to such early-stage venture capital in New Zealand may also constitute a significant barrier.
9 New Zealand’s tax treatment on resources used for patenting and profits from patent sales is less generous than in other OECD countries (OECD, 2013a). However, the magnitude of the negative impact of such tax treatment on the transaction of intellectual property is ambiguous.
An International Perspective on the New Zealand Productivity Paradox 23
4 In search of a market: the role of geographic distance and its impact on productivity through international trade
The influence of cross-border trade and investment flows on productivity and growth comes through a number of channels (Nordås, Miroudot and Kowalski, 2006). First, the expansion of markets provided by international trade allows for efficiency gains from specialisation and economies of scale while maintaining or even raising overall pressures from competition. Second, trade and especially FDI play a fundamental role in the transfer of technology. Interaction with foreign customers in advanced markets often enables firms to tap into the world’s technological frontier. Third, international trade may increase the return on physical and knowledge-based capital, not only through a more efficient allocation of resources but also by convincing investors that a project they are invited to back up has a better chance of reaching a market of the size necessary to fully exploit the returns to scale. One reason is that the easier the access to a vast potential market, the better the prospects of achieving successful commercialisation of new ideas. Improved access to world markets through trade liberalisation has been observed to stimulate innovation activities and technology expenditure (Bustos, 2012). Lastly, imports of sophisticated intermediate inputs play an important role in upgrading product quality and enhancing export competitiveness (OECD, 2013c).
However, moving goods and services across locations is not without costs and hence the scope for exploiting higher returns to scale can be limited by distance to major markets, both within and across countries. Aside from transportation costs, trade involves border-related barriers as well as retail and wholesale distribution costs (Anderson and van Wincoop, 2004). While each of these cost components is affected to some extent by the distance to major markets, this is mainly the case for transportation costs, whose relative importance has not really diminished over time despite technological improvements (Golub and Tomasik, 2008; Hummels, 2007).10 Developing internationally comparable indicators, Golub and Tomasik (2008) have estimated that countries such as Australia and New Zealand face transportation costs for goods that are on average twice as high as those faced by countries in Europe.
The relevance of transportation costs and access to large markets in international trade has most likely increased due to the development of global value chains (GVCs), whereby a full range of activities that firms engage in to bring a product or service to the market is globally fragmented. GVCs involve intensive back and forth trade of intermediate inputs across production stages. The elasticity of trade flow to distance has indeed increased since 1950 (Disdier and Head, 2008), partly because countries are increasingly sourcing substitutable goods or services from nearby countries (Berthelon and Freund, 2008). Also, the international fragmentation of production stages tends to happen regionally because the coordination of GVCs often requires intensive interaction and just-in-time delivery.
Some of the drawbacks associated with long distances to foreign markets can be lessened by the presence of a sufficiently large and concentrated domestic market. For instance, given the additional fixed costs associated with trade, the domestic market often serves as a testing ground for new products, which can then be fine-tuned to boost the chances of success on foreign markets (Procter, 2013). In this regard, the challenge created by the remoteness to major foreign markets is compounded for New Zealand by the small and sparsely populated domestic market.
10 This is particularly the case of maritime transport which affects the majority of trade by value. Though the lack of cost improvement has been attributed to special factors such as rising fuels and port congestion, it may also be a reflection that the benefit from containerisation may not have been as large as presumed (Bloningen and Wilson, 2006). The cost of air transport has clearly diminished but considering that technological improvements have also lowered the cost of transported goods, so transport costs expressed in terms of manufacturing goods deflators have not fallen by as much.
24 An International Perspective on the New Zealand Productivity Paradox
4.1 Low trade intensity may account for a sizeable share of the productivity gap
Simple measures of trade intensity can illustrate the extent to which New Zealand integration in world trade markets is hampered by distance. One such measure is the sum of exports and imports as a share of GDP, adjusted for the size of the country. The intuition is that the smaller a country is the more intensively it should be trading on foreign markets to benefit from the advantages of specialisation. Based on that metric, New Zealand is indeed far below what would be expected in terms of trade intensity given its size (Figure 16). Based on indicators of tariffs or trade restrictiveness (especially in services), trade-related policies are unlikely to account for much of this gap given that New Zealand generally compares favourably in international standards. In addition, language is certainly no more a barrier than it is for other countries, which leaves remoteness as a major explanatory factor.
In order to assess more directly the contribution of distance to low trade intensity, Boulhol and de Serres (2010) computed a measure of access to market and suppliers for OECD countries, based on a methodology developed by Redding and Venables (2004). Beyond distance, the measure also takes into account that the size, growth and degree of openness of foreign markets also matter in determining the scope of trade opportunities (see Box 3). This paper updates the results by Boulhol and de Serres (2010) by including a broader coverage of countries in the bilateral trade equations and extending the dataset until 2010. It confirms the sizable disadvantage of Australia and New Zealand with respect to market access and supplier access (Figure 17).
Both the measure of adjusted trade intensity and the indicator of market and supplier access are found to have a significant impact on GDP per capita when added to the set of explanatory variables (including R&D) in the Solow framework (Table 1, column 3 and 4).11 In the case of access to markets and suppliers, the impact is also economically large. Based on the estimated effect, the black box (residual including fixed effects) for New Zealand is reduced: slightly more than half of New Zealand’s 27 percentage points MFP gap vis-à-vis the average of 20 OECD countries could be accounted for by the reduced access to markets and suppliers (Figure 18).
11 This framework includes as an explanatory variable the indicator of market and supplier access, which is the weighted sum of the index of market access and the index of supplier access (see Box 3)
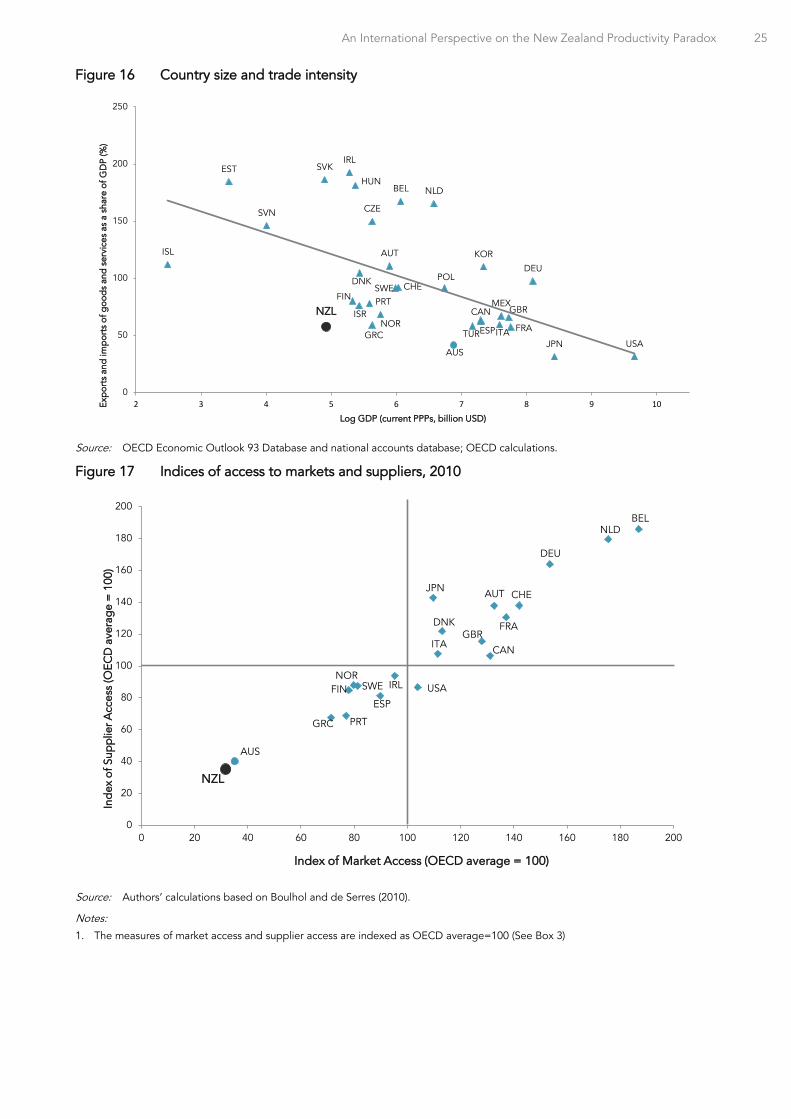
An International Perspective on the New Zealand Productivity Paradox 25
Figure 16 Country size and trade intensity
Source: OECD Economic Outlook 93 Database and national accounts database; OECD calculations.
Figure 17 Indices of access to markets and suppliers, 2010
Source: Authors’ calculations based on Boulhol and de Serres (2010).
Notes:
1. The measures of market access and supplier access are indexed as OECD average=100 (See Box 3)
AUS
AUT
BEL
CAN
CZE
DNK
EST
FIN
FRAGRC
DEU
HUN
ISL
IRL
ISR
ITAJPN
KOR
MEX
NLD
NZLNOR
POL
PRT
SVK
SVN
ESP
SWE CHE
TUR
GBR
USA
0
50
100
150
200
250
2 3 4 5 6 7 8 9 10Exp
orts
and
imp
orts
of g
ood
s an
d s
ervi
ces
as a
sha
re o
f GD
P (%
)
Log GDP (current PPPs, billion USD)
AUS
AUT
BEL
CAN
CHE
DEU
DNK
ESPFIN
FRAGBR
GRC
IRL
ITA
JPN
NLD
NOR
NZL
PRT
SWE USA
0
20
40
60
80
100
120
140
160
180
200
0 20 40 60 80 100 120 140 160 180 200
Ind
ex o
f Sup
plie
r Acc
ess
(OEC
D a
vera
ge
= 1
00)
Index of Market Access (OECD average = 100)
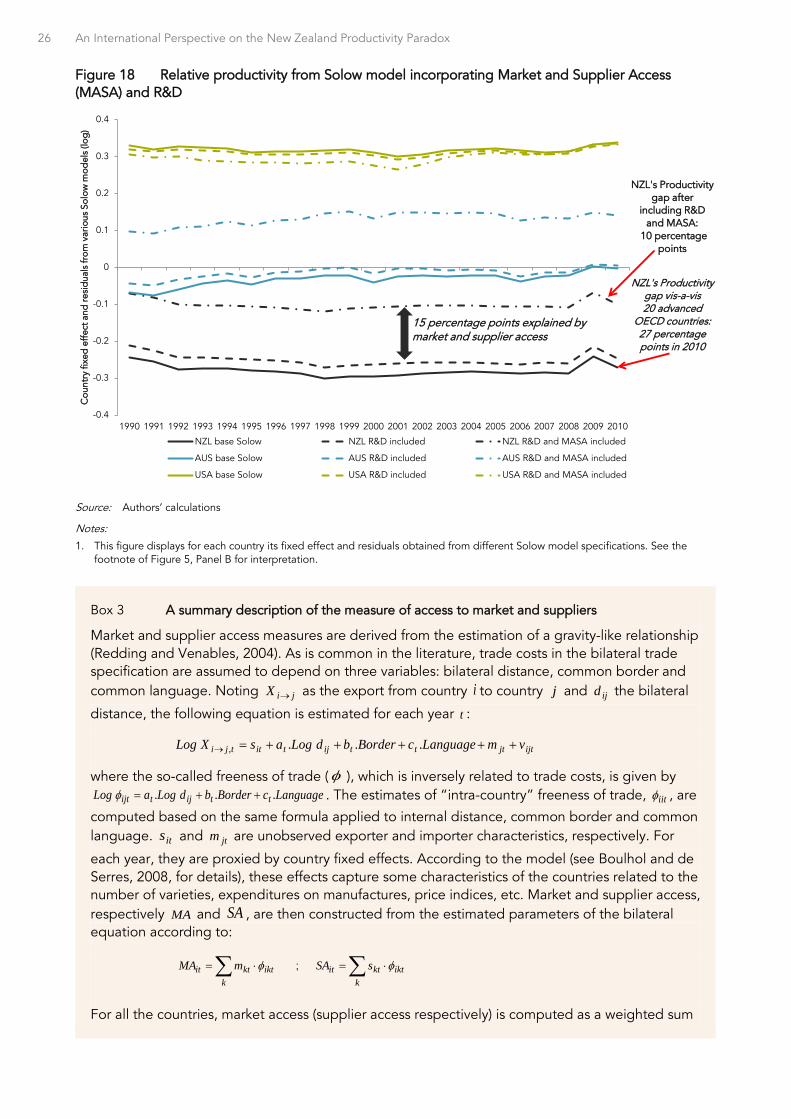
26 An International Perspective on the New Zealand Productivity Paradox
Figure 18 Relative productivity from Solow model incorporating Market and Supplier Access (MASA) and R&D
Source: Authors’ calculations
Notes:
1. This figure displays for each country its fixed effect and residuals obtained from different Solow model specifications. See the footnote of Figure 5, Panel B for interpretation.
NZL's Productivity gap vis-a-vis 20 advanced
OECD countries: 27 percentage points in 2010
NZL's Productivity gap after
including R&D and MASA:
10 percentage points
-0.4
-0.3
-0.2
-0.1
0
0.1
0.2
0.3
0.4
1990 1991 1992 1993 1994 1995 1996 1997 1998 1999 2000 2001 2002 2003 2004 2005 2006 2007 2008 2009 2010
Cou
ntry
fixe
d e
ffec
t and
resi
dua
ls fr
om v
ario
us S
olow
mod
els
(log
)
NZL base Solow NZL R&D included NZL R&D and MASA included
AUS base Solow AUS R&D included AUS R&D and MASA included
USA base Solow USA R&D included USA R&D and MASA included
15 percentage points explained by market and supplier access
Box 3 A summary description of the measure of access to market and suppliers
Market and supplier access measures are derived from the estimation of a gravity-like relationship (Redding and Venables, 2004). As is common in the literature, trade costs in the bilateral trade specification are assumed to depend on three variables: bilateral distance, common border and common language. Noting jiX → as the export from country i to country j and ijd the bilateral
distance, the following equation is estimated for each year t :
ijtjtttijtittji vmLanguagecBorderbdLogasXLog +++++=→ ...,
where the so-called freeness of trade (φ ), which is inversely related to trade costs, is given by LanguagecBorderbdLogaLog ttijtijt ... ++=φ . The estimates of “intra-country” freeness of trade, iitφ , are
computed based on the same formula applied to internal distance, common border and common language. its and jtm are unobserved exporter and importer characteristics, respectively. For
each year, they are proxied by country fixed effects. According to the model (see Boulhol and de Serres, 2008, for details), these effects capture some characteristics of the countries related to the number of varieties, expenditures on manufactures, price indices, etc. Market and supplier access, respectively MA and SA , are then constructed from the estimated parameters of the bilateral equation according to:
∑ ⋅=k
iktktit mMA φ ; ∑ ⋅=k
iktktit sSA φ
For all the countries, market access (supplier access respectively) is computed as a weighted sum
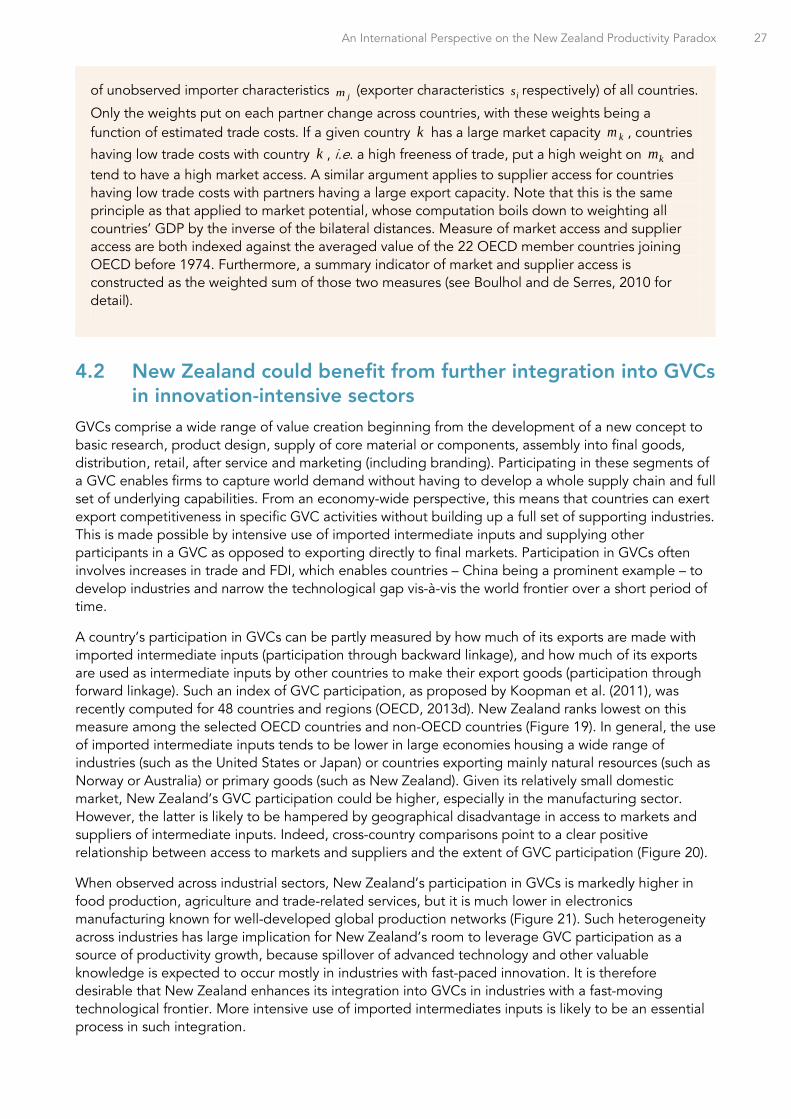
An International Perspective on the New Zealand Productivity Paradox 27
4.2 New Zealand could benefit from further integration into GVCs in innovation-intensive sectors
GVCs comprise a wide range of value creation beginning from the development of a new concept to basic research, product design, supply of core material or components, assembly into final goods, distribution, retail, after service and marketing (including branding). Participating in these segments of a GVC enables firms to capture world demand without having to develop a whole supply chain and full set of underlying capabilities. From an economy-wide perspective, this means that countries can exert export competitiveness in specific GVC activities without building up a full set of supporting industries. This is made possible by intensive use of imported intermediate inputs and supplying other participants in a GVC as opposed to exporting directly to final markets. Participation in GVCs often involves increases in trade and FDI, which enables countries – China being a prominent example – to develop industries and narrow the technological gap vis-à-vis the world frontier over a short period of time.
A country’s participation in GVCs can be partly measured by how much of its exports are made with imported intermediate inputs (participation through backward linkage), and how much of its exports are used as intermediate inputs by other countries to make their export goods (participation through forward linkage). Such an index of GVC participation, as proposed by Koopman et al. (2011), was recently computed for 48 countries and regions (OECD, 2013d). New Zealand ranks lowest on this measure among the selected OECD countries and non-OECD countries (Figure 19). In general, the use of imported intermediate inputs tends to be lower in large economies housing a wide range of industries (such as the United States or Japan) or countries exporting mainly natural resources (such as Norway or Australia) or primary goods (such as New Zealand). Given its relatively small domestic market, New Zealand’s GVC participation could be higher, especially in the manufacturing sector. However, the latter is likely to be hampered by geographical disadvantage in access to markets and suppliers of intermediate inputs. Indeed, cross-country comparisons point to a clear positive relationship between access to markets and suppliers and the extent of GVC participation (Figure 20).
When observed across industrial sectors, New Zealand’s participation in GVCs is markedly higher in food production, agriculture and trade-related services, but it is much lower in electronics manufacturing known for well-developed global production networks (Figure 21). Such heterogeneity across industries has large implication for New Zealand’s room to leverage GVC participation as a source of productivity growth, because spillover of advanced technology and other valuable knowledge is expected to occur mostly in industries with fast-paced innovation. It is therefore desirable that New Zealand enhances its integration into GVCs in industries with a fast-moving technological frontier. More intensive use of imported intermediates inputs is likely to be an essential process in such integration.
of unobserved importer characteristics jm (exporter characteristics is respectively) of all countries.
Only the weights put on each partner change across countries, with these weights being a function of estimated trade costs. If a given country k has a large market capacity km , countries
having low trade costs with country k , i.e. a high freeness of trade, put a high weight on km and tend to have a high market access. A similar argument applies to supplier access for countries having low trade costs with partners having a large export capacity. Note that this is the same principle as that applied to market potential, whose computation boils down to weighting all countries’ GDP by the inverse of the bilateral distances. Measure of market access and supplier access are both indexed against the averaged value of the 22 OECD member countries joining OECD before 1974. Furthermore, a summary indicator of market and supplier access is constructed as the weighted sum of those two measures (see Boulhol and de Serres, 2010 for detail).
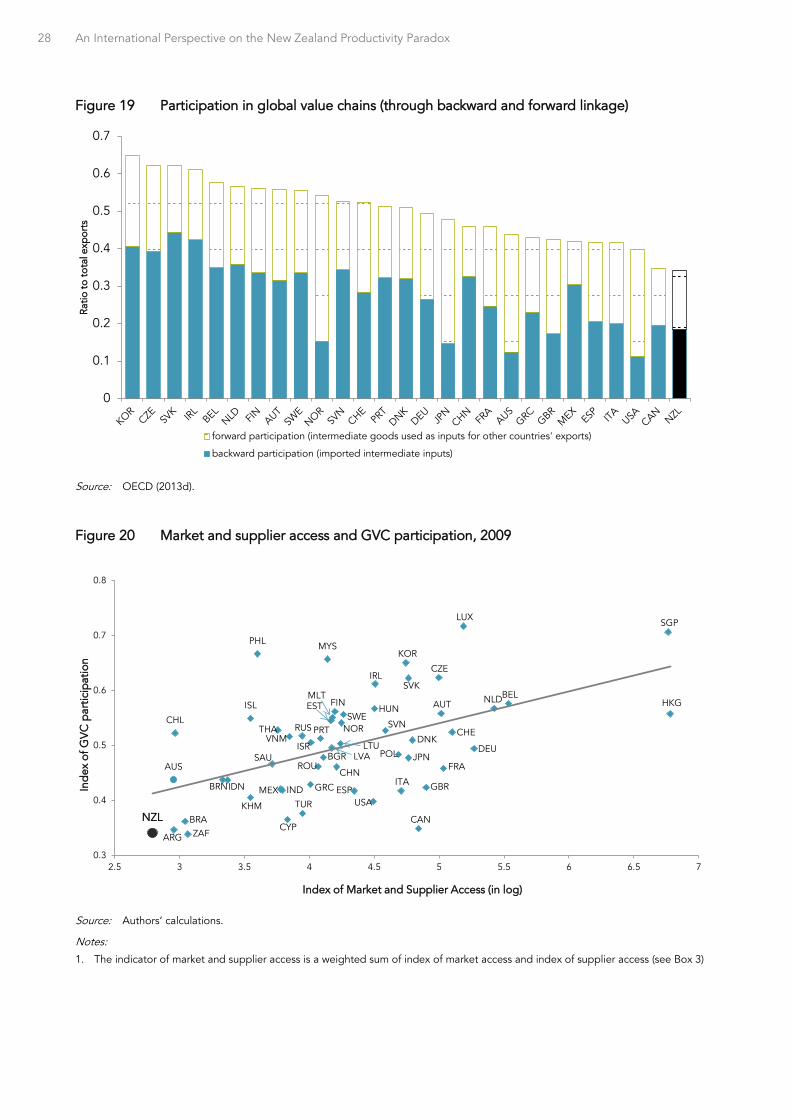
28 An International Perspective on the New Zealand Productivity Paradox
Figure 19 Participation in global value chains (through backward and forward linkage)
Source: OECD (2013d).
Figure 20 Market and supplier access and GVC participation, 2009
Source: Authors’ calculations.
Notes:
1. The indicator of market and supplier access is a weighted sum of index of market access and index of supplier access (see Box 3)
0
0.1
0.2
0.3
0.4
0.5
0.6
0.7
Rat
io to
tota
l exp
orts
forward participation (intermediate goods used as inputs for other countries' exports)
backward participation (imported intermediate inputs)
MEX
MLTSVK
ARG
AUS
AUTBEL
BGR
BRA
BRN
CAN
CHECHL
CHN
CYP
CZE
DEUDNK
ESP
EST FIN
FRA
GBRGRC
HKGHUN
IDN IND
IRL
ISL
ISR
ITA
JPN
KHM
KOR
LTU
LUX
LVA
MYS
NLD
NOR
NZL
PHL
POL
PRT
ROU
RUS
SAU
SGP
SVNSWE
THA
TUR USA
VNM
ZAF
0.3
0.4
0.5
0.6
0.7
0.8
2.5 3 3.5 4 4.5 5 5.5 6 6.5 7
Ind
ex o
f GV
C p
artic
ipat
ion
Index of Market and Supplier Access (in log)
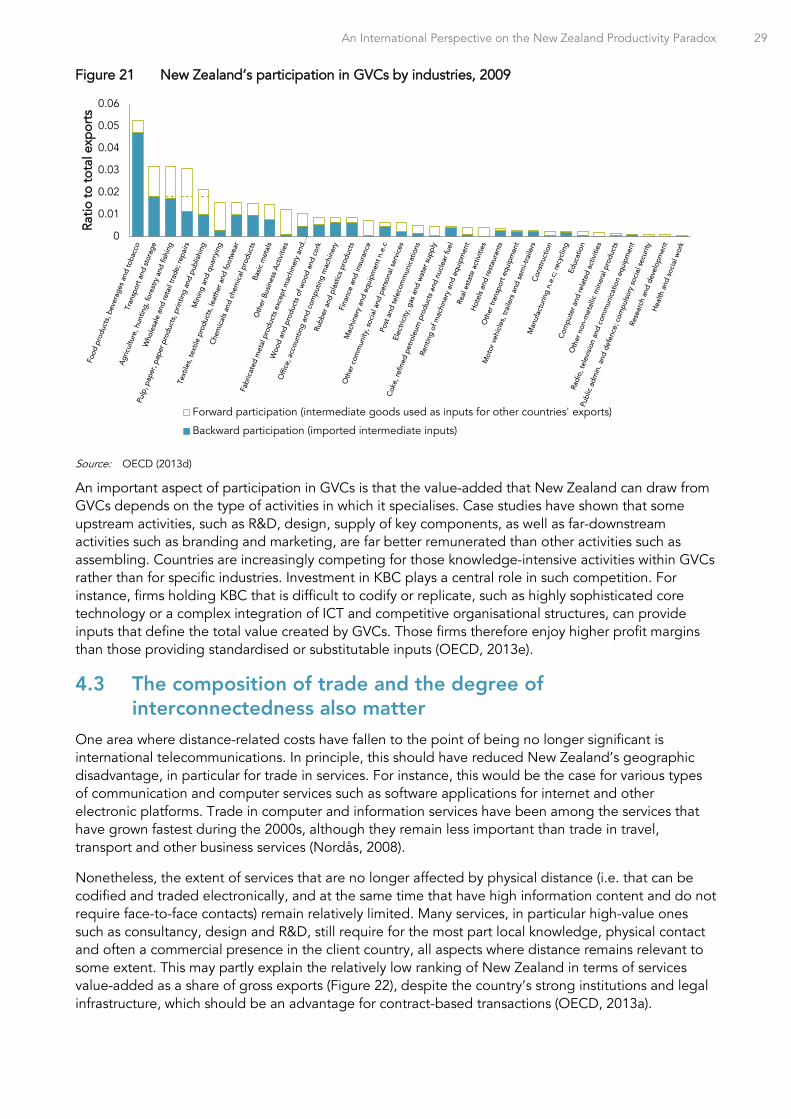
An International Perspective on the New Zealand Productivity Paradox 29
Figure 21 New Zealand’s participation in GVCs by industries, 2009
Source: OECD (2013d)
An important aspect of participation in GVCs is that the value-added that New Zealand can draw from GVCs depends on the type of activities in which it specialises. Case studies have shown that some upstream activities, such as R&D, design, supply of key components, as well as far-downstream activities such as branding and marketing, are far better remunerated than other activities such as assembling. Countries are increasingly competing for those knowledge-intensive activities within GVCs rather than for specific industries. Investment in KBC plays a central role in such competition. For instance, firms holding KBC that is difficult to codify or replicate, such as highly sophisticated core technology or a complex integration of ICT and competitive organisational structures, can provide inputs that define the total value created by GVCs. Those firms therefore enjoy higher profit margins than those providing standardised or substitutable inputs (OECD, 2013e).
4.3 The composition of trade and the degree of interconnectedness also matter
One area where distance-related costs have fallen to the point of being no longer significant is international telecommunications. In principle, this should have reduced New Zealand’s geographic disadvantage, in particular for trade in services. For instance, this would be the case for various types of communication and computer services such as software applications for internet and other electronic platforms. Trade in computer and information services have been among the services that have grown fastest during the 2000s, although they remain less important than trade in travel, transport and other business services (Nordås, 2008).
Nonetheless, the extent of services that are no longer affected by physical distance (i.e. that can be codified and traded electronically, and at the same time that have high information content and do not require face-to-face contacts) remain relatively limited. Many services, in particular high-value ones such as consultancy, design and R&D, still require for the most part local knowledge, physical contact and often a commercial presence in the client country, all aspects where distance remains relevant to some extent. This may partly explain the relatively low ranking of New Zealand in terms of services value-added as a share of gross exports (Figure 22), despite the country’s strong institutions and legal infrastructure, which should be an advantage for contract-based transactions (OECD, 2013a).
0
0.01
0.02
0.03
0.04
0.05
0.06
Ratio
to to
tal e
xpor
ts
Forward participation (intermediate goods used as inputs for other countries' exports)
Backward participation (imported intermediate inputs)
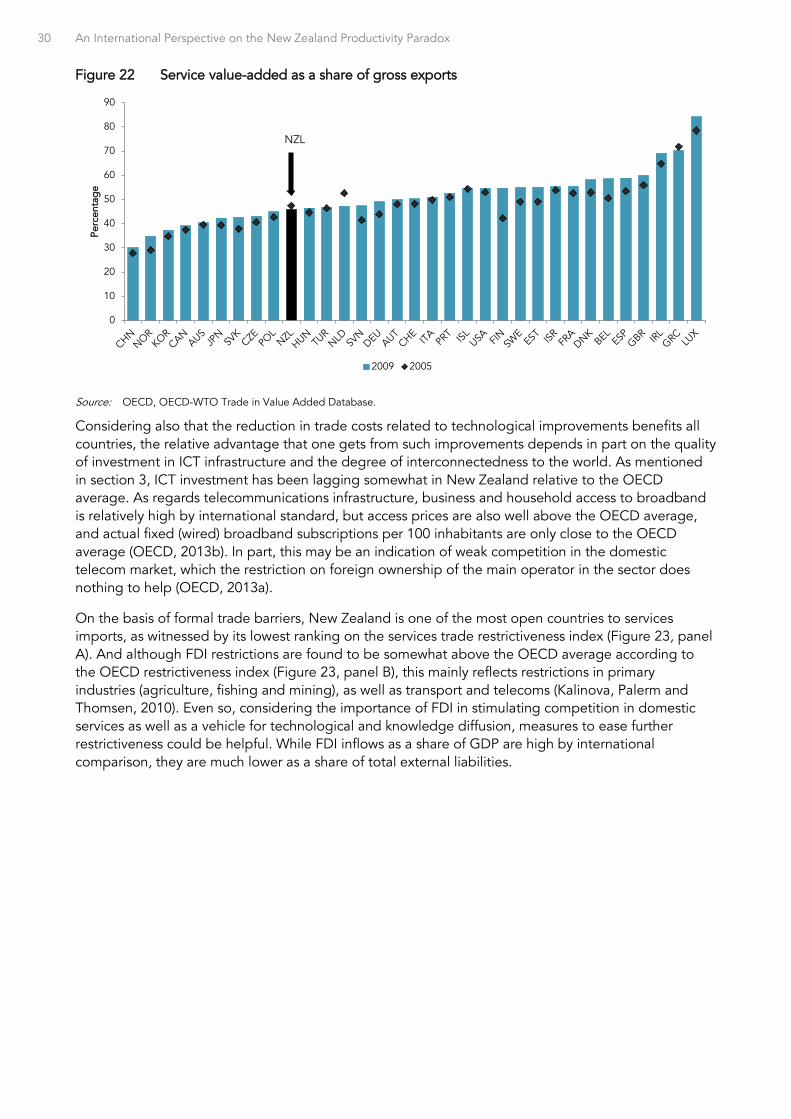
30 An International Perspective on the New Zealand Productivity Paradox
Figure 22 Service value-added as a share of gross exports
Source: OECD, OECD-WTO Trade in Value Added Database.
Considering also that the reduction in trade costs related to technological improvements benefits all countries, the relative advantage that one gets from such improvements depends in part on the quality of investment in ICT infrastructure and the degree of interconnectedness to the world. As mentioned in section 3, ICT investment has been lagging somewhat in New Zealand relative to the OECD average. As regards telecommunications infrastructure, business and household access to broadband is relatively high by international standard, but access prices are also well above the OECD average, and actual fixed (wired) broadband subscriptions per 100 inhabitants are only close to the OECD average (OECD, 2013b). In part, this may be an indication of weak competition in the domestic telecom market, which the restriction on foreign ownership of the main operator in the sector does nothing to help (OECD, 2013a).
On the basis of formal trade barriers, New Zealand is one of the most open countries to services imports, as witnessed by its lowest ranking on the services trade restrictiveness index (Figure 23, panel A). And although FDI restrictions are found to be somewhat above the OECD average according to the OECD restrictiveness index (Figure 23, panel B), this mainly reflects restrictions in primary industries (agriculture, fishing and mining), as well as transport and telecoms (Kalinova, Palerm and Thomsen, 2010). Even so, considering the importance of FDI in stimulating competition in domestic services as well as a vehicle for technological and knowledge diffusion, measures to ease further restrictiveness could be helpful. While FDI inflows as a share of GDP are high by international comparison, they are much lower as a share of total external liabilities.
0
10
20
30
40
50
60
70
80
90Pe
rcen
tag
e
2009 2005
NZL
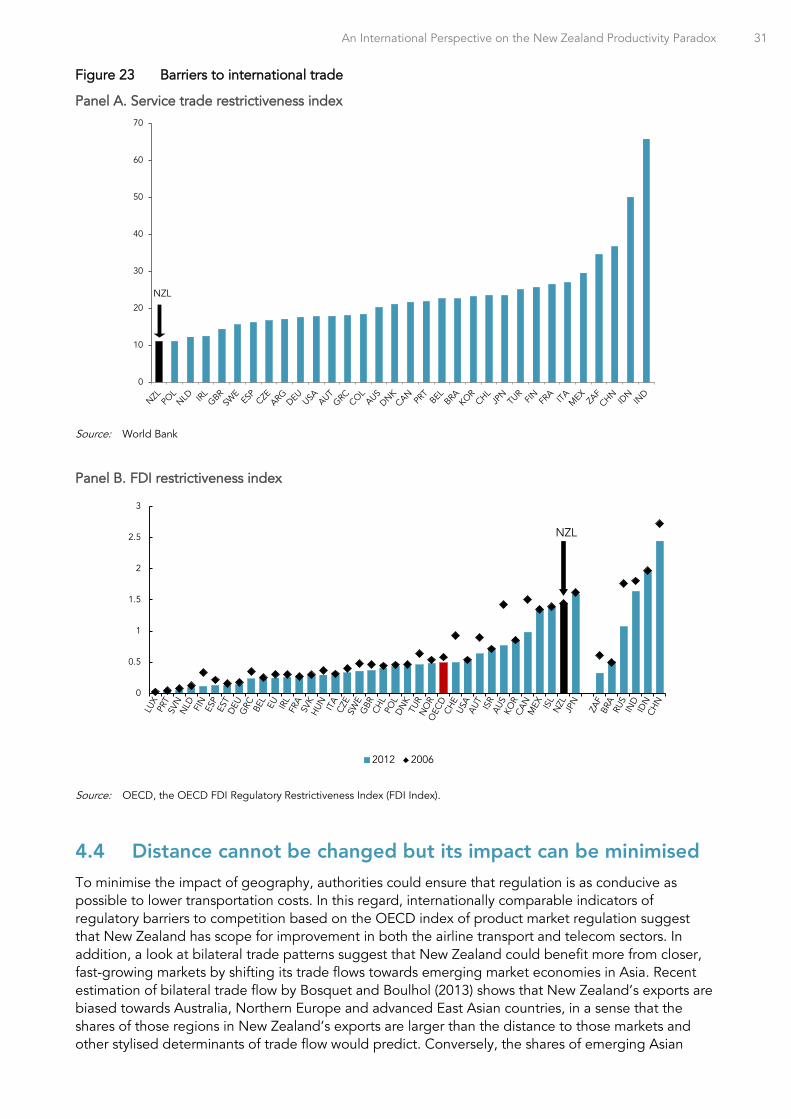
An International Perspective on the New Zealand Productivity Paradox 31
Figure 23 Barriers to international trade
Panel A. Service trade restrictiveness index
Source: World Bank
Panel B. FDI restrictiveness index
Source: OECD, the OECD FDI Regulatory Restrictiveness Index (FDI Index).
4.4 Distance cannot be changed but its impact can be minimised To minimise the impact of geography, authorities could ensure that regulation is as conducive as possible to lower transportation costs. In this regard, internationally comparable indicators of regulatory barriers to competition based on the OECD index of product market regulation suggest that New Zealand has scope for improvement in both the airline transport and telecom sectors. In addition, a look at bilateral trade patterns suggest that New Zealand could benefit more from closer, fast-growing markets by shifting its trade flows towards emerging market economies in Asia. Recent estimation of bilateral trade flow by Bosquet and Boulhol (2013) shows that New Zealand’s exports are biased towards Australia, Northern Europe and advanced East Asian countries, in a sense that the shares of those regions in New Zealand’s exports are larger than the distance to those markets and other stylised determinants of trade flow would predict. Conversely, the shares of emerging Asian
0
10
20
30
40
50
60
70
NZL
0
0.5
1
1.5
2
2.5
3
2012 2006
NZL
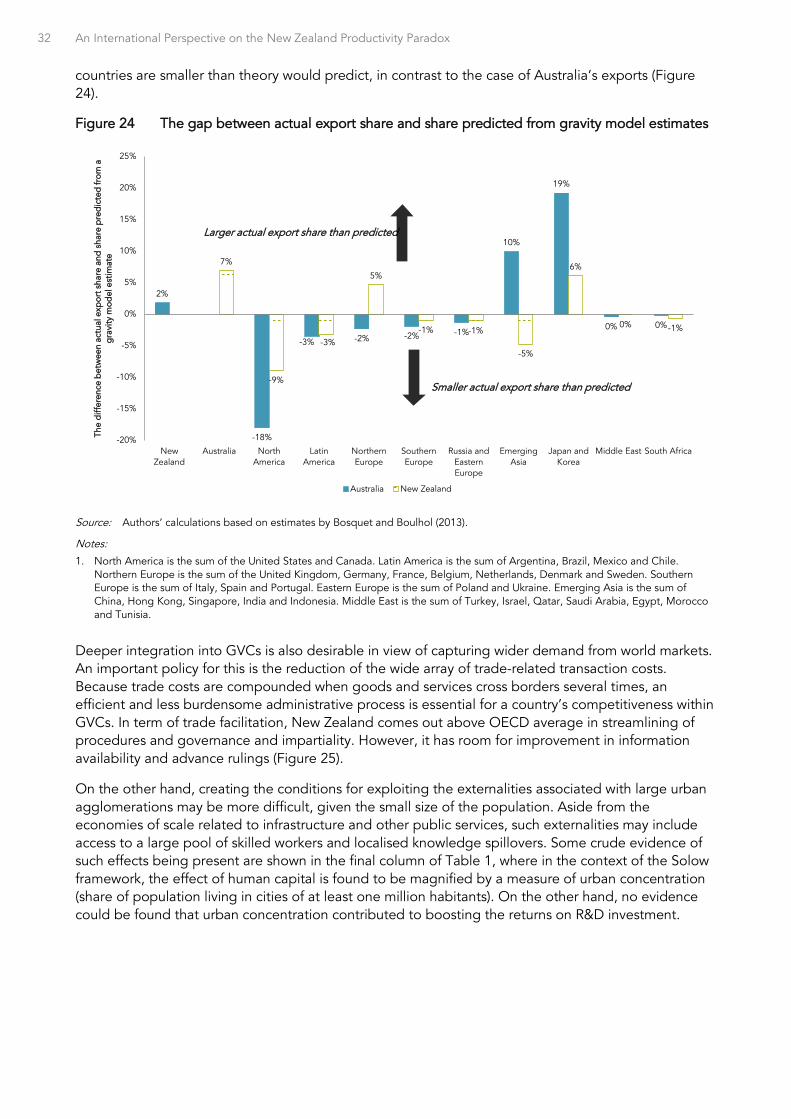
32 An International Perspective on the New Zealand Productivity Paradox
countries are smaller than theory would predict, in contrast to the case of Australia’s exports (Figure 24).
Figure 24 The gap between actual export share and share predicted from gravity model estimates
Source: Authors’ calculations based on estimates by Bosquet and Boulhol (2013).
Notes:
1. North America is the sum of the United States and Canada. Latin America is the sum of Argentina, Brazil, Mexico and Chile. Northern Europe is the sum of the United Kingdom, Germany, France, Belgium, Netherlands, Denmark and Sweden. Southern Europe is the sum of Italy, Spain and Portugal. Eastern Europe is the sum of Poland and Ukraine. Emerging Asia is the sum of China, Hong Kong, Singapore, India and Indonesia. Middle East is the sum of Turkey, Israel, Qatar, Saudi Arabia, Egypt, Morocco and Tunisia.
Deeper integration into GVCs is also desirable in view of capturing wider demand from world markets. An important policy for this is the reduction of the wide array of trade-related transaction costs. Because trade costs are compounded when goods and services cross borders several times, an efficient and less burdensome administrative process is essential for a country’s competitiveness within GVCs. In term of trade facilitation, New Zealand comes out above OECD average in streamlining of procedures and governance and impartiality. However, it has room for improvement in information availability and advance rulings (Figure 25).
On the other hand, creating the conditions for exploiting the externalities associated with large urban agglomerations may be more difficult, given the small size of the population. Aside from the economies of scale related to infrastructure and other public services, such externalities may include access to a large pool of skilled workers and localised knowledge spillovers. Some crude evidence of such effects being present are shown in the final column of Table 1, where in the context of the Solow framework, the effect of human capital is found to be magnified by a measure of urban concentration (share of population living in cities of at least one million habitants). On the other hand, no evidence could be found that urban concentration contributed to boosting the returns on R&D investment.
2%
-18%
-3% -2% -2% -1%
10%
19%
0% 0%
7%
-9%
-3%
5%
-1% -1%
-5%
6%
0% -1%
-20%
-15%
-10%
-5%
0%
5%
10%
15%
20%
25%
NewZealand
Australia NorthAmerica
LatinAmerica
NorthernEurope
SouthernEurope
Russia andEasternEurope
EmergingAsia
Japan andKorea
Middle East South Africa
The
diff
eren
ce b
etw
een
actu
al e
xpor
t sha
re a
nd s
hare
pre
dic
ted
from
a
gra
vity
mod
el e
stim
ate
Australia New Zealand
Smaller actual export share than predicted
Larger actual export share than predicted
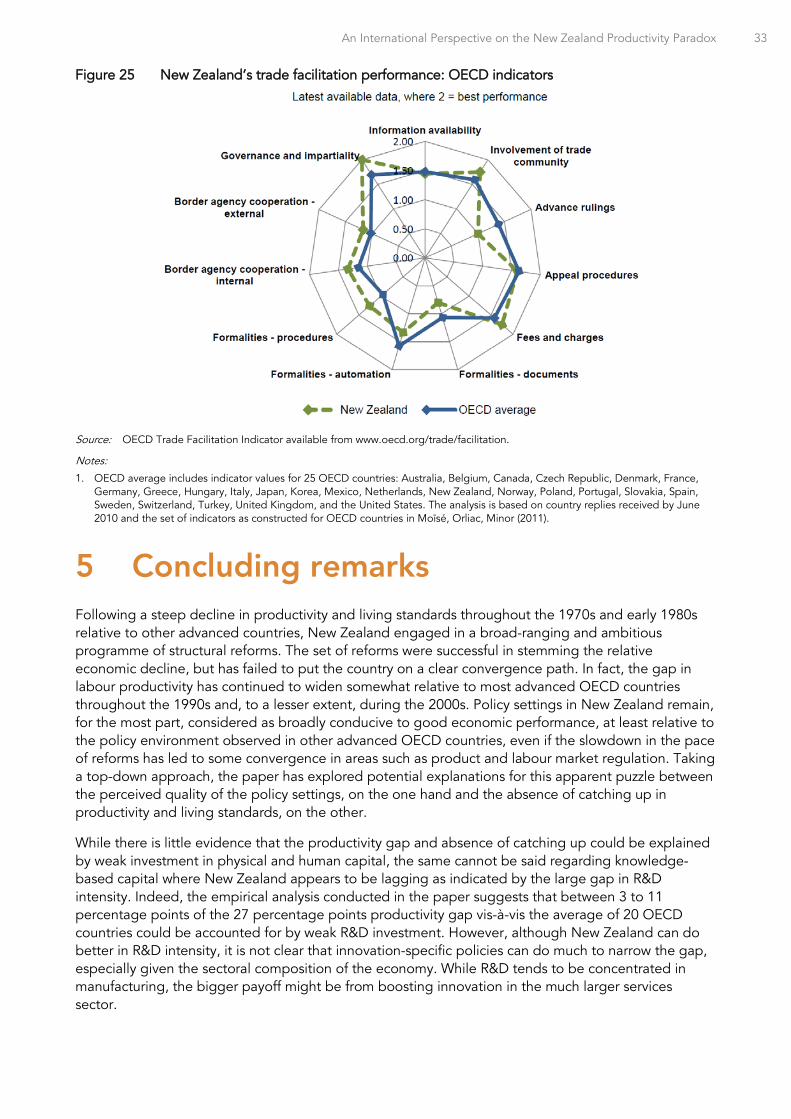
An International Perspective on the New Zealand Productivity Paradox 33
Figure 25 New Zealand’s trade facilitation performance: OECD indicators
Source: OECD Trade Facilitation Indicator available from www.oecd.org/trade/facilitation.
Notes:
1. OECD average includes indicator values for 25 OECD countries: Australia, Belgium, Canada, Czech Republic, Denmark, France, Germany, Greece, Hungary, Italy, Japan, Korea, Mexico, Netherlands, New Zealand, Norway, Poland, Portugal, Slovakia, Spain, Sweden, Switzerland, Turkey, United Kingdom, and the United States. The analysis is based on country replies received by June 2010 and the set of indicators as constructed for OECD countries in Moïsé, Orliac, Minor (2011).
5 Concluding remarks Following a steep decline in productivity and living standards throughout the 1970s and early 1980s relative to other advanced countries, New Zealand engaged in a broad-ranging and ambitious programme of structural reforms. The set of reforms were successful in stemming the relative economic decline, but has failed to put the country on a clear convergence path. In fact, the gap in labour productivity has continued to widen somewhat relative to most advanced OECD countries throughout the 1990s and, to a lesser extent, during the 2000s. Policy settings in New Zealand remain, for the most part, considered as broadly conducive to good economic performance, at least relative to the policy environment observed in other advanced OECD countries, even if the slowdown in the pace of reforms has led to some convergence in areas such as product and labour market regulation. Taking a top-down approach, the paper has explored potential explanations for this apparent puzzle between the perceived quality of the policy settings, on the one hand and the absence of catching up in productivity and living standards, on the other.
While there is little evidence that the productivity gap and absence of catching up could be explained by weak investment in physical and human capital, the same cannot be said regarding knowledge-based capital where New Zealand appears to be lagging as indicated by the large gap in R&D intensity. Indeed, the empirical analysis conducted in the paper suggests that between 3 to 11 percentage points of the 27 percentage points productivity gap vis-à-vis the average of 20 OECD countries could be accounted for by weak R&D investment. However, although New Zealand can do better in R&D intensity, it is not clear that innovation-specific policies can do much to narrow the gap, especially given the sectoral composition of the economy. While R&D tends to be concentrated in manufacturing, the bigger payoff might be from boosting innovation in the much larger services sector.
34 An International Perspective on the New Zealand Productivity Paradox
In this regard, there are indications that New Zealand could improve its performance in ICT investment, which is one of the key drivers of innovation in services. In order to maximise the return on ICT investment, it is important that firms adapt business practices to better exploit the new technology. While direct and comparable data on organisational capital are unavailable, recent survey-based information points to a sizeable margin for improvement on average in managerial practices. It shows that somehow poorly-managed firms are able to survive to a greater extent than in higher-productivity countries such as the United States. Insufficient competition in the domestic market could be an explanation. While product market regulation is considered overall as conducive to firm entry and competition, there is room for improvement in specific sectors. Also, pressures from the financial system on managers may not be very strong compared to those being exerted in a market-based system such as in the United States.
In addition, incentives to invest in KBC are influenced by the perceived ability of firms to ramp up production sufficiently rapidly to fully reap the potential of increasing returns to scale of the production of ideas. This in turns depends on the ease with which capital and labour resources can be reallocated across firms. The ability to draw capital following innovation has been shown to be influenced by access to early-stage venture capital as well as by regulation of professional services, two areas where New Zealand’s standing lags that of other countries.
Access to a large market is also crucial in realising returns on specialisation and investment in new ideas. In this regard, New Zealand is twice penalised by physical distance to vast external markets as well as by limited scope for internal agglomeration. Estimates provided in the paper suggest that more limited access to market and suppliers could explain as much as 15 percentage points of New Zealand’s productivity gap (Figure 18). Furthermore, the results also suggest that the returns on human capital may be hampered by the small and dispersed population, which limit the scope to benefit from agglomeration externalities. The remote access to major external markets is reflected in the low trade intensity of New Zealand considering its small size. Insofar as one of the benefits from international trade is to heighten pressures from competition, it is important for the authorities to ensure that other barriers to competition be lowered as much as possible, starting with those arising from product market regulation.
Overall, the empirical estimates provided in the paper suggest that remote access to market and suppliers and low investment in innovation (as measured by R&D intensity) could together account for between 17 to 22 percentage points of the productivity gap vis-à-vis the average of 20 OECD countries. If one adds to this 3 percentage points that can be attributed to the labour market integration of low-skilled workers, this would put New Zealand 2 to 7 percentage points below the average of those advanced OECD countries in terms of productivity instead of nearly 30 percentage points.
An International Perspective on the New Zealand Productivity Paradox 35
References Anderson, J. E., & Wincoop, E. van. (2004). Trade costs, Journal of Economic Literature, American
Economic Association, 42(3), 691-751, September.
Andrews, D. (2013). Policy determinants of TFP growth: Evidence from firms in OECD countries, Mimeo.
Andrews, D., & de Serres, A. (2012). Intangible assets, resource allocation and growth: A framework for analysis, OECD Economics Department Working Papers, no. 989. Paris, France: OECD.
Andrews, D., & Criscuolo, C. (2013). Knowledge-based capital, innovation and resource allocation, OECD Economics Department Working Papers, no. 1046. Paris, France: OECD.
Baldwin, J.R., Gu, W. & Macdonald, R. (2011). Intangible capital and productivity growth in Canada, Statistics Canada, mimeo.
Barnes, S., Bouis, R., Briard, P., Dougherty, S., and Eris, M. (2011). The GDP impact of reform: a simple simulation framework, OECD Economics Department Working Papers, no. 834, Paris, France: OECD.
Berthelon, M., & Freund, C. (2008). On the conservation of distance in international trade, Journal of International Economics, 75, 310-320.
Bessen, J., Ford, J. L. & Meurer, M. J. (2011). The private and social costs of patent trolls, Working Papers 1103, Research on Innovation.
Black, S. E., & Lynch, L.M. (2004). What's driving the new economy?: The benefits of workplace innovation, Economic Journal, Royal Economic Society, 114(493), F97-F116, 02
Blonigen, B.A., & Wilson, W. (2006). New measures of port efficiency using international trade data, NBER Working Papers 12052. Cambridge, MA, United States: National Bureau of Economic Research.
Bloom, N., Genakos, C., Sadun, R. & Van Reenen, J. (2012). Management practices across firms and countries, NBER Working Papers 17850. Cambridge, MA, United States: National Bureau of Economic Research.
Bloom, N., Sadun, R. & Van Reenen, J. (2007). Americans do I.T. better: US multinationals and the productivity miracle, NBER Working Papers 13085. Cambridge, MA, United States: National Bureau of Economic Research.
Bosquet, C., & Boulhol, H. (2013). What is really puzzling about the distance puzzle, GREQAM Working Paper n°2009-12.
Boulhol, H., & de Serres, A. (2010). Have developed countries escaped the curse of distance?, Journal of Economic Geography, Oxford University Press, 10(1), 113-139, January.
Boulhol, H., & Turner, L. (2009). Employment-productivity trade-off and labour composition, OECD Economics Department Working Papers, no. 698. Paris, France: OECD.
Brynjolfsson, E., & Hitt, L. M. (2003). Computing productivity: Firm-level evidence, The Review of Economics and Statistics, MIT Press, 85(4), 793-808, November.
36 An International Perspective on the New Zealand Productivity Paradox
Brynjolfsson, E., Hitt, L. M. & Yang, S. (2002). Intangible assets: How the interaction of computers and organizational structure affects stock market valuations, Brookings Papers on Economic Activity, Economic Studies Program, The Brookings Institution, 33(1), 137-198.
Brynjolfsson. E., & Saunders, A. (2010). Wired for innovation: How information technology is reshaping the economy, The MIT Press.
Conway, P. et al. (2006). Regulation, competition and productivity convergence, OECD Economics Department Working Papers, no. 509. Paris, France: OECD.
Corrado, C., Hulten, C., & Sichel, D. (2005). Measuring capital and technology: An expanded framework, in Corrado et al. (eds.), Measuring capital in the new economy, National Bureau of Economic Research Studies in Income and Wealth, 65, 11-45. Chicago, IL, United States: The University of Chicago Press.
Corrado, C., Hulten, C., & Sichel, D. (2006). Intangible capital and economic growth, NBER Working Paper, no. 11948. Cambridge, MA, United States: National Bureau of Economic Research.
Corrado, C., Hulten, C., & Sichel, D. (2009). Intangible capital and U.S. economic growth, Review of Income and Wealth, International Association for Research in Income and Wealth, 55(3), 661-685, 09.
Crawford, R., Fabling, R., Grimes, A., & Bonner, N. (2007). National R&D and patenting: Is New Zealand an outlier?, New Zealand Economic Papers, 41(1), 69-90.
Crespi, G., Criscuolo, C. & Haskel, J. (2007). Information technology, organisational change and productivity growth: Evidence from UK firms, CEP Discussion Papers DP0783, Centre for Economic Performance, LSE.
Disdier, A-C., & Head, K. (2008). The puzzling persistence of the distance effect on bilateral trade, The Review of Economics and Statistics, 90(1), 37-48.
Fukao, K., Miyagawa, T., Mukai, K. & Shinoda, Y. (2009). Intangible investment in Japan: Measurement and contribution to economic growth, The Review of Income and Wealth, 55(3), September, 717-736.
Golub, S.S., & Tomasik, B. (2008). Measures of International Transport Cost for OECD Countries OECD Economics Department Working Papers 609. Paris, France: OECD.
Goolsbee, A., & Klenow, P. J. (2006). Valuing consumer products by the time spent using them: An application to the internet, American Economic Review, American Economic Association, 96(2), 108-113, May.
Gordon, R. J. (2004). Why was Europe left at the station when America's productivity locomotive departed? NBER Working Paper Series, no. 10661. Cambridge MA, United States: National Bureau of Economic Research.
Griffith, R, Redding, S. & Van Reenen, J. (2004). Mapping the two faces of R&D: Productivity growth in a panel of OECD industries, The Review of Economics and Statistics, MIT Press, 86(4), 883-895, November.
Griliches, Z. (1979). Issues in assessing the contribution of research and development to productivity growth, Bell Journal of Economics, The RAND Corporation, 10(1), 92-116, Spring.
Hall, B. H., Mairesse, J. & Mohnen, P. (2010). Measuring the returns to R&D, CIRANO Working Papers 2010s-02, CIRANO.
An International Perspective on the New Zealand Productivity Paradox 37
Hummels, D. (2007). Transportation costs and international trade in the second era of globalization, Journal of Economic Perspectives, American Economic Association, 21(3), 131-154, Summer.
Jalava, J., Aulin-Ahmavaara, P. & Alanen, A. (2007). Intangible capital in the Finnish business sector, 1975-2005, ETLA Discussion Papers no. 1103.
Jensen, P.H., & Webster, E. (2006). Managing knowledge flows through appropriation and learning strategies, Melbourne Institute Working Paper Series wp2006n06. Melbourne, VIC, Australia: Melbourne Institute of Applied Economic and Social Research, The University of Melbourne.
Jona-Lasinio, C., Iommi, M. & Manzocchi, S. (2011). Intangible capital and productivity growth in European countries, LLEE Working Paper Series, no. 91.
Jones, C. I., & Romer, P.M. (2010). The New Kaldor facts: ideas, institutions, population, and human capital, American Economic Journal: Macroeconomics, American Economic Association, 2(1), 224-45, January.
Jones, C.I. (2005). Growth and ideas, Chapter 16 in Aghion P., & Durlauf, S. (eds.), Handbook of Economic Growth, Vol. B. San Diego, CA, United States: Elsevier B.V.
Jorgenson, D.W., Ho, M. S., & Stiroh, K. J. (2008). A retrospective look at the U.S. productivity growth resurgence, Journal of Economic Perspectives, American Economic Association, 22(1), 3-24, Winter.
Kalinova, B., Palerm, A. & Thomsen, S. (2010). OECD’s FDI Restrictiveness Index: 2010 Update, OECD Working Papers on International Investment, No. 2010/3, OECD Investment Division.
Koopman, R., Powers, W., Wang, Z., & Wei, S.-J. (2011). Give credit to where credit is due: tracing value added in global production chains, NBER Working Papers Series no. 16426. Cambridge, MA, United States: National Bureau of Economic Research.
Mankiw, N.G., Romer, D., & Weil, D.N. (1992). A contribution to the empirics of economic growth, The Quarterly Journal of Economics, 107(2), May, 407-437.
Marrano, M. G., Haskel, J., & Wallis, G. (2009). What happened to the knowledge economy? ICT, intangible investment and Britain’s productivity record revisited, The Review of Income and Wealth, 55(3), September, 686-716.
Mason, G. (2013). New Zealand-Australia productivity differences: New comparisons at industry level. New Zealand Productivity Commission Working Paper 2013/02.
Moïsé, E., Orliac, T., & Minor, P (2011) Trade facilitation indicators: The impact on trade costs, OECD Trade Policy Paper, no. 118. Paris, France: OECD.
Nordås, H.K. (2008). The impact of services trade liberalisation on trade in non-agricultural products, OECD Trade Policy Papers no. 81. Paris, France: OECD.
Nordås, H.K., Miroudot, S., & Kowalski, P. (2006). Dynamic gains from trade, OECD Trade Policy Papers 43. Paris, France: OECD.
OECD. (2011). OECD Science, Technology and Industry Scoreboard 2011. Paris, France: Author.
OECD. (2012). Economic Policy Reforms: Going for Growth 2012. Paris, France.
OECD. (2013a). OECD economic surveys: New Zealand 2013. Paris, France: Author.
OECD. (2013b). OECD science, technology and industry scoreboard 2013. Paris, France: Author.
38 An International Perspective on the New Zealand Productivity Paradox
OECD. (2013c). Interconnected economies—benefitting from global value chains. Paris, France: Author.
OECD. (2013d). OECD global value chain indicators. Paris, France: Author.
OECD. (2013e). Supporting investment in knowledge capital, growth and innovation. Paris, France: Author.
Oliner, S. D., & Sichel, D. E. (2000). The resurgence of growth in the late 1990s: Is information technology the story?, Journal of Economic Perspectives, American Economic Association, 14(4), Fall, 3-22.
Polder, M., van Leeuwen, G., Mohnen, P., & Wladimir, R. (2010). Product, process and organizational innovation: drivers, complementarity and productivity effects, MPRA Paper 23719. Munich, Germany: University Library of Munich.
Procter, R. (2011). Enhancing productivity: Towards an updated action agenda, Occasional Paper no. 11/01. Wellington: Ministry of Economic Development.
Redding, S., & Venables, A.J. (2004). Economic geography and international inequality, Journal of International Economics, Elsevier, 62(1), 53-82, January.
Roth, F., & Thum, E. (2010). Does intangible capital affect economic growth?, Centre for European Policy Studies Working Document no. 335, September.
Solow, R. M. (1956). A contribution to the theory of economic growth, Quarterly Journal of Economics, 70(1), 1956, 65–94.
van Ark, B., Hao, J.X., Corrado, C., & Hulten C. (2009). Measuring intangible capital and its contribution to economic growth in Europe, EIB Papers 14(1), 62-93.
van Ark, B., O'Mahoney, M., & Timmer, M.P. (2008). The productivity gap between Europe and the United States: Trends and causes, Journal of Economic Perspectives, American Economic Association, 22(1), 25-44, Winter.
Westmore, B. (2013). R&D, patenting and growth: The role of public policy, OECD Economics Department Working Papers, no. 1047. Paris, France: OECD.