social sector productivity: a task perspective - productivity … · · 2017-06-01iv social...
TRANSCRIPT
Social sector productivity: a task perspective
Research Note 2017/01
May 2017
Author: Danijela Tavich
The New Zealand Productivity Commission Research Note: Social sector productivity: a task perspective Te Kōmihana Whai Hua o Aotearoa1
Date: May 2017
Author: Danijela Tavich
JEL classification: H4, H5, I30
ISBN: 978-0-478-44045-4
Acknowledgements: The following people kindly made time to discuss draft findings with the author:
Murray Sherwin, Graham Scott, Sally Davenport, Patrick Nolan, Geoff Lewis and Dave Heatley,
Productivity Commission; Emeritus Professor Bob Gregory and Dr Barbara Allen, Victoria University of
Wellington School of Government; Alastair Cameron and Megan Taylor, The Treasury; John Dickson,
Presbyterian Support Northern; Derek Gill, New Zealand Institute of Economic Research; David Rea,
Ministry of Social Development; Simon Wakeman, Social Investment Unit. Thank you also to Professor
Claudia Scott, of the Victoria University of Wellington School of Government, for reviewing this note.
The Commission – an independent Crown entity – completes in depth inquiry reports on topics
selected by the Government, carries out productivity related research and promotes understanding of
productivity issues. The Commission aims to provide insightful, well –formed and accessible advice that
leads to the best possible improvement in the wellbeing of New Zealanders. The New Zealand
Productivity Commission Act 2010 guides and binds the Commission.
Information on the Productivity Commission can be found on www.productivity.govt.nz or by contacting
+64 4 903 5150.
1 The Commission that pursues abundance for New Zealand
Disclaimer
The views expressed in this Research Note are strictly those of the author. They do not necessarily
reflect the views of the New Zealand Productivity Commission or the New Zealand Government.
The author is solely responsible for any errors or omissions. The contents of this report must not
be construed as legal advice. The Commission does not accept any responsibility or liability for an
action taken as a result of reading, or reliance placed because of having read any part, or all, of
the information in this report. The Commission does not accept any responsibility or liability for
any error, inadequacy, deficiency, flaw in or omission from this report.

New Zealand Productivity Commission Research Note 2017/01 iii
Executive summary
Background
This research note adopts a public management framework to explore the complexity and challenges
of introducing productivity measurement in the social sector. The framework draws on James Q
Wilson’s matrix of government tasks (Wilson, 1989) and literature which explores its strengths and
limitations (Gregory (1995a) and Gregory and Lonti (2008)). This note applies the matrix to a set of tasks
within one organisation in the social sector. The tasks are drawn from the 2015/2016 Ministry of Social
Development (MSD) Annual Report. Although limitations exist with this approach, the process of
applying the framework and associated feedback received raise interesting 6insights surrounding the
challenge of measuring public sector capability.
This note was prepared for the internship component of my Master of Public Policy (MPP) degree for
two days a week over 9 weeks in the summer of 2016-17. As part of the preparation of this note,
feedback on draft material was sought and received from stakeholders within and outside government
agencies. I also reviewed a number of the submissions to the Commission’s More Effective Social
Services Inquiry (along with the inquiry itself). These documents provided useful insights into some of
the key practices and concerns of the social services sector.
The Wilson Framework for Tasks
The Wilson matrix is divided into four quadrants, representing different types of tasks and the
observability of outputs and outcomes. Production tasks are those which have both observable outputs
and outcomes; procedural ones have observable work but unobservable outcomes; craft tasks produce
observable outcomes through unobservable work; and neither outputs nor outcomes of coping tasks
are observable. The application of selected MSD tasks to the matrix is illustrated in Figure 1.
Figure 1 Tasks in the MSD Annual Report
Source: Adapted from Gregory (1995a)
It should be acknowledged that the matrix does not provide definitive and precise differentiation
among different tasks, with some tasks not fitting into the typology (Lonti & Gregory, 2007, p. 473). To
represent the imprecision of the classifications the lines between the quadrants have been dashed. But
even with these caveats the matrix proves a useful heuristic tool in distinguishing among social sector
tasks, demonstrating the varying observability of outputs and outcomes for each.

iv Social sector productivity: a task perspective
Discussion
The starting point for defining a measure is to establish what it will be used for and what change you
want to encourage (otherwise there is a risk of “hitting the target but missing the point” (Bevan &
Hood, 2006, p. 421)). These decisions will affect how outputs and outcomes should be defined, which
will in turn affect their observability and the identified measurability of tasks.
Broadly defined, outputs are the work that organisations carry out and the things (goods and services)
produced, and outcomes are the effects of this work on communities and society at large (Gregory &
Lonti, 2008, p. 839). However, outputs and outcomes can be defined in different ways depending on
the levels at which they are to be observed. How outputs and outcomes are defined depends on the
question being asked, and these definitions significantly affect how the application is applied to the
four types of task (production, procedural, craft and coping).
It is also necessary to recognise how a measure may have unintended effects (including when it comes
to collecting data, e.g., the “Hawthorne effect” (McCambridge, Witton, & Elbourne, 2014, p. 268)).
Further, there is already measurement taking place in these services and so measures do not start from
a blank slate. Finally, there are a range of views on the prospects for productivity measurement – from
“it’s a private sector concept that cannot apply to public services” to “even the most complex tasks
have outputs and inputs that can be measured”.
So where does this take us when we are seeking improvements to productivity? In many cases, standard
productivity concepts are compatible with social sector tasks. Indeed, some government tasks (eg,
production and procedural tasks) have characteristics similar to private sector ones; so a metric such as
volume of output/volume of inputs can be relatively easy to use.
However, for some other tasks (eg, craft and coping tasks) using standard measures is a challenge. With
creativity it is possible that some useful measures could be developed for these tasks, but this involves
moving from productivity measures into other forms of performance assessment, such as cost
effectiveness (showing the relationship between inputs and final outcomes) (see Figure 1).
In this respect, the social investment approach is an interesting possibility. Use of data such as that in
the Integrated Data Infrastructure (IDI) could illuminate ultimate outcomes not previously measurable,
although some problems (such as attribution) will remain. This is a space to watch.
Figure 1 A schematic outline of public sector performance
Source: Van Dooren et al. (2010) p. 18
External factors
Outputs Outcomes Desiredoutcomes
Effectiveness
Inputs• Expenditure• Personnel
Confidence
Societal factors• Demography• Economy• Social circumstances• State of public finance
Wellbeing
Cost-effectiveness
Public sectorProductivity
6
1
13
2 3 4
11
5
7
12
10
8
9

New Zealand Productivity Commission Research Note 2017/01 v
Contents
Executive summary .................................................................................................................. iii
Abstract ................................................................................................................................... vi
Social sector productivity: a task perspective .......................................................................... 1 Challenges and the importance of task ......................................................................................... 1 Defining levels of measurement .................................................................................................... 2 Illustrating tasks in a single organisation (MSD)............................................................................ 3 Implications for productivity measurement ................................................................................... 4 Production and procedural tasks ................................................................................................... 5 Craft tasks ........................................................................................................................................ 5 Coping tasks .................................................................................................................................... 6 Where to from here? ....................................................................................................................... 7
References ............................................................................................................................... 9
Tables
Table 1 Compatibility of selected tasks with productivity concepts ............................................ 5
Figures
Figure 1 A schematic outline of public sector performance ......................................................... iv Figure 2 Selected tasks in MSD (adapted from James Q Wilson in Gregory, 1995a, p. 172) ...... 3 Figure 3 The reliance of tasks on co-production (Gregory, 1995a, p. 174) ................................... 6

vi Social sector productivity: a task perspective
Abstract
The social sector or ‘social services sector’ delivers a wide range of services to New Zealanders throughout their lives (Whitcombe, 2009; Social Sector Forum, 2014, p. 1). The significance of the social sector for achieving positive outcomes in the lives of New Zealanders is reflected in its contribution to eight of the ten Better Public Services targets (MSD, 2014, p. 7). Productivity is an important concept in the social sector because a more productive social sector will increase wellbeing, all else being equal (NZPC, 2015, p. 30). However, if we are to improve social sector productivity we must first measure where it stands, and herein lies the challenge (Hanushek & Ettema, 2015, p. 1). This research note focuses on measuring productivity, with an emphasis not on specific measures but rather adopting a public management lens and considering the implications and risks of using productivity measures in this space. The discussion will centre on the James Q. Wilson matrix framework as discussed in Gregory (1995a, pp. 172-173), which illustrates the importance of distinguishing among different social sector tasks when considering performance measurement. This research note suggests that standard productivity measurement may not be compatible with tasks that have unobservable outputs and outcomes. In such cases, other measures of performance are needed. Nonetheless, standard measures appear compatible with some tasks, and their use could enable a greater understanding of social sector productivity and lead to improved living standards.

New Zealand Productivity Commission Research Note 2017/01 1
Social sector productivity: a task perspective
The social sector is complex, covering a variety of activities including health, education and welfare
services. The Government is the primary funder of the sector, financing services with the aim of
improving a set of outcomes that people value, such as improved health, less crime, and more and
better jobs (NZPC, 2015, pp. 4-5). The sector includes significant use of contracting out, leading to a
diverse set of service providers including not-for-profit (NFP), for-profit (FP) and public organisations
(Social Sector Forum 2014, p. 3; NZPC 2015, p. 5). The importance of the sector is reflected in its role in
the Treasury’s Living Standards Framework and the social investment approach (Gleisner, Llewellyn-
Fowler, & McAlister, 2011, p. 20; Destremau & Wilson, 2016, p. i).
Productivity is a measure of the capacity of an economy, industry or organisation to produce goods and
services (outputs) using inputs such as labour and capital (such as machinery, computer software and
land). It is a measure of the ratio of the volume of output to the volume of inputs (Gemmell, Nolan, &
Scobie, 2017, p. 11). Productivity is important because a social sector that delivers more or improved
services with the same inputs (or the same services with fewer inputs) will enhance wellbeing, holding
other factors constant.
As client expectations of service quality rise and resources in the social sector come under increasing
pressure, particularly with an ageing population, understanding productivity in the sector could prove
increasingly useful (NZPC, 2015, p. 6). This is because a more productive sector would ease this
pressure on resources, and in doing so expand the range of options for decision-makers. Importantly,
improvements in productivity come from being more effective rather than from longer hours of work
(NZPC, 2015, p. 30). Improved productivity is also consistent with the Better Public Services targets, as
increasing productivity is one of the themes underpinning the BPS approach to ‘doing more with less’
(SSC, 2016).
A vital component of productivity measurement in the social sector is ‘quality adjustment.’ Quality
adjustments can play an important role in the interpretation of public sector productivity data
(especially trends). Failing to take quality changes into account would paint an unfair picture of service
performance and potentially discourage valuable activity (Hanushek & Ettema, 2015, p. 8). Quality
adjustments can be made to inputs, outputs, and outcomes (Gemmell, Nolan, & Scobie, 2017, p. 26).
Much work in developing quality adjustments for productivity measurement has taken place
internationally (ibid., p. 26).
Challenges and the importance of task
Several difficulties immediately become apparent when attempting to measure social sector
productivity. Some challenges apply to performance measurement generally, such as the ‘Hawthorne
effect’, which occurs when the subjects of study alter behaviour due to being observed and
consequently compromise the accuracy of results (McCambridge, Witton, & Elbourne, 2014, p. 268).
Other challenges are more specific to productivity measurement in the social sector. These challenges
include the absence of market clearing prices for public services, which are often provided free or with
subsidised prices. In contrast, in the private (or measured) sector market prices can be used to indicate
service value based on customers’ ‘willingness to pay’ (Gemmell, Nolan, & Scobie, 2017, p. 13).
Another challenge is accounting for institutional settings that can be significantly different to the
private sector (ibid, p. 14). One such institutional difference, the observability of outputs and outcomes,
provides important challenges for productivity measurement and thus is the focus of this research note.
‘Outputs’ are the work that organisations carry out and the things (goods and services) produced.
‘Outcomes’ are the effects of this work on communities and society at large (Gregory & Lonti, 2008, p.
839). These definitions can be further broken down – a point that will be returned to later.

2 Social sector productivity: a task perspective
The setting of well-defined and measurable goals (and thus the definition of outputs and outcomes)
can be problematic in the social sector. As mentioned above, the sector is diverse and encompasses a
wide range of tasks. Compared to measured sector firms, some of these tasks have relatively complex
goals, including, for example, distributional impacts as well as efficiency. Furthermore, where goals can
be identified at a high level (such as investment in human capital), difficulty in observing outputs and
outcomes and the role of co-production (whether service delivery is self-contained) can mean it is hard
to define measurable indicators of performance (Gemmell, Nolan, & Scobie, 2017, p. 15). As
productivity measurement requires some measure of outputs (or outcomes), this is a significant issue for
the development of meaningful measures that might capture real value created by a task rather than
“mindless bean counting” of what can easily be counted (Gregory & Lonti, 2008, p. 848).
Similar issues were raised in several submissions to the NZPC’s More Effective Social Services inquiry
(2015, p. 314). Presbyterian Support New Zealand argued in their submission that only some services
have observable outcomes, stating that “[m]ost outcomes are the result of input from multiple agencies
and it is very difficult to attribute outcomes to one service. For example, a move on to permanent
housing may involve a supported housing provider, health worker/ NGO worker, WINZ, Housing New
Zealand. The same outcome of one person moved on requires the input of all and is measured and
reported by all” (2015, p. 18). Auckland District Council of Social Services also described the problems
of unobservable outcomes and coproduced tasks. It was noted that “[f]or building community
resilience a great many services come together each with varying but unmeasurable effectiveness so
the proportionate role of each input which led to the outcome usually can’t be determined” and that
“[f]or early interventions with children and other intractable issues the outcomes are not seen for a
generation or more but desperately need to be supported” (2014, p. 6). The Health and Disability
Network noted the differences and challenges of defining outcomes in the health and social services
sector (compared to say engineering or manufacturing), and that a “one-size-fits-all” approach to the
sector is not appropriate given its diversity (2014, p. 4).
It would be inappropriate to transplant a one-size-fits-all productivity measure from the private sector
to all social sector tasks as this would imply that each task can be measured in the same way. Inevitably,
the measurement of a task with less observable outputs and outcomes, such as community corrections,
will require a different approach than one with easily observable outputs and outcomes, such as tax
collection (Gregory, 1995b, p. 3). As a result, care must be taken in considering types of tasks, the
observability of outputs and outcomes (measurability) for each, and – if deemed appropriate –
productivity measures developed accordingly.
Defining levels of measurement
It is important to note that much performance measurement already takes place in the social sector,
despite the challenges in defining outputs and outcomes (see Laking in Gill, 2011, pp. 191-214). The key
is the level at which outputs and outcomes are defined for performance measurement. As mentioned
above, outcomes and outputs can be defined in different ways. Outcomes can be broken into
intermediate and ultimate outcomes. Ultimate outcomes are the overall objective for an intervention or
service, the impact on society and the wider community of the task. Intermediate outcomes are
objectives that serve as goals along the path to an ultimate outcome (Coglianese, 2012, p. 12). Because
intermediate outcomes are more observable in the shorter term, they can be easier to attribute to a
given intervention and easier to measure than ultimate outcomes (ibid, p. 22).
Outputs, similarly, can be considered at two levels. Outputs can be defined as the daily activities
undertaken at the level of individual officials performing a given task (Gregory, 1995a, p. 173), or they
can be defined at a higher level of overview of the task, for example labour hours worked or number of
clients seen (Laking, 2008, p. 82). The way that outputs and outcomes are defined is dependent on the
question being asked, or the objective of performance measurement.
This research note considers outputs as the daily work undertaken by officials, and outcomes as
ultimate outcomes. These definitions have been chosen because they are consistent with those used in
the original article that applied the James Q. Wilson matrix to tasks in the manner that will be

New Zealand Productivity Commission Research Note 2017/01 3
employed here (Gregory, 1995a). Additionally, discussing outputs and outcomes in this manner offers
an opportunity to consider the ability of productivity measurement to capture the actual work being
undertaken by officials and to link this activity to its ultimate end. Applying productivity measurement at
this level would contribute to the objective of developing an effective learning system in the social
sector (as recommended by the NZPC inquiry into more effective social services (recommendation 5.3))
by enabling more granular performance measurement and thus deeper learning on the subject of
productivity – what does or does not work and why (NZPC, 2015, pp. 13, 368).
Illustrating tasks in a single organisation (MSD)
The James Q. Wilson matrix (see Figure 2) in Gregory (1995a, pp. 172-173) was developed for
application to the public sector and it should be acknowledged that it does not provide definitive and
precise differentiation among different tasks, with some tasks not fitting into the typology (Lonti &
Gregory, 2007, p. 473). For this reason dashed lines have been used between the quadrants. Even so,
this model proves a useful heuristic tool in distinguishing among social sector tasks, demonstrating the
varying observability of outputs and outcomes for each type of task, and providing a basis for
discussion of the implications for productivity measurement. The application of this matrix to the social
sector will be illustrated through tasks contained in the Ministry of Social Development (MSD) annual
report for 2015/2016, as MSD is the lead agency for the sector (MSD, 2009).
The Wilson matrix is divided into four quadrants, representing different types of task per observability
of outputs and outcomes. Production tasks are those which have both observable outputs and
outcomes; procedural ones have observable work but unobservable outcomes; craft tasks produce
observable outcomes through unobservable work; and neither outputs nor outcomes of coping tasks
are observable (Gregory, 1995a, p. 172). The examples mentioned earlier of community corrections and
tax collection would be categorised as coping and production tasks, respectively (Gregory, 1995b, p. 3).
Figure 2 Selected tasks in MSD (adapted from James Q Wilson in Gregory, 1995a, p. 172)
Figure 2 shows four tasks that have been categorised per the Wilson typology. The chosen tasks are not
intended to represent the totality of MSD functions. Nevertheless, they provide an interesting
illustration of task types within a single social sector organisation. The classifications are explained as
follows:
Production: Administering income support to seniors has been categorised as a production task.
This task includes paying New Zealand Superannuation and social security entitlements to older
persons, administering international social security agreements relating to non-superannuitants,

4 Social sector productivity: a task perspective
and assessing financial entitlement to Residential Care Subsidies (MSD, 2016, p. 59). As work is
clearly prescribable (with New Zealand Superannuation being universal) there is little discretion
needed by officials, making outputs easily observable (Work and Income, 2017) (Gregory, 1995a, pp.
4-5). Outcomes (eg, the ability of seniors to maintain their independence and social participation)
are also observable (MSD, 2016, p. 59).
Procedural: Data, analytics and evidence services and policy advice have been classified as
procedural tasks, with outputs being the policy advice and outcomes being the impacts of that
advice on the community. This entails providing advice (including second opinion advice and
contributions to policy advice led by other agencies) to support decision-making by Ministers on
government social policy matters, including social sector issues (MSD, 2016, pp. 57, 68). In contrast
to Ministries such as the Treasury, where the general outcome of fiscal policy advice is relatively
evident, social policy advice outcomes are much more difficult to observe and to attribute directly
to the advice (Gregory, 1995a, pp. 175-176).
Craft: Improving employment and social outcomes support has been classed as a craft task. This
task entails operating the benefit system and associated interventions in such a way as to improve
client outcomes (employment and social) by moving them closer to independence (MSD, 2016, p.
78). The outcomes of this task, moving clients toward independence (away from benefit
dependency, for example through gaining employment) are observable. However, as greater
discretion (cf, application processes for superannuation) is required by officials in how to operate a
package of interventions in a way that will achieve outcomes, the value of outputs is more difficult
to observe (MSD, 2016, p. 78).
Coping: Care and Protection Services have been classified as coping tasks. These include the social
work services that protect and assist children and young people who are in need of care and
protection, including education and advice services for the recognition and prevention of child
abuse and neglect (MSD, 2016, p. 54). This is because social workers have to exercise much
discretion in their daily work in communities (in the absence of clear outputs), with the outcomes of
this work being highly uncertain (Lonti & Gregory, 2007, p. 474).
Implications for productivity measurement
The implications for measuring productivity of the analysis above can be seen for each of the aspects of
productivity measurement, such as inputs, outputs, outcomes and quality change, as shown in Table 1.
The features of the particular task will shape the appropriate approach to performance management
and thus productivity measurement (with the broader objective being improvement of social sector
productivity). The purposes of performance measures can range from accountability purposes, such as
monitoring and legitimisation (for the more compatible tasks), to learning purposes such as attention
focusing and strategic decision-making (for those tasks that are more difficult to accurately measure)
(Henri, 2006, pp. 80-81). These distinctions have been made because what can be seen as an
appropriate measure at least partly depends on the purpose to which it will be used (Lonti & Gregory
2007, p. 480; Merton 1968, p. 260).
Table 1 demonstrates that the input side of the productivity equation is relatively less complex, as
inputs for social sector tasks are mostly labour, which could be measured through looking at hours
worked by employees. Alternatively, multi-factor productivity can be measured based on total dollars
spent as the input (Hanushek & Ettema, 2015, p. 4). However, there are still complications. For instance,
there can be differences in the motivations of public, not for profit (NFP) and for profit (FP) employees,
although this can be overstated (Le Grand, Lipsey, & Enthoven, 2007, pp. 19-21) and so (arguably) does
not provide an insurmountable issue for input measurement (Gemmell, Nolan, & Scobie, 2017, pp. 14-
15). Input measures can also account for the characteristics of the clients of social sector services
themselves. This can be a key consideration when assessing case difficulty (for example, finding
employment for long-term welfare recipients versus highly skilled individuals transitioning between
jobs) and which in turn is important for assessing whether performance metrics incentivise social sector
organisations to cherry-pick the client cases that are easiest to resolve (NZPC, 2015, pp. 153-154).

New Zealand Productivity Commission Research Note 2017/01 5
Table 1 Compatibility of selected tasks with productivity concepts
Task type Inputs (labour and capital)
Outputs Outcomes Ability to measure quality change
Production –
Administering
income support
to seniors
Capital (money,
computers,
buildings etc.)
Labour intensive
Monetary
transfers
Entitlement
eligibility
assessments
Ability of seniors
to maintain
independence
and social
participation
Using outputs or
outcomes
Procedural –
Data, analytics,
evidence and
policy advice
Capital (money,
computers,
buildings etc.)
Labour intensive
Advice delivered
to Minister
Unobservable –
outcome
attribution issues,
impacts of work
uncertain
Using outputs
Craft – Improving
employment and
social outcomes
support
Capital (money,
computers,
buildings etc.)
Labour intensive
Attributes of
clients etc.
Unobservable –
much discretion
by officials,
difficult to
prescribe outputs
Clients moving
closer to
independence
(away from
benefit
dependency)
Using outcomes
Coping – Care
and protection
services
Capital (money,
computers,
buildings etc.)
Labour intensive
Attributes of
clients etc.
Unobservable –
much discretion
by officials,
difficult to
prescribe outputs
Unobservable –
attribution
problems,
impacts of work
uncertain
Difficult
Production and procedural tasks
Considering Table 1, production and procedural tasks are demonstrably compatible with standard
productivity concepts and thus with measurement. Both tasks can be measured through the standard
productivity approach using outputs over inputs. The observable outcomes of production tasks, eg,
administering income support, can also be used as the basis for management metrics and learning.
Quality change measurement of both outputs and outcomes for production tasks is possible.
The outcomes of procedural tasks, for example, data, analytics and evidence services and policy advice,
are more difficult to measure. This provides a more limited foundation for learning than in the case of
production tasks. However, productivity measures based on outputs could still be useful tools for
understanding procedural processes. Quality change can be measured by considering proxies for the
quality of policy advice (outputs) in this case. Overall, the compatibility of production and procedural
tasks with productivity measurement means that measurement of these types of task could comfortably
serve productivity monitoring, strategic decision-making, legitimisation and attention focusing
purposes (Henri, 2006, pp. 80-81).
Craft tasks
Craft tasks, for example, improving employment and social outcomes, have observable results or
outcomes, which provide some basis for potential learning (MSD, 2015, pp. 30-32). Quality change in
this case can be estimated based on quality of outcomes, such as quality of post-benefit employment
(low-income, unstable employment versus a higher salary job with a long-term contract) (Rosenberg,
2015, p. 37). However, the observability of the outcomes of craft tasks depends how outcomes are
defined. For example, the longer-term impacts of this task on clients (beyond finding employment or
‘independence’), such as improved relationships with family, are less likely to be observable (potentially
shifting this task to a coping classification).
6 Social sector productivity: a task perspective
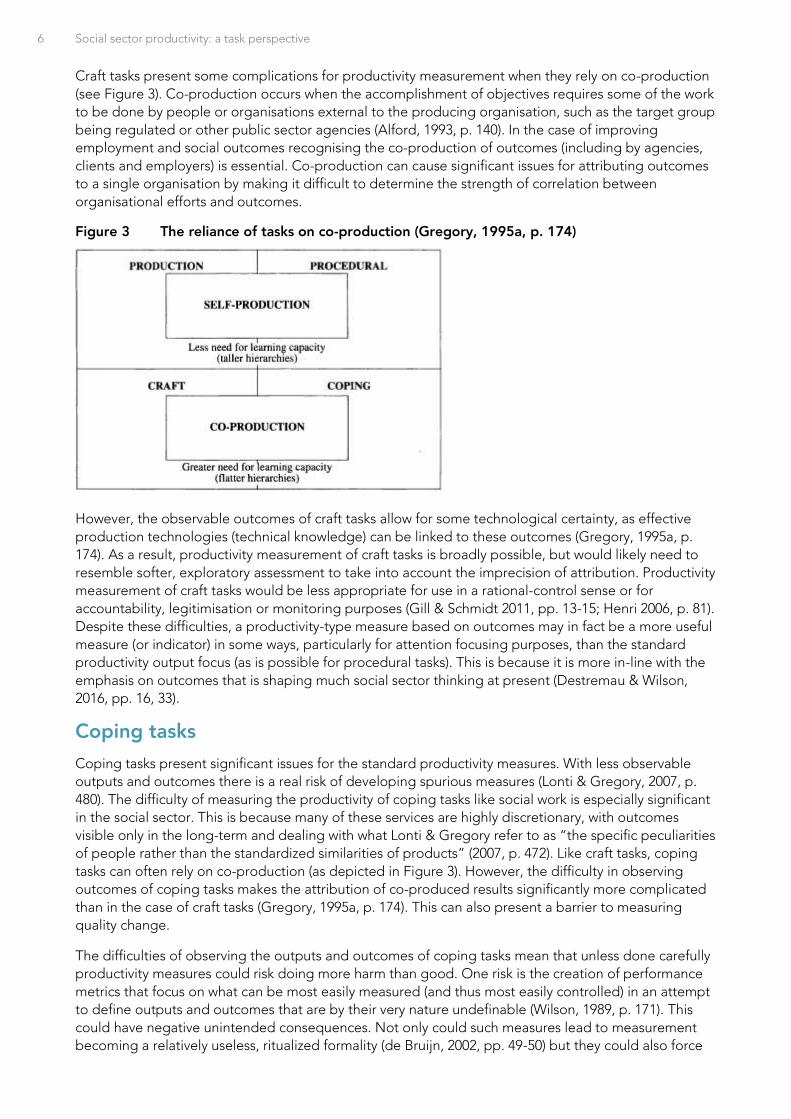
Craft tasks present some complications for productivity measurement when they rely on co-production
(see Figure 3). Co-production occurs when the accomplishment of objectives requires some of the work
to be done by people or organisations external to the producing organisation, such as the target group
being regulated or other public sector agencies (Alford, 1993, p. 140). In the case of improving
employment and social outcomes recognising the co-production of outcomes (including by agencies,
clients and employers) is essential. Co-production can cause significant issues for attributing outcomes
to a single organisation by making it difficult to determine the strength of correlation between
organisational efforts and outcomes.
Figure 3 The reliance of tasks on co-production (Gregory, 1995a, p. 174)
However, the observable outcomes of craft tasks allow for some technological certainty, as effective
production technologies (technical knowledge) can be linked to these outcomes (Gregory, 1995a, p.
174). As a result, productivity measurement of craft tasks is broadly possible, but would likely need to
resemble softer, exploratory assessment to take into account the imprecision of attribution. Productivity
measurement of craft tasks would be less appropriate for use in a rational-control sense or for
accountability, legitimisation or monitoring purposes (Gill & Schmidt 2011, pp. 13-15; Henri 2006, p. 81).
Despite these difficulties, a productivity-type measure based on outcomes may in fact be a more useful
measure (or indicator) in some ways, particularly for attention focusing purposes, than the standard
productivity output focus (as is possible for procedural tasks). This is because it is more in-line with the
emphasis on outcomes that is shaping much social sector thinking at present (Destremau & Wilson,
2016, pp. 16, 33).
Coping tasks
Coping tasks present significant issues for the standard productivity measures. With less observable
outputs and outcomes there is a real risk of developing spurious measures (Lonti & Gregory, 2007, p.
480). The difficulty of measuring the productivity of coping tasks like social work is especially significant
in the social sector. This is because many of these services are highly discretionary, with outcomes
visible only in the long-term and dealing with what Lonti & Gregory refer to as “the specific peculiarities
of people rather than the standardized similarities of products” (2007, p. 472). Like craft tasks, coping
tasks can often rely on co-production (as depicted in Figure 3). However, the difficulty in observing
outcomes of coping tasks makes the attribution of co-produced results significantly more complicated
than in the case of craft tasks (Gregory, 1995a, p. 174). This can also present a barrier to measuring
quality change.
The difficulties of observing the outputs and outcomes of coping tasks mean that unless done carefully
productivity measures could risk doing more harm than good. One risk is the creation of performance
metrics that focus on what can be most easily measured (and thus most easily controlled) in an attempt
to define outputs and outcomes that are by their very nature undefinable (Wilson, 1989, p. 171). This
could have negative unintended consequences. Not only could such measures lead to measurement
becoming a relatively useless, ritualized formality (de Bruijn, 2002, pp. 49-50) but they could also force

New Zealand Productivity Commission Research Note 2017/01 7
officials to focus on the more observable, but less important, activities within their tasks. This
phenomenon is called “goal displacement” and occurs when rules or metrics themselves become what
organisational effort is directed at achieving, rather than fulfilling the purpose of the task. In other
words, efforts end up “hitting the target and missing the point” (Hughes, 2012, p. 65; Bevan & Hood,
2006, p. 421). Goal displacement could have significantly negative impacts on task effectiveness, which
could in turn have serious consequences for the social sector.
A second problem reflects the complexity of co-production. Because the outcomes of coping tasks
tend to be “multiple, conflicting and vague”, the scope for co-production is very broad (Gregory,
1995a, pp. 173, 175). A number of interactions with individual actors and organisations could contribute
to the wellbeing outcomes of a vulnerable child that has interacted with MSD. Such actors could
include police, healthcare professionals, teachers, family and the wider community (ibid, 175).
Furthermore, with ambiguous outcomes that are difficult to observe, there can be no clear link between
the production technologies of MSD and wellbeing outcomes (ibid, p. 174).
It is possible that the greater availability and use of data may present opportunities for measurement of
these tasks by capturing outcomes more accurately than was previously achievable. This could
potentially shift coping tasks to being craft ones. Both ‘big-data’ and ‘micro-data’ appear important in
this respect. ‘Big data’ refers to collections of data so large, diverse and dynamic that they cannot be
handled by conventional data processing technology (for example, Facebook data on users) (Klievink,
Romijn, & de Bruijn, 2016, pp. 1-2). ‘Micro-data’, on the other hand, are data about specific people,
households or businesses (Statistics New Zealand, 2017).
The Integrated Data Infrastructure (IDI) is one example of a micro-data set that could allow for more
accurate learning on the outcomes of coping tasks like social work. The IDI is a large research database
containing microdata about people and households. Data is from a range of government agencies,
Statistics NZ surveys including the Census, and non-government organisations. The IDI allows
connections to be made between certain information drawn from these different sources, increasing
the ability of researchers to identify patterns and outcomes (Statistics New Zealand, 2016). For example,
the IDI could help to identify the health and educational outcomes of children who have engaged with
MSD Care and Protection Services.
However, while the growing power of data is promising, challenges remain in clearly linking particular
interventions to key results when the scope of co-production is as wide-ranging as in the case of social
work. Nonetheless, useful performance metrics for these tasks remain important (and, indeed, have
been the subject of much activity over many years). Consequently, there is room for thinking of
innovative proxies and rules of thumb to capture performance for these more difficult to measure tasks.
To give one example, in the UK an apprentice programme training chefs from disadvantaged
backgrounds is run in a number of Jamie Oliver-associated restaurants (Fifteen). Assessing the
performance of these restaurants requires both upper and lower thresholds for intermediate outcomes
like drop-out rates. As one development chef has noted: “Suppose everyone graduates: did we screw
up on recruitment? Did we really choose the people who needed us most? Or did we go easy ... On the
other hand, you need a core who you're pretty sure are going to make it. You can't take just the hard
cases. So we walk a tightrope” (Henley, 2012). Considering this, some possible directions forward are
discussed below.
Where to from here?
As discussed above, limitations in the ability to attribute outcomes to specific organisational efforts
present a real challenge for standard productivity measurement in the social sector. The risk of using an
unhelpful measure for an important service is something that cannot be overlooked. But, on the other
hand, the importance of these tasks means it is worth considering the gains that could come from
measuring and improving their productivity in an appropriate way. So what does this mean going
forward?
The issues raised in this research note are not new. For many years now government has tried to shift
management metrics in the social sector to being outcomes focused (Destremau & Wilson, 2016, p. 33).

8 Social sector productivity: a task perspective
Of course, the issues identified around observability and attribution of such outcomes (see, for
example, Ryan in Gill, 2011, pp. 447-469) make it difficult (but not impossible) to do so in a meaningful
way (NZPC, 2015, p. 314). Further, there is already measurement taking place in the sector so we are not
starting with a blank slate. This includes measurement targeting coping tasks (see MSD Annual Report
2015/ 2016). One strategy is to use intermediate outcomes as proxies for ultimate outcomes, which
makes performance measurement possible (although perhaps not perfect) and can be an improvement
from measures such as those based on inputs (Gemmell, Nolan, & Scobie, 2017, p. 18). Higher-level
outputs can also be used for coping tasks as a way of gauging an overview of performance (Laking,
2011, pp. 200-201). Consequently, coping tasks are not completely immeasurable. But, the issue
remains that there is a level of depth to measurement that cannot be captured due to their complexity,
and attempts to capture this complexity, such as attempts to define the daily work of social workers,
can risk leading to meaningless measures and goal displacement.
Further, some standard measures which assess performance within organisational silos are
fundamentally incompatible with coping tasks. However, work is well underway in approaching
performance measurement of these tasks differently. The social investment approach is influencing
thinking in this area. This approach uses big data and actuarial calculations to develop better evidence
and insights about where to target interventions (or invest). This includes a longer-term picture of the
potential impact of such interventions (Kibblewhite, 2016, p. 6). A key part of the social investment
approach is doing away with thinking about individual organisational contributions to outcomes.
Instead, the focus is on holistic outcomes at the level of the individual client.
Some concerns have been raised around the current approach that is being taken to social investment
in New Zealand, particularly the investment approach being used in MSD. Some criticism has focused
on the narrow focus of the “future welfare liability” approach on monetary costs and benefits to the
government, rather than considering non-financial and private costs and benefits of social welfare as
would be required for a “full” investment approach (Rosenberg 2015, pp. 34-35; Chapple 2013, p. 62).
But this needs to be seen in the context of the measures the social investment approach replaced, and
while this approach may still be underdeveloped in how returns are measured, the potential for a more
mature method based on social investment principles remains attractive for the future of performance
management.
The establishment of the Social Investment Unit presents an opportunity for building knowledge and
expertise on social investment and developing a more comprehensive approach (Kibblewhite, 2016, p.
6). While their work has been especially useful in identifying which population groups may be at risk,
there may be opportunities for improved understanding of the contribution that particular interventions
and changes in the supply of services (eg, service innovation) make to improved outcomes (or
intermediate outcomes). Moreover, as many (final) outcomes will be extremely difficult (or costly) to
observe, there could be value in identifying useful proxies and rules of thumb that should go with them,
such as in the above case of the Jamie Oliver associated Fifteen restaurants.
Further, while much of the focus has been on coping tasks and the challenges they provide, the other
types of tasks – production, procedural and craft tasks – present clearer opportunities for productivity
measurement and learning that could provide many benefits to the social sector. As discussed,
increasing productivity provides a way of easing pressure on resources and building stronger public
services. A greater focus on productivity measures among these other tasks would be supportive of the
‘doing more with less’ approach of Better Public Services (Better Public Services Advisory Group, 2011,
p. 5).

New Zealand Productivity Commission Research Note 2017/01 9
References
Alford, J. (1993). Towards a new public management model: Beyond managerialism and its critics.
AJPA, 52 (2), 135-148.
Auckland District Council of Social Services. (2014). Sub 55: Submission on more effective social services
- NZ Productivity Commission issues paper October 2014 by the Auckland District Council of Social
Services. Wellington: New Zealand Productivity Commission.
Better Public Services Advisory Group. (2011). Better public services advisory group report. Wellington:
State Services Commission.
Bevan, G., & Hood, C. (2006). Have targets improved performance in the English NHS? BMJ; 332, 419-
422.
Chapple, S. (2013). Forward liability and welfare reform in New Zealand. Policy Quarterly Vol, 9, Issue 2,
56-62.
Coglianese, C. (2012). Measuring regulatory performance: Evaluating the impact of regulation and
regulatory policy. Expert paper No. 1, August 2012. Paris: OECD.
de Bruijn, H. (2002). Managing performance in the public sector. London: Routledge.
Destremau, K., & Wilson, P. (2016). Defining social investment, kiwi-style. NZIER public discussion
paper. Wellington: NZIER.
Gemmell, N., Nolan, P., & Scobie, G. (Forthcoming). Public sector productivity: A case study of the New
Zealand education sector. Wellington: New Zealand Productivity Commission.
Gill, D., & Frankel, S. (2014). Learning the way forward? The role of monitoring evaluation and review. In S. Frankel, & J. Yeabsley, Framing the commons: Cross-cutting issues in regulation (pp. 55-93).
Wellington: Victoria University Press.
Gill, D., & Schmidt, T. (2011). Organisational performance management: Concepts and themes. In D. Gill, The iron cage recreated: The performance management of state organisations in New Zealand
(pp. 9-37). Wellington: Institute of Policy Studies.
Gleisner, B., Llewellyn-Fowler, M., & McAlister, F. (2011). Working towards higher living standards for
New Zealanders. New Zealand treasury paper 11/02. Wellington: New Zealand Treasury.
Gregory, R. (1995a). The peculiar tasks of public management: Toward conceptual discrimination. Australian Journal of Public Administration vol. 54, no. 2, 171-183.
Gregory, R. (1995b). Accountability, responsibility and corruption: Managing the 'public production process'. In J. Boston, The state under contract (pp. 56-77). Wellington: Bridget Williams Books.
Gregory, R., & Lonti, Z. (2008). Chasing shadows? Performance measurement of policy advice in New Zealand government departments. Public Administration Vol. 86, No. 3, 837-856.
Hanushek, E. A., & Ettema, E. (2015). Defining productivity in education: Issues and illustrations.
Stanford, CA: Hoover Institution, Stanford University.
Health and Disability Network. (2014). Submission on More Effective Social Services issues paper.
Wellington: New Zealand Productivity Commission
Henley, J. (2012, April 9). Jamie Oliver's Fifteen: A winning recipe. Retrieved from The Guardian:
https://www.theguardian.com/society/2012/apr/09/jamie-oliver-fifteen-winning-recipeHenri, J.-F.
(2006). Organizational culture and performance measurement systems. Accounting, Organizations and
Society 31(1), 77-103.

10 Social sector productivity: a task perspective
Hughes, O. E. (2012). Public management and administration: An introduction, 4th ed. New York, NY:
Palgrave Macmillan.
Kibblewhite, A. (2016). Address to the GEN 2016 annual conference. The Policy Project (pp. 1-7).
Wellington: DPMC.
Klievink, B., Romijn, B.-J., & de Bruijn, H. (2016). Big data in the public sector: Uncertainties and
readiness. Information Systems Frontiers, 1-17.
Laking, R. (2008). New Zealand public management in action: A case study of organisational performance. International Public Management Review 9 (1), 76-93.
Laking, R. (2011). Case study - Child, Youth and Family: Drivers of the need for information. In D. Gill, The iron cage recreated: The performance management of state organisations in New Zealand (pp.
191-214). Wellington: Institute of Policy Studies.
Le Grand, J., Lipsey, D., & Enthoven, A. (2007). The other invisible hand: Delivering public services
through choice and competition. Princeton, NJ: Princeton University Press.
Lonti, Z., & Gregory, R. (2007). Accountability or countability? Performance measurement in the New Zealand public service, 1992-2002. The Australian Journal of Public Administration, vol. 66, no. 4, 468-
484.
McCambridge, J., Witton, J., & Elbourne, D. R. (2014). Systematic review of the Hawthorne effect: New concepts are needed to study research participation effects. Journal of Clinical Epidemiology 67, 267-
277.
Merton, R. K. (1968). Social theory and social structure, 3rd edn. New York, NY: Free Press.
MSD. (2009). Our role. Retrieved from Ministry of Social Development: https://www.msd.govt.nz/about-
msd-and-our-work/publications-resources/corporate/annual-report/2009-10/our-role.html
MSD. (2014). Delivering social services every day. Wellington: New Zealand Ministry of Social
Development.
MSD. (2015). Ministry of Social Development: Strategic intentions 2015-2019. Wellington: New Zealand
Ministry of Social Development.
MSD. (2016). Annual report 2015/2016. Wellington: Ministry of Social Development.
NGO Health and Disability Network. (2014). Sub 70: Submission on more effective social services issues
paper. Wellington: New Zealand Productivity Commission.
NZPC. (2015). More effective social services. Wellington: New Zealand Productivity Commission.
Presbyterian Support New Zealand. (2015). Sub 76: Submission from Presbyterian Support New
Zealand. Wellington: New Zealand Productivity Commission.
Rosenberg, B. (2015). The 'investment approach' is not an investment approach. Policy Quarterly, Vol.
11, no. 4, 34-41.
Ryan, B. (2011). Getting in the road: Why outcome-oriented performance monitoring is underdeveloped in New Zealand. In D. Gill, The iron cage recreated: The performance management of
state organisations in New Zealand (pp. 447-469). Wellington: Institute of Policy Studies.
Social Sector Forum. (2014). Briefing to the incoming Government. Wellington: Social Sector Forum.
SSC. (2016, October 31). Better public services. Retrieved from State Services Commission:
http://www.ssc.govt.nz/better-public-services

New Zealand Productivity Commission Research Note 2017/01 11
Statistics New Zealand. (2016, 26 July). Integrated data infrastructure. Retrieved from Statistics New
Zealand: http://www.stats.govt.nz/browse_for_stats/snapshots-of-nz/integrated-data-infrastructure.aspx
Statistics New Zealand. (2017). Access our microdata. Retrieved from Statistics New Zealand:
http://www.stats.govt.nz/tools_and_services/microdata-access.aspx
Van Dooren, W., Bouckaert, G. & Halligan, J. (2010). Performance Management in the Public Sector.
London: Routledge.
Whitcombe, J. (2009). Changes in structural design in the New Zealand social services sector. Social
Policy Journal of New Zealand: Issue 36, 183-193.
Wilson, J. Q. (1989). Bureaucracy: What government agencies do and why they do it. New York, NY:
Basic Books, Inc.
Work and Income. (2017). New Zealand Superannuation. Retrieved from Ministry of Social
Development: Work and Income: https://www.workandincome.govt.nz/products/a-z-benefits/nz-
superannuation.html#null