an introduction to marine controlled source...
TRANSCRIPT

An Introduction to Marine Controlled Source Electromagnetic Methodsfor Hydrocarbon Exploration
Note: title change
Steven Constable1∗ and Leonard J. Srnka2
1Scripps Institution of Oceanography, La Jolla, CA, USA, [email protected](∗corresponding author)
2ExxonMobil Upstream Research Company, [email protected]
DRAFT manuscript for submission toGeophysics
September 11, 2006
1

ABSTRACT
Early development of marine electromagnetic methods, dating back about 80 years, was driven largely
by defense/military applications, and use for these purposes continues to this day. Deepwaterfrequency
domain electric dipole-dipole controlled source electromagnetic (CSEM) methods arose from academic
studies of the oceanic lithosphere in the 1980’s, and although the hydrocarbon exploration industry was
aware of this work, the shallow water environments being explored at that time were not ideally suitable
for its use. Low oil prices and increasingly successful results from 3D seismic methods further discouraged
investment in costly alternative geophysical data streams. This changed in the late 1990’s, when both
Statoil and ExxonMobil began modeling studies and field trials of CSEM surveying in deep water (around
1,000 m or deeper), specifically for characterizing the resistivity of previously identified drilling targets.
Trials offshore Angola in 2000–2002 by both these companies showed that CSEM data can successfully
be used to evaluate reservoir resistivity for targets up to several thousand meters deep. Both companies
levered instrumentation and expertise from the academic community in order to makerapidswift progress.
Although industry is still to some extent catching up with academic expertise in CSEM methods,
The resulting rapid growth in the use of marine EM methods for exploration has created a de-
mand for trained personnel that is difficult to meet, but nevertheless at the time of writing marine
CSEM data is represent a n industrialcommercial commodity within the exploration business, with
acquisition services offered by three companies. The ability to determine the resistivity of deep drilling
targets from the seafloor may well make marine CSEM the most important geophysical technique to emerge
since 3D reflection seismology.
INTRODUCTION
Marine controlled-source electromagnetic (CSEM) surveying has been transformed recently from a rela-
tively obscure academic discipline to a promising new tool for remotely detecting and mapping offshore
hydrocarbon reservoirs. This transformation has been driven in large part by the technical and economic
challenges associated with exploration in the deepwater environment. For example, seismic hydrocarbon
indicators lack perfection, and deepwater exploration wells are sufficiently expensive that it makessense to
collect additional data sets if these add information which can provide new insights and significantly reduce
risk. Early indications are that marine CSEMdata may provide some risk reduction in this regard, and at the
time of writing, the industry isattempting toin the process ofassessing this apparently new technology.
It is fair to say that oil and gas companies and the national licensing entities hold vews on marine CSEM
2

varying from cautious observation, judicious use, through to enthusiastic embrace. In this paper we review
some of the history of the method and present some early examples of the technology in use.No attempt
is made here to review all CSEM technology for hydrocarbon applications, or to discuss onshore
applications which are receiving some renewed interest from industry. For this we refer the reader
to Strack (1992), Strack and Vozoff (1996), and Hobbs et al. (2006), and the references cited therein.
For a recent review of academic marine EM studies, see Baba (2005).
Figure 1 introduces the basic method we will discuss. A horizontal electric field transmitter is towed
close to the seafloor to maximize the energy that couples to seafloor rocks.Although other source con-
figurations have been used, such as vertical electric and horizontal magnetic dipoles (e.g. Edwards,
2005), the long horizontal electric bipole offers a number of practical and theoretical advantages,
and hence is the only source used currently in the industry.A series of seafloormulticomponent
electromagnetic receivers spaced at various ranges from the transmitter record thetime-varying source
signal over source-receiver ranges from zero up to several tens of kilometers, depending upon
source waveform period and the conductivity below the seafloor. Data processing, including time-
domain stacking (binning in time windows), Fourier transformation, and merging with navigation
and position, converts these recordings intoamplitude and phase of the transmitted signal as a func-
tion of source–receiver offset and frequency (which istypically between about 0.1 and 10 Hz). Since
the electromagnetic skin depth is almost always smaller in seawater than in sub-seafloor rocks, at suf-
ficient source–receiver offset the electric and magnetic fields measured by the receiver instruments have
propagated travelled almost entirely beneath the seafloor.This desired sensitivity to sub-seafloor ge-
ology can be significantly weaker in shallow water and at higher frequencies, where the air layer
exerts a proportionately stronger influence on the data. This so-called ‘airwave effect’ arises from
an unfavorable ratio of skin depths, where the source signal up through the water column and
then back down to the receivers is comparable or larger than the signal through the geology.
This phenomenon breaks down in shallow water and at low frequencies, where the air layer
exerts a significant, sometimes dominant, influence.Since they areEquipped with magnetic as well as
electric sensors, the receiverscan also recordrecover the natural sourcemagnetotelluric (MT) signals,
that arise from natural fluctuations in Earth’s magnetic field. The MT signalswhich can be viewed either
as a source of noise for CSEM or a useful technique for recovering geological structure.
3

Air (resistive)
Seawater (very conductive)
CSEM Transmitter
Seafloor (variable conductivity)
Magnetotelluric source fields
CRIP
PS IN
ST
ITUTION OF OCEANOGRA
PHY
UCSD
Electric and magnetic field recorders
Figure 1. Schematic representation of thehorizontal electric dipole–dipole marine CSEM method.
See text.An electromagnetic transmitter is towed close to the seafloor in order to maximize the
coupling of electric and magnetic fields with seafloor rocks. These fields are recorded by instruments
deployed on the seafloor at some distance from the transmitter. Seafloor instruments are also able to
record magnetotelluric fields that have propagated downwards through the seawater layer.
Motivation
In geophysics, electrical and electromagnetic (EM) methods are used to measure the electrical properties
of geological formations. At the low frequencies used in marine CSEM, the rock resistivity accounts
for almost all of the electromagnetic response. Since replacement of saline pore fluids by hydrocarbons
(gas, gas condensate, or oil) increases the resistivity of reservoir rocks, EM methods are clearly important
exploration tools, but until recently the main application of electrical methods in the oil and gas business has
been well logging. The MT method has been used on land since the 1950’s (Vozoff, 1972), and since the
1980’s in the marine environment (Key et al., 2006), to image geological structure as part of the exploration
process. The MT method is particularly useful for mapping geological features such as salt, volcanics, and
carbonates that present challenges to the seismic methods. However, because MT currents within the earth
are generated mostly in the horizontal plane, thin sub-horizontal resistive formations are almost invisible
to the MT method, and so the technique alone is not useful for hydrocarbon fluid detection. The dipole
transmitters used in marine CSEM, on the other hand, generate vertical electric fields that sense horizontal
resistors of sufficient size.
4

HISTORICAL CONTEXT
Beginnings
The use of electromagnetic methods in hydrocarbon exploration dates back to the beginning of the 20th
century (e.g. Rust, 1938), and on land continues to this day, mainly through MT surveys carried out to
provide structural constraints. Marine electrical methods started with DC resistivity surveys carried out
over water within only a few years of the method’s inception (Schlumberger et al., 1934). For DC methods
to have any great sensitivity, seafloor resistivity has to be less than seawater resistivity (which is 0.25 to
0.3Ωm, depending on salinity and temperature), and so the main application was prospecting for sulphide
ores. Early work carried out over 80 years ago off the Cornish coast is reviewed by Francis (1985), and
much more recently Francis (1977) carried out a Wenner survey in the same area of England. In the
context of current marine CSEM practice, it is interesting to note that this early surface-towed array had an
emission current of 2000 A provided by the generators of a minesweeper. Wynn (1988) developed a marine
induced-polarization system to explore for mineral sands. However, these are all shallow-water systems,
and the market for offshore mineral mining is small, so little commercial activity in marine DC methods has
developed.
Some of the earliest work on AC marine electromagnetic methods involves military applications, dating
back to early in the last century with work on submarine cables and ship guidance (Drysdale, 1924). The
use of electric and magnetic fields for vessel detection and characterization continues to the present time,
although given the nature of the applications publications are hard to find. The proceedings of the various
MARELEC conferences probably provide the best unclassified view of this field.
Academic development of CSEM
The deepwater marine CSEM method as used today for hydrocarbon exploration was developed by Charles
Cox of Scripps Institution of Oceanography in the late 1970’s (Cox, 1981), with the first experiment being
carried out on a mid-ocean ridge in the Pacific in 1979 (Spiess et al., 1980; Young and Cox, 1981).
Cox was already working on seafloor magnetotelluric equipment and methodologiesy (Cox et al., 1971),
and the original motivationfor his CSEM experiments was to study the shallow and resistive parts of
the oceanic lithosphere by replacing the relatively high frequency energy lost to magnetotelluric fields
with a deep-towed man-made transmitter. Early funding for instrument development came from the U.S.
Defense Advanced Research Projects Agency (DARPA), which was interested in the effect of the seafloor
5

on submarine communications. Support also came from the U.S. Office of Naval Research (ONR), which
wanted to learn more about the seafloor noise environment. Several early experiments (e.g. Webb and
Constable, 1986) involved combined deployments of a sensitive broadband pressure variometer (known as
the differential pressure gauge, or DPG; Cox et al., 1984) and sensitive electric field recorders (Webb et al.,
1985). With the funding agencies’ interest in the resistivity structure of ‘normal’ oceanic lithosphere, the
next few experiments moved away from the ridges to more representative crust (Cox et al., 1986; Constable
and Cox, 1996). The oceanic lithosphere proved to be remarkably resistive; the lower crust and upper mantle
approaches 105 Ωm, and the resistivity–thickness product of the lithosphere exceeds 109 Ωm2. Combined
with the high conductivity–thickness product of the oceans (104 S), the effect of such a resistive lithosphere
is to trap horizontal electric currents associated with MT fields or horizontal water flow in the ocean for very
large distances.
As useful as this information is about the normal seafloor, geological interest then (and now) is biased
towards areas of tectonic activity such as the mid-ocean ridges that provided the initial target for CSEM
studies. Martin Sinha and his group from the University of Cambridge started to develop a marine CSEM
system in the mid-1980’s (Sinha et al., 1990). Their equipment was based largely on the Scripps system,
but with one very important improvement: use of a neutrally buoyant transmitter antenna which allowed
the deeptowed transmitter to be ‘flown’ about 100 m above the seafloor. This was necessary for working
over the very rough terrain of the ridge axis, and proved to be desirable later in the hydrocarbon exploration
environment. First trials of the Cambridge system were carried out in 1987 and 1988. This was followed by
collaborative Cambridge/Scripps experiments on the East Pacific Rise (Evans et al., 1991), the Reykjanes
Ridge (MacGregor et al., 1998), and the Valu Fa Ridge (MacGregor et al., 2001). In mid-2000 the Cambridge
group moved to Southampton University.
Although the deepwater frequency-domain horizontal electric dipole-dipole system appears to be the most
appropriate tool for exploration, other marine CSEM techniques have been tested, notably by Nigel Edwards’
University of Toronto group. Cheesman et al. (1988) deployed a horizontal magnetic dipole-dipole time
domain system, and Edwards et al. (1985) tested a variation of his land magnetometric resistivity technique
in the ocean, utilizing a vertical low frequency electric transmitter that hangs from the ship to the seafloor.
Both these techniques are being currently used forrelatively shallow geophysical surveys (e.g. Evans et
al., 2000; Evans and Webb, 2002), although neither method propagates deeply enough to be useful
for hydrocarbon detection. Yuan and Edwards (2000) developed a short-offset time domain electric
dipole-dipole system for gas hydrate characterization.
6

Collection of data sets cannot proceed far without supporting theory and numerical modeling algorithms.
Early work depended on the asymptotic solutions of Kraichman (1970) and Bannister (1968; 1984). The first
widely available layered model solution for the frequency domain electric dipole method was published by
Chave and Cox (1982), and some discussion in the literature developed around the issue of quadrature versus
digital filtering for the solution of the Hankel transforms involved in the 1D calculations (Anderson, 1984).
One dimensional solutions for the time domain methods were produced by the Toronto group (Edwards
and Chave, 1986; Cheesman et al., 1987). Flosadottir and Constable (1996) implemented the fast Hankel
transform of Anderson (1989) along with the OCCAM inversion algorithm of Constable et al. (1987) into
the Chave and Cox algorithm to produce a rapid 1D inversion code. Numerical finite element solutions to
the 2D electric dipole problem were developed for the time domain by Everett and Edwards (1993) and for
the frequency domain by Unsworth et al. (1993). Unsworth and Oldenburg (1995) demonstrated a subspace
inversion method using the frequency domain code, but as far as we know this was never tested on real data.
The first 2D inversion of real data was published by MacGregor et al. (2001), who modified the Unsworth
forward code to handle experimental geometries and bathymetry and implemented the OCCAM inversion
algorithm.
Three dimensional analytic solutionshavedo not been developedexist for the general marine CSEM
case per se,although approximate solutions exist for simple shapes (disks and spheres) in a uniform
or layered background. but However, modern3D numerical algorithms are generally flexible enough
to include a water layer, and sometimes an air layer, as part of thestructuremodel, particularly if they
have been developed with borehole applications in mind where the source and receiver are both within the
conductive structure. One code that is in extensive use within the marine exploration community is the finite
difference algorithm of Newman and Alumbaugh (1995). Badea et al. (2001) describe a 3D finite element
algorithm.
Early industry involvement
ExxonMobil (then Exxon) was aware of work being carried out by Scripps and others, and investigated
the use of marine EM for exploration in the early 1980’s; a patent was issued in this regard (Srnka,
1986). Following a series of numerical and physical (graphite) model experiments, Exxon scoped a
field test using a naval minesweeper (like Francis) and both seafloor and towed electric sensors under
development at Scripps. Scripps held a meeting in April 1984 to generate support for the development
of exploration CSEM, which resulted in a small project being funded by Amoco, Arco, Elf, and Sohio.
7

(Current supporters of marine CSEM might note that none of these companies exist today.) The result of
this work is reported in Constable et al. (1986) and Chave et al. (1991). However, exploration water depths
at that time were around 300 m, and that, coupled with a lack of computational capability, limited digital
acquisition capacities, and the growing emphasis on 3D marine seismic technology, meant that this work
was far ahead of its time in terms of commercial viability.
This all changed in the late 1990’s. Exploration was by then being routinely carried out in water 1000 m
deep, and ExxonMobil resumed and Statoil started examining marine CSEM as a tool for hydrocarbon
exploration. One of us (SC) was invited to review Statoil’s internal research project in November 1999,
which consisted of a variety of numerical and analog modeling (featuring an innovative use of a water-bed
mattress!). The conclusion was that:
“... if the target is not too small compared with its depth of burial, and the water depth is
sufficient to suppress the air wave, then the controlled source signature of the oil-filled layer
is detectable, yielding controlled source amplitudes that are a factor of 2 to 10 different than
models without the oil layer. The signals are above the noise threshold, and the experimental
parameters (frequency, range, antenna length, and power) are practicable. ”
This was sufficient for Statoil to proceed with field trials offshore Angola in late 2000, described below.
Around the same time (research was underway in mid-1998), ExxonMobil was carrying out investigations
into the use of 3D EM methods for marine CSEM survey design, acquisition, data processing, inversion,
and interpretation. ExxonMobil’s field programs started in late 2001 with field trials off Scotland, followed
by West African tests shortly afterwards (examples are also shown below).
It is important to note that exploration’s move to deeper water had already driven interest in marine MT
as an exploration tool, which had led to the development of commercially viable CSEM/MT receiver
instrumentation. Although early attempts to use the MT method in the marine environment (Hoen and
Warner, 1960) foundered for reasons similar to the early CSEM attempts (shallow water, lack of digital
equipment, etc.), by the early 1990’s electromagnetic techniques were being considered as an aid to mapping
base of salt in the Gulf of Mexico (Hoversten and Unsworth, 1994). In April 1994 a prototype MT receiver
based on the Scripps CSEM receiver was deployed off southern California, and the results were sufficiently
encouraging to attract support from industry to develop the instrumentation (Constable et al., 1998) and
method (Hoversten et al., 1998). This early work consisted of a collaboration between Mike Hoversten
and Frank Morrison of U.C. Berkeley, Arnold Orange of AOA Geophysics, and Scripps. Field trials over
8

the Gulf of Mexico Gemini prospect between 1996 and 2003 resulted in systematic refinement of the
instrumentation and methodology (Hoversten et al., 2000; Key et al., 2006). Commercial surveys were
carried out by AOA using Scripps equipment incarbonate terranes of theMediterranean (1995 and 1996,
for Agip), sub-salt prospects in theGulf of Mexico (1998, for Agip and BP), andsub-basalt prospects in
the North Atlantic (2001, for Agip and Statoil).Martin Sinha’s LITHOS consortium at the University
of Cambridge examined the use of CSEM for sub-basalt prospecting (MacGregor and Sinha, 2000),
which also helped to raise the profile of marine EM methods within industry.
THE MARINE CSEM METHOD
The theory and practice of the marine CSEM method is fairly well documented. In addition to the references
cited in the Introduction, we refer the reader to Edwards (2005) and Constable and Weiss (2006). Here we
will just summarize the key elements. The frequency domain dipole-dipole electric configuration shown in
Figure 1 is the method of choice for various reasons:
a) An alternative to the frequency domain approach is the time domain method, which is well suited to
land exploration where the geological formations are on the conductive side of the air/earth system; the
direct wave in the atmosphere dissipates at the speed of light after transmitter turn-off to leave eddy currents
propagating more slowly in the ground. On the deep seafloor, the seabed is generally more resistive than
the seawater, and so information about the geology is embedded in the early time response, while the
(uninteresting) seawater response dominates late time. In the frequency domain, however, the longer skin
depths associated with seafloor rocks means that at sufficient source–receiver distance the field is dominated
by energy propagating through the geological formations. Energy propagating through the seawater has
essentially been absorbed and is absent from the signals. Furthermore, by concentrating all the transmitter
power into one frequency, larger signal to noise ratios can be achieved at larger source-receiver offsets.
The reader should bear in mind, however, that these are operational considerations, and that the physics
of both the time domain and frequency domain methods are the same. In principle, at least, a sufficiently
broadband frequency domain survey would be equivalent to a time domain survey.In practice, a square
wave, or other binary switched waveform, is easier to generate than a pure sinusoid for a frequency
domain survey, and a square wave has the additional advantage that the fundamental harmonic has
an amplitude of 4/π times the zero to peak current.
b) Electric fields are well suited to operation in seawater. Transmitter currents of 1,000 A or more can
9
be passed through seawater with simple electrode systems and reasonable power consumption (of order
100 kW), and easily towed through the seawater along its length. Receiver noise is very low, since cultural
and MT noise is highly (if not totally) attenuated in the CSEM frequency band. Magnetic field receivers can,
and are, employed, but motion of the sensors associated with water currents moving the receiver instrument
limits the noise floor. (On land, magnetic sensors are buried to avoid this, but can still be subjected to noise
associated with ground motion from trees, microseisms, traffic, etc.)
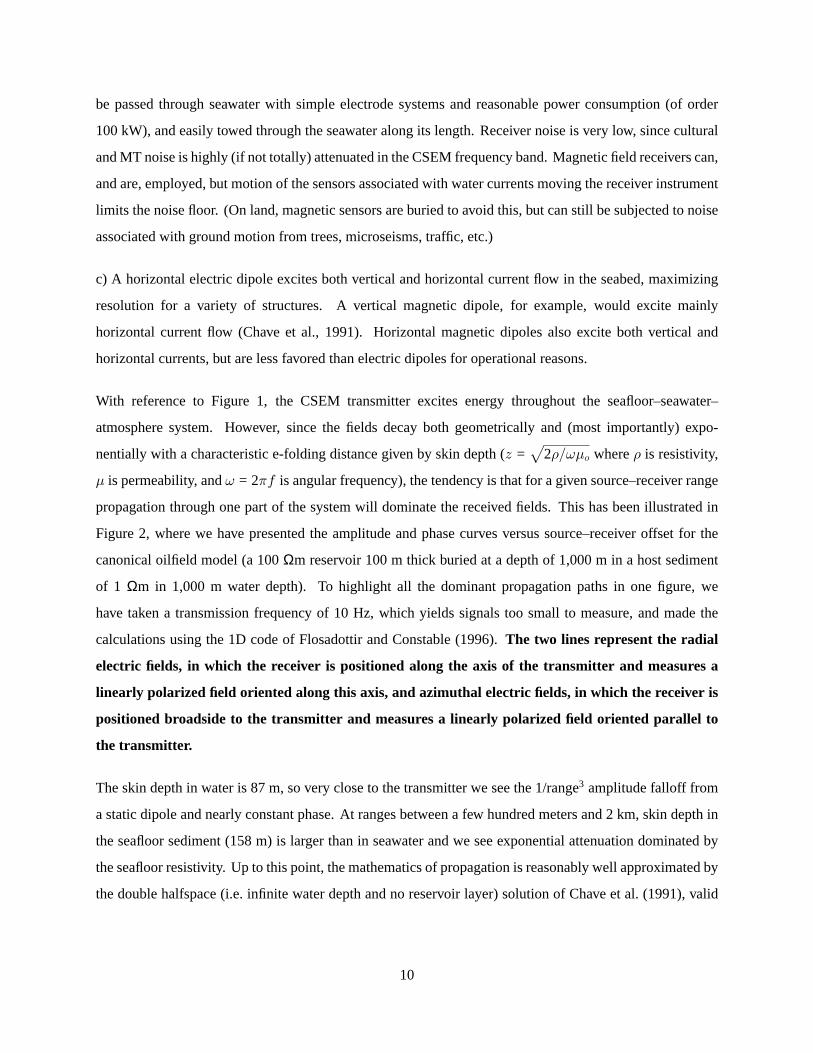
c) A horizontal electric dipole excites both vertical and horizontal current flow in the seabed, maximizing
resolution for a variety of structures. A vertical magnetic dipole, for example, would excite mainly
horizontal current flow (Chave et al., 1991). Horizontal magnetic dipoles also excite both vertical and
horizontal currents, but are less favored than electric dipoles for operational reasons.
With reference to Figure 1, the CSEM transmitter excites energy throughout the seafloor–seawater–
atmosphere system. However, since the fields decay both geometrically and (most importantly) expo-
nentially with a characteristic e-folding distance given by skin depth (z =√
2ρ/ωµo whereρ is resistivity,
µ is permeability, andω = 2πf is angular frequency), the tendency is that for a given source–receiver range
propagation through one part of the system will dominate the received fields. This has been illustrated in
Figure 2, where we have presented the amplitude and phase curves versus source–receiver offset for the
canonical oilfield model (a 100Ωm reservoir 100 m thick buried at a depth of 1,000 m in a host sediment
of 1 Ωm in 1,000 m water depth). To highlight all the dominant propagation paths in one figure, we
have taken a transmission frequency of 10 Hz, which yields signals too small to measure, and made the
calculations using the 1D code of Flosadottir and Constable (1996).The two lines represent the radial
electric fields, in which the receiver is positioned along the axis of the transmitter and measures a
linearly polarized field oriented along this axis, and azimuthal electric fields, in which the receiver is
positioned broadside to the transmitter and measures a linearly polarized field oriented parallel to
the transmitter.
The skin depth in water is 87 m, so very close to the transmitter we see the 1/range3 amplitude falloff from
a static dipole and nearly constant phase. At ranges between a few hundred meters and 2 km, skin depth in
the seafloor sediment (158 m) is larger than in seawater and we see exponential attenuation dominated by
the seafloor resistivity. Up to this point, the mathematics of propagation is reasonably well approximated by
the double halfspace (i.e. infinite water depth and no reservoir layer) solution of Chave et al. (1991), valid
10

102 103 104 105-1500
-1000
-500
0
10Source-receiver range (m)
Dipole geometry
Resistive layer attenuation
1 Ωm halfspace attenuation
Air propagation
Dipole geometry
Resistive layer attenuation
1 Ωm halfspace attenuation
Air propagation1/range3
Source-receiver range (m)
A BE-
field
mag
nitu
de, (
V/(A
m2 ))
E-fie
ld p
hase
(deg
rees
)
2 103 104 10510-26
10-24
10-22
10-20
10-18
10-16
10-14
10-12
10-10
10-8
10-6
Figure 2. Radial (solid lines) and azimuthal (broken lines) amplitude and phase responses over the canonical
model for a frequency of 10 Hz and a transmitter altitude of 30 m.
for very resistive seafloor:
Eρ =Aρo
2πcos φ
[(γor + 1)
r3e−γor +
(γ2rr
2 + γrr + 1)r3
e−γrr
]
Eφ =Aρo
2πsin φ
[(γor + 1)
r3e−γor +
2(γrr + 1)r3
e−γrr
]
γo =√
iωµo/ρo γr =√
iωµo/ρr
(ρo andρr are seawater and seafloor resistivities respectively). HereEρ is the radial, or in-line, electric field
andEφ is the azimuthal, or broadside, electric field,r is source–receiver offset, andA is the source dipole
moment (transmitter current× antenna length). The dipole azimuth isφ, which would be 0 for the purely
radial mode shown in Figure 2 and 90 for the purely azimuthal mode. Theγ are complex wavenumbers,
related to 1/(skin depth). Ther3 dipole dependence is evident in these equations, along with terms associated
with exponential attenuation through the water (first term, inγo) and through the seafloor rocks (the second
term, inγr). It is clear from these equations that for any azimuthφ other than integer multiples of
90 both modes will be present, and because the phases are typically slightly different (see Figure 2B)
a polarization ellipse will be formed (i.e. the instantaneous horizontal electric field vector will sweep
out an ellipse during every cycle of the transmitter).
Referring again to Figure 2, at ranges between 2 km and 10 km we see increased electric field amplitudes,
11

relative to those that would be measured in the absence of a resistive layer,associated with a larger skin
depth (1600 m) in the more resistive reservoir layer. There is a corresponding increase in apparent phase
velocity. Finally, at ranges greater than 10 km, propagation through the atmosphere dominates the receiver
fields and the amplitude returns to a 1/r3 dipole attenuation, along with a phase that becomes constant (i.e.
the apparent phase velocity is now comparable to the speed of light).
Much has been made of the different behavior of the azimuthal and radial modes in the presence of a thin
resistor (e.g. Eidesmo et al., 2002; Constable and Weiss, 2006), whereby the azimuthal mode has a very
much smaller reservoir response than the radial mode. This is true only at relatively low frequencies where
the CSEM fields are dominated by the galvanic response of the reservoir (a charge buildup on the upper
and lower surfaces of the resistive layer) generated by the vertical electric fields of the radial mode (which
are largely absent in the azimuthal mode). Here, the frequency is high enough that inductive effects in the
reservoir layer produce a significant response in the azimuthal mode. The static vertical offset between the
radial and azimuthal modes is presumably associated with the galvanic contribution of the reservoir to the
radial mode fields.
Equipment
Transmitted electric fields are directly proportional to the source dipole momentA, in turn given by the
dipole length times the emission current.Data for interpretation are normalized by the dipole moment,
so the system noise floor gets lower asA gets larger, allowing larger source–receiver offsets to be
recorded and deeper structure detected.Dipole lengths are typically 100–300 m; significantly longer
and towing them close to the seafloor would become technologically challenging. Current practice is to
transmit high voltage AC (typically 400 Hz) current down a towing cable to a transmitter unit close to the
seafloor. Although purely AC transformed sources are in use, most systems transform the high voltage
to low voltage/high current, rectify this low voltage AC, and switch the resulting quasi-DC into a square
wave or other binary/ternary signal (e.g. Sinha et al., 1990; Constable and Cox, 1996). To estimate what
magnitude transmission currents can be achieved, we work back from the antenna electrodes. The resistance
to seawater is purely a function of seawater resistivityρ and geometry; for a long cylindrical electrode the
resistance per electrode is given by
R =ρo
2πL
[ln
(2L
a
)− 1
](equation 3.09 of Sunde, 1949) whereL is electrode length anda is diameter. For reasonable values ofL
anda, 0.1 Ω is easy to achieve, less than 0.01Ω is harder but possible. To utilize electrodes having the
12

lower resistance, antenna resistance must be kept comparably low, yielding wire diameters of order 2 cm.
It might thus be possible to construct an antenna with a total resistance of about 0.01Ω, but much smaller
would be very difficult. More likely, total antenna resistance will be between 0.1 and 1Ω. Thus with a total
power of 10 kW delivered to the antenna, output currents of up to 1,000 amps are possible. With 100 kW
delivered to the antenna, currents could be as large as 3,000 amps for the lowest impedance antenna. Thus,
bearing in mind that 100 kW corresponds to 1,000 V and 100 A at the bottom end of a deep-tow cable, it
appears that it will be hard to achieve significantly more than the 1,000 A transmission currents currently
being advertised by industry, with corresponding dipole moments up to 300 kAm.
Switching such large currents entails dealing with stored energy in the transmitter antenna. The self-
inductance of a long wire is given approximately by
Z = 0.2L[ln(4L
a)− 0.75] µH
(Rosa, 1908). A typical antenna would have an inductance of order 500 microHenries. Early attempts by
Charles Cox to build a transmitter failed because he ignored the effect of inductance, and the back EMF
during switching destroyed the equipment. Recognizing that voltage and current were out of phase in the
antenna, he solved this problem by detecting zero current crossings in the rectifier bridge and switching at
those times. In the current SIO transmitter, a capacitor bank absorbs the energy associated with the back
EMF during switching.
Most current seafloor receiver instruments appear to be built around the principles outlined in Webb et al.
(1985) and Constable et al. (1998), and although the modern instruments are likely to use 24 bit analog to
digital conversion instead of 16 bits, and solid state data storage instead of disk drives or tape recorders,
the 1 Hz noise floor of 0.1 to 1 nV/√
Hz is similar. Constable and Weiss (2006) discuss the contributions
to the total system noise, and with reference to Figure 2 the noise floor of current equipment is around
10−15 V/m/(Am) and unlikely to be better than 10−16 V/m/(Am) (i.e. not able to detect the reservoir layer in
this example).
EXAMPLES
The rapid commercialization of marine CSEM and the high cost of surveys has resulted in few, if any,
academically available data sets being available at this time, and most of the best quality data are proprietary.
However, we are able to present examples from the first two research cruises carried out by Statoil and
ExxonMobil.
13

V
10
5
15
20
25
30
35
50 10 15 20 21 22
tow A
approximate extent of reservoir
Distance East (km)
Dis
tanc
e N
orth
, (km
)
-6000 -4000 -2000 0 2000 4000 6000 N 10-15
10-14
10-13
10-12
10-11
10-10
Rad
ial E
lect
ric F
ield
, (V/
(Am
2 ))
Source-Receiver Offset (m)
Oil Reservoir
1D Reservoir response Halfspace response 2D Reservoir response2 min. stacked data
A B
Sediments 0.6 Ωm
1100 m
75 Ωm, 50 m thick
Figure 3. Survey layout (A) and radial mode horizontal electric field data (B) collectedduring tow A
on receiver ‘V’ during the first proof-of-concept marine CSEM survey overthe Girassol hydrocarbon
reservoir, offshore Angola (Ellingsrud et al., 2002; Bhuiyan and Johansen, in press). Water depth is
1,200 m, and the transmission frequency was 0.25 Hz. The 2D response of the reservoir was calculated
using the code of Li and Key (2007, this issue).The data follow the modeled response to a remarkable
degree, since a 2D model is a reasonable approximation to the geology along this survey line.
In Figure 3A, we showthe survey layout from
data from one instrument deployed towards the south edge of the reservoir during the first use of marine
CSEM for hydrocarbon mappingcarried out by Statoil, with support from Southampton University
and Scripps (Ellingsrud et al., 2002; Bhuiyan and Johansen, in press). The location isthe Girassol
reservoir, offshore Angola in about 1,000 m seawater;over a known oil reservoir of considerable extent.
The receivers (larger dots in Figure 3A) comprise a mixed fleet of LEMURs from Southampton University
(Sinha et al., 1990), ELFs from Scripps (Webb et al., 1985), and the Scripps broadband MT/CSEM instrument
of Constable et al. (1998). The transmitter was the DASI instrument of Southampton, operating at a dipole
moment of 16 kAm at frequencies of 0.25 and 1 Hz.
This experiment was ahuge success in that the data are clearly sensitive to the reservoir, and this alone
provided the support Statoil and other companies needed to move ahead with the technique. However,
the mixed fleet of receivers, along with the poor performance of the bolt-on super-short base line (SSBL)
navigation system and the modest sized transmitter, resulted in a data set of highly variable quality. Fur-
thermore, the sites in the northern part of the array, which were designed to provide off-target control,
where heavily influenced by a salt body in that location.Bhuiyan and Johansen (in press) provide more
14

details of the background geology in this area. In Figure 3B we present data from one of the more
modern Scripps instruments (‘Bandicoot’) which was positioned close enough to the edge of the reservoir
to show an on-target and off-target response.The amplitudes are somewhat scattered, probably as a
result of transmitter stability and navigational errors, but the noise floor for this instrument of around
10−14 V/Am2 is comparable to modern surveys. The data saturate at about 5×10⁻¹¹ V/Am2 because
of the high gain settings of the low-noise amplifier used in these instruments. Although this does not
compromise the reservoir response, which does not appear until larger source-receiver ranges have
been achieved, more modern surveys employ receivers with lower gains.
In order to compress the exponential falloff of electric field amplitude with source–receiver separation,
as well as highlight the larger amplitudes associated with target structure, it has become practice to
normalize the electric field amplitudes by a half-space response, as was done by Eidesmo et al. (2002),
or to normalize data by the response recorded by an instrument assumed to be off-target (e.g. Johansen
et al., 2005) (a technique that has some similarity to the shale baseline method in well-logging).As
can be seen from the 2D modeling, simple normalization of the data by the halfspace response, as was
done by Ellingsrud et al. (2002), over-estimates the extent of the reservoir since the elevated electric field
response persists indefinitely off the edge of the target.
ExxonMobil were independently planning their own field trials during the Statoil survey, and surveyed
three prospects offshore West Africa in early 2002 (Srnka et al., 2006). These surveys were carried out
in a very similar manner to the Statoil study, using the British research vesselRRS Charles Darwinand
the Southampton DASI transmitter. The receiver fleet, however, was now a uniform fleet of 30 modern
instruments provided by Scripps, three of which were full MT/CSEM receivers, and much more effort was
put into the navigation of the transmitter and receivers.
In Figure 4 we present an example from a known discovery, with data acquired in January 2002 during the
three offshore West Africa surveys. Saturated middle to lower Miocene oil sands are present 1,400 m to
2,500 m below the seafloor. A total of 29 receiver positions and 210 line-kilometers of data were collected
in water 1,000 m deep. The radial towing pattern maximizes the amount of in-line data collected, and has
advantages for data summation and 3D inversion (Srnka and Carrazone, 2003). The transmitter, again the
DASI system provided by Southampton, was towed 50 m above the seafloor at a speed of about 1.5 knots.
The maximum dipole moment was 15 kAm.
Figure 5 shows a section of the 3D resistivity model developed by iterative forward calculations guided by
15

Distance along line (km)
noise level
0 3 6 9Distance (km)
00
3
3
6
6
9
9
12 15 12 1510-15
10-14
10-13
10-12
10-11
10-10
Nor
mal
ized
fiel
d (V
/(Am
2))
BackgoundWith Reservoir2 min. Stacked Data
Inline E Field, 0.25 HzReceiver 21, Tow Line 2
BA
Salt
tow 2Well B
Well A
receiver 21
seismic O/Wcontact reservoir limits
Dis
tanc
e (k
m)
Figure 4. Marine CSEM data example over a discovered field. The survey layout is shown in ‘A’, and data
from receiver 21 for tow line 2 is shown in ‘B’, along with 3D forward model responses for the charged
reservoir (Figure 5) and uncharged reservoir models.The transmission frequency was 0.25 Hz and the
source dipole moment 15 kAm.
50 Ωm
70 Ωm
0.8 Ωm
0.6 Ωm
0.3 Ωm
0
0 3 6 9 12 15 18
1
2
3
Distance (km)
Dep
th (k
m)
Figure 5. Section through 3D resistivity model taken along tow line 2 shown in Figure 4. Background
resistivity is gradational from 0.6Ωm at the seafloor to 0.8Ωm at depth. The resistive layers in the
overburden sediments are 2–4Ωm. Receiver positions are shown as open circles at the seafloor.
3D seismic data, well log data from wells A and B, and the CSEM data collected on all instruments at all
frequencies transmitted by all tow lines. The reservoir units are the four deep, highly resistive (50–70Ωm),
dipping units. Figure 4B shows source-normalized inline horizontal electic field amplitude data acquired
on receiver 21 during survey tow line 2, for a frequency of 0.25 Hz (the source fundamental). The response
16

of the 3D forward model with all oil-filled reservoirs (solid line) and all brine-filled reservoirs (broken line)
are also shown, calculated using a variant of the 3D finite difference frequency domain code of Newman and
Alumbaugh (1995). It is clear that a charged reservoir model fits the data much better than a no-reservoir
model.
Brine Filled
Distance East (km)
noise level
00
3
6
9
12
15
3 6 9 12 15 Distance (km)0 3 6 9 12 15
10-15
10-14
10-13
10-12
10-11
10-10
Rad
ial E
lect
ric F
ield
, (V/
(Am
2 ))
Oligocene HC FilledMio + Olig HC Filled0.25 Hz Data
Rotated Inline E FieldReceiver 21, Tow Line 3Oligocene
Miocene
Salt
Salt
tow 3
well
receiver 21
A B
Dis
tanc
e N
orth
(km
)
Figure 6. Marine CSEM data collected over an active exploration prospect. Pre-drill CSEM data suggested
that the potential reservoir was brine-filled, which was confirmed by drilling.The transmission frequency
was 0.25 Hz and the source dipole moment 15 kAm.
Figure 6 shows a second 2002 survey also collected offshore West Africa prior to drilling an exploration
prospect in a salt withdrawal mini-basin. The survey parameters were similar to the previous example,
except that fewer receivers (23) and transmitter tows (182 line-km) were used, and the water depth was
deeper (1,900 m). Prospective lower Miocene and Oligocene sands were located 1,200 to 1,500 m below
the seafloor, with a seismic reflection signature that showed indications of hydrocarbons. In contrast to the
example shown in Figures 4 and 5, here the inline horizontal electric field data fit the 3D forward model
response for a brine-filled reservoir (Figure 6B). The predicted response for models of hydrocarbon filled
reservoirs are significantly larger than the observed data. The CSEM prediction was thus for a dry hole,
which was confirmed upon drilling. This was a success for the marine CSEM method, although less of a
success from an exploration perspective. Drilling showed that the sands were partially gas saturated, which
contributed to a seismic direct hydrocarbon indicator (DHI) interpretation.
Between then and the end of 2004, thirty-four additional surveys were carried out by ExxonMobil in a
variety of geological environments offshore West Africa, South America, and North America in water
depths between 100 m and 3,200 m. In order to evaluate the extent to which marine CSEM could be
17
applied to exploration problems, surveys were conducted with calibration from well control, over rank
exploration prospects, and in development and production settings. It was demonstrated that marine
CSEM data could be successfully acquired simultaneously with seismic surveys, drilling operations, and
hydrocarbon production. From the start, ExxonMobil developed a strong 3D modeling and inversion
capability, and prospect evaluation relied heavily on 3D model-based interpretation utilizing seismic depth
control and geological constraints. These results have confirmed that the method is useful for distinguishing
hydrocarbon reservoirs from wet sands, subject to the current limitations of the method. These limitations
include signal to noise ratio, target size, and geological structure (e.g. targets below salt are largely invisible
to the method as currently practiced). However, it has been shown that integrated interpretation of marine
CSEM data using iterative 3D forward modeling can be effective even in complex geological settings (Green
et al., 2005), and that 3D inversion can illuminate subtle resistivity effects that would otherwise be difficult
to interpret manually (Carazzone et al., 2005).
CONCLUSIONS AND A LOOK FORWARD
Marine CSEM may well become the most important geophysical technique to emerge since the advent of 3D
reflection seismology 25 years ago.Calibrations of the method over known reservoirs, using well data
comparisons and realistic 3D model simulations, demonstrate that the fundamental methodology is
sound. The high quality of marine CSEM data is a result of the low noise environment at the deep
seafloor, the high sensitivity and low system noise of seafloor receivers, and the large source strengths
now being used. The utility of the data for hydrocarbon applications stems from the good coupling of
the transmitted fields to geological structures, and the absence of a strongly attenuated direct source
signal through the seawater at large source-receiver separations.As might be expected, interpretation is
improved significantly when CSEM data are integrated with other geoscientific information such as seismic
reflection data, well logs, and geological syntheses. Although the non-uniqueness of geophysical inversion
and modeling, coupled with the fact that many geological formations can exhibit enhanced resistivity
(evaporites, volcanics, coals, carbonates, and fresh water sands, to name a few), presents potential pitfalls
to using the method, the fact that CSEM provides information that is independent from seismicdata and
intimately connected to the nature of the fluid component means that the method can make significant
contributions to exploration, and possibly field development and production. Although the spatial resolution
of EM methods is lower than for seismic methods, there is an intrinsic sensitivity to the depth of the target
and the resolution is significantly better than for potential field methods.
18

Theearly commercial development of marine CSEM leant heavily on the academic community for software,
instrumentation, and methodology, and has progressed very rapidly as a result.The balance of activity
has now moved heavily towards industry, and so one expects thatfurther progressis going to require
will come from the commercial sector.to make advances in its own right,This has clearly happened in
the areas of 3D modeling and inversion (Green et al., 2005; Carazzone et al., 2005). Another area
of improvement is the collection of useful phase (c.f. amplitude) data. The phase stability of the
acquisition systems used in early academic and industrial surveys were problematic, due primarily to
source and receiver timing issues, and so the use of the potentially very valuable information in the
frequency-dependent phase response has been limited. This situation applies to the data examples
shown in Figures 3, 4, and 6. These problems have been addressed in more recent instrument
systems, and now accurate absolute phase is recorded.For example Data quality as characterized by
signal-to-noise floor has improved byonly a little more than an order of magnitude, from the worst of the
academic data (a little more than 10−14 V/(Am2)) to the best of the current commercial data (a little less than
10−15 V/(Am2)), mainly througha brute-force increases in source dipole moment.On the other hand, the
only significant modification to the original marine CSEM method as proposed 25 years ago is the collection
of vertical electric field data(Srnka and Carazzone, 2003). The most likely near-term innovations are
the collection of a much broader frequency spectrum of data,along with moredeploying morenumerous
receiver instruments, and continuous collection of data in a reconnaissance survey mode.The successes
of deepwater CSEM have created a demand for shallow-water applications and a solution to the air
wave problem, which may well come about through the use of time domain methods, or at least a
broadening of the frequency spectrum.
Current efforts have focussed on screening previously identified prospects.OnceAs the methodshave been
are adopted by industry, and the equipmentmadebecomes morecommercially available, one can envisage
a variety of other applications. Time-lapse methods for reservoir monitoring during production (so-called
4D-EM) are an obvious application of the technology, possibly incorporating borehole transmitters or
receivers, and certainly improving the repeat survey method by installation of fixed infrastructure. Use of
higher frequencies and shorter offsets will allow resistivity structure in the shallow section to be studied,
useful for avoiding drilling hazards such as gas hydrates (e.g.Yuan and Edwards, 2000; Schwalenberg
et al., 2005;Weitemeyer et al., 2006). The seismic method has dominated exploration so effectively that
it is possible that the discovery of reservoirs is biased towards those with a seismic signature, and as we
gain confidence and expertise in marine CSEM methods we may be able to explore for hydrocarbons that
are visible only through their resistivity signature. Indeed, the optimists among us may imagine that marine
19

CSEM will play a critical role in providing the necessary supply of hydrocarbons for the world’s growing
economy, and thus help ease the eventual transition to other energy sources.
Acknowledgments
The authors thank the officers and crew of the R.R.S. Charles Darwin for their assistance with the cruises
described here, David Wright and Ian Florence of Kongsberg Simrad, colleagues Terje Eidesmo, Svein
Ellingsrud, Lucy MacGregor, Arnold Orange, and Martin Sinha, and the many students, postdocs, and
technicians who participated in these projects. S.C. would like to thank Kerry Key and Yuguo Li for running
the 2D model shown in Figure 3, and Statoil and the Scripps Seafloor Electromagnetic Methods Consortium
for support. L.J.S. would like to thank ExxonMobil management for their support and encouragement, the
R3M collaborative for their dedication, enthusiasm, and many contributions, and ExxonMobil Upstream
Research Company, ExxonMobil Exploration Company, Sonangol, and block co-venturers for permission
to publish results.The authors thank the editors and reviewers, whose comments helped improve this
contribution.
References
Anderson, W.L, 1984. Discussion of: Numerical integration of Hankel transforms by quadrature and
continued fraction expansion, by A.D. Chave (with reply by the author).Geophysics, 49, 1811–1813.
Anderson, W.L., 1989. A hybrid fast Hankel transform algorithm for electromagnetic modeling.Geophysics,
54, 263–266.
Badea, E.A., M.E. Everett, G.A. Newman, and O. Biro, 2001. Finite-element analysis of controlled-source
electromagnetic induction using Coulomb-gauged potentials.Geophysics, 66, 786–799.
Baba, K., 2005. Electrical structure in marine tectonic settings.Surv. Geophys., 26, 701—731, doi:
10.1007/s10712-005-1831-2.
Bannister, P.R., 1968. Electromagnetic fields within a stratified earth produced by a long horizontal line
source.Radio Science, 3, 387–390.
Bannister, P.R., 1984. New simplified formulas for ELF subsurface- to-subsurface propagation.I.E.E.E. J.
Ocean. Eng., OE-9, 154–163.
20

Carazzone, J.J., O.M. Burtz. K.E. Green, D A. Pavlov, and C. Xia, 2005. Three Dimensional Imaging of
Marine CSEM Data.SEG Technical Program Expanded Abstracts, 24, 575-578.
Chave, A.D., and C.S. Cox, 1982. Controlled electromagnetic sources for measuring electrical conductivity
beneath the oceans, 1, Forward problem and model study.J. Geophys. Res., 87, 5327–5338.
Chave, A.D., S.C. Constable, and R.N. Edwards, 1991. Electrical exploration methods for the seafloor. In
“Electromagnetic Methods in Applied Geophysics, Volume 2”, ed. M. Nabighian, Soc. Explor. Geophys.,
Tulsa., pp. 931–966.
Cheesman, S.J., R.N. Edwards, and A.D. Chave, 1987. On the theory of sea floor conductivity mapping
using transient EM systems.Geophysics, 52, 204–217.
Cheesman, S.J., R.N. Edwards, and L.K. Law, 1988. First results of a new short baseline sea floor transient
EM system.SEG Tech. Prog. Expanded Abs., 7, 259–261.
Constable, S.C., C.S. Cox, and A.D. Chave, 1986. Offshore electromagnetic surveying techniques.SEG
Tech. Prog. Expanded Abs., 5, 81–82.
Constable, S.C., Parker, R.L., and Constable, C.G., 1987. Occam’s Inversion: a practical algorithm for
generating smooth models from EM sounding data.Geophysics, 52, 289–300.
Constable, S., and C.S. Cox, 1996. Marine controlled source electromagnetic sounding 2. The PEGASUS
experiment.J. Geophys. Res., 101, 5519–5530.
Constable, S., A. Orange, G.M. Hoversten, and H.F. Morrison, 1998. Marine magnetotellurics for petroleum
exploration Part 1. A seafloor instrument system.Geophysics, 63, 816–825.
Constable, S., and C.J. Weiss, 2006. Mapping thin resistors and hydrocarbons with marine EM methods:
Insights from 1D modeling.Geophysics, 71, G43-G51.
Cox, C.S., 1981. On the electrical conductivity of the oceanic lithosphere.Phys. Earth Planet. Int., 25,
196–201.
Cox, C.S., J.H. Filloux, and J.C. Larsen, 1971. Electromagnetic studies of ocean currents and electrical
conductivity below the ocean floor. In “The Sea, Vol. 4 Part I”, ed. Maxwell (ed.), Wiley, pp. 637–693.
21

Cox, C., T. Deaton, and S. Webb, 1984. A deep-sea differential pressure gauge.J. Atm. Oceanic Tech., 1,
237–246.
Cox, C.S., S.C. Constable, A.D. Chave, and S.C. Webb, 1986. Controlled source electromagnetic sounding
of the oceanic lithosphere.Nature, 320, 52-54.
Drysdale, C.V., 1924. The distribution of the magnetic field and return current around a submarine cable
carrying alternating current– part I.Phil. Trans. Roy. Soc., A224, 95–140.
Edwards, N., 2005. Marine controlled source electromagnetics: Principles, methodologies, future commer-
cial applications.Surv. Geophys., 26, 675–700.
Edwards, R.N., L.K. Law, P.A. Wolfgram, D.C. Nobes, M.N. Bone, D.F. Trigg, and J.M. DeLaurier, 1985.
First results of the MOSES experiment: sea sediment conductivity and thickness determination, Bute
Inlet, British Columbia, by magnetometric offshore electrical sounding.Geophysics, 50, 153-160.
Edwards, R.N., and A.D. Chave, 1986. A transient dipole-dipole method for mapping the conductivity of
the seafloor.Geophysics, 51, 984–987.
Eidesmo, T., S. Ellingsrud, L.M. MacGregor, S. Constable, M.C. Sinha, S. Johanson, F.N. Kong, and H.
Westerdahl, 2002. Sea Bed Logging (SBL), a new method for remote and direct identification of
hydrocarbon filled layers in deepwater areas.First Break, 20, 144–152.
Ellingsrud, S., T. Eidesmo, S. Johansen, M.C. Sinha, L.M. MacGregor, and S. Constable, 2002. Remote
sensing of hydrocarbon layers by seabed logging (SBL): Results from a cruise offshore Angola.The
Leading Edge, 21, 972-982.
Evans, R.L., S.C. Constable, M.C. Sinha, and C.S. Cox, 1991. Upper crustal resistivity structure of the East
Pacific Rise near 13N. Geophys. Res. Lett., 18, 1917–1920.
Evans, R.L., L.K. Law, B. St. Louis, S. Cheesman, 2000. Buried paleo-channels on the New Jersey
continental margin: channel porosity structures from electromagnetic surveying.Marine Geology,
170, 381–394.
Evans, R.L., S.C. Webb, and the RIFT-UMC Team, 2002. Crustal resistivity structure at 9.5N on the East Pa-
cific Rise: Results of an electromagnetic survey.Geophys. Res. Lett., 29, 1082, 10.1029/2001GL014106.
22

Everett, M.E., and R.N. Edwards, 1993. Transient marine electromagnetics: the 2.5-D forward problem.
Geophys. J. Int., 113, 545–561.
Flosadottir, A.H., and S. Constable, 1996. Marine controlled source electromagnetic sounding 1. Modeling
and experimental design.J. Geophys. Res., 101, 5507–5517.
Francis, T.J.G., 1977.Electrical prospecting on the continental shelf. Rep. Inst. Geol. Sci. 77/4, Her
Majesty’s Printing Office, London.
Francis, T.J.G., 1985. Electrical methods in the exploration of seafloor mineral deposits. In “Marine
Minerals”, ed. Teleki, P.G., M.R. Dobson, J.R. Moore, and U. von Stackelberg, Dordecht, Netherlands,
pp. 413–420.
Green, K.E., O.M. Burtz, L.A. Wahrmund, T. Clee, I. Gallegos, C. Xia, G. Zelewski, A.A. Martinez, M.
Stiver, C.M. Rodriguez, and J. Zhang, 2005. .SEG Tech. Prog. Expanded Abs., 24, 572–574.
Hobbs, B.A., Li, G., Clarke, C., and Linfoot, J., 2006. Inversion of multi-transient (MTEM) data. Con-
tributed paper atEuropean Association of Geoscientists and Engineers Annual Meeting, Vienna.
Hoehn, G. L., and Warner, B.N., 1983. Magnetotelluric measurements in the Gulf of Mexico at 20 m ocean
depths. In “CRC Handbook of Geophysical Exploration at Sea”, ed. R.A. Geyer, CRC Press, Boca
Raton, pp. 397-416.
Hoversten, G.M., and M. Unsworth, 1994. Subsalt imaging via seaborne electromagnetics.Offshore
Technology Conference, 26, 231-240.
Hoversten, G.M., H.F. Morrison and S. Constable, 1998. Marine magnetotellurics for petroleum exploration
Part 2. Numerical analysis of subsalt resolution.Geophysics, 63, 826–840.
Hoversten, G.H., S. Constable, and H.F. Morrison, 2000. Marine magnetellurics for base salt mapping:
Gulf of Mexico field- test at the Gemini structure.Geophysics, 65, 1476–1488.
Johansen, S.E., Amundsen, H.E.F., Røsten,T., Ellingsrud, S., Eidesmo, T., and Bhuyian, A.H., 2005.
Subsurface hydrocarbons detected by electromagnetic sounding.First Break, 23, 31–36.
Key, K., S. Constable, and C.J. Weiss, 2006. Mapping 3D salt using the 2D marine magnetotelluric method:
Case study from Gemini Prospect, Gulf of Mexico.Geophysics, 71, B17-B27.
23

Kraichman, M.B., 1970.Handbook of Electromagnetic Propagation in Conducting Media. U.S. Govt. Prin.
Office, Washington, D.C.
MacGregor, L.M., S. Constable, and M.C. Sinha, 1998. The RAMESSES Experiment III: Controlled source
electromagnetic sounding of the Reykjanes Ridge at 5745’ N. Geophys. J. Int., 135, 773–789.
MacGregor, L., and Sinha, S., 2000. Use of marine controlled- source electromagnetic sounding for
sub-basalt exploration.Geophysics Prosp., 48, 1091–1106.
MacGregor, L., M. Sinha, and S. Constable, 2001. Electrical resistivity structure of the Valu Fa Ridge, Lau
Basin, from marine controlled-source electromagnetic sounding.Geophys. J. Int., 146, 217–236.
Newman, G.A., and D.L. Alumbaugh, 1995. Frequency-domain modelling of airborne electromagnetic
responses using staggered finite differences.Geophys. Prosp., 43, 1021–1042.
Rosa, E.B., 1908. The Self and Mutual Inductances of Linear Conductors.Bulletin of the Bureau of
Standards, 4, 301.
Rust, W.M., 1938. A historical review of electrical prospecting methods.Geophysics, 3, 1–6.
Schlumberger, C., M. Schlumberger, and E.G. Leonardon, 1934. Electrical exploration of water-covered
areas.Trans. Am. Inst. Mining Metall. Eng., 110, 122–134.
Schwalenberg, K., E. Willoughby, R. Mir, and R.N. Edwards, 2005. Marine gas hydrate electromagnetic
signatures in Cascadia and their correlation with seismic blank zones.First Break, 23, 57–63.
Sinha, M.C., P.D. Patel, M.J. Unsworth, T.R.E. Owen, and M.R.J. MacCormack, 1990. An active source
EM sounding system for marine use.Mar. Geophys. Res., 12, 59-68.
Spiess, F.N., Macdonald, K.C., Atwater, T., Ballard, R., Carranza, A., Cordoba, D., Cox, C., Diaz Garcia,
V.M., Francheteau, J., Guerrero, J., Hawkings, J., Haymon, R., Hessler, R., Juteau, T., Kastner, M.,
Larson, R., Luyendyk, B., Macdougall, J.D., Miller, S., Normark, W., Orcutt, J., and Rangin, C., 1980.
East Pacific Rise: hot springs and geophysical experiments.Science, 207, 1421–1433.
Srnka, L.J., 1986.Method and apparatus for offshore electromagnetic sounding utilizing wavelength effects
to determine optimum source and detector positions. US patent 4,617,518.
24

Srnka, L.J., and J.J. Carazzone, 2003.Method of imaging subsurface formations using a virtual array. US
patent office 2003/050759A1.
Srnka, L.J., J.J. Carazzone, E.A. Eriksen, and M.S. Ephron, 2006. Remote reservoir resistivity mapping.
The Leading Edge, 25, 972–975.
Strack. K.-M, 1992.Exploration with Deep Transient Electromagnetics. Elsevier, Amsterdam.
Strack, K.-M., and K. Vozoff, 1996. Integrating long-offset transient electromagnetics (LOTEM) with
seismics in an exploration environment.Geophys. Prosp., 44, 997–1017.
Sunde, E.D., 1949.Earth Conduction Effects in Transmission Systems. D. Van Nostrand, New York.
Unsworth, M.J., B.J. Travis, and A.D. Chave, 1993. Electromagnetic induction by a finite electric dipole
source over a 2-D earth.Geophysics, 58, 198-214.
Unsworth, M., and D. Oldenburg, 1995. Subspace inversion of electromagnetic data: application to mid-
ocean-ridge exploration.Geophys. J. Int., 123, 161–168.
Vozoff, K., 1972. The magnetotelluric method in the exploration of sedimentary basins.Geophysics, 37,
98–141.
Webb, S.C., and S.C. Constable, 1986. Microseism propagation between two sites on the deep sea floor.
Bull. Seis. Soc. Am., 76, 1433-1445.
Webb, S.C., S.C. Constable, C.S. Cox, and T.K. Deaton, 1985. A seafloor electric field instrument.Geomag.
Geoelectr., 37, 1115-1129.
Weitemeyer, K.A., S.C. Constable, K.W. Key, and J.P. Behrens, 2006. First results from a marine controlled-
source electromagnetic survey to detect gas hydrates offshore Oregon.Geophys. Res. Lett., 33, L03304,
doi:10.1029/2005GL024896.
Wynn, J.C., 1988. Titanium geophysics: the application of induced polarization to seafloor mineral
exploration.Geophysics, 53, 386–401.
Young, P.D., and C.S. Cox, 1981. Electromagnetic active source sounding near the East Pacific Rise.
Geophys. Res. Lett., 8, 1043–1046.
25

Yuan, J., and R.N. Edwards, 2000. The assessment of marine gas hydrates through electronic remote
sounding: Hydrate without a BSR?.Geophys. Res. Lett., 27, 2397–2400.
26