an investigation into ways of improving the …
TRANSCRIPT
1
AN INVESTIGATION INTO WAYS OF IMPROVING THE EFFECTIVENESS OF ACCESS-LEVEL MATHEMATICS COURSES AT THE UNIVERSITY OF SOUTH
AFRICA (UNISA)
CHAPTER 1
BACKGROUND AND CONTEXT
1.1 Introduction
For many years, nationally and internationally, different initiatives have been directed at
overcoming the perceived need to increase access to mathematics at tertiary level. This need has
arisen from the recognition of the importance of mathematics, and from the gap between what has
been learnt at secondary level and what is required at tertiary level. Different attempts to
investigate and address these issues have resulted in a vast array of educational offerings,
variously described as stand-alone bridging courses, access and foundation programmes,
extended curricula, and so on. The context in which a course or programme is situated, and the
purposes for which it is designed, often determine what it is called. The focus on increased access
to mathematics is necessary because of the political and socio-economic factors that have
inhibited the development of environments in which the study of mathematics could flourish.
In this thesis, the design and evolution of a distance education mathematics access course
(module1) is described and evaluated. The study consists of two phases. In the first phase several
practitioner-based activities were undertaken, during which a number of relevant aspects were
researched without any systematic reflection taking place. These aspects led directly to the design
of a particular mathematics module, showing why and how the module was developed. This
background information is necessary to understand what follows. In the second phase, two
parallel sets of action research cycles were implemented in order to examine the effects of two
sets of interventions on student pass rate in the module. One intervention was aimed at improving
students’ reading skills; the other intervention involved using an alternative form of assessment.
1 At UNISA subjects may be taken as courses or modules. A module is ‘less’ than a course, in terms of scope and credit, and may be taken over a semester, in certain faculties, or over the full academic year. In the College of Science, Engineering and Technology (CSET) (formerly the Science Faculty), which includes the Department of Mathematical Sciences (formerly the Department of Mathematics, Applied Mathematics and Astronomy), all modules extend over the academic year, with registration taking place by the end of February or early in March, and examinations being written from late October. Supplementary examinations for year modules are conducted in the January of the following year.
2
Chapter 1 introduces the topic of the thesis. It provides a rationale for the development and
introduction of an access mathematics module at the University of South Africa (UNISA). This
chapter deals with the importance of mathematics, in general and in South Africa. It then focuses
on access to mathematics, from an international and then a South African perspective. In the
South African context it is necessary to consider the political factors that have affected
participation in mathematics, in particular the impact of the political history on socio-economic
circumstances, schooling and assessment, and teaching and learning, especially with regard to
mathematics. Tertiary education’s response to the problem is then discussed, again from an
international as well as a South African perspective. In the South African context the response
arose from two considerations, namely redress and massification. An overview of the access
initiatives available in South Africa during the 1990s is then provided.
The possible role of distance learning is considered. The concept of open and distance learning is
discussed, taking into account the opportunities and constraints of distance learning, and the
differences between distance learning programmes in developed and in developing countries. The
chapter then focuses on the nature of UNISA, and its role in providing access to mathematics.
The chapter concludes by considering some of the similarities and differences between the
different institutions’ approaches to providing access to mathematics.
1.2 The importance of mathematics
1.2.1 The importance of mathematics in general
Access to mathematics would not be an issue if mathematics itself were not a fundamentally
important discipline. Galileo (1564 – 1642) wrote ‘This grand book, the universe … cannot be
understood unless one first learns to comprehend the language and read the letters in which it is
composed. It is written in the language of mathematics’ (Butterworth, 1999, p.1). Two centuries
later Napoleon Bonaparte (1769 – 1821) stated ‘The advancement and perfection of mathematics
are ultimately connected with the prosperity of the state’ (Butterworth, 1999, p. 319).
Five centuries later mathematics is still globally recognised as a subject of extreme value and
importance for many different reasons. In the United States of America (USA), Steen (1987)
stated that ‘The well-being of our nation depends on the ability of our youth to succeed with
mathematics’ (p. xviii). Apart from its logic and aesthetic value, most areas of mathematics are
important for society and for the individual: it was estimated that in the USA ‘starting salaries go
up $2 000 per year for every mathematics course taken after the ninth grade’ (Tobias, 1994,
3
p. 34). Studying mathematics has scientific and technological implications, which relate to
economic growth. Additional research in the USA stresses that the lack of access to quality
mathematical education inhibits individual potential and economic opportunity (Tate &
Rousseau, 2002). Mathematics is always a prerequisite for the study of subjects such as
chemistry, computer science and physics, and these in turn are the building blocks for all science,
engineering and technology (SET) careers. The high economic growth of many countries such as
Taiwan, Korea, Singapore, Malaysia and the Philippines may be attributed to export-led
manufacturing, much of it in ‘high value-added, knowledge-intensive products that have a high
SET content’ (Lewin, 1997, p.158). Furthermore, universities have been challenged to ‘contribute
more towards national reconstruction and redress programmes by producing, for example, more
scientists, engineers and accountants’ (Smith & Seegal, 1994, p. 53).
1.2.2 The importance of mathematics in South Africa
In South Africa as well the dependence of many careers on mathematics is recognised. The
Department of Education has stated that ‘South Africa’s economic survival depends largely on
training sufficient numbers of secondary pupils and post-secondary students in key subjects in the
sciences and technology’ (Delvare, 1995, p. 68). Mathematics is one such key subject. For South
Africa to be part of the global economy, the study of mathematics is important, as much for the
side effects it produces (transferable skills, problem-solving strategies and analytical abilities) as
for its specific academic value (Lewin, 1997). It has been noted that ‘As the twenty-first century
approaches, the demand for mathematical, scientific and technological understanding and
expertise is greater than ever before’ (Howie, 1997, p. 4).
In 1995 the Department of Education published the first White Paper on Education and Training,
an important policy document that provided a framework for a new system of education. This
paper highlighted, for the first time, the importance of mathematics and science for all South
African learners (Howie, 2001). In the Foreword to the Human Sciences Research Council
(HSRC) Report on the repeat of the Third International Mathematics and Science Study (TIMSS-
R) in 1999, Nkomo (Executive Director of the Group: Education and Training) commented that
‘Proficiency in mathematics and science are important ingredients of individual and societal
viability in the context of what is now characterised as the information age’ (Howie, 2001, p. iii).
Michael Kahn, formerly Professor of Science Education at the University of Cape Town, and
subsequently executive director of the Knowledge Management Research Programme of the
Human Sciences Research Council (HSRC), has emphasised that mathematics serves as one of
4
the gateway subjects to higher education (Kahn, 2001). These ideas are echoed in many official
policy documents, for example
In an ever-changing society, it is essential that all learners … acquire a functioning
knowledge of the Mathematics that empowers them to make sense of society. …
[Mathematics] ensures access to … a variety of career paths (Department of Education,
2002, p.7).
1.3 Access to mathematics
1.3.1 The meaning of access
In Chapters 1 and 2 ‘access’ is used in a broad sense to denote various means that have been used
to facilitate entry into mainstream tertiary courses dependent on mathematics, primarily for those
who would not otherwise have been eligible for such courses. Later, from Chapter 3, the focus
moves more specifically to what ‘access’ means within the UNISA context.
1.3.2 Access to mathematics: an international perspective
Universities need to address access to mathematics for two reasons: firstly, students emerging
from secondary education are often unsuccessful in tertiary mathematics courses; secondly, many
students who may have the potential to be successful have previously been denied access to
mathematics for social, cultural or other reasons, and are thus not eligible to study mathematics at
tertiary level.
Apart from concerns about success, it is also true that unrestricted access to the study of
mathematics has not been the norm. Political and social factors have played a role in limiting
access to mathematics for certain population groups. In 1997 it was noted in the USA that one of
the primary challenges facing educators was the need to overcome a history of limited
mathematics opportunity for certain populations and create an environment in which mathematics
education for these groups could take place (Shade, 1997, in Malloy, 2002). Research in the USA
suggests that much of the difference in mathematics achievement with respect to various racial
and socio-economic groups can be related to the quality and number of mathematics courses that
African American, white American and Hispanic2 students complete during secondary school
(Tate & Rousseau, 2002). Those students for whom previous access to mathematics has been
limited, for whatever reason, have limited chances of success in mainstream mathematics courses.
In such cases ‘… an intellectual, coherent, focused approach to mathematics education, 2 Race descriptor used as in original text.
5
addressing content, teaching practices, and assessment is needed to ensure our students’ success’
(Price, 1997, p. 457). There is consensus that mathematics is important; simultaneously there is
international concern that fewer learners emerging from school are successful in their studies
when they reach university. (See for example Anthony, 2000; Appleby & Cox, 2002.)
Internationally, the Third International Mathematics and Science Study (TIMSS) in 1996
indicated that many learners were not being afforded a mathematical education that would serve
them in the future (Malloy, 2002). It thus seems highly likely that large numbers of students
entering mathematics courses at tertiary level may not be sufficiently equipped to undertake such
studies, and will need additional assistance.
The gap that needs to be bridged between secondary and tertiary level may arise from the
discontinuity between school and university, with many educators in each sector appearing to
have little awareness of where the learners are, or should be, when they have completed
secondary education. Ideally schools should adequately prepare all interested learners for future
study in the sciences, for which acceptable levels of mathematical knowledge and skill are
required. However, this is not generally the case. The extent of poor performance in mathematics
has stimulated reform in all aspects of mathematics education, curriculum, pedagogy and
assessment (Greenes, 1995). It has also led to the provision, in a large number of institutions
worldwide, of preparatory or introductory courses in mathematics. In 1996 Hillel (see Hillel,
1996, in Mamona-Downs & Downs, 2002) noted that
The problem of the mathematical preparation of incoming students, their different socio-
cultural background, age, and expectations is evidently a worldwide phenomenon. The
traditional image of a mathematics student as well prepared, selected, and highly
motivated simply doesn’t fit present-day realities. Consequently, mathematics
departments find themselves with a new set of challenges (p. 166).
1.3.3 Access to mathematics in South Africa
We now turn to the particular South African context in which access to mathematics became a
compelling issue. Access to mathematics was related to educational provision, which was
significantly affected by the political environment.
6
Political factors affecting participation in mathematics
The South African education environment has been complicated by the country’s political
history. Race and politics thus need to be taken into account in any attempt at understanding the
context of access to mathematics in South Africa. Information has been obtained from a variety of
different sources, and for the sake of convenience the race descriptors used are the ones given in
these sources. They are (in alphabetical order):
Africans denoting black South Africans
coloureds denoting South Africans of mixed race
Indians denoting South Africans of Indian descent
whites denoting white South Africans.
Collectively the Africans, coloureds and Indians were referred to as ‘non-whites’. The Africans
included members of various Southern African ethnic groups, such as the Xhosa or Ndebele
people. Each of these groups has its own language and unique cultural heritage. The past
government policies of ‘separate development’, known as apartheid3, created great divisions
within the country, and resulted in South Africa’s exclusion from the international community for
some time.
In 1990 Nelson Mandela was released from prison after considerable internal political unrest and
external pressure. In 1991 the then president of the country, President F. W. de Klerk, abolished
the apartheid laws, paving the way for the elections in 1994. A new constitution for the country
and a new School’s Act were adopted in 1996.
One of the most serious implications of the pre-1994 South African education policies was the
fact that during the apartheid era there was virtually ‘no encouragement for African students to
study mathematics and science’ (Howie, 1997, p. 56). Although issues of access to education are
relevant to many communities in many different countries, the South African political situation
before the first democratic elections in 1994 created an artificial situation in which such access
was regarded as a right for only one sector of the population (viz. the ‘whites’). We recall the
infamous remark made by Dr Verwoerd, the Prime Minister of the country in the 1960s, that
Africans ‘should not aspire to be anything more than drawers of water and hewers of wood’
(EduSource4, 1997, p. 45). As a result, mathematics and science education for Africans (and
3 ‘Apartheid’ is an Afrikaans word meaning ‘separateness’. 4 The full title of this report, sponsored by the Danish International Development Agency and published by EduSource, appears in the reference section. It will however be referred to as the EduSource Report, the name by which it is commonly known.
7
members of all other ‘non-white’ population groups) received little attention. There was
consequently poor participation of Africans in these subjects, and the number of secondary school
learners taking and continuing with mathematics was low.
Lack of access to mathematics, science and technology has been cited as one of the reasons for
South Africa’s poor economic performance and poor productivity. The low participation by
African, coloured and Indian students in mathematics and science was a matter of increasing
concern. In 1995 it was noted that South Africa produced fifteen times fewer graduate engineers
per million of the total population than Japan, and six times fewer engineers than Australia, where
the population was approximately half that of South Africa (Delvare, 1995).
The impact of the political background on socio-economic factors
Socio-economic circumstances support the teaching and learning environment. Adverse
circumstances have an immediate impact on the domestic budget, which must provide adequate
accommodation, study materials, transport, food and clothing. High levels of unemployment had
an adverse impact on the home environment (in 1995 approximately 37% of Africans were
unemployed5 (South Africa Survey, 1996/7)). For many South African learners, conditions in the
home environment in 1996 were such ‘that they can scarcely be imagined by first-world
researchers’ (Howie, 1997, p. 52). In the period 2000 to 2001 it was estimated that more than
50% of the population in several provinces was living in poverty: 70% in the Eastern Cape, about
62% in the Free State, just over 60% in the Northern Cape, 59% in the North West, 58% in
Mpumalanga, and about 54% in the Northern Province (see SA 2000-01).
The local infrastructure was also adversely affected, with uneven provision of facilities across
communities. Although the situation is improving, there are still students for whom access to
electricity cannot be taken for granted. In 1995 about 77% of urban households had access to
electricity, in contrast to 21% in rural areas (South Africa Survey 1996/7). By 2000 only 71,7%
of all households had access to electricity (GCIS, 2003). It was also estimated that there was a
total urban housing shortage of 1,92 million houses, with for example a shortfall of more than
700 000 in Gauteng, followed by a shortfall of nearly 400 000 in KwaZulu-Natal (KZN) (SA
2000-01).
5 ‘This figure refers to the “expanded” definition of unemployment: people of 15 years and older who are unemployed and have the desire to work, irrespective of whether or not they have taken active steps to find work’ (South Africa Survey, 1996/7, p. 358).
8
The impact of the political background on schooling and assessment
In South Africa, formal schooling begins with the primary school phase, which consists of seven
years (Grades6 1 to 7), and the secondary phase, which comprises Grades 8 to 12. The Grade 12
school-leaving examination in South Africa is referred to as the Senior Certificate. A student who
passes certain subjects at the right level is said to have matriculated; the examination thus also
became known as the matriculation examination (called ‘matric’ for short).
The first nine years of schooling are now compulsory (as from 1996; this was not always so,
except for whites), and the intention is that there should be provincial school-leaving
examinations at the end of Grade 9. After that subjects may be taken on Standard Grade (SG) or
Higher Grade (HG). These levels differ in the extent to which content and assessment focus more
on procedural or analytical issues, respectively, and also reflect the inclusion of additional, more
challenging content for HG. Results in the Grade 12 national school-leaving examination
determine whether learners pass with or without ‘exemption7’. School leavers with exemption
have passed the requisite combinations of subjects, at requisite grades, and are eligible to study at
a university, but not necessarily in all faculties. Although matriculation exemption technically
provides access to tertiary study, many universities, limited by physical constraints, set higher
requirements in order to select from the greater number of applications than can be
accommodated. In addition, universities set minimum requirements for certain disciplines, such
as medicine.
South Africa has eleven official languages, namely Afrikaans, English, Ndebele, Northern Sotho,
Southern Sotho, Swazi, Tsonga, Tswana, Venda, Xhosa and Zulu. Before 1994 there were only
two official languages, namely English and Afrikaans. The most widely spoken languages in
2000 were Zulu, Xhosa and Afrikaans (about 23%, 18% and 14%, respectively) (SA 2000-01).
All eleven languages have equal status, but from a practical point of view English is the lingua
franca of most business, technical and administrative transactions. English, the home language of
about 9% of the population in 2000 (SA 2000-01), is the only international language commonly
6 Grades 1 and 2 were in some cases referred to as Sub A and Sub B. Grades 3 to 12 used to be called Standards 1 to 10. 7 To obtain the senior certificate with exemption a student needs to pass at least five subjects, at least four of them on HG, with a 20% sub-minimum in the fifth subject. A pass on HG means obtaining a mark of at least 40%. A total of at least 950 marks must be obtained. Two of the subjects must be languages, one of which must be a language of instruction at tertiary level, i.e. English or Afrikaans. Each subject on HG can contribute 400 marks to the total, and each subject on SG can contribute 300 marks. (See for example Table B2 in the Umalusi Report (Umalusi Report, 2004))
9
used in South Africa. It has a well-developed mathematical vocabulary, with the capacity to
accommodate mathematical concepts at all levels. Afrikaans is derived from Dutch and as such
also has a well-developed mathematical vocabulary, although even for Afrikaans many terms are
similar to English terms (for example, the English logarithm becomes logaritme in Afrikaans).
The other nine indigenous languages do not yet have sufficient vocabulary for many
mathematical terms. Even if it were feasible to create a mathematical vocabulary for all the
indigenous languages, this would need to be introduced first at the secondary school level.
Learners whose mother tongue is not English usually study mathematics in the mother tongue for
the first three years of their schooling. For the rest of the primary school phase, at secondary
school and at university, mathematics is taught in English or Afrikaans.
The senior certificate examination has progressed through different phases in the country’s
political history (Umalusi Report, 2004). During the apartheid years it was administered by
racially and ethnically segregated departments of education: the Department of Education and
Training (DET) was responsible for African learners, the House of Delegates was responsible for
Indian learners, the House of Representatives was responsible for coloured learners; the House of
Assembly managed the educational affairs of white learners. The administration of education was
further complicated by the existence of several ‘independent homelands’8 whose governments
had a certain amount of autonomy to formulate their own education policies. Education in the
country was only unified under one body, the Department of Education, after 1994. By 1996
geographical restructuring had led to the formation of nine provinces out of the previous four
provinces, the independent homelands (four) and non-independent homelands (six). These
provinces then took responsibility for their own education, from 1996 to 2001, and designed and
administered their own senior certificate examinations. However, in an attempt to standardise the
quality of education, certain Grade 12 examinations were later (from 2001) nationally set and
administered (mathematics, physical science, biology, history, accountancy and English as a
second or additional language).
The impact of the political background on teaching and learning
Before the first democratic elections in 1994, education was divided along racial lines.
In the apartheid era legislation determined that schooling at opposite ends of the quality spectrum
was available for ‘whites’ (the minority population group, constituting approximately one eighth
8 For some years before the first democratic elections in 1994 certain regions in the country had been declared ‘homelands’ for different ethnic groups; several of these opted to become independent, others remained under the jurisdiction of the central government.
10
of the total) and ‘non-whites’ (the majority of the population: in 1993 there were roughly 30,7
million Africans, 3,4 million coloureds, one million Indians, and five million whites in South
Africa, giving a total population of 40,3 million) (Race Relations Survey, 1994). In spite of the
philosophy that apartheid constituted separate development, this was clearly a euphemism which
did not disguise the fact that while separate was a valid adjective, development could only take
place for one sector of the population. This is clearly illustrated in the education budget. For
example, in 1993 the ratio of per capita expenditure on white school children to per capita
expenditure on African school children falling under the department that had oversight for
African education was 2,5:1 (Delvare, 1995). Limited funding implied limited resources, from
which many other problems emerged. According to data supplied by the October Householder
Survey, an annual sample survey undertaken by the Central Statistical Service, in 1995 there were
approximately 2 856 000 people over the age of 20 who had no education (South Africa Survey,
1996/7). Of these, 92% were African, and 6% were coloured. Only roughly four million people
over the age of 20 had passed the matriculation examination, and only two million had any
further qualifications, out of the just over 22 million people over the age of 20.
With the advent of democracy inferior forms of schooling were no longer entrenched by law.
However, changing the laws made little immediate difference at the community level, and
providing learners with legitimate access to tertiary study could not easily resolve problems
related to previously limited participation, especially in the sciences, as past inequities in
schooling and a number of socio-economic factors militated against success at tertiary level. The
predicament of ‘disadvantaged’ learners has received greater attention in South Africa since
1994, when, for the first time, race was not a barrier to entering an educational institution. This
term ‘disadvantaged’ is normally used
to describe students whose schooling has been negatively affected by (mis)education or
other circumstances such as poor socio-economic and political conditions. Problems
often manifest themselves in communication …, cognitive …, and subject-specific
deficiencies (Mphalhele, 1994, p. 49).
By definition the term thus referred mostly to students from African, coloured and Indian
communities.
11
In 1996 a survey conducted by the Education Policy Unit at the University of the Witwatersrand
revealed a serious ‘collapse in the culture of learning and teaching’ in Gauteng9 schools (South
Africa Survey, 1996/7, p. 149). This was reflected to varying degrees in the other provinces as
well. The problem related mainly to schools other than the previous ‘Model C’10 schools. The
‘collapse’ was characterised by high rates of pupil and teacher absenteeism, poor motivation, a
lack of basic facilities and frequent incidents of violence (South Africa Survey, 1996/7).
The teaching and learning environment was characterised by a number of negative factors (see for
example Howie, 1997; EduSource, 1997; South Africa Survey, 1996/7) such as the disruption of
schooling by political action, inadequate general school environment, including physical
problems such as inadequate buildings, poor or non-existent libraries, laboratories and other
facilities, overcrowded classrooms11, and lack of textbooks, as well as systemic problems such as
inadequate support for teachers and weak school leadership.
The impact of the political background on mathematics
The dysfunctional education system particularly affected mathematics and science teaching. The
problems described above were compounded by low levels of professionalism amongst teachers,
a severe shortage of properly qualified mathematics teachers, and the employment of teachers
whose inadequate subject knowledge and poor motivation negatively affected the learning
process (EduSource, 1997). In the classroom, learning was also negatively affected by an
unsupportive peer environment and gender factors, where girls were discouraged in subtle (or less
subtle) ways from pursuing mathematics or science: in addition, girls were often expected to bear
the burden of household work, and had less time and energy for their studies (cf. Ngwema, 1996
in Howie, 1997). Problems also arose from the lack of congruence between the language of
instruction (English or Afrikaans) and the home language, and from curricular issues, such as
9 Gauteng is one of the country’s nine provinces, and the wealthiest per capita. During 1999 Gauteng residents accounted for just under 35% of the household expenditure of R492,1 billion, with the other provinces far behind: the next highest, KwaZulu-Natal, only accounted for approximately half that amount (SA, 2000-01). 10 Before 1994 racially segregated schools fell under different government departments. Schools generally reserved for white children fell under the relevant provincial Education Departments and were classified as Model C schools. In these schools governing bodies, elected by the parents, had a significant influence on school fees that could be charged (beyond the statutory minimum) and other policies. Economic factors thus led to the exclusion of some learners, although the schools were required by law to accommodate all learners in a school’s zone, regardless of whether or not fees were paid. 11 International findings in TIMSS suggest that the size of the class does not necessarily correlate inversely with performance in the achievement test (Howie, 1997). It would appear that other factors can play a role in minimising the potentially negative impact of large class size.
12
outdated, irrelevant and boring syllabi, a ‘chalk-and-talk’ approach to teaching, and inappropriate
assessment methods (EduSource, 1997).
Among the more serious factors that negatively affected mathematics teaching and learning were
a reliance on rote learning, poor qualifications of teachers (the former often a result of the latter),
and overcrowding. Over-crowding defeats interaction, dialogue, and the spirit of enquiry essential
to understanding mathematics. All learners require individual attention at some stage, but
individual attention is unlikely to take place in over-crowded classrooms. More than 68% of
mathematics classes in the seven provinces from which data were available12 had more than 40
learners per teacher (EduSource, 1997). In fact, the results in these seven provinces indicated that
in Standard 10 (Grade 12) mathematics classes class sizes varied from fewer than 21 learners (in
16% of the classes) to as many as 200 (in 4% of the cases investigated).
Qualified mathematics teachers were not available in sufficient numbers. Mathematics and
science teachers tended to be qualified as teachers (i.e. they had studied aspects of teaching
methodology and classroom practice) but in the EduSource study it was found that most teachers
had limited or no qualifications in the subject areas of mathematics and science (EduSource,
1997). At the time of the survey, across the seven provinces involved, 85% of teachers teaching
mathematics were qualified as teachers, but less than half had specialised in mathematics in their
training. It was however found that approximately a quarter of the qualified mathematics and
science teachers had a university degree. The EduSource Report indicates that mathematics
teachers were generally not well rated in terms of teaching practice, subject knowledge or
practical experience: ‘Mathematics and science teachers typically have low craft knowledge in
their subject, i.e. they do not score highly overall on pedagogic practice, subject mastery or
practical experience’ (p. 14). In addition, in the course of their training, ‘no attention is given to
the relevance of mathematics to the local community’ (p. 2), and it is thus not surprising that this
carried over into the classroom. Additional findings of the EduSource Report showed that limited
availability of mathematics teachers meant that mathematics was not offered in all secondary
schools in Standards 6 and 7 (Grades 8 and 9), and that fewer schools could provide teachers at
the Standard 10 (Grade 12) level than at the Standard 6 (Grade 8) level. Most mathematics
teachers at secondary level did not spend the majority of their time teaching mathematics, as they
were often assigned to teach other subjects.
12 The information is incomplete, as there was no teacher data for 304 schools and 15 318 learners enrolled in Standard 10 (Grade 12) mathematics.
13
In order to deal with the problem the EduSource Report estimated that for the three years
following the report a minimum of 4 000 additional mathematics teachers would be required per
year to improve teacher-pupil ratios and learner access, and to deal with teacher attrition. More
recently it was still evident that
… under qualified and unqualified teachers in Mathematics, Science and Technology
constitute both cause and effect in the current situation: poorly qualified educators result
in a low level of output, which in turn results in fewer competent trainee teachers entering
the system (Directory of Science, Engineering and Technology Programmes, 2001, p. 3).
It is clear that ‘Poorly trained teachers in poorly resourced schools produce poor students of
science and mathematics – a “cycle of mediocrity” indeed’ (NARSET13, 1997, p. 72).
In a report in S A Science and Technology Indicators, published by the (then) Foundation for
Research and Development (FRD) in 1996, it was stated that fewer than 20% of the African
students who matriculated studied mathematics or physical science; of those, about 20% passed
the subject on HG (South Africa Survey 1996/7).
In 1996 it was estimated that only 4 500 African students passed HG mathematics (NARSET,
1997). In the 1996 TIMSS South African learners performed worst, with a score of 354 for
Standard 5 (Grade 7) learners against the international mean of 484, and a score of 354 for
Standard 6 (Grade 8) learners, against the international mean of 513 (Howie, 1997). In 1997 the
EduSource Report14 stated that mathematics matriculation results were lower than the national
pass rates for other subjects, and that over the five-year period preceding 1997 the average
mathematics pass rate (for HG and SG together) for African learners was 23% (EduSource,
1997). In the repeat study (TIMSS-R) of 1999, South African learners again came last at the
levels tested (38th out of the 38 participating countries, including two other African countries, viz.
Tunisia and Morocco). Not only did South African learners perform worst, but 86% of South
African students did not even reach the international lower quarter benchmark15, and the top 10%
13 NARSET (National Access and Retention in Science, Engineering and Technology) Report: a report on issues relating to access and retention in these fields. 14 Note that only seven of the nine provinces furnished data on which these calculations were based. 15 ‘A scale anchoring exercise was conducted in TIMSS-R to provide meaningful descriptions of pupils’ performance in terms of what they can do and what they know about mathematics. Scale anchoring describes the pupils’ performance at different points on the TIMSS-R achievement scale in terms of the types of items that on average were answered correctly. To do this, four points were identified on the scale used and are described as the Top 10% benchmark (90th percentile), the Upper Quarter benchmark (75th percentile), the Median benchmark (50th percentile) and the Lower Quarter benchmark (25th percentile)’ (Howie, 2001, p. 19).
14
of South African learners did not compare to the top 10% internationally (Howie, 2001). The
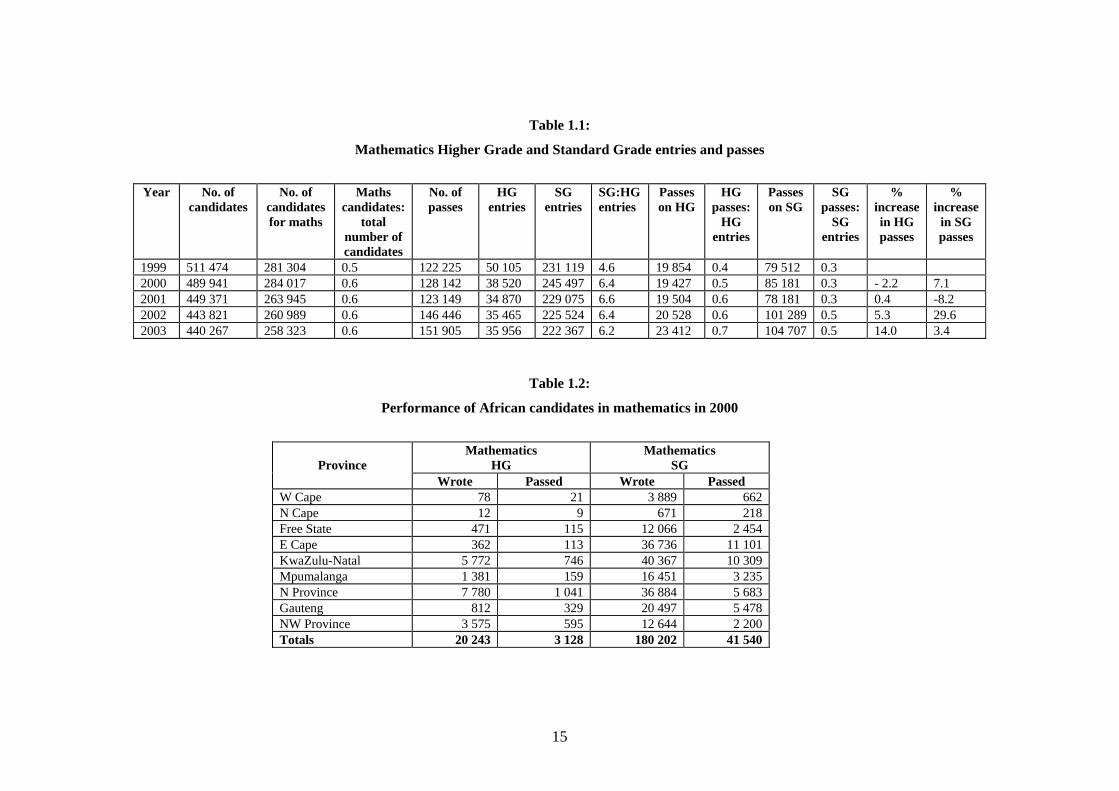
problem remains, and is reflected in Table 1.1, showing the number of HG and SG entries and
passes in the Grade 12 mathematics examinations from 1999 to 2003 (see Tables A1 and A2,
Umalusi Report, 2004). The number of learners writing mathematics as a Grade 12 subject should
be seen against the total number of learners in Grade 12 in each year: only between 50% and 60%
of school leavers were studying mathematics. Table 1.2 reflects the performance of African
learners in one of the years, namely 2000 (Directory of Science, Engineering and Technology
Foundation Programmes, 2001).
The limited participation in mathematics and the poor performance are regarded with concern in
many different areas. In September 2003 the Financial Mail Cover Story, entitled ‘Future
Imperfect (Business is paying a high price for a dysfunctional schooling system)’, expresses the
business sector’s concern regarding the low number of black learners passing secondary
mathematics and science (Bisseker, 2003, p.23). According to the article, the best available
figures indicated that in 2002 about 3 300 black learners passed mathematics on Higher Grade
(HG), the normal minimum requirement for most Natural Science courses at university.
In interpreting Table 1.1 it is important to remember the following: in 1999 papers were still
provincially set. The move to set certain papers nationally began in 2001. This change made it
possible to see the differences between the provinces more clearly, and have a better basis for
comparison. It is also important to note that from 1999 a compensatory measure was applied for
learners whose first language was neither English nor Afrikaans, i.e. those who offered an
African language as their first language. Such learners were awarded a compensation of 5% of the
examination marks they obtained in non-language subjects, of which mathematics was one
(Umalusi Report, 2004).
15
Table 1.1:
Mathematics Higher Grade and Standard Grade entries and passes
Year No. of
candidates No. of
candidates for maths
Maths candidates:
total number of candidates
No. of passes
HG entries
SG entries
SG:HG entries
Passes on HG
HG passes:
HG entries
Passes on SG
SG passes:
SG entries
% increase in HG passes
% increase
in SG passes
1999 511 474 281 304 0.5 122 225 50 105 231 119 4.6 19 854 0.4 79 512 0.3 2000 489 941 284 017 0.6 128 142 38 520 245 497 6.4 19 427 0.5 85 181 0.3 - 2.2 7.1 2001 449 371 263 945 0.6 123 149 34 870 229 075 6.6 19 504 0.6 78 181 0.3 0.4 -8.2 2002 443 821 260 989 0.6 146 446 35 465 225 524 6.4 20 528 0.6 101 289 0.5 5.3 29.6 2003 440 267 258 323 0.6 151 905 35 956 222 367 6.2 23 412 0.7 104 707 0.5 14.0 3.4
Table 1.2:
Performance of African candidates in mathematics in 2000
Mathematics
HG Mathematics
SG
Province Wrote Passed Wrote Passed
W Cape 78 21 3 889 662 N Cape 12 9 671 218 Free State 471 115 12 066 2 454 E Cape 362 113 36 736 11 101 KwaZulu-Natal 5 772 746 40 367 10 309 Mpumalanga 1 381 159 16 451 3 235 N Province 7 780 1 041 36 884 5 683 Gauteng 812 329 20 497 5 478 NW Province 3 575 595 12 644 2 200 Totals 20 243 3 128 180 202 41 540
16
The poor performance of students in the matriculation examination, and the limited participation
of African students were factors that needed to be accommodated by the tertiary sector.
1.4 Tertiary education’s response
The South African situation was compounded by many socio-economic factors, but the provision
of access to mathematics is not a uniquely South African problem. How does tertiary education
respond to this situation? What initiatives were there to address the problem? In considering these
questions we need to take into account the fact that a significant difference in the South African
situation was the number of potential students for whom access to mathematics was necessary,
relative to the number of students who could be accommodated in the Higher Education sector.
This necessarily implies that distance education needs to be involved: ‘… if it is important to
increase access, models of educational delivery that facilitate such access need to be used. A
greater focus on distance education methods therefore seems inevitable…’ (Council on Higher
Education, 2004, p. 35).
1.4.1 The international situation
Internationally many universities accepted the responsibility of providing alternative access into
science degrees, through addressing the needs of incoming mathematics students. Specially
designed mathematics courses, called foundation programmes, bridging programmes, preparatory
programmes, remedial courses, etc., have been introduced at many universities throughout the
world. Courses include the Starting with Mathematics courses at the United Kingdom Open
University (UKOU) (UKOU, 2005), the Higher Education Foundation Programme providing
access to King’s School, Oxford (King’s School, 2005), the Preparatory Mathematics at Norwich
University (Norwich University Graduate Programme, 2004), the Singapore Polytechnic
Preparatory Mathematics Programme (Singapore Polytechnic, 2004), Transition Mathematics I at
Central Queensland University (Central Queensland University, 2005), Foundation Mathematics
at the University of Southern Queensland (University of Southern Queensland, 2005), Foundation
Algebra and Foundation Calculus at the National University of Samoa (The National University
of Samoa, 2005), and the Math Preparatory Program and Math Advance Placement Program at
Houston (Houston, 2003).
Of particular interest for the distance learning community are the two foundation mathematics
courses offered by the Open Learning Institute of Hong Kong designed ‘to introduce students
new to distance education to the different skills required by independent learners’ as well as to
17
teach the necessary mathematics; the courses also include a diagnostic quiz which prospective
students take free of charge (Global Network Academy (GNA), 2005).
1.4.2 The South African situation
In South Africa a response to the problem was required for two reasons: redress of past inequities,
and massification of education.
Redress
In the 1990s many universities accepted students with Grade 12 mathematics on SG, usually via
foundation or bridging programmes, but in general most required HG mathematics, usually with
at least a D symbol (i.e. at least 50%) for access to mainstream mathematics or science. It was
assumed that mathematics at HG level, with at least a D, would ensure success in tertiary
mathematics. However, this did not deal with the problem of redress on a large scale, neither did
it guarantee that more students would pass tertiary-level courses. Local and international research
showed that ‘the relation between performance at school and success at university broke down at
the lower range of school aggregate’, and that the predictive value of matriculation results for all
race groups was unreliable when the matriculation aggregate was less than a C (i.e. less than
60%) (Griesel, 1991, in Delvare, 1996, p. 8).
The number of school leavers eligible to study Natural Science subjects, in particular
mathematics, at tertiary level, was thus limited. This had a significant impact on learners who
may have wanted to enter any course of study requiring mathematics. Poor participation and
performance in mathematics resulted in a situation in which tertiary entry-level requirements
were out of reach of a large number of students, in particular disadvantaged learners emerging
from a dysfunctional education system.
During the 1980s many South African universities recognised that the burden of addressing the
inequities within the educational system could not be carried by secondary education and they
began creating or planning additional opportunities for access to tertiary study in general, and to
science and mathematics in particular. Although there were isolated attempts to address the
problems of access, coherent institutional response took a while to develop. In 1992, the
Committee of University Principals (CUP) (subsequently called the South African Universities
18
Vice Chancellors Association (SAUVCA)16 recognised that the universities needed to consider
what could be done to ensure adequate access. In a newsletter in February, 1992, the CUP stated
that that ‘a main challenge facing tertiary education in South Africa was the need to ensure
adequate access, particularly by black South Africans’; furthermore, owing to the poor education
received by the majority of black students, the universities ‘had a moral obligation in terms of a
more lenient admission’ policy towards those with inferior schooling (Delvare, 1996, p. 9).
Massification
Apart from the need to address past inequities it was also important to consider the demands of a
burgeoning population responding to government’s encouragement to study mathematics and
science in order to further the country’s economic growth. In 1996 just under 40% of the African
population was under the age of 15 (South Africa Survey, 1996/7). This translates to about 40%
of approximately 33,7 million (according to Development Bank of Southern Africa figures). The
potential number of students considering the option of tertiary education was significant;
furthermore it was recognised that the level of preparedness was possibly problematic:
Not only will serious under-preparedness soon be a problem for the majority of students, but
South Africa will need to train many more under-prepared students in the sciences and
technology, disciplines in which academic support and bridging are very expensive
(Delvare, 1995, p. 32).
The prediction made by Lewin (1997) seems to have been valid:
… as higher education expands towards a mass system, the quality of students will
change as a result of this fact alone. They will be a less select group with a wider range of
learning needs and new and different support needs (p. 157).
It was noted above that the introduction of foundation and bridging programmes could not
address large-scale redress, and in fact the brief of the 1997 National Access and Retention in
Science, Engineering and Technology (NARSET) investigation was to report on ways in which
programmes aimed at redress could be scaled up. In that sense NARSET was in fact an
investigation into massification.
16 Subsequent to a number of institutional mergers the Technikon Principals were also included, and the body became known as Higher Education, South Africa (HESA).
19
By 2000 it was estimated that there were approximately 22,6 million South Africans under the
age of 25, just over half the estimated total population of 43,1 million (SA 2000-01). Obviously
not all these young people would aim to study at universities, but it is nevertheless true that the
universities are not equipped to accommodate the influx of such potentially large numbers of
possibly inadequately prepared students, particularly in subjects such as mathematics.
1.5 South African access initiatives
Since the early 1990s there has been varied institutional response to the problem of limited
availability of graduates in the SET sector and the resultant need to increase access to
mathematics. In his opening address to delegates at the National Access and Retention in Science,
Engineering and Technology (NARSET) conference in 1996, Luis Honwana of the United
Nations Educational, Scientific and Cultural Organisation (UNESCO) commented on data
emanating from the Development Bank of South Africa, indicating that South Africa at that stage
needed 600 000 additional scientists and engineers to maintain economic growth. The shortfall
was seen as a result of the small number of students taking science subjects, such as mathematics,
beyond the ninth year of school. There was clearly a need for universities to address this situation
by scaling up provision of extended and bridging programmes (Honwana, 1997).
Institutional response has included intensive staff development and faculty-integrated educational
support (Delvare, 1995). It has involved the provision of bridging programmes and foundation
programmes, the creation of extended first-year programmes, and some adjustments to
mainstream programmes at entry level (NARSET, 1997). Some institutions focused on key
subjects, sometimes in isolation, sometimes in combination with other subjects, to create
foundation or bridging programmes. In general, bridging courses or programmes are regarded as
‘backward-looking’ in that the content has usually been covered before at the secondary level;
foundation courses are seen to be ‘forward-looking’ in that ‘the material is derived from
unpacking the essential elements of the university course that will follow’ (Directory of Science,
Engineering and Technology Foundation Programmes, 2001, p. 17). Bridging programmes thus
focused primarily on content, while foundation programmes focused on content with the added
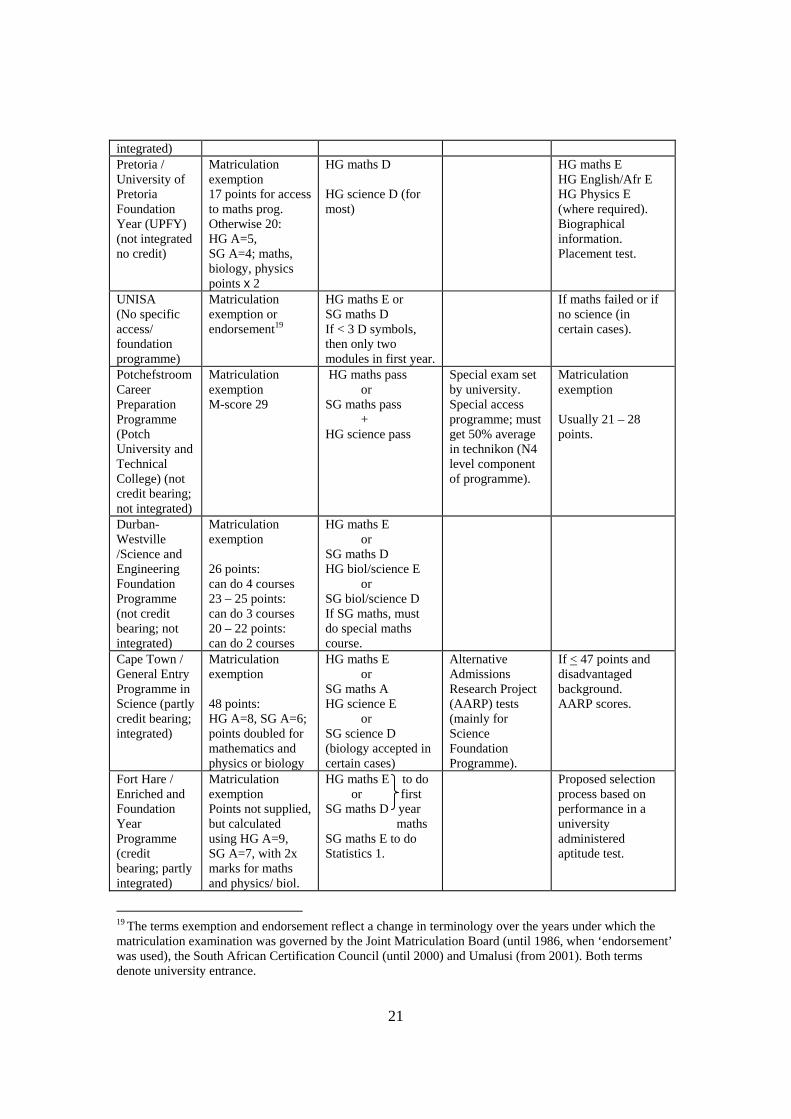
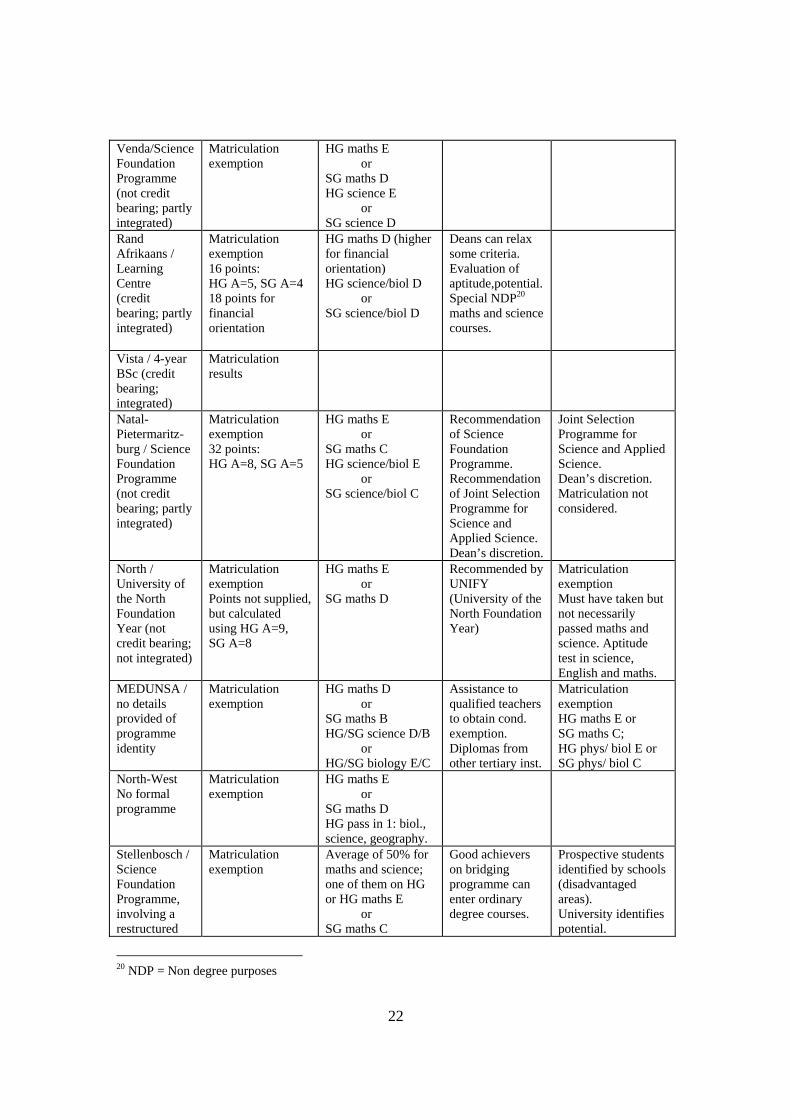
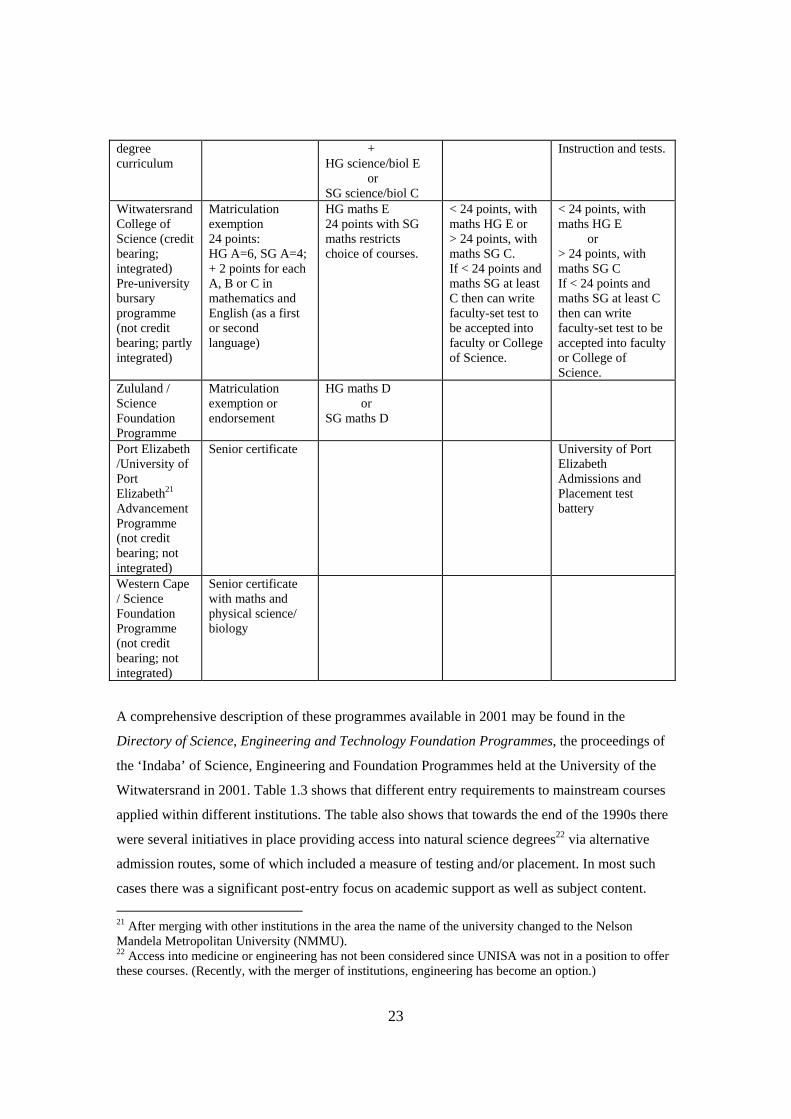
dimension of some academic support (NARSET, 1997). Information regarding access options
available to students in need of special access opportunities at contact-teaching institutions is
provided in Table 3.C.1 of the NARSET Report (NARSET, 1997) and in Table 5 and institution-
specific details in the 2001 Directory of Science, Engineering and Technology Foundation
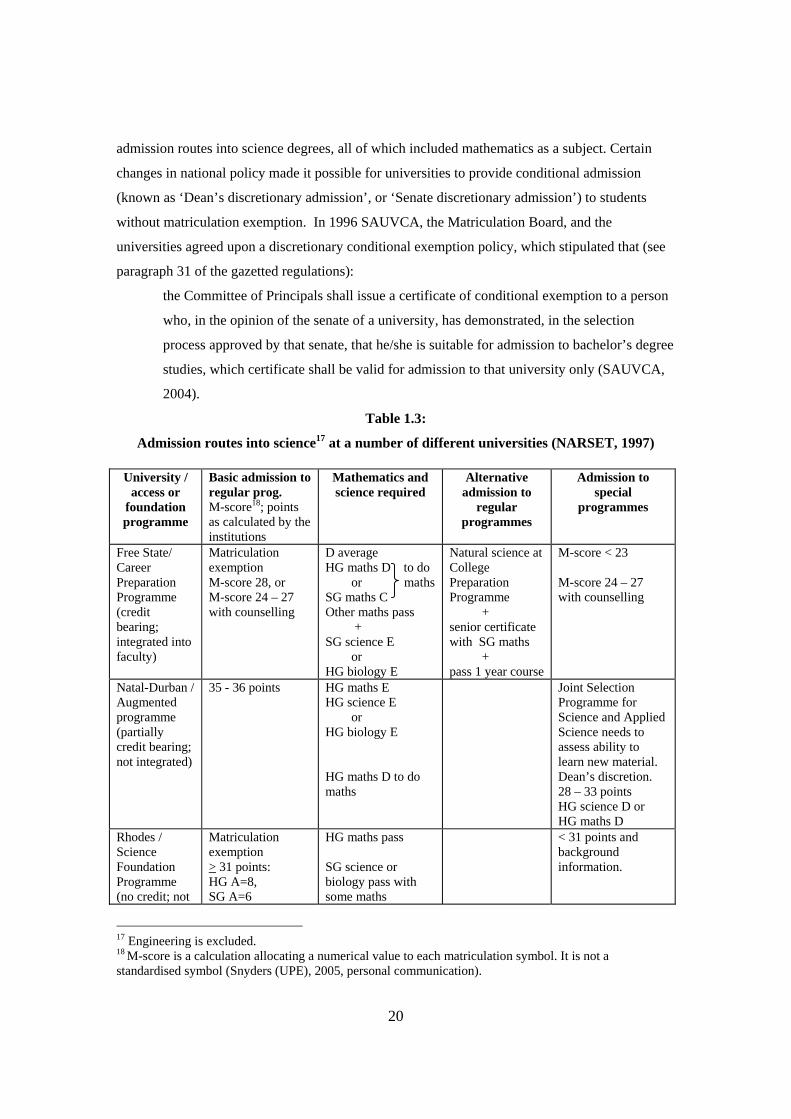
Programmes. Table 1.3 summarises the relevant details, where available. The table reflects
20
admission routes into science degrees, all of which included mathematics as a subject. Certain
changes in national policy made it possible for universities to provide conditional admission
(known as ‘Dean’s discretionary admission’, or ‘Senate discretionary admission’) to students
without matriculation exemption. In 1996 SAUVCA, the Matriculation Board, and the
universities agreed upon a discretionary conditional exemption policy, which stipulated that (see
paragraph 31 of the gazetted regulations):
the Committee of Principals shall issue a certificate of conditional exemption to a person
who, in the opinion of the senate of a university, has demonstrated, in the selection
process approved by that senate, that he/she is suitable for admission to bachelor’s degree
studies, which certificate shall be valid for admission to that university only (SAUVCA,
2004).
Table 1.3:
Admission routes into science17 at a number of different universities (NARSET, 1997)
University / access or
foundation programme
Basic admission to regular prog. M-score18; points as calculated by the institutions
Mathematics and science required
Alternative admission to
regular programmes
Admission to special
programmes
Free State/ Career Preparation Programme (credit bearing; integrated into faculty)
Matriculation exemption M-score 28, or M-score 24 – 27 with counselling
D average HG maths D to do or maths SG maths C Other maths pass + SG science E or HG biology E
Natural science at College Preparation Programme + senior certificate with SG maths + pass 1 year course
M-score < 23 M-score 24 – 27 with counselling
Natal-Durban / Augmented programme (partially credit bearing; not integrated)
35 - 36 points HG maths E HG science E or HG biology E HG maths D to do maths
Joint Selection Programme for Science and Applied Science needs to assess ability to learn new material. Dean’s discretion. 28 – 33 points HG science D or HG maths D
Rhodes / Science Foundation Programme (no credit; not
Matriculation exemption > 31 points: HG A=8, SG A=6
HG maths pass SG science or biology pass with some maths
< 31 points and background information.
17 Engineering is excluded. 18 M-score is a calculation allocating a numerical value to each matriculation symbol. It is not a standardised symbol (Snyders (UPE), 2005, personal communication).
21
integrated) Pretoria / University of Pretoria Foundation Year (UPFY) (not integrated no credit)
Matriculation exemption 17 points for access to maths prog. Otherwise 20: HG A=5, SG A=4; maths, biology, physics points x 2
HG maths D HG science D (for most)
HG maths E HG English/Afr E HG Physics E (where required). Biographical information. Placement test.
UNISA (No specific access/ foundation programme)
Matriculation exemption or endorsement19
HG maths E or SG maths D If < 3 D symbols, then only two modules in first year.
If maths failed or if no science (in certain cases).
Potchefstroom Career Preparation Programme (Potch University and Technical College) (not credit bearing; not integrated)
Matriculation exemption M-score 29
HG maths pass or SG maths pass + HG science pass
Special exam set by university. Special access programme; must get 50% average in technikon (N4 level component of programme).
Matriculation exemption Usually 21 – 28 points.
Durban-Westville /Science and Engineering Foundation Programme (not credit bearing; not integrated)
Matriculation exemption 26 points: can do 4 courses 23 – 25 points: can do 3 courses 20 – 22 points: can do 2 courses
HG maths E or SG maths D HG biol/science E or SG biol/science D If SG maths, must do special maths course.
Cape Town / General Entry Programme in Science (partly credit bearing; integrated)
Matriculation exemption 48 points: HG A=8, SG A=6; points doubled for mathematics and physics or biology
HG maths E or SG maths A HG science E or SG science D (biology accepted in certain cases)
Alternative Admissions Research Project (AARP) tests (mainly for Science Foundation Programme).
If < 47 points and disadvantaged background. AARP scores.
Fort Hare / Enriched and Foundation Year Programme (credit bearing; partly integrated)
Matriculation exemption Points not supplied, but calculated using HG A=9, SG A=7, with 2x marks for maths and physics/ biol.
HG maths E to do or first SG maths D year maths SG maths E to do Statistics 1.
Proposed selection process based on performance in a university administered aptitude test.
19 The terms exemption and endorsement reflect a change in terminology over the years under which the matriculation examination was governed by the Joint Matriculation Board (until 1986, when ‘endorsement’ was used), the South African Certification Council (until 2000) and Umalusi (from 2001). Both terms denote university entrance.
22
Venda/Science Foundation Programme (not credit bearing; partly integrated)
Matriculation exemption
HG maths E or SG maths D HG science E or SG science D
Rand Afrikaans / Learning Centre (credit bearing; partly integrated)
Matriculation exemption 16 points: HG A=5, SG A=4 18 points for financial orientation
HG maths D (higher for financial orientation) HG science/biol D or SG science/biol D
Deans can relax some criteria. Evaluation of aptitude,potential. Special NDP20
maths and science courses.
Vista / 4-year BSc (credit bearing; integrated)
Matriculation results
Natal-Pietermaritz-burg / Science Foundation Programme (not credit bearing; partly integrated)
Matriculation exemption 32 points: HG A=8, SG A=5
HG maths E or SG maths C HG science/biol E or SG science/biol C
Recommendation of Science Foundation Programme. Recommendation of Joint Selection Programme for Science and Applied Science. Dean’s discretion.
Joint Selection Programme for Science and Applied Science. Dean’s discretion. Matriculation not considered.
North / University of the North Foundation Year (not credit bearing; not integrated)
Matriculation exemption Points not supplied, but calculated using HG A=9, SG A=8
HG maths E or SG maths D
Recommended by UNIFY (University of the North Foundation Year)
Matriculation exemption Must have taken but not necessarily passed maths and science. Aptitude test in science, English and maths.
MEDUNSA / no details provided of programme identity
Matriculation exemption
HG maths D or SG maths B HG/SG science D/B or HG/SG biology E/C
Assistance to qualified teachers to obtain cond. exemption. Diplomas from other tertiary inst.
Matriculation exemption HG maths E or SG maths C; HG phys/ biol E or SG phys/ biol C
North-West No formal programme
Matriculation exemption
HG maths E or SG maths D HG pass in 1: biol., science, geography.
Stellenbosch / Science Foundation Programme, involving a restructured
Matriculation exemption
Average of 50% for maths and science; one of them on HG or HG maths E or SG maths C
Good achievers on bridging programme can enter ordinary degree courses.
Prospective students identified by schools (disadvantaged areas). University identifies potential.
20 NDP = Non degree purposes
23
degree curriculum
+ HG science/biol E or SG science/biol C
Instruction and tests.
Witwatersrand College of Science (credit bearing; integrated) Pre-university bursary programme (not credit bearing; partly integrated)
Matriculation exemption 24 points: HG A=6, SG A=4; + 2 points for each A, B or C in mathematics and English (as a first or second language)
HG maths E 24 points with SG maths restricts choice of courses.
< 24 points, with maths HG E or > 24 points, with maths SG C. If < 24 points and maths SG at least C then can write faculty-set test to be accepted into faculty or College of Science.
< 24 points, with maths HG E or > 24 points, with maths SG C If < 24 points and maths SG at least C then can write faculty-set test to be accepted into faculty or College of Science.
Zululand / Science Foundation Programme
Matriculation exemption or endorsement
HG maths D or SG maths D
Port Elizabeth /University of Port Elizabeth21
Advancement Programme (not credit bearing; not integrated)
Senior certificate University of Port Elizabeth Admissions and Placement test battery
Western Cape / Science Foundation Programme (not credit bearing; not integrated)
Senior certificate with maths and physical science/ biology
A comprehensive description of these programmes available in 2001 may be found in the
Directory of Science, Engineering and Technology Foundation Programmes, the proceedings of
the ‘Indaba’ of Science, Engineering and Foundation Programmes held at the University of the
Witwatersrand in 2001. Table 1.3 shows that different entry requirements to mainstream courses
applied within different institutions. The table also shows that towards the end of the 1990s there
were several initiatives in place providing access into natural science degrees22 via alternative
admission routes, some of which included a measure of testing and/or placement. In most such
cases there was a significant post-entry focus on academic support as well as subject content. 21 After merging with other institutions in the area the name of the university changed to the Nelson Mandela Metropolitan University (NMMU). 22 Access into medicine or engineering has not been considered since UNISA was not in a position to offer these courses. (Recently, with the merger of institutions, engineering has become an option.)
24
Matriculation exemption with various added minimum subject requirements has in the past been a
barrier to tertiary education. As the universities waived these restrictions, and provided for
alternative entry routes, with post-entry supported access programmes, many more previously
disadvantaged students were able to gain access to their chosen fields of study.
1.6 Distance learning
With large numbers of students to be accommodated, distance education seemed a logical option.
However, given the emphasis on contact, in some cases for admission purposes as well as in the
teaching context, could distance education play a role in providing access to mathematics in
South Africa? Delvare (1995) warned that distance learning (specifically for disadvantaged
students) could be an expensive option. An understanding of this apparently paradoxical
statements follows from the fact that opening the doors to all does not imply that all are well
enough equipped to utilise the study opportunities provided, and increased enrolment of
inadequately prepared students would lead to failure and attrition, both of which are costly.
Before we focus on UNISA’s role in creating access to mathematics, we need to look briefly at
the nature of distance learning, and the particular context in which distance learning is provided
in South Africa.
1.6.1 Open and distance learning
Distance education grew out of a perceived need to reach individuals who could not attend
regular classes, and began in the form of correspondence education (Perraton, 1991). The key
difference between correspondence education and distance teaching lay in the fact that in the
former students merely received pre-packaged study material, and were left to study the material
on their own, with no support, before being assessed on the content in some way. Distance
learning also involves the production of study material in advance of students’ requirements, but
includes mediated interaction between lecturers and students. With the rapid expansion and
increasing availability of technology, printed study material could be supplemented by additional
media such as radio, television, audio and video, and various forms of electronic media. Although
the media differ, all forms of distance teaching depend on the media used, the structure of the
system, and the methods implemented for providing feedback to students (Perraton, 1991). They
also depend to a lesser or greater extent on the amount of contact time afforded to students.
25
UNISA is one of the world’s so-called mega-universities23. In 2003 UNISA enrolled
approximately 145 000 students (Council on Higher Education, 2004). Some other mega-
universities are, for example, the Open University of the United Kingdom (UKOU), the Indira
Ghandi National Open University in India, the Sukhothai Thammathirat Open University in
Thailand, and the China TV University system (Daniel, 1996). UNISA is an ‘open and distance
learning university’, with all the associated advantages and disadvantages. The phrases ‘distance
teaching’ and ‘distance learning’ have relatively recently come into being. Distance learning can
be defined as ‘an educational process in which a significant proportion of the teaching is
conducted by someone removed in space and/or time from the learner’ (Perraton, 1982, p. 4), or
‘any form of organised educational experience in which teaching and learning take place with
teachers at-a-distance from the learners for most of the time’ (Dodds, 1991, p. 6).
The term ‘open university’ was introduced when a distance-teaching university with open access
(viz. the UKOU) was established in England in 1969 (Holmberg, 1995). Open learning denotes a
more flexible process, that is
an organized educational activity, based on the use of teaching materials, in which
constraints on study are minimised either in terms of access, or of time and place, pace,
methods of study, or any combination of these (Perraton, 1997, in Perraton 2000, p. 13).
Openness relates to a process of learning that ‘describes a continuum of access and opportunities’
(Singh, 1995, p. 8), although relatively few so-called open universities are fully ‘open’ in terms of
maximum choice left to students with regard to admission, content, mode of learning, etc.
Opportunities and constraints of distance learning
Distance learning provides educational opportunities for those who are unable, for many reasons,
to enter face-to-face24 teaching universities. The nature of the teaching creates greater flexibility.
Economies of scale favour large enrolments. However, overly large enrolments can have a
negative effect on retention and graduation rates. Although average costs per registered student
may be lower than for face-to-face teaching, if effectiveness is measured in terms of students who
graduate, the costs become considerably higher (Delvare, 1995; Perraton, 2000). Distance
23 A mega-university is a distance-teaching institution with over 100 000 active students in degree-level courses (Daniel, 1996). 24 We use the term face-to-face and not contact in order to make clear the distinction between delivery and support: in distance education teaching is primarily provided by means of distance methods, with various forms of contact, such as telephone, tutorial sessions, etc. used for additional support. In face-to-face delivery of material the teaching is usually mediated by lecturers who are not removed from their students in space or time.
26
learning can provide many advantages for students, such as the potential to learn at their own
pace and in their own time; the provision of asynchronous communication through computer
technology; the opportunity to structure study in ways that accommodate work and family
commitments, to name but a few. It is, however, also true that there is limited benefit to the
increased access offered by distance education if ‘the “open door” is also a “revolving door”
through which ill-prepared students pass only to re-emerge as drop-outs’ (Keegan & Rumble,
1982, p. 226).
Distance learning requires academic maturity, as discipline and perseverance are essential when
study and work commitments need to be dealt with simultaneously. Feelings of isolation
exacerbate the normal frustration that arises when students need to deal with complex concepts on
their own. (See for example ‘the lonely student’ (Young et al., 1991, p. 39).)
Competence in the media used to present study material (such as text, computer technology,
video, etc.) and in the language of instruction are regarded as prerequisites for distance learning,
but student difficulties in these areas are often only perceived after enrolment. In spite of
increased access to technology, print remains in many cases the primary instructional medium.
When students rely on pre-prepared texts they ‘may come to regard the word – rather than critical
dialogue – as sacred’ (Perraton, 2000, p.198). This attitude is more likely to facilitate a one-way
transmission of information instead of an exchange of ideas through interaction, as the constraints
limit the effectiveness of distance education in the affective domain (Keegan & Rumble, 1982).
In other words, the importance of students’ attitudes and feelings while processing the
information is often overlooked. Distance learning is dependent on the quality of the pre-prepared
learning material, but it is possible that ‘new technologies often make it easy to create poor
quality materials that look good’ (Council on Higher Education, 2004, p. 30). Furthermore,
instructional design theories, which have been applied in the development of distance learning
material, have not necessarily been effective for all students and in all contexts (Thorpe, 1995). In
distance learning, even more so than in a face-to-face context (because the events are essentially
asynchronous), it is easy to lose sight of the gap between the level at which teaching is presented
and the level at which student learning takes place. In distance learning a course is often judged
by the quality of the learning material, and not by the quality of the learning that takes place
(Melton, 1991). This has particular relevance for mathematics, where excellent study material
presents the end product (such as the solution of a problem, or the proof of a theorem) and
27
disguises the intermediate reasoning process (Mason, 2002). If no attempt is made to engage
students in the process they are unlikely to be successful.
Learning requires interaction, but in distance learning interaction can often only take place
through an assignment system. Students are then very dependent on the feedback on their
assignments, and turn-around time is critical, as ‘action without feedback is completely
unproductive for the learner’ (Laurillard, 1993, p. 61). In other words, having done an
assignment, a student needs timeous and constructive comment on the work submitted. With
limited interaction it is also difficult for both student and lecturer to determine whether learning is
taking place at a ‘deep’ or ‘surface’ level, to use Marton and Saljö’s terms (Marton & Saljö,
1984).
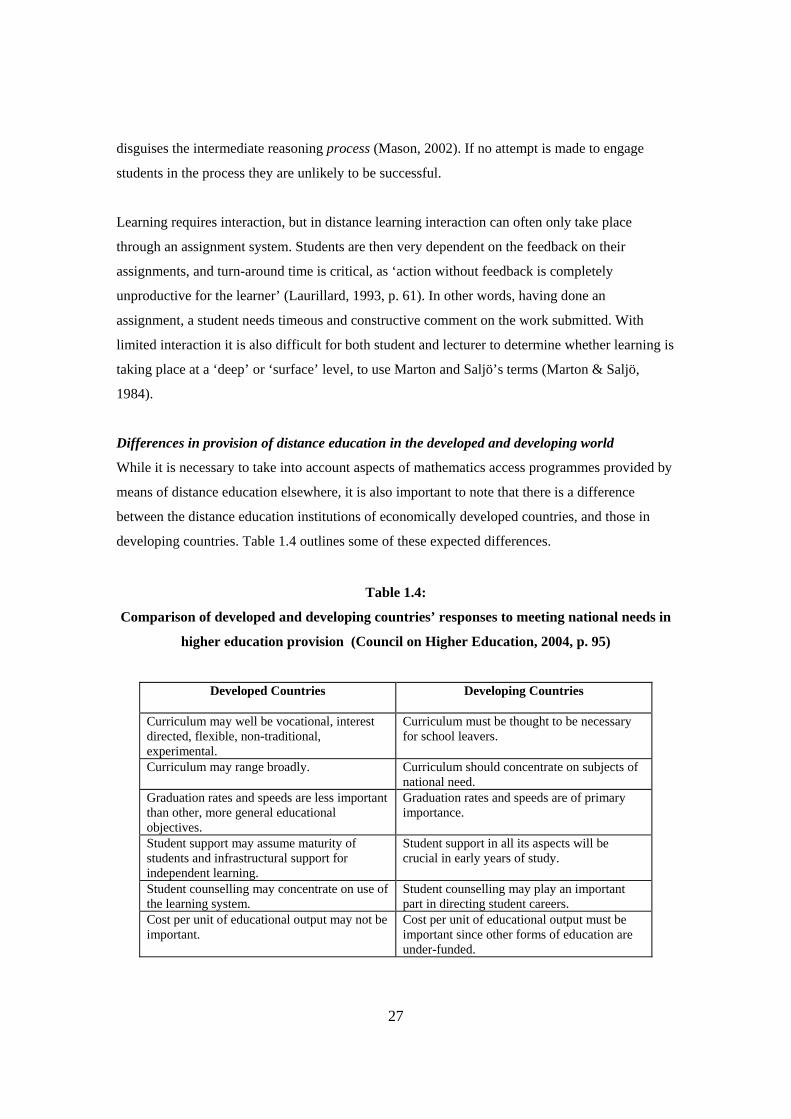
Differences in provision of distance education in the developed and developing world
While it is necessary to take into account aspects of mathematics access programmes provided by
means of distance education elsewhere, it is also important to note that there is a difference
between the distance education institutions of economically developed countries, and those in
developing countries. Table 1.4 outlines some of these expected differences.
Table 1.4:
Comparison of developed and developing countries’ responses to meeting national needs in
higher education provision (Council on Higher Education, 2004, p. 95)
Developed Countries Developing Countries
Curriculum may well be vocational, interest directed, flexible, non-traditional, experimental.
Curriculum must be thought to be necessary for school leavers.
Curriculum may range broadly. Curriculum should concentrate on subjects of national need.
Graduation rates and speeds are less important than other, more general educational objectives.
Graduation rates and speeds are of primary importance.
Student support may assume maturity of students and infrastructural support for independent learning.
Student support in all its aspects will be crucial in early years of study.
Student counselling may concentrate on use of the learning system.
Student counselling may play an important part in directing student careers.
Cost per unit of educational output may not be important.
Cost per unit of educational output must be important since other forms of education are under-funded.
28
1.6.2 The nature of UNISA
Distance education provision in South African public higher education began in 1946 with the
establishment of UNISA, which began as an examining body in 1873, as one of the world’s first
correspondence universities (Perraton, 2000). In 2002 UNISA’s enrolment was 139 388 (UNISA
Annual Report, 200225). At the beginning of 2004, UNISA and two other tertiary distance-
learning institutions, namely Technikon South Africa and the distance sector of Vista University,
merged to create one distance learning institution. With the merger and various other structural
changes, the names of several UNISA departments and faculties changed. Similar mergers and
name changes affected other universities as well. For the purposes of this thesis, all references
will be to the names of the departments, faculties and universities as they were before the
mergers, during the period over which this research was undertaken, i.e. from 1997 to 2004.
Although UNISA’s ideological stance may have been questionable during the apartheid era it
nevertheless provided courses to all, regardless of race (Perraton, 2000). For many South Africans
such courses were not available elsewhere. The South African government recognised the key
role that distance education should play in increasing participation and access. The 1995 White
Paper on Education and Training stated, with reference to the provision of distance learning, that
The dimensions of South Africa’s learning deficit are so vast in relation to the needs of
the people, the constitutional guarantee of the right to basic education, and the severe
financial constraints on infrastructural development on a large scale, that a completely
fresh approach is required to the provision of learning opportunities (Department of
Education, 1995, p. 28, in Council on Higher Education Policy Advice Report, Council
on Higher Education, 2004, p. 17).
UNISA’s history may have been in correspondence courses, but over time, with the development
of quality course material and the provision of various forms of support, it became firmly
established as a distance-teaching university. It is now also regarded as an open university, with
various mechanisms having been instituted to relax entry conditions, allow for assessment at
different times, etc. At UNISA the closing date for submission of the last assignment for many
modules is determined by the university’s examination admission process. By the beginning of
September the Examination Department needs to know for each module or course how many
25 When more recent information was sought the 2004 Annual Report had not yet been prepared, and the 2003 Annual Report was only available in draft form and could not be released.
29
students qualify26 to write the examinations. It needs time to prepare sufficient examination
scripts, arrange venues and invigilation, send information to students about examination venues,
and courier scripts to all examination centres, worldwide. In order for the necessary information
to reach the Examination Department in time, sufficient time needs to be allowed for marking the
last assignment, unless it is computer marked, in which case marking and determining final credit
totals can take place almost simultaneously.
The 2002 UNISA Annual Report gives a snapshot of UNISA: at that time it comprised six
faculties27, employed 1 252 academic members of staff28, and conferred degrees, certificates and
diplomas in many different disciplines, comprising 3 504 different modules (UNISA Annual
Report, 2002). The university offered ‘…equal education opportunities to qualified persons
regardless of race, gender, sex, ethnic and social origin, sexual orientation, age, disability and
beliefs’ (UNISA Annual Report, 2002, p. 21). The composition of the student body in 2002 was
as follows29:
Black African 47% White 36%
Coloured 5% Indian 12%
The report showed that students were geographically widely dispersed, both in the country and
internationally. In 2002 the geographical distribution was as follows:
South Africa 125 856 America30 520
Other SADC31 countries 8 660 Europe 1 842
Other African countries 1 733 Asia 544
Oceania 233
Within South Africa, the geographical distribution at that time was as follows:
Eastern Cape 5 613 Free State 3 117
Gauteng 56 051 KwaZulu-Natal (KZN) 25 378
Mpumalanga 7 093 North West 4 735
Northern Cape 1 198 Limpopo 8 819
Western Cape 13 852
26 The process of ‘qualifying’ for the examination is discussed in Chapter 8 (see 8.2.2). 27 These faculties were Economic and Management Sciences, Education, Humanities and Social Sciences, Law, Science, Theology and Biblical Religions. 28 This figure comprised 298, 91, 548, 134, 126 and 55 staff members in the above-mentioned faculties, respectively. 29 The terms ‘Black African’ and ‘Indian’ appear as ‘Black’ and ‘Asian’, respectively, in the UNISA report. 30 The Report did not make it clear whether this figure reflected the United States of America and the Central and South American countries, or just the USA. 31 SADC denotes the Southern African Development Community.
30
1.6.3 UNISA’s role in providing access to mathematics
From Table 1.3 it is clear that in during the 1990s none of the access initiatives available could
reach large numbers of dispersed students. At that stage UNISA provided a number of
mathematics modules, comprising topics usually found in most mathematics courses. Its modular
structure means that we cannot refer to ‘Mathematics 1’ since the components of the full first-
year of mathematics are split over a number of different modules. For example, in 1992 UNISA
offered MAT101, MAT102 and MAT103, together providing students with a grounding in
calculus and linear algebra. Normal Science Faculty entrance requires matriculation exemption
(see 1.3.3) with at least 40% for HG mathematics or at least 50% for SG mathematics. However,
students wanting to study mathematics at UNISA need a minimum of 50% on HG32 (and
mathematics is a prerequisite for most other subjects in the Science Faculty).
As we have seen, there were many students with exemption, whose mathematics marks were too
low for them to be admitted to the mainstream modules described above. UNISA began the
process of increasing access by introducing a Bridging Module (designated by the code MAT110-
M) which was developed by staff33 in the Department of Mathematics, Applied Mathematics and
Astronomy34 in 1993, and an additional module at first-year level, designated as MAT111-N35.
These two modules were called, respectively, Precalculus A and Precalculus B. Precalculus A
contained the essential (from a Science Faculty perspective) aspects of HG matriculation
mathematics, and extended these slightly further, to include some aspects of mainstream first-year
mathematics. It thus bridged the gap in content knowledge for students with HG mathematics
marks below the required D symbol, or with mathematics on SG, hence its designation as the
Bridging Module. Precalculus B was pitched at the first-year level. The creation of these two
modules extended the number of credit-bearing first-level modules, from three to five. They both
carry the same degree credits as all other first-year modules.
Students taking Precalculus A were allowed to take Precalculus B concurrently, but no other first-
level mathematics modules. Students entering via the normal route were expected to take
Precalculus B as well as any number of the three other mainstream modules, not necessarily all in
the same year.
32 As from 2002 students with 80% or more on SG were also accepted into mainstream modules. 33 Carol Bohlmann and Joy Singleton 34 For convenience this will from now on be referred to as the Department of Mathematics. 35 Also developed by staff in the Department of Mathematics.
31
The Bridging Module thus afforded students the opportunity of reaching a level at which they
could enter and cope with mainstream mathematics modules. It did not form part of a more
comprehensive bridging or foundation programme, in which other subjects would also have been
included. It was created to accommodate students with exemption who did not meet the
mathematics requirements. However, there were many students without exemption who also
wanted to study mathematics. Up to 1996 students without university exemption could not
register at UNISA. However, when the senate discretionary admission policy was implemented at
UNISA in 1997, it became possible to admit such students. As a first step, in 1997 and 1998
students without exemption were given the opportunity of writing a mathematics access
examination. The examination was set by staff36 in the Department of Mathematics, and consisted
of multiple-choice, computer-marked questions, which assessed prerequisite content knowledge.
The questions were such that the correct answers were not obvious: students needed to work out
the answer to each question before being able to decide which option (among the four available)
to choose. When students registered for the examination, initially written twice a year, they were
issued with the first book (called Book 0) in the series of study guides written for the
Mathematics Bridging Module. This book consisted of a summary of all the background
mathematical knowledge required in order to cope with the Bridging Module. Essentially this
included all the work students would have covered if they had taken SG mathematics up to Grade
12, excluding all Euclidean geometry, calculus and trigonometry37. Students were also given a
letter containing general information regarding the examination, as well as a mock examination
paper, with marking memorandum, to give them an idea of the kinds of questions that could be
asked. No additional study material or teaching support was provided.
If students passed the examination they were admitted to the Science Faculty38, and were able to
study the two Precalculus modules. This examination also created access for students with
exemption who did not have at least 40% on HG or 50% on SG for Standard 10 (Grade 12)
mathematics. They were also able to register for other mathematics modules (initially only the
36 The staff members involved were Joy Singleton and Carol Bohlmann. 37 Calculus and trigonometry were excluded as they were dealt with in detail in later modules, and would not have been needed by students moving into Life Science subjects; Euclidean geometry was excluded as students would only need it if they were studying higher level mathematics; it was assumed that such students would be able to study the relevant concepts on their own at that stage. 38 In 1997 and 1998 students without exemption were admitted to the Science Faculty if they passed two access examinations, one in English, and one in mathematics. The English examination in time also evolved into an access module, called Comprehension Skills for Science. Students whose home language was English could choose an access module other than the English module, but were not compelled to do so.
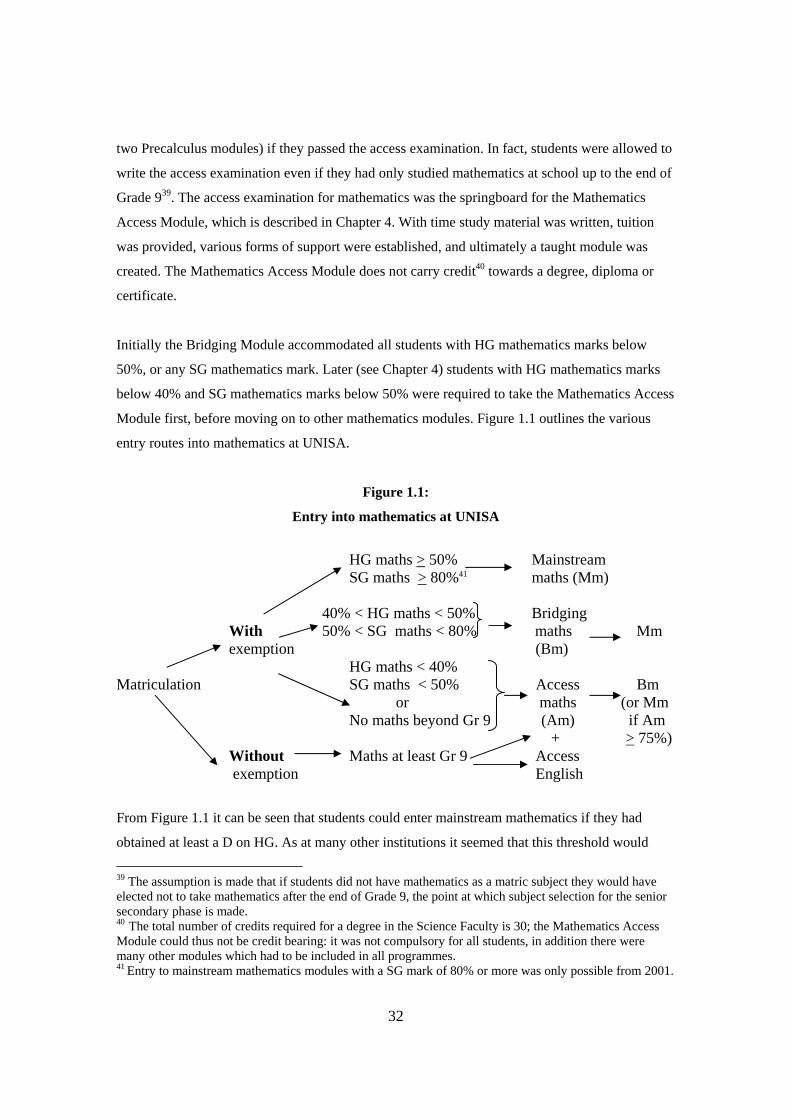
32
two Precalculus modules) if they passed the access examination. In fact, students were allowed to
write the access examination even if they had only studied mathematics at school up to the end of
Grade 939. The access examination for mathematics was the springboard for the Mathematics
Access Module, which is described in Chapter 4. With time study material was written, tuition
was provided, various forms of support were established, and ultimately a taught module was
created. The Mathematics Access Module does not carry credit40 towards a degree, diploma or
certificate.
Initially the Bridging Module accommodated all students with HG mathematics marks below
50%, or any SG mathematics mark. Later (see Chapter 4) students with HG mathematics marks
below 40% and SG mathematics marks below 50% were required to take the Mathematics Access
Module first, before moving on to other mathematics modules. Figure 1.1 outlines the various
entry routes into mathematics at UNISA.
Figure 1.1:
Entry into mathematics at UNISA
HG maths > 50% Mainstream SG maths > 80%41 maths (Mm)
40% < HG maths < 50% Bridging With 50% < SG maths < 80% maths Mm exemption (Bm) HG maths < 40% Matriculation SG maths < 50% Access Bm or maths (or Mm No maths beyond Gr 9 (Am) if Am + > 75%) Without Maths at least Gr 9 Access exemption English
From Figure 1.1 it can be seen that students could enter mainstream mathematics if they had
obtained at least a D on HG. As at many other institutions it seemed that this threshold would
39 The assumption is made that if students did not have mathematics as a matric subject they would have elected not to take mathematics after the end of Grade 9, the point at which subject selection for the senior secondary phase is made. 40 The total number of credits required for a degree in the Science Faculty is 30; the Mathematics Access Module could thus not be credit bearing: it was not compulsory for all students, in addition there were many other modules which had to be included in all programmes. 41 Entry to mainstream mathematics modules with a SG mark of 80% or more was only possible from 2001.
33
separate those who had a reasonable chance of success from those who did not. However, it is
uncertain whether this assumption remains valid. The Umalusi Report provides information on
the standard of senior certificate examination paper questions in more recent year. In mathematics
it was found that ‘the examinations contained very few questions that required the deployment of
higher-order thinking skills’ (Umalusi Report, 2004, p. 32).
Entry into mainstream mathematics at UNISA can thus be a lengthy process. In 2001 it was
decided that students with 80% or more on SG, or 75% or more in the Mathematics Access
Module, could bypass the Bridging Module and move straight into mainstream mathematics. A
variable proportion of students benefited from this policy: 31 in 2001/2, 9 in 2002/3, and 19 in
2003/4 (representing 17,3%, 8,7% and 12,3% of the total number of passes, respectively). These
students, at least, could move into mainstream mathematics more rapidly than they may otherwise
have done.
1.7 Similarities and differences between the different approaches to access
From the summary of programmes in Table 1.3 and the discussion in Section 1.5 it is clear that
there were significant differences between access opportunities available at other institutions and
at UNISA. Table 1.3 relates to access to science degrees; in this chapter we are primarily
considering access to mathematics; however, mathematics is required for any route into a science
degree, and the comparison is thus valid.
There were differences in numbers: although UNISA began with 116 students who registered for
the first Mathematics Access Examination, the numbers soon grew rapidly (over 1 600 students
registered in 2003 and 2004). None of the other institutions mentioned had the capacity to
accommodate numbers of that magnitude.
There were differences in approach: where most institutions attempted to integrate the content-
based instruction with some form of subject and academic support, at UNISA no support was
envisaged for the mathematics access examination, and initially very little support was available
for the Mathematics Access Module. There was also no consideration of cross-discipline teaching
or development of material, such as would have been provided within a foundation programme.
There was varied emphasis on entry-level testing. Of all the institutions, UNISA was the one of
the few that did not attempt any form of entry-level diagnostic or placement testing (although this
34
changed in 2004, as discussed in Chapter 9) (See Table 1.3 and the Directory of Science,
Engineering and Technology Foundation Programmes, 2001.) The initiatives described in this
thesis thus show a shift in UNISA’s approach to students who did not meet the entry
requirements, but who wanted to study mathematics: from no access (before 1993), to access for
eligible students via the Bridging Module (after 1993), to access for a wider group of students via
an examination (in 1997 and 1998), to relatively open access (from 1999 to 2003), and finally in
2004 to an acceptance of managed access which required some entry-level diagnostic testing.
(This will be described in Chapter 9.)
Finally, there was also a difference in pre-requisite entry-level mathematics. UNISA was the only
institution to admit students with mathematics at the level of Grade 9.
1.8 Summary
Chapter 1 thus shows why it was important, in South Africa, to tackle the problem of access to
mathematics at tertiary level, and why it was necessary that UNISA should be involved. Although
at UNISA there were a number of different routes potential students could follow in order to
study mathematics at tertiary level, it is clear that for many students entry via the Mathematics
Access Module was the only option. It was thus important that they should be successful at this
level.
1.9 Overview of the thesis
In the light of the many initiatives dealing with access to mathematics, both at UNISA and
elsewhere, it is important to consider various aspects of such initiatives, in order to take note of
what has been attempted, what has been successful or unsuccessful, and what can be learnt from
these successes or failures. The NARSET Report discusses in some detail the access initiatives
that existed in 1996, and more up-to-date information on the situation can be found in the 2001
Directory of Science, Engineering and Technology Foundation Programmes. Very little has been
written about UNISA’s role in the provision of access to mathematics. This purpose of this thesis
is thus to describe and evaluate the provision of access to mathematics at UNISA, from 1997 to
2004, to consider whether or not students were successful, to describe specific interventions that
were implemented and to reflect on the impact of these different interventions.
Chapter 2 contains a literature review which provides the theoretical framework in which this
research is situated. It provides an overview of the reasons for the creation of the UNISA
35
Mathematics Access Module, and a brief outline of some South African entry-level programmes
which included mathematics.
Chapters 3 and 4 deal with the pre-research phase. Chapter 3 deals with the research design. It
provides background information on action research, and outlines the reasons why an action
research framework was applicable in the context of investigating mathematics access provision
at UNISA. This chapter also notes some of the factors affecting this study, and the context within
which the research was carried out.
Chapter 4 outlines the chronological development and evolution of the Mathematics Access
Module, from 1997 to 2004. However, Chapter 4 focuses in particular on the development of
study material and the initial provision of support and some formative assessment. It is important
to keep the sequence of events in mind as they show how the module was initially conceived and
how it changed. Results for the period 1997 to 1999 are given. This chapter provides the context
in which the action research cycles were situated.
Chapter 5 deals with the beginning of the second phase of the study, in 2000. It first considers the
starting point of one set of action research cycles. (The research method is discussed in Chapter
3). The first cycle in this set deals with an attempt that was made to obtain information regarding
the reading skills of Mathematics Access Module students (Phase I in the reading intervention).
Analysis of the information led to a second phase: the design and implementation of a small face-
to-face reading intervention programme in 2001, referred to as Phase II in the reading
intervention. Planning the implementation of Phase II and analysing the results formed the second
action research cycle in this set. It became clear that a reading intervention programme might
have an impact, but would need to be extended beyond the confines of a small face-to-face
intervention. This led to the planning of Phase III, which was implemented in 2002. It featured a
large-scale reading intervention programme, based on the production and use of a video entitled
‘Read to Learn Maths’. Two different versions of the video were involved, for convenience
referred to as Video 1 and Video 2. Evaluation of the videos and of students’ experiences in
using, and further investigation into students’ reading skills took place, forming the third and
fourth action research cycles in this set. These two cycles are discussed in Chapter 6. The
tentative results of the research described in Chapter 6 suggested that a more radical intervention
might be required.
36
Poor performance in examinations and assignments in1999 led to the consideration of a more
effective form of formative assessment for mathematics at an access level. This gave rise to the
second set of action research cycles, involving three cycles. The first cycle began in 2001. An
intervention was undertaken in which an alternative form of assessment was introduced, in an
effort to engage students more meaningfully in formative assessment. A review of the 2001
intervention led to some modifications, which were implemented in a second cycle, in 2002; a
few further modifications led to a third cycle in 2003. Once again, the results suggested that a
more radical intervention might be needed.
Chapter 8 summarises the examination results in the Mathematics Access Module for the years
1997 to 2003 (the results for the years 1997 to 1999 are given in Chapter 4, but are included again
in Chapter 8 for convenient reference). It is evident that improvements in the provision of study
material for the module, increased support, and two separate sets of interventions did not translate
into a significant improvement in the pass rate. Poor student participation and performance in the
examinations, as well as a number of other factors that emerged from the two sets of
interventions, led to a final action research cycle, described in Chapter 9.
Chapter 9 deals with an investigation into the possibility of using diagnostic assessment as a tool
in the process of managed access. Such assessment was planned to identify potential problems
and provide better advice to prospective students to preempt failure. The design of the diagnostic
assessment, the first phase in its implementation, and some preliminary results, are considered.
Chapter 10 summarises the findings of the previous chapters. It considers the significance of
these findings, notes some of the limitations of the research, and makes suggestions for future
research. Some personal reflections are included.