an overview of the izu-bonin-mariana subduction factory
TRANSCRIPT

An Overview of the Izu-Bonin-Mariana Subduction Factory
Robert J. SternGeosciences Department
University of Texas at DallasBox 830688
Richardson TX [email protected]
Matthew J. Fouch*Carnegie Institution of Washington
Department of Terrestrial Magnetism5241 Broad Branch Road, NW
Washington, DC 20015
Simon L. KlempererDepartment of Geophysics
Stanford University Stanford CA 94305-2215.
* now at:Department of Geological Sciences
Arizona State UniversityP.O. Box 871404
Tempe, AZ 85287-1404
Submitted 10/00, Revised 9/01

1
ABSTRACT
The Izu-Bonin-Mariana (IBM) arc system extends 2800km from near Tokyo, Japan
to Guam and is an outstanding example of an intra-oceanic convergent margin (IOCM).
Inputs from sub-arc crust are minimized at IOCMs and mantle-to-crust fluxes can be more
confidently assessed than for arcs built on continental crust. The history of the IBM IOCM
since subduction began about 43 Ma may be better understood than for any other
convergent margin. IBM subducts the oldest seafloor on the planet and is under strong
extension. The stratigraphy of the western Pacific plate being subducted beneath IBM varies
simply parallel to the arc, with abundant off-ridge volcanics and volcaniclastics in the south
that diminish to the north, and this seafloor is completely subducted. The Wadati-Benioff
Zone varies simply along strike, from dipping gently and failing to penetrate the 660 km
discontinuity in the north to plunging vertically in the south into the deep mantle. The
northern IBM arc is about 22km thick, with a felsic middle crust; this middle crust is
exposed in the collision zone at the northern end of the IBM IOCM. There are four
Subduction Factory outputs across the IBM IOCM: serpentinite mud volcanoes in the
forearc, and as lavas erupted from along the volcanic front of the arc and back-arc basin and
from arc cross-chains. This contribution summarizes our present understanding of matter
fed into and produced by the IBM Subduction Factory, with the intention of motivating
scientific efforts to understand this outstanding example of one of earth’s most dynamic,
mysterious, and important geosystems.
2
1. INTRODUCTION:
The Izu-Bonin-Mariana arc system (IBM) extends over 2800 km south from near
Tokyo, Japan, to beyond Guam, U.S.A. (Fig. 1), and is an excellent example of an intra-
oceanic convergent margin (IOCM). IOCMs are built on oceanic crust and contrast
fundamentally with arcs built on continental crust, such as Japan or the Andes. Because
IOCM crust is thinner, denser, and more refractory than that beneath Andean-type margins,
study of IOCM melts and fluids allows more confident assessment of mantle-to-crust
fluxes and processes than is possible for Andean-type convergent margins. Because
IOCMs are far removed from continents they are not affected by the large volume of alluvial
and glacial sediments. The consequent thin sedimentary cover makes it much easier to
study arc infrastructure and determine the mass and composition of subducted sediments.
Active hydrothermal systems found on the submarine parts of IOCMs give us a chance to
study how many of earth's important ore deposits formed.
IBM presents an outstanding opportunity to study the operation of the Subduction
Factory at an IOCM, for several reasons: 1) the history of IBM evolution is one of the best
known of any convergent margin; 2) there are four opportunities across the arc to sample
products being produced by the Subduction Factory – the forearc, the active magmatic arc,
arc cross-chains, and back-arc basins - more than any other convergent margin; 3)
Subducted sediments are simple, diagnostic, and completely subducted; 4) IBM is a type
example of convergent margins undergoing extension; and 5) IBM is large and diverse.
Furthermore, a collision zone in the north provides an unparalleled opportunity to study the
composition of middle IBM crust and so better infer products and processes leading to the
formation of this crust. Additional information about the advantages of IBM for the
Subduction Factory experiment can be found in the Subduction Factory Science Plan
(http://www.ldeo.columbia.edu/margins/SF_Sci_Plan_revised.pdf).
The following overview of the IBM arc system is presented in the context of the
Subduction Factory experiment. Emphasis is on the active components and on the nature of
inputs and outputs. Although we try to summarize the most important points, it is important
to appreciate that the Subduction Factory is one of earth’s largest and most complex
geosystems, planetary in scale and extending thousands of kilometers into the earth. We
are still in the discovery stage of understanding the IBM Subduction Factory, with lots of
work to be done. The reader is invited to join in this multidisciplinary effort.
2. NOMENCLATURE AND GEOGRAPHY
The IBM arc system lies along the eastern margin of the Philippine Sea Plate in the
Western Pacific. In this paper we will use different terms to describe all or part of the

3
subducting Pacific Plate (subducting components, incoming plate) and the overriding IBM
arc system (mantle wedge, arc crust, overriding plate), which are the two key elements of the
IBM Subduction Factory. We define the Subduction Factory as that part of a convergent
margin/subduction zone system where material is transferred from subducted lithosphere
and sediments to the overlying mantle wedge for processing, from which some products are
transferred to the surface. At one time, all of the eastern Philippine Sea Plate – from New
Guinea to Japan - was an active convergent plate boundary, responsible for subducting the
Pacific Plate but active-arc volcanism has ceased in the region south of the Challenger cusp
(Fig. 1). Because we are concerned here only with that part of the IBM system associated
with an active Subduction Factory, we focus on the IBM arc system east and north of the
Challenger Cusp. We consider the width of the Subduction Factory to correspond to the
active part of the IBM arc system, which lies between the trench – entry slot for all non-
mantle contributions to the Subduction Factory - and a western limit that is defined by the
most distant point from the trench where Subduction Factory products issue. So defined,
the IBM Subduction Factory is no more than 350 km wide. However, products of IBM
generated during its Teritary history extend as far west as the Palau-Kyushu Ridge, up to
1,000 km from the trench. We cannot define the depth limit of the IBM Subduction
Factory, because we don’t know at what depth transfer of material from subducted plate to
ceases overlying mantle ceases.
The northern boundary of the active IBM arc system follows the Nankai Trough
northeastward and onto southern Honshu, joining up with a complex system of thrusts that
continue offshore eastward to the Japan Trench. The intersection of the IBM, Japan, and
Sagami trenches is the only trench-trench-trench triple junction on earth. Thus defined, the
pertinent portion of the IBM arc system spans over 25° of latitude, from 11°N to 35°20’N.
It is bounded on the east by a very deep trench, which ranges from almost 11km deep in the
Challenger Deep to unusually shoal depths of less than 3 km where the Ogasawara Plateau
enters the trench (Fig. 3). The Ogasawara Plateau [Smoot, 1983] separates a deeper portion
of the IBM Trench to the north – where depths of 8-9 km are common – from a shallower
trench in the south, characterized by depths of 6-8 km. The difference in trench depths can
be reasonably ascribed to the different histories of the Pacific Plate north and south of the
Ogasawara Plateau, which was built near the boundary between Jurassic seafloor to the
south and Cretaceous seafloor to the north (Fig. 3). The observed depth difference
contrasts with the expected greater depth at the trench for the older seafloor [Stein and Stein,
1992], probably because the seafloor to the south was extensively affected by mid- and late-
Cretaceous off-ridge volcanism whereas the seafloor to the north was not.

4
Variations on the incoming plate on either side of the Ogasawara Plateau do not
correspond in any obvious way with morphological variations along the arc system, which
can be reasonably be divided into thirds along strike. Boundaries are defined by the
Sofugan Tectonic Line (STL, ~29°30’N) separating the Izu and Bonin segments, and by the
northern end of the Mariana Trough back-arc basin (~23°N), that we take to define the
boundary between the Bonin and Mariana segments. Forearc, active arc, and back arc are
expressed differently on either side of these boundaries (Fig. 4).
The forearc is that part of the arc system between the trench and the magmatic front of
the arc and includes uplifted sectors of the forearc situated near the magmatic front, or what
Karig [1971b] called the ‘frontal arc’. The IBM forearc is very narrow in the south,
between the Challenger cusp and Guam. Elsewhere, from Guam to Honshu, it is about 200
km wide. Uplifted portions of the forearc, composed of Eocene igneous basement
surmounted by reefal terraces of Eocene and younger age, produce the island chain from
Guam north to Ferdinand de Medinilla in the Marianas. Similarly, the Bonin or Ogasawara
Islands are mostly composed of Eocene igneous rocks. There is no accretionary prism
associated with the IBM forearc or trench.
The magmatic axis of the arc is well defined from Honshu to Guam (Fig. 2). This
‘magmatic arc’ is often submarine, reflecting fluctuations between 1 and 4 km water depth
for the platform on which the arc volcanoes are built. Volcanic islands dominate the
magmatic front from Oshima south to Sofugan (the Izu Islands). The Izu segment farther
south also contains several submarine felsic calderas [Yuasa and Nohara, 1992]. The Izu
arc segment is also punctuated by inter-arc rifts [Klaus et al., 1992; Taylor et al., 1991].
The Bonin segment to the south of the Sofugan Tectonic Line contains mostly submarine
volcanoes and also some that rise slightly above sealevel, such as Nishino-shima. The
highest elevations in the IBM arc (not including the Izu Peninsula, where IBM comes
onshore in Japan) are found in the southern part of the Bonin segment, where the extinct
volcanic islands of Minami and Kita Iwo Jima rise to almost 1000 meters above sealevel.
The bathymetric high associated with magmatic arc of the Izu and Bonin segments is often
referred to as the Shichito Ridge in Japanese publications, and the Bonins are often referred
to as the Ogasawara Islands. Volcanoes erupting lavas of unusual composition – the
shoshonitic province - are found in the transition between the Bonin and Mariana arc
segments. The magmatic arc in the Marianas is submarine to the north of Uracas (Northern
Seamount Province), is mostly defined by volcanic islands in the Central Island Province,
and again becomes submarine south of Anatahan (Southern Seamount Province) [Bloomer
et al., 1989b; Meijer, 1982].

5
The back-arc regions of the three segments vary markedly (Fig. 4). The Izu segment
is marked by several volcanic cross-chains which extend SW away from the magmatic front
[Ishizuka et al., 1998]. The Bonin arc segment has no back-arc basin, inter-arc rift, or rear-
arc cross chains. The Mariana segment is characterized by an active back arc basin [Fryer,
1995] known as the Mariana Trough. The Mariana Trough shows marked variations along
strike, with seafloor spreading south of 19°15’ and rifting farther north [Gribble et al.,
1998; Martinez et al., 1995].
The IBM arc system south and west of Guam is markedly different than the region to
the north. The forearc region is very narrow and the intersection of backarc basin spreading
axis with the arc magmatic systems is complex. Earlier ideas that this was a region
dominated by dextral strike-slip faults which trend E-W are not supported by more recent
geophysical data sets [Martinez et al., 2000].
3. EARLY STUDIES OF THE IBM ARC SYSTEM
Study of the IBM arc system began with geologic studies of the islands, and the
nationality of scientists paralleled changing jurisdictions of the region. An excellent history
of work in the Marianas dating back to 1792 is given by Cloud et al. [1956]. Modern
geologic studies began with the identification of boninite lavas from the Ogasawara Islands
by Petersen [1890]. The term ‘boninite’ was neglected for 90 years, but the rocks that
Petersen described are now recognized as among the most interesting and important of all
igneous rocks [Crawford et al., 1989]. Japan controlled the entire IBM arc system except
Guam for 30 years, from 1914 until 1944, during which time the volcanic islands were
studied [Tanakadate, 1940; Tsuya, 1936; Tsuya, 1937]. Hobbs [1923] used the Marianas
as an example of how ‘asymmetric forces’ produce arcuate mountain ranges, incidentally
coining the term ‘island arc’.
The Second World War raged around the Philippine Sea Plate and particularly along
the IBM arc, with tens of thousands of deaths in 1944 and 1945. Soundings collected by
U.S. warships led to the first overview of the marine geology of the region [Hess, 1948].
This paper showed the way for modern research on the Subduction Factory (Hess, 1948,
p.422): “The trenches are the topographic expression of the dominant structural feature of
the region, the downbuckling of the crust or tectogene. This structure…is the core and
essence of mountain building, and all other major structures as well as the volcanic activity
and the seismic activity of the region, are subordinate to and related to it.” Hess mistakenly
identified a peridotite belt along the IBM islands but would have been gratified to learn that
ultramafic rocks are common, both as part of the inner trench wall and as part of serpentine
mud volcanoes in the forearc. Historical asides: former U.S. President George H.W. Bush

6
was shot down over the Bonin Islands in September, 1944, one small event in the bloodiest
military campaign ever fought on an island arc; and it was from Tinian in the Marianas that
the U.S.A. launched atomic bombing raids on Hiroshima and Nagasaki.
Geologic studies of some of the major islands occurred during the post-war period,
particularly on Guam [Tracey et al., 1964], Saipan [Cloud et al., 1956], Pagan [Corwin et
al., 1957] and Iwo Jima [McDonald, 1948]. Japanese scientists resumed geologic
investigations in the northern IBM arc, for example with the petrologic studies of Isshiki
[Isshiki, 1955; Isshiki, 1963]; as part of this effort, the greatest peacetime loss of life ever to
befall the earth science or oceanographic community occurred when the submarine volcano
Myojin-sho erupted on the night of Sept. 23, 1952 and sank the Kaiyo-maru, killing 31
scientists and crew [Jaggar, 1952].
The plate tectonic revolution revived interest in the IBM arc. Seismological re-
examination of the Wadati-Benioff Zone around the Philippine Sea plate led this effort
[Katsumata and Sykes, 1969]. The principal features of crustal structure were outlined by
Murauchi et al. [1968], who established that IBM crust was about 20 km thick. The early-
to mid-1970’s was an exciting time for understanding particularly the southern IBM
system, beginning with the startling discovery of active seafloor spreading behind the
Mariana arc [Karig, 1971b]. This was confirmed by the first integrated geochemical and
isotopic study of the IBM arc system [Hart et al., 1972] that found remarkable similarities
between the composition of Mariana Trough ‘back-arc basin basalts’ and mid-ocean ridge
basalts, and by the recognition of high heatflow in the basin [Anderson, 1975]. Karig
realized that many of the deep basins of the Philippine Sea Plate and elsewhere around the
margin of the Western Pacific evolved in a manner similar to that of the Mariana Trough.
Karig [1971a] established a firm historical and tectonic perspective for understanding the
arc system. The first modern whole-rock geochemical study of the Mariana volcanic
islands [Larson et al., 1975] and the first effort to use radiogenic isotopes to identify
subducted components in Mariana Arc lavas [Meijer, 1976] completed a broad geoscientific
sketch of the arc system. These studies motivated the convergent margin ‘biopsy’
undertaken along 18°N by DSDP Leg 60 [Hussong and Uyeda, 1982]. About this time,
the significance of the IBM collision zone began to be appreciated. Studies of the IBM arc
system since the mid-1970’s have proliferated, as the IBM arc system has come to be
appreciated as an outstanding place to study the operation of convergent plate margins.
4. HISTORY OF THE IBM ARC SYSTEM
The evolution of the IBM arc system is among the best known of any convergent
margin. Because IBM has always been an arc system under strong extension, its

7
components encompass a broad area, from the Palau-Kyushu Ridge to the IBM trench (Fig.
1). In general, the oldest components are preserved farther west, and a complete record of
evolution is preserved in the forearc. The early history has been outlined by Bloomer et al.
[1995] and Stern and Bloomer [1992], who concluded that the IBM subduction zone began
as part of a hemispheric-scale foundering of old, dense lithosphere in the Western Pacific
(Fig. 5A). The beginning of large-scale lithospheric subsidence (not true subduction, but its
precursor) is constrained by the age of igneous basement of the IBM forearc, including
boninites, to have begun by about 50 Ma [Bloomer et al., 1995; Cosca et al., 1998]. During
this stage, the forearc was the site of igneous activity, including the eruption of depleted
tholeiites, boninites and associated low-K rhyodacites [Hickey and Frey, 1982; Stern et al.,
1991; Taylor et al., 1994]. Magmatic activity localized along the present magmatic arc and
allowed forearc lithosphere to cool in Late Eocene or Early Oligocene time. This marked the
transition from lithospheric subsidence to subduction. True subduction – that is, the
beginning of down-dip motion of the lithosphere – probably began about 43 Ma, when the
Pacific Plate suddenly – and otherwise inexplicably - changed from a northerly to more
westerly motion [Richards and Lithgow-Bertelloni, 1996].
This simple model of how subduction began depends in part on the orientation of
spreading centers and fracture zones, needed to localize large-scale lithospheric foundering.
Stern and Bloomer [1992] preferred an E-W spreading ‘Tethyan’ spreading regime and a
N-S fracture zone in which the IBM subduction zone nucleated, but paleomagnetic data
suggest that elements of the IBM arc system has rotated ~90° clockwise since the early
Oligocene [Hall et al., 1995]. It is difficult to reconcile the simple model of subduction
initiation via fracture zone collapse with paleogeographic models inferred from
paleomagnetic data. Large scale rotations seemingly required by paleomagnetic data have
recently been questioned because the IBM collision zone has been at about the same place
for the last 13 Ma, an interval during which paleomagnetic data suggest the Philippine Sea
Plate (and the collision zone) should have migrated several hundred km to the NE zone (see
discussion and reply by Ali and Moss [1999] andTakahashi and Saito [1999].
The beginning of true subduction localized the magmatic arc close to its present
position, about 200 km away from the trench, and allowed the sub-forearc mantle to stabilize
and cool (Fig. 5B). Note that because of a lack of accretionary prism, the distance from the
magmatic arc to the trench is thought not to have changed much since the magmatic arc first
became established. The arc stabilized until about 30 Ma, when it began to rift to form the
Parece Vela Basin. Spreading propagated north and south from this point, resulting in the
‘bowed-out’ appearance of the Parece Vela basin [Taylor, 1992]. Spreading began in the
northernmost part of the IBM arc about 25Ma and propagated south to form the Shikoku

8
Basin [Kobayashi et al., 1995]. These two spreading systems met about 20 Ma and
spreading continued until about 15 Ma (Fig. 5C). The arc was disrupted during rifting but
began to build again as a distinct magmatic system once seafloor spreading began. Arc
volcanism, especially explosive volcanism , waned during much of this episode, with a
resurgence beginning about 20 Ma in the south and about 17 Ma in the north [Lee et al.,
1995; Taylor, 1992]. Tephra from northern and southern IBM show that strong
compositional differences observed for the modern arc have existed over most of the arc’s
history, with northern IBM being more depleted and southern IBM being relatively enriched
[Bryant et al., 1999]. About 15 Ma, the northernmost IBM began to collide with Honshu,
probably as a result of new subduction along the Nankai Trough.
A new episode of rifting to form the Mariana Trough back-arc basin began sometime
after 10 Ma, with seafloor spreading beginning about 3-4 Ma [Bibee et al., 1980; Yamazaki
and Stern, 1997] (Fig. 5D). Because disruption of the arc is the first stage in forming any
back-arc basin, the present Mariana arc volcanoes cannot be older than 3-4 Ma but the Izu-
Bonin volcanoes could be as old as ~25 Ma. The Izu interarc rifts began to form about 2
Ma [Taylor, 1992].
5. INPUTS INTO THE SUBDUCTION FACTORY
Everything delivered to the IBM trench, including the entire sedimentary section, is
subducted. In addition, Cloos [1992] argued that the subduction channel shear zone beneath
the Marianas widens with depth in the shallow parts of the subduction zone, so that
subcretion is unlikely and the entire subducted assemblage –perhaps minus a few accreted
seamounts – is delivered to and processed in the Subduction Factory. Below we discuss the
delivery vectors for this input, some modifications of the lithosphere just prior to its descent,
and the stratigraphy and composition of sediments on the Pacific plate adjacent to the
trench.
5.1. Plate Motions
The IBM arc system is part of the Philippine Sea Plate, at least to the first
approximation. Although the IBM arc deforms internally – and in fact in the south is
separated from the Philippine Sea Plate by a spreading ridge in the Mariana Trough - it is
still useful to discuss approximate rates and directions of that plate with its lithospheric
neighbors, because these define, to a first order, how rapidly and along what streamlines
material is fed into the Subduction Factory. The Philippine Sea Plate (PH) has four
neighboring plates: the Pacific (PA), Eurasian (EU), North America (NA), and Caroline
(CR). There is minor relative motion between PH and CR; furthermore, CR does not feed
the IBM Subduction Factory, so it is not discussed further. The North America plate
9
includes northern Japan, but relative motion between it and Eurasia is sufficiently small that
relative motion between PH and EU explains the motion of interest. The Euler pole for PH-
PA as inferred from the NUVEL-1A model for current plate motions [DeMets et al., 1994]
lies about 8°N, 137.3°E, near the southern end of the Philippine Sea Plate. PA rotates
around this pole CCW ~1°/Ma with respect to PH. The PH-PA Euler pole inferred from
earthquake slip vectors lies very close to the NUVEL-1A pole [Seno et al., 1993]. This
means that relative to the southernmost IBM, PA is moving NW at about 20-30 mm/y,
whereas relative to the northernmost IBM, PA is moving WNW and twice as fast (Fig. 3).
The NUVEL-1A Euler Pole for EU-PH lies about 51°N, 160.5°E, off the coast of
Kamchatka. Earthquake slip vectors [Seno et al., 1993] indicate a more southerly pole
location, NE of Hokkaido. Recent GPS (global positioning satellite) campaigns [Kotake et
al., 1998] indicate that the EU-PH Euler Pole lies ~42°N, 152.5°E, a bit south of Seno’s
slip vector pole, with a CW rotation of 1.5°/Ma for PH relative to EU. PH is moving NW at
about 40 mm/year relative to Hokkaido, so velocities increase to the south along the EU-PH
plate boundary. To a first approximation, the GPS, NUVEL-1A, and earthquake slip vector
data agree, except for Guam, which GPS data indicate is moving much more slowly to the
NW (~10mm/year) than predicted from NUVEL-1A data. This is due to the opening of the
Mariana Trough, for which full spreading rates of 3-5 cm/year are inferred [Bibee et al.,
1980; Hussong and Uyeda, 1982; Yamazaki and Stern, 1997].
It should be noted that the IBM arc is not experiencing trench ‘roll-back’, that is, the
migration of the trench towards the ocean. The trench is moving towards Eurasia, although
a strongly extensional regime is maintained in the IBM arc system because of rapid PH-EU
convergence. The nearly vertical orientation of the subducted plate beneath southern IBM
exerts a strong “sea-anchor” force that strongly resists its lateral motion. Back-arc basin
spreading is thought to be due to the combined effects of the sea-anchor force and rapid
PH-EU convergence [Scholz and Campos, 1995].
The obliquity of convergence between PA and the IBM arc system change markedly
along the IBM arc system. Fig. 6 shows the plate convergence inferred from earthquake slip
vectors [McCaffrey, 1996]. This is nearly strike-slip in the northernmost Marianas,
adjacent to and south of the northern terminus of the Mariana Trough, where the arc has
been ‘bowed-out’ by back-arc basin opening, resulting in a trench which strikes
approximately parallel to the convergence vectors. Convergence is strongly oblique for
most of the Mariana Arc system but is more nearly orthogonal for the southernmost
Marianas and most of the Izu-Bonin segments. Fig. 6 also shows the arc-parallel slip rate
in the forearc, which reaches a maximum of 30mm/yr in the northern Marianas. According
to McCaffrey, this is fast enough to have produced geologically significant effects, such as

10
unroofing of high-grade metamorphic rocks, and provides one explanation for why the
forearc in southern IBM is tectonically more active than that in northern IBM.
5.2. Trench and Forearc Bulge
The trench and the associated forearc bulge mark where raw materials are fed into the
Subduction Factory and where the lithosphere is first bent to begin its downward trajectory.
The phenomenon of the trench is well known and will not be further discussed, other than to
note that the IBM trench is devoid of any significant sediment fill [Bellaiche, 1980].
Flexure of lithosphere about to enter a subduction zone is commonly observed just
outboard of the trench, where it is referred to as the “outer rise”. The flexural bulge rises
to about 300m above the surrounding seafloor just before the trench, and this flexure can be
used to constrain the state of stress across the convergent margin. Based on application of
an elastic-plastic model, Bodine and Watts [1979] concluded that horizontal stresses are low
across the northern Mariana Trench, intermediate across the southern Mariana and Bonin
trench segments, and high across the Izu trench segment. Vertical stress were modeled by
Harry and Ferguson [1991], who noted larger vertical stresses for the southern Marianas
than the southern Izu segment. Harry and Ferguson [1991] also concluded that the load
inducing flexure results from a narrow zone of interplate coupling located 15-20 km
arcward of the trench axis, and that the weight of the subducted slab does not contribute to
the support of the trench-outer rise bathymetry. Faulting associated with development of
the flexural bulge provides one last opportunity for fluids to be introduced deep into the
about-to-be-subducted plate. These occur as ‘stair-stepping’ normal faults which trend
parallel to the trench [Bellaiche, 1980]. Open cracks or tension fractures showing no
displacement are associated with the normal faults [Ogawa et al., 1997]. These fractures
are thought to allow seawater to penetrate deeply into mantle lithosphere, forming
serpentinites that carry substantial water into the Subduction Factory [Peacock, 2001].
5.3. Geology and Composition of the westernmost Pacific Plate
The IBM arc system now subducts mid-Jurassic to Early Cretaceous lithosphere, with
younger lithosphere in the north and older lithosphere in the south. It is not possible to
directly know the composition of subducted materials presently being processed by the
IBM Subduction Factory – what is now 130 km deep in the subduction zone entered the
trench 4 – 10 million years ago. However, the composition of the Western Pacific seafloor
- sediments, crust, and mantle lithosphere - varies sufficiently systematically that, to a first
approximation, we can understand what is now being processed by studying what now lies
on the seafloor east of the IBM trench.

11
The seafloor east of the IBM arc system can be subdivided into a northern ‘smooth’
portion and a southern ‘rough’ portion, separated by the Ogasawara Plateau (Fig. 3).
These large-scale variations mark distinct geologic histories to the north and south. The
featureless north is dominated by the Nadezhda Basin. In the south, crude alignments of
seamounts, atolls, and islands define three great, WNW-ESE trending chains [Winterer et
al., 1993]: the Marcus-Wake-Ogasawara Plateau, the Magellan Chain, and the Caroline
Islands Ridge. The first two chains formed by off-ridge volcanism during Cretaceous time,
whereas the Caroline Islands chain formed over the past 20 million years. Two important
basins lie between these chains: the Pigafetta Basin lies between the Marcus-Wake and
Magellan chains, and the East Mariana Basin lies between the Magellan and Caroline
chains.
The age of Western Pacific seafloor has been interpreted from magnetic anomalies
[Nakanishi et al., 1992] and confirmed by drilling. Three major sets of magnetic anomalies
have been identified in the area of interest [Larson and Chase, 1972]. Each of these
lineation sets comprises M-series anomalies (mid-Jurassic to mid-Cretaceous) that are
essentially Pacific Plate growth rings. These anomaly sets indicate that the small, roughly
triangular Pacific plate grew by spreading along three ridges [Bartolini and Larson, 2001].
The oldest identifiable lineations are M33 to M35 [Nakanishi, 1993] or perhaps even M38
[Handschumacher et al., 1988]. It is difficult to say how old these lineations and the older
crust might be; the oldest magnetic lineations for which ages have been assigned are M29
(157 Ma; [Channell et al., 1995]). Magnetic lineations as old as M29 are not known from
other oceans, and the area in the Western Pacific that lies inside the M29 lineation - that is,
crust older than M29 - is on the order of 3x10⁶ km2, about a third of the size of the United
States. ODP site 801 lies on crust considerably older than M29 and the MORB basement
there yields Ar-Ar ages of 167±5 Ma [Pringle, 1992]. The oldest sediments at site 801C
are Callovian or latest Bathonian (~162 Ma [Harland et al., 1990]).
Seafloor spreading in the Pacific during the Cretaceous evolved from a more E-W
'Tethyan' orientation to the modern N-S trend. This occurred during mid-Cretaceous time, a
~35-40 Ma interval characterized by a lack of magnetic reversals known as the Cretaceous
Superchron. Subsequently, the location of N-S trending spreading ridges relative to the
Pacific Basin migrated progressively to the east throughout Cretaceous and Tertiary time,
resulting in the present marked asymmetry of the Pacific, with very young seafloor in the
Eastern Pacific and very old seafloor in the Western Pacific.
Sediments being delivered to the IBM trench are about 500m thick (Fig. 7). Away
from seamounts, the pelagic sequence is dominated by chert and pelagic clay, with little
carbonate. Carbonates are important near guyots, common in the southern part of the

12
region. Interestingly, Cenozoic sediments are unimportant except for deposits of volcanic
ash adjacent to Japan and carbonate associated with the relatively shallow Caroline Ridge
and plate. Strong seafloor currents are probably responsible for this erosion or non-
deposition. The compositions of sediments being subducted beneath the northern and
southern parts of the IBM arc are significantly different, because of the Cretaceous off-
ridge volcanic succession in the south that is missing in the north. Lavas and volcaniclastics
associated with an intense episode of intraplate volcanism correspond in time closely to the
Cretaceous Superchron. Off-ridge volcanism became increasingly important approaching
the Ontong-Java Plateau. There are 100-400m thick tholeiitic sills in the East Mariana
Basin and Pigafetta Basin [Abrams et al., 1993], and at least 650m of tholeiitic flows and
sills in the Nauru Basin, near ODP Site 462 [Shipley et al., 1993]. Castillo et al. [1994]
suggest that this province may reflect the formation of a mid-Cretaceous spreading system
in the Nauru and East Mariana basins . Farther north, deposits related to this episode
consist of thick sequences of Aptian-Albian volcaniclastic turbidites shed from emerging
volcanic islands, such as preserved at DSDP site 585 and ODP sites 800 and 801. A few
hundred meters of volcaniclastic deposits probably characterizes the sedimentary succession
in and around the East Mariana and Pigafetta basins. Farther north still, at DSDP sites 196
and 307 and ODP site 1149, there is little evidence of mid-Cretaceous volcanic activity. It
appears that the Aptian-Albian volcanic episode was largely restricted to the region south of
present 20°N latitude. Paleomagnetic and plate kinematic considerations place this
extensive region of off-ridge volcanism in the present vicinity of Polynesia, a broad region
of off-ridge volcanism, shallow bathymetry, and thin lithosphere known as the 'Superswell'
[McNutt et al., 1990; Menard, 1984].
The compositions of sediments being subducted beneath the IBM arc have been
examined by various workers, most recently by Plank and Langmuir [1998]. The mean
composition for Izu-Bonin sediments may soon be superseded by data from ODP site 1149
(see Initial Reports for the Leg: http://www-odp.tamu.edu:80/publications/185_IR/185ir.htm
). Relative to MORB, both the Izu-Bonin and Mariana sediment composites show elevated
concentrations of large-ion lithophile elements Rb, Ba, Th, K, La Pb (Fig. 8). Relative to the
Global Subducting Sediment mean (GLOSS; [Plank and Langmuir, 1998]), IBM
sediments are depleted in most LIL and moderately incompatible elements, although the
sedimentary column being subducted beneath the Marianas is slightly enriched in
incompatible High Field Strength Elements (HFSE) Nb and Ta. Sediments subducted
beneath the IBM arc have significant Ce anomalies (Ce/Ce*=0.33 to 0.9; [Lin, 1992] and
high Pb/Ce (~0.2) and Th/U (2-5) but low Ba/La (10-20) and Sr/Nd (<10) [Plank and
Langmuir, 1998]). These sediments contain much heavier O and more radiogenic Sr than

13
mantle-derived lavas or those from the IBM arc system (Fig. 9A). Subducted sediments are
therefore expected to have very heavy O (δ18O = 15 - 30‰; [Stern and Ito, 1983]), although
the sedimentary section subducted beneath the Marianas should be somewhat lighter
because of the importance of Cretaceous off-ridge lavas and volcaniclastics. Western
Pacific sediments have quite radiogenic Sr and nonradiogenic Nd compared to mantle-
derived lavas, including those from Cretaceous off-ridge volcanoes now being subducted
beneath the southern IBM, and compared to those of lavas from the IBM arc system (Fig.
9B). In contrast, the Pb isotopic compositions of the sediments define a relatively tight
cluster whereas W. Pacific volcanics show a very wide range (Fig. 9C,D). IBM arc lavas
resemble the subducted volcanics on a Sr-Nd isotopic diagram but resemble the sediments
on Pb isotopic diagrams.
About 470m of oceanic crust was penetrated at 801C during Legs 129 and 185 (Fig.
6). These are typical MORB that were affected by low-temperature hydrothermal alteration.
The isotopic compositions of Sr, Nd and Pb are also typical of Pacific MORB (Fig. 9;
[Castillo et al., 1992]). This crust is overlain by a 3m thick, bright yellow hydrothermal
deposit [Alt et al., 1992] and about 60 m of alkali olivine basalt, 157.4±0.5 Ma old [Pringle,
1992], enriched in light REE and other incompatible elements.
6. GEOPHYSICS OF THE SUBDUCTED SLAB AND MANTLE
The deep structure of the IBM system has been imaged using a variety of geophysical
techniques. This section provides an overview of these data, including a discussion of
mantle structure at depths (>200 km) below the typical definition of the Subduction Factory.
Although deep structure may not seem to directly influence shallow subduction processes,
deep mantle features exert important controls on features coupled to the shallow subduction
factory, such as slab descent, slab rheology, mantle circulation, and trench migration.
6.1 Seismicity
Spatial patterns of seismicity are essential for locating and understanding the
morphology and rheology of subducting slabs, and this is particularly true for the IBM
Wadati-Benioff Zone (WBZ). Pioneering efforts [Katsumata and Sykes, 1969] outlined
the most important features of the IBM WBZ. Their study detected a zone of deep
earthquakes beneath the southern Marianas and provided some of the first constraints on
the deep, vertical nature of subducting Pacific lithosphere beneath southern IBM. They also
found a region of reduced shallow seismicity (≤70 km) and an absence of deep (≥ 300 km)
14
events beneath the Volcano Islands adjacent to the junction of the Izu-Bonin and Mariana
trenches, where the trench is nearly parallel to the convergence vector.
More recently, Engdahl et al. [1998] provided an earthquake catalog containing
improved locations (Figure 10). This data set shows that, beneath northern IBM, the dip of
the WBZ steepens smoothly from ~40° to ~80° southwards, and seismicity diminishes
between depths of ~150 km and ~300 km (Figures 11a-c). The subducted slab beneath
central IBM (near 25°N; Fig. 11c) is delineated by reduced seismic activity that nevertheless
defines a more vertical orientation that persists southward (Figures 11d-f).
Deep earthquakes, here defined as seismic events ≥300 km deep, are common beneath
parts of the IBM arc system (Figures 10, 11). Deep events in the IBM system are less
frequent than for most other subduction zones with deep seismicity, such as
Tonga/Fiji/Kermadec and South America. Beneath northern IBM, deep seismicity extends
southward to ~27.5°N, and a small pocket of events between 275 km and 325 km depth
exists at ~22°N. There is narrow band of deep earthquakes beneath southern IBM between
~21°N and ~17°N, but south of this there are extremely few deep events. Although early
studies assumed that seismicity demarcated the upper boundary of the slab, more recent
evidence has shown that many of these earthquakes occur within the slab. For instance, a
study by Nakamura et al. [1998] showed that a region of events beneath northernmost IBM
region occur ~20 km beneath the top of the subducting plate. They propose that
transformational faulting, which occurs when metastable olivine changes to a more compact
spinel structure, produces this zone of seismicity. Indeed, the faulting mechanism for deep
earthquakes is a hotly debated topic (e.g., [Green and Houston, 1995]), and has yet to be
resolved.
Double seismic zones (DSZs) have been detected in several parts of the IBM
subduction zone, but their locations within the slab as well as interpretations for their
existence vary dramatically. Beneath southern IBM, Samowitz and Forsyth [1981] found a
DSZ lying 80 km and 120 km deep, with the two zones separated by 30-35 km. Earthquake
focal mechanisms indicate that the upper zone, where most events occur, is in downdip
compression, while the lower zone is in downdip extension. This DSZ is located at a depth
where the curvature of slab is greatest; at greater depths it unbends into a more planar
donfiguration. Samowitz and Forsyth [1981] suggested that unbending or thermal stresses
in the upper 150 km of the slab may the primary cause of the seismicity. For northern
IBM, Iidaka and Furukawa [1994] used a refined earthquake relocation scheme to detect a
DSZ between depths of 300 km and 400 km, which also has a spacing of 30-35 km
between the upper and lower zones. They interpreted data from S-to-P converted phases
and thermal modeling to propose that the DSZ results from transformational faulting of a

15
metastable olivine wedge in the slab. Recent work suggests that compositional variations in
the subducting slab may also contribute to double seismic zone [Abers, 1996], or that DSZs
represent the locus of serpentine dehydration in the slab [Peacock, 2001].
6.2 Seismic Anisotropy and Mantle Flow
For nearly two decades, seismic anisotropy in the form of shear wave splitting has been
used to examine deformation in subduction zones worldwide [Ando et al., 1983; Fouch and
Fischer, 1996; Peyton et al., 2001]. Two principal goals of mapping seismic anisotropy are
a) to determine the history of strain and deformation in the mantle, and b) to evaluate
coupling between lithosphere and asthenosphere. The distribution of seismicity in most
subduction zones provides an ideal opportunity to examine the lateral and depth distribution
of subducting and overriding plate fabric, mantle flow, and possible slab-mantle coupling.
Evaluation of shear wave splitting in phases such as S and SKS are routinely performed
for most regions using standard data analysis techniques [Silver and Chan, 1991]. These
measurements produce two independent pieces of information: the azimuth of propagation
of the faster wave (the fast direction) and the delay between the fast and slow phases (the
splitting time). The primary assumption is that olivine, the principal component of the upper
mantle, is responsible for the splitting, and that the fast direction (a-axis of olivine) is
aligned with either the flow direction or the direction of maximum extension [Ribe, 1989;
Zhang and Karato, 1995] in the upper 200-400 km of the mantle, where dislocation creep
is the dominant deformation mechanism. The magnitude of the splitting time corresponds
to a tradeoff between the coherence of olivine alignment and the thickness of the layer
characterized by aligned olivine.
Studies of seismic anisotropy near the IBM system have allowed workers to examine
the distribution of strain in the mantle wedge and the subducting slab [Fouch and Fischer,
1996; Fouch and Fischer, 1998; Xie, 1992]. Fouch and Fischer [1996] evaluated shear
wave splitting from several local events that traversed the northern IBM subduction zone
and found fast directions of NW-SE to WNW-ESE (i.e., roughly convergence-parallel) and
splitting times of ~0.5 s. These splitting values for local events are comparable to
observations for most convergnet margins. The geometry of ray paths did not allow a
determination of the relative contributions of anisotropy from the slab, mantle wedge, and
overriding plate; however, most of the ray paths sample mantle wedge structure. Modeling
of the splitting data indicated that anisotropy may exist to depths no greater than ~410 km.
These results indicate a relatively small strength of anisotropy, and are consistent with a
model in which induced flow in the back-arc wedge is the primary cause of anisotropy
beneath Izu-Bonin (Figure 12).

16
Xie [1992] and Fouch and Fischer [1998] examined mantle anisotropy in the southern
IBM subduction zone. Using short-period waveforms and a qualitative analysis technique,
Xie [1992] determined E-W fast directions and splitting times of ≤0.35 s beneath Guam.
Fouch and Fischer [1998] utilized broadband waveforms and a more accurate method of
waveform analysis, and found ~NW-SE fast directions and splitting times ranging from
0.1 s to 0.4 s. The steep dip of the Marianas slab creates difficulties in deciding whether the
anisotropy lies within the slab, mantle wedge, or both, but the use of broadband data
facilitated the analysis of frequency dependence in fast directions. Modeling of these data
suggested that a combination of fossil anisotropy in the subducting slab, slab-induced flow
in the back-arc wedge, and anisotropy possibly due to back-arc extension in the overriding
plate contribute to the shear wave splitting (Figure 12).
6.3 Slab Morphology and Lower Mantle Penetration
Although first-order slab characteristics can be constrained using earthquake locations
(section 6.1), more detailed information regarding lateral and vertical variations in slab
morphology is required for a complete analysis of the Subduction Factory. Additionally,
the depth to which subducting slabs penetrate is fundamental for determining the nature of
mantle convection in the earth, as it helps constrain details of mass and heat exchange
between the upper and lower mantle [Anderson, 1989; Silver et al., 1988]. Using a variety
of analysis techniques, several studies have focused on the IBM system as an end-member
example of the large variations in deep seismic structure found worldwide. Most of these
studies conclude that the slab beneath northern IBM stagnates near the upper-lower mantle
boundary (~660 km depth; Figure 12). In contrast, the slab beneath southern and central
IBM descends steeply through the upper mantle, and appears to penetrate into the lower
mantle.
Residual sphere images of the southern IBM subduction zone Creager and Jordan,
[1986] provided some of the first conclusive evidence of slab penetration into the lower
mantle. These images showed that the slab beneath southern IBM penetrates to depths of
900-1000 km, which can be explained solely by thermal effects [Fischer et al., 1988].
Waveform modeling [Brudzinski et al., 1997] indicates that a horizontal high-velocity
feature near 660 km depth exists beneath the northern IBM arc, consistent with the
hypothesis that cold, seismically fast slab material rests on top of the upper-lower mantle
boundary here. Castle and Creager [1999] used a migration method to detect scatterers at
~1000 km depth beneath the central IBM arc, which they interpreted to be produced by
subducted crust.

17
In the past decade, high-resolution images provided by travel-time tomography have
provided unambiguous evidence that fundamental differences in morphology and lower
mantle penetration exist for the subducted slabs beneath northern and southern IBM. The
first of these images was produced by Van der Hilst et al. [1991], who showed that the slab
beneath northern IBM deflects at the upper-lower mantle boundary near 660 km, while the
slab beneath southern IBM descends through the boundary into the lower mantle (Figure
12). These results have been confirmed by Fukao et al. [1992] using slightly different data
analysis and inversion techniques. Van der Hilst and Seno [1993] suggest that the
differences in slab penetration may be due to the rate of trench migration: the Izu-Bonin
trench appears to have migrated northwestward, while the Mariana trench appears to have
remained stationary. In addition, Widiyantoro et al. [1999] used P- and S-wave data to
show that the rigidity of the subducting slab beneath southern IBM is highly variable.
Bulk-sound (a combination of P- and S-wave velocity) images beneath northern IBM show
a clear spreading of fast-velocity material along the upper-lower mantle discontinuity, while
the shear-wave images do not reveal such a layer. In contrast, both bulk-sound and shear-
wave images of the southern IBM region clearly show that fast-velocity material penetrates
into the lower mantle. The tomography results of Widiyantoro et al. [1999] for northern
IBM are somewhat surprising given the implications of recent work by Takenaka et al.
[1999], which suggest that shear-wave anomalies due to temperature variations should be
more easily detected than bulk sound anomalies. However, Widiyantoro et al. [1999]
suggest that rheological variations within slabs may help determine whether or not these are
able to penetrate the 660-km discontinuity, and that temperature and compositional
variations may not be the only explanation for the seismic results.
6.4 Upper Mantle Structure
Analysis of seismic discontinuities in the mantle transition zone between depths 410 km
and 660 km (hereafter referred to as the “410” and the “660”) provide important
constraints on the thermal, chemical, and rheological properties of subducting slabs.
Additionally, constraints on the depth of the “660” help resolve the extent of slab
penetration into the lower mantle. In general, these discontinuities are believed to be due to
mineralogical phase changes in olivine due to variations in pressure and temperature. The
410 discontinuity marks the exothermic olivine--β-spinel (wadsleyite) transformation and
the 660 km discontinuity marks the endothermic γ-spinel (ringwoodite) -–perovskite +
magnesiowüstite structural transformation [Lay, 1994]. Near subduction zones, several
studies have shown that upper mantle discontinuities are generally anticorrelated, with the

18
observation of an elevated “410” and a depressed “660”. These observations suggest that
thermal anomalies due to subducting slab material are responsible for topography on the
upper mantle discontinuities.
Studies of the transition zone beneath the IBM system corroborate the tomographic and
other seismic results discussed in section 4.3. In general, global studies exhibit a thickened
transition zone and/or a depressed “660” near the IBM system [Flanagan and Shearer,
1998; Gu et al., 1998; Revenaugh and Jordan, 1991; Shearer and Masters, 1992; Vidale
and Benz, 1992], consistent with a slab-induced thermal anomaly. Detailed studies targeting
the northern IBM region have yielded results similar to the global studies. Collier and
Helffrich [1997] utilized data from several seismic networks to show that the transition zone
in this region may be thickened by as much as 100 km, corroborating the results of
Revenaugh and Jordan [1991] and Shearer [1993]. Work by Castle and Creager [1998]
showed that the “660” beneath northern IBM mimics the high-resolution tomographic
results. The discontinuity is depressed westward from the trench, again suggesting that the
slab lies flat on the upper-lower mantle boundary. Beneath central IBM the depressed
portion of the “660” is narrow, again suggesting penetration of slab material into the lower
mantle. Other studies focusing on the “660” - beneath northern IBM have shown a similar
range of depressions of the discontinuity, between 30 km and 80 km [Tajima and Grand,
1998; Wicks and Richards, 1993], but these studies do not possess the lateral resolution to
further illuminate details of slab penetration.
For the subduction zone beneath southern IBM, the nonideal geometry of the vertical
slab and existing seismic networks unfortunately hinders a detailed study of upper mantle
discontinuities. As the advent of transportable broadband seismic systems significantly
increases our ability to record seismic data around the planet, future work utilizing dense
seismic arrays should help elucidate detailed mantle structure around the IBM system.
7. IBM SUBDUCTION FACTORY OUTPUTS
Outputs from the Subduction Factory are found as low-temperature fluids released in
the forearc and as melts erupted and emplaced along the magmatic front of the arc, in arc
cross-chain volcanoes, and in back-arc basin rifts and spreading centers. These outputs
define the width of the IBM Subduction Factory, which reaches a maximum of ~300km at
18°N. In the following sections, we focus on the outputs of the IBM Subduction Factory.
We first present what we know about the crustal structure of the IBM arc system, then
focus on fluid outputs from the forearc before describing melts from along the magmatic
front, cross chain volcanoes, and back-arc basin rifts and spreading systems.
19
7.1 IBM Crustal Structure
In 1992, Japanese scientists performed an ambitious wide-angle OBS experiment at
32°15’N [Suyehiro et al., 1996; Takahashi et al., 1998](Figure 13A). This defined a
relatively thin (c. 20 km) arc crust, that may be simplistically viewed as composed of four
layers of approximately equal thickness. The upper layer with Vp=1.5-5.8 km/s represents
sediments and volcanics and overlies a middle-crustal layer with Vp=6.2±0.2 km/s. The
lower crust has an upper half with Vp=6.6-7.2 km/s (presumably mafic plutonics) overlying
a layer with Vp=7.3±0.1 km/s. The 6.2 km/s and the 7.3 km/slayers have excited most
comment because layers of these velocities are not prominent in seismic data from other
intra-oceanic arcs.
The presence of the 6.2 km/s layer is exciting because this velocity corresponds to a
wide range of intermediate-composition plutonic rocks and is close to the mean velocity of
the continental crust (6.4 km/s) [Christensen and Mooney, 1995], thereby suggesting that
continental crust can be directly created in an IOCM. Insight into the lithology of the IBM
middle crust is provided by exposures in the Izu Collision Zone (Section 7.6). Dredges
from fault scarps bounding the rifted eastern edge of the Palau-Kyushu Ridge (Figure 1)
(arc crust rifted from the IBM by formation of the Shikoku and Parece-Vela basins) at
30°N also reveal extensive submarine exposures of tonalite [Taira et al., 1998]. Similar
silicic rocks were dredged by P. Fryer (pers. comm., 2000) from major fault scarps in the
Mariana forearc southeast of Guam. Given these exposures, Taira et al. [1998] interpret
the 6.0-6.4 km/sec layer to be tonalitic. A similar 6 km/sec layer was also found in the IBM
arc near 31°30’N & 33°N by Hino [1991] and in the northern Palau-Kyushu Ridge,
suggesting its regional presence in at least the northern part of IBM system [Taira et al.,
1998].
Velocities > 7.2 km/s, at < 20 km depth in an active arc where velocities are reduced by
the high lower-crustal temperatures, are best interpreted as mafic eclogites, pyroxenites or
dunites [Christensen and Mooney, 1995], or some mixture of mafic and ultramafic
cumulates as exposed in the roots of some arc complexes [Burns, 1995] or partially molten
ultramafic rocks. In the forearc, these same velocities may correspond to variably-
serpentinized upper mantle.
Although Suyehiro et al. [1996] provide the best cross-section yet of IBM arc crust,
important geologic differences along-strike make it questionable whether this structure can
be extrapolated to the crust of southern IBM. A German OBS study across the Mariana
arc-backarc at 15°N Lange [1992] provides a crude velocity model and a crustal thickness
of only 16 km (Figure 13b). It is intriguing that neither the 6.2 km/sec nor the 7.3 km/sec
layers seen at 32°15’N were detected beneath the Marianas. This section broadly agrees

20
with earlier sonobuoy measurements at 18°N [LaTraille and Hussong, 1980] but gravity
data have been used to infer a ≥20-km thick crust [Sager, 1980]. This leaves open the
question of whether a deeper mafic layer might be present but not recognized because of
limited penetration of these seismic experiments. Recognition of high-velocity lower-crustal
layers is a particular problem for older surveys in which only first-arrival times were
modeled [Hyndman and Klemperer, 1989]. Even in modern surveys, the lower-crustal
velocity and thickness of such layers can be hard to constrain tightly [Suyehiro et al., 1996;
Takahashi et al., 1998]. However, comparison with other oceanic arcs [Fliedner and
Klemperer, 1999, 2000; Holbrook et al., 1999](Figure 13C) suggests that very fast (7.3
km/sec) layers are not ubiquitous. Layers with similar velocities are known from the lower
crust of rift provinces [Christensen and Mooney, 1995] and it is possible that the high
velocities observed for the IBM lower crust could represent mafic/ultramafic underplating
related to the active rifting in the Izu-Bonin segment of the arc [Klaus et al., 1992], rather
than to arc magmatism. Layers in the upper and middle crust are easier to recognize than
those in the lower crust, so it seems very likely that, if a similar 5-km-thick 6.2 km/s layer
was present, it would have been detected by the seismic experiments in all three regions
(Figure 13), suggesting that this layer in particular may be restricted to the northern part of
the IBM chain.
The crustal structure of the IBM arc at 32°15’N is well enough known that Taira et
al. [1998] were able to calculate a mean crustal composition of 56% SiO2, and a mean
crustal growth rate of 80 km3/km/Ma. This calculation required interpreting which parts of
the seismically-defined arc crust are pre-existing oceanic crust, or back-arc basin crust, or
(in the forearc) hydrated mantle. As discussed previously, important uncertainties remain in
extrapolating these results along the full length of the IBM system. Until a new generation
of multi-scale seismic experiments is undertaken, we can only approximate the composition
and volume of the arc as the most voluminous output of the Subduction Factory.
The Mariana Trough back-arc basin has a crustal structure that is similar to normal
oceanic crust. Three independent efforts in the late 1970s used seismic refraction to
examine the structure of Mariana Trough crust at 18°N. Bibee et al. [1980] examined
crustal structure within 50 km of the ridge, in the region underlain by new oceanic crust.
Another study [LaTraille and Hussong, 1980] examined regional crustal structure, from
the W. Mariana Ridge across the Mariana Trench and eastward onto the Pacific Plate. The
first study concluded that the crust was 5 to 7 km thick, with a velocity structure typical of
other slow-spreading ridges. Seismically slow mantle was not found beneath the spreading
axis. In contrast, the study of LaTraille and Hussong [1980] only imaged the Moho in the
western part of the Mariana Trough, more than 80 km away from the spreading axis and

21
beneath the region underlain by rifted arc crust. They concluded that the crust was about 6
km thick in the westernmost Trough and thinned towards the spreading axis. They also
noted that the crust was extremely heterogeneous and that it was associated with low-
velocity upper layers similar to those found on very young crust of other slow-spreading
ridges. These two results are thus somewhat contradictory.
The third refraction study focused on the structure of the Pagan Fracture Zone, near
18°N. This study used 6 ocean-bottom seismometers to generate two orthogonal refraction
crustal profiles, with one line parallel and one normal to the ridge axis [Sinton and Hussong,
1983]. They found that the crust along the spreading ridge away from the fracture zone is
between 4 and 6 km thick, while the crust beneath the fracture zone is 1 to 2 km thinner.
They also found a thick section of mid- to lower crust with P-wave velocities of 6.6 to 6
km/sec, similar to that of normal oceanic crust. The results of Sinton and Hussong [1983]
also suggest that slower mantle underlies the region east of the spreading ridge relative to
that in the west (Vp = 7.5 vs. 8.0 km/sec).
Mariana Trough crust thickens north of 21°N. Gravity data were interpreted by
Ishihara and Yamazaki [1991] to indicate that the crust thickens from 6 to 9 km near
21°20'N (Region III, Fig. 14A&C) to about 15 km near 23°30' to 24°N (Region I, Fig.
14A&C). This is also the part of the Mariana Trough where the extension axis shoals from
about 3.5 km depth to about 2.0 km depth. Recovery of mantle peridotite from deep graben
near 20°N [Stern et al., 1996] shows that the crust is thin at least this far north, and the fact
that the extension axis shoals north from this point also suggest crustal thickening to the
north.
7.2 The Forearc
The IBM forearc is about 200 km wide and differs from many other forearcs by not
having an accretionary prism. This is because IBM is isolated from continent-derived
sediments. In addition, because the supply of sediments to the IBM forearc is limited to
pelagic ‘rain’ and volcaniclastics shed from the volcanic arc, the infrastructure of especially
the outer forearc is not deeply buried. The relatively naked IBM forearc provides unique
opportunities to sample the rocks that formed when subduction began, to track the evolution
of Subduction Factory products, and to examine fluids squeezed and sweated out of the
downgoing slab.
There are important differences along the IBM forearc which reflect its evolution and
relative tectonic stability. The threefold subdivision proposed for the IBM arc system in
Section 2 provides a useful subdivision for the forearc region as well. The Izu section has
no well-developed frontal arc ridge comparable to those of the Bonin and Mariana segments
22
(Fig. 4). The long stability of the Izu forearc is demonstrated by several well-developed
submarine canyons up to 150 km long across the forearc which began to form in early
Miocene time [Klaus and Taylor, 1991]. The few conical features near the trench that are
likely to be serpentine mud volcanoes are covered with pelagic sediments and seem to be
inactive, for example Torishima seamount drilled during ODP Leg 125. The Bonin forearc
is characterized by a well-developed forearc basin (Bonin Trough), which formed as a result
of Oligocene rifting [Taylor, 1992]. The forearc basin becomes progressively more filled
or poorly developed away from the Bonin segment, and the free-air gravity expression of
the Bonin Trough becomes muted [Honza and Tamaki, 1985]. The Bonin Ridge is capped
by the Bonin or Ogasawara islands and is associated with one of the highest free-air gravity
anomalies on Earth (up to 360 mGal) [Honza and Tamaki, 1985].
Dredging of the IBM inner trench wall has recovered mostly igneous rocks, including
peridotites, boninites, and arc tholeiites [Bloomer, 1983; Bloomer and Hawkins, 1987; Ishii,
1985; Tararin et al., 1987]. Similar sequences of boninite and arc tholeiite were penetrated
during DSDP and ODP drilling [Hickey and Frey, 1982; Pearce et al., 1992]. These rocks
are interpreted as forming during the initial stages in the development of the IBM
subduction zone during Eocene time [Stern and Bloomer, 1992]. There is also evidence
that pre-Eocene rocks make up a small portion of the forearc basement, including Pacific
MORB crust [DeBari et al., 1999] and accreted Cretaceous seamounts and pelagic
sediments [Bloomer and Hawkins, 1983; Johnson et al., 1991].
The frontal arc islands of the southern Marianas (Guam, Saipan, etc.) and the Bonin
Islands (Chichijima, Hahajima, etc.) provide an opportunity to study forearc evolution in
detail. The igneous basement of these islands show the same sorts of tholeiitic/boninitic
igneous basement as that found in the submerged forearc [Hickey-Vargas and Reagan,
1987; Reagan and Meijer, 1984; Taylor et al., 1994; Umino, 1985], although the island
sequences also have abundant low-K rhyodacites [Meijer, 1983; Taylor et al., 1994]. The
northern Bonin Islands are dominated by boninite series volcanics whereas the southern
Bonin Islands consist of tholeiite and calc-alkaline lavas [Taylor et al., 1994], demonstrating
an intermingling of magma types similar to that observed downhole in DSDP Site 458. The
Eocene volcanic sequences in the Bonin Islands are overlain by shallow water limestones of
Oligocene-Early Miocene age [Taylor et al., 1994]. Mariana frontal arc islands have a more
complete record of the interplay between sealevel and tectonics in a well-developed sequence
of reefal limestones of Oligocene to Holocene age [Cloud et al., 1956; Tracey et al., 1964].
The Balanos volcanic member of mid-Miocene age (13.5 Ma) on Guam [Meijer et al.,
1983] is part of a thicker sequence of volcanic and sedimentary rocks known as the Umatac
Formation, which is the on-land equivalent of the thick Miocene ash blanket drilled at

23
DSDP Site 60 and corresponds to the mid-Miocene magmatic maximum identified by Lee
et al. [1995]
The Mariana forearc is tectonically unstable, reflecting the combined effects of
stretching parallel to it due to being ‘bowed-out’ by back-arc extension and because of
oblique convergence (Fig. 6; [McCaffrey, 1996; Stern and Smoot, 1998]). A detailed survey
of the inner forearc near 22°N [Wessel et al., 1994] confirmed that the northern Mariana
forearc is dominated by sinistral shear [McCaffrey, 1996]. This tectonic instability is an
important reason why the Mariana forearc has no identifiable submarine canyons and is
also the main reason why fluids and serpentinized mantle rise to the surface at several places
here. Because an important motivation for selecting IBM as a MARGINS focus area was
that this is the only place known where we can sample fluids released at shallow depth from
a subduction zone, we concentrate in the following discussion on the Mariana forearc (Fig.
15).
The Mariana forearc is characterized by relatively smooth seafloor in the western 2/3
of the forearc and rugged seafloor in the eastern 1/3. The inner, smooth forearc slopes
gently eastwards and lies mostly 3 to 4 km below sealevel, reflecting deposition of distal
volcaniclastic turbidites, ash, and pelagic sediments. In contrast, the outer, rugged forearc
has a mountainous local relief of over 2 km. Rough and smooth forearc sectors correspond
to the eastern and western structural provinces of Mrozowski and Hayes [1980]. The
western structural province is typified by a thick sequence of well-stratified, relatively
undeformed sediments above an eastward-shoaling basement reflector, comprising a forearc
basin. This basin is over 3km thick in the flexural moat east of the active volcanic arc
[Mrozowski and Hayes, 1980] and is filled with relatively undeformed sediments as old as
latest Eocene or early Oligocene [Hussong and Uyeda, 1982]. A basaltic sill of Late
Miocene or younger age was penetrated at ODP site 781A, near Conical Seamount (Fig.
15,16) [Marlow et al., 1992], and forearc volcanic flows and intrusions likely comprise a
minor part of the Mariana forearc basin sequence. Although the Mariana forearc basin is
structurally much simpler than the rugged region to the east, it is cut by numerous high-
angle normal faults that parallel the arc and trench, with surface offsets that range from 10 to
250m. Intersection of acoustic basement with the seafloor defines the eastern limit of the
forearc basin and the boundary between the western and eastern structural provinces.
The IBM forearc has been drilled during DSDP Legs 6 and 60 and ODP legs 125,
126, and 195 (Fig. 15 & 16). DSDP Site 60 penetrated 350 m without reaching basement,
with the interval from 50-350m consisting of Miocene ash [Party, 1971]. DSDP Leg 60
drilled four holes in the forearc. Site 458 penetrated almost 500m, with the upper half
consisting pelagic sediments and ashes reaching back to the early Oligocene and the lower
24
half consisting of pillowed tholeiites and boninites of probable Eocene age [Party, 1982a].
Site 459 penetrated almost 700m, with the upper 560 m consisting of pelagic sediments and
ash beds as old as middle Eocene, underlain by pillowed tholeiites of middle Eocene and
older age [Party, 1982b]. Site 460/460A penetrated about 100m of Pleistocene
diatomaceous ooze, Oligo-Miocene conglomerates, and vitric muds of Eocene to Oligocene
age. Site 461, near the trench axis, penetrated 21m of Quaternary conglomerate. ODP sites
779 – 781 were all drilled within 15 km of the summit of Conical Seamount (Fig.16). ODP
site 1200 penetrated 200m into the South Chamorro mud volcano and installed a borehole
geophysical observatory. In addition to these sites in the Mariana forearc, ODP sites 782
–793 were drilled near 31-32°N in the northern IBM forearc.
The rugged, outer Mariana forearc contains several serpentinite mudvolcanoes, some
of which are active (Fig. 15). Conical Seamount is a good representative of these. This
edifice is 10-15 km in diameter and 1500m tall (Fig. 16). Young flows mantle its flanks
and extend as far as 18 km from the summit area [Fryer et al., 1990a]. The youngest flows
are light green, have contorted surfaces, and are not covered with pelagic sediments. They
contain numerous cobbles and boulders, mostly of serpentinized peridotites and dunites,
with small amounts of metabasalt and metagabbro. Vent chimneys composed of carbonate
(aragonite and calcite) and hydrated Mg-silicate are found near the summit region (Fig. 16).
The carbonate chimneys and concretions are unusual in being composed of aragonite well
below the aragonite compensation depth in this region (~400m). Haggerty [1991]
concluded that these carbonates were not precipitated in equilibrium with seawater;
furthermore, isotopically light C indicated equilibrium with methane. Compared to ambient
seawater, fluids emanating from vents in the summit area are slightly cooler (0.03°C) and
have higher pH (9.3 vs. 7.7) and alkalinity (5.5 vs. 2.4 meq/L). The vent waters are
enriched in methane (1000 vs. 2.1 nM), silica (0.75 vs. 0.12 mM), and H2S (2.1 mM vs.
none detected) [Fryer et al., 1990a]. A biogenic origin for the methane enrichments was
discounted by Fryer et al. [1990a] because of the lack of a sedimentary substrate where
bacteria could thrive, but the possible role of a deep biosphere was not considered at that
time.
ODP Leg 125 drilled four holes in and around Conical Seamount (Fig. 16). Sites on
Conical Seamount recovered cores of unconsolidated serpentine mud matrix containing
aragonite needles and blocks of mafic and ultramafic lithologies [Fryer, 1992]. Pore waters
from Site 780 (summit of Conical Seamount) are some of the most unusual ever sampled in
oceanic sediments, containing less than half of the chloride and bromide concentrations of
seawater, pH up to 12.6, and contain methane up to 37mmol/kg along with ethane and
propane [Mottl, 1992]. Relative to seawater, these fluids are enriched in alkalinity (x26),

25
sulfate (x1.7), K (x1.5), Rb (x5.6) and B (x10) and are depleted in Li, Mg, Ca, and Sr.
Although low in Na, these pore waters have Na/Cl ratios about twice that in seawater. Sr
isotopic compositions of pore waters are significantly less radiogenic than seawater and
become less radiogenic downcore [Haggerty and Chaudhuri, 1992]. Some aspects of the
fluids can be explained as a result of interaction with peridotite. However, the decrease in
chlorinity of the pore fluid at site 780D is greater than observed in pore fluids from any
other convergent margin. Mottl [1992] concluded that the fluids at Conical Seamount
originated from the downgoing slab, 30 km beneath the seafloor, and agreed with Sakai et
al. [1990] that this water was also responsible for serpentinizing the overlying mantle
wedge.
Ultramafic blocks encountered in the serpentine mud are largely serpentinized but
often preserve original igneous minerals such that their original nature can be inferred.
Refractory peridotites dominate (mostly harzburgite, minor dunite) [Ishii et al., 1992].
Orthopyroxene and olivine have Mg# ~ 92. Spinels in the harzburgite are generally more
Cr-rich than those found in MORB-type abyssal peridotites [Dick and Bullen, 1984],
indicating that these are residues left after extensive melting. These peridotites are similar to
those recovered from the Mariana inner trench wall. Parkinson and Pearce [1998]
interprets the trace element signature of Conical Seamount harzburgites as residual MORB
mantle (15-20% fractional melting) subsequently modified by interaction with boninitic
melt. Intriguingly, recent Os isotopic data give a mixture of modern and ~1Ga model ages
for both Conical and Torishima seamount harzburgites [Parkinson et al., 1998].
Mafic crustal blocks are about 10% as common as peridotite blocks in ODP cores
drilled at Conical Seamount [Johnson, 1992]. Basalt compositions have both arc- and
MORB- affinities. Metamorphism in most samples ranges from low-T zeolite to lower
greenschist facies. At site 778A, Maekawa et al. [1993] documented clasts containing
blueschist-facies mineralogy (lawsonite, aragonite, sodic pyroxene, and blue amphibole) and
used these to estimate metamorphic conditions of 150-250°C and 5-6 kbar. This is the first
direct link documented between an active subduction zone and blueschist-facies
metamorphism.
It is not clear what routes solids and fluids follow upward to feed the mud volcanoes.
Some authors infer diapiric upwelling [Phipps and Ballotti, 1990], whereas others infer that
ascent is localized along fault intersections [Fryer, 1996a]. Regardless, the serpentine muds
are weak plastic materials, with low density and strengths which are easily mobilized
[Phipps and Ballotti, 1990]. These authors also noted that, although these muds can
transport blocks of serpentinized peridotite as large as 20m upward, such blocks would sink
unless the mud continues to well up. Fluids appear to be upwelling faster than a few mm/yr

26
[Mottl, 1992]. The identification of slab-derived fluids and solids requires that ascent paths
must reach down to the slab itself.
Recent attention has been focused on South Chamorro seamount, the southernmost of
IBM serpentine mud volcanoes (Fig. 15). This is the site of active venting, which supports
a vigorous biological community of mussels, snails, tube worms, and crabs, that is far richer
than the Conical Seamount community [Fryer and Mottl, 1997]. The muds are dominantly
serpentine but also contain blue, sodic amphiboles (crossite), jadeite, and hydrated garnet.
This is also the ‘southern forearc seamount’ where Haggerty [1991] reported extremely
light C and interpreted this as indicating equilibrium with organic methane.
Recent samplings of fluids from serpentine mud volcanoes built at different heights
above the subduction zone suggest that systematic variations in fluid chemistry can be
identified. These are interpreted to manifest progressive decarbonation reactions in the
downgoing slab [Fryer et al., 1999]. Pacman Seamount, situated ~15km above the
subduction interface, vents fluids with low alkalinity and is associated with brucite
chimneys, whereas vent fields on S. Chamorro (~ 20km above the subduction interface) and
Conical seamounts (~25 km above the subduction interface) issue fluids with much higher
alkalinity and have chimneys of carbonate and silicates. Fryer et al. [1999] infer from this
relationship that important decarbonation reactions happen in the slab when the subduction
interface above it lies at 15-20 km depth.
7.3 The Magmatic Front
The magmatic front lies at a depth of about 150 km above the Wadati-Benioff zone,
with no systematic differences along the IBM arc system. Estimates of magmatic
production rates vary widely, largely because these are based on different models. Looking
just at volcanics, Sample and Karig [1982] estimated a production rate of 12.4 km3/Ma/km
for the Mariana segment. Plutonic equivalents and cumulates need to be included to obtain
a magmatic production rate, but the ratio of intrusive to extrusive igneous products is poorly
constrained. This uncertainty is shown by differing estimates of crustal growth rates of 70-
80 km3/Ma per km of arc estimated for the northern IBM arc [Taira et al., 1998] and 30
km3/Ma per km of arc estimated for Phanerozoic arcs [Reymer and Schubert, 1984].
Resolving the magmatic addition rate to the IBM arc is a critical constraint needed to
understand IBM Subduction Factory processes.
Both submarine and subaerial volcanoes define the IBM magmatic front (Fig. 2). On
this basis, the Mariana segment has been subdivided into Northern Seamount Province,
Central Island Province, and Southern Seamount Province [Bloomer et al., 1989b]. It is still
not clear where the southern IBM magmatic arc ends [Martinez et al., 2000]. Photographs

27
of individual subaerial volcanoes of the IBM arc can be seen on-line at Volcano World (Izu
islands: http://volcano.und.nodak.edu/vwdocs/volc_images/north_asia/Izu-Volcanic-
Islands/IZU1.html ; Iwo Jima:
http://volcano.und.nodak.edu/vwdocs/volc_images/north_asia/iwo-jima.html ; Mariana
islands:
http://volcano.und.nodak.edu/vwdocs/volc_images/southeast_asia/mariana/basic_geology.ht
ml ).
One problem in studying IBM (and other) arc lavas is that these are predominantly
porphyritic so that bulk compositions generally do not correspond to magmatic liquids.
Such samples should not be studied using the techniques routinely used for studying
aphyric or glassy samples, which are appropriate for studying backarc basin basalts (BAB).
Accumulation of plagioclase phenocrysts in particular has led to a misperception that mafic
members are dominantly high-Al basalts when in fact aphyric samples or glass inclusions in
phenocrysts are tholeiites [Jackson, 1993; Lee and Stern, 1998]. Primitive compositions
(Mg#>65) are uncommon among IBM arc lavas, so fractionation conditions and history
need to be resolved.
A related issue that awaits resolution is the abundance of felsic material in the IBM
arc. Like all IOCM, IBM is commonly thought to have a basaltic bulk composition, but
recent evidence from geophysics [Suyehiro et al., 1996], exposures in the IBM collision
zone [Kawate and Arima, 1998], glass inclusions in phenocrysts [Lee and Stern, 1998], the
abundance of felsic tephra in DSDP cores [Lee et al., 1995], and the presence of submarine
silicic calderas in the Izu segment [Iizasa et al., 1999] indicates that felsic rocks are a more
important part of the IBM arc system than previously thought.
7.3.1 The Elemental Abundances
A key element for understanding operation of the IBM Subduction Factory is
knowing the typical compositions and regional variability in magma compositions along the
magmatic front of the IBM arc. An EXCEL spreadsheet was constructed for 42 volcanoes
from along the magmatic front of the IBM arc system, from Oshima (34.73°N) to an
unnamed seamount west of Rota (14.33°N). This compilation is not exhaustive; instead
data were entered for samples which contained information considered to be especially
important, such as high-quality data for REE, HFSE abundances (Y, Zr, Nb, Ta), or isotope
data (B, Li, Be, O, Sr, Nd, Pb, Hf). Data were assembled from the literature [Bloomer et al.,
1989a; Dixon and Stern, 1983; Eiler et al., 2000; Elliott et al., 1997; Hamuro et al., ;
Hochstaedter et al., 2001; Ishikawa and Nakamura, 1994; Ishikawa and Tera, 1999; Lin et
al., 1989; Lin et al., 1990; Morimoto and Ossaka, 1970; Notsu et al., 1983; Pearce et al.,
1999; Stern and Bibee, 1984; Stern et al., 1989; Stern et al., 1993; Stern et al., 1984; Sun

28
and Stern, 2001; Sun et al., 1998a; Sun et al., 1998b; Taylor and Nesbitt, 1998; White and
Patchett, 1984; Woodhead, 1989; Yuasa and Nohara, 1992; Yuasa and Tamaki, 1982].
Means were calculated for each of these volcanoes (volcano means) despite big differences
in the number of samples from which means are calculated, from a minimum of 1 to a
maximum of 20. Means for the entire IBM system assume equal weighting for each
volcano mean. These means are the basis for the following overview.
IBM lavas from along the magmatic front of the arc show a wide range of
compositions. For example, volcano means plot in the low-K, medium-K, high-K, and
shoshonitic fields on potassium-silica diagrams (Fig. 17). Low-K suites characterize the Izu
and most of the Bonin segment (as far south as 25°N), a medium-K suite typifies most of
the Mariana segment (as far north as 23°N), and a largely shoshonitic province is found
between the Bonin and Mariana segments. This subdivision will be used in subsequent
discussions of along-arc compositional variations, and symbols on figures correspond to
this first order variation. Volcano means scatter unsystematically around a mean for the
volcanic front of 55% SiO2 (Fig. 18B), indicating that these lavas are generally quite
fractionated. Although the major element variations along the arc are systematic, the
significant variations in composition do not correspond exactly to the along-arc
subdivisions shown on Figures 1 and 2. One variation that does seem consistent with this
segmentation is the abundance of large submarine silicic calderas in the Izu segment; where
nine are found [Iizasa et al., 1999], in contrast to the absence of this volcanic style in the
rest of the IBM arc. Along-arc variations in potash concentrations (Fig. 18C) show that this
variation is not related to fractionation, with high K lavas in a different place than the high
SiO2 lavas. The low potassium contents of Izu segment lavas is reflected in the fact that
some of the felsic volcanoes have mean potash contents below the IBM arc mean of 0.98%
K2O.
Determining water and CO2 contents of arc lavas has proved challenging because
arc lavas are extensively degassed. Water contents determined for ten glass inclusions in
phenocrysts from three volcanoes average 2.2% H2O accompanied by no detectable CO2
(except for 400-600 ppm in one shoshonite). Water contents in glass inclusions in a
gabbroic xenolith from Agrigan gives a mean of 5.1% H2O and negligible CO2 [Newman et
al., 2000]. It is not clear whether the much higher value for the xenolith better reflects
magmatic water contents or post-entrapment crystallization, but an estimate of 3% H2O in
IBM magmas prior to degassing seems conservative at this time. Water contents of
northern IBM arc magmas are unknown.
There are important differences in source depletion observed along the arc. Because
Zr behaves more incompatibly than Y for most mantle minerals, the ratio Zr/Y is relatively

29
high in melts generated from undepleted mantle sources and decreases for melts from
depleted sources. A similar relationship holds for Nd/Sm. The mean Zr/Y for the arc
system is 3.3, slightly higher than the MORB mean of 2.9 [Hofmann, 1988]. Similarly, the
Nd/Sm ratio monitors source depletion, with higher Nd/Sm indicating a less-depleted
source. The mean Nd/Sm for the arc system of 3.77 is also slightly higher than that for N-
MORB (3.0)[Hofmann, 1988]. Following this simple argument, fig. 18D and E show that
Izu-Bonin arc melts are derived from the most depleted sources, that Mariana arc melts are
generated from somewhat less-depleted sources, and that lavas of the Shoshonitic Province
are generated from an enriched source.
Differences between typical mafic lavas of the three arc segments are shown another
way in Fig. 19, along with the field of subducted sediment generalized from Fig. 8. The
three arc patterns are broadly similar in being greatly enriched in LIL elements (Rb, Ba, K,
Pb, and Sr) and significantly depleted in HFSE Nb and Ta relative to MORB. The patterns
for Izu and Mariana are very similar except that the Izu lavas are generally more depleted for
elements to the left of (more incompatible than) Sm. The shoshonitic pattern is similar to the
features shown by the Izu and Mariana patterns, albeit at generally elevated levels. All three
patterns broadly parallel the field defined by subducted sediment except that the positive
anomaly for Sr in the lavas is not seen for the sediments. Another important feature of the
pattern shown in Fig. 19 for IBM arc lavas is that heavy REE elements are generally lower
than observed in MORB. This is interpreted to reflect higher degrees of melting for IBM
arc melts relative to MORB; it is estimated that IBM arc melts represent 25-30% melting of
mantle peridotite [Bloomer et al., 1989a; Peate and Pearce, 1998]. Alternatively, the source
peridotite may have been melted previously, beneath the back-arc basin spreading axis and
then been remelted beneath the arc [McCulloch and Gamble, 1991]. However, if this is the
dominant mechanism to explain the depleted nature of arc melts, one would expect the
Mariana arc – which is associated with an actively spreading back-arc basin – to erupt more
depleted lavas than the Izu arc, which has not been associated with an actively spreading
back-arc basin for 25 million years. This is not the case: Izu segment lavas are significantly
more depleted than Mariana segment lavas.
7.3.2 Isotopic Characteristics
A wide range of isotopic tracers have been applied to the IBM arc system over the
past 3 decades. Some isotopic systems allow subducted components to be unequivocally
identified in the source region of IBM arc melts, while others do not allow such
contributions to be identified. Uncertainties in our understanding of the nature of the
mantle source as it existed before the subduction component was added looms over all
interpretations of the isotopic datasets. Regardless of these issues, the isotopic database

30
provides one of the most important constraints that we have for how the IBM Subduction
Factory operates. Accordingly, the isotopic database is summarized below, in order of
increasing atomic weight.
There has not been a lot of He isotopic work, principally because of the difficulty of
finding samples that have not been extensively degassed, but work on olivine separates
promises to overcome this problem because glass inclusions in these retain volatile
elements. This also applies to the other rare gasses (Ar, Ne, Xe). A small amount of He data
is presented by Poreda and Craig [1989], who report 3He/4He of 7.22 – 7.65 x
atmospheric values for three Mariana volcanoes, very similar to values for MORB of 8±1 x
atmospheric. It appears that He in the arc lavas is overwhelmingly derived from the mantle.
Li and B isotope data for convergent margin lavas are powerful ways to identify
contributions from altered oceanic crust. The first Li isotope data for the IBM arc system
were reported by Moriguti and Nakamura [1998]. They noted that arc lavas from Oshima
in the northernmost IBM arc have significantly heavier Li than do lavas generated by
unmodified mantle, indicating significant participation of altered oceanic crust in the source
region of melts beneath the magmatic front. They also noted that Li isotopic compositions
decrease away from the trench, indicating decreasing involvement of altered oceanic crust.
There is a larger database for B isotopic compositions of lavas from along the IBM arc
magmatic front, which is significantly heavier (mean δ11B = +4.8‰) than expected for
unmodified mantle (δ11B<-1‰; Fig. 20A). This isotopic system is especially powerful
because compositions expected for sediments, altered oceanic crust, and unmodified mantle
are distinct. The heavy B isotopic composition of IBM arc lavas indicates that most B is
derived from altered oceanic crust, with the caveat that progressive metamorphism of all
subducted components, including sediments, is expected to leave progressively heavier B
and other light elements in the slab as distillation related to subduction proceeds. In
contrast, two samples from the Mariana Trough plot in the field expected for mantle-derived
rocks or sediments. Considered together, Li and B isotopic data available for the IBM arc
indicate that subducted altered oceanic crust makes important contributions to the source of
melts generated along the magmatic front.10Be is another important isotopic tracer. Because it is cosmogenic, with a 1.5
million year half-life, it is only found in very young sediments. Because subduction to
depths of ~130 km will take 3-5 million years, significant amounts of 10Be in fresh lavas
convincingly demonstrates a significant amount of sediment recycling. Studies to date of
IBM arc lavas indicate very low abundances of 10Be compared to other arcs [Woodhead
and Fraser, 1985], due in part to low sedimentation rates outboard of the IBM trench.

31
Oxygen isotopic data for the IBM arc system has resulted in some controversy.
This is an important tracer because O is the most common element in igneous rocks and
because there are big differences in the isotopic composition of mantle (δ18O ~+5.7 ‰) and
sediments (δ18O ~+20 ‰). The first study [Matsuhisa, 1979] concluded that fresh basalts
from Oshima and Hachijojima had δ18O = +5.3 to +6.1‰, indistinguishable from that of
normal mantle. Matsuhisa [1979] observed a covariation of δ18O with SiO2 that could be
modeled by simple fractional crystallization. Similar observations were made in the
southern IBM arc system by Ito and Stern [1986], who interpreted their data to limit the
participation of sediments or sediment-derived fluids to <1% of the oxygen budget. In
contrast, Woodhead et al. [1987] concluded that Mariana arc lavas had slightly heavier
oxygen than would be expected from melting of unmodified mantle, and that the
participation of subducted sediment could be identified. One concern is that minor alteration
of lavas can cause slight but significant shifts in oxygen isotopic composition, and some of
the differences between the results of the different groups may have been due to this effect.
The oxygen isotopic composition of IBM arc lavas has recently been re-examined Eiler et
al. [2000], who analyzed olivines and concluded that the oxygen isotopic composition of
pristine Mariana arc lavas – including shoshonites - could not be distinguished from that of
MORB or OIB melts. They concluded that no more than 1% or so of the oxygen in these
rocks could be recycled from subducted sediments.
In contrast to the mantle-like oxygen in arc lavas, sulphur isotopic compositions are
often much heavier than mantle-derived rocks, particularly for the Mariana arc. Sparse data
for Iwo Jima and Izu-Bonin segments are more mantle-like, or perhaps similar to altered
oceanic crust (Fig. 20b). Mariana arc samples approach the isotopic composition expected
for sulfate in subducted sediments [Alt et al., 1993]. Fresh lavas from both the Mariana
Trough and the Sumisu rift erupt lavas with mantle-like sulphur isotopic compositions [Alt
et al., 1993; Hochstaedter et al., 1990a].
Sr comprises the most complete isotopic data set for the IBM arc (Fig. 20C).87Sr/86Sr varies between 0.7030 and 0.7040, with a mean value of 0.70352. This is more
radiogenic than the mean of 0.7028 found for MORB [Ito et al., 1987] or the mean of
0.70304 found for Mariana Trough back-arc basin basalts, but it is similar to the isotopic
composition of OIB. Whether the more radiogenic composition of IBM arc lavas relative to
MORB reflects the mixing of Sr from subducted materials into a depleted MORB-like
mantle or manifests extraction of these melts from an unmodified OIB-like mantle remains
controversial. Because of the completeness of the Sr-isotope dataset, long-wavelength
variations can be identified. Most of the Mariana Arc and Izu-Bonin segments cluster
around a mean of 0.7034 but volcanoes in the shoshonitic province along with the
32
northernmost part of the Mariana arc cluster around 0.7038. Whether the elevated 87Sr/86Sr
of lavas from the shoshonitic province is due to the involvement of proportionately more or
different subducted material or reflects mantle heterogeneities unrelated to subduction is
unknown.
The database for Nd isotopic compositions of lavas from along the IBM arc is
reasonably complete (Fig. 20D). Isotopic data from the literature were adjusted to a
common value of 143Nd/144Nd for the La Jolla Nd standard, from which values of εNd were
calculated. The mean for the arc system is +6.7, significantly lower than typical values for
MORB of ~+10. Variations along the arc mostly mirror variations seen for Sr isotopes,
with the northernmost Mariana arc and shoshonitic province volcanoes having less
radiogenic Nd (lower εNd) than the rest of the arc. This is consistent with a greater role for
subducted sediments or derivation from enriched mantle, although Nd is generally thought
not to be mobile in hydrous fluids like those sweated out of the subducting slab. Izu-Bonin
arc lavas mostly have higher εNd than Mariana arc lavas. Compared to Mariana arc lavas,
the higher εNd of Izu-Bonin lavas coupled with similar 87Sr/86Sr results in the latter lavas
lying significantly farther to the right than other IBM arc lavas, well to the right of where the
mantle array would lie on Fig. 21A if it were shown. This is strong evidence that subducted
components (altered seafloor or sediments) help control the Sr systematics of the arc source
region. For the most part, there is a clear break between the space occupied by back-arc
basin (Mariana Trough) and interarc basin (Sumisu Rift) lavas and those of the arc
(Mariana arc, Shoshonitic province, Izu-Bonin arc, with most of the former having 87Sr/86Sr
<0.7032 and most of the latter having 87Sr/86Sr >0.7032. A few back-arc basin (BAB)
samples are more radiogenic than this and are isotopically indistinguishable from arc
samples. These BAB samples are invariably from the northern rifted part of the Mariana
Trough where the BAB extension axis is rifting, not spreading, and has captured the arc
magmatic supply [Gribble et al., 1998].
A growing body of Hf isotopic data has been reported for the IBM arc system. The
arc system has a mean εHf of 14 (Fig. 22A). Variations in Hf isotopic composition along
the arc are similar to those seen for Nd, with εHf decreasing markedly in the Shoshonitic
Province. The data from the entire arc fall in the Nd-Hf mantle array of Vervoort and
coworkers (Fig. 23A). Pearce et al. [1999] used coupled Hf-Nd isotopic data to infer that
the mantle source for IBM arc melts has always been of Indian Ocean provenance and that
Pacific volcanogenic sediments make the most important contribution to the subduction
component.
There are also considerable variations in Pb isotopic composition within the arc,
most of which varies systematically along strike of the arc. Mariana arc lavas cluster around

33
the mean 206Pb/204Pb for the IBM arc of 18.85 (Fig. 22B). Most of the shoshonitic edifices
also cluster around this mean, with the exception of very radiogenic Iwo Jima data. This
volcano defines a trend toward ‘HIMU’, possibly due to the participation of subducted
HIMU off-ridge volcanoes (Fig. 9C). Pb isotopic variations in the southern Izu-Bonin
segment are radiogenic in the south but fall off rapidly to non-radiogenic values
(206Pb/204Pb ~18.25) at the north end of the IBM arc. Fig. 21B and C shows the Pb isotopic
data on a conventional Pb isotope diagram. The field of Western Pacific sediments (from
Fig. 9) is also shown (shaded), as well as the field defined by the products of W. Pacific
off-ridge volcanism (dashed line). The trajectory of oceanic volcanic rocks erupted in the
northern hemisphere which are unrelated to subduction is shown as the ‘Northern
Hemisphere Reference Line (NHRL [Hart, 1984]). Significant deviations from the NHRL,
especially on the 207Pb/204Pb vs. 206Pb/204Pb plot (Fig. 21B) are commonly interpreted as
due to the mixing of Pb from subducted sediments into the mantle source region. It is also
noteworthy that especially the Mariana Arc lavas plot in the field of off-ridge volcanics and
that subducted off-ridge volcanics and volcaniclastics should also be considered as a source
of Pb for IBM arc melts.
Hart [1984] used ∆7/4 and ∆8/4 to quantify deviations of 207Pb/204Pb and208Pb/204Pb from NHRL, ∆>0 lying above NHRL and ∆<0 lying below. Because Western
Pacific sediments lie above the NHRL, involvement of Pb from subducted sediments may
be monitored with ∆7/4. Fig. 22C plots this parameter along strike of the IBM arc. The
IBM arc system is characterized by a mean value of 4.4 for ∆7/4, with still higher values
characterizing the northernmost Marianas and Shohsonitic Province. Pelagic sediments also
lie above the NHRL on a plot of 208Pb/204Pb vs. 206Pb/204Pb plot (Fig. 21C) and so have
strongly positive ∆8/4. The complementary parameter ∆8/4 is not usually used to track
sediment involvement, however, the IBM arc system shows systematic variations in ∆8/4
that differ in detail from those shown by ∆7/4 (Fig. 22D). The arc system has a mean ∆8/4
~14 and is even higher at the northern end of the Marianas and in the southern shoshonitic
edifices. However, ∆8/4 drops precipitously for Iwo Jima and the southernmost Izu-Bonin
segment before rising to a regional high over the northern Izu-Bonin segment. The strongly
positive ∆8/4 over the northernmost IBM arc may be due to migration into the mantle
beneath the northernmost IBM arc of Eurasian or Indian Ocean-type mantle that is
distinguished by elevated ∆8/4 [Hickey-Vargas et al., 1995].
Uranium-thorium disequilibria studies of IBM arc magmas provide important
constraints on timescales and processes of fluid fractionation, melt generation, and
migration. These elements have similar distribution coefficients between mantle minerals

34
and melt, but U is much more mobile than Th in oxidizing fluids. Such fluids can strip U
preferentially from the subducted slab or the mantle and can correspondingly enrich the arc
source region. Fractionation of U and Th is detectable in young lavas through the use of
short-lived radiogenic daughter products. Striking confirmation that fluid-mediated
fractionation has been important was demonstrated by the first U-Th disequilibrium study
of IBM arc lavas [Newman et al., 1984]. Subsequent studies confirm that Mariana lavas
contain large U-excesses [Elliott et al., 1997; Gill and Williams, 1990; McDermott and
Hawkesworth, 1991]. These excesses vary systematically with composition. Lavas that
have been interpreted to be derived from a depleted source to which a hydrous fluid was
added (e.g., depleted arc tholeiites with high Ba/La) show large excesses in U, whereas
shoshonites and lavas from relatively enriched sources show small or negligible U-excesses
(Fig. 23B). Some samples show (238U/230Th) <1, which suggests small degrees of melting
of long-term dynamic melting of sources with residual garnet or clinopyroxene [Turner et
al., 2000]. Those samples showing strong fractionation of radionuclides lie near a 30 kyr
isochron. This constrains the amount of time that has elapsed between fluid-mediated
fractionation and eruption. Whether the timing of fluid mediated fractionation corresponds
to dehydration of the slab, breakdown of amphiboles in the convecting mantle wedge, or
some other event is not yet known.
Elliott et al. [1997] recently suggested that material was added from the subducted
slab in two stages. Lavas with (238U/230Th) ~1 have incompatible trace element abundances
suggesting that their source has been metasomatized with a component from subducted
sediments, possibly sediment melts. These workers also suggest that a late stage, water-rich
component, with (238U/230Th) >1, was derived from altered crust and transferred to the
mantle source region <30,000 years ago.
7.4 Cross-chains
Another perspective on IBM Subduction Factory outputs comes from consideration
of chains of volcanoes that trend at high angles to the arc front, known as cross-chains.
Because the Wadati-Benioff zone lies at different depths beneath cross-chain volcanoes
while mantle and subducted material lie approximately on flowlines, the products of these
volcanoes allow us to track output of the Subduction Factory across its breadth. Cross-
chains are best developed in the Izu segment, where several extinct and one active cross
chain are known. The 30’NKan’ei, Manji, Enpo, and Genroku cross-chains extend WSW
between 30°30’ and 32°N (Fig. 1) and give K-Ar ages between 3 and 12 Ma [Ishizuka et
al., 1998]. Detailed geochemical and isotopic studies of these cross-chains are given by
Hochstaedter et al. [2001], who concluded that magmas generated beneath the magmatic

35
front had the strongest relative enrichments of fluid-mobile elements in spite of having the
lowest concentrations of incompatible elements. Interestingly, a similar study by [Tatsumi
et al., 1992] concluded that Rb/Zr ratios increased away from the volcanic front, implying a
greater role for slab-derived fluids in that direction.
Here we focus on the Zenisu and Kasuga cross-chains as active examples. The most
impressive cross-chain in the IBM arc lies at its northern end, where five active or dormant
subaerial volcanoes and submarine counterparts along the Zenisu Ridge extend about 300
km WSW from Oshima (Fig. 24A). Volcanism along the Zenisu Ridge is dominated by
rhyolitic eruptions. The islands of Kozushima and Niijima are dominated by medium-K
rhyolitic rocks, with subordinate andesites and basalts [Aramaki and Itoh, 1993; Aramaki et
al., 1993]. Mafic lavas dominate on Toshima [Taylor and Nesbitt, 1998]. Systematic
variations in Li, B, Sr, and Pb isotopic compositions are consistent with decreasing
participation of a slab-derived component away from the trench (Fig. 24B-E; [Ishikawa and
Nakamura, 1994; Moriguti and Nakamura, 1998; Notsu et al., 1983]). Moreover, the
subducted component that dominates along the magmatic front can be identified on the
basis of Li and B isotopes as subducted altered oceanic crust.
The Kasuga cross-chain, near 22°N, (Fig. 1, 26B) is the best studied of any submarine
arc volcano in the IBM arc system and perhaps the world. It has been mapped with
SeaMARC II imagery and sampled several times by dredging and 8 Alvin dives [Fryer et
al., 1997]. The cross-chain consists of three volcanoes, Kasuga 1, 2, and 3, numbered with
increasing distance from the magmatic front and increasing depth to the Wadati-Benioff
zone. Kasuga 1 is extinct but Kasuga 2 and Kasuga 3 are active, with fresh lava exposures
and hydrothermal activity at their summits. Kasuga 2 hydrothermal fluids are
compositionally unique among submarine hydrothermal systems [McMurtry et al., 1993].
In contrast to lavas from the IBM magmatic front, Kasuga 2 and 3 lavas are often glassy
and primitive; Mg# >65 is common. These lavas range from medium-K to shoshonitic
suites and the basalts range from nepheline-normative to hypersthene-normative [Stern et
al., 1993]; this appears to be the only IBM cross-chain that has shoshonitic lavas. Much of
the compositional range may be due to magma mixing [Meen et al., 1998]. Glassy
margins of three Kasuga basalts contain 1.45-1.69% H2O [Newman et al., 2000]. Felsic
volcanism is also important in the Kasuga cross-chain, although lavas with >66% SiO2 are
not reported [Fryer et al., 1997]. U-Th disequilibrium studies show no U excess or even Th
excess [Gill and Williams, 1990], indicating that fractionation of U-Th by hydrous fluids
was not important. The range of δ18O for basaltic glasses (5.7 to 6.0‰) and clinopyroxene
separates (5.23-5.57‰) indicates a mantle source, and the range for andesites and dacites
(6.0-6.2‰; [Stern et al., 1993]) is consistent with their evolution by fractionation of basalt.
36
These lavas do not show the elevated 87Sr/86Sr for a given εNd that is characteristic of lavas
erupted along the magmatic front, and Pb isotopic variations and mantle-like Ce/Pb (10-23)
limit the role of subducted sediment in modifying the mantle source region. Instead, the
inverse variation of magma production rate and isotopic heterogeneity was interpreted by
Stern et al. [1993] to indicate diminished melting with distance from the magmatic front due
to diminished water supply from the subducted slab.
7.5 Magmatism related to Extension
Extension-related igneous activity provides a third perspective on the high-temperature
products of the IBM Subduction Factory, one that is important not only because these
volcanic centers are generally located farther from the trench than the arc volcanoes, but also
because the melt generation process itself is different. Magma generation beneath the
magmatic front is probably caused by fluid fluxing of downwelling mantle, whereas beneath
back-arc basin spreading centers melting is probably caused by adiabatic decompression of
upwelling mantle, similar to that beneath mid-ocean ridges but aided by addition of water
from the subduction zone (Fig. 25). Evolution of an unrifted arc to one with a back-arc
basin thus requires a major reorganization of sub-arc mantle flow regimes, a problem that
has not yet been explored. Also, the mantle flow regime in an arc system associated with
active back-arc basin spreading is interpreted to carry mantle previously depleted by melting
beneath the back-arc basin spreading center (1 in Fig. 25B) to be remelted beneath cross-
chains and the magmatic front (2,3 in Fig. 25B)[McCulloch and Gamble, 1991].
Igneous activity related to extension is manifested as inter-arc rift basins in the Izu
segment [Klaus et al., 1992] and as an active back-arc basin (Mariana Trough) in the
Mariana segment [Fryer, 1995]. Here we briefly consider the magmatic products of the
Sumisu Rift inter-arc basin and the Mariana Trough back-arc basin.
The Izu rift zone spans most of the Izu segment, from 33° to 27°30’ N, just south of
the Sofugan Tectonic Line, a distance of about 700km. The rift zone parallels the arc
magmatic front and lies just to the west of it, except near 29°N where magmatic arc and rift
coincide (Fig. 26A). Six basins have been named in the rift zone: Hachijo, Aogashima,
Sumisu, Torishima, Sofugan, and Nishinoshima. The rift zone deepens southward, with flat,
sediment covered basins lying at depths of a little deeper than 1 km in the north to little over
3km in the south [Klaus et al., 1992; Taylor et al., 1991]. The Sumisu Rift is by far the
best known of the Izu rifts and is representative. Studies of the Sumisu Rift include
SeaMARC II and Seabeam swathmapping and Alvin diving [Taylor, 1992], multichannel
seismic reflection profiling [Taylor et al., 1991] and ODP drilling (sites 790 and 791 in the
basin, sites 788 and 789 on the flanking uplift to the east [Taylor, 1992]. This geophysical

37
background provides a firm foundation for igneous rock geochemical studies [Fryer et al.,
1990b; Hochstaedter et al., 1990a; Hochstaedter et al., 1990b; Ikeda and Yuasa, 1989],
[Gill et al., 1992]. Three oblique transfer zones divide the rift along strike into four
segments with different fault trends and uplift/subsidence patterns. Differential strain is
accommodated by interdigitating, rift-parallel faults and cross-rift volcanism, which is often
concentrated at cross-rift transfer zones. The locus of maximum sediment thickness
(>1km) and basin subsidence occurs along an inner rift adjacent to the arc margin.
Volcanism is also concentrated on the highs between the basins, most of which mimic
cross-chains extending W to SW from the major arc volcanoes, indicating the dominance of
magmatic point sources. From estimates of extension (2-5km), the age of the rift (~2 Ma),
and accelerating subsidence, Taylor et al. [1991] infer that the Sumisu rift is in the early
stages of developing as a back-arc basin.
The Mariana Trough stretches 1300 km from north to south (Fig. 26B), about the
distance from Los Angeles to Portland, Tokyo to Seoul, or London to Rome, and has
roughly the dimensions and areal extent of Japan or California. The Trough is crudely
crescent-shaped, opening on the south; it is bounded to the east by the active Mariana arc, to
the west by the remnant arc of the West Mariana Ridge [Karig, 1972], and to the south by
the Challenger Deep part of the Mariana Trench. It narrows northward until the Mariana
arc and West Mariana Ridge meet at about 24°N. It is widest in the middle, at 18°N, where
it is about 240 km wide, and narrows to about half this at its southern, open end. Depths in
the basin are distributed asymmetrically, being greater adjacent to the West Mariana Ridge
than next to the active arc, due to a westward-thinning wedge of volcaniclastic sediments
derived from the active arc, and also less thermal buoyancy of the mantle. Where not
covered by sediments, the seafloor is deeper and bathymetry more rugged than normal.
Zero-age seafloor of the Philippine Sea, including the Mariana Trough, lies at a mean depth
of 3200 m compared to normal zero-age seafloor depths of 2500 m [Park et al., 1990].
The extension axis can be subdivided along strike into a southern two-thirds
characterized by slow seafloor spreading and a northern third characterized by rifting (Fig.
26B). From as far north as 19°45'N south to 13°10’N, the spreading ridge has the typical
morphology of a slow-spreading ridge, with an axial graben that is sometimes occupied by a
neovolcanic axial ridge [Hawkins et al., 1990; Martinez et al., 2000; Stüben et al., 1998];
south of this the ridge more resembles a fast-spreading ridge, probably because magma
supply is enhanced by proximity to the arc [Martinez et al., 2000]. Spreading half-rates in
the region between 16° and 18°N are estimated at 1.5 to 2.2cm/year [Bibee et al., 1980;
Hussong and Uyeda, 1982; Yamazaki and Stern, 1997]. The ridge becomes punctiform
north of 18°30', and true seafloor spreading does not occur north of 19°45'N (but see the

38
different conclusion of Yamazaki et al. [1993]). Rifting forms a series of amagmatic deeps
between 19°45'N and 21°10'N called the 'Central Graben' by Martinez et al. [1995]. These
basins have low heatflow, lack igneous activity, and contain the greatest depths in the
Mariana Trough (>5400m). The deepest part of the Central Graben is also unique among
back-arc basins in exposing mantle peridotites along the extension axis [Stern et al., 1996].
Extension north of the Central Graben occurs by combined tectonic and magmatic
processes that are distinct from seafloor spreading, in a region known as the Volcano-
Tectonic Zone (VTZ) [Martinez et al., 1995]. The VTZ corresponds with a part of the
Mariana Trough where the crust thickens from 6 to 15 km (Fig. 14). The southern VTZ is
dominated by fissure eruptions associated with a ridge-like feature, ~30 km long, which
rises to less than 2800 m water depth and which is similar to the inflated segment at the
southern terminus of the spreading ridge. The northern VTZ is dominated by point-source
volcanism, with edifices spaced 50-60 km apart alternating with rift basins. There is no
volcanic activity along the adjacent arc segment and it appears that the extension axis has
captured the arc magma supply between the Kasuga cross-chain at 22°N and Nikko near
23°N, where the extension axis intersects the arc. North of this point, incipient rifting is
magmatically manifested by the shoshonitic lavas of the Hiyoshi complex, Fukutoku-oka-
no-ba (or Sin Iwo Jima), and Iwo Jima (Fig.26B). Rifting and spreading are inferred to be
propagating northward at a rate of 10 to 40 cm/year [Martinez et al., 1995; Stern et al.,
1984], so the variations in tectonic and magmatic style seen along-strike north of 18°N
provide an example of the sequence of events that occur at any one section across the back-
arc basin as the rift evolves from updoming through rifting to true spreading.
The following geochemical discussion and data for associated figures is extracted
from the following literature sources: [Hochstaedter et al., 1990a; Ikeda and Yuasa, 1989]
[Alt et al., 1993; Chaussidon and Jambon, 1994; Fryer et al., 1990b; Garcia et al., 1979;
Gribble et al., 1996; Gribble et al., 1998; Hart et al., 1972; Hawkins et al., 1990; Hawkins
and Melchior, 1985; Ikeda et al., 1998; Ito and Stern, 1986; Jackson, 1989; Poreda, 1985;
Sano et al., 1998; Sinton and Fryer, 1987; Stern et al., 1990; Volpe et al., 1987] [Eiler et al.,
2000; Hochstaedter et al., 1990b; Macpherson et al., 2000; Newman et al., 2000]. Data for
the Mariana Trough samples are entered in an annotated EXCEL database that is available
from the first author upon request. Before summarizing the geochemical and isotopic
signatures of extension-related IBM lavas, three points need to be emphasized. First, even
though the Sumisu Rift is in the early stages of extension and seafloor spreading is not
occurring, these basalts have geochemical and isotopic affinities with back-arc basin basalts
such as erupt from spreading segments of the Mariana Trough [Hochstaedter et al.,
1990b]. Second, and in contrast to the absence of felsic volcanism in the Mariana Trough

39
spreading ridge, volcanism in the Sumisu Rift is compositionally bimodal, with abundant
felsic (>70% SiO2) material as well as basalt. The bimodal nature of Sumisu Rift igneous
activity makes it more similar to the northern VTZ than to the spreading portion of the
Mariana Trough (Fig. 27A). Extension-related igneous activity in many tectonic
environments is compositionally bimodal during rifting and becomes entirely mafic when
seafloor spreading begins. Finally, extension-related lavas are wet, generally containing
much more water than found in MORB or OIB. Glassy Mariana Trough basalts contain
0.2-2.78% H2O, with a mean of 1.59%. This range does not seem to due to degassing,
because glass inclusions contain similar water abundances as found in glassy lava rims.
Extension-related basalts generally show chemical signatures of a ‘subduction
component’ that is dominantly carried by a hydrous fluid. Trace element abundances vary
strongly with how wet the melt was. Fig. 27B presents trace element abundances for the
two rifting segments, Mariana Trough VTZ and Sumisu Rift, along with endmember
examples of basalts erupted along the Mariana Trough spreading ridge. As can be seen
from this figure, some basalts in the Mariana Trough spreading segment have trace element
patterns – and concentrations of water - which are indistinguishable from MORB (labeled
‘MORB-like’ on Fig. 27B). More commonly, Mariana Trough basalts from the spreading
segment have an identifiable arc signature, especially enrichments in fluid-mobile elements
Rb, Ba, K, Pb, and Sr, and elevated concentrations of water. This is particularly perplexing
because the Mariana Wadati-Benioff zone dives nearly vertically and does not lie beneath
most of the Mariana Trough, so how slab-derived fluids are transported to the melt
generation zone is unclear. Arc-like geochemical features are ubiquitous in portions of the
IBM arc system undergoing rifting. Melting models indicate that the degree of melting in
spreading segment basalts can be directly linked to the abundance of water in the mantle
source [Gribble et al., 1998; Stolper and Newman, 1994].
In spite of the geochemical indications for a subduction component, isotopic data for
Mariana Trough ‘spread’ basalts mostly indicate a mantle source. Helium isotopes data
indicate a mean R/RA = 7.87±1.34 (1 std. dev), indistinguishable from the value for MORB
of 8±1. Two analyses of boron isotopes fall in the fields for the mantle (Fig. 20A). Mean
δ13C of –4.15±1.34‰ is close to mantle values as well. Oxygen isotopic data mostly on
glasses gives a mean δ18O of +5.85±0.15‰, overlapping the range of 5.35-6.05‰ for
MORB glasses [Ito et al., 1987], although glasses with strong arc-like signatures
sometimes have δ18O of 6.0-6.1‰. The conclusion that Mariana Trough spread basalts
have oxygen isotopic compositions that are indistinguishable from MORB is confirmed by
analysis of olivines [Eiler et al., 2000]. Sulphur isotopic data for samples from both the

40
spreading and VTZ segments of the Mariana Trough spread and the Sumisu Rift fall in the
field for mantle-derived basalts (Fig. 20B).
Isotopic data for Sr, Nd, and Pb indicate that the mantle source of rift volcanism is
very similar to that of associated arc segments whereas spreading segments have distinct
mantle sources. Fig. 21A shows that the εNd of Sumisu Rift lavas is similar to Izu-Bonin
arc lavas but that they have lower 87Sr/86Sr. Mariana Trough VTZ and spread basalts are
not distinguished in Fig. 21, but spread basalts have significantly lower 87Sr/86Sr (mean =
0.70291±0.00015) and higher εNd (8.9±1.1) than lavas erupted along the associated
magmatic front (see Fig. 15C,D: 0.70352,+ 6.7). Lavas erupted from the Mariana Trough
VTZ have Sr- and Nd-isotopic compositions that overlap those of the magmatic front
(0.70343±0.00032; +6.8±1.0). Pb isotopic compositions tell a similar story. On Pb
isotopic diagrams, Sumisu Rift and Izu-Bonin arc lavas plot in restricted areas that overlap,
and both show elevated 208Pb/204Pb relative to the NHRL. Mariana Trough VTZ lavas have
mean 206Pb/204Pb (18.76±0.13) that is indistinguishable from the mean for the IBM arc of
18.85. In contrast, Mariana Trough spread basalts have less radiogenic and more variable206Pb/204Pb (18.24±0.27) and show elevated 208Pb/204Pb relative to the NHRL. The
radiogenic isotope data strongly indicate that IBM rift basalts are produced by parts and
processes of the Subduction Factory that generally produces basalts along the magmatic
front, but that spreading basalts are produced differently.
In summary, although arc lavas have affinities with continental crust and back-arc
basin lavas are in most ways indistinguishable from MORB and oceanic crust, the source
regions of these two magma stems are similar in many respects. In particular, both mantle
source regions are strongly affected by a ‘subduction component’ that travels with water
extracted from the subducted slab or sediments. Although arc and back-arc basin melts have
very different modes of formation and tectonic environments of eruption, arc and back-arc
basin lavas show similar enrichments in LIL elements, depletions of HFSE, and water
contents. In spite of these affinities, significantly different isotopic compositions indicate
that back-arc basin melts have less of an identifiable component from subducted materials
than do arc lavas. Fluids from the slab that interact with the back-arc basin source are more
equilibrated with asthenospheric mantle than have those delivered to the arc source. There is
a great need for quantitative chemical modeling in tandem with development of realistic
models for mantle, fluid, and melt flow to explain these similarities and differences.
41
7.6 IBM Collision Zone
The IBM arc system in the north is colliding with Honshu in the Izu Collision Zone
(ICZ; Fig. 28). This is one of the few examples that we have of ongoing terrane accretion,
and it provides outstanding opportunities to study strain partitioning during terrane
accretion and the nature of middle and deep crust of an IOCM. The ongoing collision also
presents a first-order geohazard; the Great Kanto Earthquake of 1923 (140,000 dead and
missing) had an estimated surface wave magnitude of 8.2. This earthquake had an epicenter
SW of Tokyo and it devastated southeastern Japan, including the cities of Tokyo and
Yokohama. The earthquake killed about 140,000 people and was probably caused by the
collision. Uplift associated with the collision zone has resulted in the highest topographic
relief in Japan; if submarine relief is considered, the total relief in the region is greater than
that of the Himalayas [Niitsuma, 1989]. Collision-related uplift is active and rapid, as
shown by the steep tilts of very young sedimentary beds.
The ICZ is caused by the attempted subduction of thickened arc crust at the
northeastern corner of the Philippine Sea plate. The north end of the IBM arc enters the
Nankai Trough subduction zone at a rate of ~4cm/y but the ~22km-thick IBM crust is too
thick and buoyant to be readily subducted. Instead, the northern end of IBM plows end-on
into southern Honshu. This collision has been occurring in about the same place since
Middle Miocene time, ~15 Ma ago [Itoh, 1986]. The deformation is partly accommodated
by oroclinal bending of margin-parallel lithotectonic belts in southern Honshu, such as the
Cretaceous-Paleogene Shimanto Belt accretionary prism [Niitsuma, 1989]. The collision
has rotated the Shimanto Belt from its normal ENE trend elsewhere in Honshu to a N-S and
NNW-SSE trend to the west and east of the ICZ respectively. This cuspate deflection of
trends that were originally more E-W is shown by the deflection of the Nankai Trough into
the NNE-trending Suruga Trough on the west side of the Izu Peninsula and the NW-
trending Sagami Trough on the east side (Fig. 28A).
Even though the Isu Peninsula has acted for the most part as a rigid indenter during
the collision, it is also being deformed and thickened. Cumulative thickening has about
doubled the crustal thickness, from ~22km for the arc at 32°15’N to >40km [Soh et al.,
1998] in the collision zone. Collision has caused the incremental migration of the
subduction zone to the south with time, manifested as major thrust faults which young from
north to south. The three thrusts exposed on land (labeled 1, 2, and 3 on Fig. 28) are each
associated with deep, foreland-type basins which also become younger to the south, ranging
in age from Middle Miocene in the north to Pleistocene in the south [Soh et al., 1998]. The
Ashigara basin (Fig. 28A) is a good example; it filled with about 5km of shallowing- and
coarsening-upwards sediments deposited between 1.6 Ma and 0.5 Ma [Soh et al., 1998].

42
The southernmost and youngest thrust (5 in Fig. 28) lies parallel to the Zenisu Ridge on its
southern flank and is associated with a broad zone of crustal seismicity [Le Pichon et al.,
1987].
Uplift has exhumed the deep infrastructure of the arc in the Tanzawa Mountains (Fig.
28A). This is made up of Tanzawa Group volcanics and sediments and Tanzawa plutonic
complex, both of Miocene age. The Tanzawa Group comprises altered basaltic and andesitic
tuff, volcanic breccia and lavas, and shallow marine limestone, which is considered to be a
shallow submarine volcanic sequence erupted on the IBM arc which was subsequently
accreted to Honshu. The Tanzawa Group passes through metamorphic facies from zeolite
to amphibolite facies towards the contact with the Tanzawa plutonic complex [Soh et al.,
1991]. The Tanzawa plutonic complex is interpreted as the exposed middle crust of the
IBM arc and has been explicitly linked to the ~10 km thick layer with 6-6.3km/sec velocity
layer identified from the refraction profile at 32°15’N (Fig. 13) [Taira et al., 1998]. K-Ar
ages for biotites, hornblende, and whole rocks range from 4.6 to 10.7Ma [Kawate and
Arima, 1998].
Four intrusive stages are identified in the Tanzawa plutonic complex, a first-stage
gabbro suite and three younger stages of a tonalite suite. These rocks are dominated by
hornblende and plagioclase± quartz and contain a wide range in silica, from ~44% to >70%
(Fig. 29A). Tanzawa plutonic rocks comprise a low-K suite similar to that of the Izu Arc;
gabbroic rocks with <50% SiO2 are likely cumulates. Trace element patterns confirm the
depleted nature of Tanzawa magmas, which often have lower abundances of incompatible
elements than MORB, except for enrichments in Rb, Ba, Th, and K and spikes in Pb and Sr
(Fig. 29B). Fields defined by Tanzawa plutonic rocks mimic those of basalts now being
erupted along the magmatic front of the Izu Arc. Trace element compositions for Tanzawa
felsic rocks plot in the field for volcanic arcs (Fig. 29C) and Arc ADR suites (Fig. 29D).
Initial 87Sr/86Sr for Tanzawa gabbros and tonalites (0.70331-0.70370)[Ishizaka and Yanagi,
1977] are similar to each other and to other Izu arc lavas. Tanzawa felsic rocks are
comparable to abundant felsic lavas erupted along and across the Izu segment of the IBM
arc. All of these geochemical parameters demonstrate that the Tanzawa igneous suite is
comparable to what is expected from the igneous infrastructure of an IOCM such as the
northern IBM arc.
The generation of the Tanzawa plutonic complex is of special interest because of the
insights it provides on the evolution of middle crust in the northern IBM arc. This has been
modeled as taking place in two stages [Kawate and Arima, 1998]. The first stage was
melting of amphibolite-facies low-K tholeiite in the lower crust of the IBM arc to form an
intermediate melt (~60% silica). About 50% melting of amphibolite is required, at

43
temperatures of ~1100°C and P<1.2 GPa [Nakajima and Arima, 1998]. This corresponds
to conditions expected for arc crust that is less than 40 km thick; garnet is stabilized at
higher pressures. They further proposed delamination of pyroxenitic residue after
generation of the anatectic melts. More siliceous melts were derived from the parental
intermediate melt by fractionation of hornblende, plagioclase, and magnetite.
8. CONCLUSIONS
The IBM Subduction Factory opened for business about 50 million years ago and is
now in an equilibrium state of operation. We understand the most important parts of the
IBM arc system, including raw materials fed into and finished products issuing from this
Subduction Factory. Inputs into the IBM Subduction Factory define an endmember
assemblage of the oldest seafloor on earth which youngs northward. Sedimentary
sequences on this crust are dominated by a late Mesozoic pelagic succession with a
southward-thickenening wedge of mid-Cretacous volcanic and volcaniclastic rocks. Seafloor
and associated supracrustal sequences are entirely subducted. Plate convergence increases
from about 3 cm/year in the south to about 6 cm/year in the north. Relative convergence
between the Pacific and the IBM arc system is oblique along much of the IBM trench and
varies from orthogonal to margin-parallel along strike. In contrast to the situation for
Pacific-Philippine Sea plate convergence, which has a pole of rotation near the southern end
of the IBM arc, Philippine Sea- Eurasian plate convergence has a pole of rotation north of
the northern end of the IBM arc system. The clockwise rotation of the Philippine Sea plate
in the south coupled with the relatively slow subduction of the oldest and most dense
oceanic lithosphere on the planet results in vertical sinking of the Pacific plate in the
southern IBM, producing a sea-anchor force that is responsible for back-arc extension in
the southern IBM. Combined effects of back-arc extension and oblique convergence result
in stretching of the forearc in the south.
Along-strike variations in seafloor age and convergence rates control the shape of the
subduction zone. Seismic definition of the Wadati-Benioff zone steepens smoothly from
40° dip to 80° dip from north to south, although earthquakes deeper than 300km are
common only beneath the Izu segment and central Marianas. Double seismic zones exist
beneath the northern and southern IBM. The trajectory of subducted material can be traced
with earthquakes down to a depth of about 700 km and tomographically can be outlined
well into the lower mantle. In contrast, the more rapid subduction of younger, less dense
oceanic lithosphere beneath northern IBM has resulted in a gentler angle of subduction and
the stagnation of the subducted slab above the 660 km discontinuity. Shear-wave splitting

44
data indicate that olivines in the mantle beneath IBM are oriented NW-SE to E-W and this
is about what is expected for flow induced by NW plate convergence.
The IBM arc system is naturally divided into Izu, Bonin, and Mariana segments
characterized by different morphologies, tectonic histories, and locus of outputs. The crust
is about 22 km thick beneath the Izu segment and has a distinctive middle crust composed
of felsic igneous rocks. The thickness and velocity structure for this arc segment is quite
different from that of the central Aleutians, the only other arc for which we have a similar
level of geophysical understanding. The middle crust of the IBM arc system can be studied
on-land in the Izu Collision Zone, where IBM has been colliding end-on with Honshu for
the past 15 Ma. The bulk crust of northern IBM contains about 56% SiO2 much more
siliceous than generally thought for IOCM, which are generally thought to have basaltic
bulk compositions. Further work is needed to evaluate the crustal structure beneath other
parts of the arc. Back-arc basin crust of the Mariana Trough is similar in thickness to crust
produced by spreading at mid-ocean ridge.
Outputs from the IBM Subduction Factory can be examined at forearc mud volcanoes
and cold-water vents, along the magmatic arc, at cross-chains and in extension-related back-
arc magmatic systems. Low sedimentation rates over most of the IBM arc system allow
direct study of most of the forearc and simplifies assessing the source of venting fluids,
incidentally providing one of the best places on the planet to study how subduction begins.
The forearc mud volcanoes of southern IBM result from strong extension of this forearc
and provide unique opportunities to sample slab-derived fluids, blueschist-facies subducted
crust, and entrained upper mantle. The intensive fluid mediation of the relatively cool
forearc may support the deepest biosphere in the planet.
The 2500-km long line of submarine and subaerial arc volcanoes provide the most
spectacular output from the IBM Subduction Factory. These volcanoes erupt porphyritic
and fractionated lavas, the study of which demands new techniques and approaches. There
are important compositional variations observed along strike of the IBM arc system. The
Izu segment erupts some of the most depleted arc lavas on the planet but is flanked
southward by the only active shoshonitic province found along the magmatic front of an
IOCM. Mariana arc lavas are less depleted than Izu arc lavas, and this may reflect an
important role for subducted volcaniclastics in the south. The Izu segment is also distinctive
in having abundant submarine felsic volcanoes. Mariana arc lavas contain about 2-3%
magmatic water. These lavas are characterized by distinctive depletions in Ta and Nb and
enrichments in Ba, Rb, K, Pb and Sr. Isotopic tracers allow some subducted components to
be unequivocally identified (e.g., water, 11B, 34S) but not others (e.g., 4He, 18O); uncertainties
regarding the affinities of the unmodified mantle source (MORB-like or OIB-like)

45
complicate interpretations of other isotopic tracers. Arc cross-chains such as the Zenisu
Ridge and the Kasuga cross-chain provide a perspective on how Subduction Factory
outputs vary across its breadth. These indicate that the role of subducted components
decreases across strike of the arc, leading to diminished melt production with distance from
the trench. Extension-related igneous activity, localized in the Mariana Trough and the Izu
rifts, provides a final perspective on IBM Subduction Factory outputs. IBM extensional
zones contain rift volcanism as well as seafloor spreading. These igneous rocks are
primitive, glassy, and relatively straightforward to study. Rifting is associated with bimodal
volcanism whereas only basalts are erupted from regions undergoing spreading. Lavas
associated with backarc basin seafloor spreading contain variable amounts of water, with an
average of about 1.6%; those with little water are indistinguishable from MORB whereas
those with abundant water also carry an elemental subduction component.
We hope that this summary and synthesis will motivate and guide students and
scientists to help elucidate the workings of the large, complex, and deeply hidden
Subduction Factory. A truly interdisciplinary effort is needed if we are to understand the
operation of the IBM Subduction Factory, with the development of a quantitative model that
can explain all aspects of the composition of products as our ultimate goal.
ACKNOWLEDGEMENTS
We appreciate the opportunity to synthesize our understanding of the IBM arc system
provided by the conveners of the Subduction Factory workshop at Eugene. We thank those
who let us use their unpublished data in this synthesis: Julie Morris, Julian Pearce, Mark
Reagan, and Jeff Vervoort. We are also grateful for thoughtful reviews of the manuscript
provided by John Eiler and Mark Reagan.
46
REFERENCES CITED
Abers, G.A., Plate structure and the origin of double seismic zones, in Subduction: Top to
Bottom, edited by G.E. Bebout, D.W. Scholl, S.H. Kirby, and J.P. Platt, pp. 223-
228, AGU Geophysical Monograph 96, American Geophysical Union, Washington
DC, 1996.
Abrams, L.J., R.L. Larson, T.H. Shipley, and Y. Lancelot, Cretaceous Volcanic Sequences
and Jurassic Oceanic Crust in the East Mariana and Pigafetta Basins of the Western
Pacific, in The Mesozoic Pacific: Geology, Tectonics, and Volcanism, edited by
M.S. Pringle, W.W. Sager, W.V. Sliter, and S. Stein, pp. 77-101, AGU
Geophysical Monograph 97, American Geophysical Union, Washington DC, 1993.
Ali, J.R., and S.J. Moss, Miocene intra-arc bending at an arc-arc collision zone, central
Japan: Comment, The Island Arc, 8, 114-117, 1999.
Alt, J.C., C. France-Lanord, P.A. Floyd, P. Castillo, and A. Galy., Low-temperature
hydrothermal alteration of Jurassic ocean crust, Site 801, in Proceedings of the
Ocean Drilling Project, Scientific Results, edited by R.L. Larson, Y. Lancelot, et al.,
pp. 415-427, Ocean Drilling Project, College Station, TX, 1992.
Alt, J.C., W.C. Shanks III, and M.C. Jackson, Cycling of sulfur in subduction zones; the
geochemistry of sulfur in the Mariana island arc and back-arc trough, Earth Planet.
Sci. Lett., 119, 477-494, 1993.
Anderson, D.L., Theory of the Earth, 366 pp., Blackwell Scientific, Cambridge, Mass.,
1989.
Anderson, R.N., Heat flow in the Mariana marginal basin, J. Geophys. Res., 80, 4043-4048,
1975.
Ando, M., Y. Ishikawa, and F. Yamazaki, Shear wave polarization anisotropy in the upper
mantle beneath Honshu, Japan, J. Geophys. Res., 88, 5850-5864, 1983.
Aramaki, S., and J. Itoh, Rocks of Niijima volcano, in Characterization of Volcanic rocks in
Izu Islands: Data set for Prevention of Volcanic Hazard, pp. 31-45, Bureau of
General Affair, Disaster Prevention Division, Tokyo Metropolitan Government,
1993.
Aramaki, S., S. Oshima, K. Ono, S. Sudoh, and J. Itoh, Rocks of Kozushima volcano., in
Characterization of Volcanic rocks in Izu Islands: Data set for Prevention of
Volcanic Hazard, pp. 7-29, Tokyo Metropolitan Government, 1993.
Bartolini, A., and R.L. Larson, Pacific microplate and the Pangea supercontinent in the Early
to Middle Jurassic, Geology, 29, 735-738, 2001.

47
Bellaiche, G., Sedimentation and structure of the Izu-Ogasawara (Bonin) Trench off Tokyo:
New lights on the results of a diving campaign with the Bathyscape "Archimede",
Earth Planet. Sci. Lett., 47, 124-130, 1980.
Bibee, L.D., G.G.S. Jr., and R.S. Lu, Inter-arc spreading in the Mariana Trough, Marine
Geol., 35, 183-197, 1980.
Bloomer, S.H., Distribution and origin of igneous rocks from the landward slopes of the
Mariana Trench: Implications for its structure and evolution, J. Geophys. Res., 88,
7411-7428, 1983.
Bloomer, S.H., and J.W. Hawkins, Gabbroic and ultramafic rocks from the Mariana
Trench: An Island Arc ophiolite, in The Tectonic and Geologic Evolution of
Southeast Asian Seas and Islands: Part 2. Geophysical Monograph 27, edited by
D.E. Hayes, pp. 294-317, American Geophysical Union, Washington D.C., 1983.
Bloomer, S.H., and J.W. Hawkins, Petrology and geochemistry of boninite series volcanic
rocks from the Mariana Trench, Contrib. Mineral. Petrol., 97, 361-377, 1987.
Bloomer, S.H., R.J. Stern, E. Fisk, and C.H. Geschwind, Shoshonitic Volcanism in the
Northern Mariana Arc. 1. Mineralogic and Major and Trace Element Characteristics,
J. Geophys. Res., 94, 4469-4496, 1989a.
Bloomer, S.H., R.J. Stern, and N.C. Smoot, Physical volcanology of the submarine Mariana
and Volcano Arcs, Bull. Volcanol., 51, 210-224, 1989b.
Bloomer, S.H., B. Taylor, C.J. MacLeod, and e. al., Early Arc volcanism and the Ophiolite
problem: A perspective from drilling in the Western Pacific, in Active Margins and
Marginal Basins of the Western Pacific, edited by B. Taylor, and J. Natland, pp.
67-96, AGU Geophysical Monograph 88, American Geophysical Union,
Washington D.C., 1995.
Bodine, J.H., and A.B. Watts, On Lithospheric Flexure seaward of the Bonin and Mariana
Trenches, Earth Planet. Sci. Lett., 43, 132-148, 1979.
Brudzinski, M.R., W.-P. Chen, R.L. Nowack, and B.S. Huang, Variations of P wave speeds
in the mantle transition zone beneath the northern Philippine Sea, J. Geophys. Res.,
102 (6), 11,815-11,827, 1997.
Bryant, C.J., R.J. Arculus, and S.M. Eggins, Laser ablation - inductively coupled plasma
mass spectrometry and tephras: A new approach to understanding arc-magma
genesis, Geology, 27, 1119-1122, 1999.
Burns, L.E., The Border Ranges ultramafic and mafic complex, south-central Alaska:
cumulate fractionates of island-arc volcanics, Can. J. Earth Sci., 22, 1020-1038,
1995.

48
Castillo, P.R., R.W. Carlson, and R. Batiza, Origin of Nauru Basin igneous complex: Sr,
Nd, and Pb isotope and REE constraints, Earth Planet. Sci. Lett., 103, 200-213,
1991.
Castillo, P.R., P.A. Floyd, and C. France-Lanord, Isotope geochemistry of Leg 129:
Implications for the origin of the widespread Cretaceous volcanic event in the
Pacific, in Proceedings of the Ocean Drilling Project, Scientific Results, edited by
R.L. Larson, Y. Lancelot, et al., pp. 405-413, Ocean Drilling Project, College Station,
TX, 1992.
Castillo, P.R., M.S. Pringle, and R.W. Carlson, East Mariana Basin tholeiites: Cretaceous
intraplate basalts or rift basalts related to the Ontong Java plume?, Earth Planet. Sci.
Lett., 123, 139-154, 1994.
Castle, J.C., and K.C. Creager, Topography of the 660-km seismic discontinuity beneath
Izu-Bonin: Implications for tectonic history and slab deformation, J. Geophys. Res.,
103, 12,511-12,527, 1998.
Castle, J.C., and K.C. Creager, A steeply dipping discontinuity in the lower mantle beneath
Izu-Bonin, J. Geophys. Res., 104, 7279-7292, 1999.
Channell, J.T., E. Erba, M. Nakanishi, and K. Tamaki, Late Jurassic-Early Cretaceous time
scales and oceanic magnetic anomaly block models, in Geochronology, time scales
and global stratigraphic correlation, edited by W.A. Berggren, D.V. Kent, M.-P.
Aubry, and J. Hardenbol, pp. 51-63, SEPM Special Publication, Tulsa, 1995.
Chaussidon, M., and A. Jambon, Boron content and isotopic composition of oceanic
basalts: Geochemical and cosmochemical implications, Earth Planet. Sci. Lett., 121,
277-291, 1994.
Christensen, N.J., and W.D. Mooney, Seismic velocity structure and composition of the
continental crust: A global view, J. Geophys. Res., 100, 9761-9788, 1995.
Cloos, M., Thrust-type subduction earthquakes and seamount asperities: A physical model
for seismic rupture, Geology, 20, 601-604, 1992.
Cloud, P.E., Jr., R.G. Schmidt, and H.W. Burke, Geology of Saipan, Mariana Islands. Part
1. General Geology, pp. 126, U.S. Geological Survey Professional Paper 280,
Washington DC, 1956.
Collier, J.D., and G.R. Helffrich, Topography of the "410" and "660" km seismic
discontinuities in the Izu-Bonin subduction zone, Geophys. Res. Lett., 24, 1535-
1538, 1997.
Corwin, G., L.D. Bonham, M.J. Terman, and G.W. Viele, Military Geology of Pagan,
Mariana Islands, pp. 259, United States Army, Washington, D.C., 1957.

49
Cosca, M.A., R.J. Arculus, J.A. Pearce, and J.G. Mitchell, 40Ar/39Ar and K-Ar
geochronological age constraints for the inception and early evolution of the Izu-
Bonin-Mariana arc sysem, The Island Arc, 7, 1998.
Crawford, A.J., T.J. Falloon, and D.H. Green, Classification, petrogenesis and tectonic
setting of boninites, in Boninites and Related Rocks, edited by A.J. Crawford, pp. 1-
49, Unwin Hyman, Boston, 1989.
Creager, K.C., and T.H. Jordan, Slab penetration into the lower mantle beneath the Mariana
and other island arcs of the Northwest Pacific, J. Geophys. Res., 91, 3573-3589,
1986.
Davis, A.S., M.S. Pringle, L.G. Pickthorn, and D.A. Clague, Petrology and age of Alkalic
Lava from the Ratak Chain of the Marshall Islands, J. Geophys. Res., 94, 5757-
5774, 1989.
DeBari, S.M., B. Taylor, K. Spencer, and K. Fujioka, A trapped Philippine Sea plate origin
for MORB from the inner slope of the Izu-Bonin trench, Earth Planet. Sci. Lett.,
174, 183-197, 1999.
DeMets, C., R.G. Gordon, D.D. Argus, and S. Stein, Effect of recent revisions to the
geomagnetic reversal time scale on estimates of current plate motions, Geophys. Res.
Lett., 21, 2191-2194, 1994.
Dick, H.J.B., and T. Bullen, Chromian spinels as a petrogenetic indicator in abyssal and
alpine-type peridotites and spatially associated lavas, Contrib. Mineral. Petrol., 86,
54-76, 1984.
Dixon, T.H., and R.J. Stern, Petrology, chemistry, and isotopic composition of submarine
volcanoes in the southern Mariana arc, Geol. Soc. Am., Bull., 94, 1159-1172, 1983.
Drummond, M.S., and M.J. Defant, A model for trondhjemite-tonalite-dacite genesis and
crustal growth via slab melting: Archean to modern comparisons, J. Geophys. Res.,
95, 503-521, 1990.
Eiler, J.M., A. Crawford, T. Elliott, K.A. Farley, J.W. Valley, and E.M. Stolper, Oxygen
Isotope Geochemistry of Oceanic-Arc lavas, J. Petrol., 41, 229-256, 2000.
Elliott, T., T. Plank, A. Zindler, W. White, and B. Bourdon, Element transport from slab to
volcanic front at the Mariana arc, J. Geophys. Res., 102, 14,991-15,019, 1997.
Engdahl, E.R., R.D. van der Hilst, and R. Buland, Global teleseismic earthquake relocation
with improved travel times and procedures for depth determination, Bull. Seismol.
Soc. Am., 88, 722-743, 1998.
Fischer, K.M., T.H. Jordan, and K.C. Creager, Seismic constraints on the morphology of
deep slabs, J. Geophys. Res., 93, 4773-4783, 1988.

50
Flanagan, M.P., and P.M. Shearer, Global mapping of topography on transition zone
velocity discontinuities by stacking SS precursors, J. Geophys. Res., 103, 2673-
2692, 1998.
Fliedner, M.M., and Klemperer, S.L., Structure of an island-arc; wide-angle seismic studies
in the eastern Aleutian Islands, Alaska, J. Geophys. Res., 104, 10,667-10,694.
Fliedner, M.M., and S.L. Klemperer, The transition from oceanic arc to continental arc in
the crustal structure of the Aleutian Arc, Earth and Planetary Science Letters, 179,
567-579, 2000.
Fouch, M.J., and K.M. Fischer, Mantle anisotropy beneath northwest Pacific subduction
zones, J. Geophys. Res., 101, 15,987-16,002, 1996.
Fouch, M.J., and K.M. Fischer, Shear wave anisotropy in the Mariana subduction zone,
Geophys. Res. Lett., 25, 1221-1224, 1998.
Fryer, P., A synthesis of Leg 125 Drilling of Serpentine Seamounts on the Mariana and
Izu-Bonin forearcs, in Proceedings of the Ocean Drilling Project, Scientific Results,
edited by P. Fryer, J. Pearce, L.B. Stokking, et al., pp. 3-11, Ocean Drilling
Program, College Station, 1992.
Fryer, P., Evolution of the Mariana Convergent Margin, Rev. Geophys., 34, 89-125, 1996a.
Fryer, P., Geology of the Mariana Trough, in Back-arc Basins: Tectonics and Magmatism,
edited by B. Taylor, Plenum Press 1995.
Fryer, P., J.B. Gill, and M.C. Jackson, Volcanologic and tectonic evolution of the Kasuga
seamounts, northern Mariana Trough: Alvin submersible investigations, J. Volcanol.
Geotherm. Res., 79, 277-311, 1997.
Fryer, P., M. Mottl, J. L., S. Phipps, and H. Maekawa, Serpentine bodies in the Forearcs of
Western Pacific Convergent Margins: Origin and Associated Fluids, in Active
Margins and Marginal Basins of the Western Pacific Convergent Margins, edited
by B. Taylor, and J. Natland, pp. 259-270, AGU Geophysical Monograph 88,
American Geophysical Union, Washington DC, 1995.
Fryer, P., and M.J. Mottl, "Shinkai 6500" investigations of a resurgent mud volcano on the
Southeastern Mariana forearc, JAMSTEC Journal of Deep Sea Research, 13, 103-
114, 1997.
Fryer, P., K.L. Saboda, L.E. Johnson, M.E. Mackay, G.F. Moore, and P. Stoffers, Conical
Seamount: SeaMARC II, ALVIN Submersible, and seismic-reflection studies, in
Proceedings of the Ocean Drilling Project, Scientific Results, edited by P. Fryer,
and J. Pearce, pp. 3-11, Ocean Drilling Project, College Station, 1990a.

51
Fryer, P., B. Taylor, C.H. Langmuir, and A.G. Hochstaedter, Petrology and geochemistry of
lavas from the Sumisu and Torishima backarc rifts, Earth Planet. Sci. Lett., 100,
161-178, 1990b.
Fryer, P., C.G. Wheat, and M. Mottle, Mariana blueschist mud volcanism; implications for
conditions within the subduction zone, Geology, 27, 103-106, 1999.
Fukao, Y., M. Obayashi, H. Inoue, and M. Nenbai, Subducting slabs stagnant in the mantle
transition zone, J. Geophys. Res., 97, 4809-4822, 1992.
Garcia, M.O., N.W.K. Liu, and D.W. Muenow, Volatiles in submarine volcanic rocks from
the Mariana Island arc and trough, Geochim. Cosmochim. Acta, 43, 305-312, 1979.
Gill, J.B., C. Seales, P. Thompson, A.G. Hochstaedter, and C. Dunlap, Petrology and
Geochemistry of Pliocene-Pleistocene volcanic rocks from the Izu Arc, Leg 126, in
Proceedings of the Ocean Drilling Program, Scientific Results, edited by B. Taylor,
K. Fujioka, et al., pp. 383-404, Ocean Drilling Program, College Station, 1992.
Gill, J.B., and R.W. Williams, Th isotope and U-series studies of subduction-related
volcanic rocks, Geochim. Cosmochim. Acta, 54, 1427-1442, 1990.
Green, H.W., and H. Houston, The mechanics of deep earthquakes, Ann. Rev. Earth Planet
Sci., 23, 169-213, 1995.
Gribble, R.F., R.J. Stern, S.H. Bloomer, D. Stüben, T. O'Hearn, and S. Newman, MORB
Mantle amd subduction components interact to generate basalts in the southern
Mariana Trough back-arc basin, Geochim. Cosmochim. Acta, 60, 2153-2166, 1996.
Gribble, R.F., R.J. Stern, S. Newman, S.H. Bloomer, and T. O'Hearn, Chemical and
Isotopic Composition of Lavas from the Northern Mariana Trough: Implications for
Magmagenesis in Back-arc basins, J. Petrol., 39, 125-154, 1998.
Gu, Y., A.M. Dziewonski, and C.B. Agee, Global de-correlation of the topography of
transition zone discontinuities, Earth Planet. Sci. Lett., 157, 57-67, 1998.
Haggerty, J.A., Evidence from fluid seeps atop serpentine seamounts in the Mariana
Forearc: Clues for emplacement of the seamounts and their relationship to forearc
tectonics, Marine Geol., 102, 293-309, 1991.
Haggerty, J.A., and S. Chaudhuri, Strontium isotopic composition of the interstitial waters
from Leg 125: Mariana and Bonin forearcs, in Proceedings of the Ocean Drilling
Project, Scientific Results, edited by P. Fryer, J. Pearce, L.B. Stokking, and e. al.,
pp. 397-400, Ocean Drilling Program, College Station, 1992.
Hall, R., M. Fuller, J.R. Ali, and C.D. Anderson, The Philippine Sea Plate: Magnetism and
Reconstructions, in Active Margins and Marginal Basins of the Western Pacific,
52
edited by B. Taylor, and J. Natland, pp. 371-404, AGU Geophysical Monograph
88, American Geophysical Union Monograph, Wachington DC, 1995.
Hamuro, K., S. Aramaki, K. Fujioka, T. Ishii, and T. Tanaka, The Higashi-Izu-Oki
submarine volcanoes, Part 2, and the submarine volcanoes near the Izu Shoto
Islands (in Japanese), Bull. Earthquake Res. Inst., 58, 527-557, 1983.
Handschumacher, D.W., W.W. Sager, T.W.C. Hilde, and D.R. Bracey, Pre-Cretaceous
tectonic evolution of the Pacific plate and extension of the geomagnetic polarity
reversal time scale with implications for the origin of the Jurassic "Quiet Zone",
Tectonophy., 155, 365-380, 1988.
Harland, W.B., R.L. Armstrong, A.V. Cox, L.E. Craig, A.G. Smith, and D.G. Smith, A
Geologic Time Scale, 263 pp., Cambridge University Press, Cambridge, UK, 1990.
Harry, D.L., and J.F. Ferguson, Bounding the state of stress at oceanic convergent zones,
Tectonophys., 187, 305-314, 1991.
Hart, S.R., A large scale isotope anomaly in the Southern Hemisphere mantle, Nature, 309,
753-757, 1984.
Hart, S.R., Heterogeneous mantle domains: Signatures, genesis and mixing chronologies,
Earth Planet. Sci. Lett., 90, 273-296, 1988.
Hart, S.R., W.E. Glassley, and D.E. Karig, Basalts and sea floor spreading behind the
Mariana Island Arc, Earth Planet. Sci. Lett., 15, 12-18, 1972.
Hawkins, J.W., P.F. Lonsdale, J.D. Macdougall, and A.M. Volpe, Petrology of the axial
ridge of the Mariana Trough backarc spreading center, Earth Planet. Sci. Lett., 100,
226-250, 1990.
Hawkins, J.W., and Melchior, Petrology of Mariana Trough and Lau Basin basalts, J.
Geophys. Res., 90, 11,431-11,468, 1985.
Hess, H.H., Major structural features of the western North Pacific, An interpretation of
H.O. 5485, Bathymetric chart, Korea to New Guinea, Geol. Soc. Am. Bull., 59, 417-
445, 1948.
Hickey, R.L., and F.A. Frey, Geochemical characteristics of boninite series volcanics:
Implications for their source, Geochim. Cosmochim. Acta, 45, 2099-2115, 1982.
Hickey-Vargas, R., J.M. Hergt, and P. Spadea, The Indian Ocean-type isotopic signature in
Western Pacific marginal basins: Origin and significance, in Active Margins and
Marginal Basins of the Western Pacific, edited by B. Taylor, and J. Natland, pp.
175-197, AGU Geophysical Monograph 88, American Geophysical Union,
Washinton DC, 1995.

53
Hickey-Vargas, R.L., and M. Reagan, Temporal variations of isotope and rare earth element
abundances from Guam: Implications for the evolution of the Mariana island arc,
Contrib. Mineral. Petrol., 97, 497-508, 1987.
Hino, R., A study on the crustal structure of the Izu-Bonin arc by airgun-OBS profiling,
Ph.D. thesis, Tohoku University, Sendai, Japan, 1991.
Hobbs, W.H., The Asiatic Arcs, Bull. Geol. Soc. Am., 34, 243-252, 1923.
Hochstaedter, A.G., J.B. Gill, M. Kusakabe, S. Newman, M. Pringle, B. Taylor, and P.
Fryer, Volcanism in the Sumisu Rift, I. Major element, volatile, and stable isotope
geochemistry, Earth and Planetary Science Letters, 100, 179-194, 1990a.
Hochstaedter, A.G., J.B. Gill, and J.D. Morris, Volcanism in the Sumisu Rift, II.
Subduction and non-subduction related components, Earth and Planetary Science
Letters, 100, 195-209, 1990b.
Hochstaedter, A., J. Gill, R. Peters, P. Broughton, P. Holden, and B. Taylor, Across-Arc
Geochemical trends in the Izu-Bonin Arc: Contributions from the Subducting Slab,
Geochem. Geophys. Geosyst., 2 (Article), 2000GC000105, 2001.
Hofmann, A.W., Chemical differentiation of the Earth: The relationship between mantle,
continental crust, and oceanic crust, Earth Planet. Sci. Lett., 90, 297-314, 1988.
Holbrook, W.S., D. Lizarralde, S. McGeary, N. Bangs, and J. Deibold, Structure and
composition of the Aleutian island arc and implications for continental crustal
growth, Geology, 27, 31-34, 1999.
Honza, E., and K. Tamaki, The Bonin Arc, in The Ocean Basins and Margins, edited by
A.E. Nairn, F.G. Stehli, and S. Uyeda, pp. 459-502, Plenum Publishing Co,, 1985.
Hussong, D.M., and S. Uyeda, Tectonic processes and the history of the Mariana Arc, A
synthesis of the results of Deep Sea Drilling leg 60, in Initial Reports of the Deep
Sea Drilling Project, edited by D.M. Hussong, et al., pp. 909-929, U.S. Government
Printing Office, Washington D.C., 1982.
Hyndman, R.D., and S.L. Klemperer, Lower-crustal porosity from electrical measurements
and inferences about composition from seismic velocities, Geophys. Res. Lett., 16,
255-258, 1989.
Iidaka, T., and Y. Furukawa, Double seismic zone for deep earthquakes in the Izu-Bonin
subduction zone, Science, 263 (5150), 1116-1118, 1994.
Iizasa, K., R.S. Fiske, O. Ishizuka, M. Yuasa, J. Hashimoto, J. Ishibashi, J. Naka, Y. Horii,
Y. Fujiwara, A. Imai, and S. Koyama, A Kuroko-type polymetallic sulfide deposit in
a submarine silicic caldera, Science, 283, 975-977, 1999.

54
Ikeda, Y., K. Nagao, R.J. Stern, M. Yuasa, and S. Newman, Noble gases in pillow basalt
glasses from the northern Mariana Trough back-arc basin, The Island Arc, 7, 471-
478, 1998.
Ikeda, Y., and M. Yuasa, Volcanism in nascent back-arc basins behind the Shichito Ridge
and adjacent areas in the Izu-Ogasawara arc, northwest Pacific: Evidence for mixing
between E-type MORB and island arc magmas at the initiation of back-arc rifting,
Contrib. Mineral. Petrol., 101, 377-393, 1989.
Ishihara, T., and T. Yamazaki, Gravity anomalies over the Izu-Ogasawara (Bonin) and
northern Mariana Arcs, Bull. Geol. Surv. Japan, 42, 687-701, 1991.
Ishii, T., Dredged samples from the Ogasawara fore-arc seamount of "Ogasawara
Paleoland" - "Fore-arc Ophiolite", in Formation of Active Ocean Margins, edited by
N. Nasu, and e. al., pp. 307-342, Terra Scientific Publishing, Tokyo, 1985.
Ishii, T., P.T. Robinson, H. Maekawa, and R. Fiske, Petrological studies of peridotites from
diapiric Serpentinite Seamounts in the Izu-Ogasawara-Mariana forearc, Leg 125, in
Proceedings of the Ocean Drilling Project, Scientific Results, edited by P. Fryer, J.
Pearce, L.B. Stokking, et al., pp. 445-485, Ocean Drilling Program, College Station,
1992.
Ishikawa, T., and E. Nakamura, Origin of the slab component in arc lavas from across-arc
variation of B and Pb isotopes, Nature, 370, 205-208, 1994.
Ishikawa, T., and F. Tera, Two isotopically distinct fluid components involved in the
Mariana Arc; evidence from Nb/B ratios and B, Sr, Nd, and Pb isotope systematics,
Geology, 27, 83-86, 1999.
Ishizaka, K., and T. Yanagi, K, Rb, and Sr abundances and Sr isotopic composition of the
Tanzawa granitic and associated gabbroic rocks, Japan: Low-potash island arc
plutonic complex, Earth Planet. Sci. Lett., 33 , 345-352, 1977.
Ishizuka, O., K. Uto, M. Yuasa, and A.G. Hochstaedter, K-Ar ages from seamount chains in
the back-arc region of the Izu-Ogasawara arc, The Island Arc, 7, 408-421, 1998.
Isshiki, N., Ao-ga-sima Volcano, Jap. J. Geol. Geog., 27, 209-218, 1955.
Isshiki, N., Petrology of Hachijo-Jima volcano group, Seven Izu Islands, Japan, J. Fac. Sci.,
U. Tokyo, 15, 91-134, 1963.
Ito, E., and R.J. Stern, Oxygen- and strontium-isotopic investigations of subduction zone
volcanism: The case of the Volcano Arc and the Marianas Island Arc, Earth Planet.
Sci. Lett., 76, 312-320, 1986.
Ito, E., W.M. White, and C. Göpel, The O, Sr, Nd, and Pb isotope geochemistry of MORB,
Earth Planet. Sci. Letters, 62, 157-176, 1987.

55
Itoh, Y., Differential rotation of the northern part of southwest Japan: Paleomagnetism of
Early to Late Miocene rocks from Yatsuo Area in Chichibu District, J. Geomag.
Geo-elec., 38, 325-334, 1986.
Jackson, M.C., Petrology and Petrogenesis of Recent Submarine Volcanics from the
Northern Mariana Arc and Back-Arc Basin, Ph.D. thesis, University of Hawaii,
Honolulu, 1989.
Jackson, M.C., Crystal accumulation and Magma Mixing in the Petrogenesis of Tholeiitic
Andesites from Fukujin Seamount, Northern Mariana Island Arc, J. Petrol., 34, 259-
289, 1993.
Jaggar, T., Myojin Reef, Volcano Notes (518), 13-14, 1952.
Johnson, L.E., Mafic clasts in serpentine seamounts: Petrology and geochemistry of a
diverse crustal suite from the outer Mariana forearc, in Proceedings of the Ocean
Drilling Project, Scientific Results, edited by P. Fryer, J. Pearce, L.B. Stokking, et
al., pp. 401-413, Ocean Drilling Program, College Station, 1992.
Johnson, L.E., P. Fryer, B. Taylor, and e. al., New evidence for crustal accretion in the outer
Mariana forearc: Cretaceous Radiolarian cherts and MORB-like lavas, Geology, 19,
811-814, 1991.
Karig, D.E., Origin and development of marginal basins in the western Pacific, J. Geophys.
Res., 76, 2542-2561, 1971a.
Karig, D.E., Structural history of the Mariana island arc system, Geol. Soc. Am. Bull., 82,
323-344, 1971b.
Karig, D.E., Remnant arcs, Geol. Soc. Am. Bull., 83, 1057-1068, 1972.
Katsumata, M., and L.R. Sykes, Seismicity and tectonics of the western Pacific: Izu-
Mariana-Caroline and Ryukyu-Taiwan regions, J. Geophys. Res., 74, 5923-5948,
1969.
Kawate, S., and M. Arima, Petrogenesis of the Tanzawa plutonic complex, central Japan:
Exposed felsic middle crust of the Izu-Bonin-Mariana arc, The Island Arc, 7, 342-
358, 1998.
Klaus, A., and B. Taylor, Submarine canyon development in the Izu-Bonin forearc: A
SeaMARC II and Seismic Survey of Aoga Shima, Marine Geophys. Res., 13, 131-
152, 1991.
Klaus, A., B. Taylor, G.F. Moore, F. Murakami, and Y. Okamura, Back-arc rifting in the
Izu-Bonin Island Arc: Structural evolution of Hachijo and Aoga Shima rifts, The
Island Arc, 1, 16-31, 1992.

56
Kobayashi, K., S. Kasuga, and K. Okino, Shikoku Basin and Its Margins, in Backarc
Basins: Tectonics and Magmatism, edited by B. Taylor, pp. 381-405, Plenum Press,
New York, 1995.
Kotake, Y., T. Kato, S. Miyazaki, and A. Sengoku, Relative motion of the Philippine Sea
Plate derived from GPS observations and tectonics of the south-western Japan (in
Japanese), Zisin, J. Seismol. Soc., Jap., 51, 171-180, 1998.
Lange, K., Auswertung eines weitwinkelreflexions- und refraktionsseismischen Profils im
suedlichen Marianen Backarc Becken, Diplomarbeit thesis, Hamburg U., Hamburg,
1992.
Larson, E.E., R.L. Reynolds, R. Merrill, S. Levi, M. Ozima, Y. Aoki, H. Kinoshita, S.
Zasshu, N. Kawai, T. Nakajima, and K. Hirooka, Major-element Petrochemistry of
some Extrusive Rocks from the Volcanically Active Mariana Islands, Bull.
Volcanol., 38, 361-377, 1975.
Larson, R.L., and C.G. Chase, Late Mesozoic evolution of the western Pacific Ocean, Geol.
Soc. Am. Bull., 83, 3627-3644, 1972.
LaTraille, S.L., and D.M. Hussong, Crustal structure across the Mariana Island Arc, in The
Tectonic and Geologic Evolution of Southeast Asian Seas and Islands.
Geophysical Monograph 23, edited by D.E. Hayes, pp. 209-221, American
Geophysical Union, Washington DC, 1980.
Lay, T., Structure and Fate of Subducting Slabs, 185 p. pp., Academic Press, San Diego,
1994.
Le Pichon, X., T. Iiyama, H. Chamley, M. Faure, H. Fujimoto, T. Furuta, Y. Ida, H. Kagami,
S. Lalemant, J. Leggett, A. Murata, H. Okada, C. Rangin, V. Renard, A. Taira, and
H. Tokuyama, The eastern and western ends of Nankai Trough, results of Box 5
and Box 7 Kaiko survey, Earth Planet. Sci. Lett., 83, 199-213, 1987.
Lee, J., and R.J. Stern, Glass inclusions in Mariana Arc phenocrysts; A new perspective on
magmatic evolution in a typical intra-oceanic arc, J. Geol., 106, 19-33, 1998.
Lee, J., R.J. Stern, and S.H. Bloomer, Forty million years of magmatic evolution in the
Mariana Arc: The tephra glass record, J. Geophys. Res., 100, 17,671-17,687, 1995.
Lin, P.-N., Trace element and isotopic characteristics of western Pacific pelagic sediments:
Implications for the petrogenesis of Mariana Arc magmas, Geochim. Cosmochim.
Acta, 56, 1641-1654, 1992.
Lin, P.N., R.J. Stern, and S.H. Bloomer, Shoshonitic volcanism in the Northern Mariana
Arc. 2. Large-ion lithophile and rare earth element abundances: Evidence for the

57
source of incompatible element enrichments in Intraoceanic Arcs, J. Geophys. Res.,
94, 4497-4514, 1989.
Lin, P.N., R.J. Stern, J. Morris, and S.H. Bloomer, Nd- and Sr-isotopic compositions of
lavas from the northern Mariana and southern Volcano arcs: Implications for the
origin of island arc melts, Contrib. Mineral. Petrol., 105, 381-392, 1990.
Macpherson, C.G., D.R. Hilton, D.P. Mattey, and J.M. Sinton, Evidence for an 18O-
depleted mantle plume from contrasting 18O/16O ratios of back-arc lavas from the
Manus Basin and Mariana Trough, Earth Planet. Sci. Lett., 176, 171-183, 2000.
Maekawa, H., M. Shozuni, T. Ishii, P. Fryer, and J.A. Pearce, Blueschist metamorphism in
an active subduction zone, Nature, 364, 520-523, 1993.
Mahoney, J.J., and S. K.J., Isotopic evidence for the origin of the Manihiki and Ontong
Java oceanic plateaus, Earth Planet. Sci. Lett., 104, 196-210, 1991.
Marlow, M.S., L.E. Johnson, J.A. Pearce, P. Fryer, L.B.G. Pickhorn, and B.J. Murton,
Upper Cenozoic volcanic rocks in the Mariana forearc recovered from drilling at
Ocean Drilling Program Site 781: Implications for forearc magmatism, J. Geophys.
Res., 97, 15,085-15,098, 1992.
Martinez, F., P. Fryer, N.A. Baker, and T. Yamazaki, Evolution of Backarc Rifting: Mariana
Trough, 20°-24°N, J. Geophy. Res., 100, 3807-3827, 1995.
Martinez, F., P. Fryer, and N. Becker, Geophysical characteristics of the southern Mariana
Trough, 11°50'N-13°40'N, J. Geophys. Res., 105, 16,591-16,607, 2000.
Matsuhisa, Y., Oxygen Isotopic compositions of Volcanic Rocks from the East Japan Island
Arcs and their Bearing on Petrogenesis, J. Volcanol. Geotherm. Res., 5, 271-296,
1979.
McCaffrey, R., Estimates of modern arc-parallel strain rates in fore arcs, Geology, 24, 27-30,
1996.
McCulloch, M.T., and A.J. Gamble, Geochemical and geodynamical constraints on
subduction zone magmatism, Earth Planet. Sci. Lett., 102, 358-374, 1991.
McDermott, F., and C. Hawkesworth, Th, Pb, and Sr isotope variations in young island arc
volcanics and oceanic sediments, Earth Planet. Sci. Lett., 104, 1-15, 1991.
McDonald, G.A., Petrography of Iwo Jima, Geol. Soc. Am. Bull., 59, 1009-1018, 1948.
McMurtry, G.M., P.N. Sedwick, P. Fryer, D.L. Vonderhaar, and H.-W. Yeh, Unusual
geochemistry of Hydrothermal Vents on Submarine Arc Volcanoes: Kasuga
Seamounts, Northern Mariana Arc, Earth Planet. Sci. Lett., 114, 517-528, 1993.
McNutt, M.K., E.L. Winterer, W.W. Sager, J.H. Natland, and G. Ito, The Darwin Rise:
Cretaceous Superswell?, Geophys. Res. Lett., 17, 1101-1108, 1990.

58
Meen, J.K., R.J. Stern, and S.H. Bloomer, Evidence for magma mixing in the Mariana arc
system, The Island Arc, 7, 443-459, 1998.
Meijer, A., Pb and Sr isotopic data bearing on the origin of volcanic rocks from the Mariana
island-arc system, Geol. Soc. Am. Bull., 87, 1358-1369, 1976.
Meijer, A., Mariana-Volcano Islands, in Andesites, edited by R.S. Thorpe, pp. 293-306,
John Wiley and Sons, 1982.
Meijer, A., The origin of low-K rhyolites from the Mariana frontal arc, Contrib. Mineral.
Petrol., 83, 45-51, 1983.
Meijer, A., M. Reagan, H. Ellis, M. Shafiqullah, J. Sutter, P. Damon, and K. S., Chronology
of Volcanic Events in the Eastern Philippine Sea, edited by D.E. Hayes, pp. 349-
359, The Tectonic and Geologic Evolution of Southeast Asian Seas and Islands Part
2, AGU Geophysical Monograph 27, American Geophysical Union, Washington
DC, 1983.
Menard, H.W., Darwin Reprise, J. Geophys. Res., 89, 9960-9968, 1984.
Moriguti, T., and E. Nakamura, Across-arc variation of Li isotopes in lavas and implications
for crust/mantle recycling at subduction zones, Earth Planet. Sci. Lett., 164, 167-
174, 1998.
Morimoto, R., and J. Ossaka, The 1970-activity of Myojin reef, J. Earthquake Stud. (in
Japanese), 79, 301-320, 1970.
Mottl, M.J., Pore waters from Serpentinite Seamounts in the Mariana and Izu-Bonin
forearcs, Leg 125: Evidence for volatiles from the Subducting Slab, in Proceedings
of the Ocean Drilling Project, Scientific Results, edited by P. Fryer, J. Pearce, L.B.
Stokking, et al., pp. 373-385, Ocean Drilling Program, College Station, 1992.
Mrozowski, C.L., and D.E. Hayes, A seismic reflection study of faulting in the Mariana
Fore Arc, in The Tectonic and Geologic Evolution of Southeast Asian Seas and
Islands, edited by D.E. Hayes, pp. 223-234, AGU Geophysical Monograph 23,
American Geophysical Union, Washington DC, 1980.
Murauchi, S., N. Den, S. Asano, H. Hotta, T. Yoshii, T. Asanuma, K. Hagiwara, K.
Ichikawa, T. Sato, W.J. Ludwig, J.I. Ewing, N.T. Edgar, and R.E. Houtz, Crustal
structure of the Philippine Sea, J. Geophys. Res., 73, 3143-3171, 1968.
Nakajima, K., and M. Arima, Melting experiments on hydrous low-K tholeiite: Implications
for the genesis of tonalitic crust in the Izu-Bonin-Mariana arc, The Island Arc, 7,
359-373, 1998.
Nakamura, M., M. Ando, and T. Ohkura, Fine structure of deep Wadati-Benioff zone in the
Izu-Bonin region estimated from S-to-P converted phase, Phys. Earth Planet. Int.,
106, 63-74, 1998.

59
Nakanishi, M., Topographic Expression of Five Fracture Zones in the Northwestern Pacific
Ocean, in The Mesozoic Pacific: Geology, Tectonics, and Volcanism, edited by
M.S. Pringle, Sager, W.W., Sliter, W.V., Stein S., pp. 121-136, AGU Geophysical
Monograph 97, American Geophysical Union, Washington D.C, 1993.
Nakanishi, M., K. Tamaki, and K. Kobayashi, Magnetic anomaly lineations from Late
Jurassic to Early Cretaceous in the west-central Pacific Ocean, Geophys. J. Internat.,
109, 701-719, 1992.
Newman, S., J.D. Macdougall, and R.C. Finkel, 230Th-238U disequilibrium in island arcs;
evidence from the Aleutians and Marianas, Nature, 308, 268-270, 1984.
Newman, S., E. Stolper, and R.J. Stern, H2O and CO2 in magmas from the Mariana arc and
back arc system, Geochem. Geophys. Geosyst., 1 (Article), 1999GC000027, 2000.
Niitsuma, N., Collision tectonics in the southern Fossa Magna, Modern Geol., 14, 3-18,
1989.
Notsu, K., N. Isshiki, and M. Hirano, Comprehensive strontium isotope study of
Quaternary volcanic rocks from the Izu-Ogasawara arc, Geochem. J. (17), 289-302,
1983.
Ogawa, Y., K. Kobayashi, H. Hotta, and K. Fujioka, Tension gashes on the oceanward
slopes of the northern Japan and Mariana Trenches, Marine Geol., 141, 111-123,
1997.
Park, C.-H., K. Tamaki, and K. Kobayashi, Age-depth correlation of the Philippine Sea
back-arc basins and other marginal basins in the world, Tectonophys., 181, 351-371,
1990.
Parkinson, I.J., C.J. Hawkesworth, and A.S. Cohen, Ancient mantle in a modern arc:
Osmium isotopes in Izu-Bonin-Mariana forearc peridotites, Science, 281, 2011-
2013, 1998.
Parkinson, I.J., and J.A. Pearce, Peridotites from the Izu-Bonin-Mariana forearc (ODP Leg
125); evidence for mantle melting and melt-mantle interaction in a supra-subduction
zone setting, J. Petrol., 39, 1577-1618, 1998.
Peacock, S.M., Are the lower planes of double seismic zones caused by serpentine
dehydration in subducted oceanic mantle?, Geology, 29, 299-302, 2001.
Pearce, J.A., N.B.W. Harris, and A.G. Tindle, Trace element discrimination diagrams for the
tectonic interpretation of granitic rocks, J. Petrol., 25, 956-983, 1984.

60
Pearce, J.A., P.D. Kempton, G.M. Nowell, and S.R. Noble, Hf-Nd Element and Isotope
Perspective on the Nature and Provenance of Mantle and Subduction Components
in Western Pacific Arc-Basin systems, J. Petrol., 40, 1579-1611, 1999.
Pearce, J.A., S.R. Van Der Laan, R.J. Arculus, B.J. Murton, T. Ishii, J.A. Peate, and I.J.
Parkinson, Boninite and Harzburgite from Leg 125 (Bonin-Mariana Forearc): A
Case Study of Magma Genesis during the Initial Stages of Subduction, in
Proceedings of the Ocean Drilling Program, edited by P. Fryer, J.A. Pearce, I.J.
Stokking, et al., pp. 623-659, College Station, 1992.
Peate, D.W., and J.A. Pearce, Causes of spatial compositional variations in Mariana arc
lavas: Trace element evidence, The Island Arc, 7, 479-495, 1998.
Petersen, J., Der Boninit von Peel island, Jahrbuch der Hamburischen
Wissenschafteftlichen Anstalten, Hamburg, 8, 341-349, 1890.
Peyton, V., V. Levin, J. Park, M. Brandon, J. Lees, E. Gordeev, and A. Ozerov, Mantle flow
at a slab edge: Seismic anisotropy in the Kamchatka region, Geophys. Res. Lett., 28,
379-382, 2001.
Phipps, S.P., and D. Ballotti, Rheology of Serpentine Muds in the Mariana-Izu-Bonin
forearc, in Proceedings of the Ocean Drilling Project, Scientific Results, edited by P.
Fryer, J.A. Pearce, L.B. Stokking, et al., pp. 363-372, Ocean Drilling Project,
College Station, 1990.
Plank, T., and C. Langmuir, The chemical composition of subducting sediment and its
consequence for the crust and mantle, Chem. Geol., 145, 325-394, 1998.
Poreda, R., Helium-3 and deuterium in backarc basalts: Lau and Mariana Trough, Earth
Planet. Sci. Lett., 73, 244-254, 1985.
Poreda, R., and H. Craig, Helium isotope ratios in circum-Pacific volcanic arcs, Nature, 338,
473-478, 1989.
Pringle, M.S., Radiometric ages of basaltic basement recovered at sites 800, 801, and 802,
Leg 129, Western Pacific Ocean, in Proceedings of the Ocean Drilling Project,
Scientific Results, edited by R.L. Larson, Y. Lancelot, et al., pp. 389-404, Ocean
Drilling Project, College Station, TX, 1992.
Reagan, M.K., and A. Meijer, Geology and geochemistry of early arc-volcanic rocks from
Guam, Geol. Soc. Am. Bull., 95, 701-713, 1984.
Revenaugh, J., and T.H. Jordan, Mantle layering from ScS reverberations: 2. The transition
zone, J. Geophys. Res., 96, 19,763-19,780, 1991.
Reymer, A., and G. Schubert, Phanerozoic addition rates to the continental crust and crustal
growth, Tectonics, 3, 63-77, 1984.
Ribe, N.M., Seismic anisotropy and mantle flow, J. Geophys. Res., 94, 4213-4223, 1989.
61
Richards, M.A., and C. Lithgow-Bertelloni, Plate motion changes, the Hawaiian-Emperor
Bend, and the apparent success and failure of geodynamic models, Earth Planet.
Sci. Lett., 137, 19-27, 1996.
Sager, W.W., Mariana Arc structure inferred from gravity and seismic data, J. Geophys.
Res., 85, 5382-5388, 1980.
Sakai, R., M. Kusakabe, M. Noto, and T. Ishii, Origin of waters responsible for
serpentinization of the Izu-Ogaswara-Mariana forearc seamounts in view of
hydrogen and oxygen isotope ratios, Earth Planet. Sci. Lett., 100, 291-303, 1990.
Samowitz, I.R., and D.W. Forsyth, Double seismic zone beneath the Mariana island arc, J.
Geophys. Res., 86, 7013-7021, 1981.
Sample, J.C., and D.E. Karig, A volcanic production rate for the Mariana Island Arc, J.
Volcanol. Geotherm. Res., 13, 73-82, 1982.
Sano, Y., Y. Nishio, T. Gamo, A. Jambon, and B. Marty, Noble gas and carbon isotopes in
Mariana Trough basalt glasses, Appl. Geochem., 13, 441-449, 1998.
Scholz, C.H., and J. Campos, On the mechanism of seismic decoupling and back arc
spreading at subduction zones, J. Geophys. Res., 100, 22,103-22,115, 1995.
Seno, T., S. Stein, and A.E. Gripp, A model for the motion of the Philippine Sea Plate
consistent with NUVEL-1 and geological data, J. Geophys. Res., 98, 17,941-17,948,
1993.
Shipboard Scientific Party, Site 60, in Initial Reports of the Deep Sea Drilling Project,
edited by A.G. Fischer, E.L. Winterer, W.R. Riedel, et al., pp. 587-629, U.S.
Government Printing Office, Washington, D.C., 1971.
Shipboard Scientific Party, Site 458: Mariana Fore-Arc, in Initial reports of the Deep Sea
Drilling Project, Leg 60, edited by D.M. Hussong, S. Uyeda, et al., pp. 263-307,
U.S. Government Printing Ofice, Washington DC, 1982a.
Shipboard Scientific Party, Site 459: Mariana Fore-Arc, in Initial Reports of the Deep Sea
Drilling Project, Leg 60, edited by D.M. Hussong, S. Uyeda, et al., pp. 309-369,
U.S. Government Printing Office, Washington D.C., 1982b.
Shearer, P.M., Global mapping of upper mantle reflectors from long-period SS precursors,
Geophys. J. Int., 115, 878-904, 1993.
Shearer, P.M., and T.G. Masters, Global mapping of topography on the 660-km
discontinuity, Nature, 355, 791-796, 1992.
Shipley, T.H., L.J. Abrams, Y. Lancelot, and R.L. Larson, Late Jurassic-Early Cretaceous
oceanic crust and Early Cretaceous volcanic sequences of the Nauru Basin, Western
Pacific, in The Mesozoic Pacific: Geology, Tectonics, and Volcanism, edited by
62
M.S. Pringle, W.W. Sager, W.V. Sliter, and S. Stein, pp. 103-119, AGU
Monograph 97, American Geophysical Union, Washington, D.C., 1993.
Silver, P.G., R.W. Carlson, and P. Olson, Deep slabs, geochemical heterogeneity and the
large-scale structure of mantle convection, Ann. Rev. Earth Planet Sci., 16, 477-541,
1988.
Silver, P.G., and W.W. Chan, Shear wave splitting and subcontinental mantle deformation,
J. Geophys. Res., 96, 16,429-16,454, 1991.
Sinton, J.B., and D.M. Hussong, Crustal structure of a Short Length Transform Fault in the
Central Mariana Trough, in The Tectonic and Geologic Evolution of Southeast
Asian Seas and Islands: Part 2. Geophysical Monograph 27, edited by D.E.
Hayes, pp. 236-254, American Geophysical Union, Washington DC, 1983.
Sinton, J.H., and P. Fryer, Mariana Trough lavas from 18°N: Implications for the origin of
back arc basin basalts, J. Geophys. Res., 92, 12,782-12,802, 1987.
Smoot, N.C., Ogasawara Plateau: Multi-beam sonar bathymetry and possible tectonic
implications, J. Geol., 91, 591-598, 1983.
Soh, W., K. Nakayam, and T. Kimura, Arc-arc collision in the Izu collision zone, central
Japan, deduced from the Ashigara Basin and adjacent Tanzawa Mountains, The
Island Arc, 7, 330-341, 1998.
Soh, W., K.T. Pickering, A. Taira, and H. Tokuyama, Basin evolution in the arc-arc Izu
Collision Zone, Mio-Pliocene Miura Group, central Japan, J. Geol. Soc., Lond.,
148, 317-330, 1991.
Staudigel, H., K.-H. Park, M. Pringle, J.L. Rubenstone, W.H.F. Smith, and A. Zindler, The
longevity of the South Pacific isotopic and thermal anomaly, Earth Planet. Sci. Lett.,
102, 24-44, 1991.
Stein, C., and S. Stein, A model for the global variation in oceanic depth and heat flow with
lithospheric age, Nature, 359, 123-129, 1992.
Stern, R.J., and L.D. Bibee, Esmeralda Bank: Geochemistry of an active submarine volcano
in the Mariana Island Arc, Contrib. Mineral. Petrol., 86, 159-169, 1984.
Stern, R.J., and S.H. Bloomer, Subduction zone infancy : Examples from the Eocene Izu-
Bonin-Mariana and Jurassic California, Geol. Soc. Am. Bull., 104, 1621-1636, 1992.
Stern, R.J., S.H. Bloomer, P.-N. Lin, and N.C. Smoot, Submarine arc volcanism in the
southern Mariana Arc as an ophiolite analogue, Tectonophys., 168, 151-170, 1989.
63
Stern, R.J., S.H. Bloomer, F. Martinez, T. Yamazaki, and T.M. Harrison, The composition
of back-arc basin lower crust and upper mantle in the Mariana Trough: A first
report, The Island Arc, 5, 354-372, 1996.
Stern, R.J., and E. Ito, Trace-element and isotopic constraints on the source of magmas in
the active Volcano and Mariana island arcs, Western Pacific, J. Volcanol. Geotherm.
Res., 18, 461-482, 1983.
Stern, R.J., M.C. Jackson, P. Fryer, and E. Ito, O, Sr, Nd, and Pb isotopic composition of
the Kasuga Cross-Chain in the Mariana Arc: A new perspective on the K-H
relationship, Earth Planet. Sci. Lett., 119, 459-475, 1993.
Stern, R.J., P.-N. Lin, J.D. Morris, M.C. Jackson, P. Fryer, S.H. Bloomer, and E. Ito,
Enriched back-arc basin basalts from the northern Mariana Trough: Implications for
the magmatic evolution of back-arc basins, Earth Planet. Sci. Lett., 100, 210-225,
1990.
Stern, R.J., J. Morris, S.H. Bloomer, and J.W. Hawkins, The source of the subduction
component in convergent margin magmas: Trace element and radiogenic isotope
evidence from Eocene boninites, Mariana forearc, Geochim. Cosmochim. Acta, 55,
1467-1481, 1991.
Stern, R.J., and N.C. Smoot, A bathymetric overview of the Mariana forearc, The Island Arc,
7, 525-540, 1998.
Stern, R.J., N.C. Smoot, and M. Rubin, Unzipping of the Volcano Arc, Japan, Tectonophys.,
102, 153-174, 1984.
Stolper, E., and S. Newman, The role of water in the petrogenesis of Mariana Trough
magmas, Earth Planet. Sci. Lett., 121, 293-325, 1994.
Stüben, D., T. Neumann, N.E. Taibi, and G.P. Glasby, Segmentation of the southern
Mariana back-arc spreading center, The Island Arc, 7, 513-524, 1998.
Sun, C.H., and R.J. Stern, Genesis of Mariana Shoshonites: Contribution of the Subduction
Component, J. Geophys. Res., 106, 589-608, 2001.
Sun, C.H., R.J. Stern, J. Naka, I. Sakamoto, and M. Arima, Geological and geochemical
studies with Dolphin 3K on North Hiyoshi seamount, Izu-Bonin-Mariana arc,
JAMSTEC Journal of Deep-Sea Research, 14, 139-156, 1998a.
Sun, C.H., R.J. Stern, T. Yoshida, and J.-I. Kimura, Fukutoku-oka-no-ba Volcano: A new
perspective on the Alkalic Volcano Province in the Izu-Bonin-Mariana arc, The
Island Arc, 7, 432-442, 1998b.
Suyehiro, K., N. Takahashi, Y. Ariie, and e. al., Continental crust, crustal underplating, and
low-Q upper mantle beneath an oceanic island arc, Science, 272, 390-392, 1996.

64
Taira, A., S. Saito, and others, Nature and growth rate of the Northern Izu-Bonin
(Ogasawara) arc crust and their implications for continental crust formation, The
Island Arc, 7, 395-407, 1998.
Tajima, F., and S.P. Grand, Variation of transition zone high-velocity anomalies and
depression of 660 km discontinuity associated with subduction zones from the
southern Kuriles to Izu-Bonin and Ryukyu, J. Geophys. Res., 103, 15,015-15,036,
1998.
Takahashi, M., and K. Saito, Miocene intra-arc bending at an arc-arc collision zone, central
Japan: reply, The Island Arc, 8, 117-123, 1999.
Takahashi, N., K. Suyehiro, and M. Shinohara, Implications from the seismic crustal
structure of the northern Izu-Bonin arc, The Island Arc, 7, 383-394, 1998.
Takenaka, S., H. Sanshadokoro, and S. Yoshioka, Velocity anomalies and spatial
distributions of physical properties in horizontally lying slabs beneath the
Northwestern Pacific region, Phys. Earth Planet. Int., 112, 137-157, 1999.
Tanakadate, H., Volcanoes in the Japanese Mandated South Seas, Bulletin Volcanologique,
Ser. 2, 6, 199-223, 1940.
Tararin, I.A., I.N. Govorov, and B.I. Vasil'yev, Boninites of the Izu Trench, Doklady of
USSR Acadamey of Sciences, 295, 117-120, 1987.
Tatsumi, Y., M. Murasaki, and S. Nohda, Across-arc variation of lava chemistry in the Izu-
Bonin Arc: Identification of subduction components, J. Volcanol. Geotherm. Res.,
49, 179-190, 1992.
Taylor, B., Rifting and the volcanic-tectonic evolution of the Izu-Bonin-Mariana Arc, in
Proceedings of the Ocean Drilling Program, Scientific Results, edited by B. Taylor,
K. Fujioka, et al., pp. 627-651, Ocean Drilling Program, College Station, 1992.
Taylor, B., A. Klaus, G.R. Brown, G.F. Moore, Y. Okamura, and F. Murakami, Structural
development of Sumisu Rift, Izu-Bonin Arc, J. Geophys. Res., 96, 113-129, 1991.
Taylor, R.N., and R.W. Nesbitt, Isotopic characteristics of subduction fluids in an intra-
oceanic setting, Izu-Bonin Arc, Japan, Earth Planet. Sci. Lett., 164, 79-98, 1998.
Taylor, R.N., R.W. Nesbitt, P. Vidal, R.S. Harmon, B. Auvray, and I.W. Croudace,
Mineralogy, chemistry, and genesis of the Boninite Series Volcanics, Chichijima,
Bonin Islands, Japan, J. Petrol., 35, 577-617, 1994.
Tracey, J.I., S.O. Schlanger, J.T. Stark, D.B. Doan, and H.O. May, General Geology of
Guam, pp. 104, U.S. Geological Survey Professional Paper P-0403A, Washington
DC, 1964.
65
Tsuya, H., Geology and petrography of Io-sima (Sulphur Island), Volcano Islands Group,
Bull. Earthquake Res. Inst., Jap., 14, 453-480, 1936.
Tsuya, H., On the Volcanism of the Huzi Volcanic Zone, with special reference to the
Geology and Petrology of the Idu and the Southern islands, Bull. Earthquake Res.
Inst., 15, 215-357, 1937.
Turner, S.P., J. Blundy, B. Wood, and M. Hole, Large 230Th-excesses in basalts produced
by partial melting of spinel lherzolite, Chem. Geol., 162, 127-136, 2000.
Ueda, A., and H. Sakai, Sulfur isotope study of Quaternary volcanic rocks from the
Japanese Islands Arc, Geochim. Cosmochim. Acta, 48, 1837-1848, 1984.
Umino, S., Volcanic geology of Chichijima, the Bonin Islands (Ogasawara Islands), J. Geol.
Soc., Jap., 91, 505-523, 1985.
Van der Hilst, R., and T. Seno, Effects of relative plate motion on the deep structure and
penetration depth of slabs below the Izu-Bonin and Mariana island arcs, Earth
Planet. Sci. Lett., 120, 395-407, 1993.
Van der Hilst, R.D., E.R. Engdahl, W. Spakman, and G. Nolet, Tomographic imaging of
subducted lithosphere below northwest Pacific island arcs, Nature, 353, 37-43,
1991.
Vervoort, J.D., P. P.J., J. Blichert-Toft, and F. Albarede, Relationships between Lu–Hf and
Sm–Nd isotopic systems in the global sedimentary system, Earth Planet. Sci. Lett.,
168, 79-99, 1999.
Vidale, J.E., and H.M. Benz, Upper-mantle seismic discontinuities and the thermal structure
of subduction zones, Nature, 356 (6371), 678-683, 1992.
Volpe, A.M., J.D. Macdougall, and J.W. Hawkins, Mariana Trough basalts (MTB): Trace
element ad Sr-Nd isotopic evidence for mixing between MORB-like and arc-like
melts, Earth Planet. Sci. Lett., 82, 241-254, 1987.
Wessel, J.K., P. Fryer, P. Wessel, and B. Taylor, Extension in the northern Mariana inner
forearc, J. Geophys. Res., 99, 15,181-15,203, 1994.
White, W.M., and J. Patchett, Hf-Nd-Sr isotopes and incompatible element abundances in
island arcs; implications for magma origins and crust-mantle evolution, Earth
Planet. Sci. Lett., 67, 167-185, 1984.
Wicks, C.W., and M.A. Richards, A detailed map of the 660-kilometer discontinuity
beneath the Izu-Bonin subduction zone, Science, 261 (5127), 1424-1427, 1993.
Widiyantoro, S., B.L.N. Kennett, and R.D. van der Hilst, Seismic tomography with P and S
data reveals lateral variations in the rigidity of deep slabs, Earth Planet. Sci. Lett.,
173, 91-100, 1999.

66
Winterer, E.L., J.H. Natland, R.J. Van Waasbergen, R.A. Duncan, M.K. McNutt, C.J.
Wolfe, I.P. Silva, W.W. Sager, and W.V. Slither, Cretaceous Guyots in the
Northwest Pacific: An overview of their Geology and Geophysics, in The Mesozoic
Pacific: Geology, Tectonics, and Volcanism, edited by M.S. Pringle, W.W. Sager,
W.V. Sliter, and S. Stein, pp. 307-334, AGU Geophysical Monograph 97,
American Geophysical Union, Washington D.C., 1993.
Woodhead, J.D., Geochemistry of the Mariana arc (western Pacific): Source compositions
and processes, Chem. Geol., 76, 1-24, 1989.
Woodhead, J.D., and D.G. Fraser, Pb, Sr, and 10Be isotopic studies of volcanic rocks from
the Northern Mariana Islands. Implications for magma genesis and crustal recycling
in the Western Pacific, Geochim. Cosmochim. Acta, 49, 1925-1930, 1985.
Woodhead, J.D., R.S. Harmon, and D.G. Fraser, O, S, Sr, and Pb isotope variations in
volcanic rocks from the Northern Mariana Islands: Implications for crustal recycling
in intra-oceanic arcs, Earth Planet. Sci. Lett., 83, 39-52, 1987.
Xie, J., Shear-wave splitting near Guam, Phys. Earth Planet. Int., 72, 211-219, 1992.
Yamazaki, T., F. Murakami, and E. Saito, Mode of seafloor spreading in the northern
Mariana Trough, Tectonophys., 221, 207-222, 1993.
Yamazaki, T., and R.J. Stern, Topography and magnetic vector anomalies in the Mariana
Trough, JAMSTEC Journal of Deep Sea Research, 13, 1997.
Yuasa, M., and M. Nohara, Petrographic and geochemical along-arc variations of volcanic
rocks on the volcanic front of the Izu-Ogasawara (Bonin) Arc, Bull. Geol. Surv.
Japan, 43, 421-426, 1992.
Yuasa, M., and K. Tamaki, Basalt from Minami-Iwojima Island, Volcano Islands (in
Japanese), Bull. Geol. Surv. Japan, 33, 531-540, 1982.
Zhang, S., and S. Karato, Lattice preferred orientation of olivine aggregates deformed in
simple shear, Nature, 375, 774-777, 1995.

67
FIGURE CAPTIONS
Figure 1: Generalized locality map for the Izu-Bonin-Mariana Arc system. Dashed line
labeled STL = Sofugan Tectonic Line. Traverse shown in Fig. 2 follows the magmatic arc
from Japan through the Izu, Bonin, and Mariana magmatic arcs. Locations of profiles
shown in Fig. 4 are shown and labeled 4A, 4B, and 4C. Location of cross-chains is shown,
with Zenisu (Z) at the far north, Kan’ei (K) and Genroku (G) farther south in the Izu arc,
and Kasuga (Ka) in the Marianas.
Figure 2: Along-strike profiles of the IBM Arc System, from Japan (left) to Guam (right).
The thick solid line shows the bathymetry and topography along the volcanic axis of the
active arc, with the thin dashed horizontal line marking sealevel. The approximate locations
of the principal island groups (Izu, Bonin-Volcano, and Mariana) are shown. Submarine
volcanoes (and the Sofugan Tectonic Line, STL) are given as italicized abbreviations: Ku,
Kurose;Ms, Myojin-sho; Do, Doyo; Kk, Kaikata; Kt, Kaitoku;F, Fukutoku-oka-no-ba; HC,
Hiyoshi Volcanic Complex, Nk, Nikko; Fj, Fukujin, Ch, Chamorro, D, Diamante; R, Ruby,
E, Esmeralda; T; Tracy. Subaerial volcanoes are given as normal abbreviations: O, Oshima;
My, Miyakejima; Mi, Mikurajima; H, Hachijojima; A, Aogashima; Su, Sumisujima, T,
Torishima; Sg, Sofugan; N, Nishinoshima; KIJ, Kita Iwo Jima; IJ, Iwo Jima; MIJ, Minami
Iwo Jima; U, Uracas; M, Maug; As, Asuncion; Ag, Agrigan; P, Pagan; Al, Alamagan; G;
Guguan; S, Sarigan; An, Anatahan. Locations of important zones of intra-arc and back-arc
extension in the north (Bonin Arc Rifted Zone) and south (Mariana Trough Back-Arc
Basin) are marked. The thick dashed line shows the maximum depth in the trench along its
strike. Frontal arc elements are not shown, but consist of the Bonin or Ogasawara Islands
between 26° and 28°N and the Mariana frontal arc islands between 13° and 16°N.
Figure 3 Simplified geologic and magnetic map of the western Pacific, modified after
Nakanishi et al. [1992]. Relative motion of the Pacific Plate with respect to the Philippine
Sea Plate is shown with arrows, numbers correspond to velocities (mm/year), after Seno et
al. [1993].
Figure 4 Greatly simplified cross sections along the IBM arc system, showing variations in
morphology and tectonic style from north (Izu) through central (Bonin) and southern
(Mariana) segments. Locations are shown in Fig. 1. Sections taken from various reports,
especially Honza and Tamaki [1985], Hussong and Uyeda [1982] Karig [1971b;], and

68
Taylor [1992]. T= trench, solid triangle = magmatic arc. Vertical exaggeration ~ 25x.
Figure 5 Simplified history of the IBM arc system. Shaded areas are magmatically
inactive, cross-hatched areas are magmatically active.
Figure 6 Convergence obliquity and fore-arc extension along the IBM arc, modified after
McCaffrey [1996]. Arc segments Izu, Bonin, and Mariana are shown. Note that the
northernmost Mariana arc is characterized by nearly strike-slip motion, whereas much of the
Izu-Bonin and southern Mariana Arc is characterized by plate convergence that is almost
orthogonal.
Figure 7 ODP sites 801C and 1149, locations shown on Fig. 3. 801C is thought to be
representative of sediments being subducted beneath the Marianas and 1149 of those going
down beneath Izu-Bonin. Superimposed on simplified lithological column are K contents
determined using the natural gamma down hole logging tool. Note that enrichments in K
and other incompatible elements in sediments being subducted beneath the Mariana arc is
largely due to the thick sequence of Albian (Cretaceous) volcaniclastics
http://www-
odp.tamu.edu/publications/185_IR/VOLUME/CHAPTERS/IR185_04.PDF
Figure 8 Chemical composition of sediments being fed into the IBM Subduction Factory.
Composites for sediments outboard of Izu-Bonin (dotted line) and Mariana (solid line) are
after Plank and Langmuir [1998], (A) normalized to abundances in MORB [Hofmann,
1988] and (B) normalized to Global Subducting Sediments (GLOSS; [Plank and
Langmuir, 1998]).
Figure 9 Isotopic composition of sediments and volcanics being fed into the IBM
Subduction Factory. A) O-Sr isotopic systematics for sediments (data from Stern and Ito
[1983], Woodhead and Fraser [1985], and Woodhead [1989]). B) Sr-Nd isotopic
systematics for W. Pacific sediments (data from Lin [1992], Stern and Ito [1983],
andWoodhead [1989] and means calculated for Jurassic seafloor and Jurassic alkali basalt
at ODP 801C [Castillo et al., 1992]; alkalic sill at ODP 800 [Castillo et al., 1992];
Cretaceous off-ridge tholeiites at ODP 802 [Castillo et al., 1994], Nauru Basin (ODP 462;
[Castillo et al., 1991], and the Ontong Java Plateau [Mahoney and K.J., 1991]; Magellan
seamounts (Himu, Hemler, Golden Dragon); Wake seamounts (Wilde, Miami, Lamont, and
Scripps) [Staudigel et al., 1991]; Marshall Islands [Davis et al., 1989]; and Caroline Islands

69
[Hart, 1988]. Notice that data for lavas clusters about εNd ~+6 to +8, 87Sr/86Sr ~ 0.7027-
0.7040 except for the Jurassic MORB at 801C and Hemler and Wilde seamounts.
Approximate locations of mantle reservoirs EMI, EMII, and HIMU are also shown.
Sediment samples with 87Sr/86Sr < 0.706 contain a high proportion of volcaniclastic
material. Location of weighted mean for sediment being subducted beneath IBM [Plank
and Langmuir, 1998] is shown, along with fields for fresh MORB and IBM arc lavas. C)208Pb/204Pb vs. 206Pb/204Pb for W. Pacific sediments and volcanics, data sources as above.
D) 207Pb/204Pb vs. 206Pb/204Pb. Also shown is the estimated composition of IBM mean
sediment from Plank and Langmuir, [1998] and the Northern Hemisphere Reference Line
(NHRL) after Hart [1984]. Dashed rectangles in B-D show the areas plotted in Fig. 21.
Figure 10. Map view of bathymetry and seismicity in the Izu-Bonin-Mariana Subduction
Factory using the earthquake catalog of Engdahl et al. [1998]. Circles denote epicentral
locations; lighter circles represent shallower events, darker circles represent deeper events.
Black lines denote cross-sectional areas depicted in Figure 11. Large variations in the
seismic structure of the region are evident.
Figure 11. Cross-sectional views of the IBM system using the earthquake catalog of
Engdahl et al. [1998]. Black circles represent hypocentral locations in volume ~60 km to
each side of the lines shown in Figure 10. Large variations in slab dip and maximum depth
of seismicity are apparent. Distance along each section is measured from the magmatic arc.
A) Northern Izu-Bonin region. Slab dip is ~45°; seismicity tapers off from ~175 km to
~300 km but increases around 400 km, and terminates at ~475 km. B) Central Izu-Bonin
region. Slab dip is nearly vertical; seismicity tapers off from ~100 km to ~325 km but
increases in rate and extends horizontally around 500 km, and terminates at ~550 km.
C) Southern Izu-Bonin region. Slab dip is ~50°; seismicity is continuous to ~200 km, but a
very few anomalous events are evident down to ~600 km. D) Northern Mariana region.
Slab dip is ~60°; seismicity is continuous to ~375 km and terminates at ~400 km, but a very
few anomalous events are evident down to ~600 km. E) Central Mariana region. Slab dip
is vertical; seismicity tapers off slightly between ~275 km and ~575 km, but is essentially
continuous. A pocket of deep events around 600 km exists, as well as 1 deep event at
680 km. F) Southern Mariana region. Slab dip is ~55°; seismicity is continuous to
~225 km, with an anomalous event at 375 km.

70
Figure 12. Cartoon representation of seismic observations in the IBM system. Black
circles show representative seismicity for each region. Thick dashed lines show rough
interpretation of tomographic images for each area. A) Northern IBM (near section A in
Fig. 11). Slab dip is variable, but averages around 50°. Tomographic images suggest that
the slab does not penetrate the lower mantle, but extends horizontally to the west. The
410 km seismic discontinuity (thin line at 410) appears to be locally elevated; the 660 km
seismic discontinuity (thin line at 660) appears to be depressed for an extended distance to
the west. Seismic anisotropy indicates the presence of fabric in the mantle wedge, as well as
possibly in the overriding plate and subducting slab. B) Southern IBM (near section E in
Fig. 11). Slab dip is slightly variable, but generally becomes vertical. Tomographic images
suggest that the slab penetrates the lower mantle. Regional variations of upper mantle
discontinuities have not yet been documented, but a locally elevated “410” and a locally
depressed “660” (thin dashed lines) might be expected. Seismic anisotropy indicates the
presence of fabric in the mantle wedge and subducting slab, as well as possibly in the
overriding plate.
Figure 13 Arc-perpendicular cross-sections aligned along the volcanic front, redrawn
to a uniform vertical exaggeration (x2) and scale, and with uniform velocity shading. “6.2"
and "7.3" identify the 6.6±0.2 km/s middle crustal layer and 7.3±0.1 km/s deepest crustal
layer of the IBM arc. Neither layer is prominent in the other two models. Redrawn after A:
[Suyehiro et al., 1996]; B: [Lange, 1992]; C: [Holbrook et al., 1999].
Figure 14 Crustal structure of the Mariana Trough. (A) Shows the location of B and C.
(B) Crustal structure beneath the central Mariana Trough is combined from the seismic
refraction results of Bibee et al. [1980] in the east, centered beneath the spreading ridge, and
the results of LaTraille and Hussong [1980] in the west. Numbers correspond to P-wave
seismic velocities, in km/sec. The Moho is defined by velocities greater than 8 km/sec,
although the 7.4 km/sec velocity in the east may be anomalously slow mantle, perhaps due
to the presence of partial melt. (C) Crustal structure beneath the northern Mariana Trough
is based on interpretation of gravity data [Ishihara and Yamazaki, 1991]. Note the rapid
thinning southward to crustal thicknesses corresponding to normal oceanic crust just south
of 22°N.

71
Figure 15 The IBM forearc, between 13° and 25°N, shown in gray. Generalized structural
features and location of serpentine mud volcanoes are taken from Stern and Smoot [1998].
Dashed line marks the boundary between rough and smooth terrains of Stern and Smoot
[1998], or between Eastern and Western Structural Provinces of Mrozowski and Hayes
[1980]. Arrows radiating out from the back-arc basin extension axis show how differential
extension causes decreasing radius of curvature of the arc, leading to stretching of the
forearc along strike. Location of DSDP sites 60, 458, 459, 460, 461, and 1200 are shown.
ODP sites 778-781 are centered on Chamorro Seamount.
Names of serpentine mudvolcanoes, after Fryer et al. [1999] from south to north: South
Chamorro, SC; North Chamorro, NC; Blue Moon, BM; Peacock, Pe; Celestial, C;
Turquoise, T; Big Blue, BB; Pacman, Pm; Conical, Co.
Figure 16 Conical Seamount, location shown in Fig. 15. Map shows the location of active
vents and chimney structures [Fryer et al., 1995], and location of ODP drill sites and
ALVIN dive tracks [Fryer et al., 1990a]. Tracks for five dives (1851-1855) on the flanks
are shown; four dives (1859-1862) on the summit are not shown. Rock sequences
penetrated by ODP sites 778-781 are portrayed very schematically, along with age
assignments (from ODP Leg 125 Initial Reports). Note the presence of a basalt sill at ODP
site 781. Bathymetry in km.
Figure 17 Potassium-silica diagram for the mean composition of 62 volcanoes along the
magmatic front of the IBM arc system. Data sources discussed in text. Names for rocks
indicated for calc-alkaline and tholeiitic series below the double arrows, above the double
arrows for the shoshonitic series.
Figure 18 Profiles of mean silica and potash contents and Zr/Y and Nd/Sm for volcanoes
along the magmatic front of the IBM arc. Data sources as described in text, same symbols
as in Fig. 17. A) Variations in bathymetry along the same profile, similar to Fig. 2. Names
of individual volcanoes can be found in Fig. 2. Along-strike variations in silica B) and
potash C) are shown, using symbols as in Fig. 17. Mean silica and potash contents are
shown for the IBM magmatic front as a dashed line. Along-strike variations in Zr/Y D) and
Nd/Sm E) are shown, using symbols as in Fig. 17. Mean values for Zr/Y and Nd/Sm are
shown for the IBM magmatic front as a dashed line labeled Mean and also for typical
MORB [Hofmann, 1988].
Figure 19 Incompatibility plot for lavas from along the front of the IBM arc. Typical

72
compositions for the Mariana arc (GUG-9 of Elliott et al. [1997]; 51% SiO2 ) and
Shoshonitic province (54H of Peate and Pearce [1998]; 47.8% SiO2) are plotted, along
with a mean calculated for Izu arc mafic lavas (51.6% SiO2 [Taylor and Nesbitt, 1998].
Symbols are the same as in Fig. 17 (filled circles: Izu-Bonin; diamonds: Shoshonitic
Province; open squares: Mariana). Composition of MORB and element order is after N-
MORB of Hofmann [1988]. Grey field outlines the composition of IBM subducted
sediment, from Fig. 8.
Figure 20 Isotopic variations along the IBM arc. Symbols are the same as in Fig. 17 (filled
circles: Izu-Bonin; diamonds: Shoshonitic Province; open squares: Mariana). (A) B
isotopic variations; data for IBM arc after Ishikawa and Nakamura [1994] andIshikawa
and Tera [1999]; data for Mariana Trough basalts after Chaussidon and Jambon [1994].
Isotopic composition of altered oceanic crust, sediment, and mantle are from Ishikawa and
Tera [1999]. (B) S isotopic composition of IBM arc lavas, Mariana Trough, and Sumisu
rift lavas. Data for IBM arc lavas from Alt et al. [1993], Ueda and Sakai [1984], and
Woodhead et al. [1987]; Data for ten Mariana Trough basalts are from Alt et al. [1993]; for
7 Sumisu Rift lavas from Hochstaedter et al. [1990a]. Fields for sediments, altered oceanic
crust, and mantle are from Alt et al. [1993]. (C) Sr isotopic data for IBM arc lavas,
normallized to E&A SrCO3; data sources described in text. (D) Nd isotopic data for IBM
arc lavas, adjusted to a common value for the La Jolla Nd standard; data sources described
in text.
Figure 21 Isotopic composition of Sr, Nd, and Pb for IBM arc lavas, including Sumisu Rift
and Mariana Trough basalts. Data for IBM arc are averages for individual volcanoes, data
for Sumisu Rift and Mariana Trough are individual analyses. Fields for sediments (shaded)
and W. Pacific off-ridge volcanics (dashed), taken from Fig. 9, are shown in B and C.
Location of these diagrams is shown with dashed boxes on Fig. 9. The Northern
Hemisphere Reference Line (NHRL [Hart, 1984]) is shown for comparison.
Figure 22 Isotopic variations along the magmatic front of the IBM arc. Symbols are the
same as in Fig. 17 (filled circles: Izu-Bonin; diamonds: Shoshonitic Province; open
squares: Mariana). A) εHf ; B) 206Pb/204Pb isotopic variations; C) ∆7/4; and D) ∆8/4. Hf
isotopic data are from Pearce et al. [1999], White and Patchett [1984], Woodhead, [1989],
and Vervoort (personal communication, 2000). Delta notation for Pb follows Hart [1984];
Epsilon notation for Hf follows Pearce et al. [1999].
73
Figure 23 (A) Hf-Nd isotopic variations for the IBM arc system, data from [Pearce et al.,
1999; White and Patchett, 1984; Woodhead, 1989] (Vervoort, personal communication,
2000). Fields for OIB and MORB are from Vervoort et al. [1999] and define the mantle
array. (B) U-Th disequilibrium data for IBM arc lavas. Data are not averaged for each
edifice. Data from Elliott et al. [1997], Gill and Williams [1990], McDermott and
Hawkesworth [1991, Newman et al. [1984], and Reagan (personal communication, 2000).
Figure 24 A) Locality map for the northern IBM arc system and the Zenisu cross-chain. B-
F plot volcano-means for parameters sensitive to fluid input (B) or contributions from the
subducted slab (C-F) vs. depth to the Wadati-Benioff zone. B) Variations of B/Nb vs.
depth to the Wadati-Benioff Zone. Islands Oshima (Os), Toshima (To), Nii Jima (NJ),
Shikine Jima (SJ); Kozushima (Ko); C) Variations of δ7Li vs. depth to the Wadati-Benioff
Zone; D) Variations of δ11B vs. depth to the Wadati-Benioff Zone; E) Variations of87Sr/86Sr vs. depth to the Wadati-Benioff Zone; F) Variations of ∆7/4 Pb vs. depth to the
Wadati-Benioff Zone. Notice the decrease in the all parameters sensitive to subducted
inputs with greater depth to the seismic zone. Data are from Ishikawa and Nakamura,
[1994], Moriguti and Nakamura [1998], and Notsu et al. [1983].
Figure 25 Conceptual models for evolution of the Subduction Factory from one lacking an
actively spreading back-arc basin (A) to one associated with back-arc spreading (B). Note
that magma generation and migration beneath the magmatic front occurs in a region of
mantle downwelling, whereas that beneath the back-arc basin spreading axis occurs in a
region of mantle upwelling. Note in (B) the multiple melting opportunities for mantle rising
beneath the back-arc basin, with melt generation beneath the spreading axis (1), beneath
cross-chains (2) and beneath the magmatic front (3). The IBM arc system presents all of
these stages, with the Bonin segment now acting as an unrifted arc (A) whereas the Mariana
segment is an outstanding example of an arc associated with back-arc spreading (B). The
Izu segment represents an intermediate situation, where rifting is underway but has not
proceeded to seafloor spreading.
Figure 26 Actively extensing systems of the IBM arc. A) Tectonic sketch map of Izu rifts,
modified after Taylor [1992]; shaded where shallower than 3km. Note this is rotated
clockwise about 10° from true north. Calderas shown with open circles. Abbreviations for
frontal arc volcanoes (from the north): My, Miyake Jima; Mk, Mikura Jima; HJ, Hachijo
Jima; AS, Aoga Shima; MS, Myojin Sho; TS, Tori Shima; SJ, Sofu Gan; NS, Nishino Shima.
STL = Sofugan Tectonic Line. Abbreviations for rifts (from the north): HR, Hachijo Rift;

74
AR, Aogashima Rift; SR, Sumisu Rift; TSR, Torishima Rift, SGR, Sofugan Rift; NSR,
Nishinoshima Rift.
B) Tectonic sketch map of the Mariana Arc and back-arc basin. Bathymetric contours are
in km, region shallower than 3km is shaded. CD= Challenger Deep, SSP = Southern
Seamount Province, CIP=Central Island Province, NSP=Northern Seamount Province,
K=location of Kasuga cross-chain, CG=Central Graben. Note that seafloor spreading
characterizes the Mariana Trough south of 19°45’N and rifting is characteristic from this
latitude north to Nikko, where the extension axis intersects the arc.
Figure 27 Chemical features of IBM rift-related lavas. A) Potash-silica diagram for IBM
rift-related igneous rocks. Fields are shown for Sumisu and Myojinsho rifts (66 samples) ,
Mariana Trough VTZ (41 samples) , and Mariana Trough spreading segment (labeled
MTB, 167 samples). Note the bimodal nature of lavas erupted in rifts and strictly mafic
nature of lavas erupted in the region undergoing spreading. B) Incompatibility plot for
extension-related IBM lavas. Sumisu rift data is mean from data set of Hochstaedter et al.,
1990b]; note that this pattern is incomplete. Mariana Trough data are for glasses analyzed
by Pearce (unpublished ICP-MS data). VTZ sample is T7-54:1-1 (1.69% H2O). Two
representative samples are given for the Mariana Trough spreading segment: ‘arc-like’
sample GTVA75:1-1 (2.21% H2O) and ‘MORB-like’ sample DS84:2-1 (0.21% H2O)
[Gribble et al., 1996]. Composition of N-MORB and element order is after Hofmann
[1988]. Grey field outlines the composition of Mariana and Izu segment lavas, from Fig.
19.
Figure 28 The IBM collision zone. A) Geologic map showing the location of major thrust
faults and tectonic lines (1-5 circled) and the Tanzawa Mountains. 1= Mineoka/Tonoki-
Aikawa/Itoigawa-Shizuoka Thrust; 2=TonokiAikawa/Nishikatsura/ Minobu Thrust;
3=Kouzu-Matsuda/Kannawa Thrust; 4=Izu-Toho Tectonic Line; 5=Zenisu-Oki Tectonic
Line. Dashed fault indicates incipient thrust fault. IP = Izu Peninsula; AB = Ashigara
Basin. Water depth contours are labeled in km. Volcanoes are abbreviated F=Fuji,
H=Hakone, Os = Oshima, Om = Omurodashi (submarine), To = Toshima, NJ = Nii Jima,
SJ = Shikine Jima, Ko = Kozushima, My = Miyakejima, Mk = Mikurajima. Underlining
indicates dominantly felsic volcano. Arrow labeled ‘4 cm/y’ indicates convergence direction
and rate between IBM arc and Honshu. Note the generalized location of seismicity
shallower than 50km. Dashed line A-A’ shows approximate location of section shown in B.
Figure modified after Kawate and Arima [1998] and Taira et al. [1998]. B) Along-arc
cross-section A-A’, modified after Taira et al. [1998], showing sequence of imbrications of
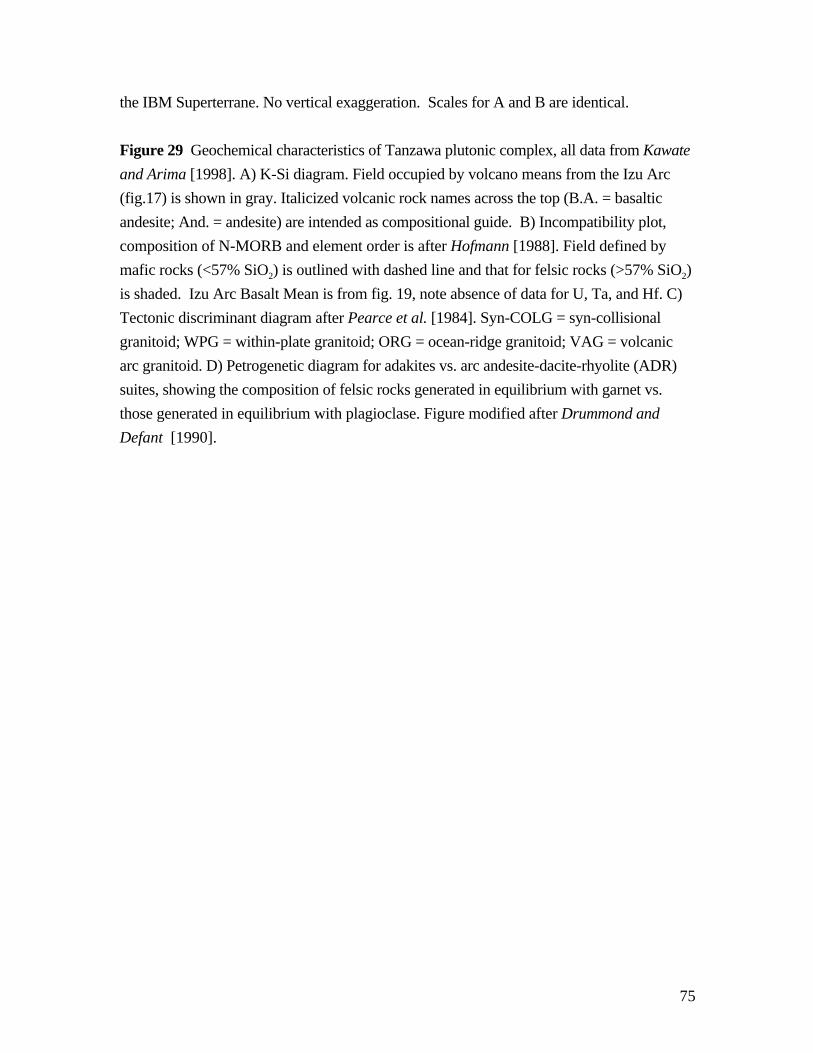
75
the IBM Superterrane. No vertical exaggeration. Scales for A and B are identical.
Figure 29 Geochemical characteristics of Tanzawa plutonic complex, all data from Kawate
and Arima [1998]. A) K-Si diagram. Field occupied by volcano means from the Izu Arc
(fig.17) is shown in gray. Italicized volcanic rock names across the top (B.A. = basaltic
andesite; And. = andesite) are intended as compositional guide. B) Incompatibility plot,
composition of N-MORB and element order is after Hofmann [1988]. Field defined by
mafic rocks (<57% SiO2) is outlined with dashed line and that for felsic rocks (>57% SiO2)
is shaded. Izu Arc Basalt Mean is from fig. 19, note absence of data for U, Ta, and Hf. C)
Tectonic discriminant diagram after Pearce et al. [1984]. Syn-COLG = syn-collisional
granitoid; WPG = within-plate granitoid; ORG = ocean-ridge granitoid; VAG = volcanic
arc granitoid. D) Petrogenetic diagram for adakites vs. arc andesite-dacite-rhyolite (ADR)
suites, showing the composition of felsic rocks generated in equilibrium with garnet vs.
those generated in equilibrium with plagioclase. Figure modified after Drummond and
Defant [1990].

Japan
*Tokyo
Nanka
i Tro
ugh
Japa
n T
renc
h
Izu-Bonin T
rench
Mar
iana
Tre
nch
YapTrench
Palau Trench
..
Pala
u
Kyu
shu
Rid
ge
-
ShikokuBasin
Parece VelaBasin
... .......
. ...
...
........
.
Belau
.
Mar
iana
Mar
iana
Mar
iana
Arc
30
40
20
10
140
WestPhilippine
Basin
Active SpreadingRidge
Extinct SpreadingRidge
IBM arc crustCrust of IBM arc system
Wes
tR
idge
IzuArc
Tro
ugh
Bonin A
rc
IBMARC
SYSTEM PacificPlate
ChallengerDeep
ChallengerCusp
STL
Guam
OgasawaraPlateau
4A
4B
4C
STERN ET AL. FIG. 1
K
G
Ka
Z

262832 3034
KIJ+1SL
-2
-4
24 22 20 18 16
IJ HCFj As
Ch Ag P
Al G S DO
My Mi H A
Ms Su T Sg N
AnMIJ
-6
-8
-10
E T
14
(Km)
Degrees N latitude
R
500 km
Trench
Active Arc
U
Izu Islands Bonin &Volcano Islands Mariana Islands
Nk
Mariana segment Izu segment Bonin segment
Mariana Trough Back-Arc Basin Bonin Arc Rifted Zone
FSTLDo
Ku MKtKk

Jurassic
Ontong JavaPlateau
Hawaii-Emperor Smts.
Shatsk
y Rise
Mid-PacificMountains
Cretaceous
Age of Western Pacific Seafloor
Cretaceous
Jurassic
**
*
v v vv v v v
v v v v vv v v v v v
vvvvvv
v v
vvv
v vv
v v v v v
vvvv
vv
v
v
v v v v
vvv
vv vIzu-B
onin-Mariana A
rc 801
Oligocene and younger crust
Oceanic Plateaus (mostly Cretaceous)
vv Mid-Cretaceous Flood Basalts
* DSDP & ODP sites
Trenches
*
Caroline Ridge
1149
Mid-PacificMountains
ShatskyRise
800
*452
802
*307*197*196
*195 *194
140 E 160 180
*
v
v
462Mariana Trench
OgasawaraPlateau
30
57
Pigafetta Basin
Nadezhda Basin
Caroline Basin
Nauru Basin
Jurassic-Cretaceous boundary
STERN ET AL. FIG. 3
10
40
30
20
0
East Mariana Basin
Magellan Seamounts
198*Marcus-Wake Seamounts

Volcanic Cross-chains(mostly extinct)
Active interarc rift
Arc volcanoes(mostly subaerial)
Well-developedsubmarine canyons
ExtinctSerpentine
MudVolcanoes
-1
-5
A) Izu ~32 N T
+1
142 E140
Sea Level
140
Bonin Trough(extinct rift)
B) Bonin ~28 N
Bonin Ridge(uplifted Eocene
basement)
Arc volcanoes(mostly submarine)
T
142 E
-9
-5
-1
Arc volcanoes
C) Marianas ~16 N
Frontal Arc(uplifted Eocene
basement)
Active SerpentineMud Volcanoes
T
Active SeafloorSpreading in
Backarc basin
148 E146144
+1
-9 km
+1
-1
-5
-9
STERN ET AL. FIG. 4
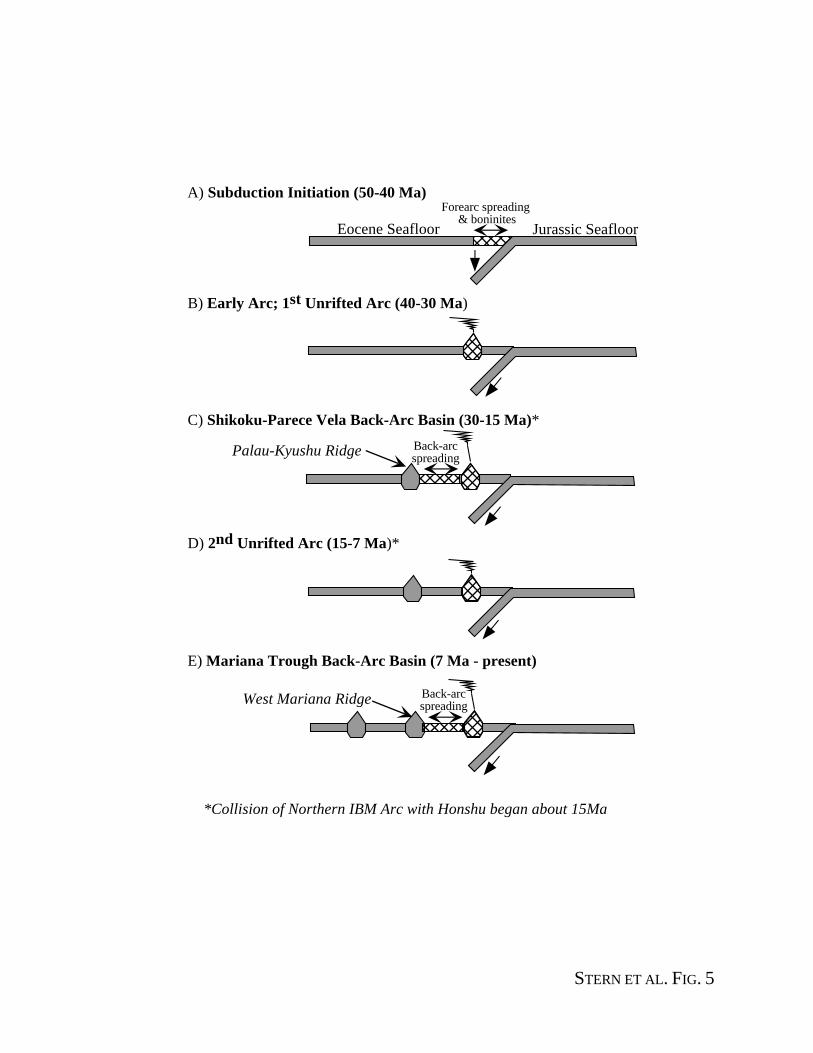
Eocene Seafloor Jurassic Seafloor
Forearc spreading & boninites
A) Subduction Initiation (50-40 Ma)
B) Early Arc; 1st Unrifted Arc (40-30 Ma)
Back-arcspreading
C) Shikoku-Parece Vela Back-Arc Basin (30-15 Ma)*
D) 2nd Unrifted Arc (15-7 Ma)*
Back-arcspreading
E) Mariana Trough Back-Arc Basin (7 Ma - present)
*Collision of Northern IBM Arc with Honshu began about 15Ma
West Mariana Ridge
Palau-Kyushu Ridge
STERN ET AL. FIG. 5

plate convergence obliquity(from earthquake slip vectors)
arc-parallel fore-arc slip rate
North South
Izu Bonin Mariana
0 1000 2000 3000 km
34.1 25.2 16.9 N 142 E
60
30
0
-30
-60
-90SinistralStrike-slip
Obl
iqui
ty (
)or
rat
e (m
m/y
)
OrthogonalConvergence
STERN ET AL. FIG. 6

Ash &Diatom/Rad.clay
Site 1149
Early Cretaceous(Haut.-Valang.)
Pelagicclay
Chert&zeoliteclay
U. Miocene- Recent
Chert&marl
Basalt
Site 801C
M. J
ur. -
L. C
ret.
(Baj
oc.-
Val
ang.
)
167 +/- 5 Ma
Pelagicclay
RadiolarianChert
Alkali Basalt
Volcaniclasticturbidites
Chert andporcellanite
MORB
Hydrothermal
Leg185Begins
594m
U. C
reta
ceos
us0
100
200
300
400
500metersbelowseafloor
Alb
ian
936m
V VV
V VV
V VV
V VV
H H
V VV
V V
V
V VV
V VV
H H
M11(Early Cret.
~132 Ma)
1.0% K2O0.65% K2O
STERN ET AL. FIG. 7
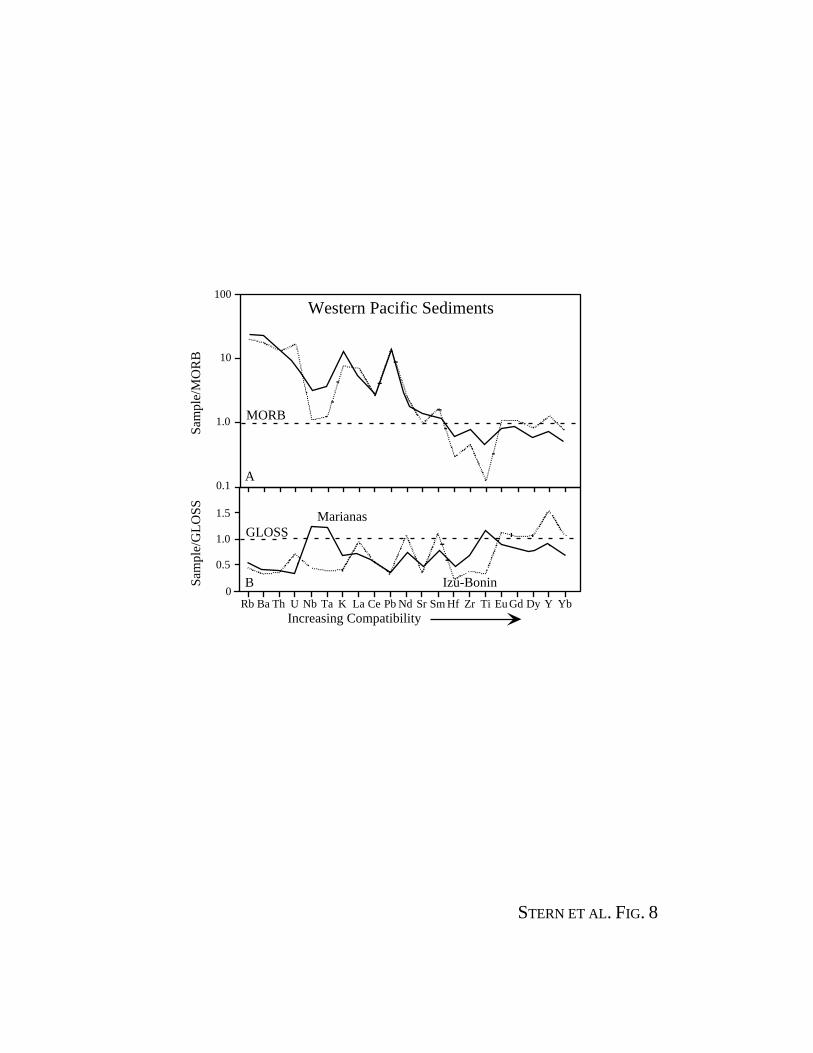
0.1
1.0
10
100
Increasing Compatibility
Sam
ple/
MO
RB
0
0.5
1.0
1.5
Rb Ba Th U Nb Ta K La Ce Pb Nd Sr Sm Hf Zr Ti Eu Gd Dy Y Yb
A
B
Marianas
Izu-Bonin
GLOSS
Western Pacific Sediments
Sam
ple/
GL
OSS
STERN ET AL. FIG. 8
MORB

EMI
HIMU
Pacific
MO
RB
EMII
εNd
-8
-4
0
4
8
12
0.702 0.704 0.706 0.708 0.71 0.712 0.714 0.716
Sediments
Volcanics
IBM Arc lavas
A
Hemler
Jurassic MORB (801C)
Wilde
87Sr/86Sr
δ 18O
0
5
10
15
20
25
30
35
0.702 0.704 0.706 0.708
0.71 0.712
87Sr/86Sr
B
IBM Arc lavas
IBM mean sediment
15.4
15.5
15.7
18 19 20 21
NHRL
N-MORB
38
39
40
41
C
D
EMII
EMII HIMU
HIMU
MarianaArc lavas
I-B Arc lavas
208Pb/204Pb
207Pb/204Pb
206Pb/204Pb
STERN ET AL. FIG. 9
15.6

-4
0 100 200 300 400 500 600 700Earthquake depth (km)
A A’
B B’
C C’
D
D’
E E’
F
F’
135° 140° 145° 150°
10°
15°
20°
25°
30°
35°
Figure 10 Stern, Fouch, and Klemperer

Figure 11 Stern, Fouch, and Klemperer
F F’0
100
200
300
400
500
600
700
Dep
th (
km)
-100 0 100 200
C C’0
100
200
300
400
500
600
700-100 0 100
Distance along cross-section (km)
C F
B B’0
100
200
300
400
500
600
700-500 -400 -300 -200 -100 0 100
E E’0
100
200
300
400
500
600
700
Dep
th (
km)
0 100 200 300
B E
A A’0
100
200
300
400
500
600
700-400 -300 -200 -100 0 100 200
D D’0
100
200
300
400
500
600
700
Dep
th (
km)
0 100 200
A D

Figure 12 Stern, Fouch, and Klemperer
depressed "660"
Northern IBM
Flow produces anisotropy in mantle wedge Fabric in slab?
Fabric in overriding plate?
elevated "410"
410 km discontinuity
660 km discontinuity
UPPER MANTLE
TRANSITION ZONE
LOWER MANTLE
410
660
no lower mantleslab penetration
Southern IBM
depressed "660"?
elevated "410"?
410
660
Flow produces anisotropy in mantle wedge
Fabric in slab?
Fabric inoverriding plate?
lower mantleslab penetration
A
B

no velocity control
Mantle
volcanic front
05
101520253035
Dep
th (
km)
MantleMantle
Ocean
?
km across arc255075100 125 150 17525 50 75
Central Aleutians, 172.5° W
100
A
B
C
05
10152025
255075100125 150 17525 50 75 100 125
MantleMantle
Ocean
3035
no velocity control
Mariana arc, 15° N (Tinian)
Izu-Bonin (Ogasawara), 32° N
05
101520253035
Dep
th (
km)
km across arc
30˚
60˚
15˚
2550 25 50 75
1.5 5.0 6.0 6.4 6.8 7.2 7.4 x2 vertical exaggeration
velocity, km/s
"6.2"
"7.3"
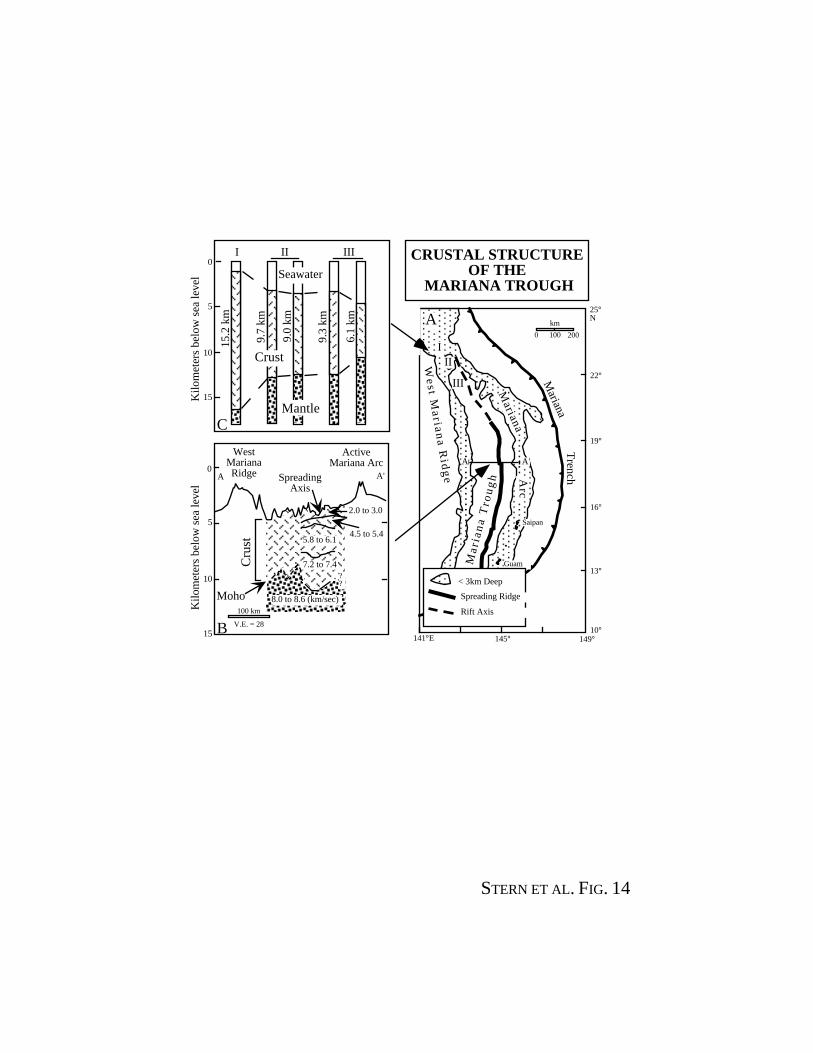
25N
22
19
16
13
10141 E 145 149
Guam
Saipan
III
III
A A'
< 3km Deep
Spreading Ridge
0 100 200
km
Ma
ria
na
Tro
ug
h
Mariana
Ma
rian
a
Trench
We
st M
ar ia
na
Rid
ge
Arc
WestMarianaRidge
ActiveMariana Arc
5.8 to 6.1
7.2 to 7.4 ??
2.0 to 3.0
100 km
V.E. = 28
SpreadingAxis
I II III0
5
10
15Kilo
met
ers
belo
w s
ea le
vel
15.2
km
9.7
km
9.0
km
9.3
km
6.1
kmCrust
CMantle
Seawater
A A'0
5
10
15
Kilo
met
ers
belo
w s
ea le
vel
A
B
CRUSTAL STRUCTUREOF THE
MARIANA TROUGH
4.5 to 5.4
8.0 to 8.6 (km/sec)
Cru
st
Moho
STERN ET AL. FIG. 14
Rift Axis

30
40
45
48
35
148
Guam
Uracas
Pagan
142
145
145
13
15
18
20
25
Nikko
N
Frontal Arc Uplift
Back-Arc BasinExtension Axis
30
Arc volcanoTrench
Serpentine seamount
Boundary betweenEastern & WesternStructural ProvincesNormal fault(teeth on down side)
Strike-slip fault
Pacific-PhilippineSea plate convergencevector, mm/a
Forearc
* DSDP/ODP site
kilometers
0 100 200
SCNC
C
BM
Pe
T
BB
Co
Pm
*
* * **
60
458459 461
Trench
Tren
ch
147
*1200
STERN ET AL. FIG. 15
460

Mud
Basalt
Mud
Plio
cene
Holo.781
S S
Serp.
BrecciaS S
Mud
S
Ple
isto
cene
Holo.778
Serp.
Breccia
S SS
S SS
S SS
S SS
S SS
S SS
S SS
S SS
S SS
Mud
Ple
isto
cene
Holo.779
S SS
S SSS S
S
Serp.
Breccia
S SS
S SS
S SS
S SS
Mid
- P
leis
toce
ne to
Hol
o. 7800 10
*
**
780
778
781
779
3.5
4.5
4.5
4.0
1930'N
300m
200
100
0
* ODP Drill site Vent field ALVIN track
146 40'E
STERN ET AL. FIG. 16
*
km
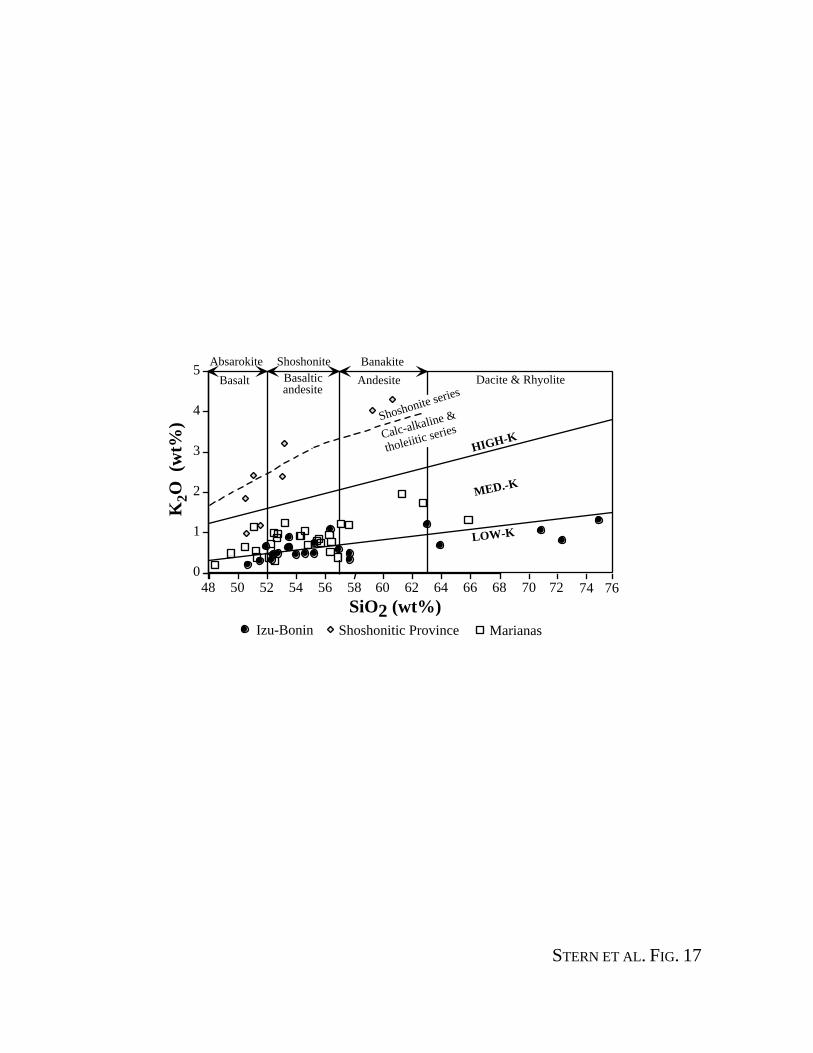
Absarokite Shoshonite Banakite
Basalt Basaltic Andesiteandesite
0
1
2
3
4
5
48 50 52 54 56 58 60 62 64 66 68
SiO2 (wt%)
K2O
(w
t%)
HIGH-K
MED.-K
LOW-K
Calc-alkaline &
tholeiitic seriesShoshonite series
Izu-Bonin Shoshonitic Province Marianas
70 72 74
Dacite & Rhyolite
76
STERN ET AL. FIG. 17

B
C
2
3
4
5 Nd/Sm
1416182022242628303234
MEAN = 3.77
MORBE
50
60
70% SiO2
MEAN = 55%
0
1
2
3
4
5
% K2O
MEAN = 0.98%
0
2.5
5
7.5
MEAN = 3.3
Zr/Y
MORB
+1
SL
-2
-4
km 500 kmActive Arc
Izu Islands Bonin &Volcano Islands Mariana Islands
Mariana Trough Back-Arc Basin Bonin Arc Rifted Zone A
D
Latiitude ( N)
STERN ET AL. FIG. 18

0.1
1
10
100
Rb Ba Th U Nb Ta K La Ce Pb Nd Sr Sm Hf Zr Ti Eu Gd Dy Y YbElement (increasing compatibility)
Sam
ple/
MO
RB
IBM Subducted Sediments
MORB
STERN ET AL. FIG. 19
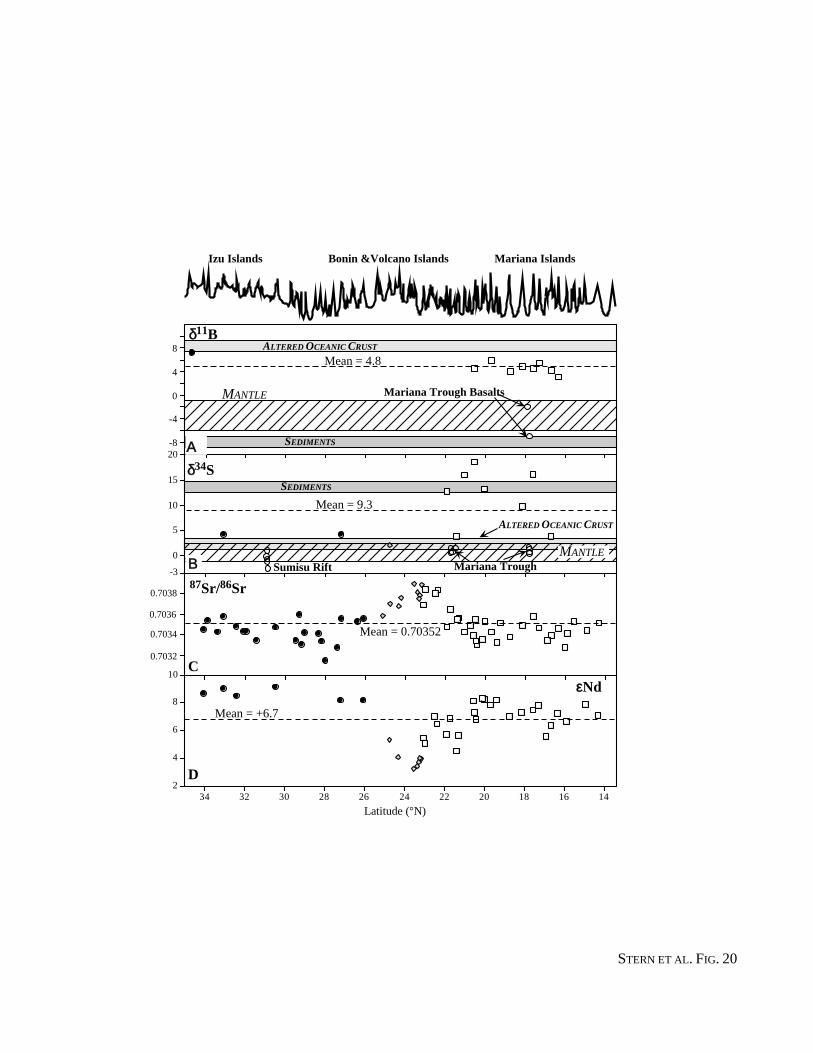
MANTLE
SEDIMENTS-8
-4
0
4
8 ALTERED OCEANIC CRUSTδ11B
Mean = 4.8
Mariana Trough Basalts
Izu Islands Bonin &Volcano Islands Mariana Islands
0
5
10
15
20Α
SEDIMENTS
Β
ALTERED OCEANIC CRUST
MANTLE
-3 Sumisu Rift Mariana Trough
0.7032
0.7034
0.7038
Mean = 9.3
87Sr/86Sr
C
Mean = 0.70352
2
4
6
8
10
1416182022242628303234
0.7036
Mean = +6.7
D
εNd
Latitude ( N)
STERN ET AL. FIG. 20
δ34S

B39.5
206Pb/204Pb
37.5/15.7
38
38.5
39
208 P
b/20
4 Pb
NHRL
15.4
15.5
15.6NHRLSediments
C
18.0 18.5 19.0 19.5
207 P
b/20
4 Pb
0
2
4
6
8
10
12
0.7020 0.7025 0.7030 0.7035 0.7040 0.7045
87Sr/86Sr
εNd
Sumisu RiftMariana TroughIzu-Bonin arcShoshonitic ProvinceMariana Arc
A
STERN ET AL. FIG. 21
Sediments
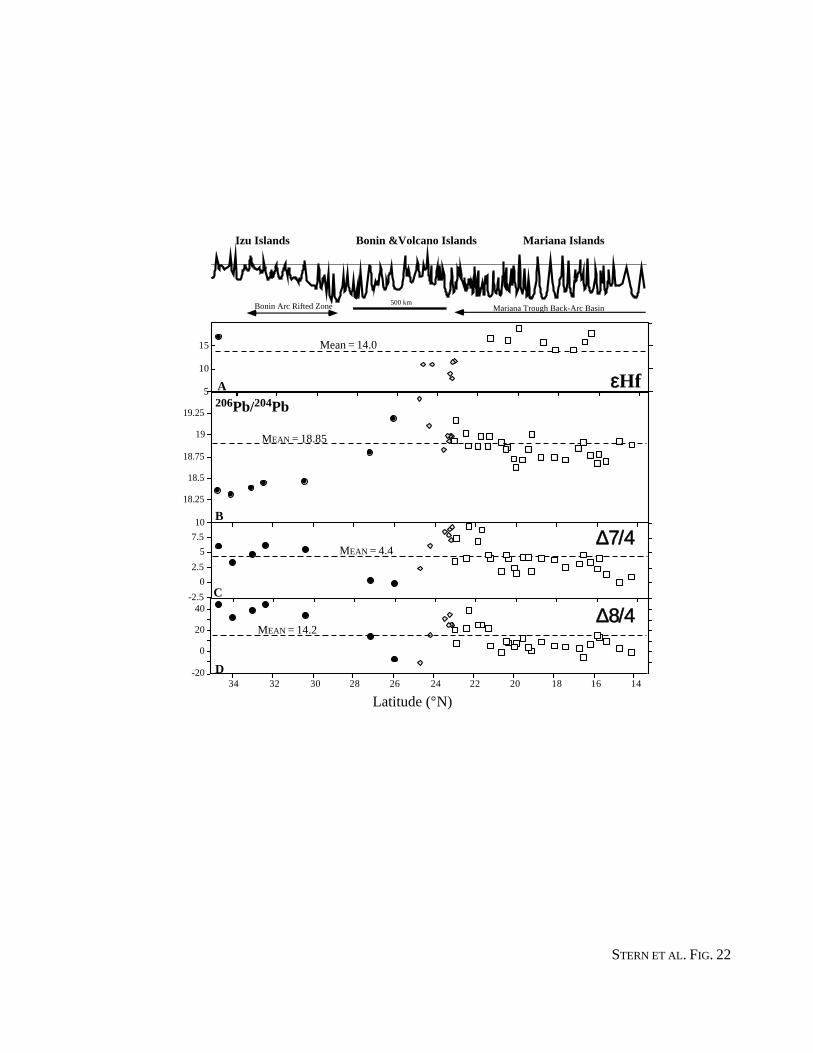
0
2.5
5
7.5
10
-20
0
20
40-2.5
18.25
18.5
18.75
19
19.25
MEAN = 4.4∆7/4
∆8/4MEAN = 14.2
MEAN = 18.85
B
C
D
206Pb/204Pb
εHf
Mean = 14.0
A5
10
15
1416182022242628303234
Latitude ( N)
500 km
Izu Islands Bonin &Volcano Islands Mariana Islands
Mariana Trough Back-Arc Basin Bonin Arc Rifted Zone
STERN ET AL. FIG. 22

(230
Th/
232 T
h)
(238U/232Th)
0
0.5
1
1.5
2
2.5
0 0.5 1.0 1.5 2.0 2.5 3.0
MORB
OIB
Bulk Sediments
U- Addition
30kyr Isochron
Equili
ne
-10
-5
0
5
10
15
20
25
-10 -5 0 5 10 15
IZU-BONIN ARC
SHOSHONITIC PROVINCE
MARIANA ARC
MORB
OIB
εNd
εHf
A
B
STERN ET AL. FIG. 23
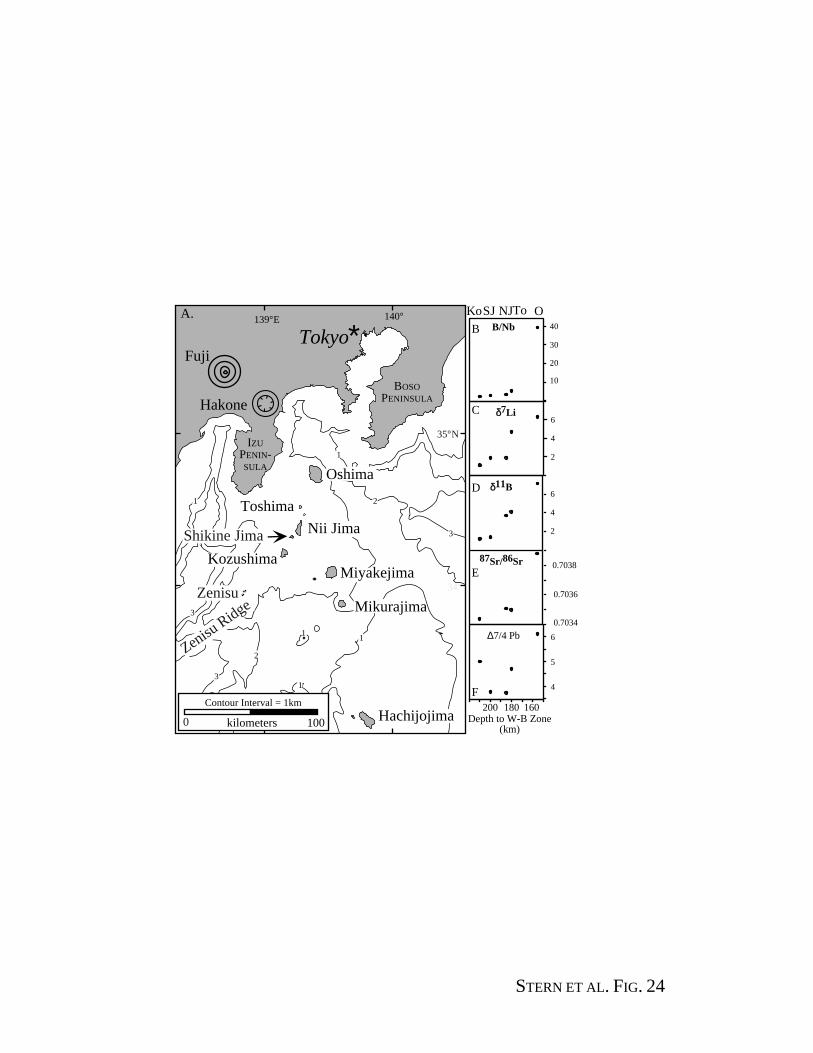
*Tokyo
IZUPENIN-SULA
35 N
139 E 140
1
Fuji
Hakone
2
3
Kozushima
Nii Jima
Toshima
Hachijojima
Shikine Jima
Miyakejima
Mikurajima
BOSOPENINSULA
1
Oshima
2
3
34
11
0 100kilometers
3
2
1
Contour Interval = 1km
Zenisu
Zenisu Ridge
160180200
OToNJSJKo
2
4
6δ7Li
2
4
6δ11B
10
20
30
40B/Nb
4
5
6∆7/4 Pb
87Sr/86Sr
B
C
D
E
F
0.7034
0.7036
0.7038
Depth to W-B Zone(km)
A.
STERN ET AL. FIG. 24

0
100
200
300
km b
elow
sea
leve
l
Axis of SpreadingBack-arc Basin
100 km500
Cross-chainVolcanoes
1
32
Magmatic Front of Arc Trench
0
100
200
300
km b
elow
sea
leve
l
km100
(No vertical exaggeration)
Crust
Lithosphere
Plate Motions
Partially moltendiapir
Magma
AsthenosphereMotions
1
Areas of MeltGeneration
Asthenosphere
300
A
B
1
STERN ET AL. FIG. 25
Trench

Shoshonitic
Province
45
3
79
9
Tinian
9
8 64
6
5 4
6
7
6
CIP
NSP
Iwo Jima
4
4
55
5
5
5
140 145 E 149
12
16
20
5
0 100 200
km
Pagan
Agrigan
Uracas
West
CD
Guam
Mariana
CIP
Ridge
SSP
K
Nikko
CG
B.
STERN ET AL. FIG. 26
28
140 141
32
139MyMk
HJ
AS
MS
SJ
TS
SG
NS
STL
NS
RS
GR
TS
RS
RA
RH
R
A.
30
34
Subaerial Volcano
Submarine Volcano
Volcanic Arc
Back-arc Basin
Spreading Ridge
Amagmatic Rift
Volcano-TectonicZone (VTZ)
Legend
Saipan

Hi-K Low-KMed.-K
0.2
0.6
1
1.4
1.8
SiO2
50 54 58 62 66 70 74 78
K2O
Bas. Andesite Dacite & RhyoliteB.-A.
A
Element (increasing compatibility)
Sam
ple/
N-M
OR
B
0.1
1
10
Rb Ba Th U Nb Ta K La Ce Pb Nd Sr Sm Hf Zr Ti Eu Gd Dy Y Yb
2
0.2
20
Mariana TroughVTZSpreading ('arc-like')Spreading ('MORB-like')
Sumisu & Myojinsho Rift
B
Sumisu Rift
Mariana Trough VTZ
MTB
STERN ET AL. FIG. 27

...
... .
....
.
..
.
.
. ..
....
.
.
... .
...
. . .
.
.
.
.
Os H F1 2 3 4 5
Cretaceous & older IBM Superterrane
A A'
.
...
.
. .
....
.
.
.
...
.
. .
.. . .. . .. . .. . .
...
.
....
.. .
...
...
. .. . .
...
.. . .
...
.
....
.. .
...
...
. .. . .
...
.. . .
...
.
....
.. .
...
...
. .. . .
...
.. . .
...
.
....
.. .
...
...
. .. . .
...
.. . .
....
.
.
.
...
.
. .
....
.
.
..
.
...
.
....
...
.
. . ..
.
.....
... .
... .
...
.. .. . .
...
.. . ...
.
.
....
..
.
.
... .
... .
...
.
....
.. .
...
...
. .. . .
...
.. . .
.
.
.
.
.
.
.
....
..
.
.
. ..
....
.
.
... .
...
. . .
.
.
.
.
50km
Os
F
H
~4cm/y
3
2
1
1
2Zen
isu R
idge
3
TanzawaMountains
To
NJ
SJ
Ko My
Mk
Sagami Trough
Suru
ga T
roug
h
Cretaceous and OlderCrust of Honshu
Shimanto BeltAccretionary Prism
IBM Lower Crust
Neogene GraniticRocks
IBM Upper Crust IBM
Superterrane
Quaternary Volcano
Quaternary
Seismicity <50km
... . .
...
.. . ...
. . . . . .
Tertiary Basin Fill
xx
A
A'
3
Om
1
4
5
A.
B.
IP
AB
STERN ET AL. FIG. 28
x
x
xx
xxxxx
xxx
xx
xx
xx

Hi-K
Low-K
Med.-K
Basalt And.B.-A.
0.2
0.6
1
1.4
1.8
44 48 52 56 60 64 68 72
% K
2ODacite & Rhyolite
76% SiO2
Izu Arc
1
10
30
3
0.3
SiO2 >57%
Izu Arc basalt mean
Y (ppm)60402001000100101
Y+Nb (ppm)
1 0
A
STERN ET AL. FIG. 29