analysis for diagnosing myocardial ischemia by detecting the boundary of left ventricle in...
TRANSCRIPT

8/12/2019 Analysis for Diagnosing Myocardial Ischemia by Detecting the Boundary of Left Ventricle in Echocardiography Sequences using GVF snake
http://slidepdf.com/reader/full/analysis-for-diagnosing-myocardial-ischemia-by-detecting-the-boundary-of-left 1/6
8/12/2019 Analysis for Diagnosing Myocardial Ischemia by Detecting the Boundary of Left Ventricle in Echocardiography Sequences using GVF snake
http://slidepdf.com/reader/full/analysis-for-diagnosing-myocardial-ischemia-by-detecting-the-boundary-of-left 2/6
Analysis for Diagnosing Myocardial Ischemia by Detecting the Boundary of Left Ventricle in
www.iosrjournals.org 34 | Page
II. Related Work Accurate LV segmentation is quite difficult due to the presence of noise and due to the low contrast of
echocardiographic image. Hence preprocessing of echocardiographic images is very important before the actual
segmentation of LV. The work in [1] presented a wavelet-based thresholding scheme for noise suppression in
ultrasound images. In [2] the image is filtered by convolving with a 3X3 Gaussian low pass filter followed by
thresholding and to eliminate the noise morphological dilation and erosion have been applied. Adaptiveweighted median filter (AWMF) for reducing speckle noise in ultrasound images is presented in [3] which is
based on the weighted median. By adjusting the weight coefficients and consequently the smoothing
characteristics of the filter according to the local statistics around each point of the image, it is possible to
suppress noise while edges and other important features are preserved. The work in [4] combines image
processing techniques with radial search to detect the left ventricular borders from echocardiograph images. The
fuzzy reasoning employed in [5] defines edges by local image characteristics computed based on local statistics
of the image. In this work to reduce the noise and to enhance the contrast of the image high boost filteringfollowed by LoG filter is carried out. The literature shows different methods for segmentation of LV in short
axis views. The work in [6] uses the gray level information along with user defined initial contours to extract the
boundary in the images. The method in [7] implements a probabilistic deformable model considering the
boundary as two-dimensional deformable object using maximum posteriori estimate. The work in [8] reports an
interesting approach to detect LV boundary of short axis echocardiographic sequences using a multiple active
contour model which is an extension to the original model proposed in [9]. A Hough transform technique is usedin [10] to find an initial approximation of the object boundary at the first frame of the sequence then, an active-
contour model is used in a coarse-to-fine framework, for the estimation of a noisy LV (Left Ventricle) boundary.
A texture segmentation algorithm based on the multi-channel filtering theory, is presented in [11]. The work in
[12] presents a technique that incorporates the information on pixel velocities (optical flow) into the estimate of
initial contour to enable tracking of fast-moving objects. Watershed transform and morphological operation tolocate the region containing the LV which then performs snake deformation with a multi-scale directional edge
map for the detection of the endocardial boundary of the LV is proposed in [13].A novel approach of combining
the K-Means clustering algorithm for segmentation and active contour model for boundary detection was
proposed in [14]. More recently mathematical morphology and connected component labeling are used to
segment the LV in short axis view echocardiography [15].In this work, gradient vector flow is used for
boundary detection to segment the LV in short axis view echocardiography.
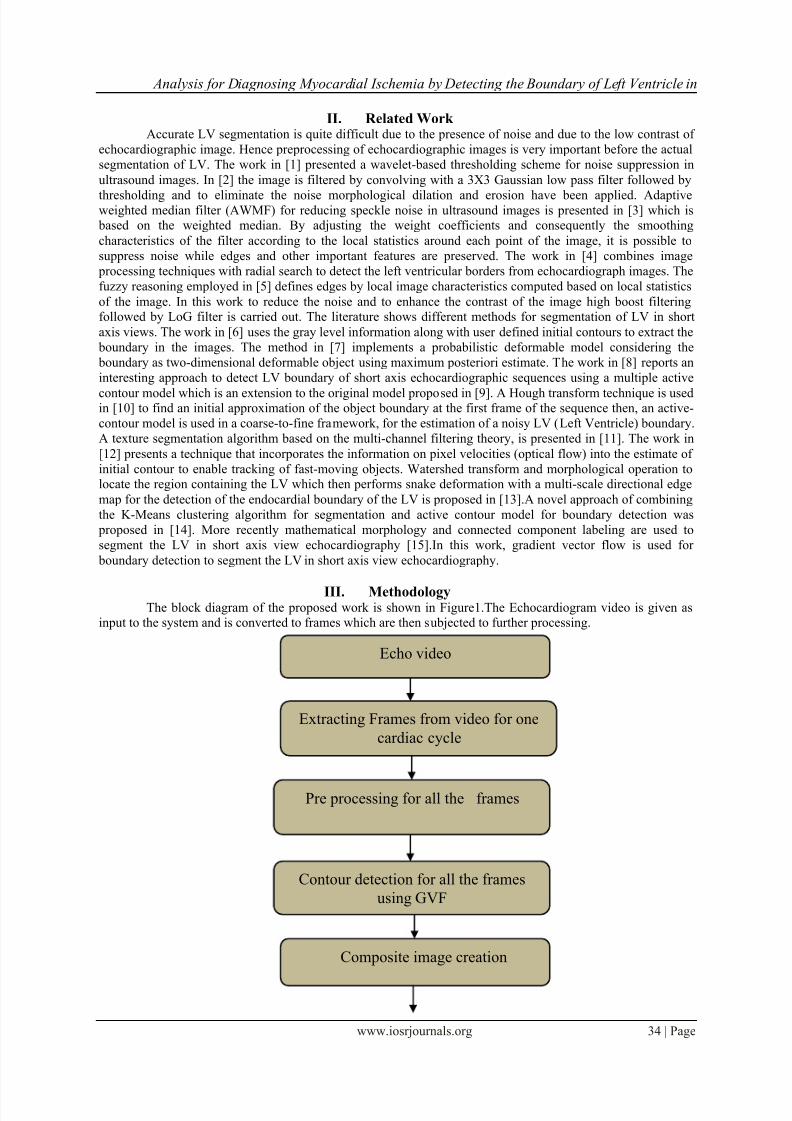
III. Methodology The block diagram of the proposed work is shown in Figure1.The Echocardiogram video is given as
input to the system and is converted to frames which are then subjected to further processing.
Echo video
Extracting Frames from video for one
cardiac cycle
Pre processing for all the frames
Contour detection for all the frames
using GVF
Composite image creation

8/12/2019 Analysis for Diagnosing Myocardial Ischemia by Detecting the Boundary of Left Ventricle in Echocardiography Sequences using GVF snake
http://slidepdf.com/reader/full/analysis-for-diagnosing-myocardial-ischemia-by-detecting-the-boundary-of-left 3/6
Analysis for Diagnosing Myocardial Ischemia by Detecting the Boundary of Left Ventricle in
www.iosrjournals.org 35 | Page
Figure 1 shows the method of the proposed work
When a patient Echo video is divided into frames, required images from the frames for one cardiac cycle will beextracted, and image pre-processing is performed for all the images that is extracted and the LV boundary is
detected by using GVF snake model .The boundary obtained for the entire echo image which is used to create a
composite motion (CM) image that consist of boundary detected systole and diastole movements. Then, finally
it is concluded that if the systole and diastole movements are normal then it is a normal heart else it is abnormal
and there is a block. Hence these methods are used to classify the heart wall abnormality. These stages aredetailed in the following sections.
Figure 2 shows the block diagram of the stages
Image pre-processingAn average filtering process is performed on the approximations. A mean based smoothing is
performed to all the details, which is defined for an image I(x, y) as,
I(x,y) if | I(x,y) | ≤ N
I(x,y) = N if | I(x,y) | > N
where N is the trimmed mean value of row of the pixel I(x, y) and x, y are the pixel coordinates. The trimmed
mean of a data X with n values, is the mean calculated by excluding the highest and lowest k data values, where
k=n*(p/100)/2 and where p is the percentage to be trimmed. Here 25 % of the outliers are trimmed from the
data. However, if the data is all from the same probability distribution, then the trimmed mean is less efficient
than the sample mean as an estimator of the location of the data. This operation is used to smooth the sudden
changes of coefficient values. Then the image is reconstructed using all the modified sub bands to get the noise
reduced image. Figure 2(a) shows the noisy image (speckle noise variance=0.5) and 2(b) shows the speckle
noise reduced image.
Figure 3 (a) Original image of Echo in parasternal short axis view (b) Speckle noise reduced image of Echo in
parasternal short axis view
LV boundary detectionThe left ventricle boundary is detected by using Gradient vector flow.
GRADIENT VECTOR FLOW SNAKEUsing a force balance condition as a starting point, the GVF field replaces the potential force field
The heart wall motion is normal or
abnormal
Image pre- processin
LV boundarydetection
Compositeimage
creation

8/12/2019 Analysis for Diagnosing Myocardial Ischemia by Detecting the Boundary of Left Ventricle in Echocardiography Sequences using GVF snake
http://slidepdf.com/reader/full/analysis-for-diagnosing-myocardial-ischemia-by-detecting-the-boundary-of-left 4/6
Analysis for Diagnosing Myocardial Ischemia by Detecting the Boundary of Left Ventricle in
www.iosrjournals.org 36 | Page
In defining a new snake, called the GVF snake. The GVF field points toward the object boundary when it is
very near to the boundary, but varies smoothly over homogeneous image regions, extending to the image border.
The main advantages of the GVF field are that it can capture from either side of the object boundary and can
force it into concave regions.Contour is said to possess energy (E snake ) which is defined as the sum of the three energy terms.
EGVF =EINTERNAL + EEXTERNAL
The internal energy, Einternal is the energy of curve and the image energy, Eexternal possess a GVF field as
external energy; and the constraint energy, Econ,allows higher level information to control the curve.
Internal EnergyThe internal energy is further given by sum of elastic energy and bending energy.
Elastic Energy (E elastic )The curve is treated as an elastic rubber band possessing elastic potential energy.It discourages
stretching by introducing tension. Weight (s) allows us to control elastic energy along different parts of the
contour. Considered to be constant for many applications. Responsible for shrinking of the contour.
Bending Energy (E bending )The snake is also considered to behave like a thin metal strip giving rise to bending energy. It is defined as
sum of squared curvature of the contour.
(s) plays a similar role to (s). Bending energy is minimum for a circle.
Total internal energy of the snake can be defined as
External energy of the contour (E ext )GVF snake algorithm possess Gradient Vector Field as external energy. The GVF field is defined to be a
vector field V(x,y)
Force equation of GVF snake:
αVss is the bending force of the internal energy, βVssss is the elastic energy of the internal energy and V is the
energy external which is defined as GVF field.V(x,y) is defined such that it minimizes the energy functional.
V(x, y) = (u(x, y) v(x, y))
GVF field can be obtained by solving following equations,
derivative of u and v.2 Is the Laplacian operator.
21( ) | |
2elastic s
E s v ds s
21( ) | |
2bending ss
s
E s v ds
2 2
int
1| | | | )2
elastic bending s ss
s E E E v v ds
0 ss ssssv v V
2 2( )( ) 0 x x yu u f f f 2 2( )( ) 0 y x yv v f f f
8/12/2019 Analysis for Diagnosing Myocardial Ischemia by Detecting the Boundary of Left Ventricle in Echocardiography Sequences using GVF snake
http://slidepdf.com/reader/full/analysis-for-diagnosing-myocardial-ischemia-by-detecting-the-boundary-of-left 5/6
Analysis for Diagnosing Myocardial Ischemia by Detecting the Boundary of Left Ventricle in
www.iosrjournals.org 37 | Page
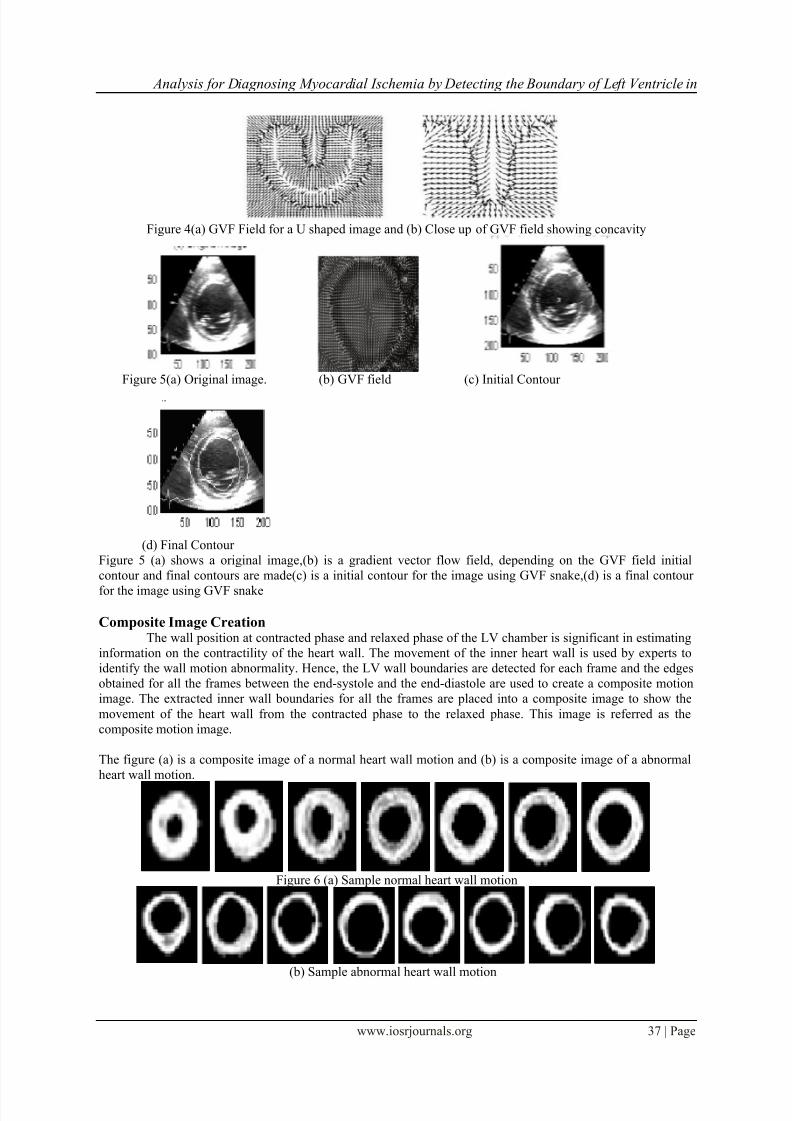
Figure 4(a) GVF Field for a U shaped image and (b) Close up of GVF field showing concavity
Figure 5(a) Original image. (b) GVF field (c) Initial Contour
(d) Final Contour
Figure 5 (a) shows a original image,(b) is a gradient vector flow field, depending on the GVF field initial
contour and final contours are made(c) is a initial contour for the image using GVF snake,(d) is a final contour
for the image using GVF snake
Composite Image Creation The wall position at contracted phase and relaxed phase of the LV chamber is significant in estimating
information on the contractility of the heart wall. The movement of the inner heart wall is used by experts to
identify the wall motion abnormality. Hence, the LV wall boundaries are detected for each frame and the edges
obtained for all the frames between the end-systole and the end-diastole are used to create a composite motion
image. The extracted inner wall boundaries for all the frames are placed into a composite image to show the
movement of the heart wall from the contracted phase to the relaxed phase. This image is referred as the
composite motion image.
The figure (a) is a composite image of a normal heart wall motion and (b) is a composite image of a abnormal
heart wall motion.
Figure 6 (a) Sample normal heart wall motion
(b) Sample abnormal heart wall motion
8/12/2019 Analysis for Diagnosing Myocardial Ischemia by Detecting the Boundary of Left Ventricle in Echocardiography Sequences using GVF snake
http://slidepdf.com/reader/full/analysis-for-diagnosing-myocardial-ischemia-by-detecting-the-boundary-of-left 6/6
Analysis for Diagnosing Myocardial Ischemia by Detecting the Boundary of Left Ventricle in
www.iosrjournals.org 38 | Page
IV. Conclusion In this paper a method for border detection in left ventricle was proposed using GVF snake for
diagnosis of myocardial ischemia.The heart wall boundaries extracted by using the GVF snake to analyse the
heart wall to identify the heart wall abnormality. The left ventricular motion over a complete cardiac cycle was
provided by the proposed algorithm. The accuracy of the proposed method was useful to the cardiologist. Hence
the proposed method can be very effectively used to detect myocardial ischemia.
References[1] S.Sudha, G.R.Suresh and R.Sukanesh Speckle Noise Reduction in Ultrasound Images by Wavelet Thresholding based on Weighted
Variance, International Journal of Computer Theory and Engineering, Vol. 1, No.1, April 2009.[2] A. Mishra, P. K. Dutta, and M. K. Ghosh, A GA based approach for boundary detection of left ventricle with echocardiographic
image sequences. Image Vis. Compute., vol. 21, pp. 967-976, 2003.[3] T. Loupas, W. N. Mcdicken, and P. L. Allan. An Adaptive Weighted Median Filter for Speckle Suppression in Medical Ultrasonic
Images OO98-4094/89/01OO-012901 .01 989 IEEE.
[4] Saulo Guerreiro Lacerda, Adson F. da Rocha, Daniel F. Vasconcelos,Joo L. A. de Carvalho, Iwens G. Sene Jr. and Juliana F.
Camapum Left Ventricle Segmentation in Echocardiography Using a Radial-Search-Based Image Processing Algorithm. IEEE
2008.
[5] Sheila Chan, Gopalakrishnan Sainarayanan, Fuzzy-based boundary enhancement for echocardiogram using local imagecharacteristics. Malaysian Journal of Computer Science, Vol. 19(2), 2006.
[6] Chu, C. H., Delp, E. J., and Buda, A. J. (1988). Detecting left ventricular endocardial and epicardial boundaries by digital two
dimensional echocardiography. IEEE Transactions on Medical Imaging.[7] Staib, L. H., and Duncan, J. S. (1992). Boundary finding with parametrically deformable models. IEEE Transactions on Pattern
Analys is and Machine Intelligence.
[8] Chalana, V., Linker, D. T., Haynor, D. R., and Kim, Y. (1996).A multiple active contour model for cardiac boundary detection oneechocardiographic sequences.IEEE Transactions on Medical Imaging,15, 290298.
[9] Kass M., Witkin A., and Terzopoulos D. (1988). Snakes: Active contour models. International Journal of Computer Vision, 1,
321331.[10] Antonio Fernandez-Caballero, Jose M. Vega-Riesco. Determining heart parameters through left ventricular automatic segmentation
for heart disease diagnosis. Expert Systems with Applications 36 (2009) 223422492007ElsevierLtd.All rights reserved
doi:10.1016/j.eswa.2007.12.045.[11] A Bosnjak, G Montilla, V Torrealba, Medical Images Segmentation using Gabor Filters applied to Echocardiographic Images0276-
6547/981998 IEEE.
[12] IvanaMikic,* Slawomir Krucinski, and James D. Thomas, Segmentation and Tracking in Echocardiographic Sequences: ActiveContours Guided by Optical Flow Estimates S 0278-0062(98)04883-6. 1998 IEEE.
[13] Jierong Cheng, Say Wei Foo, and Shankar M. Krishnan Watershed Presegmented Snake for Boundary Detection and Tracking of
Left ventricle in Echocardiographic Images IEEE transactions on informationtechnology in biomedicine, vol. 10, no. 2, April 2006. IJCATM :
[14] S. Nandagopalan, C. Dhanalakshmi, Dr. B. S. Adiga N. Deepak, Automatic Segmentation and Ventricular Border Detection of2DEchocardiographic Images Combining K-Means Clustering and Active Contour Model. IEEE 2010.
[15] G.N.Balaji,Dr.T.S.Subashini,Automatic Border Detection of the Left Ventricle in Parasternal Short Axis View of Echocardiogram
using mathematical morphology International Journal of Computer Application.September 2013.