analysis of irrigation pond ecosystems. ii....
TRANSCRIPT
Hyogo University of Teacher Education Journal Vol. 9, Ser. 3, 51-68 (1988)
Analysis of Irrigation Pond Ecosystems.
II. Seasona,1 Changes of the Concentrations of
Photosynthetic Pigments.
51
Osamu YAMAGUCHI, Noriko INOUYE, Osamu IMANISHI
and Shigeru SHIRANITA
(Received September 30, 1988)
Abstract
Four irrigation ponds were analyzed for the density of plankton and the concentr-
ations of photosynthetic pigments in every month over a year in order to estima-
te the capacity of productivity in the ecosystems. The averages of concentration
of chlorophyll a were 1.98〟 g/ 1 in Showa pond, 2.75 in Haibaraguchi pond and
3.35 inOhjiga pond respectively. Diatoms were the most dominant plankton in
these three ponds in common. While the average concentration of chlorophyll a
was 47.66llg/ 1 , and the dominant plankton were protozoans in Sara pond. The
magnitudes of diatom quotient paralleled the concentrations of chlorophyll a. The
estimated productivityinSarapondseems tobetwentytimes higher than thoseof
the former three ponds.
Introduction
Photosynthesis is the ultimately biologiacal energy source to ecosystems. Using
this energy, any functions of ecosystem are able to operate. Photosynthetic pigm-
ents are the primary light energy acceptors or the primary step of photosynthesis,
and their total amount is an indicator of the potential of productivity in a given
ecosystem. Each floral phytoplankton has its own supplemental photosynthetic
pigments, thus the amount is also an indicator of biomass of a specific plankton
flora. So far, we have described population dynamics of the constituent plankton
in some irrigation ponds (Yamaguchi et al. 1988). Here in this paper, we report
a monthly survey of the potential of productivity and the population dynamics
of its contributory plankton considered from a variation in the concentrationsof
photosynthetic pigments.
Materials and methods
Descriptionof the water-sampled ponds: The following four irrigation ponds
were examined for amounts of photosynthetic pigments during a period of ayear.
All of them are in Yashiro Town, Hyogo Prefecture. The irrigation capacities
Department of Biology, Hyogo Universtiy of Teacher Education, Yashiro, Hyogo
673-14, Japan
52
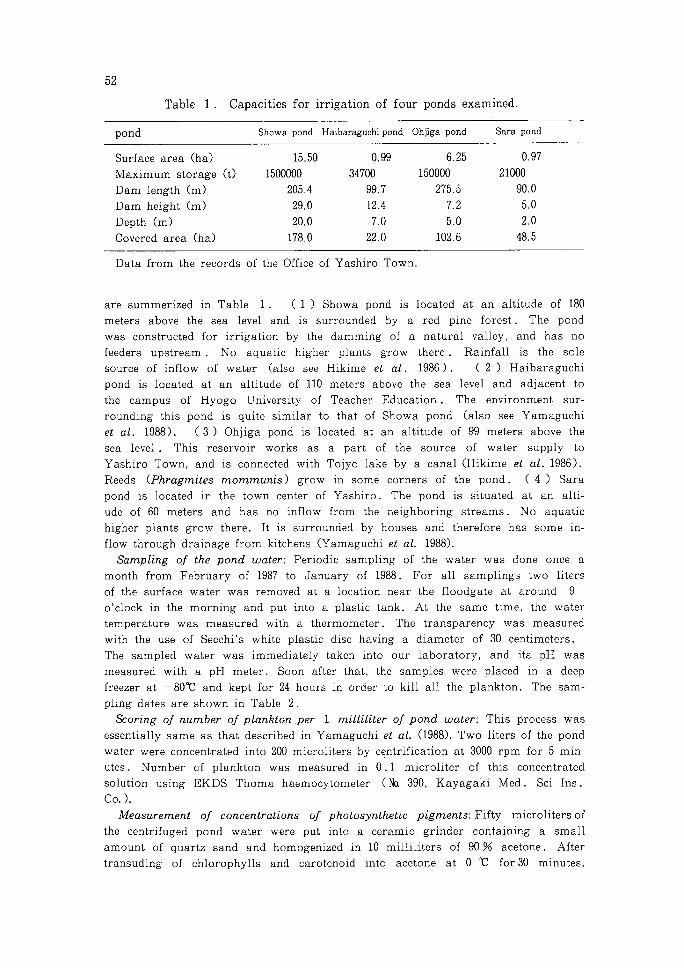
Table 1. Capacities for irrigation of four ponds examined.
pond Showa pond Haibaraguchi pond Ohjiga pond Sara pond
Surface area (ha) 15.50 0.99 6.25 0.97
Maximum storage (t) 1500000 34700 150000 21000
Dam length (m) 205.4 99.7 275.5 90.0
Dam height (m) 29.0 12.4 7.2 5.0
Depth Cm) 20.0 7.0 5.0 2.0
Covered area (ha) 178.0 22.0 102.6 48.5
Data from the records of the Office of Yashiro Town.
are summerized in Table 1. (1) Showa pond is located at an altitude of 180
meters above the sea level and is surrounded by a red pine forest. The pond
was constructed for irrigation by the damming of a natural valley, and has no
feeders upstream. No aquatic higher plants grow there. Rainfall is the sole
source of inflow of water (also see Hikime et al. 1986). ( 2 ) Haibaraguchi
pond is located at an altitude of 110 meters above the sea level and adjacent to
the campus of Hyogo University of Teacher Education. The environment sur-
rounding this pond is quite similar to that of Showa pond (also see Yamaguchi
et al. 1988). (3) Ohjiga pond is located at an altitude of 99 meters above the
sea level. This reservoir works as a part of the source of water supply to
Yashiro Town, and is connected with Tojyo lake by a canal (Hikime et al. 1986).
Reeds (Phragmites mommunis) grow in some corners of the pond. ( 4 ) Sara
pond is located in the town center of Yashiro. The pond is situated at an alti-
ude of 60 meters and has no inflow from the neighboring streams. No aquatic
higher plants grow there. It is surrounded by houses and therefore has some in-
flow through drainage from kitchens (Yamaguchi et al. 1988).
Sampling of the pond water: Periodic sampling of the water was done once a
month from February of 1987 to January of 1988. For all samplings two liters
of the surface water was removed at a location near the floodgate at around 9
0'clock in the morning and put into a plastic tank. At the same time, the water
temperature was measured with a thermometer. The transparency was measured
with the use of Secchi's white plastic disc having a diameter of 30 centimeters.
The sampled water was immediately taken into our laboratory, and its pH was
measured with a pH meter. Soon after that, the samples were placed in a deep
freezer at -80C and kept for 24 hours in order to kill all the plankton. The sam-
pling dates are shown in Table 2.
Scoring of number of plankton per I milliliter of pond water: This process was
essentially same as that described in Yamaguchi et al. (1988). Two liters of the pond
water were concentrated into 200 microliters by centrification at 3000 rpm for 5 min-
utes. Number of plankton was measured in 0.1 microliter of this concentrated
solution using EKDS Thoma haemocytometer (Na 390, Kayagaki Med. Sci Ins.
CO.).
Measurement of concentrations of photosynthetic pigments: Fifty microhters of
the centrifuged pond water were put into a ceramic grinder containing a small
amount of quartz sand and homogenized in 10 milliliters of 90% acetone. After
transuding of chlorophylls and carotenoid into acetone at 0 C for30 minutes,
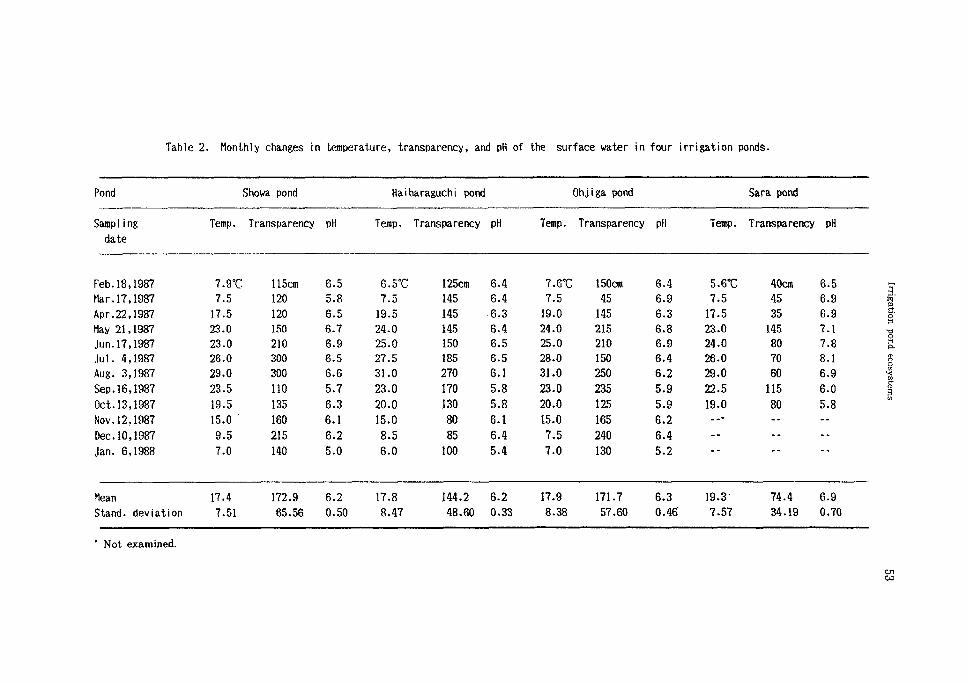
Tab一e 2. Monthly changes inもentperat.ilre, transparency, and pH ofもhe surface l抱ter in four irrigation ponds.
Pond Showa pond Hai baraguchi pond Oh、i iga pond Sara pond
Sampl ing Temp. Transparency pH Temp. Transparency pH Temp. Transparency pH Temp. Transparency pH
date
Feb. 18, 1987
Mar. 17, 1987
Apr.22, 1987
May 21,1987
Jun.17,1987
.lui. 4,1987
Aug. 3,1987
Sep. 16,1987
0ct.13.1987
Nov. 12, 1987
Dec. 10, 1987
Jan. 6,1988
7.9℃ 115cm
7.5 120
17.5 120
23.0 150
23.0 210
26.0 300
29.0 300
23.5 110
19.5 135
15.0 160
9.5 215
7.0 140
Locoint-ainto>n-cno
c
d
i
n
c
o
e
U
C
D
ハ
s
<
s
i
n
c
o
t
o
<
o
i
n
℃m
t
o
t
o
o
o
m
o
ハ
3
O
O
I
O
O
<
o
r
-
r
o
ォ
*
i
n
c
-
-
*
n
o
i
a
o
o
e
U
M
M
N
ォ
N
M
-
<
*
ォ
・
i
<
5
<
*
i
n
i
n
.
1
C
O
0
0
-
'
一
皿
丁
4
氏
3
C
D
C
D
C
D
C
O
e
d
c
d
i
n
t
o
e
U
6
5
.
l
,
、
此
Ci
n
i
n
t
o
w
o
c
4
ォ
*
k
t
ォ
a
*
m
^
o
o
t
o
o
e
o
c
o
o
o
o
l
C
N
-
-
1
n
…
CO
I
O
I
O
U
7
0
0
0
1
0
L
O
U
7
0
0
ォ
蝣
ォ
蝣
-
i
-
<
u
i
ォ
M
M
r
<
訪
n
c
N
t
o
ォ
=
)
・
C
O
℃企
U
5
0
ハ
3
0
0
0
0
0
0
1
0
0
2
S
8
8
?
S
?
3
8
;
2
r
-
t
-
=i'(サnaiO)fl'N!nojM>サM
6
6
e
D
C
O
t
O
と
d
c
d
m
i
n
c
o
c
d
i
n
W
O
5
Q
-
'
0
0
ォ
ー
i
O
O
O
0
I
6
6
e
o
c
-
r
-
o
o
e
U
e
d
i
n
i
i
i
eCO
t
O
l
r
t
L
r
t
O
O
O
I
O
O
一
ォ
"
ォ
3
<
m
>
a
'
c
o
r
-
i
d
r
i
o
o
ll
℃6
5
5
ハ
3
O
O
O
I
O
O・
I
l
l
i
n
r
-
t
-
<
m
"
=
r
e
U
9
(
ノ
1
O
i
I
I
I
1
2
へ
ノ
N
ォ
N
ォ
Mean 17.4
Stand, deviation 7.51
蝣Not examined.
Irrigationpondecosystems
Crl
CJD
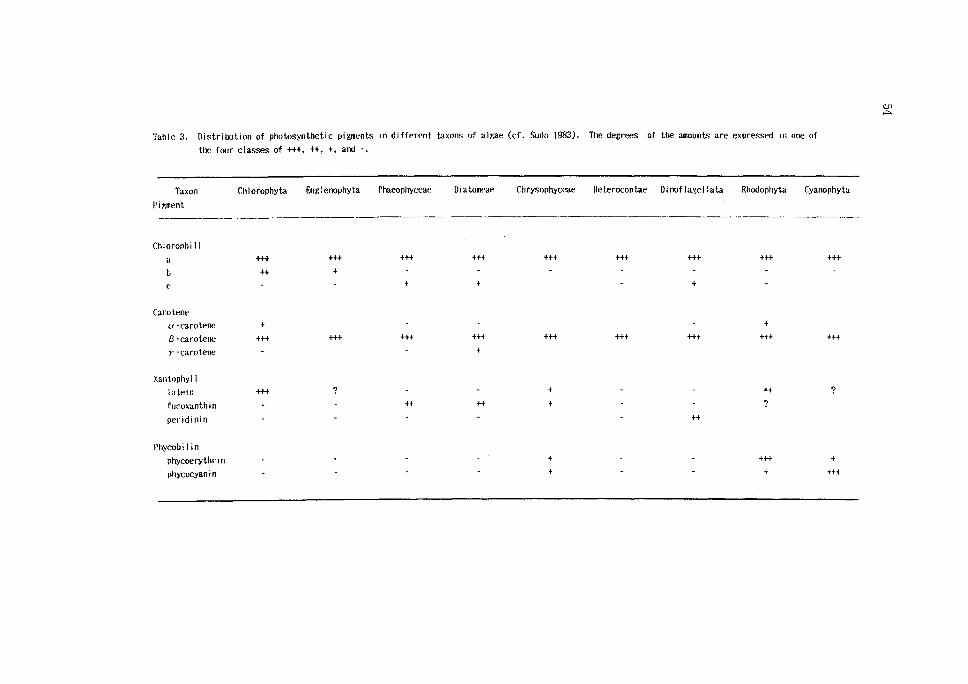
Table 3. 【listribution of photosynthetic pigments in different taxons of al岩ae (cf. Sudo 】983). The de苫r・氾s of the aimiounts are expresst・d id one clf
the four classes of +++, ++, +, and -.
Taxon Chlorophyta En岩Ienophyta Phaeophyceae Dialomeae Chrysophyceae lleterocontae Dinoflagellata Rhodophyta Cyanophyta
Piwent
Chlorophi I
a
b
ぐ
+++ +++ +++ +++十十十+++ +++十十+ +++
++ +
+ +
C払rotene
Et -(蝣aroterw'
T -carotene
Xalltophyl i
luteinつ
fucoxanlhill
peridimn
Phycohl l蝣n
phycoerythr i n
uhycocyan i n
+
++十十十
as
十十ウ
t、
+++ +
+ +++
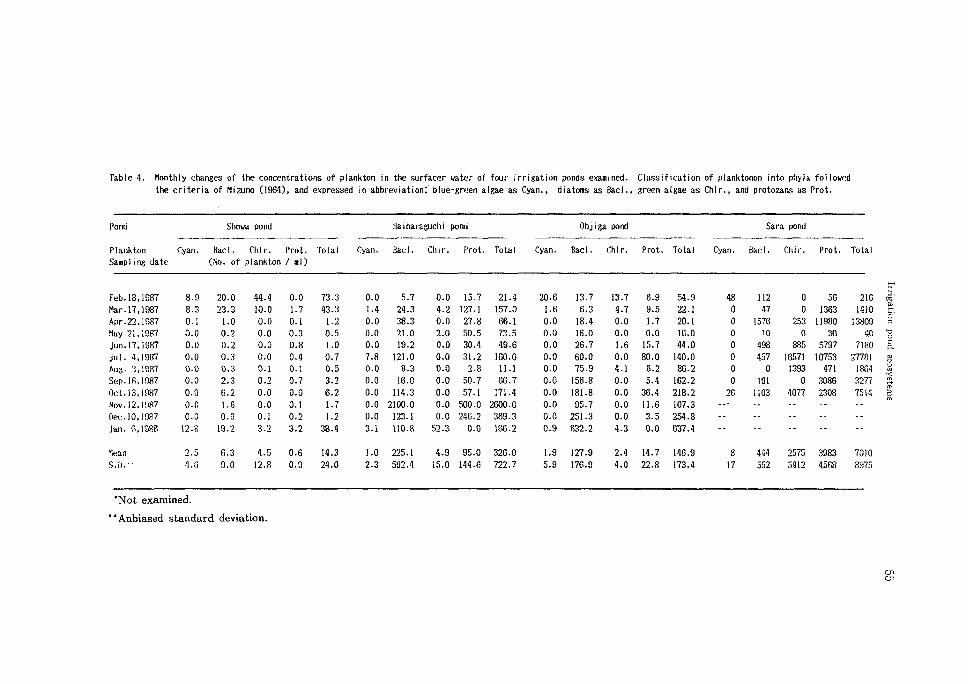
Table 4. Monthly changes of the concentrations of plankton in the surfacer water of four irri岩ation ponds examined, classification of planktonon into phy一a followed
the criteria of Mizuno (1964), and expressed in abbrev atioru blue-green algae as Cyan., diatoms as Bad., reerl algae as Chlr., and proto2aas as Prot.
Ponii lrowa pond Haibaraguchi pond Ohj iga pond Sara pond
Plallkton二yan. Bad. Chlr. ProL Total Cyan. Bad. Ch】r. P「ot. Total Cyan- Bad. Chir. Prot. Total Cyan. Bad. Chir. Prot. Total
Sa叫Iing date (No. of plankton !印J)
Irrigationpondecosystems
〃UO
e
j
ォ
=
r
56氾
09姐80別朋F=1
38刊r-cc<siin
s-Mt-一
l2
…-・,-:普.-a
oocioin
ir>ooh-CDr-
cnooincooサ
ZD‾-T蝣
M^OOCOr-0-M
-i<=s-r-r-eni39ハU
IlD1<=f-IW
mooハUハUバーjo<nco
42!
9・l一-ハ3OOCSMNMMAI
Sf3S25ァΩ22S別的
-->-hrj-inw
oji^r-or-Oへノi蝣?wcdino
臥oi-oir.那臥CO・-・蝣臥
r-r-OOハCOlハ3000<n
COォ=J*00-<=>ォ10000<TI
r*-<nォ*or-ADOCOCOf-WfN
COCDCOCDCOnr>w>cd-ォin蝣lへ6
1--'-CNtD^UIOOEilftrt
--CN'_C
euハsooooooooocn
0-00000ハz>oooo
aej*OォーfICeUO・174へU3りん
:ァ=描l
7t伽。5t。
coco
nノJ
7・-・‖Oin*rcscct--10つ一O
577ハ=>0-つ-nDf-OCOO
lりんminfoォmlioォa<
5nノ1
02CACSOOOOOOOM
o*rocソ】00爪UOハUハUOへノl
T*J
r-ciccoc-jocoocooIIQU
in-zr-1COtoKfOMO
CNCOCN-CMAZ>CN-
204ハ=>ooceooハ300-・
0-0ハDOI*-OハUOOnU3
n;nminon一〇227りん八'
MM-nD-<OOCO<0-蝣-CO
r-tr-.
or--蝣c?coォa*--r-o・19】2
010ハC3OOOOOOOCC
4-nUA^000-・れノ蝣IOO-flJ
且pooooooooooつJ
41
onocnへノ7へ:ォォwcdc:-m
OM--OOOOiNハIE蝣-"OC?3
22
OSォーIn30000C3ハUOOn
COCOOOOOOハZ>OOOCN
2575 3983 70iO
5412 1568約7.i
a
r
r
J*M-tf
47
7
9
U
4
.
2
-蝣r*j
句nu
2.礼
99
7'臥
27
99
15
Feb. 18,1987
Mar蝣17,1987
Apr.22.川87May 21,1987
Jun.17,1987
Jill. 4,1987
Aug. :'-,1987
Sep. 】6.1987
Oct.13,1987
Noヤ. 12.王087
Dec. 】0,日〕P7
Jan. K,1988
Yl也6-J.04.50.614.31.0225.14.995.0326.0s.n.--4.69.012.80.924.02.3592.415.0144.6722.7
"Not examined.
‥Anbiased standard deviation.
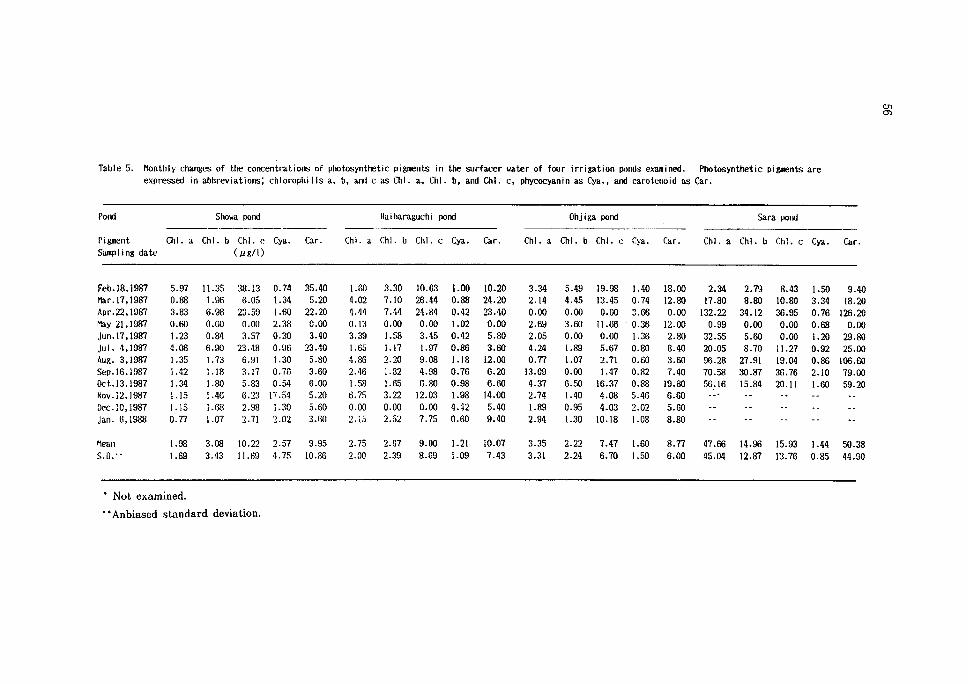
Table 5. Monthly changes of the concentrations of photosynthetic pig向ents in the surfacer lJater of four irrigation ponds examined. Photosynthetic pigi山ents are
expressed in abbreviations; chloropiulls a, b, and c as Chi. a, Chi. b, and Chi. c, phycocyanin as Cya., and carotenoid as Car.
PoI Showa pond Hai baraguchi pond Ohj i岩a pond Sara pond
Pi即Ient Chi.a Ch上b Chi.o Cya. Car. Chi.a Chi.b Chi.c Cya. Car. Chi.a Chi.b Chi.c Cya. Car. Chi.a Chl.b CH.c Cya. Car.
Samp! ing date (u幕/I)
9.40
18.20
26.20
0.00
29.80
25.00
06. 60
79.00
59.20
50朗76餌8S3粥106
-蝣MOOI一OON-
sァs肺∞27047;
050(000
‾-CO‖19諮2-
開脚t2榊舶-[*-ォ3"
oscooo
cJ臥owco(-訓1.
2.34
17.80
132.22
0.99
32.55
20.05
96. 28
70.58
56.16
47.66 14.96 15.93 1.44 50.38
45.04 12.87 13.76 0.85 44.90
oo湘∞SSS8ァ抑ooo
cocooo
COtNONMOSMISmCDinCO
:g訊88糾氾iCDCNCO
I-OC00-OOOOiOへ∠,-I
粥45の磁軸;fiォ82
atco0-oirtつ]・liQ<rォd70
ァS8仰∞約88ァ88
WォfOォO--OO-O-
82抑ct>inォ*t-
(oOMI*-∞訂ej*05TT
p-oeoj
WCMONMAfOMォTCN-(ノl
加oooo
cM*&OOO鈍ァs細蝣s
乃OIOWCN(D飢帆u405
00錦cJC"JCN
ォa>o<*・鎚octa鍋05MO
o5ォ*CO
-<00-一oo--00-蝣・a'0
34月TOirtI-COCO∧dォon
nDォ3*OCO蝣り007
0CD爪TOM-O)nTPU207
122
23叫詔tsa駈22∞52
cor-r-o蝣--tソ一---MOhソ】
2g18ggg」8ほ
・・144-0ォーォTN-mOつl
88叫oooo
ォ#ォ蝣OOCO∞sss
WWMOMォ〇ォcdininm
32つ】
郎S.S兆cir-u?朋8S
0--NO・-oor‾-一1ハソ一
3L39ハU790-h-COMCOl1
-oioom^rm-ーCOJNC5I*-
OUeUCOOォMIOWU5nU2つ・l
322
35鮎粥oo糾sgs印〇
・l・ItDooeo-H--__-1一
s拭S3印23鵬898ほ157
mocso-**-1・10
π㈱
ci臥
3S
70
^蝣蝣s
f-CO
CJrr
22
SmS
51
3
つ
t
へ
i
e
o
73
0
ォ
r
柑7
=ZX*;h
CNO
潤潤
900
r-cr.
nHりr.
fjf-j
in欄サ蝣ォ:
inc3
0SO,〟
9
_
0
Feb. 18, 1987
Mar. 17, 1987
Apr.22, 1987
May 21,1987
ノun. 17, 1987
Jul. 4,1987
Au葛. 3,1987
Sep- 16. 1987
Oct. 13, 1987
Nov.i2,】987
Dec. 10, 1987
Jan. 6.1988
Mean 1.98 3.0 10.22 2.57
S.Cl.= 3.43 ll.R9 4.75
* Not examined.
"Anbiased standard deviation.
Irrigation pond ecosystems 57
the homogenates were centrifuged at 3000 rpm for 5 minutes. Two milhliters
of the supernatant solution was decanted into a quartz cell, and light absorp-
tion was examined at 750,663,645,630, and 480 nm wave lengths witha spectr0-
photometer (Shimazu UV-120-02). Estimation of the concentrations of chlo-
rophylls (Chi. a, b, and c) and carotenoid (Car.) was done following the
methods of SCOR/UNESCO (1966) and Strickland and Parsons (1968).
Chi. a dug/ml) -ll.64E663-2.16E645+0.10E<
Chi. b (〟g/ml) --3.94Ee63+20.97E6(s-3.66Ee3o
Chi. c (〟g/ml) --5.53Ei -14.81E645+54.22E,
Car. 〟g/ml) -10.0E48
There E means the real absorption at specific wave lengths written in subscript
after sulDtracting the absorption at 750 nm.
Another 50 microliters of the centrifuged pond water were ground in 10 milli-
liters of distilled water. The concentration of phycocyamn was measured in the
same way as carotenoid substituting Ee2s for E480 (cf. Shibata 1974).
Concentrations of the photosynthetic pigments in the actual pond water sam-
pled (C 〟g/ 1) are given in the following formula when the measured value
is x (〝g/ml) ;
C(〝g/1)-Ⅹ.Ⅴ
Ⅴ
There V means the volume of 90% acetone solution or distilled water (ml) used
for extraction of the pigments, and V stands for the volume of the correspond-
ing pond water examined (1).
Results
Monthly survey_ of parameters of the ecosystems
Abiotic conditions of the pond ecosystems were surveyed once a month for one
year from February of 1987 to January of 1988; temperature of the surface
water, transparency, and pH. The results are shown in Table 2. The tempera-
ture had a range from 5.6℃ to 31.0-C with the grand mean of 18.1。C. The min-
1mum transparency was 40cm, and the maximum was 300cm with the grand mean
of 140.8cm. The concentrations of hydrogen ions (pH) ranged from 5.0 to 8.1
with the grand mean of 6.4. The biotic components were surveyed to assess
the dynamics of the planktonic population, and the plankton mass was described
as the observed number of individual organisms in one milhliter of the pond
water and the concentrations of photosynthetic pigments specific to the com-
posing taxons. Distribution of the pigments among different taxons are seen in
Table3 (Sudo 1983). The results are shown in Tables 4 and 5. The detailed
analyses were done in the following sections with regard to each independent
pond.
Seasonal succession in the ecosystem of Showa pond
Diatoms (Bacillariophyta) dominated over the other plankton throughout the
58
No.p一ankton/ml p一ankton in Showa pond
234567891'g
Month in 1987 or 1988
!
S
J
&
i
n
-
n
88堊ヨCyanophyta78 EヨBaci I larioph如
・こ悪∵∴r-il・=i50 -・ tota一 p一ankton
n
U
n
U
n
U
n
U
^<OC¥JT-i
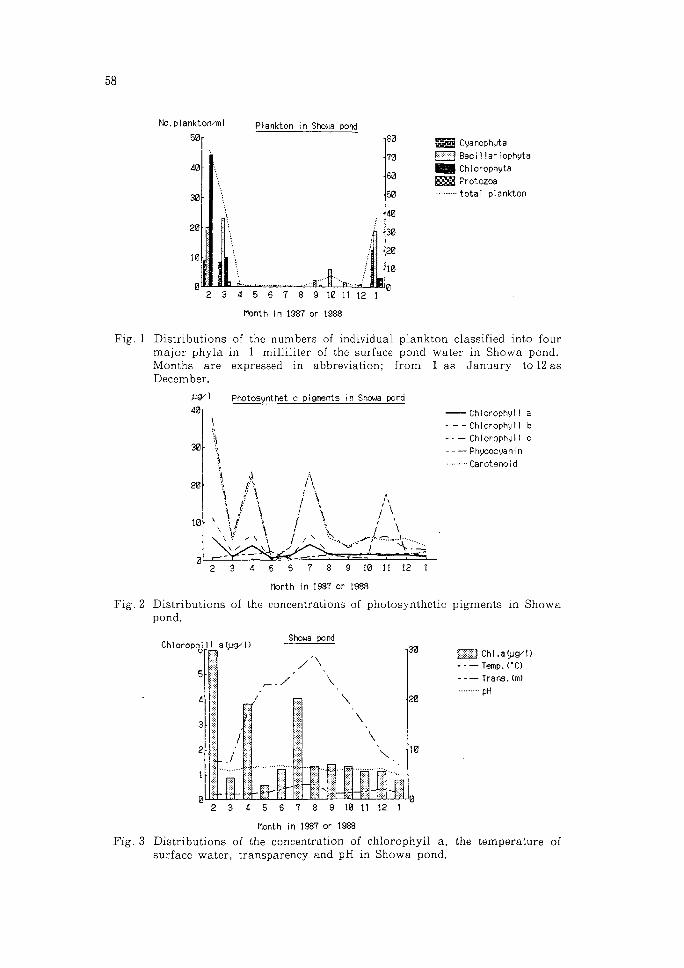
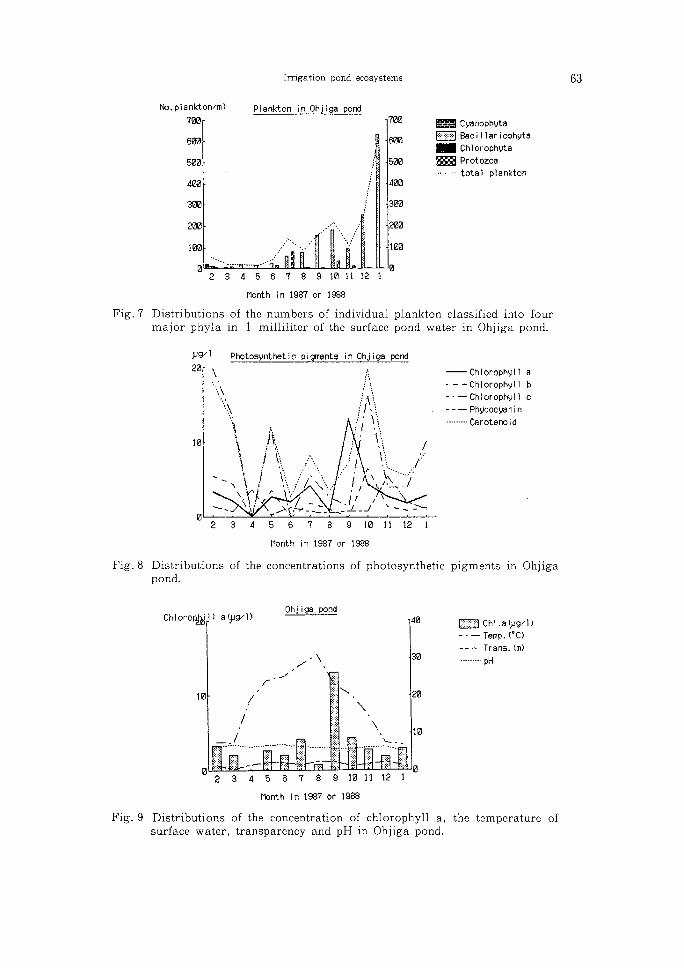
Fig. 1 Distributions of the numbers of individual plankton classified into four
major phyla in 1 milliliter of the surface pond water in Showa pond.
Months are expressed in abbreviation; from 1 as January to12asDecember.
p9-'】
甜柑
Photosリnthet ic pigments in Shoレga pond
LL/'!
-1
!
!
-
′
56T89柑i1121
-ChlorophリH a
ChlorophリIl b
一--ChiorophリH c
PhリCOCゝ.'a n i n
-- Caroteneid
「蝣tenth in 1987 or 1988
Fig. 2 Distributions of the concentrations of photosynthetic pigments in Showa
pond.
E:琵ヨChl a(y
Temp. (
I--Trans.(
pH
234567891011121
Month in 1987 or 1988
Fig. 3 Distributions of the concentration of chlorophyll a, the temperature of
surface water, transparency and pH in Showa pond.
Irrigation pond ecosystems 59
year in this pond. Green algal plankton (Chlorophyta) were observed only inthe
cold season under direct observation with a micsroscope. Blue-green algal plank-
ton (Cyanophyta) had also a similar distribution pattern as of the green algae.
The distribution is seen in Fig. 1. However, this seems not to be the case,
because the concentration distribution of chlorophyll b which is specific to green
algae (Table 3) had peaks in April (6.! 〃g/1) and July (6.90〝 1) as
well as February (38.13 〝g/1) as shown in Fig. 2. The contradiction ap-
pears to be ascribed to the small sample volume of the former assay. Similarly,
the concentration distribution of pycocyanin, specific to blue-gree algae (Table
3), had a sigle peak in November (17.54 〟g/ 1 ) in the pigment assay. The
concentration distribution of carotenoid paralleled that of chlorophyll c which
is specific to diatoms, thus the majority of carotenoid were contributed from
the diatoms. The pigments discussed above are of supplementals in the process
of energy acception in photosynthesis. Chlorophyll a, on the contrary, is the
core pigment in photosynthesis and every phytoplankton contains this pigment
(Table 3 ). Therefore, its concentration seems to be an indicator of capacity
of photosynthesis. Its concentration distribution is represented by a bold line in
Fig. 2. The peaks were seen in the eary spring (5.97〝g/ 1 ) and summer
(4. 06〝 1 ), but not so drastic fluctuation was observed throughout the year.
The concentration distribution of chlorophyll a was also analyzed along with the
distributions of the abiotic components in Fig. 3. The amounts of chlorophyll
a did not parallel with the variation of temperature of the surface water, but
paralleled with the magnitudes of pH. Clear circulation periods in spring and
autumn and stagnation in summer were not observed (cf. Hogetsu 1974).
Seasonal succession in the ecosystem of Haibaraguchi pond
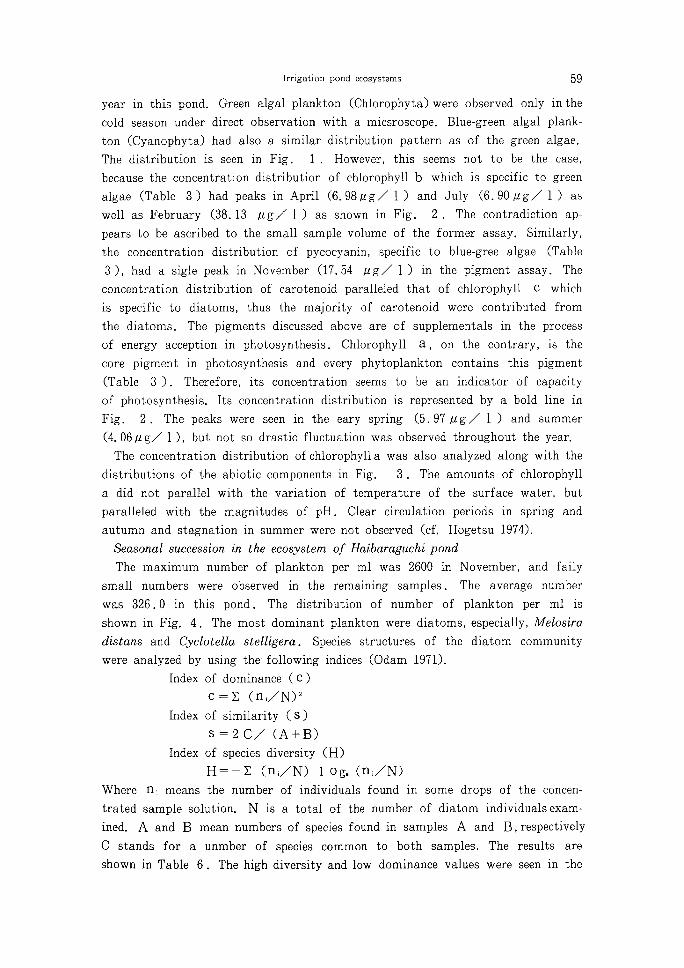
The maximum number of plankton per ml was 2600 in November, and faily
small numbers were observed in the remaining samples. The average number
was 326.0 in this pond. The distribution of number of plankton per ml is
shown in Fig. 4. The most dominant plankton were diatoms, especially, Melosira
distans and Cyclotella stelligera. Species structures of the diatom community
were analyzed by using the following indices (Odam 1971).
Index of dominance (C)
C-∑ (n./N)5
Index of similarity (S)
s-2C/(A+B)
Index of species diversity (H)
H--∑ (n,/N) 10gォ(rii/N)
Where n; means the number of individuals found in some drops of the concen-
trated sample solution. N is a total of the number of diatom individualsexam-
ined. A and B mean numbers of species found in samples A and B,respectively
C stands for a unmber of species common to both samples. The results are
shown in Table 6. The high diversity and low dominance values were seen in the
60
恥・planktorv′nl plankton in Haibaraguchトpond
234567891011121
lionth in 1987 or 1988
Fig. 4 Distributions of the numbers of individual plankton classified into four
major phyla in 1 milliliter of the surface pond water in Haibaraguchi
pond.
Haibaraguchi pond
・Chlorophリtl a
Chlorophリ11 b
-一一ChlorophリH c
PhlJCOCリa n i n
・- Carotenoid
Month in 1987 or 1988
Fig. 5 Distributions of the concentrations of photosynthetic pigments in Distribu-
tions of the concentrations of photosynthetic pigments in Haibaraguchi
pond.
ChlorophiI
6
5
4
3
2
I
8
E=ヨChl.a(ug/I>Temp. <-C)
Trans. (m)
・‥一・一pH
2345 7891の11121
Month in 1987 0「 1988
Fig. 6 Distributions of the concentration of chlorophyll a, the temperature of
surface water, transparency and pH in Haibaraguchi pond.
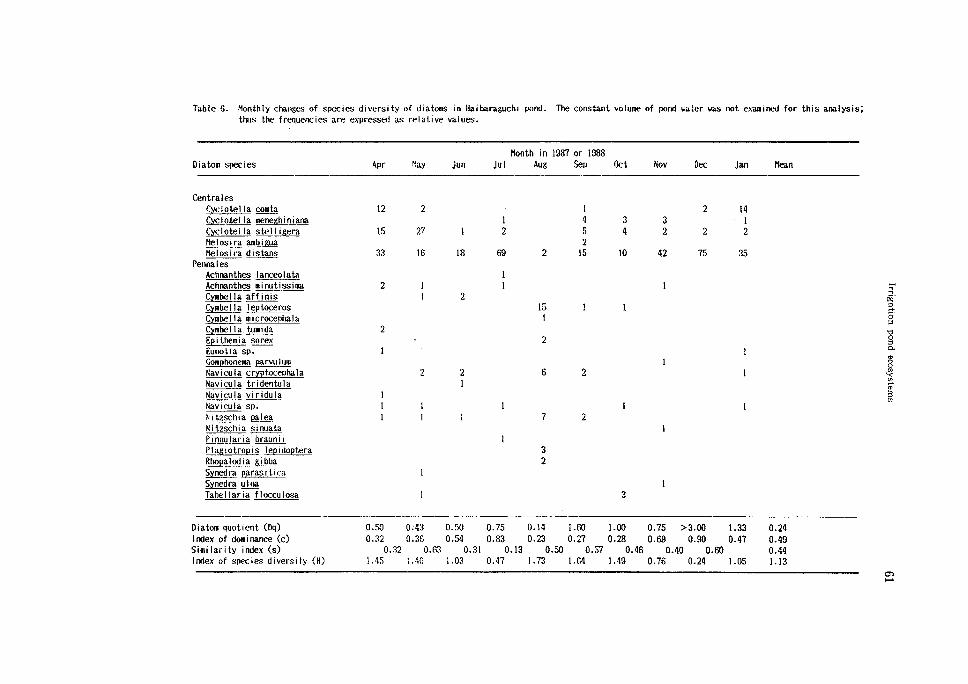
Table 6. Month一y changes of species diversity of diatoms in Haibaraguchi pond- Tl把constant Volume of pond Ualer was not examned for this analysis;
thus the frequencies are expressed as relative values.
Diatom species
Centra l es
Cyclotel la g塑垣
Cyclo.tel la aenexhinia伯
Cyclotel la岨L幽rtelosira ambigua
Melosira distant;
Penna l es
Achnanthes lanceo ata
Achn払nthesホinutissima
Cymbella affinis
Cynbel la
Cvmbel la microceptiala
包吐出_担tunidaEpithemia墾竺tunotia sp.
Gomphone爪a parvu lum
Navicula c「yptocephala
Navicula tndentula
Navio.ila vindula
Navicula sp.
Mtzschia幽Ni一.zschia sinuata
Pinnulana braunii
PH増iotropis l印i血p如Rhopalod ia &[b垣Synedra parasi tica
Synedra吐型Tabel laria fl0cculosa
Diato¶ quotient (Dq)
Index of doninance (c)
Simi一arity indexくS)
lr山ex of species diversity (H)
Month in 1987 or 1988
Apr May Jun Ju l Aug Sep Oct Nov Dec Jan Mean
12 14
1 4 3 3 1
15 27
2
33 1 6 18 69 15 10 42 75 35
1
L
C
-
つ
・
I
0.50 0.43 0.50 0.75 0.I 1.60 1.00 0.75 >3.00 1.33
0.32 0.36 ,54 0.83 0.23.27 0.28 0.69 0.90 0.47
0.32 0.R3 0.31 0. 13 0.50 0.57 0.46 0.10 0.60
1.45 ち.40 1.03 0.47 】.73 1.B4 1.49 0.76 0.24 I.05
WOilI3
o
j
ォ
r
A
.
I
C
3
0
0
-
・
Irrigationpondecosystems
62
summer season.
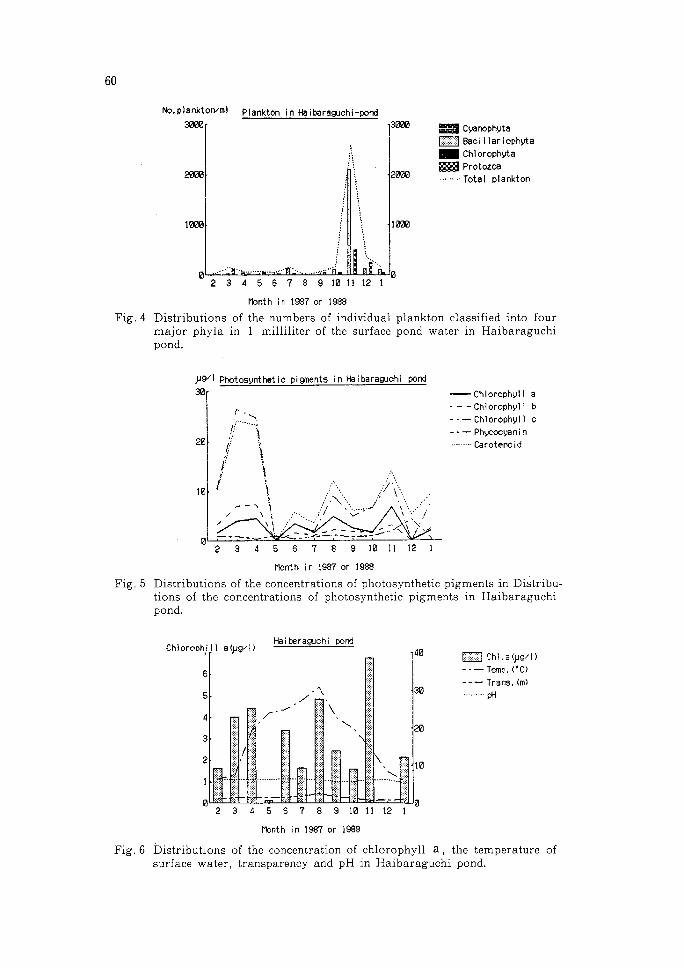
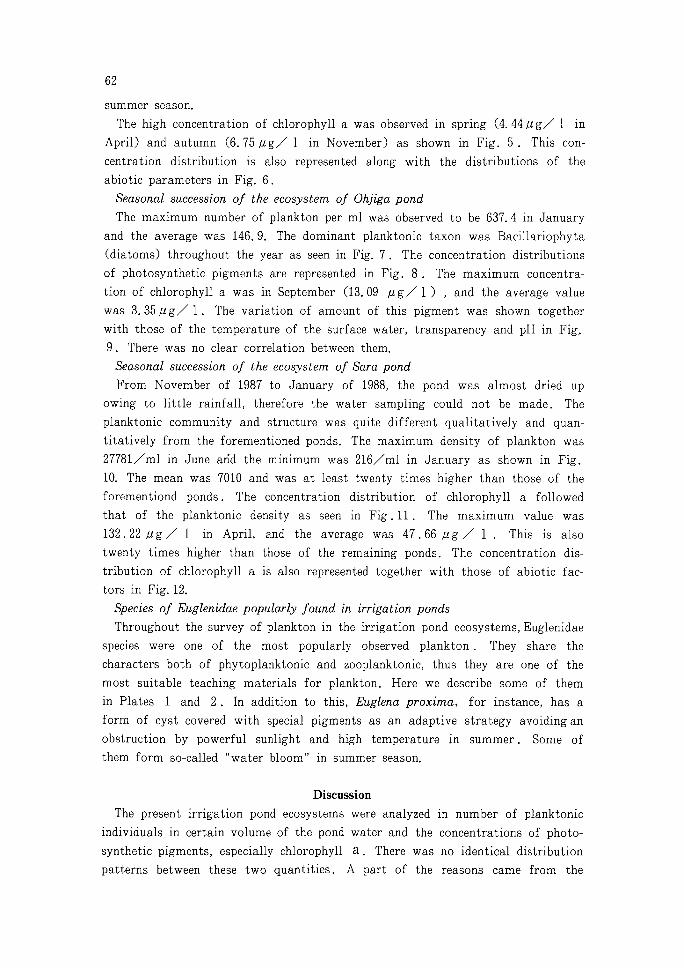
The high concentration of chlorophyll a was observed in spring (4.44〃g/ 1 in
April) and autumn (6.75〟 1 in November) as shown in Fig. 5. This con-
centration distribution is also represented along with the distributions of the
abiotic parameters in Fig. 6.
Seasonal succession of the ecosystem of Ohjiga pond
The maximum number of plankton per ml was observed to be 637.4 in January
and the average was 146. 9. The dominant planktonic taxon was Bacillariophyta
(diatoms) throughout the year as seen in Fig. 7. The concentration distributions
of photosynthetic pigments are represented in Fig. 8. The maximum concentra-
tion of chlorophyll a was in September (13.09 〟g/ 1 ) , and the average value
was 3.35lJg/ L The variation of amount of this pigment was shown together
with those of the temperature of the surface water, transparency and pH in Fig,
9. There was no clear correlation between them.
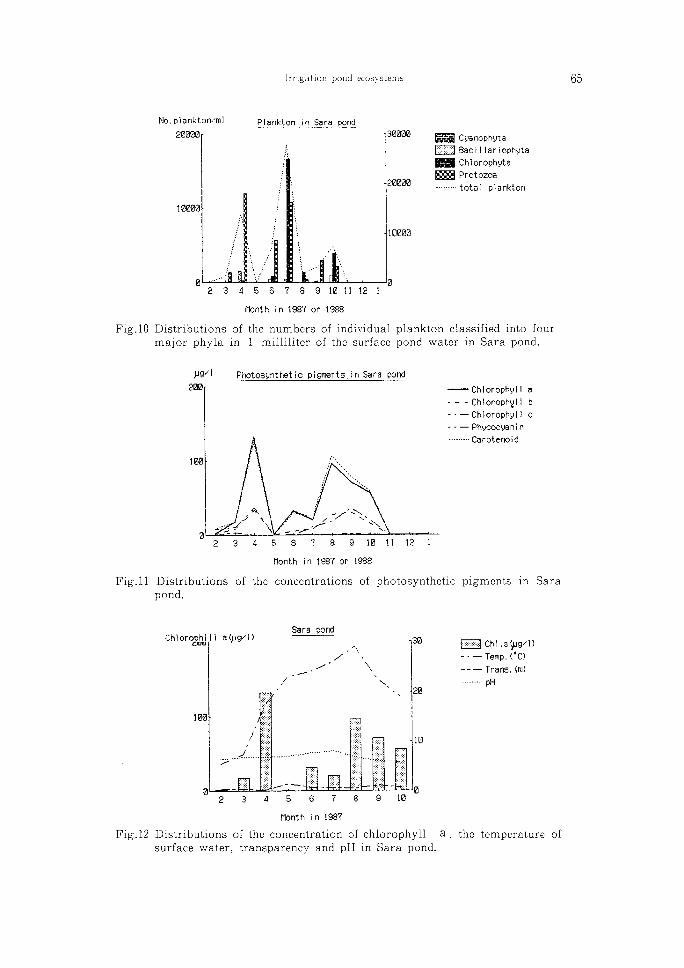
Seasonal succession of the ecosystem of Sara pond
From November of 1987 to January of 1988, the pond was almost dried up
owing to little rainfall, therefore the water sampling could not be made. The
planktonic community and structure was quite different qualitatively and quan-
titatively from the forementioned ponds. The maximum density of plankton was
27781/ml in June arid the minimum was 216/ml in January as shown in Fig.
10. The mean was 7010 and was at least twenty times higher than those of the
forementiond ponds. The concentration distribution of chlorophyll a followed
that of the planktonic density as seen in Fig.ll. The maximum value was
132.22〃g/ 1 in April, and the average was 47.66〟g/ 1. This is also
twenty times higher than those of the remaining ponds. The concentration dis-
tribution of chlorophyll a is also represented together with those of abiotic fac-
tors in Fig. 12.
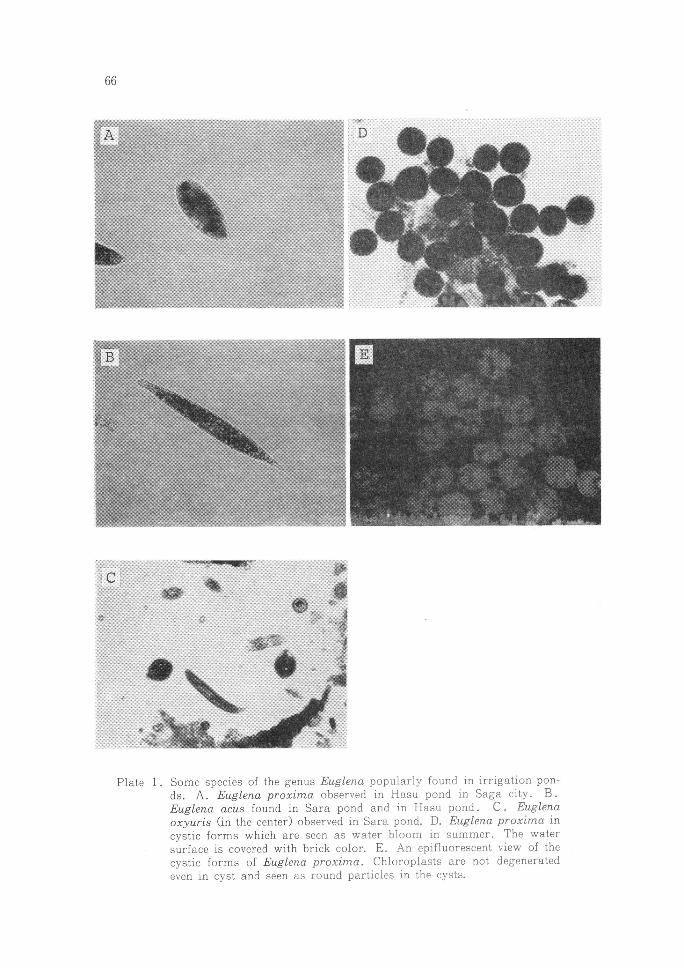
Species of Euglenidae popularly found in irrigation ponds
Throughout the survey of plankton in the irrigation pond ecosystems, Euglenidae
species were one of the most popularly observed plankton. They share the
characters both of phytoplanktonic and zooplanktonic, thus they are one of the
most suitable teaching materials for plankton. Here we describe some of them
in Plates 1 and 2. In addition to this, Euglena proxima, for instance, has a
form of cyst covered with special pigments as an adaptive strategy avoidingan
obstruction by powerful sunlight and high temperature in summer. Some of
them form s0-called "water bloom" in summer season.
Discussion
The present irrigation pond ecosystems were analyzed in number of planktonic
individuals in certain volume of the pond water and the concentrations of photo-
synthetic pigments, especially chlorophyll a. There was no identical distribution
patterns between these two quantities. A part of the reasons came from the
卜わ. planktoivml
Irrigation pond ecosystems
Plankton in Ohjiga pond
7四匹冠Cゝjanoph如匠≡ヨBaci llariophリta
表■ chlorophリta58の田Protozoa
蝣・・蝣total plankton
四
四
開
E
^
K
i
H
日
伝
2345 7891011121
Month in 1987 or 198専
Fig. 7 Distributions of the numbers of individual plankton classified into four
major phyla in 1 milliliter of the surface pond water in Ohjiga pond.
-ChlorophリH a
Chlorophllll b
一一一Chlorophl月l c
-i- PhリCOcl唱nin
・・-- Caroteno id
3456789柑11121
110nth in 1987 0「 1988
Fig. 8 Distributions of the concentrations of photosynthetic pigments in Ohiiga
pond.
Fig. 9 Distributions of the concentration of chlorophyll a, the temperature of
surface water, transparency and pH in Ohjiga pond.
63
64
differences in the sample volumes for examination, 0.1 〟 1 0f concentrated
pond water for the former and 2 ml for the latter. However, the mam reason
is due to the difference in body sizes of planktomc species. The amount
of chlorophyll a is more accurate esmitate for the biomass of planktomc com-
munity (Odam 1971). This quantity is also a good indicator of the capacity of
productivity in certain ecosystem.
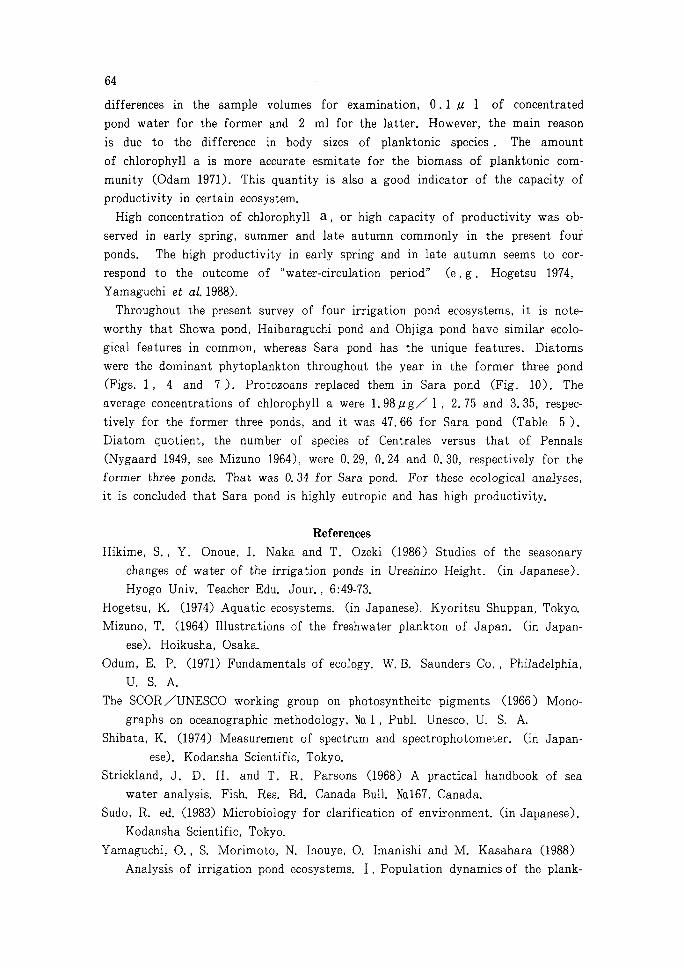
High concentration of chlorophyll a, or high capacity of productivity was ob-
served in early spring, summer and late autumn commonly in the present four
ponds. The high productivity in early spring and in late autumn seems to cor-
respond to the outcome of "water-circulation period" (e.g. Hogetsu 1974,
Yamaguchi et al. 1988).
Throughout the present survey of four irrigation pond ecosystems, it is note-
worthy that Showa pond, Haibaraguchi pond and Ohjiga pond have similar ecolo-
gical features in common, whereas Sara pond has the unique features. Diatoms
were the dominant phytoplankton throughout the year in the former three pond
(Figs. 1, 4 and 7). Protozoans replaced them in Sara pond (Fig. 10). The
average concentrations of chlorophyll a were 1.98〟g/ 1 , 2. 75 and 3.35, respec-
tively for the former three ponds, and it was 47.66 for Sara pond (Table 5 ).
Diatom quotient, the number of species of Centrales versus that of Pennals
(Nygaard 1949, see Mizuno 1964), were 0.29, 0.24 and 0.30, respectively for the
former three ponds. That was 0. 34 for Sara pond. For these ecological analyses,
it is concluded that Sara pond is highly eutropic and has high productivity.
References
Hikime, S., Y. Onoue, I. Naka and T. Ozeki (1986) Studies of the seasonary
changes of water of the irrigation ponds in Ureshino Height, (in Japanese).
Hyogo Univ. Teacher Edu. Jour. , 6:49-73.
Hogetsu, K. (1974) Aquatic ecosystems, (in Japanese). Kyoritsu Shuppan, Tokyo.
Mizuno, T. (1964) Illustrations of the freshwater plankton of Japan, (in Japan-
ese). Hoikusha, Osaka.
Odum, E. P. (1971) Fundamentals of ecology. W.B. Saunders CO‖ Philadelphia,
U.S.A.
The SCOR/UNESCO working group on photosyntheitc pigments (1966) Mono-
graphs on oceanographic methodology, No.1 , Publ. Unesco, U. S. A.
Shibata, K. (1974) Measurement of spectrum and spectrophotometer. (in Japan-
ese). Kodansha Scientific, Tokyo.
Strickland, J. D. H. and T. R. Parsons (1968) A practical handbook of sea
water analysis. Fish. Res. Bd. Canada Bull. Nal67, Canada.
Sudo, R. ed. (1983) Microbiology for clarification of environment, (in Japanese).
Kodansha Scientific, Tokyo.
Yamaguchi, 0. , S. Morimoto, N. Inouye, O. Imanishi and M. Kasahara (1988)
Analysis of irrigation pond ecosystems. I. Population dynamicsof the plank-
Irrigation pond ecosystems
3匂88の団CyanophytaE∃ Baoillariophyta軍遜chlorophリta四Protozoa
-・ tota一 p一ankton
65
No. planktoivml Plankton in Sara pond
234567 910 2!
Month in 1987 or 988
Fig.10 Distributions of the numbers of indi、/idual plankton classified into four
major phyla in 1 milliliter of the surface pond water in Sara pond.
・Chlorophリ11 a
- - 1Chlorophyl1 b
-・-ChlorophリlI c
PhゝICOCリ∂ni n
-蝣Carotenoid
Month in 1987 or 19S3
Fig.ll Distributions of the concentrations of photosynthetic pigments in Sara
pond.
Chlorophisou 39匹ヨChi.叫g/i)一一Temp.( C)
--- Trans. 、m)
一一・ pH
28
2 3 4 5 6 7 8 9 1の
Month in 1987
Fig.12 Distributions of the concentration of chlorophyll a, the temperature of
surface water, transparency and pH in Sara pond.
66
Plate 1. Some species of the genus Euglena popularly found in irrigation pon-
ds. A. Euglena proxima observed in Hasu pond in Saga city. B.
Euglena acus found in Sara pond and in Hasu pond. C. Euglena
oxy?ris (in the center) observed in Sara pond. D. Euglena proximo, incystic forms which are seen as water bioom in summer. The water
surface is covered with brick color. E. An epifluorescent view of the
cystic forms of Euglena proximo. Chloroplasts are not degenerated
even in cyst and seen as round particles in the cysts.
Irrigation pond ecosystems 67
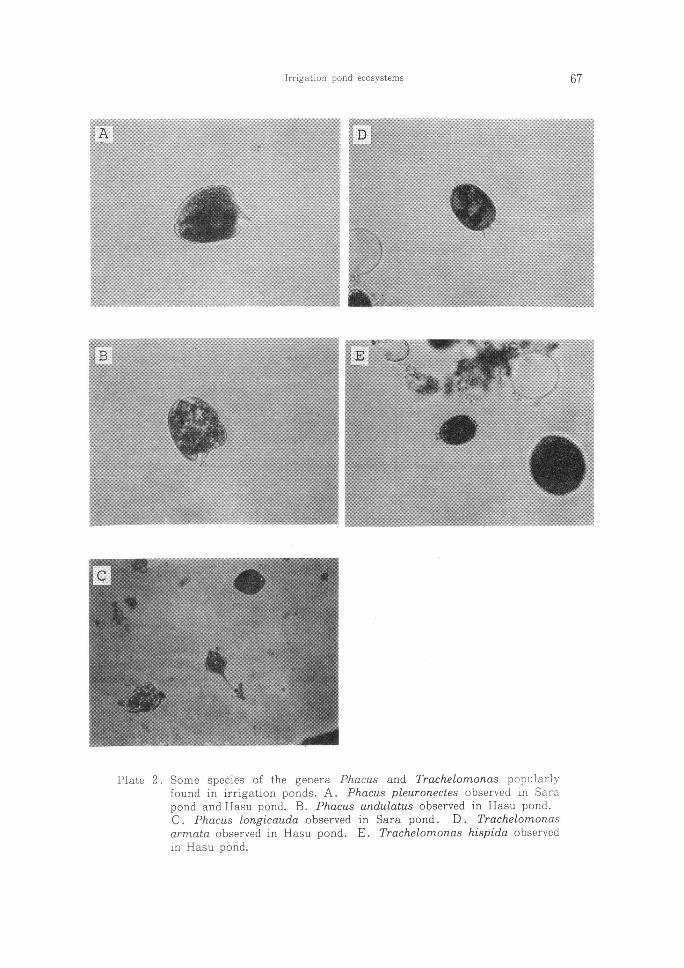
Plate 2. Some species of the genera Phacus and Trachelomonas popularly
found in irrigation ponds. A. Phacus pleuronectes observed in Sara
pond andHasu pond. B. Phacus undulatus observed in Hasu pond.
C. Phacus longicauda observed in Sara pond. D. Trachelomonas
armata observed in Hasu pond. E. Trachelomonas hispida observed
in Hasu pond.

68
ton and a seasonal succession of the main producers and consumers. Hvogo
Univ. Teacher Edu. Jour. , 8:89-106.