analysis of poultry market chain: the - cgspace home
TRANSCRIPT

ANALYSIS OF POULTRY MARKET CHAIN: THE CASE OF DALE
AND ALABA ‘SPECIAL’ WOREDAS OF SNNPRS, ETHIOPIA
M.Sc. Thesis
Awol Zeberga
May, 2010
Haramaya University

ANALYSIS OF POULTRY MARKET CHAIN: THE CASE OF DALE
AND ALABA SPECIAL WOREDAS OF SNNPRS, ETHIOPIA
A Thesis Submitted to the School of Agricultural Economics and
Agri-business Management
School of Graduate Studies
HARRAMAYA UNIVERSITY
In Partial Fulfillment of the Requirements for the Degree of
MASTER OF SCIENCE IN AGRICULTURE
(AGRICULTURAL ECONOMICS)
BY
Awol Zeberga Kerbaga
June, 2010
Haramaya University

i
APROVAL SHEET
SCHOOL OF GRADUATE STUDIES
HARAMAYA UNIVERSITY
As Thesis Research advisor, here by certify that I have read and evaluated this thesis
prepared, Under my guidance, by Awol Zeberga entitled "Analysis of poultry marketing
chain, The Case of Dale and Alaba ‘special’ Woreda in SNNPRS of Ethiopia” I recommend
that it be submitted as fulfilling the thesis requirement
________________________ ___________________ ______________
Major Advisor Signature Date
As member of the Board of Examiners of the M.Sc Thesis Open Defense Examination, We
certify that we have read, evaluated the Thesis prepared by Awol Zeberga and examined the
candidate. We recommended that the Thesis be accepted as fulfilling the Thesis requirement
for The Degree of Master of Science in Agriculture (Agricultural Economics).
_________________________ _______________ ___________
Chairperson Signature Date
_________________________ _______________ ____________
Internal Examiner Signature Date
_________________________ ________________ ___________
External Examiner Signature Date

ii
DEDICATION
This Thesis is dedicated to my father Zeberga Kerbaga.

iii
STATEMENT OF AUTHOR
First, I declare that this thesis manuscript is prepared by my effort with the guidance and close
supervision of my advisor. The thesis has been submitted in partial fulfillment of the
requirements for M.Sc. degree at Haramaya University. It is deposited at the University
library to be made available to borrowers under the rules of the library. I declare that this
thesis is not submitted to any other institution anywhere for the award of an academic degree,
diploma or certificate.
Brief quotations from this thesis are allowable without special permission provided that
accurate acknowledgement of the source is made. Requests for permission for extended
quotation from or reproduction of this manuscript in whole or part may be granted by the head
of the Department of Agricultural Economics or the Dean of the School of Graduate Studies
when in his/her judgment the proposed use of the material is in the interest of scholarship. In
all other instances, however, permission must be obtained from the author.
Name: Awol Zeberga Kerbaga Signature: _________________
Place: Haramaya University, Haramaya
Date of submission: June, 2010

iv
ACRONYMS AND ABBREVIATIONS
NGO Nongovernmental organization
IMR Inverse Mills Ratio
TLU Tropical Livestock Unit
OLS Ordinary Least Square
NMM Net Marketing Margin
GMMp Gross Marketing Margin of Producers
TGMM Total Gross Marketing Margin
CM Concentration Measure
CR Concentration Ratio
SCP Structure Conduct and Performance
RMA Rapid Market Appraisal
CSA Central Statistics Authority
DZARC Debrezeyt Agricultural Research Center
ILRI International Livestock Research Institute
SNNPRs Southern Nations Nationalities and Peoples Regional State
GDP Gross Domestic Product
SSA Sub Saharan Africa
FAO Food and Agriculture Organization
IPMS Improving Productivity and Market success

v
BOARD Bureau of Agriculture and Rural Development
NMMra Net Marketing Margin of Rural Assemblers
NMMua Net Marketing Margin of Urban Assemblers
NMMws Net Marketing Margin of whole Assemblers
LR Log likelihood Ratio
HHI Hirschman Herfindahl Index
NCD New Castle Disease
ML Maximum Likelihood
SARI Southern Agricultural Research Institute

vi
BIBLOGRAPHICAL SCETCH
The author was born on May 24, 1981 in a small village called Chiro in Geto Woreda of
Guragie zone in SNNPRS. He attended elementary school in Dejazimatch Hailu Shawol
primary School in Addis Ababa and continued his junior school in Mugo Junior and
secondary school in Guragie Zone. He has joined Dejazimatch Wondirad primary and
Secondary School in Addis Ababa and attended his Secondary School until he joined
Hawassa University in 2003 and Graduated with B.Sc Degree in the year June, 2006 in
Agricultural Resource Economics and Management (AREM). He has served in Southern
Agricultural Research Institute (SARI), at Areca Agricultural Research Center since October,
2007 as a junior researcher in socio economics Research Division for one year and then
Joined Haramaya University School of Graduate Study in September, 2008 academic year in
pursuing his MSc degree in Agricultural Economics./

vii
ACKNOWLEDGMENTS
My deepest gratitude goes to my supervisor Dr. Berhanu G/ Medhin for his vitally important
comments and his deep insight into the whole thesis that contributes a lot for the improvement
of the manuscript. It is also worthwhile to acknowledge ILRI-IPMS for funding the cost of
this study and I am also indebted to extend my appreciation to Ketema Yilma, Research
Development Officer of ILRI-IPMS of Dale pilot learning site and all other staff members of
IPMS project for their collaboration in the course of my study.
I am also indebted to thank Dr. Daniel Dawro, the Director General of Southern Agricultural
Research Institute (SARI) and Endrias Geta ‘socio economic Director of SARI’ and all staffs
members of Areca Agricultural Research Center for letting me join Haramaya University
School of Graduate Study to pursue my post graduate study.
Furthermore, it is hardly possible to foregone the contribution of my Brother Fekade Zeberga
for his unreserved moral and financial support in the course of my entire academic endeavor. I
am also grateful to enlarge my appreciation to my shining friends whom are of course weary
to list all, but I found it difficult to abandon braving the names of: Mohammed Endris, Sultan
Abdulrehman, Dereje Bekele, Amare Hailu, Assefa Wolde and Beniam Eshetu whom I want
tell all of them that I have backup picture of them in my memory at the most accessible part.
Lastly but mostly I want to be appreciative of all my family for your ever living love that
injects real and fresh life into my blood and keeps me alive when I felt horrific.
viii
TABLE OF CONTENTS
STATEMENT OF AUTHOR III
ACRONYMS AND ABBREVIATIONS IV
BIBLOGRAPHICAL SCETCH VI
ACKNOWLEDGMENTS VII
LIST OF TABLES XII
LIST OF APPENDICES XIV
ABSTRACT XVI
1. INTRODUCTION 1
1.1. Background 1
1.2. Statement of the Problem 4
1.3. Objective of the Study 6
1.3. Significance of the Study 7
1.5. Scope and Limitation of the Study 7
2. LITERATURE REVIEW 8
2.1. Basic Concepts 8
2.1.1. Market and marketing 8
2.1.2. Marketing systems 9
2.1.3. Marketing efficiency 10
2.1.4. Marketing channel 11
2.1.5. Market chain and business support services 12
2.2. Approaches Used to the Study of Agricultural Marketing 13
2.2.1. Functional approach 13
2.2.2. Institutional approach 13
2.2.3. Commodity approach 13
2.3. Methods of Evaluating Marketing System 14
2.3.1. The Structure, Conduct and Performance (SCP) Model 15
2.3.1.1. Market Structure 15
2.3.1.1.1. Market Concentration Ratio (measure) 16

ix
TABLE OF CONTENT (CONTINUED)
2.3.1.1.2. Hirschman Herfindahl Index (HHI) 17
2.3.1.1.3. Gini-Coefficient 18
2.3.1.2. Market Conduct 19
2.3.1.3. Marketing performance 20
2.3.1.3.1. Marketing Costs and Margins 21
2.4. Supply Response and Market Participation in Farm Households 22
2.5. Sample selection bias 23
3. METHODOLOGY 25
3.1. Description of the Study Area 25
3.2. Sources of Data 29
3.3. Data Requirements 29
3.4. Sample Size and Method of Sampling 30
3.5. Method of Data Collection 30
3.6. Methods of Data Analysis 31
3.6.1. Descriptive statistics 31
3.6.1.1. Structure conduct and performance (S-C-P) model 31
3.6.1.1.1. Market structure 32
3.6.1.1.2. Market conduct 33
3.6.1.1.3. Market performance 33
3.6.2. Econometric analysis 35
3.6.3. Hypothesis and variables definition 40
4. RESULTS AND DISCUSON 45
4.1. Production and Consumption of Village Poultry in Ethiopia. Error! Bookmark not
defined.
4.2. Results of Descriptive Analysis 45
4.2.1. Socio-demographic characteristic of farmers 45
4.2.2. Sources and income level of farmers 47

x
TABLE OF CONTENT (CONTINUED)
4.2.3. Flock size and breed composition of bird in the sample household 48
4.3. General Characteristics of Village Poultry Production 50
4.3.1. Ownership and decision making role 50
4.3.2.Feeding structure 50
4.3.3. Diseases management and Housing 50
4.4. Productivity and Profitability of Village Poultry Keeping 51
4.4.1. Productivity of village poultry keeping 51
4.4.2. Cost structure and profitability of village poultry keeping 53
4.5. Farmers’ Access to Business Support Services 55
4.5.1. Farmers access to credit 55
4.5.2. Farmers access to extension service 58
4.5.3. Farmers access to input supply 61
4.5.4 Farmers access to market and market information 67
4.6. Structure, Conduct and Performance of Poultry Marketing System 71
4.6.1. Structure of poultry marketing system 71
4.6.1.1. Demographic characteristics of bird and egg traders 71
4.6.1.2. Traders’ distribution by resource ownership 73
4.6.1.3. Roles and linkage of actors in village poultry marketing chain 80
4.6.1.4. Live bird and Egg marketing channels 85
4.6.1.5. Traders concentration ratios 88
4.6.1.6 .Condition of entry and exit to live bird and egg trading 89
4.6.2. Conduct of traders in village poultry marketing system 91
4.6.3. Performance of village poultry marketing system 94
4.6.3.1. Marketing costs of traders 94
4.6.3.2. Marketing margins in bird and egg marketing chain 96
4.6.3.3. Marketing profit of live bird and egg trading 97
4.7. Determinants of Market Participation Decision and Intensity of Supply 98
4.8. Constraints and Opportunities of Village Poultry Keeping and Marketing 105
xi
TABLE OF CONTENT (CONTINUED)
4.8.1. Constraints and opportunities of village poultry keeping 105
4.8.2. Constraints and opportunities of live bird and egg trading 107
5. CONCLUSIONS AND RECOMENDATIONS 109
5.1. Conclusions 109
5.2. Recommendations and policy implications 113
REFFERENCES 116
APPENDICES 121

xii
LIST OF TABLES
Tables Pages
Demographic characteristics of sample households (farmers) 45
Source and income level of farmers 47
Flock characteristic and breed composition of bird 58
Productivity of village poultry keeping in the study area 51
Cost structure and profitability of village poultry keeping 53
Farmers’ access and source of credit for poultry production and marketing 55
Farmers evaluation of credit service access for poultry keeping and marketing 56
problems in credit service for the production and marketing of poultry 57
Extension service coverage between the two woredas 58
Evaluation of Extension service by farmers 59
Major problems in extension service for the production and marketing of birds 60
Farmers access of input supply for bird keeping 62
Farmers’ evaluation of input supply for poultry production 64
Problems in input supply for chicken keeping 65
Chicken and egg marketing behavior of sample farmers 67
Source and farmers’ evaluation of market information 69
Traders distribution by demographic characteristics 71
Resource ownership of bird and egg traders 73
Financial position of bird and egg traders in sample markets 75
Social capital of bird traders in sample market 77
Social capital of Egg traders in sample market 78
Farmers’ bird and egg market outlet 80
Bird and egg traders’ concentration ratio in sample markets 87
Entry barriers mentioned by bird egg traders 89
Buying, selling and pricing strategy of traders in sample markets 92
Marketing cost of bird and egg marketing system 94
Marketing margins maintained actors in bird and egg marketing chain 95

xiii
LIST OF TABLES (CONTINUED)
Tables Pages
Description of the hypothesized variables 97
Results of the Heckmans’ first step estimation in the selection model (probit) 99
OLS estimates of the supply function corrected for selectivity bias 102
Constraints and opportunity of bird keeping and marketing 105
Constraints and opportunities in poultry marketing system 106

xiv
LIST OF APPENDICES
List of Tables in the Appendix Pages
Distribution of sample respondents by age category 121
Degree of multi colinearity among the continuous independent variables 121
Independent ownership and decision making role in bird keeping and marketing 122
Profit earned by marketing actors in the different bird marketing channels 123
Degree of association among the categorical independent variables 124
Profit earned by each trader category per unit egg sold 125
ML estimates of Tobit model 126

xv
LIST OF FIGURES
Figures
Dale Woreda location map 26
Alaba ‘Special’ Woreda Location Map 28
Poultry marketing chain map of the study area 86

xvi
ANALYSIS OF POULTRY MARKET CHAIN, THE CASE OF DALE
AND ALABA SPECIAL WOREDA OF SNNPRS, ETHIOPIA
ABSTRACT
The purpose of this study was to analyze the poultry marketing chain in Dale and Alaba
‘special’ weredas of SNNPRS, Ethiopia. The specific objectives include analysis of the
structure, conduct and performance of poultry marketing system, production and marketing
support services of extension, input supply, credit and marketing. Cost structure and
profitability of village poultry keeping were also analyzed. Furthermore, factors that affect
farmers’ decision to participate in the supply of live birds and egg to the market and volume
of birds and egg supplied to the market were identified in the study. Constraints and
opportunities of production and marketing of poultry in the study area were also assessed. To
address the aforementioned objectives descriptive statistics and econometric models were
employed. Moreover, various marketing agents and their roles, linkages and functions in the
poultry marketing system were also assessed. Alternative marketing channels and their
systematic linkages and relative importance in the flow of birds and egg from the point of
production to the end users were identified and mapped. Heckmans’ two stage and Tobit
econometric models were employed to identify factors that determine the farmers’
participation decision and the amount of birds and egg supplied to the market in the year
2007/8 E.C. Village collectors, urban assemblers and whole sellers played crucial roles in the
sample markets in the transaction of birds and egg from producers to consumers. Strong
oligopolistic behavior is observed in Yirgalem and Alaba egg markets wit 98 and 93 percent
concentration ratio respectively due to the short and inconsistent supply of egg that inhibits
new entrants to engage in the business. Live bird trading in Alaba market also shows modest
oligopolistic behavior (59.7% concentration ratio) due to the involvement of whole sellers
who transport their birds to Addis Ababa market that comparatively demands high capital
and information than the Awassa and Yirgalem poultry market places. Business support
services such as credit, extension, input provision and information access in the production
and marketing of village poultry are poorly developed or almost nonexistent in the study area.

xvii
According to the study the production and trading of live birds and egg are profitable in
smallholders’ production system due to its’ low and abundant input requirements such as
capital and labor than alternative business activities. From the probit model factors that
determine the farmers’ participation decision are identified. These includes sex of the house
holdhead, family size, total number of birds kept and feed supplementation have highly
significantly influences farmers’ decision to supply chickens and eggs to the market.
According to the result of the linear supply function and Tobit models, the total number of
birds that the family kept, feed supplementation, market access, purpose of poultry keeping,
producers participation decision in bird and egg supply and Credit use are found to have
highly significant impact on the value of volume of birds and egg supplied to the market. The
village poultry subsector provides ample opportunities for smallholder farmers since it
utilizes resources that are abundant in rural areas and the anticipated rising price and
demand in domestic and international markets. The subsector was also constrained by
various challenges. According to the market survey, traders face lack of capital, short and
inconsistent supply and, poor information and infrastructure development such as storage,
packaging and transportation facilities. The production of village poultry was also
constrained by diseases (NCD), predation, lack of input and volatile price and demand.
Despite the numerous challenges the subsector still remains profitable business for the rural
poor.

1
1. INTRODUCTION
1.1. Background
The price of agricultural products particularly livestock products is rising both in domestic as
well as international markets due to rising income in newly emerging developing nations and
high population growth. Livestock products have very high income elasticity’s, and demand
increases rapidly with rising income as countries shift from lower to middle income
economies. This has led to a ‘livestock revolution’ in developing counties (Delgado et al.,
1999). Increases in poultry consumption have been particularly dramatic and widespread,
while changes in beef, pork, and dairy demand vary with cultural differences between
countries. Future meat demand is expected to grow at roughly equivalent rates in different
developing countries, with very large absolute increases in demand in China leading to large
imports (Andrew et al., 2008).
Livestock products have long been a pathway for income generation by the poor.
Rapidly growing and changing livestock markets in the developing world provide real
opportunities but also significant threats to participation of the poor. This is due to the
increasing integration of national and world markets, the changing nature of food demand in
cities, and a changing regulatory environment on the one hand, and constraints to
smallholders' inability to produce high quality products due to lack of technology,
inputs, resources and information on the other hand. High value agricultural products, of
which livestock products form an important part, cover a range of goods whose attributes are
driven primarily by demand and by the manner and cost of production. Due to demand,
markets for traditionally processed, informal and raw products continue to predominate
in most developing countries, even while demand for higher quality increases at the
higher market end (Gebremedhin et al., 2007).
Delgado et al. (1999) projected that per capita consumption of livestock products will increase
by about 50 percent from 1993 to 2020, with most of the increases attributed to developing
countries, as a result of population growth, urbanization, and rising incomes. In sub-Saharan

2
Africa (SSA) total consumption of meat and milk is expected to double between 1997 and
2020 to reach 11.3 and 35.4 million tons (Holloway et al., 2002). This expected increase in
demand for animal products has profound implications for food security and poverty
alleviation among rural people in SSA. In particular, the expected demand for livestock
products presents expanding market opportunities for poor smallholder livestock producers.
Therefore, improving access to markets of poor smallholder livestock producers can help
them benefit from the rapidly growing demand for livestock products. The International
Livestock Research Institute (ILRI) and its partners have identified that encouraging market
participation of smallholder livestock producers is a major pathway for getting rural people
out of poverty and improving their food security, as livestock contribute to the livelihoods of
more than two-thirds of the world’s rural poor (Holloway et.al., 2002).
Market access plays an essential role in assuring better income and welfare for smallholder
livestock producers. In addition, by creating demand for production inputs and investment
goods, markets promote economic growth. Markets also facilitate the accumulation of assets,
provide the opportunity for improved nutrition and balanced diets, and, therefore, help
alleviate poverty. In Ethiopia the livestock sector contributes about 20% of the total GDP in
the country.
Despite such significant contribution to the national economy of the country, the sector has
received less than 3% of the recurrent agricultural expenditures in Ethiopia. Livestock
markets in Ethiopia function at three levels consisting of primary, secondary, and terminal
markets. Solomon et al. (2000) also include a nominal forth tier at the farm gate level, which
could hardly be considered to function as a market.
In Ethiopia, rural poultry represents a significant part of the rural economy in particular and of
the national economy as a whole. Besides the provision of employment and easily disposable
cash income for small-holder farmers, particularly in the off-season from cropping, rural
poultry integrates very well into other farming activities as it requires relatively little labor

3
and capital. However, rural poultry is considered invisible as it is rarely counted in wealth
ranking as cattle, sheep and goats are.
There are about 56.5 million poultry of all species in Ethiopia. Local chicken constitutes
about 99% of the total poultry population in the small-scale rural farms (Alemu and Tadelle
1997). Poultry are important and relatively cheap providers of eggs and meet as well as being
valued in religious and cultural life. The total poultry egg and meat production in Ethiopia is
estimated to be about 78,000 and 72,300 metric tons, respectively. Per capita consumption of
these products is also very low relative to the world and African standards. Traditionally
prepared doro wot is preferred by many people in Ethiopia. Despite this, per capita chicken
meat consumption in the country is reported to be about 2.85 kg per annum (Alemu and
Tadele, 1997). Chicken meat consumption is more common in urban areas than in rural areas.
The poor rural farmers produce chickens and sell them to earn cash required for various
household expenses. There is a growing demand for chicken meat and egg in urban areas due
to substantial increase in price of beef and mutton. Therefore, chicken production is likely to
play increasing role in supplying animal protein for human consumption in the country.
Chicken meat is relatively cheap and affordable source of animal protein (Alemu and Tadelle,
1997). However, at home and restaurants chicken dishes are more expensive than other dishes
such as beef and mutton probably due to the way chicken dishes are prepared. Marketing is an
important aspect of any livestock production system. It provides the mechanism whereby
producers exchange their livestock and livestock products for cash. The cash is used for
acquiring goods and services which they do not produce themselves, in order to satisfy a
variety of needs ranging from food items, clothing, medication, and schooling to the purchase
of breeding stock and other production inputs and supplies.
Analysis of the marketing system for village poultry will help to determine the economic
value and importance of local chickens. Branckaert and Guèye (1999) reported that an
established market structure for free-range chickens is a prerequisite for developing family
poultry. Even in breeding program development, indices require appropriate economic values

4
that could be derived from such market studies. Market access factors, which refer to the
existence of local markets, infrastructure, and adequate transport facilities, are obvious
prerequisites for poultry subsector development (Teklewold et al., 2005).
The marketing system for local chickens in most developing countries is described as
informal and poorly developed (Branckaert and Guèye 1999; Mlozi et al., 2003). On the other
hand, free-ranging local chickens are claimed to be on demand and fetch high market prices in
urban markets of Malawi, Nicaragua and many developing countries in Africa and Asia due to
preferred attributes such as being tastier than improved broiler strains (Aini, 1990, Kyvsgaard
et al., 1999; Branckaert and Guèye, 1999). In Ethiopia information regarding the poultry
marketing system and factors that determine farmer’s poultry supply to market are lucking.
This study attempts to analyze poultry marketing system and identify factors that affect
farmers’ participation decision in poultry marketing and the volume of poultry supplied to the
markets in the study are.
1.2. Statement of the Problem Marketing systems play a decisive role in vibrant economies as mechanisms for both
exchange (necessary for specialization and hence leads to higher economic growth) functions
and the proper coordination of the exchange (through price signals) which reflect and shape
producer and consumer incentives in supply and demand interaction. If small scale domestic
producers are to take advantage of the projected domestic demand growth, then marketing
systems in the supply chains linking producers to consumers must be able to support low cost
production and timely delivery of the products (Andrew et al., 2008).
Agricultural products particularly livestock products can only be supplied to satisfy the
demand through effective and efficient marketing system which links farm and non-farm
communities. For a marketing system to successfully coordinate the interaction of the
suppliers and consumers of goods and services must be accompanied by efficient marketing
system. Both producers and consumers satisfy their conflicting goals regarding the pricing
5
behavior of a marketing system through such efficient and competitive marketing systems. In
parts of the world, rural people often say that one reason they cannot improve their living
standards is that they face difficulties in accessing markets.
Market systems do not, however, provide the only mechanisms for ‘coordinated exchange’. In
advanced market economies hierarchical relations in organizations (government agencies,
firms, and civil society organizations) play a major role both as channels for exchange and in
providing institutional services necessary for markets to work (Fafchamps, 2004; Williamson,
1991). However market transactions are normally voluntary (in that both sides have to
perceive gains from trade), involve precise terms of exchange (with regard to quantity,
quality, space and time), and require wider institutions supporting interaction between trading
parties. Now a day the consumption pattern is changing both domestically and internationally
toward high quality attributes. Livestock products particularly poultry products have sky
rocketing demand throughout the world. It is widely recognized that an inefficient marketing
system entailing substantial costs to consumers and less incentives to producers could not
provide the mechanism to meet the accelerating demand for high quality food items.
In Ethiopia, information concerning the chicken marketing system is lacking. Despite the high
demand for poultry products, producers in Ethiopian are not market oriented and the
production system is characterized by its low productivity and scavenging type. This in turn
leads to very small supply compared to the high potential the country has in the subsector.
Research efforts to increase chicken production and productivity has been underway in
Ethiopia. But review of past research works indicate that the research largely concentrated on
the biological aspects of poultry production such as supplementary feeding and breeding
(Alemu and Tadele, 1997). Increased production, however, needs to be accompanied by
efficient marketing system that adds place, form, time, and possession utility to the product
along the supply chain. The marketing system for local poultry in Ethiopia, particularly in the
study areas is poorly developed. This study was intended to analyzing poultry marketing
system, business support services and their role, constraints and opportunities of the sub

6
sector and factors that affect chicken market participation and volume of poultry supplied to
the market to generate information about the entire supply chain of poultry in the study area.
1.3. Objective of the study The general objective of this study is to analyze the poultry marketing chain in Alaba ‘special’
and Dale Woreda’s of SNNPR state.
The specific objectives of the study are:
1. To analyze the production and marketing support services of extension, input supply,
credit and marketing.
2. To investigate the structure of poultry production cost and determines profitability of
poultry keeping.
3. To study the structure conduct and performance of poultry marketing system.
4. To identify factors that determine poultry supplied to the market in the study area.
5. To identify constraints and opportunities of poultry production and marketing.
Research questions
The study tried to answer the following major questions:
1. What are the components of production and marketing costs of poultry marketing chain?
2. How poultry marketing and its business support services organized and functioning?
3. What are the major problems and opportunity of poultry production and marketing?
4. What determinants do farmers encounter to supply birds and egg to the market?
5. How poultry market chain organized and what are the alternative poultry market
channels?
6. Do farmers and other marketing actors get fair market share from consumer price?

7
1.4. Significance of the Study The result of the study is helpful for farmers, traders and service providers involved in the
production and marketing of poultry in the study area. This study also helps development
planners and policy makers in designing appropriate policies for the production and marketing
of poultry subsector to enable farmers and other participants benefit according to their
marginal contribution so that they can stay in the business. Moreover, the information can be
provided for potential investors and small and medium enterprises interested in the business
so that medium and large scale poultry farms start to emerge.
1.5. Scope and Limitations of the Study
This investigation is conducted in two woredas and applied information collected from
limited sample households and marketing actors involved in the subsector organization in the
study areas. Hence, the investigation is limited spatially as well as temporally to make the
study more representatives in terms of wider range of commodity, area, and time horizon. The
purpose of the study also limits the investigation toward a single commodity and specific
geographic location.

8
2. LITERATURE REVIEW
In this section the basic concepts of market, marketing, marketing system and, market
efficiency, market channels, approaches to study marketing system, factors affecting market
supply, methods to evaluate the efficiency of agricultural markets, and sample selection biases
would be discussed.
2.1. Basic Concepts
2.1.1. Market and marketing
A market is traditionally defined as a specific geographical area where buyers and sellers
meet for exchange of goods and services. The most common way we obtain goods and
services we do not produce ourselves is to buy them from others who specialize in
producing them. To make such purchases, buyers seek out sellers in markets. Markets are
ways in which buyers and sellers can conduct transactions resulting in mutual net gains that
otherwise would not be possible (Hyman, 1989).
Modern definition considers market as an arena for organizing and facilitating business
activities and for answering the basic economic questions (Kohls and Uhl, 1985)
described market as how much to produce? What to produce? How to distribute
production? A location, a product, a time, a group of consumers, or a level of the
marketing system may define it. The choice as to which market definition to use depends on
the problem to be analyzed. Market is an institutional and organizational arrangement to
facilitate exchange of one thing for another. The most observable features of a market are
its pricing and exchange processes. A market is thought of as a meeting of buyers and
sellers: a place where sellers and buyers meet and exchange takes place, an area where price-
determining forces (supply and demand) operate, an area where there is a demand for good
(Andargachew, 1990). But a market is more than a physical place. It is a mechanism or an
institution through which buyers and sellers exchange information and transact. No need to

9
meet physically for a market to operate especially in today’s information and communication
technologies.
Another basic concept that is closely related to market is marketing. This term came into use
with division of labor and specialization and became common with urbanization and
industrialization over many years. The term marketing has been a very debatable concept and
defined in so many different ways by different scholars (Chaturvedi, 1959; Purcell, 1979).
This is because marketing, or more specifically agricultural marketing, projects different
impression to different groups of people in a society, like farmers, traders and consumers
(Kohls and Uhl, 1985). The same source also described marketing as the performance of all
business activities involved in the flow of food products and services from the point of initial
agricultural production until they are in the hands of consumers. The definition of marketing
as a process by which individuals and groups obtain what they need and want by creating
and exchange products and values with others involves work.
Marketing is also an important aspect of any livestock system. It provides the mechanism
whereby farmer’s producers/pastoralists exchange their livestock products for cash. The cash
is used for acquiring goods and services, which they do not produce themselves, in order to
satisfy a variety of needs including food clothing, medication, schooling, the purchase of
breeding stock and other production inputs and supplies (Solomon and Nigussie, 1983).
2.1.2. Marketing systems
A marketing system is a collection of channels, intermediaries, and business activities, which
facilitate the physical distribution and economic exchange of goods (Kohls and Uhl, 1985). A
channel of distribution may be defined as a path traced in the direct or indirect transfer of the
title to a product as it moves from a producer to consumer or industrial users. Every channel
of distribution contains one or more of “transfer points” at each of which there is always
either an institution or a final buyer of the product. In the process of marketing, legal title to
the product always changes hands at least once. The concept of marketing system includes

10
both the physical distribution of economic input and products and the mechanism of process
or coordinating production and distribution (cited in Andargachew 1990). Branson and Norvel
(1983) define the marketing system in terms of what is otherwise known as marketing
channel. In broad terms, marketing system may be defined as the totality of product
channels, market participants and business activities involved in the physical and
economic transfer of goods and services from producers to consumers. Marketing
system operates through a set of intermediaries performing useful commercial functions
in chain formations all the way from the producer to the final consumers (Islam et al.,
2001).
The system comprises several, usually, stable, interrelated structures that, along with
production, distribution, and consumption, underpin the economic process (Mendoza, 1995).
A marketing system can be regarded as a multi-layered sequence of physical activities and of
transfers of property rights from the farm-gate to the consumer (White, 1995). The efficiency
with which a marketing system in an area or country operates can influence the living
standards of people and the overall development of a nation and thus it is vital to make
improvement in marketing efficiency to trigger economic development.
2.1.3. Marketing efficiency
Efficiency in marketing is the most commonly used measure of market performance.
There are two aspects of market efficiency mostly mentioned in agricultural marketing
literature are technical (operational) efficiency and pricing (allocative) efficiency. Technical
efficiency is attained when goods and services are provided at a minimum average cost that is,
when the least cost combination of marketing activities are employed. Technical
efficiency is achieved through technical improvement. Pricing efficiency is concerned
with the price–making role of the market system. It concerns how accurately, how
effectively, how rapidly, and how freely the marketing system makes price, which
measure product values to the ultimate consumer and reflects these values through the
various stages of the marketing system to the producer (Andargachew, 1990).

11
Performance is the crucial issue measured by pricing and operational efficiency. Individual
producers as well as the public have a stake in this matter because the degree of efficiency
attained affects producer’s prices and profit, costs to the consumer and thereby their real
income and the general resource utilization (John and Saharan, 1988).
Improved marketing efficiency is a common goal of farmers, marketing organizations,
consumers and society (Kohls and Uhl, 1985). Higher efficiency means better
performance, while lower efficiency denotes poor performance. Most of the changes proposed
in marketing are justified on the grounds of improved efficiency. Marketing efficiency as
measured by composing output and input values are based on consumer valuation of
goods, and input values (costs) are determined by the values of alternative production
capabilities (Cramer and Jensen, 1982). Based on this argument, markets are efficient
when the ratio of the value of output to the value of input throughout the marketing system is
maximized. The output of marketing is the consumer satisfaction with the goods and
service and the inputs are the various resources of labor, capital and management that
marketing firms use in the process accomplishing particular job without reducing consumer’s
satisfaction and with the output of improvement is efficiency (Abbot and Makeham,
1981). However, a change that reduces costs but also reduces consumer satisfaction with the
end product might actually reduce marketing efficiency.
Effective and efficient marketing system is the one that induces the production of
those products and quantities which when sold to the consumer results in maximum returns
after the deduction of minimum marketing charges and farm production costs (Kohls and Uhl,
1985). However, consumer's satisfaction cannot be measured directly; changes can be
analyzed in terms of “technical” efficiency and “pricing” efficiency.
2.1.4. Marketing channel
Marketing channels are the sequence of intermediaries through which goods pass from the
producers to consumers. They are alternative routes of product flows from producers to

12
consumers (Kohls and Uhl, 1985). Davar (1996) defined marketing channels of distribution
as a series of operations, which physically bring goods into the hands of the final consumer.
Most frequently, a physical product transfer is involved but sometimes an intermediate
marketing institution may take title to goods without actually handling them (Giles, 1974).
Formally, a marketing channel is a business structure of interdependent organizations that
reach from the point of product origin to the consumer with the purpose of moving products
to their final consumption destination (Kotler and Armstong, 2003). Market channel of food
grain trade activities in Alaba Siraro district was studied by Wolday (1994). The food grain
marketing channel among different agents from producer to consumer was studied. Village
collectors, wholesalers, agents, and millers are the main agent in this market. The
study indicates that smaller proportion of the food grain is dishonored to the market
center in the district by village collectors.
2.1.5. Market chain and business support services
According to Lundy et al. (2004) a market chain is used to describe the numerous links
that connect all the actors and transactions involved in the movement of agricultural goods
from the farm to the consumer. Supporting these activities are services that enable the
chain to operate. Agricultural goods and products flow up the chain and money flows
down the chain. The efficiency of the market chain is generally a factor of how well
information flows among these actors. Given the many challenges of the marketplace, it is
vital to suggest that a practical starting point in developing a marketing strategy is to assist
chain actors to visualize their market chain from beginning to end. Market chains operate
most competitively when they are supported by dedicated business organizations, both
formal and informal, which participate in enabling produce to flow from the farm gate to
the final consumer.

13
2.2. Approaches Used to the Study of Agricultural Marketing
The agricultural marketing study involves mainly three approaches. These approaches are the
functional, institutional, and the commodity approaches.
2.2.1. Functional approach
This approach investigates marketing in terms of the various activities that are performed to
exchange product from the producer to the consumer. These activities are called functions
(Cramers and Jensen, 1982). And this approach helps to compare cost and benefits of
different functions. The common functions include are: a) exchange (buying and selling), b)
physical (processing, storage, and transportation), and c) facilitating (Standardization,
financing, risk bearing, and market information). Most of these functions are performed in the
marketing of nearly all commodities.
2.2.2. Institutional approach
Institutional approach examines the activities of business organizations or people
in marketing. The institutional approach focuses on the study of the various institutions,
middlemen and other agencies which perform the marketing activities. These organizations or
market actors are those who perform the operations necessary to transfer goods from the
producer to consumer, because of the benefit of specialization and scale that exist in
marketing as well as production (Cramers and Jensen, 1982).
2.2.3. Commodity approach
This activity encompasses the above two approaches in the marketing of one or more
commodities. This approach focuses on what is being done to the product after its
transfer from its original production place to the consumer (Kohls and Uhl, 1985). It
helps to pinpoint the specific marketing problems of each commodity as well to develop the
market for the specific commodity. The approach follows the commodity along the path

14
between producer and consumer and is concerned with describing what is done and how the
commodity could be handled more efficiently. This approach will be used in this study as the
investigation integrates the above two approaches to study the poultry marketing chain. This
paper uses the commodity approach that integrates the application of the functional and
institutional approach to examine the poultry marketing system in the study area.
2.4. Methods of Evaluating Marketing System
The development of reliable and stable market system has been an important element in
commercialization and specialization in the agricultural sector. In order to evaluate the
functioning and performance of the market, there are three different approaches namely
traditional, Structure-Conduct-Performance (SCP), and the New Empirical Industrial
Organization (NEIO) approaches that integrate SCP with value chain analysis. The SCP
approach was developed in the United State as a tool to analyze the market organization of
industrial sector and it was later applied to assess the agricultural system and this framework
was to evaluate the performance of industries in the USA (Meijer, 1994).
Efficiency factors can be evaluated by examining marketing enterprises for structure, conduct
and performance (Abbott and Mekeham, 1979). The performance of a certain market or
industry depends on the conduct of its sellers and buyers which, in turn, is strongly influenced
by the structure of the relevant markets (Scarborough and Kydd, 1992; Margrath, 1992).
Variables relevant in appraising firm’s behavior can be put into three general categories: -
structure, conduct, and performance related variables (Clodius and Mueller, 1961). But this
approach does not consider all efficiency parameters particularly from the firms or sub sector
efficiency view point to be considered as efficient marketing system. So that it will be
accompanied by value chain analysis that incorporate efficiency parameters in terms of the
sub sector organization structure and conduct.
15
2.4.1. The Structure, Conduct and Performance (SCP) model
Environmental and internal conditions of the firm have an influence on the actions
and behavior of the firm. On the other hand, the composite of firm’s actions is not
equivalent to a complete description of overall market result. Only some important
actions and their consequences on performance of the firm are relevant (Andargachew,
1990). SCP model is one of the most common and pragmatic methods of analyzing a
marketing system. It analyzes the relationship between functionally similar firms and
their market behavior as a group and, it is mainly based on the nature of various sets of
market attributes and relations between them and their performance (Scarborough and
Kydd, 1992). This analytical method is based on the theory that market structure and
market conduct determine the performance of a marketing system.
Efficiency factors can be evaluated by examining marketing enterprises for structure,
conduct and performance (Abbott and Mekeham, 1979). The performance of a certain
market or industry depends on the conduct of its sellers and buyers which, in turn, is
strongly influenced by the structure of the relevant markets (Scarborough and Kydd,
1992; Abbott, 1987; Margrath, 1992). All the three parameters do not have
unidirectional movement but rather have an interdependent relationship. Hence, market
structure does not only influence market performance but also has an impact on market
conduct. Furthermore, performance also affects the development of market structure and
market conduct.
2.4.1.1. Market structure
Market structure includes - a) the degree of buyer and seller concentration, defined by the
number of buyers and sellers in the market b) the degree of market transparency which refers
to the availability of relevant market information, its distribution among buyers and sellers,
and its adequacy in terms of price sharpening, quality comparisons and risk reduction or
uncertainty about the future c) the condition of entry to the market referring to the relative

16
ease or difficulty with which seller may enter the market. This is generally determined by the
advantages that established sellers have over potential entrants (Clodius and Mueller, 1961).
Thus, from market structure perspective, in an efficient market there should be sufficient
number of firms in an industry given the size of the overall market and the firms of
appropriate size are needed to fully capture the economies of scale; there should no barriers to
entry to the market; and firms should have full market information.
Competition plays a key role in harnessing the rivalry and the profit seeking of the market
place in order that it may serve the public interest (Khols and Uhl, 1985). Determining the
presence or absence of the requirements of the model of perfect competition can be used
indirectly to assess the economic efficiency of markets. Many studies concerned with the
efficiency of agricultural markets begin in this form of analysis. Following, three methods of
measures of market concentration are discussed.
2.4.1.1.1. Market concentration ratio (measure)
Considerable attention has been focused on market concentration as a measure of competition
in marketing. Concentration refers to the proportion of industry sales made by its largest
firms. In general, the more concentrated the industry sales, the more likelihood that the market
will be imperfectly competitive (Khols and Uhl, 1985).
Concentration ratio is one of the commonly used measures of market power, which in other
words, refers to the number and relative size of distribution of buyers or sellers in a market.
Concentration ratio measures the per cent of traded volume accounted for by a given number
of participants and is designated by the formula:
Where
C=is concentration ratio,
Si =is the percentage share of the all firms and

17
r=the number of the largest firms for which the ratio is to calculated
Where
Vi amount of product handled by buyer i
MSi market share of buyer i
total amount of product handled by the r firms
Khols and Uhl (1985) suggest that as a rule of thumb, a four enterprise concentration ratio of
50 percent or more is indicative of a strong oligopolistic industry; of 33-50 per cent ratio
denotes a weak oligopoly, and less than that un-concentrated industry. Despite wide
application of concentration ratio as a measure of the ratio of market concentration, there are
limitations against the index. Scarborough and Kydd (1992) suggest that calculating and using
concentration ratios as a measure of market structure is subject to empirical, theoretical and
inferential problems. In most LDCs, where firm records are usually not available publicly, it
would be difficult to determine such ratios on anything, but the most local of scales.
Furthermore, this single measure doesn’t reveal anything about the distribution of sales
between the numbers of largest enterprises, nor does it take in to account product
differentiation or other possible monopoly elements, and it doesn’t allow for the possibility of
different degrees of oligopoly through time, space market levels, functions and products.
Another problem associated with concentration ratio is the arbitrary selection of r (the firms
that are taken to calculate the ratio). The ratio doesn’t indicate the size distribution of r firms.
However, when the numbers of participants in an industry is large it will be difficult to
organize oligopolistic behavior. Under such local circumstances, the concentration ratio given
above can be usefully determined (Scarborough and Kydd, 1992).
2.4.1.1.2. Hirschman Herfindahl Index (HHI)
The other method of measure of market power commonly used is Hirschman Herfindahl

18
Index designated by the formula:
Where:
HHI = Hirschman Herfindahl Index,
Si = the percentage market share of ith firm, and
n= the total number of firms.
The index takes into account all points on the concentration curve. It also considers the
number and size distribution of all firms. In addition, squaring the individual market share
gives some more weight of the larger firms, which is an advantage over concentration ratio.
A very small index indicates the presence of many firms of comparable size, whilst one of 1
or near 1, suggests that the number of firms is small and/or that they have unequal shares in
the market (Scarborough and Kydd, 1992).
2.4.1.1.3. Gini-Coefficient
Gini-coefficient is a very convenient shorthand summary measure of concentration. It is done
based on Lorenz curve and is obtained, by calculating the ratio of the area between the
diagonal and the Lorenz curve divided by the total area of the half square in which the curve
lies. It is this ratio that is known as the Gini-Concentration ratio or more simply as the Gini
coefficient, named after the Italian statistician who first formulated it in 1912.
Alternatively, Gini-Coefficient is computed using the formula:
Where:
G= Gini-coefficient
Ti-Ti-1= cumulative proportion of traders
Fi+Fi-1= cumulative proportion of the product handled by traders

19
n = number of traders (Bhuyan et al., (1988; cited in Wolday (1994)).
Gini-Coefficients are aggregate inequality measures and can vary anywhere from zero
(perfect equality) to one (perfect inequality). In actual fact, the Gini-Coefficient with highly
unequal distributions typically lies between 0.50 and 0.70, while with relatively equitable
distributions it is on the order of 0.20 to 0.35. However, although Gini-Coefficients provide
useful information based on Lorenz curve shapes, a problem arises when Lorenz curves cross.
It is problematic whether we can in this special case claim that a higher coefficient means a
more unequal distribution. The other problem associated with Gini-Coefficients is that it
favors equality of market shares without regard to the number of equalized firms. In other
words, the coefficient equals zero for two firms with 50 percent market shares, for three firms
with 33.33 per cent market shares each, and so on. This study employ concentration measure
to study the structure of poultry marketing in the study area.
2.4.1.2. Market conduct
“Acceptable conduct” includes the aspects that there are enough firms in the market to
create some uncertainty in the minds of firms’ managers regarding whether price changes
both up and down; firm manager will be followed by competitors; there is no
unjustified price discrimination; there is no collusion among different firms, and there are
no pricing or other matters (Wolday, 1994).
Market conduct refers to the behavior that firms pursue in adopting or adjusting the market in
which they sell or buy. The major aspects according to Scarborough and Kydd (1992) include
pricing and selling policies and tactics, overt and tacit inter-firm co-operation, or rivalry, and
research and development activities. According to Abbott and Makeham (1981) conduct
refers to the market behavior of all firms. In what way do they compete? Are they looking
for new techniques and do they apply them as practicable? Are they looking for new
investment opportunities, or are they disinvesting and transferring funds elsewhere? Meijer
(1994) said that, “conduct is pattern of behavior which enterprise follow in adopting or
20
adjusting to the market in which they sell or buy”, in other words the strategies of the actors
operating in the market.
The specified structural features of atomistic numbers, homogeneous product, and free entry
and exit require a form of conduct such that each firm must operate as if in isolation. The
market behavior of firms will determine whether or not they compete and whether they are
acting innovatively to improve market efficiency. Informal association between even a small
numbers of firms (collusion) can cause price distortions and seemingly independent firms can
have joint ownership (subsidiaries) (Staal, 1995).
2.4.1.3. Market performance
Performance of the market is reflection of the impact of structure and conduct on product
price, costs and the volume and quality of output (Cramers and Jensen, 1982). If the market
structure in an industry resembles monopoly rather than pure competition, then one expect
poor market performance.
Assessment of how well the process of marketing is carried out, and according to Abbott and
Makeham (1981) performance is how successfully its aims are accomplished. Is produce
assembled and delivered on time and without wastage? Is it well packed and presented
attractively? Is its quality reliable and are contract kept? Is the consumption of the products
increasing and sales in competitive market expanding? There are such many practical
indications of how well a certain marketing system is operating.
As a method for analysis the SCP paradigm postulates that the relationship exists between the
three levels distinguished. Suppose a causal relations starting from the structure, which
determine the conduct, which together determine the performance (technological
progressiveness, growth orientation of marketing firms, efficiency of resource use, and
product improvement and maximum market services at the least possible cost) of agricultural

21
marketing system in developing countries (Meijer, 1994). Market performance can be
measured by marketing costs and margins.
2.4.1.3.1. Marketing costs and margins
A marketing margin may be defined as a difference between the price paid by consumers and
that obtained by producers or; the price of a collection of marketing services that is, the
outcome of the demand for and the supply of each service (Tomek and Robinson, 1990).
Results of analysis of marketing costs and margins are used to determine whether there
are excess profits and serious inefficiencies or whether wide margins are due to
technical constraints (such as transportation bottleneck). Like in any agricultural marketing,
in livestock marketing, there are several participants in the marketing chain; the
participants include cattle traders, collectors, fattening enterprises, wholesale dealers
and retailers. Both governmental and private fattening enterprises are participating in
collecting, wholesaling and fattening activities. The relative share of the different market
participants will be estimated using the marketing margin analysis. The total marketing
margin in the marketing system constitutes the marketing costs plus profit earned by the
different participants in the system. Marketing costs include those incurred for feed,
laborers working in the collection and feeding activity, costs of transportation to
fattening area and to the market taxes, interest on capital and miscellaneous expenses like
licensing and renewal fees considered.
The size of market margins is largely dependent upon a combination of (1) the quality and
quantity of marketing services provided; (2) the cost of providing such services; and (3) the
efficiency with which they are undertaken and priced (Scarborough and Kydd, 1992). For
instance, a big margin may result in little or no profit or even a loss for the seller involved
depending upon the marketing costs as well as on the selling and buying prices (Mendoza,
1991). However, under competitive conditions, the size of market margins would be the
outcome of the supply and demand for marketing services, and they would be equal to the
minimum costs of service provision plus “normal” profit (Scarborough and Kydd, 1992;

22
Mendoza, 1991). Therefore, analyzing market margins is an important means of assessing the
efficiency of price formation in and transmission through the system.
There are three methods generally used in estimating marketing margin. (1) Detailed analyses
of the accounts of trading firms at each stage of the marketing chain (time lag method); (2)
computations of share of the consumer’s price obtained by producers and traders at each stage
of the marketing chain; and (3) concurrent method: comparison of prices at different levels of
marketing over the same period of time (Scarborough and Kydd, 1992). This paper employs
the use of concurrent method due to complexities in data issues in the remaining method.
2.4.2. Supply response and market participation of farm households
Subsistence agriculture entails large inefficiencies in resource allocation that poor countries
cannot afford to fulfill the rising demand for food that might arises from uncontrollable
population growth and increase in per capita income. Large numbers of African households
remain excluded from participating in the cash economy, and risks and transaction costs far
exceed those of any other region of the world (Delgado, 1995). It has for some time been clear
that Africa needs to move beyond adjustment to development (Cornia and Helleiner, 1994),
and agricultural commercialization has to play a crucial part in this process if it is to result in
poverty alleviation and improved food security.
Modeling the decision to enter the output market is potentially important in situations where
many households rely on subsistence farming. Simultaneous modeling of marketing decision
and amount traded marks a distinct step forward relative to standard empirical approaches
adopted in the literature on agricultural supply response. An additional attractive feature of
this approach is that it allows detailed breakdown of marginal effects from the regression into
a market participation and a quantity (or sales value) component. The challenge for empirical
estimation of marketed surplus is to take account of the Inter relationships among market
participation, production and sales decisions. Supply response analysis will not generate
reliable estimates of the true responsiveness to price and other determinants unless
movements into and out of subsistence are accounted for. For policy analysis, it is also

23
important to focus on policies to increase market participation (Sadoulet and de Janvry, 1995).
In practice, this is done by estimating the marginal effects of the exogenous variables on both
market participation and supply, based on full sample of both market and subsistence farmers.
This study tried to identify the marketing behavior as a two-step decision process: (i) the
household decides whether or not to participate in the market, and (ii) establishes how much
to sell. This study adopted Heckman two stage estimation procedure as suggested by Goetz
(1992) along with the censored regression (Tobit model) to compare the results of the models.
2.4.3. Sample selection bias
Sample selection is a generic problem in social science research that arises when an
investigator does not observe a random sample of a population of interest. Specifically, when
observations are selected so that they are not independent of the outcome variables in the
study, this sample selection leads to biased inferences about social processes. In recent
decades, however, many social scientists have formalized the ways that selectivity can affect
inferences about social processes through the use of models for sample selection bias. These
models demonstrate formally how and why bias comes about, and they also show the
common formal structure of an array of substantive investigations affected by sample
selection bias. In a linear regression model, selection occurs when data on the dependent
variable are missing non-randomly conditional on the independent variables.
Elementary statistical methods in this situation generally yield biased and inconsistent
estimates of the effects of the independent variables. For example, if a researcher uses
ordinary least squares (OLS) to estimate a regression model where large values of the
dependent variable are underrepresented in a sample, the estimates of slope coefficients may
be biased. Heckman’s (1 979) estimator has been used extensively in the recent social science
literature and this study adopt this technique to explicitly identify factors that farmers poultry
market participation and volume of marketable surplus. This study tried to identify the
marketing behavior as a two-step decision process: (i) the household decides whether or not to

24
participate in the market, and (ii) establishes how much to sell. The study employed Heckman
two step estimation procedure that takes selectivity bias into account.

25
3. METHODOLOGY
3.1. Description of the Study Area
Dale woreda
Dale woreda is located in SNNP regional state, Sidama zone. The woreda has a total area of
1326.4 square kilometers and total population of 416842. The woreda is characterized by
dega, woinadega and kola agro-ecologies and produces a variety of crop and livestock. The
woreda is known for its coffee production. Out of the total population 213068 male and the
remaining 203774 are females. The woreda is located at an altitude of 1161-3167m (asl). The
annual rain fall and temperature of the woreda ranges from 1027-1452ml and 11-22co,
respectively.
The soil type of the woreda constitutes Haplic Luvisols (orthic), Chromic Luvisols (nitic),
Chromic Luvisols (orthic), Humic Nitisols (mollic), Eutric Vertisols (chernic), Eutric
Vertisols (ferralic). The woreda has 76 kebeles (Peasant Associations). The woreda is able to
produce various crops such as Coffee, Haricot bean, Fruit, Spices, Vegetables (Irrigated). The
woreda has livestock population. of 166142.0, cattle 19492.0 sheep, 16381.0 donkeys,
431.0 mules 218923.0 poultry, 10506.0 Beehives (IPMS PRA, 2006). Mixed agriculture,
pottery, petty trade and sale of alcolic drink are the main activities under taken by inhabitants
of the woreda. Recently the woreda has been split into three woredas (namely Dale, Antete,
and Bocasso woredas) and the focus of this stuy is Dale woreda and the information discussed
above refers to Dale woreda before its split into three distinct woredas.

26
Figure 1. Dale Woreda geographic location map*
Figure 1. Dale Woreda Map* (IPMS PRA, 2006) *: This map shows Dale woreda before it split into three woredas.
Dale Woreda Dale Woreda*
IPMS pilot
learning sites

27
Alaba ‘special’ woreda
Alaba special woreda is located in SNNPR state, and the Woreda constitutes one of the eight
special Woredas found in the region. The woreda has a total area of 973.8 square kilometers
and a total population of 255127. The woreda is located at 1554 to 2149 m (a.s.l), but most of
the woreda is found at about 1800 m.a.s.l. The land use pattern has shown that out of the
total area coverage of the woreda 64116.25 hectare, 44020 hectare is currently
cultivated; 4317 hectare used for grazing, 3644.45 hectare cultivable, 4592 hectare forest
cover, 4737.8 hectare for others and the rest about 2805 uncultivable land. The woreda also
characterized by woinadega agro-ecologies and produce a variety of crops and livestocks. Out
of the total population, 127060 are males and the remaining 128067 are females. The woreda
is located at an altitude of 1553-2194m (a.s.l). The annual rain fall and temperature of the
woreda ranges from 853-1080ml and 17-20 co, respectivily. The soil type of the woreda
constitutes Andosol (orthic), Solonchak (orthic), Phaeozem (ortic), and Chromic Luvisols (-
orthic). The woreda has 76 kebeles (Peasant Associations). The woreda produce various
crops such as hot pepper, pulses, and Fruit. The woreda has livestock population of 161566,
cattle 34760 sheep, 27661 donkeys, 27661 goats, 2346 mules, 218923, poultry, and 14690
beehives (IPMS PRA, 2006).

28
Figure 2. Alaba ‘special’ Woreda geographic location map.
Figure-2 Alaba ‘special’ Woreda (IPMS PRA, 2006)
Alaba ‘special’ Woreda
IPMS pilot
learning site
29
3.2. Source of Data
For this study both primary and secondary data sources were used. The primary data was
collected from farmers, traders, and other market participants involved in the production and
marketing of poultry subsector. The information includes the overall socioeconomic
characteristics of farmers and traders involved in this business using structured questionnaires
designed for this study. Beside this informal survey was also employed to gather information
from different market participants in the poultry marketing chain. The study also employed
information from secondary sources such as Central Statistical Authority (CSA) and Woreda
and zonal Agriculture and rural development offices regarding poultry production and
marketing.
3.3. Data Requirements
Generally the data required for this study were categorized into two parts. The first one
encompasses information regarding the poultry marketing system and marketing institutions
or business support services involved in poultry marketing in the study area. This data include
the number and role of various intermediaries, the price received and paid by each
intermediary, the number and role of marketing institutions, number of poultry bought and
sold by each traders category, access to market, market information, condition of entry and
exit and other marketing information. The second type of data required for this study include
the general socioeconomics characteristics, access to market and market information,
extension and credit access, institutional organization, input access particularly feed,
veterinary service and improved breeds, number of poultry kept and sold in each family and
other relevant information was gathered from sample households. Finally the role and
responsibly of household members engaged in the production and marketing decision making
within the family members had been gathered.

30
3.4. Sample Size and Method of Sampling
The study has two parts that are market and the farmers’ survey. The market survey was
employed in six sample markets. The sample markets include Awassa (regional) market,
Alaba and Yirgalem (woreda) markets and one local market from Alaba and two local
markets from Dale woreda. The selection of local sample markets was based on the number
and availability of local poultry markets in the two districts. The marketing information was
collected using purposefully selected 35 and 20 market participants (traders) in chicken and
egg markets respectively and the choice of them was made based on the number and category
of traders, mobility of the traders among the sample markets and also informal discussions
with key informants in the marketing system. Informal discussions were also made with
respondents selected from producers, consumers, traders, and service providers in the poultry
marketing system. Two stage sampling technique were used to select sample farm
households. The population or sample frame of the study was the list of households in Alaba
‘special’ and Dale woreda. In Alaba ‘special’ woreda, from the 76 PAs, 5 PAs were selected
randomly and from the 5 PAs, 20 farmers from each PA were selected and a total of 100
farmers were selected and interviewed using systematic random sampling technique. The
same sampling technique was also employed in Dale woreda to select representative farmer
households and a total of 200 farmers were selected and interviewed from both woredas.
3.5. Methods of Data Collection
This study was conducted using information collected from farmers and other marketing
agents that participate either directly or indirectly in the functioning of the poultry market
system in the study area. For this study both formal and informal survey were conducted
using structured questionnaires designed for this study. Informal survey is used to gather data
that are qualitative and enable to give due attention in the design of questionnaire in addition
to its importance giving deep insight into the marketing chain. Moreover, Rapid Market
Appraisal (RMA) technique was employed using checklists from market participants in all
stage to obtain additional supporting information for the study. Enumerators were oriented

31
about the type of data required, the number and list of sample respondents and also the
general objective of the study before they start collecting the data and they collected the data
under the close supervision of the researcher.
3.6. Methods of Data Analysis
The data collected from the farmers, traders and other sources were analyzed using
descriptive and inferential statistics and econometric models were also applied by the help of
statistical software packages such as SPSS and LIMDEP. The descriptive statistics analysis
that were employed using diagrams, charts, ratios, percentages, means, variances and
standard deviations in examining the poultry marketing system as well as farmers’
demographic and socio-economic characteristics.The conduct and various strategies and also
other characteristics of the different marketing agents, market efficiency parameters and the
role and organization of market institutions and functions in the market chain were also
analyzed using descriptive statistics. Econometrics model was also used to identify factors
affecting the farmers’ participation decision and volume of poultry products (chicken and
egg) supplied to the market.
3.6.1. Descriptive statistics
3.6.1.1. Structure conduct and performance (S.C.P) model
The SCP approach evaluates the marketing system at the industry level for a specific
commodity. The critics on this approach are its assumption that firms interact horizontally and
this interaction determines the conduct of the marketing system. But in reality these
interactions are themselves influenced by other variables that are characteristics of the
individual firms that comprise the industry. Hence the structure, conduct and performance of
the poultry marketing system were studied in terms of the sub sector organization approach or
firm analysis along with the industry as a whole system. That is the application of SCP
approach to poultry value chain analysis in the market (sub sector approach) was applied in
this study to examine the poultry marketing system in the study area. In this approach the

32
following are the major areas to be investigated; commodity characteristics, consumption
pattern, supply situation, price relationship and seasonality, marketing institutions and
infrastructures. Moreover the structure, conduct and performance of the entire industry were
also be analyzed.
3.6.1.1.1. Market structure
The market structure and the structure of a firm (size and market share) were analyzed in this
section. Market structure can be measured with CR, HHI, and Gini coefficient. This study
adopt concentration measure (CR) to analyse the degree of traders concentration in sample
market places in performing the exchange function.
Concentration ratio (CR)
Concentration ratio measures the market share of each supplier involved in the market. It is
the percentage of total market sales accounted for by a given number of leading firms, four
largest firms here in this case. The greater degree of concentration is the greater the
possibility of non-competitive behavior existing in the market.
Where Si represents market share of ith firm and m is number of largest firms for which the
ratio is going to be calculated. The concentration measure or market share was used in the
analysis of poultry market structure for Awassa, Alaba and Yirgalem markets.
Barriers to entry can also influence the structure of a marketing system. It is simply any
advantage held by existing firms over those firms that might potentially produce same output
in a given marketing system. Potential entry barriers were investigated based on: demand
conditions, product differentiation, price elasticity, and control over input supplies, legal and
institutional aspects, economies of scale, capital and technological factors to analyze the
market structure.

33
The structure of the sub sector organization that affects the industry or market structure can be
analyzed using information like the location, timing, and clustering of functions, the number
of stages, the number of parallel channel, the type of information, the cost and distribution of
products and the type of exchange and existing exchange institutions. The nature of these
conditions and response and adaptability of the marketing actors determine the firms’ decision
environment and then the market structure.
3.6.1.1.2. Market conduct There are no universally accepted methods for the analysis of elements of market conduct.
The following information’s can be considered to systematically detect indication of unfair
price setting practice and conditions under which such practices are likely to prevail.The
existence of formal and informal producing and marketing groups that affect the bargaining
power of marketing agents. The availability of price information and its impact on the
prevailing prices. The accessibility of alternative market channels and their relative efficiency
in the flow of goods and services from the point of production to the point of consumption.
The exchange practice and pricing behavior of the marketing firms were analyzed to examine
the influence of the existing market structure on the market conduct. The conduct of firms
were also analyzed using information such as: type of exchange used, supply, demand, and
price forecast, information and quality specification, timing and means of exchange and
response to changes in market places.
3.6.1.1.3. Market performance The performance of an industry for a particular commodity can be evaluated interms of
technical and pricing efficiency. Marketing costs and marketing margins, influences on
consumption, distribution and market access are best efficiency parameters to analyze the
performance of a market. Performance in light of the firm view can be explained by allocative
accuracy, efficiency and transaction cost, distribution and capital cost efficiency, right and
control, etc.

34
Marketing margin: The marketing margin is a measure of the percentage of price that is paid
by the consumer that is maintained by each agent in the marketing chain. These include the
total gross marketing margin, producer’s gross marketing margin, and net marketing margin.
These margins can be calculated by deducting the selling price and marketing cost from the
purchase price and then dividing by the price paid by the end users and the proportion and
distribution of these values among marketing actors were used to study the performance of
village poultry marketing system. Mathematically these margins can be calculated as follows:
Where, TGMM = Total gross marketing margin
Where, GMMp = the producer's marketing margins (producers share) from consumer price.
Where, NMM = Net marketing margin
Market cost: This include handling (packing and unpacking cost, loading and unloading
cost), transportation cost, production loss, storage cost, processing cost, capital cost,
commission and other unofficial payments.
The various institutions involved in poultry marking system and their role were indentified
using information from informal survey. The cost component of keeping poultry and their
profitability were also analyzed. Furthermore, the different market channels and the
percentage share of these channels were identified. The result of this market investigation was

35
compared with the perfectly competitive market conditions to measure the marketing
efficiency.
3.6.2. Econometric analysis
Econometric model was used to identify the factors that affect farmers’ participation decision
in the supply of poultry to the market in one hand and determinants of the volume of poultry
supplied to the market in the other hand. Most recent literatures adopt “Tobit and Heckman’s
two stage models’ to identify factors that affect producers to participate in the supply of
poultry (sale of poultry) or not and also identify the limiting factors that determine the level of
poultry (chicken and egg) supplied to market. The aim of this study was to look at factors that
affect participation decision and the volume of marketable surplus in poultry marketing
system. Ideally, the OLS model is applicable when all households participate in the market. In
reality not all households participate in a specific commodity market. Some households may
not prefer to participate in a particular market in favor of another, while others may be
excluded by market conditions. If the OLS regression is estimated excluding the non-
participants from the analysis, a sample selectivity bias is introduced into a model. Such a
problem can be overcome by following a two-step procedure as suggested by Heckman
(1979). Tobit model can also be used to address the above mentioned problem; but its
assumption that both the participation decision and level of supply determined by the same
variable in the same way introduces inconsistency bias into the model. But in reality all
producers may not be potential suppliers of a product and a variable that affect participation
decision may or may not have similar effect on the volume of a produce supplied to the mrket.
Hence, Heckmans two stage estimation procedure was used in this study. The maximum
likelihood estimates of Tobit model was also presented in Annex.9 for comparison purpose.
Because of the restrictions put on the values taken by the regressand, (censored from lower
bound in this case) Tobit model can be called limited dependent variable regression
model.

36
Model specification
The censored regression (Ttobit model) is appropriate when the dependent variable is
censored at some upper or lower bound dipending on nature of the data available. (Tobin
1958, Maddala 1983). For censoring at a lower bound, the model is:
Tobit with left-censoring at zero:
i= 1, 2, 3…….m;
Where Y= Y*, if Y* > 0, and Y = 0 if Y* 0 and Y= max (Y*, 0)
Where Y*= market supply of poultry (dependent variable)
β0 = an intercept
βi= coefficients of ith independent variable (xi)
Xi = independent variable, and 'i' is 1, 2, 3,
Ui = unobserved disturbance term
Where, for the ith observation, Y* is an unobserved continuous latent variable, Yi is the
observed variable, Xi is a vector of values on the independent variables, Ui is the error term,
and βi is a vector of coefficients. This model assumes that Ui is uncorrelated with Xi and is
independently and identically distributed. The model parameters are estimated by
maximizing the likelihood function of the following form;
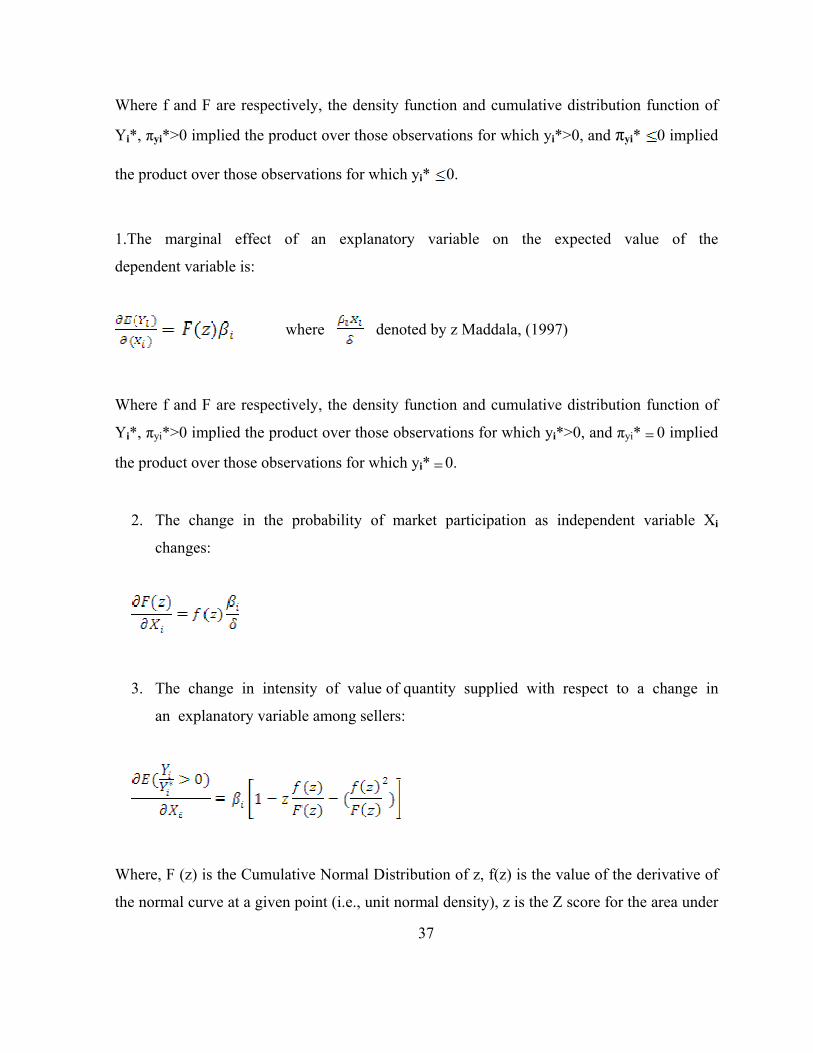
37
Where f and F are respectively, the density function and cumulative distribution function of
Yi*, πyi*>0 implied the product over those observations for which yi*>0, and πyi* 0 implied
the product over those observations for which yi* 0.
1.The marginal effect of an explanatory variable on the expected value of the
dependent variable is:
where denoted by z Maddala, (1997)
Where f and F are respectively, the density function and cumulative distribution function of
Yi*, πyi*>0 implied the product over those observations for which yi*>0, and πyi* = 0 implied
the product over those observations for which yi* = 0.
2. The change in the probability of market participation as independent variable Xi
changes:
3. The change in intensity of value of quantity supplied with respect to a change in
an explanatory variable among sellers:
Where, F (z) is the Cumulative Normal Distribution of z, f(z) is the value of the derivative of
the normal curve at a given point (i.e., unit normal density), z is the Z score for the area under

38
normal curve, βi is a vector of Tobit Maximum Likelihood estimates and σ is the
standard error. Estimation of the whole system of the supply function would give more
efficient estimates, but excluding inconsistencies or biases. Recently the commonly used
technique is the well known Heckman’s sample selection model (Heckmans’ two step model).
The disadvantage of the Tobit model is the assumption that both the decision to
participate and the amount of product marketed given participation is determined by
the same variables, and that a variable that increases the probability of participation also
increases the amount of product marketed. This problem can be overcome using the
Heckman’s sample selection model where a Probit model for the participation equation
is estimated and a regression model, which is corrected for selectivity bias, is specified to
account the factors affecting participation decision and its impact on the level of produce
marketed.
First, the probability of participation and factors affecting participation decision were
specified by Maximum Likelihood Probit model, and from which inverse Mill’s ratios was
estimated and included as independent variable in the linear regression model to estimate the
impact of participation decision on the value of volume of supply. Second-step, the estimated
Inverse Mill’s Ratio (IMR) was used as explanatory variable at the right hand side of the
linear supply function to include the impact of participation decision on the intensity of
volume of poultry supplied to the market.
.
The Probit model is specified as:
i= 1, 2, 3 ……….n
Where: Yi is a dummy variable indicating the market participation decision that is related as
Yi = 1 if Yi > 0, otherwise Yi = 0
Xi - is the variables determining participation decision in the probit model
βi - is unknown parameter to be estimated in the probit regression model

39
ei- is random error term.
Then the parameters can consistently be estimated by OLS over n observations reporting
values for Yi by including an estimate of the inverse Mill’s Ratio, denoting λi, as an
additional regressor to identify the impact of participation decision on the level of volume of
poltry supplied to the market.
More precisely selection model is specified (second step of Heckman’s two stage):
; where Yi is the volume of supply
Where:
Xi is the explanatory variable determining the level of quantity supply
βi is unknown parameter to be estimated (OLS)
µ is a parameter to be estimated that shows the marginal impact of participation decision on
the level quantity supply
ηi is the error term corrected for selectivity bias

40
3.6.3. Hypothesis and variables definition
This part of the study tries to hypothesize factors that influence both the participation decision
of farmers and level of poultry supplied to the market. In the course of identifying factors
influencing poultry supply, the main task is to explore which factors potentially influence
and how (the direction of the relationship) these factors related with the dependent variables.
Therefore, potential variables, which are supposed to influence poultry market
participation and intensity of volume of poultry were explained. Thus the list of variables
expected to have influence on both the farmers’ participation decision and volume of quantity
supplied to markets was defined.
Dependent Variables
Market participation decision (MKTPARTN): The dummy participation decision wheather
to supply chicken and/or egg or not to the market and this variable is the dependent variable
that is to be regressed in the first step of the Heckman’s two stage estimation
procedures (Probit). For the respondents who participate in chicken or egg market = 1, and =
0, otherwise in the year 2007/8.
Value of quantity supplied (VQUTSPLD): It is a continuous variable which represents the
value (birr) of chickens and eggs supplied to the market by family members of the sample
respondents in 2007/8 production year.
Independent Variables
Distance to the nearest poultry market (DSTPLTMKT): It is a continuous variable
measured in walking time (minute) which the farmer spends to reach the nearest poultry
market. If the farmer is located in a village that is further distant from the market place, he/she
is poorly accessible to the market. The closer the market place the lesser would be the
transportation cost and time spent. Therefore, it is hypothesized that this variable is
negatively related to market participation.

41
Average lagged price of poultry (AVLAGPC): This is a continuous variable that measures
annual average lagged price per bird in the year 2007/8. When poultry price is high in the
market in the previous year, farmers would be interested to produce and supply more. Thus,
price of bird in the previous year is expected to have positive relationship with market
participation and level of marketable surplus.
Total number of birds owned (TNBRDOWN): It is a continuous variable and measured by
the number of birds kept by members of the family during the survey period. A marginal
increase in poultry production is expected to have significant effect on the value of poultry
product supplied and also the producers’ participation decision. The volume of poultry
production is expected to have positive relationship with market participation and
marketable surplus. Singh and Rai (1998) identified factors affecting marketed surplus of
buffalo milk in Haryana and identify that milk production and price significantly affected
marketed surplus positively.
Age of the household head (AGHHD): It is a continuous variable and measured in the age
(years) of the household heads f. This variable is expected to have negative relationship with
the independent variables.
Family size (FAMSIZ): It is a continuous variable, measured in the total number of members
of the household, which affects farmer's decisions to participate in market particularly in
poultry production and marketing. Any family member might decide to participate in poultry
production and marketing. Hence it is expected to have positive relationship with the
dependent variable.
Family size greater than 14 years old (FMSZ14YRS): It is a continuous variable, measured
in the number of members of the household who have greater than 14 years old. Most yang
family members made independent decission to participate in poultry production and
marketing. Hence it is expected to have positive relationship with the dependent variable.
Size of land holding (LNDHLD): This is the total land holding measured in hectare, which is
a continuous variable and expected to have negative relationship with poultry market

42
participation and volume of poultry products. If the producer has small land size the
probability of market participation in poultry and the amount of marketable surplus is
expected to be high.
Breed type (BRDTYP): This variable is a dummy variable indicating the breed type of the
birds that the household owned (exotic or local and/or any combination of the two breed
types). The former type is more productive in terms of both egg and meat yield. But due to
feed requirement and disease vulnerability farmers may prefer the local breed type. Therefore,
this variable might take both negative and positive sign on market participation and
marketable surplus. The households owning exotic breed = 1 and 0, otherwise.
Sex of the household head (SEXHHD): It is a dummy with value of 1 for men and 0 for
women HHD participating in production and marketing of poultry. Female household heads
have been observed to have a better tendency than male household heads to enter into
poultry production and marketing business. Thus, this variable is expected to have negative
relationship with market participation and volume of marketable surplus.
Purpose of keeping chickens (PURPCKNKP): This variable is a dummy variable and refers
to wheather the household keeps chicken to sell birds and egg (for business purpose) or just
for home consumption purpose. For those households keeping chickens for selling purpose
assigned with 1 and 0, otherwise. The purpose of keeping chickens is expected to have
positive relationship with the volume of poultry supply.
Education level of household head (EDUCHHD): It is a dummy variable and refers to
weather the household head has a formal education or not. Those household heads who have
formal education determines the readiness to accept new ideas and innovations, and hence
promote to get supply, demand and price information and this enhances farmers’ willingness
to participate and increase volume of sale. Therefore, formal education was hypothesized to
positively influence market participation and marketable surplus. Holloway et al. (1999)
found that education and visits by an extension agent had significant and positive effect on
quantity of milk marketed in Ethiopian highlands. Out of the total household heads

43
interviewed, 15% of them do not have formal education and the remaining 85% have formal
education.
Extension service (EXTSRV): A categorical variable measured in contact with extension
workers for poultry production and marketing assuming extension service as a source of
information on the production and marketing of the product under consideration. Previous
studies revealed that efforts have been made to introduce cross breed chickens but farmers
were less likely to adopt these breeds mainly due to high feed requirements and disease
vulnerability. Farmers who have contact with extension workers are more likely to know the
advantage of production like poultry and the availability, quality, and price of inputs and
assigned with 1 and 0, otherwise. Therefore contact with extension agent is assumed to have
positive relationship with market participation decision and volume of marketable surplus.
Credit access (CRDTACS): This is a dummy variable and measured with 1 for those farmers
who take credit for the production and marketing of poultry and 0, otherwise. Access to
credit would enhance the financial capacity of the farmers to purchase the necessary
inputs for the production and marketing of poultry. Therefore, it is hypothesized that credit
use for poultry keeping and marketing would have positive influence on market participation
and volume of poultry supplied.
Income from non-farm activity (NFRMINC): It is a continuous variable that show the
amount of income obtained from non-farm activities undertaken by the household members.
This income might strengthen their farming bussiness or might become reluctant to keep
poultry in favor of other farming activities. However, getting income from non farming
activities may be used to purchase inputs for poultry business. Thus, this variable is assumed
to have direct or inverse relationship with market participation and volume of supply.
Market information (MRKTINF): It is a dummy variable and assigned with 1 for those
households who access marketing information and 0, otherwise. Farmers marketing decisions
are based on market price, supply and demand information, and poorly integrated markets
may convey inaccurate and inadequate information on price, demand and supply, leading to

44
inefficient production and marketing decisions. Therefore, it is hypothesized that market
information is negatively related to market participation and marketable surplus.
Feed supplement (FDSPLT): It is a dummy variable and assigned 1 for those farm
households who suppliment feed for their chicken and 0, otherwise. Food supplimantation for
scavenging local chickens would significantlty improve the productivity of local breeds. Thus,
this variable is expected to positively influence the market participation and level of supply.
Off-farm income (OFRMINC): It is a continuous variable and measured with the annual
income earned (birr) by the households members from off-farm activity. This income might
strengthen their farming bussiness or might become reluctant to keep poultry in favor of other
farming activities. However, getting income from off-farm activities might be used to
purchase inputs for poultry business. Thus, this variable is assumed to have direct or inverse
relationship with market participation and volume of supply.
Income from farming (INCFRMG): It is a continuous variable and measured with the
annual income earned (birr) by the households from farming activity within their land
holding. Poultry production and marketing is not considered as an independent business
activity by most rural farm families and hence higher farming income is expected to adversely
affect the farmers participation in poultry marketing and level of supply.
Years of experience in farming (EXPFRMG): It is a continuous variable; measured in the
number of years that the household head spend in farming business. Higher experience in
farming business may favor farming activity than poultry business. Hence, this variable is
expected to have adverse impact on the participation on and volume of chickens and egg
supplied to the market.

45
4. RESULTS AND DISCUSON In this chapter, chicken and egg production and marketing, socio-economic and demographic
characteristic of farmers and chicken and egg traders had been discussed. Production and
marketing support services of extension, input supply, and credit and information access had
also been discussed. Furthermore, the structure, conduct and performance of chicken and egg
marketing, profitability of chicken keeping, determinants of chicken and egg supply had been
discussed.
4.2. Results of Descriptive Analysis
4.2.1. Socio-demographic characteristic of farmers The result of this finding showed that 6 and 1 percent of the sample respondents were
female headed in Dale and Alaba woreda respectively. Sex of the household head in the
two woredas has significant difference at 10 percent significance level. The respondents
in Alaba woreda implied that there is a possibility of having more than one wife in
Muslim community and close relatives can marry women who do not have husband to
protect the wealth and children of the family. This might be the source of variation as 4
and 96 percent of the household are Muslims in Dale and Alaba woreda respectively.
Family size also showed variation at 10 percent significance level due to the same reason
(5.8 in Dale and 6.3 in Alaba). Education level has shown strong variations between the
woredas in favor of Dale woreda. Only five percent of the respondents in Dale woreda
are illiterate whereas it is 25% in Alaba. Religion in the two woreds has clear boundary
at 1% significance level. In Alaba woreda 96% of the sample respondents are Muslims
whereas 91% of the respondents in Dale woreda are protestant. The average age of
sample respondent in Dale and Alaba are 39 and 36 years respectively. Regarding marital
status more respondents in Alaba woreda are married (95%) than Dale woreda (93%).
Table-1 presents the demographic characteristics of sample respondents (farmers) in Dale
and Alaba woredas.

46
Table 1. Demographic characteristics of sample households (farmers)
Source: Own computation ***, **, * show level of significance at 1, 5 and 10 percent Annex 2 presents the distribution of sample households by the age of family members. In
Alaba woreda there are more family members (both sex) under 14 years age at 1 percent
significance level. There are also variations in family members between the age of 14 to
64 at 1 percent level of significance for males and 5 percent level of significance for
females.
Annex.1 presents family size by age and sex distribution as these variables are hypothesized
to have an impact on chicken production and marketing decision making. The two woredas
have statistically significance difference in all categories of age and sex.
Variables
Woreda
Total χ2/t Dale Alaba
Sex (HHH) Male 94 99 193 3.701*
Female 6 1 7
Age (HHH) Mean 39.07 36.02 2.194**
Family size Mean 5.806 6.341 -1.647*
Education
level
Illiterate 5 25 30 34.824***
Read and write 19 13 32
1-6 grade 38 53 91
7-12 grade 38 9 47
Religion Ort. Christian 2 4 6 179.307***
Muslim 4 96 100
Catholic 3 0 3
Protestant 91 0 91
Marital
status
Single 1 4 5 5.488*
Married 93 95 188
Divorced 1 0 1
widowed 5 1 6

47
Ownership and decision making in bird keeping and marketing is not limited to the head of
the household unlike other livestock. According to the result presented in Annex 3 significant
portion of the birds in the sample household are owned by females and children (both male
and female). Annex 2 revealed that mother, father, male children and female children are
owner and decision makers of bird production at the ratio of 5:4:2:1 respectively. Mothers
owned more hatchery (25.5%) and hen (32%) than fathers (13.5%, 22%) and the difference
might indicate mother’s interest in the production of chickens and egg to fulfill immediate
cash need and nutrition requirements of the family.
4.2.2. Source and income level of farmers Most farmers in the study area earn their entire income only from agriculture. According to
the result presented in Table 2, 78 and 88 percent of the sample households earn their total
annual income from agricultural activities. More farmers in Dale woreda integrate trading and
other economic activities with their agriculture than farmers in Alaba woreda. The annual
average income of farmers in Alaba woreda is about 6570 birr that is much larger than
farmers in Dale woreda which is 3244 birr. This variation might be due to the high population
density and their better involvement in non agricultural activities among other potential
reasons. The annual revenue from poultry production cannot be undermined. Most farmers
replied that they do not have clearly stated purpose regarding the intention of poultry keeping.
But the figures presented in Table 4 can prove the contribution of the subsector for the
betterment of the livelihood of the rural poor relative to the low financial and labor
investment.

48
Table 2. Source and income level of farmers
Variables Item
Woreda
Total χ2/t Dale Alaba
Main source of income Farming 78 88 166 5.1*
Trading 16 11 27
Others 6 1 7
Annual revenue from Farming 3244.3 6569 -5.7***
Poultry production 805.9 208.9 3.65***
-2.13** Off-farm income 1140 2478
Non-farm income 2293.78 1566
Source: Own computation ***, **, * show level of significance differences at 1, 5 and 10 percent confidence level 4.2.3. Flock size and breed composition of bird in the sample household Flock size and breed composition of birds in rural and small scale farmers highly depend on
the accessibility of input, housing, disease incident and purpose of bird keeping among others.
Sonaiya and Swan (2004) stated most common flock size of family poultry ranging from 5 to
20 birds seems to be the limit that can be kept by a family without special inputs in terms of
feeding, housing and labor. The average flock size per family in Dale woreda is about 27 and
that of Alaba woreda is about 17 for both local and exotic breeds. The independent sample t
test showed that these two means show significance defference at 1 percent significance level.
Table 3 presents the flock characteristics of birds by age category, breed type and sex for the
sample households between the two woredas. Hatchery flock size (both local and exotic)
shows strong variation (<0.01 significance level) in the two woredas. Cock, hen, cockerel,
pullet and hatchery ratio kept by the sample respondent is 1:2:1:4:3.

49
Table 3. Flock characteristics and breed composition of bird
Breed type Woreda N Mean Std. Deviation t-test
Hatchery local
Dale
47
5.17
4.65
-4.171***
Alaba 55 9.94 6.56
Hatchery exotic Dale 34 45.70 12.93 15.53***
Alaba 6 4.50 3.56
Pullet local
Dale 48 3.87 3.33 0.734
Alaba 51 3.45 2.29
Pullet exotic owned
Dale 6 10.00 19.60 1.965**
Alaba 20 1.80 .62
Cockerel local
Dale 24 2.66 1.76 -1.217
Alaba 36 3.25 1.90
Cockerel exotic Dale 4 2.00 1.41 0.917
Alaba 19 1.57 .692
Hen local Dale 78 3.76 3.07 1.942**
Alaba 78 3.01 1.55
Hen exotic Dale 18 3.11 1.60 -0.638
Alaba 21 4.33 7.97
Cock local Dale 39 2.20 -1.36
Alaba 63 2.74
Cock exotic Dale 7 1.85 1.49
Alaba 9 1.11
Total number of
bird
Dale ( 96) 26.93 26.63 3.022***
Alaba (84) 17.28 12.95
Source: Own computation ***, **, * show level of significance differences at 1, 5 and 10 percent confidence level N: Represents number of sample respondents
50
4.3. General Characteristics of Village Poultry Production
4.3.1. Ownership and decision making role Ownership and decision making ability in the production and marketing of birds and eggs
within the household in the study area is diverse and independent. All household members
including male, female and children are owners and decision makers in the production and
marketing of birds and eggs. From the farmers survey the respondents replied that owners and
decision makers in bird production and marketing include the household head spouse, and
children at the ratio of 5:4:3 respectively.
4.3.2. Feeding structure
In most parts of the country indigenous birds are left aside to find their feed requirement on
free ranges and scavenge what they find elsewhere. From the total sample households’ 45% of
them responded that they supplement left over grains for birds. But discussions with farmers
revealed that the supplementation is irregular and highly depends on the availability of grains.
Out of the total sample households 26 and 2 percent in Dale and Alaba woredas respectively,
purchase grain and compound feed in various mix to supplement their birds (Table 12). The
remaining 14% replied that they entirely left their birds aside to scavenge from free range and
waste disposals elsewhere in the surrounding. According to the information obtained from
sample respondents the diversity of ownership within the family members discourages the
purchase of supplementary feeds as most of bird owners have not separate day and night time
housing so that birds compete for what they are supplied with.
4.3.3. Diseases management and housing
Discussions with the development agents and agricultural bureau experts revealed that
Newcastle disease is the most frequently observed diseases in the study areas. Red-pepper
and lemon with water are supplied for the chickens in the time of diseases outbreak without
consultation with veterinary officers due to the difficulty of getting the service. Lack of
51
knowledge among bird keepers on modern drugs availability, inadequate resources to seek for
veterinary advisory, Existence of traditional knowledge on poultry diseases management are
the possible bottlenecks in the sub-sector regarding disease management. More than 72
percents of the respondent replied that they do not have separate day and night time house and
birds spent the whole day elsewhere searching for feed for survival making diseases
transmission substantial and severe.
4.4. Productivity and Profitability of Village Poultry Keeping
4.4.1. Productivity of village poultry keeping in the Study Area
Poultry is kept in most farm households without clearly defined purpose by most producers.
Ownership and decision making in this subsector is also diverse and independent.
Understanding the exact purpose of poultry keeping in rural family has a paramount
importance in the development of the subsector. Tadelle (2002) decomposes the major uses
and benefits of poultry and egg in rural Ethiopia into egg for hatching (51.8%), sale (22.6%),
home consumption (20.2%) and birds produced for sale (26.6%), sacrifice for ceremonies
(25%), stock replacement (20.3%) and home consumption (19.5%). This decomposition
cannot reflect the ultimate purpose of why farmers are keeping poultry because the activities
are not scheduled before the production decision. Village poultry production system is also
characterized by low input-output ratio. Birds are left to scavenge what they find elsewhere
and given minimal or virtually nothing to supplement their daily feed requirements. Most
respondents in the study area replied that the supplements include home leftover wastes,
grains that cannot be used for home consumption and anything they find irregularly. Under
such management condition village poultry lay 40-60 eggs per hen per year (Tadelle, 2002).
The same source also revealed that this low productivity is a factor of high mortality rate, low
hatchability, and long broodiness time of local breeds. Table 4 shows the productivity of local
breed under smallholder production management system in the study area. The mean egg
production of local birds under smallholders’ management system is 58 eggs per annum per
bird in the study area. This figure is very low when compared to the production potential of

52
exotic breeds which is 250 eggs per annum per bird. This figure (local chickens egg
productivity) can be improved to 100 eggs per annum per bird and ten clutches per annum
under semi intensive management system (Tadelle and Ogle, 1996). About fifety percent of
the loss in the eggs incubated by local chicken is due to the low hatchability rate and low
survivability rate of local hatcheries.
Table 4. Productivity of village poultry keeping in the study area
Item N Minimum Maximum Mean Std. Deviation
Average egg laid per bird per annum
(local breed)
99 30 120 57.9 12.4
Length of broodiness time/ clutch 30 5 60 18.3 8.88
Number of clutches per year 79 3 10 4.67 1.1
Number of eggs hatched per clutch 70 4 18 11.24 2.6
Proportion of eggs hatched
successfully per clutch
51 4 15 8.67 2.2
Survivability rate per clutch 16 3 10 6.8 1.8
Total number of bird owned (local) 149 1 56 14.1 10.66
Chickens dead in 2000 (local) 122 0 18 5.2 4.3
Source: Own computation N: Represents the number of sample respondents
However, the input-output ratio of village poultry keeping is minimal, the production system
is still economical under the smallholder management condition with virtually minimal or nil
input cost. The productivity of the production system can be significantly improved by small
supplementation of feed, decreasing mortality rate by introducing day and night time housing,
and improving the veterinary service. Tadelle and Ogle (1996c), pointed out that it is possible
to achieve daily production per hen over 30% using a supplement of 30g/day maize and
30g/day noug cake, to 28% from 30g/day maize. According to Udo et al. (2001) housing,
NCD vaccination, feed supplementation and control of broodiness showed greatest increase in
flock size.

53
4.4.2. Cost structure and profitability of village poultry keeping Cost component of village poultry keeping is mostly related with the production constraints
like high mortality rate of chicks, low hatchability, diseases (particularly NCD), long
broodiness time of local birds and the cost of stock replacement. Other input costs like feed,
labor, housing, and veterinary costs (if any) would have been analyzed to compute the profit
level of the subsector even if these cost categories contribute less in the subsector under small
holders production system. The profitability of village poultry keeping here is assessed by
studing the cost and revenue for a hypothetical producer who owns the average number of
birds kept in the sample households in each flock composition for one year production period.
According to the result obtained in Table 5, the cock, hen, cockerel, pullet and chick
composition of the sample respondents is 1:2:1:4:3 and this figure is used as a stock (starting
capital) in the start of production year in which the profitability of poultry is undertaken.
Productivity of village poultry keeping is also revealed in Table 5. The profitability analysis is
undertaken in each stage in bird and egg production cycle including hatching egg layer, chicks
keeping, table egg layer and, growers stage and cocks for one year interval based on the
productivity of village bird keeping in the study area presented in Table 5. The finding is in
line with the finding of Udo et.al. (2001) and Tadelle and Ogle (1996) in that most cost
component of the subsector is attributed to death caused by disease, predation, long
broodiness time and low productivity of local breeds, and low input base production system.
But the profitability analysis proved that the subsector is still profitable and attractive as it
requires less capital and input that are most common constraints in most investment decisions
of rural community in particular and the country as a whole. According to the analysis the
subsector provides about 100 percent net profit of the initial investment cost. The profitability
of poultry keeping can also be improved significantly by making improvements in the
management and input utlization.

54
Table 5. The cost structure and profitability of village poultry keeping (in birr)
Flock compsition
No
Cost/revenue Items in Birr
Unit cost
Total no
Total cost (-)
Unit price
Total no
Total revenue (+)
hatc
hing
he
n\H
atch
ery
1 Stock cost 0.9 17.4 15.66 - - - 2 Feed cost 3.0 5Kg 15 - - - 3 Labor cost - - 1.5 - - - 4 Hatchability loss 0.9 5.94 5.346 - - - 5 Death loss<6week 2.75 4.8 13.2 - - - 6 Revenue (sale)=<6 week - - - 8.5 17.4 147.9
Subtotal=a - - 50.71 - - 147.9
Pulle
t and
co
cker
el/
broi
lers
1 Stock cost 8.5 23.8 202.3 - - - 2 Labor - - - - - - 3 Feed cost (Birr/Kg) 3 7.5 22.5 - - -
4 Death loss =<12 weeks 12 2.2 26.4 - - - 5 Revenue=<12 week - - - 23.5 21.6 507.6
Subtotal=b 251.2 507.6
Hen
/layi
ng/ t
able
eg
g pr
oduc
tion
1 Stock cost 23.5 15.2 357.2 - - - 2 Feed cost 3.5 7.5 26.25 - - - 3 Housing cost 4 7.5 30.0 - - - Cost (death) 21.5 4 86 - - - 4 Revenue from sale egg 0.9 510.2 459.18 5 Revenue sale of birds - - - 19.0 11.2 212.8
Subtotal=c 499.6 671.98
K e
epin
g co
ckre
ls
1 Stock cost 27 9.98 269.46 - - - 2 Feed cost 3.5 4.5 15.75 - - - 3 Cost due to death - - - - - - 4 Revenue (sale) - - - 32.0 9.98 319.36
Subtotal=d 285.21 319.36 Cost of veterinary service=e 25 1 25 - - - Gross total=a+b+c+d+e 1111.7 1646.84 Net profit 535.12
Source: Own computation

55
4.5. Farmers’ Access to Business Support Services
Access to business support services for all actors in the marketing chain is pivotal to make the
chain actors and the market chain as a system competitive so that producers, intermediaries
and end users of goods and services can make the best use out of it. In this section support
services of extension, credit, input supply and marketing in poultry sub-sector have been
assessed and evaluated by farmers.
4.5.1. Farmers access to credit Competitive financial market is a fundamental in undertaking each and every economic
activity in order to get the maximum benefit out of the activity undertaken. Formal financial
market in most developing countries is not competitive and even nonexistent in the rural
areas. Farmers in rural areas of Ethiopia get most of their financial requirements from
informal money lenders and relatives at higher interest rate. Formal credit access and sources
of the credit for the poultry keeping and marketing in study areas are described in Table 6.
About 49 % of the sample respondents in Dale and 32% in Alaba special woreda replied that
they do not want credit for poultry keeping and marketing in the year 2000. Most of these
farmers added that they never consider poultry keeping and marketing as an independent
business and they do not have schedule for bird keeping and marketing unlike other economic
activities. There is significance difference (<0.05) in farmers credit need between the two
woredas. This might be due to the introduction of exotic breed day old chicks in credit (kind)
in Dale woreda by IPMS project (NGO). Credit taken for poultry keeping in 2000 also shows
significant difference (<0.01) between the two woredas for the same reason.

56
Table 6. Farmers’ access and source of credit for poultry production and marketing
Variables
Item
Woreda
Total
χ2/t Dale Alaba
Did you need credit for
poultry in 2000?
Yes 49 32 81 5.61**
No 47 62 109
Did you take credit in
2000?
Yes 36 2 38 35.633***
No 59 87 146
Source of credit NGO 35 0 35 24.629***
Relatives &friends 1 2 3
How much did you take? Mean 873.7 220 3.441***
Source: Own computation ***, **, * show level of significance differences at 1, and 5 percent confidence level
Farmers were also asked to evaluate their credit access for the production and marketing of
poultry. The evaluation criteria include availability of credit access, timeliness of credit,
repayment duration and relevance of the credit. Table 7 presents farmers evaluation of the
service for the aforementioned criterion. Regarding the availability of credit access about 35
percent of the respondents strongly agree that availability of credit service is poor. About 61%
of the respondents agree that credit access is not available. Farmers in Dale woreda reply that
they receive credit in the year 2000 E.C. But the repayment duration was fixed and they were
asked to repay the entire amount at a time. Those farmers who take credit were also asked to
evaluate the service in relation to its timeliness and most of them agreed that the credit taken
was not timely. They also evaluate the service in terms of the repayment duration and
adequacy and most of the service users agreed that it was not satisfactory. Farmers from Dale
woreda replied that the credits they take were relevant and they benefit out of it even if they
were asked to repay within a short period of time so that they unable to adopt the technology.

57
Table 7. Farmers evaluation of credit service access for poultry keeping and marketing
Variable
Item
Woreda
Total
χ2 Dale Alaba
Evaluation of credit
availability
Strongly disagree 19 21 40 4.037693
Disagree 35 34 69
Neutral 4 0 4
Evaluation of credit
timeliness
Strongly disagree 10 5 15 2.195122
Disagree 26 15 41
Neutral 4 0 4
Evaluation of credit
repayment duration
Strongly disagree 9 0 9 5.96129
Disagree 19 11 30
Neutral 2 0 2
Agree 1 0 1
Evaluation of credit
relevance
Strongly agree 9 1 10 1.435376
Agree 15 4 19
Neutral 2 0 2
Agree 2 0 2
Evaluation of credit
adequacy
Strongly disagree 5 0 5 1.851852
Disagree 14 4 18
Neutral 2 0 2
Source: Own computation
Farmers also pointed out that major the problems in credit service include absence of formal
credit access, inconsistent supply, farmers afraid taking credit and lack of collateral are the
most frequently mentioned problems among others (Table 8).

58
Table 8. Problems in credit service for the production and marketing of poultry
Source: Own computation *** Show level of significance differences at 1, 5 and 10 percent confidence level
4.5.2. Farmers access to extension service Now a day agricultural experts are trained and assigned at the lower administrative level
“kebele” to assist farmers to improve productivity and competitiveness so that earn better
income and improve their livelihoods. Extension service here is assessed and evaluated based
on the frequency of farmers contact with the development agent and how farmers are
evaluating and measuring the quality and relevance of the service they get from the experts. In
Ethiopia these services are provided by ministry of agriculture and rural development and
other nongovernmental organizations (NGOs) to equip farmers with technological know how
and information access so that they can better utilize their scarce land and labor resources to
improve their productivity and competence. The type and frequency of these services are
described by the sample farm households as shown in Table 9. About 76 and 57 percent of the
respondents in Dale and Alaba “special” woredas respectively get extension service for
poultry production and marketing in the year 2000EC.
Variable
Item
Woreda
Total
χ2 Dale Alaba
Major problems in
credit
Afraid of taking credit 1 5 6 34.46***
Inconsistent 17 2 19
No formal credit institution 40 60 100
No collateral 0 5 5

59
Table 9. Extension service coverage between the two woredas
Variables Item
Woreda
Total χ2 Dale Alaba
Did you get extension service
for poultry production?
Yes 76 57 133 11.602***
No 18 41 59
Who provide the service? BOARD 39 42 81 6.844***
NGO & BOARD 37 15 52
How often did you contact
the development agent?
Once a week 27 8 35 8.012**
Monthly 22 25 47
Twice a week 23 20 43
What was the extension
advice on?
Production 28 30 58 9.21*
Credit facilitation 5 0 5
Marketing facilitation 5 4 9
All the above 28 13 41
Have you ever attend
demonstration field day?
Yes 15 4 19 7.24***
No 76 88 164
Source: Own computation ***, **, * show level of significance differences at 1, 5 and 10 percent confidence level
Extension service access for poultry production and marketing shows statistically significant
difference (<0.01) between the two woredas. The variation is the resultant involvement of
IPMS-ILRI project in the subsector in Dale woreda along with the woreda bureau of
agriculture and rural development (BOARD) in the survey year. This also improves the
frequency of farmers contact with the development experts in Dale woreda than Alaba
“special” woreda at significance level of 5 percent. The extension advice that was given for
farmers includes advice on production, credit facilitation and marketing facilitation among
others. Farmers from Dale woreda also better enjoy visiting demonstration field day than
farmers of Alaba special woreda. Table 10 presents farmers evaluation of extension services
they get on the production and marketing of poultry.

60
Table 10. Evaluation of Extension service by farmers
Variable Item Woreda Total χ2
Dale Alaba
Evaluation of extension
service relevancy
Disagree 7 9 16 0.5296
Neutral 17 17 34
Agree 38 33 71
Strongly agree 28 27 55
Evaluation of extension
service timeliness
Disagree 25 32 57 15.748***
Neutral 31 23 54
Agree 31 16 47
Strongly agree 2 14 16
Evaluation of extension
service effectiveness
Strongly disagree 1 3 4 5.21
Disagree 35 43 78
Neutral 15 14 29
Agree 31 18 49
Strongly agree 7 7 14
Evaluation of extension
service adequacy
Strongly disagree 8 1 9 9.0579*
Disagree 40 46 86
Neutral 28 20 48
Agree 10 10 20
Strongly agree 2 6 8
Source: Own computation ***, **, * show level of significance differences at 1, 5 and 10 percent confidence level
According to the result presented in Table 11 more than 66% and 60% of the respondents in
Dale and Alaba woreda respectively agree that the extension service related to the subsector is
relevant and they are interested to get the service if accessible. The farmers also evaluate the
service in terms of its timeliness, effectiveness and adequacy and most of them replied that
the service is not satisfactory regarding the above evaluation criteria. And they exhaustively
list problems of the service in Table 11 below.

61
Table 11. Major problems in extension service for the production and marketing of birds
Source: Own computation ***, **, * show level of significance differences at 1, 5 and 10 percent confidence level
The most frequently mentioned bottleneck in extension service is its failure to integrate input
supply and credit facilitation in the package. Inconsistency and inefficiency are also
mentioned as constraint in extension service provision for the sub sector. The service also
gives less weight for the production and marketing of village poultry than other crop and
livestock. Poor infrastructure and absence of demonstration sites have paramount importance
for the success of the business support services to impact the competence of the subsector.
4.5.3. Farmers access to input supply
Farmers were asked to list and evaluate the type, source, adequacy, and efficiency of input
supply in the woredas. The following table summarizes the farmers’ responses for the input
supply system in the two woredas. This input supply system includes all input types used for
the production and marketing of both local and exotic chickens. This input supply system
includes all input types used for the production and marketing of both local and exotic
chickens. More families in Dale woreda have better access for inputs for exotic birds
Items
Woreda
Total
χ2 Dale Alaba
Problems in
extension
service
The service is not consistent 30 16 46 25.77***
Inefficient in transfer of
technology
5 6 11
The service not focus on input
supply and credit facilitation
33 59 92
Less weight is given for the sub
sector
5 1 6
Poor infrastructure 5 10 15
No demonstration site 3 0 3

62
including chicks and pullet for stock establishment along with the credit, feed and veterinary
service than farmers in Alaba. This is due to the fact that the involvement of the
nongovernmental organization (ILRI-IPMS) among others potential possibilities in provision
of full package of inputs for exotic bird keeping in selected five kebeles of Dale woreda in the
study year.

63
Table 12. Farmers access of input supply for bird keeping
Source: Own computation ***, **, * show level of significance differences at 1, 5 and 10 percent confidence level
Variable
Item
Woreda
Total
χ2 Dale Alaba
Did you have exotic chickens? Yes 46 36 82 1.8136
No 48 56 104
Source of the exotic chickens? Board 10 27 37 40.727***
PA market 1 4 5
Woreda market 2 2 4
NGO 29 0 29
Mode of purchase of the exotic
chickens
Cash 11 27 38 38.65***
Credit 34 0 34
Source of local chicks Local market 51 43 94 5.596*
Mode of purchase of the local
chickens
Cash 49 36 85 0.0967
Credit 2 1 3
Did you supplement feed? Yes 75 60 135 5.128**
No 25 40 65
Did you get veterinary service? Yes 41 16 57 14.751***
No 58 81 139
Did you have separate shelter
for you chickens?
Yes 29 4 33 22.618***
No 60 83 143
What was the major feed for the
chickens?
Scavenging 10 18 28 51.636***
Scavenging & grain 46 53 99
Compound feed 9 0 9
Scavenging &
compound feed
26 2 28
64
Source of inputs and mode of purchase of these inputs for exotic chicken production shows
significant variations between the two woredas (<0.01) percent level of significance. In Dale
woreda about 69% of the respondents confirmed that the source of these inputs was NGO
where as this figure is 0% in Alaba woreda. About 82% of the respondents replied that the
source of the input was bureau of agriculture and rural development and this figure was about
30% in Dale woreda. This might be the reason for the high variation in the average flock size
between the two woredas that is 17 in Alaba and 26 in Dale woreda (Table 3). With regard to
feed supplementation and availability of housing services, farmers in Dale woreda are better
accessing the service due to the same reason mentioned above. Furthermore, farmers in Dale
woreda are in a better position in supplying their birds a combination of grain and compound
feed beside the traditional free ranging system. Table 13 summarizes farmers’ evaluation of
input supply system for the production and marketing of birds in the study area. The
evaluation criterion includes availability, adequacy, price and timeliness of inputs for both
local and exotic bird keeping. Most farmers in both woredas do not hesitate the input supply
system for local bird keeping. This is because of the fact that farmers do not consider village
poultry keeping as an independent business and birds are left aside to fulfill their feed
requirements. Local birds also have better performance in surviving harsh environmental
condition and disease. But regarding exotic bird input supply, most farmers are strongly
opposing the service as the breeds require much more inputs than the local ones. The exotic
input supply was strongly challenged interms of price, adequacy and timeliness of the service
in Dale woreda. This is because of their exposure to evaluate the exotic birds for their
intensive input requirement and the corresponding benefit out of it.

65
Table 13. Farmers’ evaluation of input supply for poultry production
Source: Own computation ***, **, * show level of significance differences at 1, 5 and 10 percent confidence level
Variable Item
Woreda Total
χ2 Dale Alaba
Evaluation of local chicken input availability
Strongly disagree 29 20 49 8.5* Disagree 4 9 13 Neutral 19 7 26 Agree 33 37 70
Evaluation of local chicken input adequacy
Disagree 9 9 18 0.71 Neutral 16 14 30 Agree 53 46 99 Strongly agree 6 3 9
Evaluation of exotic chicken input availability
Strongly disagree 21 14 35 1.34 Disagree 54 52 106 Neutral 7 4 11
Evaluation of exotic chicken input adequacy
Strongly disagree 16 8 24 6.36 Disagree 45 32 77 Neutral 20 22 42
Evaluation of local chicken input price
Agree 43 34 77 12.53** Disagree 9 16 25 Neutral 27 13 40
Evaluation of exotic chicken input price
Strongly disagree 17 1 18 33.54***Disagree 48 21 69 Neutral 11 21 32 Agree 6 9 15
Evaluation of exotic chicken input timeliness
Strongly disagree 27 2 29 25.76***Disagree 43 38 81 Neutral 9 14 23 Agree 4 12 16

66
The problems associated with input supply system for local and exotic bird keeping is
summarized in Table 14. According to the result most farmers in both woredas stated that the
input supply system for exotic breeds is poorly developed or nonexistent and characterized by
high price and inconsistent availability if it exists. The input supply system for local breeds is
also poor and inconsistent in availing inputs like compound feed and veterinary services that
cannot be found in local market places. Even if it existed, characterized by high price and
found in long distance from the farmers resident. This poorly developed input supply system
can have adverse effect in the productivity and profitability of the subsector. This also makes
the marketing system function inefficiently to coordinate the flow of birds and eggs between
the production and consumption points.
Table 14. Problems in input supply for chicken keeping
variable Items Woreda Total χ2 Dale Alaba
N 85 75 160
Problems in
input supply
Absence of input for exotic breeds 41 40 81 22.7***
Absence of inputs for local breeds 13 14 27
High input price 8 2 10
Absence of veterinary service 7 1 8
Exotic input not timely 1 4 5
Inconsistent input supply and poor
supervision
9 1 10
Source: Own computation ***, **, * show level of significance differences at 1, 5 and 10 percent confidence level

67
4.5.4. Farmers access to market and market information Market places in rural areas are often characterized by long distance and considerably long
time interval between two market days. These characteristics of rural marketing system
obviously adversely affect the transaction of goods and services by rural households. This
intern affects the farmers’ production and marketing decision of goods and services. Table 17
presents the market access and farmers evaluation of bird and egg marketing system in the
study area. Many past works in the production and marketing of poultry stated that the
activities undertaken in this subsector involve the active participation of women and children.
These groups of the society are believed to participate in other activities like production and
reproduction responsibility of women and children are expected to enroll school which is also
far away from home in many rural areas. So that understanding of the situation of the poultry
marketing system in the study area is crucial in analyzing the production and marketing
behavior of owners and decision makers of village bird keepers.
About 70% of the total sample respondents engaged in the marketing of bird and egg in the
survey time (Table 15). In order to arrive the nearest poultry market, producers must walk
about 10Km distance and trade their birds and egg at a market which function once or twice a
week mostly (Table 15). Almost all sample markets were starting at the afternoon that
imposes tension on the market participants as they walk long distance back to home. Table 13
summarizes the action taken by each participants when they unable to sale what they bring to
the market. About 45%and 25% of the respondents replied that their bird that is not sold at the
market took back home and sold at lower price respectively. About 46%and 36% of the
respondents replied that their egg that is not sold took back home and sold at lower price
respectively. According to the result obtained most poultry owners are price takers and price
is set by negotiation of the parties that lead to increase the bargaining power of the buyers
depending on the time of sale. Above all most sellers (69%) do not have price information of
another market before they transact their produce. Lack of market access and absence and/or
asymmetric information are the major constraints mentioned in deciding how much to
produce and supply to the market.

68
Table 13. Chicken and egg marketing behaviors of households in the two woreda
Variables Item Woreda Total χ2 Woreda Total χ2 Dale Alaba Dale Alaba Egg Marketing Chickens Marketing
Did you sell eggs /Chickens in 2000
Yes 70 69 139 0.2677 69 72 141 0.2217 No 22 18 40 30 27 57
Chickens/ eggs not sold in a market day
Took back home 10 23 33 4.826 21 24 45 0.7547 Took another market 5 6 11 10 15 25 Sold at lower price 14 12 26 11 13 24
Who set selling price of Chickens/ egg?
Sellers 28 37 75 12.9** 13 50 63 38.57*** Buyers 33 18 51 55 20 75
How the selling price of Chickens/ egg set?
By demand and supply 27 38 65 2.2319 30 46 76 5.21** Negotiation 39 34 73 43 31 74
Did you know Woreda price before you sold?
Yes 63 48 111 3.112* 53 45 98 0.2486 No 19 27 46 30 30 60
Did you know awassa price before sold?
Yes 0 3 3 2.898* 3 2 5 0.236 No 70 71 141 69 72 141
Difficulty getting’ buyers Yes 27 17 44 2.187 27 17 44 2.187
No 53 57 110 53 57 110 Reason of difficulty Inaccessibility of market 11 2 13 17.18*** 11 2 13 17.187***
Lack of information 8 0 8 8 0 8
Source: Own computation

69
There is significance difference between the two woredas in price setting strategy that is who
and how price is set in the chicken market at 1 and 5 percent significant level respectively. In
general egg marketing was better functioning in terms of price setting and information on the
price before sold. Some bird sellers replied that the variation between egg and bird marketing
is due to the fact that the demand for bird is not consistent as that of the egg demand and also
they afraid to return back birds once they are supplied to the market due to diseases
transmission to birds that are left at home.
Table 16. presents the farmers evaluation of market access for the production and marketing
of birds and egg. Friend farmers, personal observation and traders are the most important
source of information on price, supply and demand of birds and eggs. Farmers were also
asked to evaluate information access in terms of reliability, adequacy and timeliness of the
information regarding price, supply and demand of birds and eggs and most of them agree
that the information was reliable but they added that the service was not consistent and
adequate. Information access in Dale woreda is in a better position than in Alaba at high level
of significance (<0.05) because Alaba woreda is larger than Dale woreda in geographic area
so that market places are far away from the farmers resident. Most farmers (69%) do not get
price information so that they were neutral to evaluate the market access. According to the
result presented in the Table 16 information access is generally dependent on market access
that in turn depend on distance of the market place to resident. Based on the above analysis
one can conclude that proxy of market places, infrastructure development and information
access have significant implication on the production and marketing decision of rural
households.

70
Table 16. Source and farmers’ evaluation of market information
Variable Category
Woreda
Total χ2
Woreda
Total χ2 Dale Alaba Dale Alaba
On Supply On Demand
Source of
information
Traders 22 8 30 13.8** 17 5 22 10.5**
Observation 27 21 48 17 14 31
Friend farmer 29 44 73 42 53 95
Source of
information
on price
Traders 20 10 30 13.32** 20 10 30 13.3**
Observation 16 19 35 16 19 35
Friend farmer 35 44 79 35 44 79
Reliability
of
information
Disagree 6 5 11 4.59 18 33 51 9.45*
Neutral 23 22 45 21 14 35
Agree 44 47 91 40 27 67
Reliability
of
information
on price
Strongly disagree 3 6 9 16.1** 3 6 9 16.1**
Disagree 8 12 20 8 12 20
Neutral 18 31 49 18 31 49
Agree 43 22 65 43 22 65
Strongly agree 9 2 11 9 2 11
Adequacy of
information
Disagree 8 27 35 35*** 5 21 26 35.9***
Neutral 21 31 52 27 38 65
Agree 47 12 59 42 10 52
Timeliness
of
information
Strongly disagree 3 2 5 17.7*** 3 0 3 33.4***
Disagree 11 27 38 11 29 40
Neutral 26 26 52 22 30 52
Agree 38 14 52 42 9 51
Timeliness
of
information
on price
Strongly disagree 3 6 9 28.7*** 3 6 9 28.7***
Disagree 12 17 29 12 17 29
Neutral 18 37 55 18 37 55
Agree 41 9 50 41 9 50

71
4.6. Structure, Conduct and Performance of Poultry Marketing System 4.6.1. Structure of poultry marketing system 4.6.1.1. Demographic characteristics of bird and egg traders
Bird and egg traders in the sample markets were interviewed to gather information about their
distribution based on different socioeconomic characteristics. Markets participants in Dale
and Alaba woredas are considered as one market participants each because almost all
participants engaged in all markets within the woreda except when there exists more than one
market in a day. Table 17 revises traders’ distribution on the bases of demographic
characteristics. Sex of the sample traders in all sample markets are 100% male. But in the
survey period it is observed that females are also involved in egg trading at retailing stage in
the market chain even though they are not included in the sample due to their nonexistent in
the market place. Females actively involved in bird and egg sell to cover their cash
requirements in market days. Most bird and egg traders in the sample market are part time
traders like poultry keeping. This might be the reason for the poor involvement of women in
bird and egg trading as women has diverse responsibilities in rural family. School aged
children and farmers involve in this market. Out of the 35 bird traders and 15 egg traders
interviewed about 83 and 60 percent of bird and egg traders respectively are not married or
are singles. This implies that bird and egg trading in the two woredas are integrated with other
farming and non farming activities and most traders do not consider it as an independent
business. Language and religion show statistically significant variation at (<0.01) level
significance among the three market places for both bird and egg traders. The mean age of the
sample respondents are about 24 and 25 years for bird and egg traders respectively that is
smaller than that of other crops or livestock traders.
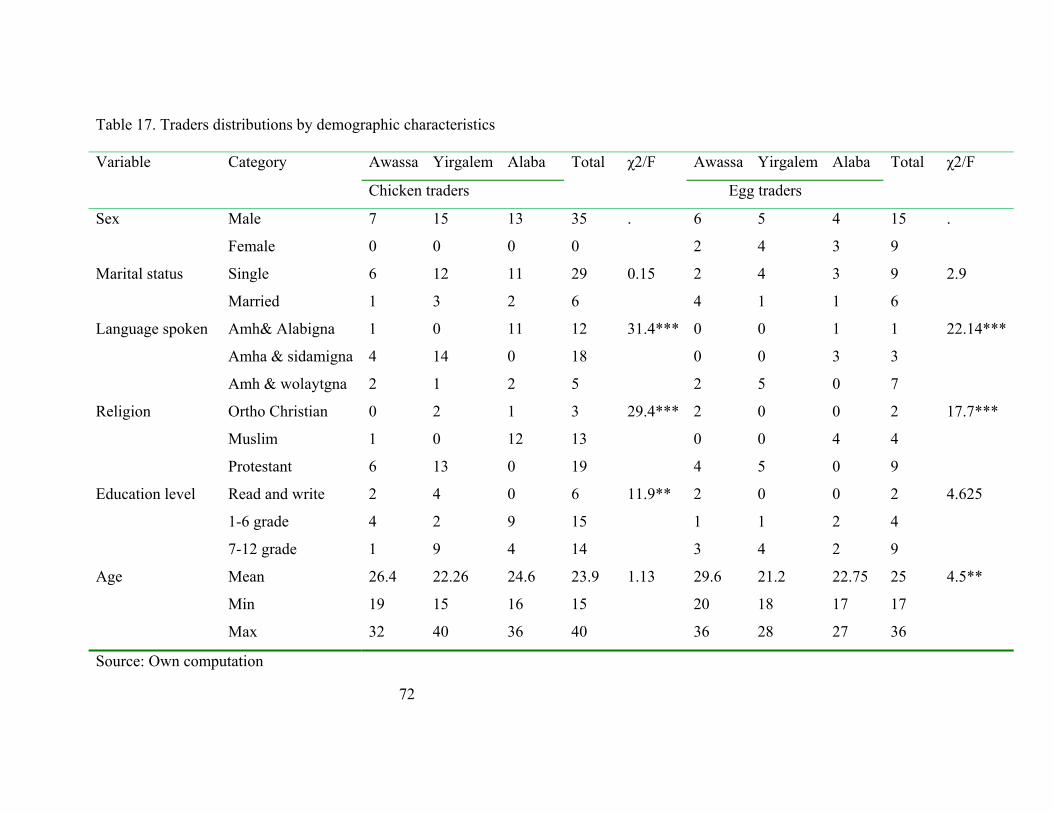
72
Table 17. Traders distributions by demographic characteristics Variable Category Awassa Yirgalem Alaba Total χ2/F Awassa Yirgalem Alaba Total χ2/F
Chicken traders Egg traders
Sex Male 7 15 13 35 . 6 5 4 15 .
Female 0 0 0 0 2 4 3 9
Marital status
Single 6 12 11 29 0.15 2 4 3 9 2.9
Married 1 3 2 6 4 1 1 6
Language spoken
Amh& Alabigna 1 0 11 12 31.4*** 0 0 1 1 22.14***
Amha & sidamigna 4 14 0 18 0 0 3 3
Amh & wolaytgna 2 1 2 5 2 5 0 7
Religion
Ortho Christian 0 2 1 3 29.4*** 2 0 0 2 17.7***
Muslim 1 0 12 13 0 0 4 4
Protestant 6 13 0 19 4 5 0 9
Education level
Read and write 2 4 0 6 11.9** 2 0 0 2 4.625
1-6 grade 4 2 9 15 1 1 2 4
7-12 grade 1 9 4 14 3 4 2 9
Age Mean 26.4 22.26 24.6 23.9 1.13 29.6 21.2 22.75 25 4.5**
Min 19 15 16 15 20 18 17 17
Max 32 40 36 40 36 28 27 36
Source: Own computation

73
4.6.1.2. Traders’ distribution by resource ownership Physical resource: Resource ownership of market participants for both chicken and egg
traders is summarized in Table 18. Most of the traders in the sample markets particularly in
primary markets are very young and are living with their parents. They are school aged and
perform marketing activities mostly in market days that take place at weekend. Very few full
time bird and egg traders are observed in Awassa and Yirgalem markets. Resources owned by
traders when they start the business and in the year 2000E.C are summarized for comparison.
Almost all traders have not virtually any physical resource when they start the business
(100%). These is due to the fact that bird and chicken trading are not considered as an
independent business activity and most traders perform the business with very low financial
capital temporarily depending on season, capital availability and cash requirement.
Traders in local markets transact their birds within one market day and store birds that can’t
be sold that day in their resident and left to scavenge with birds owned by their family. The
number of bird and egg traders is very high in time of festivals than other time in all sample
market. Physical resource ownership is improved in 2000 E.C in all sample markets for both
bird and egg traders. According to the results displayed in Table 19 bird traders in all sample
markets have physical resource like shop shed, telephone, stores (both separate and resident)
and bicycle in 2000 E.C. Physical resource ownership in 2000 E.C. shows statistically
significant difference among the sample markets at a 5 percent level of significance in favor
of Awassa market. About 86% of bird traders in Awassa market have mobile telephone in
2000 E.C. the figure is much higher than the 15% and 46% of Yigalem and Alaba markets
respectively. The variation is due to the fact that traders in Awassa market have better
financial and physical asset and consequently higher volume of transaction.

74
Table 18. Live bird and egg traders’ distribution by resource ownership
Market place Total χ2/F Market place Total χ2/F Awassa Yirgalem Alaba Awassa Yirgalem Alaba
Chicken traders Egg traders Store separate at start
Yes 0 0 0 0 a. 0 0 0 0 No 7 15 13 35 6 5 4 15
Store resident at start
Yes 0 0 0 0 0 0 0 0 No 7 15 13 35 6 5 4 15
Mobile telephone at start
Yes 0 0 0 0 6 5 4 15 No 7 15 13 35 0 0 0 0
Fixed line telephone in 2000
Yes 0 0 1 1 1.7 6 5 4 15 No 7 15 12 34 0 0 0 0
Bicycle in 2000 Yes 1 0 3 4 3.7** 6 5 4 15 No 6 15 10 31 0 0 0 0
Shop shed in 2000 Yes 0 0 0 0 0 0 0 0 No 7 15 13 35 6 5 4 15
Mobile telephone in 2000
Yes 6 2 6 14 10.7** 5 1 1 7 5.4***No 1 13 7 21 1 4 3 8
Store separate in 2000
Yes 2 0 0 2 8.5** 0 0 0 0 No 5 15 13 33 6 5 4 15
Store resident in 2000
Yes 2 4 1 7 1.97** 5 1 1 7 5.4***No 5 11 12 28 1 4 3 8

75
Financial resource: financial resource is one of the most important marketing inputs for
agricultural marketing in general. In developing countries like Ethiopia financial market is
poorly developed and less competent. Most farmers and traders particularly in rural areas of
Ethiopia entirely rely on informal credit source as the only source of finance for the
development of their business activities. Meyer and Nagarajan (1992) define “informal”
finance as farmer source of credit from traders, input suppliers, moneylenders, friends and
relatives to support their business activity. Since these financial service providers are not
regulated and supervised by the national financial authorities, all the rules and regulations are
set in favor of the lender. Traders in sample market are analyzed in (Table 19) in relation with
their financial capacity to plan, organize and implement their business activities. In the course
of the survey it is observed that farmers and children keep and trade poultry as a means of
initial capital accumulation to involve in another business activity due to its comparatively
low capital and labor requirement. The traders’ initial mean operating capital was 243 and 345
for bird and egg traders in the study area. The initial capital was ranging from a minimum of
11birr to a maximum of 800birr for bird traders and this figure ranges from minimum of
50birr to a maximum of 1300Birr. The mean operating capital of bird and egg traders in
2000E.C was 2657 and 2533 birr respectively. This means the mean operating capital of bird
traders in 2000E.C is eleven times greater than that of the operating capital at the start of the
business. Operating capital of egg traders in 2000E.C also increase by seven times that of
initial capital. Operating capital of bird and egg traders reach peak of 9000 and 7000 birr
respectively and both peak capital are registered in Awassa market. Moreover traders
confirmed that the source of the financial increase is from internal source except few traders
get credit from informal credit institutions. The source of capital in the start of the business is
from gift from family members and own fund. No credit is given to enter new traders into the
bird and egg trading business activity.

76
Table 18. Financial position of bird and egg traders in sample markets
Financial capital Market N Mean Std. Dev Min Max F N Mean Std. Dev Min Max F
Bird traders Egg traders
Amount of working
capital in the start
Awassa 7 237.1 139 110 500 7.5* 6 625 373.8 200 1300 6.3**
Yirgalem 15 143.1 106.5 11 330 5 174 71.6 100 250
Alaba 13 361.5 190.7 150 800 4 137.5 110.9 50 300
Total 35 243 175.2 11 800 15 344.7 332.2 50 1300
Amount of working
capital in 2000
Awassa 7 6050 2556.2 750 9000 8.8* 6 3458 2064.1 750 7000 1.3
Yirgalem 15 1677 2281.8 150 6000 5 1990 1746.6 750 5000
Alaba 13 1961 2436.8 450 7000 4 1825 1325.1 300 3500
Total 35 2657 2893.5 150 9000 15 2533 1839.8 300 7000
Source: Own computation **, * show level of significance differences at 1, 5 and 10 percent confidence level

77
Social capital: social capital refers to a capital stock developed by trust and emotional
attachments to some indigenous rules and regulations stated by members of a group involved
in same or related functions in a marketing system. It improves the efficiency and
competitiveness of a market chain by decreasing the marketing costs and also reduces the risk
of conducting marketing business activities in the course of product and service flow from the
point of production to the end users across the market chain. Table 20 presents social capital
that has direct or indirect impact on the development and competitiveness of bird and egg
marketing system in the study area. With regard to traders’ parent occupation, most traders
(about 97% and 93%) of live bird and egg traders respectively in sample markets are from
farmer family. This result showed that both the production and marketing functions of the sub
sector is dominated by farmers and members of farm families. Most bird and egg traders in
the sample market replied that they do not have previous occupation before they start this
business. According to the result obtained from the survey, about 77 and 67 percent of bird
and egg traders in the sample markets respectively, do not have any occupation before they
start the business. This result showed that this sub sector has crucial importance as a source of
starting capital for the development of business activity within and outside the sub sector. The
finding of the thesis presented in Table 19 also depicted that most bird and egg traders have
regular buyers and sellers without any systematic relationship pattern. The traders added that
having regular buyer and seller is important in sustaining the business activity and reduces the
cost of finding buyers and/or sellers. Eggs traders have involved more frequently/regularly
operate the business than bird traders. Regarding experience in this and other business activity
the result also showed that bird traders have higher experience.
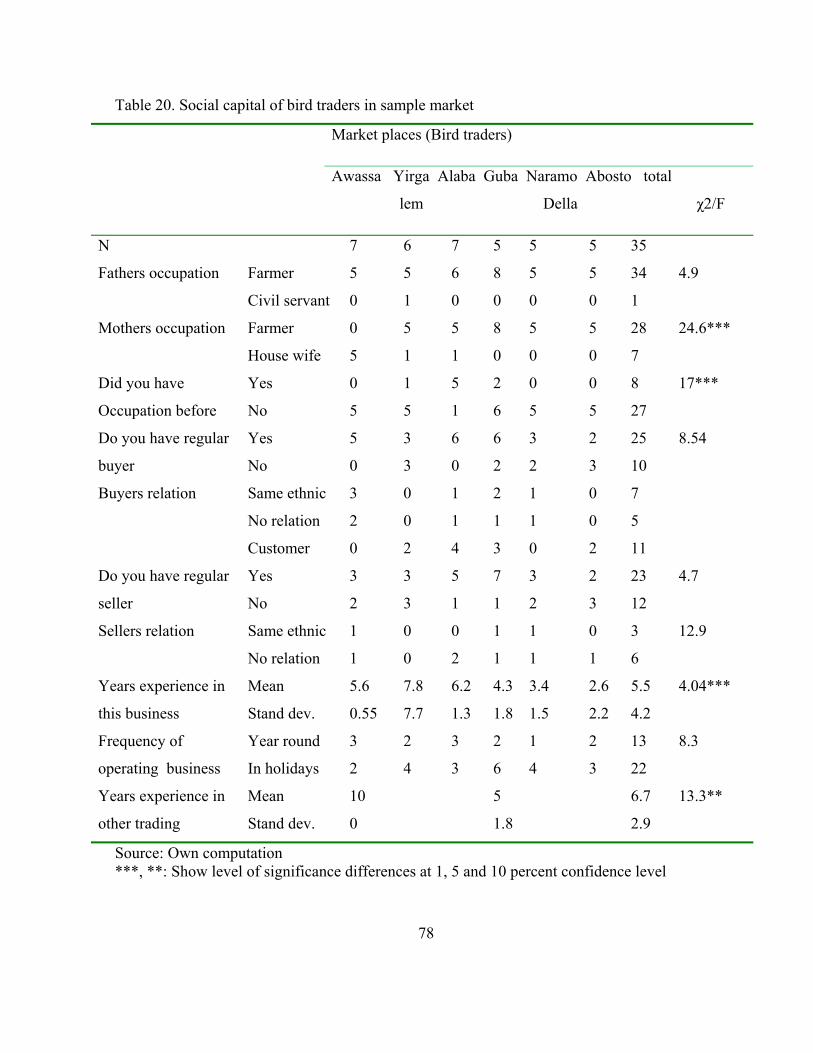
78
Table 20. Social capital of bird traders in sample market
Market places (Bird traders)
Awassa Yirga Alaba Guba Naramo Abosto total
lem Della χ2/F
N 7 6 7 5 5 5 35
Fathers occupation Farmer 5 5 6 8 5 5 34 4.9
Civil servant 0 1 0 0 0 0 1
Mothers occupation Farmer 0 5 5 8 5 5 28 24.6***
House wife 5 1 1 0 0 0 7
Did you have
Occupation before
Yes 0 1 5 2 0 0 8 17***
No 5 5 1 6 5 5 27
Do you have regular
buyer
Yes 5 3 6 6 3 2 25 8.54
No 0 3 0 2 2 3 10
Buyers relation Same ethnic 3 0 1 2 1 0 7
No relation 2 0 1 1 1 0 5
Customer 0 2 4 3 0 2 11
Do you have regular
seller
Yes 3 3 5 7 3 2 23 4.7
No 2 3 1 1 2 3 12
Sellers relation Same ethnic 1 0 0 1 1 0 3 12.9
No relation 1 0 2 1 1 1 6
Years experience in
this business
Mean 5.6 7.8 6.2 4.3 3.4 2.6 5.5 4.04***
Stand dev. 0.55 7.7 1.3 1.8 1.5 2.2 4.2
Frequency of
operating business
Year round 3 2 3 2 1 2 13 8.3
In holidays 2 4 3 6 4 3 22
Years experience in
other trading
Mean 10 5 6.7 13.3**
Stand dev. 0 1.8 2.9
Source: Own computation ***, **: Show level of significance differences at 1, 5 and 10 percent confidence level

79
Table 21. Social capital of egg traders in sample market
Variable
Market places (Egg traders) χ2/F
Awassa Yirga Alaba Guba Naramo Abosto Total
lem della
N
Fathers occupation Farmer 6 2 1 2 2 1 14
7 Civil servant 0 0 1 0 0 0 1
Mothers occupation Farmer 6 2 1 2 2 1 14
7 House wife 0 0 1 0 0 0 1
Did you have
Occupation before?
Yes 3 2 0 0 0 0 5
8.3 No 3 0 2 2 2 1 10
Do you have regular
buyer?
Yes 5 2 1 1 2 1 12
3.5 No 1 0 1 1 0 0 3
Buyers relation Same ethnic 0 1 0 0 1 0 2
9.5
No relation 2 0 1 0 1 0 4
Customer 3 1 0 1 0 1 6
Do you have regular
seller?
Yes 4 2 1 2 2 1 12
3.5 No 2 0 1 0 0 0 3
Sellers relation Same ethnic 1 0 1 0 1 1 4
10.8 No relation 3 2 2 2 0 0 9
Years experience in
this business
Mean 4.8 5 6.5 2 4 3 4.5
1 Stand dev. 2.3 0 0.7 1.4 1.4 1.9
Frequency of
operating business
Year round 6 2 2 2 0 0 12
15*** In holidays 0 0 0 0 2 1 3
Years experience in
other trading
Mean 4.3 5 6.5 2 4 3 4.2
1.6 Stand dev. 2 0 0.7 1.4 1.4 1.9
Source: Own computation ***: Show level of significance differences at 1, 5 and 10 percent confidence level N: The number of sample respondents

80
4.6.1.3. Roles and linkage of actors in poultry marketing chain In this section the roles and linkages of chain actors involved in varies marketing functions
and also their linkages within each function category would have been discussed. Producers
are the sole source of birds and egg that are core stones in the development of the marketing
chain. They have varies market outlets to inject their produce into the marketing chains at the
alternative periphery of the supply chain. The researcher observed that all traders in this
subsector are males in all sample markets. Farmer traders or rural assemblers are actors who
play great role in coordinating the transactions between and within producers and
traders/urban assemblers. Other important actors in the marketing chain are urban assemblers.
This group of the chain actors performs important marketing functions in facilitating the flows
of birds and egg from producers and village collectors to consumers and regional whole
sellers. Brokers, supermarkets, hotels and retailers also have significant contribution in the
market chain.
Producers: This group of the chain actors includes males, females and children within the
farm family at the ratio of 5:4:3 and performs the physical production of birds and egg. In
other agricultural products household heads are the ultimate decision makers. But in this
subsector all family members are independently owners and decision makers in the
production and marketing of birds and egg. Producers are buyers and sellers of birds and egg.
They buy birds and egg for consumption and stock establishment and sell their produce to
satisfy their cash requirement. The supply and price of birds and egg depend highly on the
availability of holydays. This impacts the number of farmers’ market outlet. In the ordinary
seasons farmers are the major market outlet for stock establishment in local markets and in
time of holydays no farmer buy birds for this purpose. In ordinary seasons the local markets
are full of pullets and cockerel because the major buyers are producers to keep birds until the
time of holydays. Table 22 presents farmers market outlet for birds and egg.

81
Table 22. Farmers’ bird and egg market outlet Market outlet (volume traded) Percent (bird) Percent (egg)
Producer farmers 10.4 3.8
Producer /village traders 34.5 19.5
Urban assemblers 29.6 38
Whole sellers 20 22.2
Consumers 5.5 16.5
Source: Own computation
Farmer traders/ village collectors: This group of the chain actors has immediate contact
with farmers who supply bird and egg to the market. They buy egg and bird from local market
and resell it back for farmers, urban assemblers and whole sellers in local and woreda markets
for a profit. These categories of traders are usually part time traders and most of them are
yang and school aged male children who themselves are producers. According to informal
discussion with this trader category, most of them are part time traders but they transact about
35 percent of birds in local and woreda markets. They collect birds and egg from different
local markets using their financial advantage and local knowledge sold for a profit in same or
other markets/day. They walk long distance to the village and woreda market carrying their
birds and egg to sell their product. High proportion of the birds is transacted through this
group of actors.
Urban assemblers: These traders are also important actors in the market chain and they all
are male in the study area. They serve the chain by transacting the product from farmers and
village collectors to whole sellers and consumers in the woerda and regional markets. They
also travel to nearby local markets to buy birds and egg by competing with village collectors.
They have better capital and most of them are full time traders than village collectors. These
assemblers supply their birds and egg for Hotels and restaurants and retailers and whole
sellers in woreda and regional markets.

82
Whole sellers: Whole sellers in village poultry marketing chain refer to those traders who sell
large quantities of birds and egg to other traders via brokers or direct communication. In egg
marketing chain whole sellers buy egg from urban assemblers and village collectors from
woreda and regional markets and sell in bulk for shops, Hotels and Restaurants in woreda and
regional markets. They are full time traders and travel to different woredas to buy egg. They
use baskets to pack their egg and put straw and grass to protect the egg from mechanical
injury during transportation. These traders have strong financial resource and better
information on the price and supply of egg in the source and destination markets. In bird
marketing chain whole sellers are conducting important marketing functions by linking the
woreda and regional markets with the terminal market. In Alaba town there are two whole
sellers involved in the supply of birds to Adis Ababa market. These traders transact very high
volume of birds from Alaba and other woreda markets to Adis Ababa market. They transport
the birds by truck/ ISUZU to Adis Ababa and supply for brokers who sell the birds to retailers
and Hotels and Restaurants in Adis Ababa. They use large box made of bamboo to pack their
birds in the course of the transportation. These whole sellers receive their price set by the
brokers after the birds are sold.
Transporters: Transport service providers have also played very fundamental role in the
village poultry marketing system. They serve the physical function of marketing and add
place value (utility) to the product by transferring the product from the surplus area to where
the products are scarce and so that fetch better price. They play the role of scarce resource
allocation and distribution by optimizing the transaction of the product to where they value
most.
Brokers: Brokers in this market chain play crucial role by coordinating the flow of birds from
Alaba town to consumers in Adis Ababa. They don’t posses ownership of the birds they
transact. Rather they receive the birds sent by whole sellers in Alaba town and sell them for
retailers and hotels and restaurants in Addis Ababa terminal market for Alaba bird marketing
system. They set the price themselves according to the demand and supply of birds from the
different parts of the country to Addis Ababa market and deduct 2 birr per bird and send the

83
remainder to the whole sellers. There is neither legally enforceable agreement nor any kin
relationship between the brokers and the whole sellers rather they have just business clientele
relationship based on mutual trust.
Retailers: Retailers in bird and egg marketing chain are those actors who perform the last
marketing function by linking consumers with other traders and/or producers. The number of
these traders varies according to the demand and supply condition. In the time of holydays the
number of retailers reaches its peak and drop as the holyday ends. These retailers include both
full and part time traders and operate in local, woreda, regional and terminal/ Adis Ababa
market.
Hotels and Restaurants: Traditional “doro wot” and egg dishes are served by Hotels and
Restaurants for consumers in most parts of the country although the number and proportion
from the total volume of is less (Fig. 3). This group of the actors in market chain also adds
value to the birds and egg they serve for their customers even though the cost and benefit of
these actors is not included in this market chain analysis due to the complexity of the business
undertaken by them. They get the supply from different actors who involve in the transaction
process.
Processors: The number of actors in this category is very limited and most birds are supplied
to consumers without passing any processing function that adds farm utility to the product.
But informal discussion with consumers revealed that the most reason they do not buy poultry
product is they could not find the product in a form they wish it could be. But in Awassa town
there are few processors using the traditional processing technology and supply for super
markets. They slaughter, wash and pack the birds and sold for consumers via Super markets.
The most important observation here is both these processors and Hotels and Restaurants use
female birds due to their comparative price advantage than cocks that are mostly preferred by
consumers who buy live birds.

84
Super markets: Although the proportion of birds and egg in these chain actors are minimal
their contribution in the market chain is worthy to be mentioned. They get the birds from
processors and stored in refrigerator until sell. They pack the different parts of the bird in
plastics according to Ethiopian traditional “doro wot” dish preparation procedure and sold for
consumers.
Consumers: Consumers in village poultry subsector comprise the full range of the society in
all parts of the country. Consumers are the final end points and are the ultimate goal of the
production and marketing process and the consideration of whom is central for which the
development of the subsector organization comes to reality. Their demand pattern, socio-
cultural distribution and geographic location can have influence on the entire marketing
efficiency parameters along the market chain. In village poultry marketing chain, the
consumption pattern is seasonal and dynamically changed based on availability of festival and
existing price of birds and egg. Consumers get the product at different channels as in
represented by fig. 3 based on their geographic location, the number and size of
intermediaries and the number and type of marketing functions performed by varies
marketing agents within the marketing chain. Consumers claim the marketing system is
incapable of availing high quality and value added poultry product in all sample markets.
Along with the numerous customs and social values associated with the consumption of
chicken meat and egg in Ethiopia, the aforementioned factors can potentially influence the
consumption pattern of the society. Due to the poor development of the village poultry
marketing system, the per capita consumption of bird meat and egg is very low in the country
compared with international and African standards and this figure do not even show slight
improvements in the past few decades.
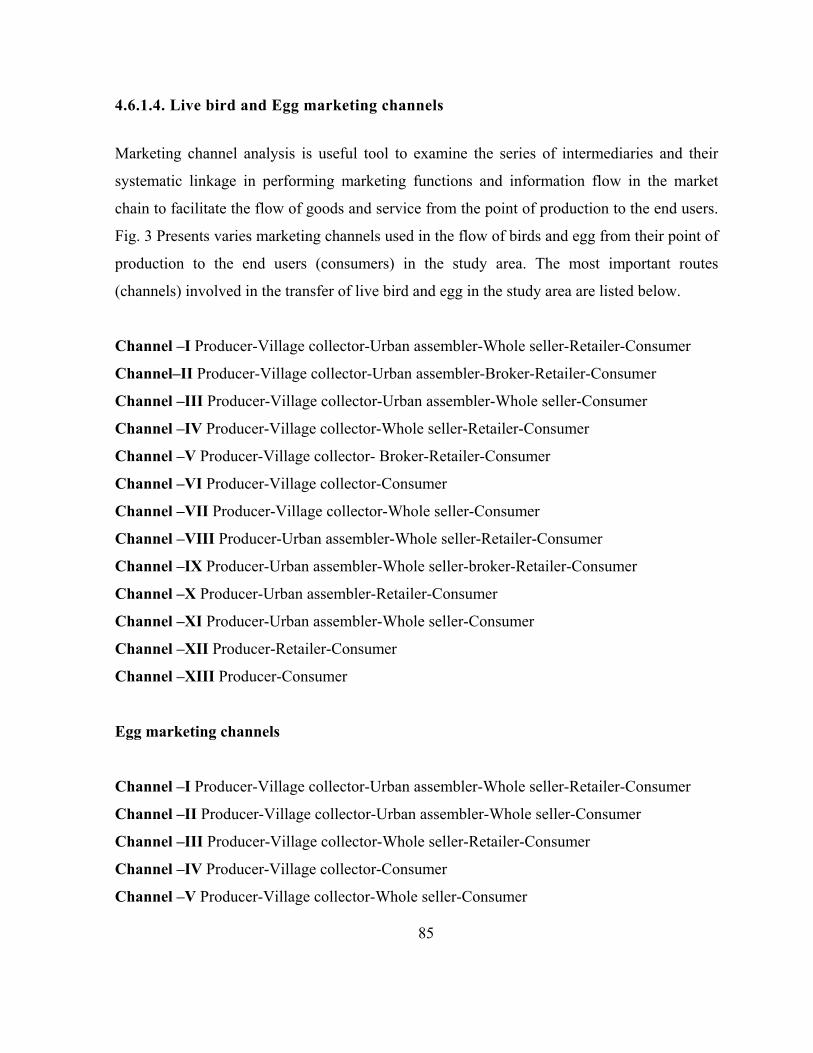
85
4.6.1.4. Live bird and Egg marketing channels
Marketing channel analysis is useful tool to examine the series of intermediaries and their
systematic linkage in performing marketing functions and information flow in the market
chain to facilitate the flow of goods and service from the point of production to the end users.
Fig. 3 Presents varies marketing channels used in the flow of birds and egg from their point of
production to the end users (consumers) in the study area. The most important routes
(channels) involved in the transfer of live bird and egg in the study area are listed below.
Channel –І Producer-Village collector-Urban assembler-Whole seller-Retailer-Consumer
Channel–ІІ Producer-Village collector-Urban assembler-Broker-Retailer-Consumer
Channel –ІII Producer-Village collector-Urban assembler-Whole seller-Consumer
Channel –IV Producer-Village collector-Whole seller-Retailer-Consumer
Channel –V Producer-Village collector- Broker-Retailer-Consumer
Channel –VІ Producer-Village collector-Consumer
Channel –VII Producer-Village collector-Whole seller-Consumer
Channel –VIІІ Producer-Urban assembler-Whole seller-Retailer-Consumer
Channel –ІX Producer-Urban assembler-Whole seller-broker-Retailer-Consumer
Channel –X Producer-Urban assembler-Retailer-Consumer
Channel –XI Producer-Urban assembler-Whole seller-Consumer
Channel –XII Producer-Retailer-Consumer
Channel –XIII Producer-Consumer
Egg marketing channels
Channel –І Producer-Village collector-Urban assembler-Whole seller-Retailer-Consumer
Channel –ІІ Producer-Village collector-Urban assembler-Whole seller-Consumer
Channel –ІII Producer-Village collector-Whole seller-Retailer-Consumer
Channel –IV Producer-Village collector-Consumer
Channel –V Producer-Village collector-Whole seller-Consumer
86
Channel –VІ Producer-Urban assembler-Whole seller-Retailer-Consumer
Channel –VІІ Producer-Urban assembler-Retailer-Consumer
Channel –VIII Producer-Urban assembler-Whole seller-Consumer
Channel –IX Producer-Whole seller-Retailer-Consumer
Channel –X Producer-Retailer-Consumer
Channel –XІ Producer-Consumer
The outputs of marketing system in village poultry subsector (live bird and egg) are reached
to the final end users in many interlinked channels as in shown by marketing chain map (Fig.
3). According to the information gathered from key informant discussion very little (less than
one percent) portion of the birds and egg transacted in the market chain have passed through
value addition process which creates form utility (processing function). The long broken lines
and black solid lines in the marketing chain map refers to alternative paths used in the flow of
egg and live birds from the point of production to the end users respectively. The relative
importance and competence of varies channels is described by the percent share of each
channel in the transfer of bird and egg, among others, across the different marketing stages in
the marketing chain map. There exist relatively long channels in Alaba special woreda due to
the involvement of brokers in Addis Ababa terminal market that are virtually nonexistent in
Dale and Awassa markets. In Alaba special woreda the channels that engage the involvement
of brokers play crucial role in the transfer of the product from the origin to the final
consumers. Detailed analysis of the marketing costs and benefits of participants in the
marketing system involving Hotels and restaurants, processors, and supermarkets (fine broken
lines in marketing chain map) is not included in the analysis of margins and costs due to the
difficulty of obtaining data. But as we can see from the marketing chain map of the subsector
(Fig. 3), these channels have contributed much (as in shown by the percent share of these
actors) in the transaction of the produce between the production and consumption ends.
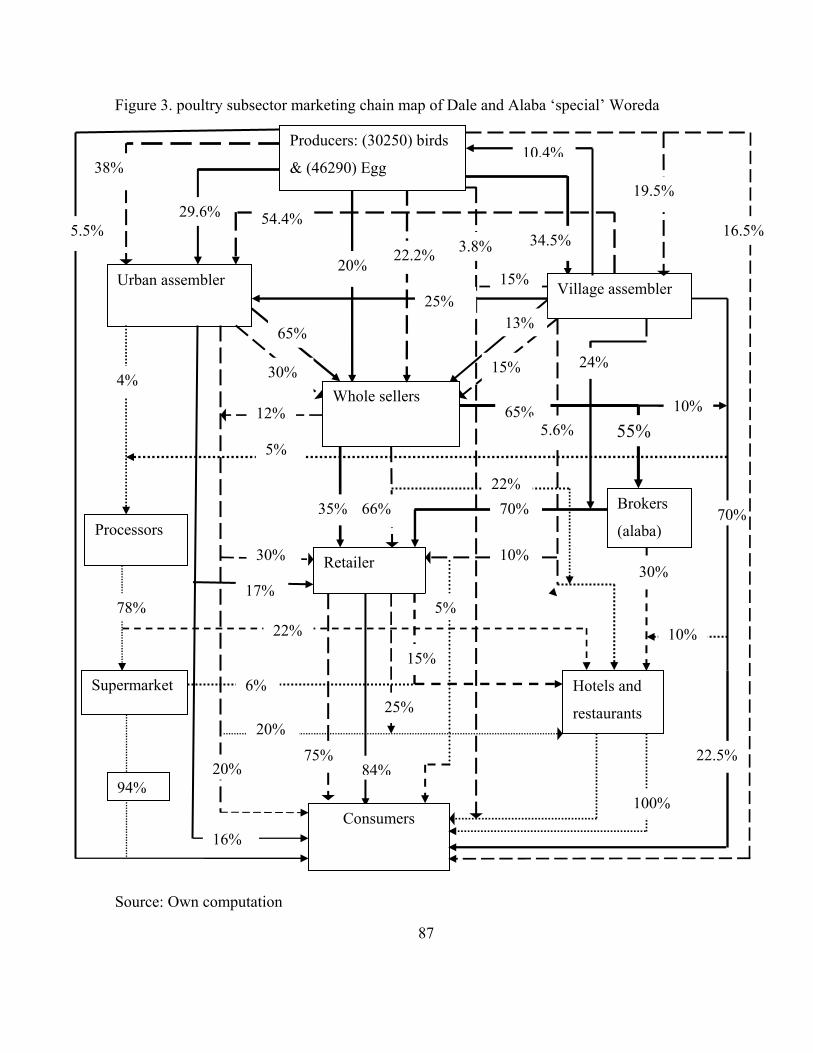
87
Figure 3. poultry subsector marketing chain map of Dale and Alaba ‘special’ Woreda
Source: Own computation
Village assembler Urban assembler
Whole sellers
Processors
Brokers
(alaba)
Retailer
Supermarket Hotels and
restaurants
Consumers
55%
34.5%
19.5% 29.6%
38%
20% 22.2% 5.5%
25%
15%
65%
30%
13%
65% 10%
22.5% 84%
16%
10%
35%
10.4%
17%
4%
5%
70%
30%
24%
15%
100% 94%
78% 22%
54.4%
5.6%
10%
5%
15%
12%
75% 20%
30%
20%
22%66%
25% 6%
16.5% 3.8%
70%
Producers: (30250) birds
& (46290) Egg

88
4.6.1.5. Traders concentration ratio
Structure of a marketing system refers to the size and market share of firms, relative ease of
free entry and exit from the marketing chain, degree of product differentiation and the degree
of market transparency among the chain participants within a given subsector. Concentration
ratio, potential entry and exit barriers, degree of product differentiation and quality and
availability of marketing information have been analyzed to evaluate the market structure of
the subsector in sample markets. Traders’ market concentration ratio was calculated for the
wereda and regional markets. Table 23 shows bird and egg traders’ concentration ratio for
Yirgalem, Alaba and Awassa markets. The analysis is made for bird and egg traders in sample
market places. Most traders in the two sample woreda visited local markets to buy birds and
egg and the concentration measures are calculated excluding local markets to avoid double
counting.
Table 23. Chicken and egg traders’ concentration ratio in sample markets
Markets places Traders’ concentration ratio (%)
Trader type Bird traders’ Egg traders
Awassa (regional market) 39.00 38
Yirgalem (woreda market) 26.22 98
Alaba (woreda market) 59.73 93
Source: own computation
According to the finding presented in the above table bird buyers are concentrated (59.7%) of
the total bird supply in Ababa woreda. This figure show strong oligopolistic power in live bird
trading in Alaba woreda. This is due to the fact that there are two bird traders in the woreda
who export live birds to Addis Ababa market (destination market) without any limit. But in
Awassa and Yirgalem market the percent share of traders is moderately concentrated within
the hands of few traders.

89
With regard to the attributes of the subsector organization, most traders (about 95%) have
similarly organized in terms of the firms’ location, timing of marketing functions undertaken,
and the clustering of these functions, the number and type of channels used and the type of
exchange used that might influence the structure of the village poultry marketing system. And
this might in turn influence the conduct of firms and thus affecting the competiveness of the
marketing chain. About 5% of the sample traders (in Alaba market) are organized in a
different way concerning the aforementioned characteristics such as the location, timing and
clustering and type of marketing functions undertaken (transportation, storage, packaging and
the type and payment arrangements) by these category of chain actors and their institutional
arrangements alter the conduct of most marketing actors in the respective market channels.
Informal discussions with these traders confirmed that they have performed different types of
marketing functions in undertaking the physical, exchange, and other marketing functions.
4.6.1.6. Condition of entry and exit to live bird and egg trading
Barriers to enter to and exit from a given marketing system influence the structure of
marketing system. Licensing procedure and the associated cost incurred, information access,
and price and demand fluctuation can be the possible entry and exit barriers to live bird and
egg trading in the study area. About 63% of traders replied that their source of information on
price, demand and supply is other traders and hence information access is among one of the
potential entry barriers in bird marketing system.

90
Table 24. Entry barriers mentioned by bird egg traders
Entry barriers Category (%) Role of the traders (%)
Total Rural assembler
Whole seller Retailer Secondary
trader
Trend of
finance access
Improved 5.88 2.94 2.94 2.94 23.53
Deteriorated 14.71 0.00 0.00 2.94 23.53
No change 17.65 2.94 11.76 20.59 52.94
Major problem
to enter
chicken market
Lack of capital 23.53 2.94 5.88 5.88 44.12
Lack of information 0.00 2.94 8.82 8.82 20.59
Lack of warehouse 8.82 0.00 0.00 5.88 14.71
Coincide with school time 8.82 0.00 0.00 2.94 20.59
Information on
price
Other traders 25.71 2.86 0.00 20.00 62.86
Personal observation 14.29 2.86 14.29 5.71 37.14
Information on
demand
Other traders 25.71 2.86 0.00 20.00 62.86
Personal observation 14.29 2.86 14.29 5.71 37.14
Information on
supply
Other traders 25.71 2.86 0.00 20.00 62.86
Personal observation 14.29 2.86 14.29 5.71 37.14
Source: Own computation
According to the information from the informal survey of traders, there is no trading license
requirement in all sample markets. Most live bird and egg traders (94.3%) in Awassa and
Yigalem markets have no any trading license at all. And none of the traders pays check point
fee in the survey period when transporting their birds and eggs across market places. But there
are two traders in Alaba market who have bird trading license and pay annual tax even though
there is no formal trading license requirement in the market and they reply that they face
competition with non licensed traders because there is no barriers to enter and exit the market
due license requirement.
Most traders in the sample markets replied that live bird and egg trading is constrained by low
or virtually nonexistent formal capital (credit) access and this might be possibly an entry

91
barrier particularly for the full time bird and egg traders. Above all the availability and quality
of information access could be one entry barrier in the marketing system. Table-25 presents
trend of credit access, source and availability of marketing information by bird and egg
traders in the sample markets. According to this result lack of capital, quality and source of
marketing information and absence of storage facility are listed in order of importance in the
sample markets as the main entry barriers in bird and egg trading in the sample markets.
4.6.2. Conduct of traders in poultry marketing system
Market conduct refers to the exchange practice and pricing behavior of the marketing firms
that make up the industry to examine the influence of the existing market structure on the
market conduct and the bargaining power of marketing actors in the marketing system. Here
in this analysis the market conduct of firms in the subsector have been analyzed using
information like selling and buying behaviors and price setting strategy of sample traders have
been analyzed. Furthermore type of exchange used, supply, demand, and price trend forecast,
information and quality specification, timing and means of exchange and response to the
anticipated changing environment.
According to the result obtained from the market survey presented in Table 25 About 77% of
the respondent replied that the purchasing price of bird is set by buyers in the sample market.
Almost 100% of the sample traders agreed that the purchasing price of birds is entirely
dependent on demand and supply of birds in the market day. All sample traders also confirm
that the purchasing price of birds cannot be clearly identified until the final transaction took
place. The selling price of bird is set by a combination of buyers, negotiation and also demand
and supply balance of birds in the market day (Table 25). Provision of better price than others
and use of strong negotiation word power and varies combination of these two strategies are
applied by most bird and egg traders to attract buyers and sellers. Except two traders in Alaba
market (5.7% of the total respondents) who receive prices already set by brokers in Addis
Ababa (terminal market for Alaba woreda market), all sample respondents transact their birds
on cash payment bases in all sample markets (94.3%) at the time of transaction.

92
Unlike bird trading, the price setting strategy in egg market is better in terms of price setting
and information access. The price of egg is not that much volatile as in observed in live bird
trading. According to the finding of the market survey, the price of egg is set earlier in the
market day based on the price information in the destination market (Awassa market). There
are no significant variations in egg traders’ response regarding egg traders’ marketing
behaviors (conduct measures) among the sample respondents as in observed by live bird
marketing participants. Regarding product differentiation, very few actors involved in
processing function add values to alter the type of the product they serve for consumers.

93
Table 25. Buying, selling and pricing strategy of live bird traders in sample markets
Marketing strategy Marketing behavior of traders (%)
Market place Awassa Yirgalem Alaba Total
Who set the purchase
price of chicken in 2000?
Buyer 6.67 26.67 43.33 76.67
Seller 16.67 6.67 0.00 23.33
How is the purchase price
set?
Demand & supply 23.33 33.33 43.33 100.00
Time of purchasing price
of chicken set
At the time of
Purchase
23.33 33.33 43.33 100.00
Who decide your chicken
selling price?
Buyers 0.00 0.00 22.86 22.86
Negotiation 20.00 42.86 14.29 77.14
How is your chicken
selling price set?
Demand and supply 6.67 26.67 43.33 76.67
Negotiation 16.67 6.67 0.00 23.33
After sale at terminal
market by brokers
0.00 0.00 2.00 5.70
How do you attract your
suppliers?
Provide better price 12.50 28.13 28.13 68.75
Negotiation power 3.13 9.38 3.13 15.63
Better price& negotiation 6.25 0.00 9.38 15.63
How do you attract your
buyers?
Provide better price 0.00 28.13 6.25 34.38
Negotiation power 15.63 3.13 15.63 34.38
By visiting them 0.00 6.25 9.38 15.63
Better price& negotiation 6.25 0.00 9.38 15.63
Type of payment Cash 100 100 75 94.3
Credit 0 0 25 5.7
Source: Own computation

94
4.6.3. Performance of poultry marketing system 4.6.3.1. Marketing costs of traders
The marketing cost of live bird and egg trading for varies marketing stages is calculated and
depicted in Table 26. In live bird trading the highest average marketing cost of varies trader
category is registered by labor cost including the traders opportunity cost in all categories of
traders that is 2.2 birr/bird. The next highest average marketing cost in live bird trading is
attributed to storage los cost that is 1.5 birr/bird. The storage cost is due to diseases, predation
and theft in the course of the storage period (mostly between two consecutive market days).
This is due to the periodic nature of local markets in most of rural parts of the country that
imposes traders to store the birds and egg for a longer period of time. Feed and water cost,
loading and unloading cost and transportation costs are worthwhile to be mentioned as they
have significant contribution to the transaction cost involved in chicken trading. Urban
assemblers or secondary traders and whole sellers incur the highest marketing cost in bird
trading business accounting 3.3 and 2.8 birr per bird respectively. The average transaction
(marketing) cost in the flow of bird from the point of production to the final consumer is 2.6
birr/bird. Labor and transportation cost in egg marketing constitute the greater portion of the
total marketing cost accounting 0.06 birr/egg each. The average marketing cost in bird trading
in all traders category is about 0.13 birr per egg. Out of whom rural assemblers and secondary
traders incur the highest marketing cost in the flow of bird from the point of production to the
end users accounting 0.15 and 0.14 birr per egg respectively. Higher marketing cost by actors
in marketing channels reduces the relative competence of the marketing channel in the market
chain.
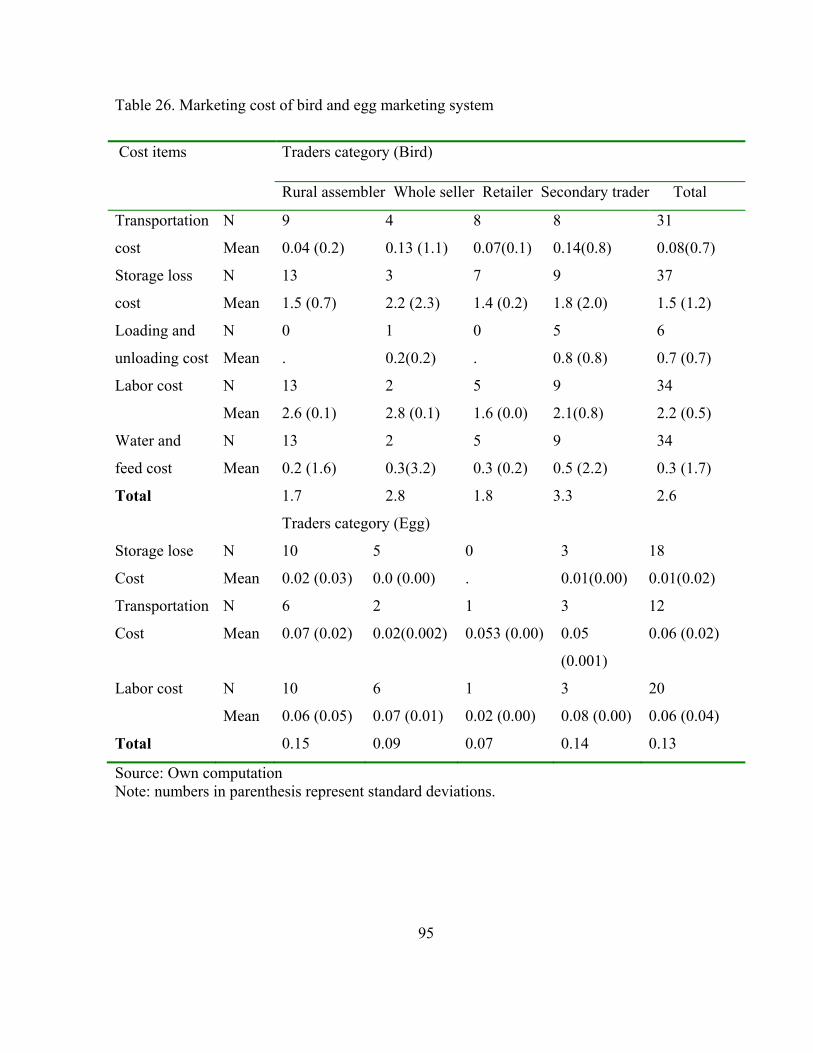
95
Table 26. Marketing cost of bird and egg marketing system
Source: Own computation Note: numbers in parenthesis represent standard deviations.
Cost items Traders category (Bird)
Rural assembler Whole seller Retailer Secondary trader Total
Transportation
cost
N 9 4 8 8 31
Mean 0.04 (0.2) 0.13 (1.1) 0.07(0.1) 0.14(0.8) 0.08(0.7)
Storage loss
cost
N 13 3 7 9 37
Mean 1.5 (0.7) 2.2 (2.3) 1.4 (0.2) 1.8 (2.0) 1.5 (1.2)
Loading and
unloading cost
N 0 1 0 5 6
Mean . 0.2(0.2) . 0.8 (0.8) 0.7 (0.7)
Labor cost N 13 2 5 9 34
Mean 2.6 (0.1) 2.8 (0.1) 1.6 (0.0) 2.1(0.8) 2.2 (0.5)
Water and
feed cost
N 13 2 5 9 34
Mean 0.2 (1.6) 0.3(3.2) 0.3 (0.2) 0.5 (2.2) 0.3 (1.7)
Total 1.7 2.8 1.8 3.3 2.6
Traders category (Egg)
Storage lose
Cost
N 10 5 0 3 18
Mean 0.02 (0.03) 0.0 (0.00) . 0.01(0.00) 0.01(0.02)
Transportation
Cost
N 6 2 1 3 12
Mean 0.07 (0.02) 0.02(0.002) 0.053 (0.00) 0.05
(0.001)
0.06 (0.02)
Labor cost N 10 6 1 3 20
Mean 0.06 (0.05) 0.07 (0.01) 0.02 (0.00) 0.08 (0.00) 0.06 (0.04)
Total 0.15 0.09 0.07 0.14 0.13

96
4.6.3.2. Marketing margins in bird and egg marketing chain
Table 27 summarizes marketing margins maintained by each actors in varies bird and egg
marketing channels. Total gross marketing margin in bird trading is highest in channels: II, V,
VI, and VIII and they account a TGMM of 38.3 each. Rural assemblers enjoy the highest net
marketing margin that is 42.9 in channel II followed by urban assemblers who maintain a
NMM of 40.5 in channel V and VI. Producers share from the price paid by consumers is
highest in channel III which accounts 76.3% of the price paid by consumers. The lowest net
marketing margin is associated with rural assemblers in channel III of bird marketing chain.
Table 27. Marketing margins maintained by marketing actors in bird and egg marketing chain
Bird trader І ІІ ІІІ ІV V VI VII VIII IX X XI XII
TGMM 27.5 38.3 23.7 27.5 38.3 38.3 27.5 38.3
NMMra 24.4 42.9 19.2
NMMua 40.5 40.5 23.0
NMMws 33.0 20.5 33.0 38.0
NMMrt 19.6 34.5 34.5 34.5
GMMp 72.5 61.7 76.3 72.5 61.7 61.7 72.5 61.7
Egg traders
TGMM 36.0 36.0 36.0 15.8 33.3 36.0 36.0 36 33.3
NMMra 10.4 12 11.58 6.4
NMMua 8 8 8.3
NMMws 29.6 16.8 20.0 24.2 13.6 16.8
NMMrt 13 19
GMMp 64.0 64.0 64.0 84.2 66.7 64.0 64.0 64 66.7
Source: Own computation

97
The highest producer share is observed in channel V of egg marketing chain that is 84.2 out of
the price paid by consumers. The highest net marketing margin in egg marketing chain is
observed in channel I by the whole sellers that is 29.6. The lowest net marketing margin in
egg marketing chain is observed in channel VII that accounts 6.4 and this is maintained by
rural assemblers. The marketing margin analysis of the subsector revealed that producers
share and net marketing margin maintained by varies chain actors are remarkably varied
across the different marketing channels.
4.6.3.3. Marketing profit of live bird and egg trading
The marketing profit of each bird and egg traders’ category is summarized in annex-1 and 2
respectively. The highest profit in bird marketing chain is attained by retailers’ category in
channel VI which accounts 12 birr per bird. This highest profit was made possible by the
retailers due to the exclusion of village collectors and whole sellers from participation in the
market channel. But urban assemblers in channel V account 9.2 birr/bird which is the highest
marketing profit for these traders’ category across the total bird marketing channel which
comprises the marketing chain. This highest profit is maintained by urban assemblers due to
the fact that they directly purchase the birds from producers in local markets and sold for
whole sellers avoiding the involvement of rural assemblers in this particular marketing
channel. Whole sellers made their maximum profit (8.7 birr/bird) in channel II and minimum
profit (1.7 birr/bird) in channel VI. In channel II the maximum profit (9 birr/bird) is
maintained by rural assemblers because in this channel this group of the traders’ category
bypasses urban assemblers and sold directly to whole sellers. According to the result
presented in Annex.2 the price and profit margins maintained by each trader category in egg
trading is more consistent than bird trading. The highest profit is made possible (0.29
birr/egg) by whole sellers’ category in channel VI in which case whole sellers by from rural
assemblers and directly sold to consumers. Rural assemblers attained the lowest marketing
profit in channel VII of the egg marketing chain.

98
4.7. Determinants of Market Participation Decision and Intensity of Supply Farmers’ decision to participate in village bird and egg supplied to the market and the
underlying intensity of the value obtained from the supply is determined by the following
hypothesized variables.
Table 28. Description of the hypothesized variables
Variable Description Type Value
PARTCIPAT Participation bird or egg supply Dummy 0-no and 1-yes
VALBRDSD Value of bird and egg sold Continuous Value of bird and egg in birr
AGHD Age of the household head Continuous Number of years
FAMSIZ Family size over 14 years old Continuous Family members over 14 yrs
YREXPFM Years of experience in farming Continuous Number of years
ANRVFMG Annual revenue from farming Continuous Amount of income in birr
ANRVOFI Annual revenue from off-farm Continuous Amount of income in birr
LANDHLD Total land holding (hectare) Continuous Size of land holding (hec)
PLTWND Number of bird owned Continuous Number of bird kept
DCEPLMKT Nearest poultry market Continuous Distance in kilometer
AVLAGPRC Average lagged price of bird Continuous Annual lagged price in birr
MRKTINFO Market information access Dummy 0-no and 1-yes
EDCATN Education level of the household Dummy 0-no and 1-yes
SXHDHD Sex of the household head Dummy 0-male and 1-female
FEDSPLT Feed supplement Dummy 0-no and 1-yes
EXOCHKN Exotic breed availability Dummy 0-no and 1-yes
TAKCRDT Credit taken Dummy 0-no and 1-yes
GTEXTION Extension service access Dummy 0-no and 1-yes
PRPCKNKP Purpose of bird kept Dummy 1-consumption and 2- sell
Source: own computation

99
Table 28 presents the dependent variables and the independent variables that influence the
producers’ decision to participate or not in the supply of bird and egg to the market and the
intensity of value of the volume supplied to the market. Before running the selection model
and the centered regression it is crucial that the repressors should be checked for multi-
collinearity and degree of associations for the continuous and dummy variables using VIF and
CC techniques respectively (Annex.1 and 2). According to the result obtained from the
analysis there is no strong multi co linearity and degree of association between the continuous
and dummy variables respectively.
Table 29. presents the first step of the selection model that is the results obtained from the
probit model which analyses those factors that determine the farmers’ decision to participate
in bird and egg supply to the market. This model also helps to calculate the Inverse mills ratio
that is used in correcting the selectivity bias incorporates the effect of participation decision in
to the supply function. According to the results of the probit model (Table 29), the most
important factors that determine the producers’ decision to participate in the supply of bird
and egg to the market are identified and presented in Table 29. Three independent variables
namely number of bird kept, feed supplement and purpose of bird keeping has been found to
be highly significant (<1%) in the participation decision. There are also two repressors
namely family size and sex of the household that head affect the participation decision at 5
percent level of significance.
Sex of the household head (SXHHD): Sex of the household head has a significant and
positive effect (< 5%) on the farmers’ participation decision. This implies that being female
headed household would increases the probability of that family to supply poultry product to
the market by 0.655 percent.
Family size (FAMSIZ): Family size has significant and positive effect (< 5%) on the
farmers’ participation decision to sell their produce or not. This implies that as the number of
family members increased by one the probability of that family to become seller poultry
product would increase by 0.22 percent.
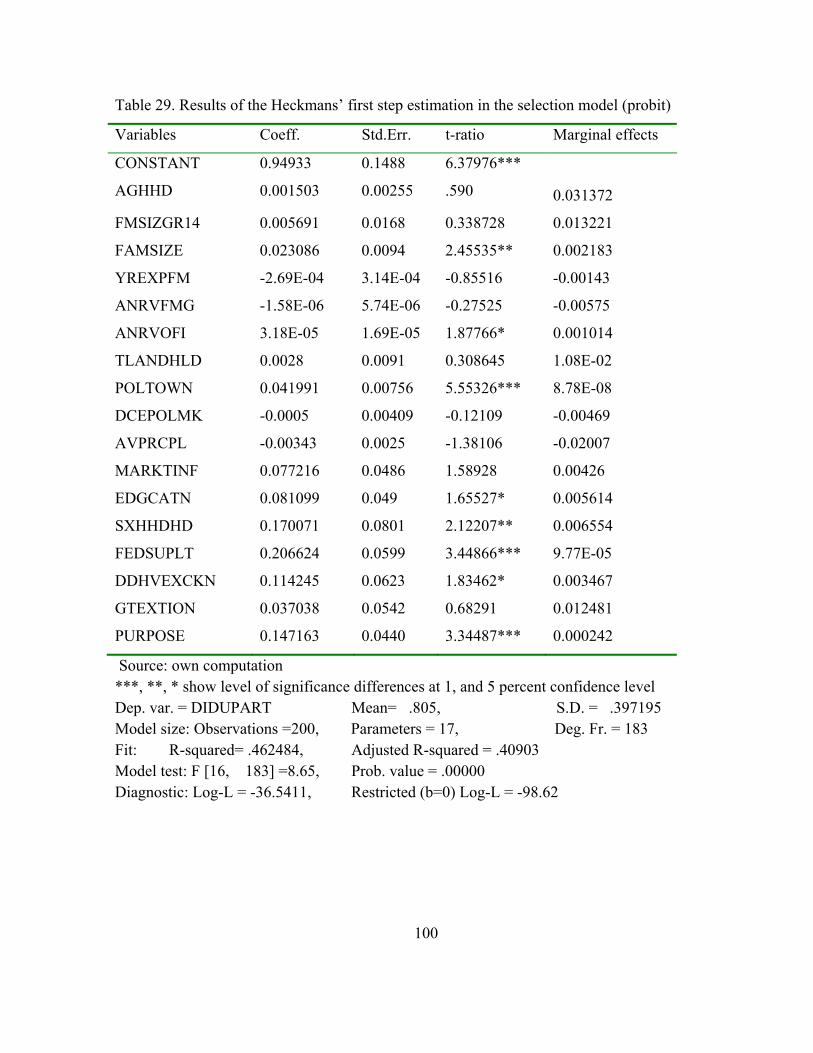
100
Table 29. Results of the Heckmans’ first step estimation in the selection model (probit)
Variables Coeff. Std.Err. t-ratio Marginal effects
CONSTANT 0.94933 0.1488 6.37976***
AGHHD 0.001503 0.00255 .590 0.031372
FMSIZGR14 0.005691 0.0168 0.338728 0.013221
FAMSIZE 0.023086 0.0094 2.45535** 0.002183
YREXPFM -2.69E-04 3.14E-04 -0.85516 -0.00143
ANRVFMG -1.58E-06 5.74E-06 -0.27525 -0.00575
ANRVOFI 3.18E-05 1.69E-05 1.87766* 0.001014
TLANDHLD 0.0028 0.0091 0.308645 1.08E-02
POLTOWN 0.041991 0.00756 5.55326*** 8.78E-08
DCEPOLMK -0.0005 0.00409 -0.12109 -0.00469
AVPRCPL -0.00343 0.0025 -1.38106 -0.02007
MARKTINF 0.077216 0.0486 1.58928 0.00426
EDGCATN 0.081099 0.049 1.65527* 0.005614
SXHHDHD 0.170071 0.0801 2.12207** 0.006554
FEDSUPLT 0.206624 0.0599 3.44866*** 9.77E-05
DDHVEXCKN 0.114245 0.0623 1.83462* 0.003467
GTEXTION 0.037038 0.0542 0.68291 0.012481
PURPOSE 0.147163 0.0440 3.34487*** 0.000242
Source: own computation ***, **, * show level of significance differences at 1, and 5 percent confidence level Dep. var. = DIDUPART Mean= .805, S.D. = .397195 Model size: Observations =200, Parameters = 17, Deg. Fr. = 183 Fit: R-squared= .462484, Adjusted R-squared = .40903 Model test: F [16, 183] =8.65, Prob. value = .00000 Diagnostic: Log-L = -36.5411, Restricted (b=0) Log-L = -98.62

101
Total number of bird kept (POLTOWN): Bird keeping in rural areas is characterized by
many integrated socio cultural values and this make the sub sector to be considered as one of
the most important activities undertaken in rural farm households. As it was hypothesized,
this variable affects the dependent variable positively. The number of birds kept within the
family members highly influences (<1%) the producers decision in favor of participating on
bird and egg supply.
Feed supplementation (FEFSUPL): Most literatures agreed that supplementation of feed for
birds in scavenging type of production system significantly increase their productivity. The
above result also revealed that feed supplementation highly affects the farmers’ decision of
bird and egg supply positively at one percent level of significance. When the family
supplements feed for his scavenger birds, the probability of the producers’ decision in favor of
participation in supplying birds and egg increases by about 0.001 percent.
Purpose of bird keeping (PRPBRDKP): It is also stated that the purpose of bird keeping in
rural areas of the country is complex and diverse. According to this finding keeping birds for
the purpose of business activity (selling) highly influences (at 1% level of significance) the
farmers’ decision to supply in a positive way. Keeping poultry for sale increases the
probability of participation in the supply of poultry products by about 0.0242 percent.

102
OLS estimation of the selection model
According to Heckman (11979) a sample selection bias refers to the problems where the
dependent variable is only observed for a restricted and non random sample. Ordinary least
square estimation hence leads to both biased and inconsistent estimates of the parameters. To
overcome the problem Heckman suggested adding inverse mills ratio (sometimes referred as
hazard rate) as a regressor in to the model enables the parameter estimates become unbiased
and inconsistent. The effect of participation decision also on the level of supply is indicated
on the parameter estimates of the IMR which is obtained from the probit mode in the first step
of the Heckman two step procedures. Table 30 summarizes the result of the ordinary least
square estimation corrected for the selection bias (second step in Heckman’s selection model).
Average annual price of bird (lagged), Sex of the house hold head, Feed supplementation,
Credit use for poultry keeping, purpose of bird keeping and selectivity bias correction
(LAMBDA) are found to affect the value (in birr) of the volume of birds and egg supplied to
the market positively at higher statistical level of significance.
Inverse mills ratio (LAMBDA): The p-value of this variable is almost zero as in presented in
Table 30. This implies that the correction for selectivity bias is highly significant at 1% level
of significance. The coefficient of this variable is interpreted as an observation is being a
participant in poultry supply, the value obtained from poultry keeping and marketing
increases by 1.67 birr.
Feed supplementation (FEDSUPLT): It was hypothesized that Feed supplementation for the
scavenging bird production system positively affect the value obtained from the sale of birds
and egg as it was hypothesized and is significantly and positively affected the value earned
from birds and egg supply at 5% level of significance. As supplement of feed to scavengers’
increases by an observation, the value obtained from the supply of bird and egg increases by
169.89 birr.

103
Table 30. OLS estimates of the supply function corrected for selectivity bias
Variables Coeff. Std.Err. t-ratio P-value
AGHHD 1.46893 3.62409 0.405323 0.685719
FAMSIZGR 8.19162 21.8137 0.375526 0.707709
FAMSIZE 2.65908 12.4118 0.214238 0.830603
YREXPFM 0.05722 0.405087 0.141254 0.887826
ANRVFMG -0.00983 0.007463 -1.31715 0.189454
ANRVOFFI 0.030283 0.022043 1.37378 0.171209
TLANDHLD -18.0264 12.0297 -1.49849 0.135748
POLTOWN 6.5819 10.557 0.623465 0.533764
AVPRCBRD 22.927 3.5056 6.54013*** 0.000000
INFOACCS 40.6171 64.4812 0.629906 5.30E-01
EDGCTN 103.224 67.649 1.52587 1.29E-01
SXHDHD 425.366 116.669 3.64593*** 0.000348
FEEDSUPL 169.893 80.9518 2.09869** 0.037232
DHVEXCHN 11.3571 80.9815 0.140244 0.888623
TAKCRDT 447.646 106.128 4.218*** 3.89E-05
EXTNSERCE 110.102 71.1477 1.54751 1.23E-01
PRPSBRDKP 182.597 62.4832 2.92234*** 3.92E-03
LAMBDA 1.69967 0.275577 6.16767*** 3.78E-09
Source: own computation
***, **, * show level of significance differences at 1, and 5 percent confidence level
Dep. var. = VALTOTAL Mean= 452.604, S.D. = 748.0328
Model size: Observations =200, Parameters = 18, Deg. Fr. = 182
Fit: R-squared= .705390, Adjusted R-squared = .6761
Model test: F [17, 182] =24.08, Prob. value = .00000
Diagnostic: Log-L =-1484.5655, Restricted (b=0) Log-L = -1606.7758

104
Average lagged price of bird (AVLAGPRC): The average lagged price of birds influence
the value obtained from the sale of live birds and egg significantly (<1%) and positively. An
increase in the average lagged price of local chicken by one birr the value obtained from the
supply of chickens and egg to the market increases by 22.93 birr.
Sex of the house hold head (SXHD): Sex of the house hold head also significantly (<1%)
and positively affects the value obtained from the sale of live birds and egg. Female headed
households in the observation attain about 23 birr additional income from the sale of chickens
and eggs to the market.
Credit taken for poultry production (CRDT): Credit use by the sample respondents
significantly (<1%) and positively affects the value obtained from the supply of live birds and
egg to the market. The value obtained from the sale of chickens and eggs for sample
respondents who access credit has shown an increase by about 447.6 birr than those who do
not access credit.
Purpose of bird keeping (PRPBRDKP): Purpose of bird keeping by the sample respondents
has been found that it has significant (<1%) and positive impact on the value of volume of
birds and egg sold in favor of keeping village chicken for selling purpose. Those sample
respondents who keep poultry for selling purpose achieve additional revenue of 182.6 birr
than respondents who keep chickens without clearly defined purpose.

105
4.8. Constraints and Opportunities of Village Poultry Keeping and Marketing
4.8.1. Constraints and opportunities of village poultry keeping Village poultry production system is the most important economic activity in rural poor
households. It serves as a starter capital stock, source of easily disposable cash income, source
of protein and also has crucial social and cultural values.
Disease is among the most distressing constraints in the production and marketing of village
poultry product. According to the farmers’ survey, about 37 percent of the total respondent
pointed out that disease is the most important constraint in the subsector. They also added that
New castle disease (NCD) is most common among others in the study area. Absence of day
and night housing, variable inputs and predation are also mentioned economically important
challenges in the production and marketing of local birds and egg.

106
Table 31. Constraints and opportunity of bird keeping and marketing
Major problems in bird keeping
N=118 Frequency Percent
Disease 104 36.95
No day and night housing 57 29.21
No Exotic breed and compound feed 35 17.27
Predator 29 14.29
Price variation 4 2
Low finance, lack of awareness 10 5
Major problems in bird marketing (N=142)
No marketable surplus 5 2.5
Volatile price 18 8.9
Seasonal demand 41 20.2
Low market access 53 26.1
Lack of information 25 12.3
Major opportunity in bird keeping(N=82)
Require less labor and capital 16 7.9
Require less management 28 13.8
High but irregular demand 38 18.7
Doesn't need large area, high skill 11 5.4
Source: Own computation Village poultry production also avail ample opportunities compared to other alternative
investments in rural areas particularly. It requires less labor and capital, management and
technical skill in which rural communities have comparative advantages. The increasing price
of animal products within and abroad the country also provide real and sustainable business
opportunity for the rural poor.

107
4.8.2. Constraints and opportunities of live bird and egg trading
According to the result presented in Table 32, the most frequently mentioned constraints and
opportunities of live bird and egg trading are identified by sample traders. Absence of reliable
and adequate information on price, shortage of supply is most frequently mentioned constraint
in both chicken and egg marketing system. About 65% and 45% of the sample chicken and
egg traders respectively replied that they face severe problem in getting adequate and reliable
information regarding the price and quantity (supplied and demanded) in the market places.
Table 32. Constraints and opportunities in live chicken and egg marketing system Variable Item Frequency
(bird traders)
Frequency
(egg traders)
Problems in
bird and egg
trading
Little and seasonal bird supply 51.43 31.43
Seasonal and inconsistent demand 31.43 11.43
Absence of transportation 27.14 27.54
Absence of storage facility 34.53 4.50
Absence of adequate and reliable information 65.45 45.45
Disease and absence of packaging material 23.55 38.56
Imperfect financial market 54.16 54.16
Theft 19.50 8.00
Predation 30.92 55.92
Opportunities
in bird
trading
Requires less capital & labor 30.30 39.30
Less barriers of entry and exit 53.64 67.64
Used as a starter capital 36.06 43.06
High profit margin and demand 18.70 28.70
Less risk 24.50 44.36
Source: Own computation

108
Absence of competitive financial market and little or/and inconsistent produce supply are
constraints mentioned markedly by both live bird and egg traders category in all sample
markets. Access to credit is equally constrained both live bird and egg marketing participants.
But low and irregular supply of produce is highly highlighted by live bird traders’ category
than the egg traders. Disease, theft and predation are also important marketing constraints in
chicken marketing system. Actors in egg marketing chain confirmed that packaging material
is significant treats in egg marketing chain actors. These constraints of the subsector chain
actors create systematic inefficiencies at different stages of the marketing functions across the
supply chain.

109
5. CONCLUSIONS AND RECOMENDATIONS
5.1. Conclusions This study was conducted primarily to analyze the marketing system of village poultry sub
sector. Structure, conduct and performance of village poultry marketing system were analyzed
to study the efficiency of the marketing system. Furthermore structure and component of
village poultry production cost of farmers had been analyzed. Support services of extension,
credit, input provision and market access of farmers in village poultry keeping and marketing
has also been analyzed. Determinants of farmers participation decision in the supply of birds
and eggs to the market and intensity of the volume of supply was analyzed and key
determinant factors were identified.
Regarding the structure of live bird and egg marketing system, there are about 14 and 11
marketing channels in live bird and egg marketing systems respectively. The concentration
measures in live bird and egg marketing system in Awassa (regional) live bird and egg
markets take values of 39 and 38 percent respectively and show that these marketing systems
are fairly concentrated in terms of few firms’ domination. The concentration measures of
Yirgalem and Alaba egg markets shows strongly concentrated taking values of 98 and 93
percent respectively. These figures imply that very few egg traders in the two woredas are
dominating the entire transaction process that adversely affects efficiency of egg marketing
system in the two markets. The concentration measure of Alaba live bird market also shows
moderate few firms’ dominance (60%) in the transfer of bird particularly to Addis Ababa
terminal market that in turn influences the conduct of other marketing actors in the market
imposing some sort of systematic inefficiency to the competitiveness of the marketing system.
Lack of information on price, supply and demand, low or lack of financial access and short
and inconsistent supply of live bird and egg are among the most influential entry barriers in
all sample markets mentioned by sample traders. The existing structure of marketing system
affects the conduct of marketing actors and hence the performance of the entire marketing
system. Table-24 presents the conduct of live bird and egg traders regarding the pricing and
exchange (buying and selling) behavior of traders and the type of payment used by the

110
marketing agents. Provision of better price, negotiation and combination of these two are
commonly used by most traders in buying and selling activities to attract their customers.
Most producers replied that they received prices already set by traders for their produce. It is
also observed that all most all traders perform the exchange functions themselves at cash
payment bases except few traders 5% in Alaba market whom sent their live birds to brokers in
Addis Ababa without priori agreed upon price. The brokers sell the birds based on the existing
market price at Addis Ababa terminal market and deduct brokerage fee of 2 birr/bird and send
the remainder for the traders. These traders have no any written agreement with the brokers
and the agreement is entirely based on mutual trust between the contracting parties and they
transact three to five thousand of live birds once a week. Informal discussions with this
traders revealed that they take this risk to reduce transaction cost.
The average marketing cost in the flow of live birds from the point of production to the final
consumer is 2.6 birr/bird. Urban assemblers or secondary traders and whole sellers incur the
highest marketing cost in bird trading business accounting 3.3 and 2.8 birr per bird
respectively. This is due to the fact that these trader categories visit many market places to
undertake their exchange functions adding the cost of transportation. The average marketing
cost in egg trading in all traders category is about 0.13 birr per egg. Higher marketing cost by
actors in marketing channels reduces the relative competence of the marketing channel in the
market chain.
Total gross marketing margin in bird trading is highest in channels: II, V, VI, and VIII and
they account a TGMM of 38.3 each. Producers share in bird trading from the price paid by
consumers is highest in channel III which accounts 76.3% of the price paid by consumers.
The lowest net marketing margin is associated with rural assemblers in channel III of bird
marketing chain. The highest producer share is observed in channel V of egg marketing chain
that is 84.2 percent of the price paid by consumers. The highest net marketing margin in egg
marketing chain is observed in channel I by the whole sellers group that is 29.6%. The
marketing margin analysis of the subsector revealed that producers share and net marketing
margin maintained by varies chain actors are remarkably varied across the different marketing
111
channels. The highest profit in bird marketing chain is attained by retailers’ category in
channel VI which accounts 12 birr per bird. The highest profit is made possible (0.29birr/egg)
by whole sellers’ category in channel VI in which case whole sellers by from rural assemblers
and directly sold to consumers. Rural assemblers attained the lowest marketing profit in
channel VII of the egg marketing chain. From the above analysis one can conclude that live
bird and egg trading are operating profitably and the distribution of the profit margin is
comparatively fair when compared to other agricultural commodities.
The most important constraints that the respondents (traders) highlighted in the poultry
marketing chain includes the short and inconsistent supply and demand of bird and egg in
markets. And informal discussion with consumers in the sample markets revealed that it is too
tedious to prepare meal using the live bird that can be found in the market. Thus we only
interested in it in the time of festivals as per the Ethiopian cultural traditional ‘doro wot
preparation. This is probably due to the fact that there is little or nonexistence of marketing
actors that participate in processing and other marketing functions that adds value by
changing the form of the product as per the consumers interest. The development of this
sector would have substantial contribution to the increasing demand of food items particularly
livestock products developing countries like Ethiopia.
It is also indicated that business development support services are almost nonexistent in
village poultry marketing system. This makes the marketing system inefficient in facilitating
the performance of marketing functions to be undertaken to maximize the output expected
from the sub sector while the subsector avails a profitable market niche. The cash rich and
time poor consumers need quality and value added products that can be hardly achieved
without the active involvement of firms that involved in the processing function and add form
utility to the product. If business development support services are developed and assist the
market participants, the short and inconsistent supply and demand problem that most traders
underline can be confronted by availing the product in all time, form and places to satisfy the
consumers need.

112
Village poultry production system in Ethiopia is characterized by very low input-output ratio
due to many systematically interlinked constraints. These include very low or no feed
supplementation, diseases, Housing and above all absence of clearly defined purpose for
keeping birds by rural farm families are among those bottlenecks for the inefficiently
competence of the subsector. The productivity of village poultry keeping by rural farm
families is very low compared to even African standards but according to the profitability
analysis, it is still profiTable About 50 percent of the eggs hatched by local chickens per
clutch were lost due to the low hatchability rate and low survivability rate of hatcheries.
Under even this poor management system the subsector provides atractive business activity
for all age and sex group of the society. It is also revealed that improving the feeding structure
using grain supplementation, housing and disease management, it is possible to achieve a
higher improvement in input-output ratio of village bird production system. But institutional
business development services in the study area are poorly developed to improve this situation
so that maximize the output expected from the sub sector.
According to the econometrics analysis, there are variations in the findings of the two
methods employed and correction of the selectivity bias is highly significant. Hence the result
of Hechmans two step procedure would have been used to identify variables that affect
producers participation decision and the level of poultry supply. The most important variables
affecting the producers’ participation decision on the supply of birds and egg to the market
and the volume of live bird and egg supply includes: total number of birds the family kept,
feed supplementation to local chickens, purpose of poultry keeping, family size, sex of the
household head and Credit use for the production and marketing of village poultry. These
variables are found to be economically important variables in determining the volume of birds
and eggs that the family supplly to the market. The inverse mills ratio estimated from the
probit model is highly significant and implying farmers’ participation decision has shown
significant and positive impact on the level of chickens and eggs supply in the study area.

113
5.2 Recommendations and Policy implications
It is indispensable to forward policy directions based on the findings of the study to formulate
strategies and intervene from the most appropriate edge of the supply chain. Based on this
understanding the following recommendations would have been made.
Live bird and egg traders replied that short and inconsistent supply in market places are the
most devastating constraints for the development of their business activity. Hence
intervention by the government or any interested body is compulsory aimed the improvement
of the volume and the consistency of the chicken and egg supply to the market.
Participants in poultry marketing system should be trained and supported about the
development of competitive marketing chain which give due attention to the efficiency of the
commodity chain based on trust and mutual interests and members should be committed and
favor the competence of the entire marketing chain rather than the individual interest.
An intervention by any interested organ should be made by the establishment and promotion
of chain actors involved in the physical marketing function of processing that adds value to
the product by changing the form of the product and helps the establishment of regular
demand in market places. There was only one actor in Awassa sample market who slaughter,
wash and packs live birds and supplied to supermarkets and this channel was the only one that
local birds passes value addition process (form utility) except dishes provision by very few
hotels at high prices. Thus promoting and developing the financial and technical capability of
such innovators would provide substantial contribution to the supply chain development.
Research and higher education institutions should give due attention to the preparation and
promotion of chicken fast food recipes as part of the research development programs hand in
hand with the genetic improvements of local breeds.
114
About 99 percent of the country’s poultry (meat and egg) supply constitutes local breeds from
rural farm families most of whom live farther away from market places and where most
public goods are in short supply. Thus improving the development of infrastructures in the
study areas in particular and the country as a whole would have solid implications in the
development of the supply chain.
It is also recognized that village chicken producers in the rural areas of the country did not
have clear boundary for their purpose of keeping chickens. According to the result of the
econometric analysis, purpose of chicken keeping and total number of birds kept within the
family significantly affected the farmers’ participation decision and level of poultry supplied
to the market. Thus extension advisors should be trained and involved actively at this spot by
equipping farmers about the profitability and the untapped productivity potential of village
poultry production system with minimal increment in inputs usage and management such as
application of supplementary feeding, separate night housing and veterinary services and
discouraging the broodiness time.
Interested pilot producers should be selected and assisted to undertake semi-intensive
production of local chicken under close supervision by the extension advisors. The selection
of target farmers should mainly focus on female headed households, large sized households,
and personal interest of the target groups to specialize in the business and intensive persuasion
should also be made priori before the intervention.
Village (local) poultry producers should also be trained about the optimum nember of local
chicken to be kept and assisted by availing credit facility for the production and marketing
local chickens as the number of chicken kept by farm households and access to credit are
important variables in determining the farmers participation decision and the level of chickens
and egg supplied to market places.

115
In most developing countries, the provision of business support services such as access to
credit, information, storage facility and training on the production and the functioning and
dynamic nature markets to the marketing actors should be provided by the government as
competitive establishment of these services is hardly practical with the existing poorly
developed marketing system particularly in agricultural products. These services are of course
entirely non-existent in the study areas at any stage of the market chain. So that the
government and other development partners should exert profound effort to assist the chain
actors in holistic manner.
116
REFFERENCES Abott, J.C., 1979. Marketing issues in agricultural development planning. In: R. Moyer and S. Hollander (eds). Markets and marketing in developing economics pp 87-116, Richard D. Irwin, Publishers. A. Jabbar, M., 2006. Trader Behaviour and Performance in Live Animal Marketing in Rural Ethiopian Markets. International Livestock Research Institute, Poster paper prepared for presentation at the International Association of Agricultural Economists conference, Gold Coast, Australia, August 12-18
Abbot, J.C. and Makeham, J.P., 1981. Agricultural Economics and Marketing in the Tropics. Wing Tai Cheung Printing Co. Ltd, Rome. 58p.
Alemu Yami and Tadelle Dessie, 1997. The Status of Poultry Research and Development. Research Bulletin No. 4. Poultry Commodity Research Program, Debre Zeit Agricultural Research Center, Alemaya University of Agriculture, Ethiopia.
Andargachew, K., 1990. Sheep Marketing in Central Highlands. An M.Sc Thesis Presented to the School of Graduate Studies of Alemaya University. Ethiopia. 117p.
Andrew, D., Jonathan, K. and Colin, P., 2008. Village chickens in household and national economies. World development report.
Ayelea, G., Abdul Jabbar, M., Teklewold , H., Mulugeta, E. and Getahun Kebedec, 2003. Seasonal and Inter-Market Differences in Prices of Small Ruminants in Ethiopia. Journal of Food Products Marketing , 12(4): 59-77.
Branckaert, R. and Guèye, E., 1999. FAO's Programme for Support to Family Poultry Production. In Poultry as a Tool in poverty Eradication and Promotion of Gender Equality - Proceedings of a Workshop. http://www.husdyr.kvl.dk/htm/php/tune99/24-Branckaert.htm
Branson, R. E. and Norvell, N., 1983. Introduction of Agricultural Marketing, McGraw Hill Book Company, New York. 365p.

117
Clodius, R. L. and W. F. Muller, 1961. Market structure analysis as an orientation for research in Agricultural Economics. Journal of Farm Economics, pp: 513-546. Cramer, G. L. and Jensen, W., 1982. Agricultural Economics and Agribusiness, 2nd Edition. McGraw Hill Book Company, USA. 222p.
Delgado, C., 1995. Africa's Changing Agricultural Development Strategies: Past and Present Paradigms As a Guide to the Future. IFPRI.
Delgado, C., Mark, R., Henning, S., Simeon, E. and Claude, C., 1999. Livestock to 2020: The Next Food Revolution. Food, Agriculture, and the Environment Discussion Paper 28. Washington, D. C.: International Food Policy Research Institute (IFPRI).
Delgado, C., Rosegrant, M., Steinfeld, H., Ehui, S., Courbois, C., 1999. Livestock to 2020 the next revolution. Food, Agriculture and Environment Discussion Paper 28.
Desta, S. and Coppock, L., 2000. Pastoral systems and small Ruminant production in the Borena plateau of southern Ethiopia. The opportunities and challenges of enhancing goats production in East Africa A conference held at Debub University, Awassa, Ethiopia, December, 10-12, pp. 89-95.
Ehui, S. and Steven J.S., 2000. Handbook of livestock statistics for developing countries, ILRI (International Livestock Research Institute).
Ehui, S., Benin, S. and Paulos, Z., 2003. Policy options for improving market participation and sales of smallholder livestock producers: A case study of Ethiopia. Paper submitted to the 2nd EAF International Conference on Contemporary Development issues in Ethiopia Addis Ababa, Ethiopia.
FAO (Food and Agriculture Organization), 1999. Market infrastructure planning. A guideline for decision-making, FAO, 141, Rome.
Gebremedhin, B., Dirk, H. and Jemaneh S., 2007. Heading towards commercialization? The case of live animal marketing in Ethiopia, International Livestock Research Institute (ILRI), Addis Ababa, Ethiopia.
Goetz, S. J., 1992. A Selectivity model of household food marketing behavior in Sub- Saharan Africa. Amrican Jornal of Agricultural Economics, 74(2): 444-52.

118
Granger, C.W.J., 1981. Some properties of time series data and their use in econometric model specification. Jornal of Econometrics. 16:121-130.
Greene W., 1993. Econometric Analysis. Second edition. Macmillan, New York, p. 791.
Greene, H.W., 2000. Econometric Analysis. 4th Edition. Prentice-Hall. Inc, London.1004p.
Greene, W.H., 2003. Econometric Analysis, 5th Edition. Prentice Hall. Inc, London. 1026p.
Holloway, G. and Ehui, S., 2002. Expanding market participation among smallholder livestock producers: Socio-economic and Policy Research Working Paper 48. International Livestock Research Institute, Nairobi, Kenya, pp. 85
Holloway, G., Charles, N.C, and Delgado, C., 1999. Agro industrialization through Institutional Innovation: Transactions Costs, Cooperatives and Milk-Market Development in the Ethiopian Highlands. Discussion Paper No. 35 Inc., USA. 425p.
Islam, M.S., Miah, T.H. and Haque, M.M., 2001. Marketing system of marine fish in Bangladish. Bangladish Jornal of Agricultural Economics. 24(1 & 2):127-142.
Johnston, J. And Dinardo, J., 1997. Econometrics Methods. 4th Edition, The McGraw-Hill Companies, Inc., New York. 250p.
Kohl’s, R.L. and Uhl, J.N., 1985. Marketing of Agricultural Product. Fifth ed., Coiler Mac, Milan, U.S.A.
Kotler, P. and Armstrong, G., 2003. Principle of Marketing, 10th Edition. Hall of India Pvt. Ltd., New Delhi. pp 5-12.
Kyvsgaard, N., Luna, L., Nansen, P., 1999. Analysis of a traditional grain and scavenge based poultry system in Nicaragua. In: Proceedings of a Workshop on Poultry as a Tool in Poverty Eradication and Promotion of Gender Equality,Denmark. Accessed October 2006, www.ihh.kvl.dk/ htm/php/tune99/9-Kyvsgaard.htm
Maddala, G.S., 1983. Limited, Dependent and Qualitative Variable in Econometrics. Cambridge University Press, Cambridge. 401p.

119
Maddala, G.S., 1997. Limited Dependent and Qualitative Variables in Econometrics. Cambridge University press, Cambridge. pp. 175-181.
Magrath, P., 1992. Methodologies for studying Agricultural marketing in developing Countries. Marketing series 2, Chart ham, UK: Natural resource Institute.
Mark, L., María, V., Gottret, W, Carlos, C., Felipe, O., Rupert, B., Dai, P. and Shaun, F., 2004. Increasing the Competitiveness of Market chains for Smallholder producers, CIAT
Mendoza, G., 1995. A Primer on marketing channels and margins. Lyme Rimer Publishers
Mlozi, M.R.S., Kakengi, A.V.M., Minga, U.M, Mtambo, A.M. and Olsen, J.E., 2003 Marketing of free - range local chickens in Morogoro and Kilosa urban markets, Tanzania. Livestock Research for development, http://www.cipav.org.co/lrrd/lrrd15/2/mloz152.htm
Musema, R., 2006. Analysis of pepper marketing in Alaba special woreda and Silte zone. M. Sc. Thesis, Haramaya University.
Sadoulet, E. and de Janvry, A., 1995. Quantitative Development Policy Analysis. Baltimore and London: The Johns Hopkins University Press.
Safalaoh, A., 1997. Characteristics of indigenous chickens of Malawi. Animal Genetic Resource Information, 22: 61 - 69.
Scarborough, V. and Kydd, J., 1992. Economic analysis of Agricultural Markets. A manual marketing series 5, chartham UK: Natural resource
Sonaiya, E. B., 1990. The context and prospects for development of smallholder rural poultry production in Africa. Pp. 98-115. In: CTA, 9-13 October 1990. The Salaniki, Greece.
Tadelle D., 2002. The role of scavenging poultry in integrated farming system in Ethiopia. DZARC, Alemaya university of agriculture, Debre Zeit, Ethiopia.
Tadelle, D. and Ogle, B., 1996. Effect of maize (Zea mays) and noug (guizotia abyssinica) cake supplementation on egg production performance of local birds under scavenging conditions in the central highlands of Ethiopia. M.Sc Thesis, Swedish University of Agricultural Science, pp 14.

120
Teklewold, H., Dadi, L., Yami, A. and Dana, N., 2005. Determinants of adoption of poultry technologydouble-hurdle approach, Debre Zeit Agricultural Research Center.
Tobin, J., 1958. Estimation of Relationships for Limited Dependent Variables. Econometrica. 26:24-36.
Udo, H.M.J., Asgedom, A.H., Viets T.C., 2001. Modeling the impact of interventions in village poultry systems. Animal production systems group, Wageningen institute of Animal Sciences, Wageningen University, Wageningen. E-mail: [email protected]
Whyte, M., 2002. Poultry studies and Anthropological Research Strategies. Characteristics and parameters of family poultry production in Africa. IAEA, Vienna, Austria, pp. 187-192
Wolday, A., 1994. Food Grain Marketing Development in Ethiopia after Reform 1990. A Case Study of Alaba Siraro. The PhD Dissertation Presented to Verlag Koster University. Berlin 293p.
Yacob, A., 2002. An audit of the livestock marketing status in Kenya, Ethiopia and Sudan. Community Based Animal Health Participatory Epidemiology Unit.
Yadeta, K., Dadi, L., and Yami, A., 2000. Poultry Marketing: Structure, Spatial Variations and Determinants of Prices in Eastern Shewa Zone, Ethiopia (DZARC)

121
APPENDICES

122
Annex 1. Sample respondents distribution by the family members age
Source: Own computation ***, ** show level of significance at 1, and 5 percent confidence intervals respectively
Annex 2. Mullticolinearity check among the continuous independent variables
Independent variables Mullticolinearity check
Tolerance VIF
Age of the household head 0.895 1.117
Total family size 0.886 1.129
Annual revenue from farming 0.822 1.216
Annual revenue from off-farm income 0.929 1.076
Total cultivated land holding 0.846 1.183
Total number of bird owned 0.737 1.356
Distance from residence to the nearest poultry market 0.942 1.061
Average lagged price of bird sold 0.769 1.301
Source: own computation
Woreda
Variable (age) Dale (mean) Alaba (mean) t
Male less than 14 1.6351 2.0694 -2.682***
Female less than 14 1.5079 2.0811 -3.557***
Male >14 &,<64 2.0899 1.4458 3.267***
Female >14 &,<64 1.4725 1.3690 807**
Male > 64 1.0000 … …
Female >64 1.0000 1.0000 …

123
Annex 3. Ownership and decision making role in bird keeping and marketing in each flock
composition within family Members
Source: own computation
Owner
Hatchery
Pullet
Cockerel
Hen
Cock
Freq % Freq % Freq % Freq % Freq %
Son 21 10.5 19 9.5 13 6.5 23 11.5 10 5
Daughter 11 5.5 9 4.5 3 1.5 9 4.5 9 4.5
Father 27 13.5 40 20 23 11.5 44 22 37 18.5
Mother 51 25.5 38 19 23 11.5 64 32 42 21

124
Annex 4. Profit earned by marketing actors in the different bird marketing channels per unit bird sold
Rural assemblers' І II III IV V VI VII VIII IX X XI XII Buying price 28.2 29.3 28.2 Selling price 33.5 40 37.8 Marketing cost 1.7 1.7 1.7 Profit 3.6 9 7.9 Urban assemblers' Buying price 29 29 29 36.5 Selling price 40 32.7 37.5 41 Marketing cost 1.8 1.8 1.8 2.6 Profit 9.2 1.9 1.5 Wholesalers’' Buying price 33.5 33.5 37.5 35.5 Selling price 47 40 47 40 Marketing cost 4.8 2.8 4.8 2.8 Profit 8.7 3.7 4.7 1.7 Retailers’' Buying price 32 47 32.7 29 Selling price 46.8 52.7 46.8 32.75 Marketing cost 1.8 1.8 1.8 1.8 Profit 13 4 12 2 Source: Own computation

125
Annex 5.Degree of Association among the categorical independent variables (contingency coefficients)
VARIABLE MARKTINFO EDGCATN SXHHDHD FEDSUPLT DDHVEXOCH DDTAKCRDT GTEXTION PURPOSE
MARKTINFO 0.095 0.007 0.159 0.219 0.148 0.042 0.012
EDGCATN 0.095 0.118 0.096 0.175 0.154 0.237 0.193
SXHHDHD 0.007 0.118 0.115 0.219 0.396 0.148 0.027
FEDSUPLT 0.159 0.096 0.115 0.002 0.174 0.289 0.002
DDHVEXOC 0.219 0.175 0.219 0.002 0.521 0.298 0.009
DDTAKCRD 0.148 0.154 0.396 0.174 0.521 0.286 0.033
GTEXTION 0.042 0.237 0.148 0.289 0.298 0.286 0.016
PURPOSE 0.012 0.193 0.027 0.002 0.009 0.033 0.016
Source: Own computation

126
Annex 6. Profit earned by each trader category per unit egg sold for the different channels.
Egg marketing channels І ІІ ІІІ ІV V VI VII VIII IX X XI
Rural assemblers'
Buying price 0.75 0.75 0.75 0.87
Selling price 0.93 0.95 0.91 1.00
Marketing cost 0.05 0.05 0.05 0.05
Profit 0.13 0.15 0.11 0.08
Urban assemblers'
Buying price 0.75 0.75 0.75
Selling price 0.95 0.95 0.95
Marketing cost 0.05 0.05 0.05
Profit 0.15 0.15 0.15
Wholesalers’'
Buying price 0.79 0.95 0.87 0.87 0.95 0.95
Selling price 1.25 1.25 1.21 1.25 1.21 1.25
Marketing cost 0.09 0.09 0.09 0.09 0.09 0.09
Profit 0.37 0.21 0.25 0.29 0.17 0.21
Retailers’'
Buying price 1.10 0.95
Selling price 1.3 1.21
Marketing cost 0.07 0.07
Profit 0.13 0.19
Source: Own computation

127
Annex 7. Parametric estimates of Tobit model.
Variable Coeff. Std.Err. t-ratio Marginal
change
(whole)
Marginal
change
(sellers)
Change in
probability
CONSTANT 480.605 28.04 17.141*** ----- ----- -----
AGHHD -9.099 4.181 -2.176** -6.976 -7.617 -0.06333
FAMSIZGR 35.077 27.26 1.287 26.891 29.364 0.25453
FAMSIZE -3.964 15.58 -0.254 -3.039 -3.319 -0.20336
YREXPFM -0.062 0.499 -0.124 -.0476 -.052 -0.11197
ANRVFMG -0.006 0.010 -0.615 -.0046 -.005 -0.33139
ANRVOFI 0.037 0.029 1.286 .0282 .031 0.25467
LANDHLD -42.840 15.207 -2.817*** -32.843 -35.863 -0.01352
POLTOWN 61.512 16.908 3.638*** 47.158 51.4937 0.00073
DCENRPO -20.713 7.457 -2.778*** -15.879 -17.320 -0.01444
AVPRCPL 12.008 3.991 3.009*** 9.2059 10.052 0.00933
MARKINF -36.876 79.27 -0.465 -28.271 -30.870 -0.29862
EDGCTN -86.007 83.94 -1.025 -65.936 -71.999 -0.31200
SXHHDHD 62.867 127.57 0.493 48.196 52.628 0.30682
FEDSUPL 196.087 103.75 1.890* 150.329 164.151 0.10886
DHVEXCH 31.175 104.76 0.298 23.900 26.097 0.22793
DTAKCDT 645.393 132.23 4.881*** 494.786 540.278 0.00000
GTEXSCPL 18.495 92.211 0.201 14.179 15.483 0.16868
PRPBRDK 60.996 72.725 0.839 46.762 51.082 0.33709
Source: Own computation ***, **, * show level of significance differences at 1, and 5 percent confidence level Dep. var. = VALTOTAL Mean= 452.604, S.D. =748.0328 Model size: Observations = 200, Parameters = 18, Deg. Fr. =182 Fit: R-squared= .699412, Adjusted R-squared = .66952 Model test: F [17, 182] = 23.40, Prob. value = .00000 Diagnostic: Log-L = -1486.5743, Restricted (b=0) Log-L = -1606.7758