analysis of qos delivered to users of wcdma band in ... · tiamiyu o.a. analysis of qos delivered...
TRANSCRIPT

Tiamiyu O.A. Analysis of QOS Delivered to Users of WCDMA Band in Different Locations ...
DOI:10.31854/1813-324X-2019-5-3-45-56 45 tuzs.sut.ru
ANALYSIS OF QOS DELIVERED TO USERS OF WCDMA BAND IN DIFFERENT LOCATIONS:
CASE STUDY OF UNIVERSITY OF ILORIN, NIGERIA O.A. Tiamiyu1*
1University of Ilorin Ilorin, PMB 1515, Nigeria,
*Correspondence Address: [email protected]
Article info The article was received 03 June 2019 For citation: Tiamiyu O.A. Analysis of QOS Delivered to Users of WCDMA Band in Different Locations: Case Study of University of Ilorin, Nigeria. Proceedings of Telecommunication Universities. 2019;5(3):45‒56. Available from: https://doi.org/10.31854/1813-324X-2019-5-3-45-56 Abstract: Since 2001, which marked the advent of modern telephony in Nigeria, there is a significant increase in the capacity of the Mobile Network Operators (MNOs). Total connected active lines were quite over a hundred million ac-cording to the reports by Nigeria Communications Commission (NCC), the regulatory body in Nigeria. However, mobile telephone users in the country are experiencing poor quality of service at different locations in the country. Thus, NCC has set benchmark values for various keys performance Indicator. In this study, findings on the quality of service delivered to users of WCDMA Band by the MNOs in different locations within University of Ilorin will be made. Keywords: Mobile Network Operators, capacity, WCDMA, QoS, keys performance Indicator, users’ location, University of Ilorin.
1. INTRODUCTION
The history of mobile communication in Nigeria is traceable to the deregulation of the traditional means of communication under the civilian rule of the then president of the federal republic of Nigeria in person on President Olusegun Obasanjo (GCFR). This deregula-tion gave birth to GSM revolution in 2001. Before the advent of mobile communication in Nigeria, Nigeria Telecommunication Limited (NITEL) was saddled with the responsibility of managing the telecommunications sector, which was via Landline referred to as Fixed Te-lephony [1]. The first Mobile Network Operator (MNO) that came on board was ECONET (now Airtel), launched on August 6, 2001; MTN followed suit almost immediately.
The Nigerian Telecommunication Industry is said to be the fastest growing telecommunication industry in the world with current teledensity of 108 % and the biggest telecom industry in the world. It represents the largest provider of job opportunity in the country and contributes greatly to the country’s GDP [2].
Before 2001, which marked the advent of modern te-lephony in Nigeria, teledensity in the country was at a very low level. 13 years down the line, Nigeria’s telecom-munication, the total connected active lines were quite over a hundred million with a teledensity above 90 ac-cording to the reports by NCC in 2013 [3]. This implies that there was a significant increase in the capacity of the
Mobile Network Operators (MNOs). This necessitated adoption of better system, like Universal Mobile Tele-communications System (UMTS) that uses Wideband Code Division Multiple Access (WCDMA) for its trans-mission network.
Users embraced UMTS as it is backward compatible with the already existing network architecture, which is General Packet Radio System (GPRS) or Enhanced Data rates for Global Evolution (EDGE) network. This has min-imized the investment required to set up 3G network. In addition, the regular SIM is upgradable to Universal SIM (USIM) that enables it to communicate over the UMTS network. UMTS specifies the Universal Terrestrial Radio Access Network (UTRAN), which is composed of multi-ple Node-Bs in place of base stations using different ter-restrial air interface standards and frequency bands [4].
As seen in Figure 1, UMTS network architecture in-dicates that the GPRS or EDGE Core Network (CN) re-mains the same. This shows its Inter-Radio Access Technology (IRAT) interoperability [2, 5, 6]. 3G Archi-tecture has three (3) main parts, the Core Network, UMTS Terrestrial Radio Access Network (UTRAN) and user equipment (UE). The CN performs the function of switching, transit, and routing of traffic between nodes (packet or circuit switched); the UTRAN (also referred to as Radio Access Technologies) has two parts, namely Radio Network Controller (RNC) and Node-Bs. RNC performs handover functions, ciphering of data in the network, Radio Resource Control, Power Management

ТРУДЫ УЧЕБНЫХ ЗАВЕДЕНИЙ СВЯЗИ 2019. Т. 5. № 3
DOI:10.31854/1813-324X-2019-5-3-45-56 46 tuzs.sut.ru
and control, Channel allocation among other functions. Node-Bs perform the functions of the Base station in 2G network, which is to provide the air interface to the User Equipment and also modulation and demodula-tion of traffic.
Fig. 1. UMTS Network Architecture
UE, which comprises the USIM as well as the Mobile Station of the user, has various identities assigned to it on the network such as IMSI, MSISDN, TMSI, IMEI and so on [7].
Though UMTS has better capacity than the predeces-sors do, yet mobile telephone users in the country are experiencing and complaining about poor QoS at differ-ent locations in the country. There have been complain-ing over the QoS delivered by service providers in the country continuously over the last few years that the MNOs had to pay fines billed on them by NCC in 2013 and 2014 for poor service delivery [8, 9]. Furthermore, there were reports in the Guardian newspaper from in-dividuals complaining about poor service from MNOs. A consumer living in Lagos complained that he hardly had successful conversations without three to four breaks in transmission. He further stressed that some-times when he called; he hardly heard the user on the other side. According to the consumer, this got worse with time.
There was also a report from a subscriber to service providers, the subscriber who was supposed to receive a notification message from a company about an interview but could not receive the message on time due to poor signal reception. The subscriber lost the job [9].
Among the complaints is the receipt of unsolicited messages by subscribers [8]. In the Guardian Newspa-pers in their technology section, it was reported that NCC affirmed that mobile telephone users in the coun-try had experienced poor QoS in Q4 of 2016 and Q1 of
2017. The poor services range from drop calls, call setup failure, poor call retention, weak signals, cross-talk, and unsolicited text messages among others [10].
As each of the MNOs is not having optimum service delivery in every location in the country, most mobile subscribers do subscribe to more than one MNO, thereby having to switch Subscriber Identity Module (SIM) from a location to another; or being forced to use more than one mobile equipment.
Thus, considering that subscribers of the MNOs in Ni-geria is increasing at a very high rate, there is a need for the various MNOs to check their coverage rate and see their overall network performance meets the needs of the subscribers to their network. Moreover, the regula-tory body in Nigeria, Nigeria Communications Commis-sion (NCC) has set benchmark values for various Key Performance Indicator (KPI) (Table 1) [11].
Hence, this has prompted researchers to make find-ings on the QoS delivered by the MNOs in different lo-cations and areas of the country.
In this study, KPI for voice communication in the 3G UMTS network of the four different Mobile Network Operators (MNO) in Nigeria, tagged as operator A, B, C and D respectively will be checked.
The KPIs to check include: ‒ Network Accessibility (Call Setup Success Rate); ‒ Coverage Voice Quality (−10dB ≤ Ec/No < 0 dB); ‒ Handover Success Rate (HOSR); ‒ Coverage Reliability (% RSCP > −85 dbm); ‒ Speech Quality Index; ‒ Call Setup Time; ‒ Network Retain ability (dropped call rate). As a means of informing people and the MNOs them-
selves, there is a company, OpenSignal, which monitors signal level on daily basis. This company produces re-ports on their website about network providers world-wide.
Thus, for a start in this study, below are the results considering the scope of this project as provided on this company’s website as at July 27, 2017. The points Painted Red are reports of poor QoS area while those painted green are areas with good QoS as depicted in the Figure 2-6 [12].
The report for MNO A shows that there are no re-ported data (signal) on Jalala and Senior Staff Quarters that are located within the university of Ilorin campus, unlike within its Permanent Site where QoS is high ac-cording to the report (Figure 2 and 3). Figure 4‒6 de-picts the report by Open Signal for signal quality of MNO B.
TABLE 1. Some NCC Set KPI Threshold Values
KPI Call Setup Success Rate
Call Setup Time
Call Drop Rate
Handover Success Rate
Received Signal Code
Power Ec/No Call Completion
Success Rate
NCC defined benchmark ≥ 98% ≤ 6 sec ≤ 1% ≥ 98 % ≥ −85 dBm ≥ −9 dBm ≥ 97 %

Tiamiyu O.A. Analysis of QOS Delivered to Users of WCDMA Band in Different Locations ...
DOI:10.31854/1813-324X-2019-5-3-45-56 47 tuzs.sut.ru
Fig. 2. Open Signal MNO A Report for Jalala and Senior Staff Quarters [12]
Fig. 3. Open Signal MNO A Report for Permanent Site [12]
Fig. 4. Open Signal Report for MNO B Signal Quality in Jalala [12]

ТРУДЫ УЧЕБНЫХ ЗАВЕДЕНИЙ СВЯЗИ 2019. Т. 5. № 3
DOI:10.31854/1813-324X-2019-5-3-45-56 48 tuzs.sut.ru
Fig. 5. Open Signal Report for MNO B Signal Quality in Staff Quarters [12]
Fig. 6. Open Signal Report for MNO B Coverage in Permanent Site
2. LITERATURE REVIEW
The P3 connect mobile test company based in the United Kingdom stated in their 2016 report that the re-sults got from their test in the United Kingdom that the service providers all comply with the standard set for them by the regulatory body in the country [13]. The benchmark test was carried out for the following net-work service providers: EE, Three, O2 and Vodafone. They gave a summary report of the general test then fur-ther broke down the results based on voice and data communication separately. At the end of their report, they compared the result for 2016 with those they have gathered in past years and it was evident that the four major Network operators that were tested had improved in the overall quality of service they provide to the sub-scribers of their respective networks.
In Bangkok, two Authors came together to compare the performance of Third generation technologies for Internet services provided by the major network oper-ators in Thailand. The paper focused on developing a conceptual framework for performance testing as well as Network Optimization, and performance compari-son of 3G operations on 850/900 MHz and 2100 MHz bands in Thailand. The KPIs used during the course of their analyses were Throughput, Latency and data rates [14].
The authors in [15] examined the QoS of GSM net-work offered by four major network providers in Nige-ria taking Ikorodu Axis as their case study. They studied the quality of service in voice call only over the four ser-vice providers; MTN, AIRTEL, GLOBACOMM and ETISA-LAT in some parts of Ikorodu Local Government Area,

Tiamiyu O.A. Analysis of QOS Delivered to Users of WCDMA Band in Different Locations ...
DOI:10.31854/1813-324X-2019-5-3-45-56 49 tuzs.sut.ru
Lagos State, Nigeria. They made use of TEMS 9.1 as their data collection software, Sony Ericsson C-702 and MapInfo Professional 11.0. Each mobile station was set to call for 90 seconds and a waiting period of 10 sec-onds was included in the control script. The authors an-alyzed their collected data using MapInfo and plotted graphs for the various KPIs and they did an analysis of bad patches.
The authors of [16] did an Evaluation and Optimiza-tion of the QoS that the mobile cellular networks in Ni-geria are providing to the subscribers. They used an ap-plication called QVOICE with a pre-configured Nokia 6270i phone to collect necessary data. Five KPIs were the basis of the desired result for analysis, and they were Call Setup Success Rate (CSSR), Call Completion Rate (CCR), Call Handover Success Rate, Call Drop Rate and Standalone Dedicated Control Channel (SDCCH). The data collected was analyzed and Chi-test was per-formed to know the deviation from the set value by the NCC, and then transferred through SQL server for post-processing analysis. A conceptual framework was pre-sented for Optimization using Adaptive Network-Based Fuzzy interference System (ANFIS).
A report was published in the International Journal of Research in Engineering and Technology by four au-thors on Optimizing radio frequency for improved QoS in Abeokuta, Nigeria [17]. The authors who carried out this research work collected data such as signal integ-rity, signal quality, interference, dropped calls, blocked calls, call statistics, service level statistics, QoS infor-mation and handover info among other data that were needed for thorough analysis to achieve their defined aim. They carried out drive test in defined areas to cover the Abeokuta metropolis using TEMS 9.0 and four TEMS enabled Sony Ericsson k800i. They divided the result type into two for Short and Long Calls. The short calls were used to check for Accessibility and Mobility while the Long calls were used to check retainablity and sustainability of calls.
3. METHODOLOGY
This study covered the analysis of real-time data rec-orded with the aid of a drivetest application while driv-ing along the vehicle paths in the three selected loca-tions within the University of Ilorin campus. The se-lected areas were Jalala Junior Staff Quarters (Jalala), University of Ilorin Senior Staff quarters and the Uni-versity of Ilorin Main Campus (Permanent Site).
After the drivetest, post processing of the collected data was done and results discussed. Areas with bad coverage were highlighted and some possible reasons for the bad coverage were made known.
Data was collected with the aid of a drivetest and then saved as log files for further analysis to get desired results after the parameters have been defined.
Parameters that were considered in the course of this study include Call Setup Success Rate, call setup
time, handover attempt, handover failure, HOSR, call at-tempt, Speech Quality Index (SQI), call drop, Received Signal Code Power (RSCP), Energy per Chip to Noise Ra-tio (Ec/No) and Received Signal Strength Indicator (RSSI).
The software that was used in the course of the study was licensed TEMS Investigation 15.2.2, MapInfo Pro-fessional 12.0, Snipping tool and Microsoft Excel.
The hardware or devices used were a laptop with Windows 7 Professional (Service Pack 1), a Global Po-sitioning Service (GPS) device, four (4) Sony Ericsson W995 TEMS phone, USB hub, a car and a car Inverter for constant power supply to the laptop during the course of the drive.
It was noted that the total received signal power, i.e. RSSI, could not be considered as an indication of cover-age in a WCDMA system. The RSCP value and the Ec/No are the values to put into consideration when working on the analysis of a WCDMA data.
The parameters recorded and evaluated that were used in measuring the QoS delivered were generally re-ferred to as KPI.
3.1. KPIs Used and their Definitions
Call Setup Success Rate: Often referred to Accessi-bility KPI. It is a measure of the amount of calls that are successfully setup after attempt has been made on the call. If a call has been setup and later drops, the call has been successfully setup and connection has been made. When calls are not successfully setup, it is called Call block. Call could be blocked because of abnormal RRC (Radio Resource Control) connection release, no alert-ing/connection, no Radio bearer setup, and timer expi-ration among others. CSSR is It is expressed as a per-centage of the ratio of Call Setup to the number of Call attempts.
Mathematically, 𝐶𝐶𝐶𝐶𝐶𝐶𝐶𝐶 = 𝐶𝐶𝐶𝐶𝐶𝐶𝐶𝐶 𝑆𝑆𝑆𝑆𝑆𝑆𝑆𝑆𝑆𝑆𝐶𝐶𝐶𝐶𝐶𝐶𝐶𝐶 𝐴𝐴𝑆𝑆𝑆𝑆𝑆𝑆𝐴𝐴𝑆𝑆𝑆𝑆
× 100.
Call Drop Rate (CDR): Also referred to as Network retainability. The call drop rate is the rate at which calls drop after setup and assignment of channel has taken place. The rate at which calls drop depends on various factors such as failure to reestablish connection or other unspecified reasons. It is expressed as a percent-age of the ratio of call drop to call setup.
Mathematically, 𝐶𝐶𝐶𝐶𝐶𝐶 = 𝐶𝐶𝐶𝐶𝐶𝐶𝐶𝐶 𝑑𝑑𝑑𝑑𝑑𝑑𝑆𝑆𝐶𝐶𝐶𝐶𝐶𝐶𝐶𝐶 𝑆𝑆𝑆𝑆𝑆𝑆𝑆𝑆𝑆𝑆
× 100.
Soft Handover Success Rate: This is the successful rate at which Radio Link is added, removed or replaced. It is the ratio of success of these to the failures ex-pressed in percentage.
Call Setup Time: This is the time taken to setup the call after the attempt has been successfully made. Tak-ing into consideration the benchmark set by the NCC for this KPI, which is that it must be less than 6secods. Hence, to include it in the calculation, the amount of call setup time less than 6 sec was expressed as a percent-age of the total number of call setup time.

ТРУДЫ УЧЕБНЫХ ЗАВЕДЕНИЙ СВЯЗИ 2019. Т. 5. № 3
DOI:10.31854/1813-324X-2019-5-3-45-56 50 tuzs.sut.ru
Coverage Reliability: The coverage reliability can be expressed as the reliability of the network for con-nection at any time. Connection is reliable at the Re-ceived Signal Code Power (RSCP) value. The bench-mark set for this value by the NCC is ‒85dBm. Thus, the percentage coverage reliability was calculated as the sum of RSCP values greater than the set benchmark ex-pressed as a percentage of the total.
The ranges used were as follows: Min ≤ x < −95 −95 ≤ x < −85 −85 ≤ x < −75 −75 ≤ x < −65 −65 ≤ x < −55 −55 ≤ x < Max Coverage Quality: This is the value of Energy per
chip to Noise Ratio (Ec/No) greater than a desired value that guarantees optimum connectivity and quality. The coverage quality can be expressed in value as the per-centage of number of values above the set threshold to the total number of values. For this project, a threshold of ‒10dBm was used.
The ranges used were as follows: −34 ≤ x < −10 (Bad) −10 ≤ x < −7 (Acceptable) −7 ≤ x < 0 (Good) Speech Quality Index (SQI): It is a special attribute
incorporated into the KPI value and being checked by TEMS for complete and efficient evaluation of the qual-ity of voice signals heard or passed across a communi-cation link during a particular call. It ranges from 0 to 30 with 0 been the poorest and 30 been the best.
−20 ≤ x < 1 (Bad) 1 ≤ x < 19 (Acceptable) 19 ≤ x < 30 (Good) The test was carried out in two phases, which were: 1) Data Collection phase; 2) Data Analysis phase. In data collection phase, drivetest was performed
and the software, TEMS Investigation, was used for the collection of data. TEMS Investigation is an active E2E test system, being used for verification, troubleshoot-ing and optimization of services delivered in Radio Ac-cess Networks (RAN). It enables MNOs and infrastruc-ture suppliers to test the quality of service they are de-livering to subscribers. It covers in-vehicle, in-building, as well as the service quality received by pedestrians [18]. TEMS combines two key attributes – Speed and simplicity, to help in responding quickly to customer’s complaints, while offering an unequalled ease of oper-ation to users. TEMS Investigation 15.3 was installed on the laptop used for the study, as well as MapInfo Pro-fessional 12.0 and Microsoft Office Excel, 2016 edition for data analysis. The test could as well be carried out using a motorcycle or bicycle. Instead of drivetest, walktest could also be carried out.
The connections were made to a laptop with neces-sary software installed and TEMS License Key (Dongle) attached. A GPS device and Mobile stations were con-nected via USB. The GPS device connected to the laptop was placed on top of the car during the course of the drivetest to enable it to have a clearer view of the sky for more accurate results.
The collected data during drivetest data could be an-alyzed in real time during the test or after the test.
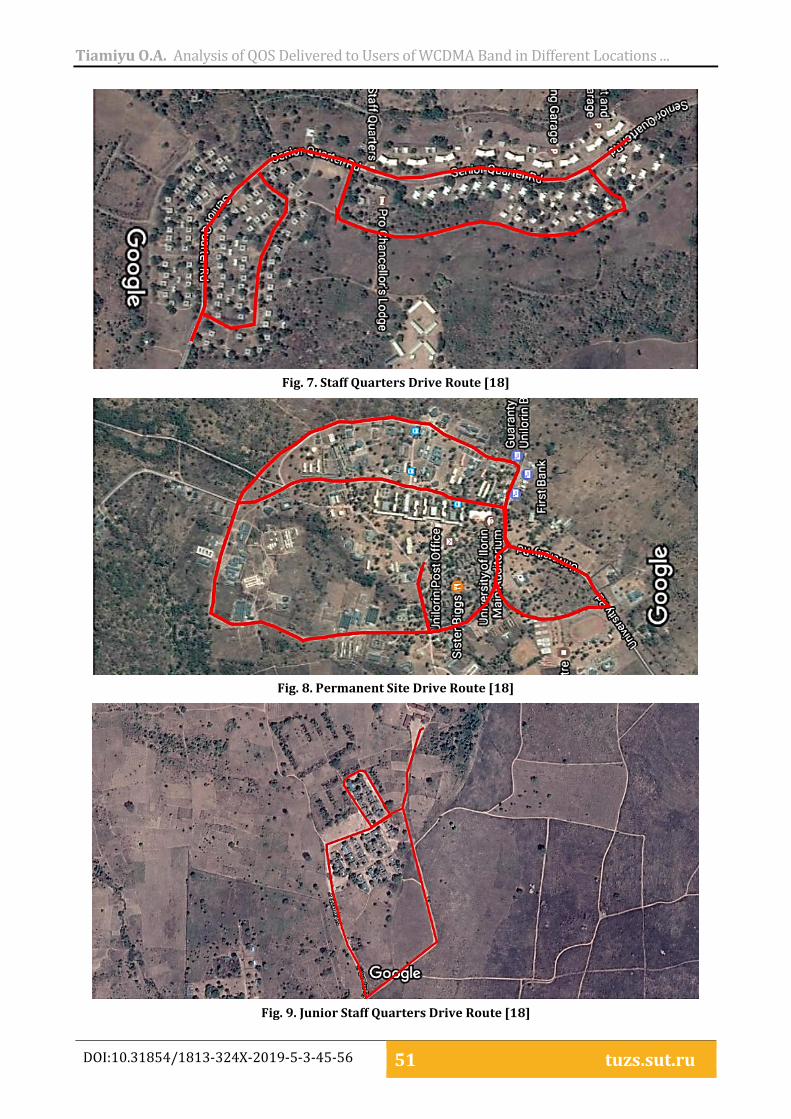
3.2. Drivetest Routes
Drivetest routes that indicated where testing would occur was defined based on several factors, mainly re-lated to the purpose of the test. The drive routes showed the essential part of the area that must be cov-ered, being the guide as to know which part had been covered and which part had not. Other places in the area might be tested as well based on the discretion.
Google Earth application was used in creating a drive route. The final image for drive route was taken to guide during drive test. Drivetest route chosen for this project were the Senior Staff Quarters of University of Ilorin (Figure 7), the University of Ilorin Main Campus Permanent Site (Figure 8) and the Jalala Junior Staff Quarters University of Ilorin (Figure 9).
3.3. The Drivetest
The drivetest was performed using two phones (one was making calls (CALL) from a specific number from time to time, while the other was maintained in IDLE mode). Thus, data were collected in IDLE and CALL modes for the network. The CALL duration were for short (30‒60 seconds) and long (up to 180 seconds or more). Short calls checked the rate at which calls were successfully established and completed, while long calls checked the retainability of the network. Figure 10 shows a snippet of the voice call.
3.4. Data Collection Process
Before starting the drivetest, the worksheet to be used in monitoring the devices connected during the drive was created after launching TEMS Investigation 15.3, then the voice scripts to be used during the course of the drives.
The Road Map to use in knowing the path taken dur-ing the project and the cell file, which is the information about the BTS in the environment, were loaded and data were collected.
While driving, voice prompt on any activity was care-fully attended to as it might had occurred as a result of disconnection of any of the devices, in which case the test would have to be rerun. Ongoing calls were allowed to end or stop the running script before stopping re-cording the logfile because the interruption might cause the call to be interpreted erroneously as dropped call.
Tiamiyu O.A. Analysis of QOS Delivered to Users of WCDMA Band in Different Locations ...
DOI:10.31854/1813-324X-2019-5-3-45-56 51 tuzs.sut.ru
Fig. 7. Staff Quarters Drive Route [18]
Fig. 8. Permanent Site Drive Route [18]
Fig. 9. Junior Staff Quarters Drive Route [18]

ТРУДЫ УЧЕБНЫХ ЗАВЕДЕНИЙ СВЯЗИ 2019. Т. 5. № 3
DOI:10.31854/1813-324X-2019-5-3-45-56 52 tuzs.sut.ru
Fig. 10. Voice Call Snippet
4. RESULTS AND ANALYSIS After the drivetest, the values of the RSCP, Ec/No,
and SQI per location and per type of call for each MNO
were plotted in MapInfo. For all Networks, there was 100 % success rate in the handover at all locations. Summary based on various KPI values, for all MNOs, were as seen in the Table 2.
TABLE 2. Summary KPI Values
PROVIDERS MTN Etisalat Airtel Glo MTN Etisalat Airtel Glo MTN Etisalat Airtel Glo
№ KPI JALALA Long Call JALALA Short Call Permanent Site Long Call
1 % Call Setup Time MOC < 6 sec 25,00 0,00 100,00 0,00 75,00 50,00 100,00 8,33 92,31 81,82 100,00 50,00
2 % Coverage Reliability RSCP > −85dbm 53,41 52,35 60,24 41,49 57,21 65,04 75,28 25,42 89,79 69,22 93,85 90,62
3 % Coverage Quality (−10 ≤ Ec/No < 0 dB) 21,49 37,70 31,06 51,18 60,74 65,43 25,49 37,18 21,49 37,70 31,06 51,18
4 Accessibility (CSSR) 85,71 50,00 75,00 80,00 85,71 50,00 88,89 85,71 100,00 100,00 100,00 73,33
5 Retainability (100-Call Drop Rate) 33,33 100,00 100,00 50,00 83,33 100,00 87,50 83,33 92,31 100,00 100,00 72,73
6 Handover Success Rate 100,00 100,00 100,00 100,00 100,00 100,00 100,00 100,00 100,00 100,00 100,00 100,00
7 SQI 86,45 0,00 24,80 67,70 37,45 0,00 65,77 66,99 84,05 0,00 55,22 67,47

Tiamiyu O.A. Analysis of QOS Delivered to Users of WCDMA Band in Different Locations ...
DOI:10.31854/1813-324X-2019-5-3-45-56 53 tuzs.sut.ru
CONTINUE TABLE 2
MTN Etisalat Airtel Glo MTN Etisalat Airtel Glo MTN Etisalat Airtel Glo
№ Staff Quarters Short Call Staff Quarters Long Call Permanent Site Short Call
1 85,71 0,00 N/A 20,00 80,00 100,00 100,00 40,00 100,00 71,43 100,00 29,17
2 58,96 53,69 99,51 42,66 57,55 62,34 76,86 88,77 99,92 70,58 91,08 86,29
3 57,65 54,20 95,19 84,51 61,48 63,57 55,71 84,68 58,15 39,47 51,34 51,34
4 100,00 66,67 0,00 100,00 100,00 100,00 100,00 100,00 12,96 89,47 6,25 76,67
5 100,00 100,00 0,00 100,00 92,31 100,00 100,00 72,73 100,00 100,00 100,00 78,26
6 100,00 100,00 N/A 100,00 100,00 100,00 100,00 100,00 100,00 100,00 100,00 100,00
7 74,97 0,00 0,00 77,92 82,63 0,00 50,40 87,45 17,05 0,00 0,00 61,27
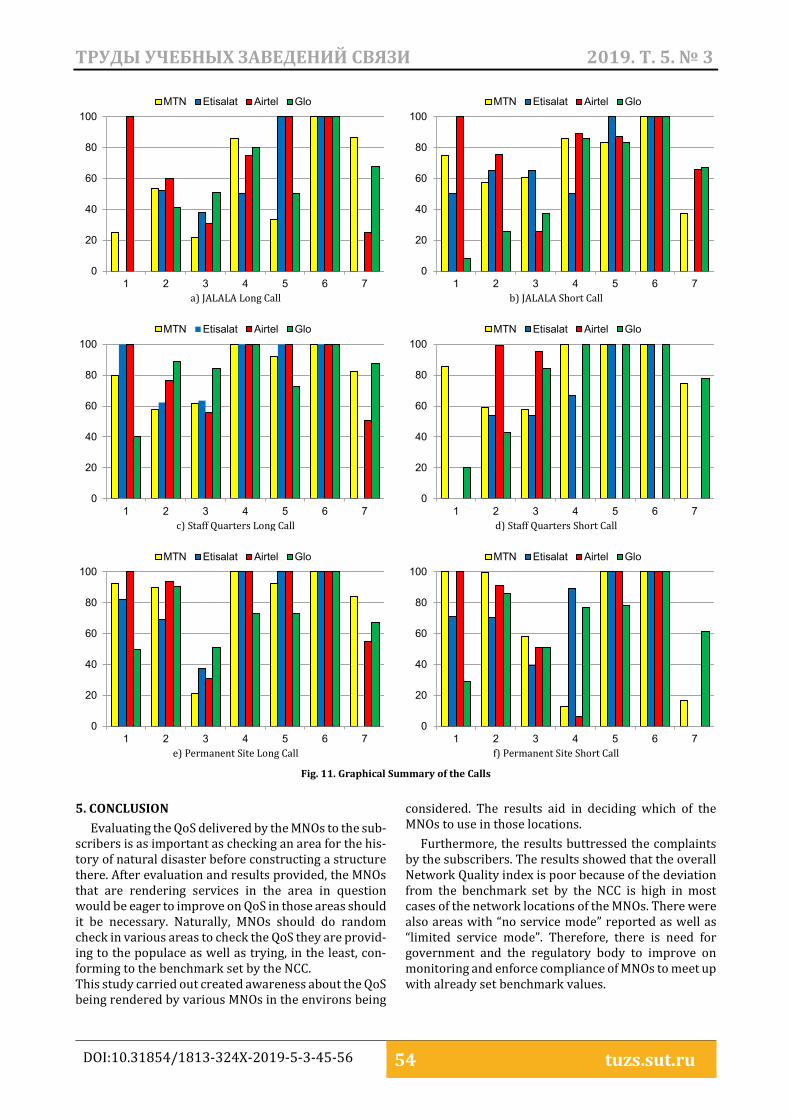
4.1. Junior Staff Quarters
As obvious from the Table 2 as well Figure 11a and 11b, at Junior Staff Quarters, all the networks had poorer accessibility (accessibility is a measure of the CSSR for Short calls) compared to the benchmark set by NCC, which is 98 %. MNO A had 88 %, which was the highest value recorded. In this location, MNO B had the least Accessibility.
On the measure of how well a network retains con-nections without leading to a drop in the call, i. e. retain-ability, NCC set benchmark for this is that the drop call rate has to be less than or equal to 1 %. MNO B led here followed by MNO A then MNO C. MNO D retainability for this area is the poorest.
Combining results for the Long and Short calls, MNO C led in the quality of voice sent over link. MNO D came second; followed by MNO A. MNO B had the poorest SQI in this location as they had 0 % values in the acceptable range of SQI.
For both types of call, MNO D had the highest call setup time and MNO A had the least. Overall, MNO A came first with all its calls setup time taking less than 6 seconds. MNO D came second here; followed by MNO B. MNO C came last in this category.
Coverage category of the KPI is of two types, which are coverage reliability and quality. In reliability, MNO A led when the result of both call types were combined to-gether, followed closely by MNO B. MNO D and MNO C were in 3rd and 4th positions respectively. As for the coverage quality, which is the Ec/No, MNO B led, fol-lowed by MNO C. MNO A had the least coverage quality.
Summary of the calls, considering KPI 1−7 values, were done for both senior Staff Quarters (Figure 11c and 11d) and the Permanent Site (Figure 11e and 11f) as well.
4.2. Senior Staff Quarters
Accessibility: MNO D and MNO C networks had 100 % accessibility for their subscribers. MNO A was least accessible.
Retainability: MNO D had the best retainability, fol-lowed by MNO C and MNO B. However, accessing MNO
A was difficult; its retainability was 100 % once the call was setup.
SQI: In this environment, MNO C had the best speech quality from the calls. MNO D was close to MNO C in speech quality. MNO B’s speech quality was poorest as there was no value greater than the acceptable KPI value for the network.
Call Setup time: Talking about the time taken to setup call on network in this location, MNO D was the best; followed by MNO A. MNO C was the worst among as a very low percentage of its calls took less than 6 sec-onds for setup.
Coverage: MNO C had the best coverage followed by MNO D and MNO B. The most reliable here was MNO A network, while MNO C had the best quality of coverage followed by MNO D.
4.3. Permanent Site
Accessibility: MNO B network was best accessible for the location, followed closely by MNO C. MNO D and MNO A had poor accessibility (MNO A had the poorest).
Retainability: MNO B and MNO A Networks were leading in this KPI in the Permanent Site environment. Though MNO D followed them closely, yet MNO C net-work also had an equally good retainability but are far from the NCC set benchmark. It had up to 11 % dropped call rate instead of 1 % specified.
SQI: MNO C led with the highest number of its SQI value in the acceptable range. MNO D followed MNO C network, though MNO D was having a widely varying value recorded. MNO B came last in the hierarchy of value.
Call Setup time: MNO A had the best call setup time, always less than 6 seconds. MNO D followed closely while MNO C had the lowest call setup duration. Coverage: MNO D network had the best network cov-erage reliability followed by MNO A. In this category of KPI, MNO B had the least. The coverage quality was gen-erally low across all networks. MNO C led followed by MNO A. MNO D was in the 3rd place.
ТРУДЫ УЧЕБНЫХ ЗАВЕДЕНИЙ СВЯЗИ 2019. Т. 5. № 3
DOI:10.31854/1813-324X-2019-5-3-45-56 54 tuzs.sut.ru
а) JALALA Long Call b) JALALA Short Call
c) Staff Quarters Long Call d) Staff Quarters Short Call
e) Permanent Site Long Call f) Permanent Site Short Call
Fig. 11. Graphical Summary of the Calls
5. CONCLUSION
Evaluating the QoS delivered by the MNOs to the sub-scribers is as important as checking an area for the his-tory of natural disaster before constructing a structure there. After evaluation and results provided, the MNOs that are rendering services in the area in question would be eager to improve on QoS in those areas should it be necessary. Naturally, MNOs should do random check in various areas to check the QoS they are provid-ing to the populace as well as trying, in the least, con-forming to the benchmark set by the NCC. This study carried out created awareness about the QoS being rendered by various MNOs in the environs being
considered. The results aid in deciding which of the MNOs to use in those locations.
Furthermore, the results buttressed the complaints by the subscribers. The results showed that the overall Network Quality index is poor because of the deviation from the benchmark set by the NCC is high in most cases of the network locations of the MNOs. There were also areas with “no service mode” reported as well as “limited service mode”. Therefore, there is need for government and the regulatory body to improve on monitoring and enforce compliance of MNOs to meet up with already set benchmark values.
0
20
40
60
80
100
1 2 3 4 5 6 7
MTN Etisalat Airtel Glo
0
20
40
60
80
100
1 2 3 4 5 6 7
MTN Etisalat Airtel Glo
0
20
40
60
80
100
1 2 3 4 5 6 7
MTN Etisalat Airtel Glo
0
20
40
60
80
100
1 2 3 4 5 6 7
MTN Etisalat Airtel Glo
0
20
40
60
80
100
1 2 3 4 5 6 7
MTN Etisalat Airtel Glo
0
20
40
60
80
100
1 2 3 4 5 6 7
MTN Etisalat Airtel Glo

Tiamiyu O.A. Analysis of QOS Delivered to Users of WCDMA Band in Different Locations ...
DOI:10.31854/1813-324X-2019-5-3-45-56 55 tuzs.sut.ru
References 1. Global Technology Archive. History of Global System for Mobile Communication in Nigeria (GSM). 2012. Available from:
http://www.onlinenaijatech.blogspot.in/2012/06/history-of-global-system-for-mobile.html?m=1 [Accessed 25th September 2019]
2. Chindo S. Assessing the Impact of GSM Sub-Telecommunication Sector on the Teledensity Rate and Economic Growth in Nigeria: Time Series Analysis. International Journal of Business and Social Science. 2013;4(3).
3. Nigerian Communications Commission. 2013 Year End Subscriber/Network Data Report for Telecommunications Operating Companies in Nigeria. 2013. Available from: https://www.ncc.gov.ng/docman-main/industry-statistics/research-reports/563-2013-year-end-subscriber-network-data-report/file [Accessed 25th September 2019]
4. Pesavento M., Mulder W. LTE Tutorial part 1. LTE Basics. Proceedings of the Femto Forum Plenary, Reading, UK, June 2010. 5. Laiho J., Wacker A., Novosad T. Radio Network Planning and Optimisation for UMTS. Chichester: John Wiley & Sons; 2006. 6. Chevallier C., Brunner C., Garavaglia A., Murray K.P., Baker K.R. WCDMA (UMTS) Deployment Handbook. Planning and Op-
timization Aspects. Chichester: John Wiley & Sons; 2006. 7. Holma H., Toskala A. WCDMA for UMTS. Radio access for Third Generation Mobile Communications. Chichester: John Wiley
& Sons; 2005. 8. Ajibola A. Nigerian Telecoms Firms Frustrate Subscribers. 2015. Available from: https://iwpr.net/global-voices/nigerian-
telecoms-firms-frustrate-subscribers [Accessed 25th September 2019] 9. Naij.com. READ What Nigerians are Saying about MTN, GLO, AIRTEL and Others. Available from: https://www.legit.ng/
64171.html [Accessed 25th September 2019] 10. Adeyemi A., Nkechi O.U. NCC decries telecoms firms quality of service. The Guardian. 2017. Available from:
https://m.guardian.ng/technology/ncc-decries-telecoms-firms-quality-of-service [Accessed 25th September 2019] 11. The Federal Government Printer. Nigerian Communications Act: Quallty of Service Regulations. Federal Republic of Ni-
geria Official Gazette. 2013:B133‒B166. 12. Opensignal. Coverage Maps. Available from: https://opensignal.com/networks/nigeria/airtel-coverage [Accessed 25th
September 2019] 13. P3 Connect. The 2016 Mobile Network Test in the United Kingdom. Available from: https://www.p3-group.com/en/wp-
content/uploads/2016/11/Report-UK-2016.pdf [Accessed 25th September 2019] 14. Chimmanee S., Jantavongso S. The performance comparison of third generation (3G) technologies for internet services
in Bangkok. J. Inf. Commun. Technol. 2016;15:1‒31. 15. Ogunleye A.O., Soewu A., Makanjuola N.T. QoS – Comparative Management and Evaluation of GSM Telephone System in
Nigeria. The Pacific Journal of Science and Technology (PJST). 2016;17(2):134‒163. 16. Alexander N.N., Anthony U.O., Emmanuel O.I., Davies K.N. Evaluation and Optimization of Quality of Service (QoS) of
Mobile Cellular Networks in Nigeria. International Journal of Information and Communication Technology Research. 2013:3(9): 277‒282.
17. Oseni O.F., Popoola S.I., Enumah H., Gordian A. Radio frequency optimization of mobile networks in Abeokuta, Nigeria for improved quality of service. International Journal of Research in Engineering and Technology. 2014;3(8):174‒180.
18. Google Maps (n.d.). Available from: http://www.maps.google.com [Accessed 25th September 2019]
* * *
АНАЛИЗ КАЧЕСТВА ОБСЛУЖИВАНИЯ ПОЛЬЗОВАТЕЛЕЙ WCDMA ПРИ РАЗЛИЧНОЙ ДИСЛОКАЦИИ: ПОИСКОВОЕ ИССЛЕДОВАНИЕ
УНИВЕРСИТЕТА ИЛОРИНА, НИГЕРИЯ О.А. Тиамийу1
1Университет Илорина 1515, Илорин, Нигерия
Информация о статье УДК 621.39.82 Статья поступила в редакцию 03.06.2019
Ссылка для цитирования: Тиамийу О.А. Анализ качества обслуживания пользователей WCDMA при раз-личной дислокации: поисковое исследование университета Илорина, Нигерия // Труды учебных заведе-ний связи. 2019. Т. 5. № 3. С. 45‒56. DOI:10.31854/1813-324X-2019-5-3-45-56

ТРУДЫ УЧЕБНЫХ ЗАВЕДЕНИЙ СВЯЗИ 2019. Т. 5. № 3
DOI:10.31854/1813-324X-2019-5-3-45-56 56 tuzs.sut.ru
Аннотация: С 2001 года, ознаменовавшего появление современной телефонии в Нигерии, наблюдается значи-тельное увеличение пропускной способности операторов мобильных сетей. Согласно отчетам Нигерийской комиссии по связи (NCC), регулирующего органа в Нигерии, общее количество подключенных активных линий составило более ста миллионов. Тем не менее, пользователи мобильных телефонов в стране получают низ-кое качество обслуживания в разных местах страны. Таким образом, NCC установил контрольные значения для различных показателей. В этом исследовании, проведенном в университете Илорина, будут сделаны вы-воды о качестве услуг, предоставляемых пользователям диапазона WCDMA операторами мобильной связи при различной дислокации пользователей.
Ключевые слова: операторы сетей мобильной связи, пропускная способность, WCDMA, качество обслужи-вания, дислокация пользователей, университет Илорина
Список используемых источников 1. History of Global System for Mobile Communication in Nigeria (GSM) // Global Technology Archive. 2012. URL:
http://www.onlinenaijatech.blogspot.in/2012/06/history-of-global-system-for-mobile.html?m=1 (дата обращения 25.09.2019) 2. Chindo S. Assessing the Impact of GSM Sub-Telecommunication Sector on the Teledensity Rate and Economic Growth in
Nigeria: Time Series Analysis // International Journal of Business and Social Science. 2013. Vol. 4. Iss. 3. 3. 2013 Year End Subscriber/Network Data Report for Telecommunications Operating Companies in Nigeria // Nigerian Com-
munications Commission. 2013. URL: https://www.ncc.gov.ng/docman-main/industry-statistics/research-reports/563-2013-year-end-subscriber-network-data-report/file (дата обращения 25.09.2019)
4. Pesavento M., Mulder W. LTE Tutorial part 1. LTE Basics // Proceedings of the Femto Forum Plenary, Reading, UK, June2010.
5. Laiho J., Wacker A., Novosad T. Radio Network Planning and Optimisation for UMTS. Chichester: John Wiley & Sons, 2006. 6. Chevallier C., Brunner C., Garavaglia A., Murray K.P., Baker K.R. WCDMA (UMTS) Deployment Handbook. Planning and
Optimization Aspects. Chichester: John Wiley & Sons, 2006. 7. Holma H., Toskala A. WCDMA for UMTS. Radio access for Third Generation Mobile Communications. Chichester: John
Wiley & Sons, 2005. 8. Ajibola A. Nigerian Telecoms Firms Frustrate Subscribers. 2015. URL: https://iwpr.net/global-voices/nigerian-telecoms-firms-fru
strate-subscribers (дата обращения 25.09.2019) 9. READ What Nigerians are Saying about MTN, GLO, AIRTEL and Others // Naij.com. URL: https://www.legit.ng/64171.html
(дата обращения 25.09.2019) 10. Adeyemi A., Nkechi O.U. NCC decries telecoms firms quality of service. The Guardian. 2017. Available from:
https://m.guardian.ng/technology/ncc-decries-telecoms-firms-quality-of-service (дата обращения 25.09.2019) 11. The Federal Government Printer. Nigerian Communications Act: Quality of Service Regulations // Federal Republic of
Nigeria Official Gazette. 2013. PP. B133‒B166. 12. Coverage Maps // Opensignal. URL: https://opensignal.com/networks/nigeria/airtel-coverage (дата обращения
25.09.2019) 13. The 2016 Mobile Network Test in the United Kingdom // P3 Connect. URL: https://www.p3-group.com/en/wp-content/
uploads/2016/11/Report-UK-2016.pdf (дата обращения 25.09.2019) 14. Chimmanee S., Jantavongso S. The performance comparison of third generation (3G) technologies for internet services
in Bangkok // J. Inf. Commun. Technol. 2016. Vol. 15. PP. 1‒31. 15. Ogunleye A.O., Soewu A., Makanjuola N.T. QoS – Comparative Management and Evaluation of GSM Telephone System in
Nigeria // The Pacific Journal of Science and Technology (PJST). 2016. Vol. 17. Iss. 2. PP. 134‒163. 16. Alexander N.N., Anthony U.O., Emmanuel O.I., Davies K.N. Evaluation and Optimization of Quality of Service (QoS) of
Mobile Cellular Networks in Nigeria // International Journal of Information and Communication Technology Research. 2013. Iss. 3(9). PP. 277‒282.
17. Oseni O.F., Popoola S.I., Enumah H., Gordian A. Radio frequency optimization of mobile networks in Abeokuta, Nigeria for improved quality of service // International Journal of Research in Engineering and Technology. 2014. Vol. 3. Iss. 8. PP. 174‒180.
18. Google Maps (n.d.). URL: http://www.maps.google.com (дата обращения 25.09.2019)