analysis of the liquefaction phenomena in the village of ...analysis of the liquefaction phenomena...
TRANSCRIPT

Bull Earthquake Eng (2011) 9:231–261DOI 10.1007/s10518-010-9228-0
ORIGINAL RESEARCH PAPER
Analysis of the liquefaction phenomena in the villageof Vittorito (L’Aquila)
Paola Monaco · Filippo Santucci de Magistris ·Salvatore Grasso · Silvano Marchetti ·Michele Maugeri · Gianfranco Totani
Received: 2 April 2010 / Accepted: 15 November 2010 / Published online: 2 December 2010© Springer Science+Business Media B.V. 2010
Abstract This paper describes a case-history of liquefaction occurred near the villageof Vittorito after the April 6, 2009 L’Aquila earthquake (moment magnitude Mw = 6.3),approximately 45 km far from the epicentre. In the document, first, an estimation of the seis-mic motion in the area has been made. Thereafter, the performed geotechnical investigationis described, followed by the application of some fast assessment criteria for the occurrenceof liquefaction, recently proposed by the new Italian Building Code. A careful assessmentof all the parameters involved in conventional Seed and Idriss (1971) liquefaction analysesis considered. The cyclic resistance ratio CRR is evaluated by cone penetration tests CPTand by in situ seismic dilatometer tests SMDT; in the latter case CRR is evaluated by dif-ferent empirical correlations with shear wave velocity Vs and horizontal stress index KD.Analytical data confirmed the observed occurrence of the liquefaction in Vittorito, even ifthe acceleration field in the area, produced by the L’Aquila earthquake, was very low.
P. Monaco · S. Marchetti · G. TotaniDepartment of Structural, Water and Soil Engineering, University of L’Aquila, Nucleo Industrialedi Bazzano Sud- S.P. 37, 67100 Monticchio—L’Aquila, Italy
F. Santucci de MagistrisS.A.V.A. Department, Structural and Geotechnical Dynamics Laboratory–StreGa, University of Molise,via Duca degli Abruzzi, 86039 Termoli, CB, Italy
S. Grasso · M. MaugeriDepartment of Civil and Environmental Engineering, University of Catania, Viale Andrea Doria 6,95125 Catania, Italy
F. Santucci de Magistris (B)Engineering Faculty, Structural and Geotechnical Dynamics Lab.–StreGa, University of Molise,via Duca degli Abruzzi, 86039 Termoli, CB, Italye-mail: [email protected]: http://www.stregadynalab.tk/; http://docenti.unimol.it/index.php?u=filippo.santucci
F. Santucci de MagistrisS.A.V.A. Department, via F. de Sanctis, 86100 Campobasso, Italy
123

232 Bull Earthquake Eng (2011) 9:231–261
Keywords L’Aquila earthquake · Attenuation relationships · Cone penetration test ·Seismic Dilatometer Test · Liquefaction
1 Introduction
On April 6, 2009, an earthquake (local magnitude ML = 5.8; moment magnitude Mw = 6.3)hit the city of L’Aquila and the surrounding region. 308 people were killed and approximately1,500 people were injured due to the collapse of masonry and reinforced concrete buildings;around 65,000 people remained homeless.
Several cases of cracks, displacement in the field and some landslides occurred, while theperformance of retaining walls and underground structures was satisfactory (GEER WorkingGroup 2009; Monaco et al. 2010).
Few cases of liquefaction were observed in the area. Aydan et al. (2009) reported about theliquefaction that occurred at the Martini district, close to the epicentral area. In that location,sand boils were observed along the Aterno River in an area located southward of the historicalcentre of L’Aquila. In addition, at Martini district, many NE-SW trending fractures parallelto the river embankment were created as a result of liquefaction. Sand boiling, as thick as150 mm, was observed in various locations, together with lateral spreading.
The Authors analysed, instead, evidences of liquefaction near the village of Vittorito,approximately 45 km far from the epicentre of the earthquake. This phenomenon is veryinteresting due to the relatively limited amount of well documented case-histories of lique-faction in Italy and because of its occurrence relatively far from the epicentre, where directand indirect effects of the earthquake should have vanished. The latter circumstance locatesthis specific event at the edge or outside from some of the threshold criteria predicted by thenew Italian Technical Code for Constructions (NTC 2008).
In the paper, an estimation of the seismic motion in the area is made, based on data collectedby the Italian Strong Motion Accelerometer Network. Then, the geotechnical investigationperformed in the area is described, followed by the application of the fast assessment criteriaof the occurrence of liquefaction reported in NTC (2008). A careful evaluation of all theparameters involved in conventional Seed and Idriss (1971) liquefaction analyses is consid-ered. The cyclic resistance ratio CRR is evaluated by cone penetration tests CPT and in situseismic dilatometer tests SMDT; in the latter case CRR is evaluated by different empiricalcorrelations with shear wave velocity Vs and horizontal stress index KD.
2 The liquefaction phenomena in Vittorito
Vittorito is a small village in the L’Aquila prefecture of around 1,000 inhabitants, locatedapproximately 40 km SE of the city of L’Aquila, at an altitude of about 370 m a.s.l.
The area where liquefaction occurred is in the lower part of the municipality, at an eleva-tion of about 250 m a.s.l., close to the right bank of the Aterno river, where ground surfaceis relatively flat. The area is utilised for agriculture purposes only and no relevant con-structions exist, except for the viaducts of the A25 Torano-Pescara highway that run somehundred meters apart from the liquefaction sites, but which were not damaged during the2009 L’Aquila earthquake.
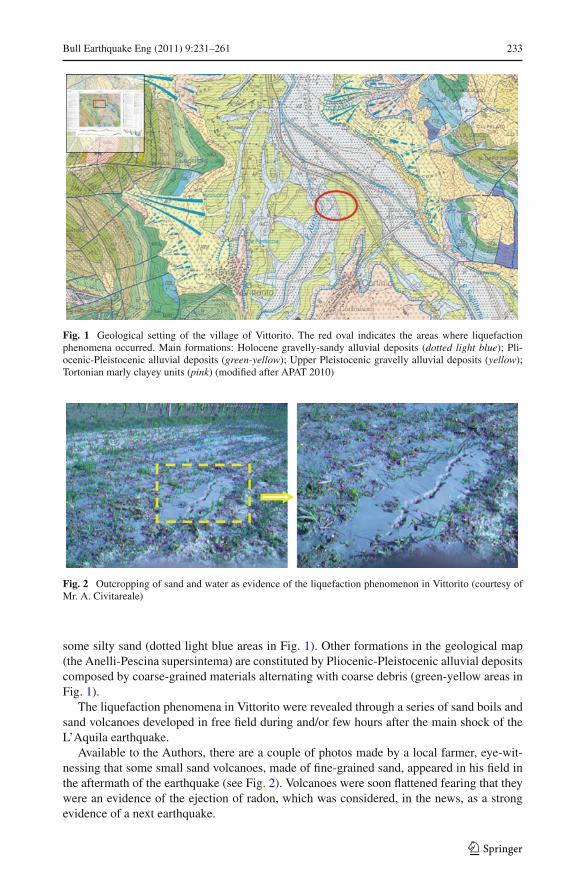
Figure 1 shows a zoom of the available geological map of the Vittorito region on a scale1:50,000. In the area, recent alluvial plain deposits are present. Particularly, the embankmentsof the Aterno river are constituted by Holocene gravelly-sandy alluvial deposits that include
123
Bull Earthquake Eng (2011) 9:231–261 233
Fig. 1 Geological setting of the village of Vittorito. The red oval indicates the areas where liquefactionphenomena occurred. Main formations: Holocene gravelly-sandy alluvial deposits (dotted light blue); Pli-ocenic-Pleistocenic alluvial deposits (green-yellow); Upper Pleistocenic gravelly alluvial deposits (yellow);Tortonian marly clayey units (pink) (modified after APAT 2010)
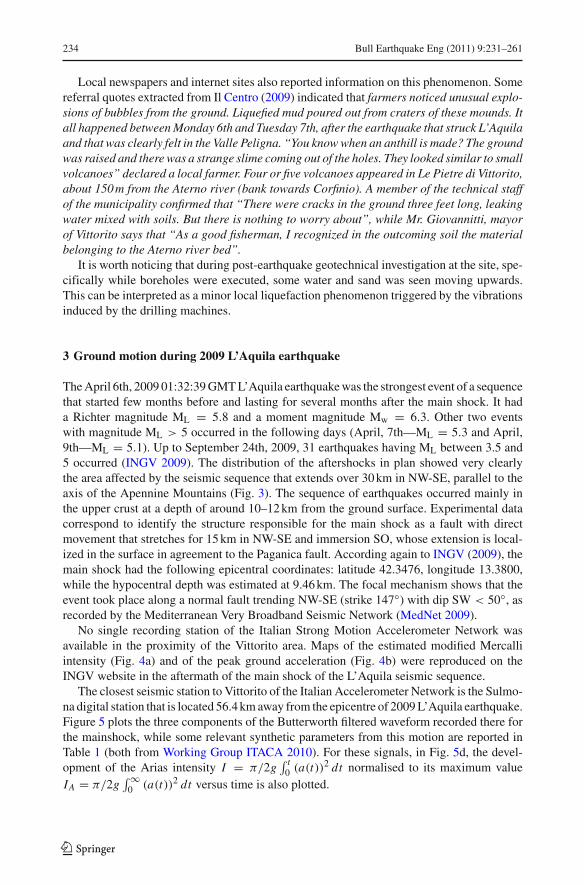
Fig. 2 Outcropping of sand and water as evidence of the liquefaction phenomenon in Vittorito (courtesy ofMr. A. Civitareale)
some silty sand (dotted light blue areas in Fig. 1). Other formations in the geological map(the Anelli-Pescina supersintema) are constituted by Pliocenic-Pleistocenic alluvial depositscomposed by coarse-grained materials alternating with coarse debris (green-yellow areas inFig. 1).
The liquefaction phenomena in Vittorito were revealed through a series of sand boils andsand volcanoes developed in free field during and/or few hours after the main shock of theL’Aquila earthquake.
Available to the Authors, there are a couple of photos made by a local farmer, eye-wit-nessing that some small sand volcanoes, made of fine-grained sand, appeared in his field inthe aftermath of the earthquake (see Fig. 2). Volcanoes were soon flattened fearing that theywere an evidence of the ejection of radon, which was considered, in the news, as a strongevidence of a next earthquake.
123
234 Bull Earthquake Eng (2011) 9:231–261
Local newspapers and internet sites also reported information on this phenomenon. Somereferral quotes extracted from Il Centro (2009) indicated that farmers noticed unusual explo-sions of bubbles from the ground. Liquefied mud poured out from craters of these mounds. Itall happened between Monday 6th and Tuesday 7th, after the earthquake that struck L’Aquilaand that was clearly felt in the Valle Peligna. “You know when an anthill is made? The groundwas raised and there was a strange slime coming out of the holes. They looked similar to smallvolcanoes” declared a local farmer. Four or five volcanoes appeared in Le Pietre di Vittorito,about 150m from the Aterno river (bank towards Corfinio). A member of the technical staffof the municipality confirmed that “There were cracks in the ground three feet long, leakingwater mixed with soils. But there is nothing to worry about”, while Mr. Giovannitti, mayorof Vittorito says that “As a good fisherman, I recognized in the outcoming soil the materialbelonging to the Aterno river bed”.
It is worth noticing that during post-earthquake geotechnical investigation at the site, spe-cifically while boreholes were executed, some water and sand was seen moving upwards.This can be interpreted as a minor local liquefaction phenomenon triggered by the vibrationsinduced by the drilling machines.
3 Ground motion during 2009 L’Aquila earthquake
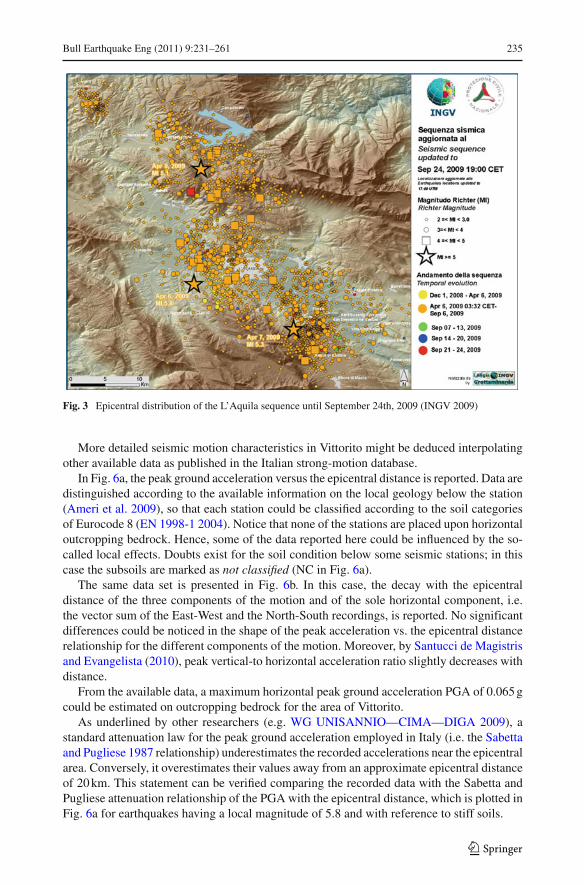
The April 6th, 2009 01:32:39 GMT L’Aquila earthquake was the strongest event of a sequencethat started few months before and lasting for several months after the main shock. It hada Richter magnitude ML = 5.8 and a moment magnitude Mw = 6.3. Other two eventswith magnitude ML > 5 occurred in the following days (April, 7th—ML = 5.3 and April,9th—ML = 5.1). Up to September 24th, 2009, 31 earthquakes having ML between 3.5 and5 occurred (INGV 2009). The distribution of the aftershocks in plan showed very clearlythe area affected by the seismic sequence that extends over 30 km in NW-SE, parallel to theaxis of the Apennine Mountains (Fig. 3). The sequence of earthquakes occurred mainly inthe upper crust at a depth of around 10–12 km from the ground surface. Experimental datacorrespond to identify the structure responsible for the main shock as a fault with directmovement that stretches for 15 km in NW-SE and immersion SO, whose extension is local-ized in the surface in agreement to the Paganica fault. According again to INGV (2009), themain shock had the following epicentral coordinates: latitude 42.3476, longitude 13.3800,while the hypocentral depth was estimated at 9.46 km. The focal mechanism shows that theevent took place along a normal fault trending NW-SE (strike 147◦) with dip SW < 50◦, asrecorded by the Mediterranean Very Broadband Seismic Network (MedNet 2009).
No single recording station of the Italian Strong Motion Accelerometer Network wasavailable in the proximity of the Vittorito area. Maps of the estimated modified Mercalliintensity (Fig. 4a) and of the peak ground acceleration (Fig. 4b) were reproduced on theINGV website in the aftermath of the main shock of the L’Aquila seismic sequence.
The closest seismic station to Vittorito of the Italian Accelerometer Network is the Sulmo-na digital station that is located 56.4 km away from the epicentre of 2009 L’Aquila earthquake.Figure 5 plots the three components of the Butterworth filtered waveform recorded there forthe mainshock, while some relevant synthetic parameters from this motion are reported inTable 1 (both from Working Group ITACA 2010). For these signals, in Fig. 5d, the devel-opment of the Arias intensity I = π/2g
∫ t0 (a(t))2 dt normalised to its maximum value
IA = π/2g∫ ∞
0 (a(t))2 dt versus time is also plotted.
123
Bull Earthquake Eng (2011) 9:231–261 235
Fig. 3 Epicentral distribution of the L’Aquila sequence until September 24th, 2009 (INGV 2009)
More detailed seismic motion characteristics in Vittorito might be deduced interpolatingother available data as published in the Italian strong-motion database.
In Fig. 6a, the peak ground acceleration versus the epicentral distance is reported. Data aredistinguished according to the available information on the local geology below the station(Ameri et al. 2009), so that each station could be classified according to the soil categoriesof Eurocode 8 (EN 1998-1 2004). Notice that none of the stations are placed upon horizontaloutcropping bedrock. Hence, some of the data reported here could be influenced by the so-called local effects. Doubts exist for the soil condition below some seismic stations; in thiscase the subsoils are marked as not classified (NC in Fig. 6a).
The same data set is presented in Fig. 6b. In this case, the decay with the epicentraldistance of the three components of the motion and of the sole horizontal component, i.e.the vector sum of the East-West and the North-South recordings, is reported. No significantdifferences could be noticed in the shape of the peak acceleration vs. the epicentral distancerelationship for the different components of the motion. Moreover, by Santucci de Magistrisand Evangelista (2010), peak vertical-to horizontal acceleration ratio slightly decreases withdistance.
From the available data, a maximum horizontal peak ground acceleration PGA of 0.065 gcould be estimated on outcropping bedrock for the area of Vittorito.
As underlined by other researchers (e.g. WG UNISANNIO—CIMA—DIGA 2009), astandard attenuation law for the peak ground acceleration employed in Italy (i.e. the Sabettaand Pugliese 1987 relationship) underestimates the recorded accelerations near the epicentralarea. Conversely, it overestimates their values away from an approximate epicentral distanceof 20 km. This statement can be verified comparing the recorded data with the Sabetta andPugliese attenuation relationship of the PGA with the epicentral distance, which is plotted inFig. 6a for earthquakes having a local magnitude of 5.8 and with reference to stiff soils.
123

236 Bull Earthquake Eng (2011) 9:231–261
Fig. 4 Shakemaps produced by INGV: (a) Modified Mercalli Intensity map and (b) Peak ground accelera-tion (PGA) map for the ML = 5.8 mainshock on 1:32 GMT, April 6th, 2009. Red triangles, INGV stations;Blue triangles, RAN stations
123

Bull Earthquake Eng (2011) 9:231–261 237
Fig. 5 Three components of therecording of the April 6th 2009L’Aquila earthquake mainshockat the Sulmona station anddevelopment of the normalizedenergy of the signals (data fromWG ITACA 2010): a East-WestEW component; b North-SouthNS component; c Up-Down UDcomponent; and, d developmentof the normalized Arias intensitywith time -40
-30
-20
-10
0
10
20
30
40
0 10 20 30 40 50 60 70 80 90 100
Time, t (s)A
ccel
erat
ion,
a (
cm/s
2)
-40
-30
-20
-10
0
10
20
30
40
0 10 20 30 40 50 60 70 80 90 100
Time, t (s)
Acc
eler
atio
n, a
(cm
/s2)
(a)
(b)
-40
-30
-20
-10
0
10
20
30
40
Time, t (s)
Acc
eler
atio
n, a
(cm
/s2)
0
0.1
0.2
0.3
0.4
0.5
0.6
0.7
0.8
0.9
1
0 10 20 30 40 50 60 70 80 90 100
15 20 25 30 35 40 45
Time, t (s)
Nor
mal
ised
Aria
s In
tens
ity, I
/I A
WENSUP
NS UD
WE
(c)
(d)
EW component
NS component
UD component
123

238 Bull Earthquake Eng (2011) 9:231–261
Table 1 Some parameters from the recording of the April 6th 2009 L’Aquila earthquake mainshock at theSulmona station (data from Working Group ITACA 2010)
EW NS UD
Peak acceleration (cm/s2) −27.13 −33.70 23.59
Peak velocity (cm/s) −3.73 −2.79 −2.45
Peak displacement (cm) 1.23 1.00 0.84
Arias intensity (cm/s) 1.00 0.95 0.49
T90 (s) 14.74 15.64 22.75
0,1
1
10
100
1000
1000100101Pea
k gr
ound
acc
eler
atio
n, P
GA
(cm
/s2)
Epicentral distance, Repi (km)
A site
B site
C site
NC
S&P (1987)
Vittorito
Threshold acc. in NTC2008
(a)
median
median + 1 SD
median - 1 SD
0.1
1
10
100
1000
1000100101
Epicentral distance, Repi (km)
Pea
k gr
ound
acc
eler
atio
n, P
GA
(cm
/s2)
EWNSUDhor
(b)
Vittorito
Fig. 6 Attenuation of the peak ground acceleration with the epicentral distance for the April 6th 2009 L’Aquilaearthquake: (a) data classified according to the ground category below the recording stations compared withthe Sabetta and Pugliese (1987) (S&P, 1987) attenuation relationship (average values in red-violet, average ±one standard deviation in light-blue) and (b) attenuation of all the components of the motion
The same consideration applies if other attenuation relationships are employed. Forinstance, Tropeano and Silvestri, in a personal communication, estimated a mean peak groundacceleration equal to 0.073 g for the area of Vittorito using the Ambraseys et al. (1996)
123

Bull Earthquake Eng (2011) 9:231–261 239
1.0E-05
1.0E-04
1.0E-03
1.0E-02
1.0E-01
1.0E+00
1.0E+01
1000100101
Epicentral distance, Repi (km)
Aria
s In
tens
ity, I
A (
m/s
)
EWNSUDhor
Vittorito
Fig. 7 Attenuation of the Arias intensity with the epicentral distance for the April 6th 2009 L’Aquilaearthquake
1
10
100
1000100101
Epicentral distance, Repi (km)
Sig
nific
ant d
urat
ion,
t 95-
t 5 (
s)
EWNSUDhor
Vittorito
Fig. 8 Increment of the significant duration with the epicentral distance for the April 6th 2009 L’Aquilaearthquake
attenuation law, but they noticed that the same formulation overestimates the measuredacceleration at the Sulmona recording station. Coherently with the Ambraseys et al. (1996)relationship, they evaluated the site to source distance (i.e., the shortest distance of the siteto the surface projection of the rupture surface) according to the Joyner and Boore (1981)formulation. In this case, the fault definition by Cirella et al. (2009) was employed.
The overall motion in the Vittorito area was not so strong in any case, as can be seen fromFig. 7, where the decay of the Arias intensity with distance is reported. Its value can be esti-mated in the order of 1 · 10−2 m/s, while, again, no large differences can be observed for thedifferent components of the motion (i.e., those obtained from the East-West, the North-Southand the Up-Down recorded accelerograms).
An assessment on the duration of earthquake in Vittorito can be made from Fig. 8. In thiscase, the significant duration is defined, for each accelerogram, as the time interval betweenthe instants at which the 5 and 95% of the total energy was reached (Trifunac and Brady1975, see also Fig. 5). An approximate significant duration of about 20 s can be expected atthe potentially liquefied sites.
123

240 Bull Earthquake Eng (2011) 9:231–261
Fig. 9 Location of tests in the area of Vittorito to analyse the occurrence of liquefaction (BH=borehole;SDMT= seismic dilatometer test; CPT = cone penetration test)
4 Geotechnical investigations
A geotechnical investigation was conducted at different sites within a small area where theliquefaction phenomenon was observed. Particularly, two shallow boreholes BH were exe-cuted (from the extracted samples, the grading curves of some of the materials were detected),three in situ seismic dilatometer tests SDMT and one cone penetration test CPT were carriedout to analyse the soil resistance to liquefaction. The location of the tests is reported in Fig. 9.
Stratigraphic logs, having an overall length of about 5 m, show that in the area the subsoilprofile is comprised of an upper layer of vegetable soil having a thickness of about 1 m.This stratum lies above a sandy silt layer having a thickness of about 2 m below which somegravelly materials, with various degrees of cementation, were found. Therefore, it appearsthat in the first few meters of subsoil, the average particle size of the material increases withdepth.
Water table is located at about 0.3 ÷ 0.5 m below the ground level.Figure 10 shows the available grading curves for the shallow materials. Two main soil
formations are observed: sandy silt and gravelly sand. The former was found at a depth lowerthan 1.7 m (tests S1-1, S1-2, S2-2), the latter at a larger depth (tests S1-3, S2-3, S2-4). In bothcases, the uniformity coefficient of the materials is relatively high (i.e., soil particle sizescover a large range).
Figure 11 summarizes the results of the three seismic dilatometer tests that were executedin the area. The flat dilatometer test is a very comprehensive in situ testing technique ableto detecting detailed information on soil properties and their variation with depth. Read-ers might refer to ISSMGE, TC16 (2001) for a detailed explanation on the parameters thatcan be obtained with this testing procedure, their engineering significance and their limits.
123

Bull Earthquake Eng (2011) 9:231–261 241
0
10
20
30
40
50
60
70
80
90
100
0,001 0,01 0,1 1 10 100
Per
cent
fine
r by
wei
ght,
p (%
)
Particle size, d (mm)
S1-1 (0.0-0.5 m)
S1-2 (1.7-1.8 m)
S1-3 (2.5-3.0 m)
S2-2 (1.0-1.7 m)
S2-3 (1.7-2.1 m)
S2-4 (2.5-3.3 m)
Silt Sand Gravel
Threshold curves in NTC, 2008
Fig. 10 Grading curves of some materials in the potentially liquefied area and limit curves for a preliminaryscreening of the liquefaction potential for soil (see Fig. 13) with high coefficient of uniformity as in NTC(2008). The depth of the sample for each borehole is given in the legend
Fig. 11 Results of three Seismic Dilatometer tests in the area of Vittorito
The equipment was recently improved with a seismic module, allowing obtaining reliableshear wave velocity profiles using a kind of double receiver down-hole technique (Marchettiet al. 2008).
The SDMT output in Fig. 11 displays the profile of the shear wave velocity Vs as well asthe profiles of four basic DMT parameters—the material index ID (soil type), the constrainedmodulus M, the undrained shear strength su and the horizontal stress index KD (related toOCR)—obtained using current DMT correlations (see ISSMGE, TC16 2001, Table 1).
The above parameters are obtained from the two DMT pressure readings: p0 = pressurenecessary to balance the soil pressure and start the movement of the membrane, and p1 =pressure necessary to move the center of the membrane 1.1 mm against the soil. The mate-rial index ID = (p1 − p0)/(p0 − u0) provides information on soil type—sand, silt, clay(u0 = pre-insertion in situ pore pressure). The horizontal stress index KD = (p0 − u0)/σ
′v0
is related to stress history (σ ′v0 =pre-insertion in situ overburden stress). The profile of KD
123

242 Bull Earthquake Eng (2011) 9:231–261
is similar in shape to the profile of the overconsolidation ratio OCR. In clays KD ≈ 2indicates OCR = 1, KD > 2 indicates overconsolidation. The constrained modulus M(vertical drained confined 1-D tangent modulus at σ ′
v0) is obtained as M = RMED, whereED = 34.7 (p1 − p0) is the dilatometer modulus, derived by simple theory of elasticity, andRM = f (ID, KD) is a correction factor introduced to take into account overconsolidationand possible high lateral stresses (incorporated via KD), that reduce considerably soil com-pressibility. The undrained shear strength in clays is obtained as su = 0.22 σ ′
v0 (0.5 KD)1.25.From Fig. 11, it appears that the soil profiles are almost similar at the three locations where
the tests are performed. At a first glance, it also appears that, excluding the gravelly stratafrom approximately 3 to 6 m below the ground level, the mechanical properties of the soilare relatively poor.
Figure 12 shows the results of the cone penetration test, CPT. Data were obtained usinga standard penetration apparatus with a maximum penetration force of 200 kN. The test wasterminated at a depth of about 7 m from the ground level, due to the attainment of the maxi-mum loading capability of the device. Above that depth, the soil shows a very low penetrationresistance at the cone tip qc in the first couple of meters, while qc is relatively higher between3 and 7 m below the ground level.
The same figure also depicts some physical and mechanical characteristics of the subsoil,as directly derived from the CPT interpretation. Particularly, from the knowledge of thesleeve resistance fs, the friction ratio profile fs/qc is reported. This ratio is higher in the firstcouple of meters and then it decreases at larger depth. The relative density profile and theeffective friction angle profile are also plotted. Relative density is obtained employing boththe Harman (1976) and Jamiolkowski et al. (2001) relationships, while the effective frictionangle is calculated from qc using both the Caquot (1934) and the Kulhawy and Mayne (1990)correlations. From the latter diagrams it appears that a loose shallow layer of sand havingpoor mechanical properties, approximately two meters thick, is followed by a subsequentportion of a soil having better geotechnical characteristics.
5 Fast assessment of liquefaction according to NTC 2008
The new Italian Technical Code for Constructions (NTC 2008) includes specific require-ments to exclude the liquefaction phenomenon, modifying an approach already reported inEurocode 8 (EN 1998-1 2004). Such requirements are related both to the expected seismicityin the area and to the characteristics of the subsoil. The Italian Code asserts that it is possibleto skip the verification when at least one of the following circumstances occur:
1. Moment magnitude Mw of the expected earthquake lower than 5;2. Maximum expected horizontal acceleration at the ground level, in free-field conditions,
lower than 0.1 g;3. Seasonal average depth of groundwater larger than 15 m below the ground level, for
sub-horizontal ground and structures with shallow foundations;4. Subsoil constituted by clean sands having normalized penetrometer resistance (N1)60 >
30 or qc1N > 180, where (N1)60 and qc1N are respectively the blow count from SPT andthe CPT cone resistance, normalized to a vertical effective stress of 100 kPa; and,
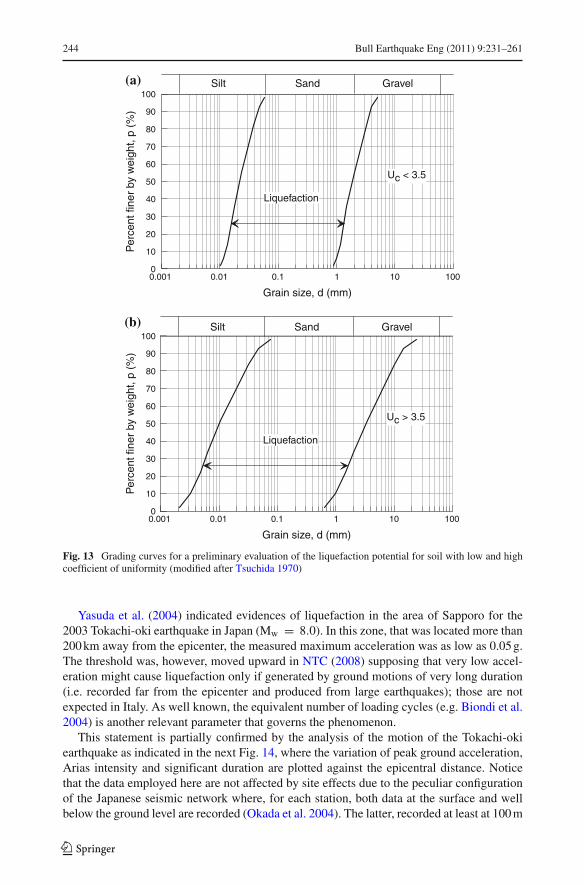
5. Grading curve distribution external to some specific areas for soils having a uniformitycoefficient Uc < 3.5 (Fig. 13a) and for soils having Uc > 3.5 (Fig. 13b).
Santucci de Magistris (2006) explains in detail the technical motivations behind the choiceof such criteria. In this study, the above conditions were checked against a real case of
123

Bull Earthquake Eng (2011) 9:231–261 243
0
2
4
6
8
10
12
14
16
18
Sleeve friction, fs (kPa)
Dep
th, z
(m
)
0
2
4
6
8
10
12
14
16
18
Dep
th, z
(m
)
Friction ratio, FR= fs /qc (%)
0
2
4
6
8
10
12
14
16
18
Dep
th, z
(m
)
Relative density, D R (%)
Harmon
Jamiolkowski et al.
0
2
4
6
8
10
12
14
16
18
0 200 400 600 800 1000 0 5 10 150 10 20 30 40 50
Penetration resistance, q c (MPa)D
epth
, z (
m)
0
2
4
6
8
10
12
14
16
18
-20 20 60 100 0 10 20 30 40 50
Effective friction angle, φ (°)
Dep
th, z
(m
)
Kulhawy & Maine
Caquot
Fig. 12 Data from one Cone Penetration Test in the area of Vittorito and some derived physical and mechanicalparameters of the subsoil
liquefaction that occurred in Italy. It can be seen in the following that, based on the availabledata, the liquefaction case-history at Vittorito is in the borderline or against some of the abovelisted criteria.
As to points (1) and (3), both the magnitude of the L’Aquila mainshock and the shallowdepth of the water table indicate that the occurrence of liquefaction in Vittorito cannot beexcluded. Criterion (4) is not employed here, since analyses of the whole investigated profileare performed in the following Sect. 6.
As previously specified, a horizontal peak ground acceleration of 0.065 g was expectedon outcropping bedrock in Vittorito. This acceleration is well below the threshold reportedin NTC (2008), which was set to 0.1 g. The latter was obtained evaluating, in an approximateway, the peak acceleration at the ground level in correspondence to the minimum value ofthe cyclic stress ratio CSR in the conventional verification charts.
123
244 Bull Earthquake Eng (2011) 9:231–261
Grain size, d (mm)
0
10
20
30
40
50
60
70
80
90
100
Per
cent
fine
r by
wei
ght,
p (%
)
Liquefaction
Uc < 3.5
(a)
0.001 0.01 0.1 1 10 100
0.001 0.01 0.1 1 10 100
Grain size, d (mm)
0
10
20
30
40
50
60
70
80
90
100
Per
cent
fine
r by
wei
ght,
p (%
)
Liquefaction
Uc > 3.5
(b)
Silt Sand Gravel
Silt Sand Gravel
Fig. 13 Grading curves for a preliminary evaluation of the liquefaction potential for soil with low and highcoefficient of uniformity (modified after Tsuchida 1970)
Yasuda et al. (2004) indicated evidences of liquefaction in the area of Sapporo for the2003 Tokachi-oki earthquake in Japan (Mw = 8.0). In this zone, that was located more than200 km away from the epicenter, the measured maximum acceleration was as low as 0.05 g.The threshold was, however, moved upward in NTC (2008) supposing that very low accel-eration might cause liquefaction only if generated by ground motions of very long duration(i.e. recorded far from the epicenter and produced from large earthquakes); those are notexpected in Italy. As well known, the equivalent number of loading cycles (e.g. Biondi et al.2004) is another relevant parameter that governs the phenomenon.
This statement is partially confirmed by the analysis of the motion of the Tokachi-okiearthquake as indicated in the next Fig. 14, where the variation of peak ground acceleration,Arias intensity and significant duration are plotted against the epicentral distance. Noticethat the data employed here are not affected by site effects due to the peculiar configurationof the Japanese seismic network where, for each station, both data at the surface and wellbelow the ground level are recorded (Okada et al. 2004). The latter, recorded at least at 100 m
123

Bull Earthquake Eng (2011) 9:231–261 245
0.1
1
10
100
1000
1000100101
Epicentral distance, Repi (km)
Pea
k gr
ound
acc
eler
atio
n, P
GA
(cm
/s2 )
WENSUDhor
(a)
1.00E-06
1.00E-05
1.00E-04
1.00E-03
1.00E-02
1.00E-01
1.00E+00
1.00E+01
1000100101
Epicentral distance, Repi (km)
Aria
s In
tens
ity, I
A (
m/s
) EWNSUDhor
(b)
1
10
100
1000
1000100101
Epicentral distance, Repi (km)
Sig
nific
ant d
urat
ion,
t 95-
t 5 (
s)
EWNSUDhor
(c)
Fig. 14 Variation of the seismic motion with the epicentral distance for the 2003 Tokachi-oki earthquake,Japan: (a) peak ground acceleration; (b) Arias intensity; and (c) significant duration. Blue lines indicate theepicentral distance of the area where liquefaction was observed (data after NEID 2010)
below the ground level, are employed for the plot presented here. It is worth mentioning thatthe epicenter of this earthquake was 75 km off the Japan coastline and therefore seismic datain the near-field area were not available.
123

246 Bull Earthquake Eng (2011) 9:231–261
0
1
2
3
4
5
6
7
8
9
1000100101
Epicentral distance, Repi (km)
Mom
ent m
agni
tude
, Mw
Galli, 2000 (Eq. 12)Galli, 2000 (Eq. 13)Kuribayashi, Tatsuoka, 1975Ambraseys, 1988Wakamatsu, 1991Wakamatsu, 1993
Threshold in NTC, 2008
Liquefaction
No Liquefaction
Test site
Fig. 15 Magnitude-distance relationship separating liquefaction/non-liquefaction case histories. Point rep-resentative of the analyzed case-history is compared with Eqs. 12 and 13 of Galli (2000) and relationshipsreported in Kuribayashi and Tatsuoka (1975); Ambraseys (1988) and Wakamatsu (1991, 1993)
As a matter of fact, for the sites in northern Japan where liquefaction occurred, Ariasintensity was about 1 · 10−1 m/s and significant duration was about 70–80 s. Then, eventhough both Vittorito and sites in Japan are placed at the same order of extent of PGA, thecharacteristics of the motion in the former case are reduced compared with the latter.
Combined information of magnitude and epicentral distance allow assessing the occur-rence of liquefaction based on historical evidences. Such criterion is employed, for instance,to assess the maximum extent of a liquefaction susceptible area in Grade-I seismic zonationanalysis (ISSMGE, TC4 1999). Some of the literatures evaluating the threshold curves sep-arating liquefaction/non liquefaction case histories are reported in Fig. 15 together with thecouple magnitude-epicentral distance for the liquefaction phenomenon in Vittorito.
To construct the graph in Fig. 15, all the data were converted into moment magnitudeusing Utsu (1982) relationships. It appears again that the situation at the test site is borderlinecompared with the previously derived relationships, including Equations (12) and (13) ofGalli (2000), calibrated entirely on historical Italian data.
Finally, the limit grading curves (Fig. 13) employed to exclude the liquefaction phenome-non developed for harbour structures in Japan (see for instance PIANC 2001) and adopted inthe new Italian Building Code (NTC 2008) are reported in the previous illustrated Fig. 10. Itappears that, for this specific case, the grading curve distribution does not allow for a-prioriexclusion of the liquefaction phenomenon.
6 Assessment of the liquefaction potential using in situ tests
6.1 Procedures of analysis
To verify the possibility of liquefaction occurrence in Vittorito, three simplified procedureswere used.
The methods are based on the comparison, at a given depth below the ground level, betweenthe available seismic resistance to liquefaction and the seismic load. Both the parameters are
123

Bull Earthquake Eng (2011) 9:231–261 247
normalized to the current vertical effective geostatic stress to respectively define the non-dimensional cyclic resistance ratio, CRR and the non-dimensional cyclic stress ratio, CSR.If the stress ratio is larger than the resistance ratio liquefaction occurs.
The first procedure, by Andrus and Stokoe (2000) and Andrus et al. (2004), uses the shearwave velocity Vs to detect the soil resistance.
The second is pivoted on the cone penetration test as proposed by Robertson and Wride(1998), and is considered one of the most accurate and complete methodology for the deter-mination of the cyclic resistance profile (Youd et al. 2001). Both CPT-based and Vs-basedmethods were reviewed by Idriss and Boulanger (2004) and, in this research, the formulationreported in this specific paper is followed.
The third method instead, recently introduced by Monaco et al. (2005), employs thehorizontal stress index KD obtained by the flat dilatometer tests to detect the soil resis-tance to liquefaction. It is worth noticing that the seismic dilatometer SDMT routinely pro-vides, among other measurements, pairs of profiles of KD and Vs—both correlated with theliquefaction resistance of sands. Hence, SDMT permits obtaining two parallel independentestimates of liquefaction resistance, one from KD and the other from Vs, using CRR-KD
and CRR-VS correlations, in the framework of the commonly used Seed and Idriss (1971)simplified procedure.
As well known, simplified computational methods allow defining the liquefaction safetyfactor, LSF, through the ratio between the capacity of the soil to resist liquefaction and theseismic demand of the deposit:
LSF = CRR
CSR=
(CRR7.5
CSR
)
· MSF (1)
In Eq. (1), CRR7.5 represents the cyclic resistance ratio for an earthquake of magnitude 7.5,CSR is the cyclic stress ratio and MSF is a “Magnitude Scaling Factor”.
The cyclic stress ratio is determined, for the three procedures, by the same relation pro-posed by Seed and Idriss (1971), while the cyclic resistance ratio is calculated with differentformulations, according to the data available from different in situ tests.
The cyclic stress ratio, at one defined depth, is estimated by the following expression:
CSR = τaverage
σ ′v0
= 0.65amax s
g
σv0
σ ′v0
rd (2)
where amax, s is the peak ground acceleration at the soil surface; g is the gravitational acceler-ation, σv0 and σ ′
v0 are, respectively, the total and effective vertical overburden stresses; rd isa shear stress reduction coefficient of the seismic action that accounts for the deformabilityof the soil.
amax, s can be obtained by the product of the design ground acceleration ag for stiff typeA ground and a soil factor S, which depends on the subsoil stiffness, often synthesized by anequivalent shear wave velocity Vs,30 (Eurocode 8, EN 1998-1 2004). Santucci de Magistris(2006) and Santucci de Magistris and Evangelista (2007) discuss on the use of S in Eq. (2).In this research, an arbitrary value S=1.35 is assumed (i.e., the one for ground type D thatis constituted by deposits of loose-to-medium cohesionless soil, with or without some softcohesive layers, in Eurocode 8), the available data not allowing for the direct computation ofthe site amplification factor.
123
248 Bull Earthquake Eng (2011) 9:231–261
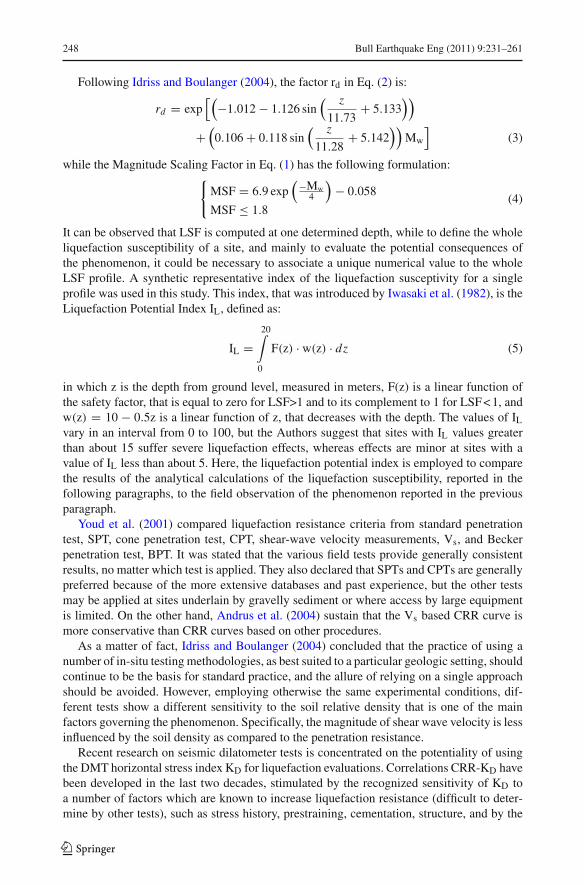
Following Idriss and Boulanger (2004), the factor rd in Eq. (2) is:
rd = exp[(
−1.012 − 1.126 sin( z
11.73+ 5.133
))
+(
0.106 + 0.118 sin( z
11.28+ 5.142
))Mw
](3)
while the Magnitude Scaling Factor in Eq. (1) has the following formulation:{
MSF = 6.9 exp(−Mw
4
)− 0.058
MSF ≤ 1.8(4)
It can be observed that LSF is computed at one determined depth, while to define the wholeliquefaction susceptibility of a site, and mainly to evaluate the potential consequences ofthe phenomenon, it could be necessary to associate a unique numerical value to the wholeLSF profile. A synthetic representative index of the liquefaction susceptivity for a singleprofile was used in this study. This index, that was introduced by Iwasaki et al. (1982), is theLiquefaction Potential Index IL, defined as:
IL =20∫
0
F(z) · w(z) · dz (5)
in which z is the depth from ground level, measured in meters, F(z) is a linear function ofthe safety factor, that is equal to zero for LSF>1 and to its complement to 1 for LSF < 1, andw(z) = 10 − 0.5z is a linear function of z, that decreases with the depth. The values of IL
vary in an interval from 0 to 100, but the Authors suggest that sites with IL values greaterthan about 15 suffer severe liquefaction effects, whereas effects are minor at sites with avalue of IL less than about 5. Here, the liquefaction potential index is employed to comparethe results of the analytical calculations of the liquefaction susceptibility, reported in thefollowing paragraphs, to the field observation of the phenomenon reported in the previousparagraph.
Youd et al. (2001) compared liquefaction resistance criteria from standard penetrationtest, SPT, cone penetration test, CPT, shear-wave velocity measurements, Vs, and Beckerpenetration test, BPT. It was stated that the various field tests provide generally consistentresults, no matter which test is applied. They also declared that SPTs and CPTs are generallypreferred because of the more extensive databases and past experience, but the other testsmay be applied at sites underlain by gravelly sediment or where access by large equipmentis limited. On the other hand, Andrus et al. (2004) sustain that the Vs based CRR curve ismore conservative than CRR curves based on other procedures.
As a matter of fact, Idriss and Boulanger (2004) concluded that the practice of using anumber of in-situ testing methodologies, as best suited to a particular geologic setting, shouldcontinue to be the basis for standard practice, and the allure of relying on a single approachshould be avoided. However, employing otherwise the same experimental conditions, dif-ferent tests show a different sensitivity to the soil relative density that is one of the mainfactors governing the phenomenon. Specifically, the magnitude of shear wave velocity is lessinfluenced by the soil density as compared to the penetration resistance.
Recent research on seismic dilatometer tests is concentrated on the potentiality of usingthe DMT horizontal stress index KD for liquefaction evaluations. Correlations CRR-KD havebeen developed in the last two decades, stimulated by the recognized sensitivity of KD toa number of factors which are known to increase liquefaction resistance (difficult to deter-mine by other tests), such as stress history, prestraining, cementation, structure, and by the
123

Bull Earthquake Eng (2011) 9:231–261 249
0
2
4
6
8
10
12
14
16
18
Shear wave velocity, V S (m/s)
Dep
th, z
(m
)
0
2
4
6
8
10
12
14
16
18
Cyclic stress ratio, CSR/MSFCyclic resistance ratio, CRR
Dep
th, z
(m
)
CSRCRR
0
2
4
6
8
10
12
14
16
18
0 100 200 300 0 0.2 0.4 0.6 0 5 10
Liquefaction safety factor, LSF
Dep
th, z
(m
)
0
0.1
0.2
0.3
0.4
0.5
0.6
0 50 100 150 200 250
Normalized shear wave velocity, vs1 (m/s)
Cyc
lic s
tres
s ra
tio, C
SR
or
Cyc
lic r
esis
tanc
e ra
tio, C
RR Fc <=5%
Fc= 15%Fc >= 35%no liquefactionliquefaction
(a) (b) (c)
(d)
Fig. 16 Example of verification charts using the shear wave velocity from SDMT1: shear wave velocityprofile (a); cyclic stress ratio and cyclic resistance ratio profiles (b); liquefaction safety factor profile (c) andliquefaction limit curves (d)
relationship of KD to relative density and state parameter. A key element of the correlationCRR-KD (Monaco and Schmertmann 2007; Monaco and Marchetti 2007) is the ability of KD
to reflect aging in sands, a factor having a first order of magnitude influence on liquefactionbehaviour (see for instance Leon et al. 2006).
A summary of the various correlations developed to estimate CRR from KD (for magni-tude M=7.5 and clean sand) to be used according to the Seed and Idriss (1971) simplifiedprocedure, including the latest CRR-KD correlation based on all previous data, can be foundin Monaco et al. (2005).
123

250 Bull Earthquake Eng (2011) 9:231–261
Fig. 17 Liquefaction potentialindex profiles for the investigatedsites in Vittorito, using the shearwave velocity and results of theCone Penetration Test
0
2
4
6
8
10
12
14
16
18
0 5 10 15 20
Liquefaction potential index, IL
Dep
th, z
(m
)
SDMT1SMDT2SMDT3CPT
Previous comparisons based on parallel measurements of KD and Vs by SDMT at severalsandy sites (Maugeri and Monaco 2006) have indicated that methods based on KD and Vs
often provide substantially different estimates of CRR. Generally CRR from Vs was found tobe “more optimistic”. This finding opens the question “which CRR should be given greaterweight”, which is discussed by Maugeri and Monaco (2006) and by Monaco and Marchetti(2007).
6.2 Assessment of the liquefaction potential using the shear wave velocity profiles
As an example, Fig. 16 shows the verification charts obtained using the shear wave velocityprofile obtained by SDMT1 (Fig. 16a). Specifically, in Fig. 16b the cyclic stress ratio andthe cyclic resistance ratio profiles are reported, while in Fig. 16c depicts the liquefactionsafety factor profile. The data are also plotted in Fig. 16d along with the liquefaction limitcurves. In the latter case, the red solid symbols indicate the condition of the potential occur-rence of the liquefaction phenomenon. It appears that the liquefaction safety factor assumesa value less than one at a depth ranging between 1 and 2.5 m. In this layer, liquefaction isexpected to occur. By the way, using shear wave velocity alone is questionable for detectingsoil liquefaction (Idriss and Boulanger 2004).
In Fig. 17 the liquefaction potential indices for the three investigated sites, as obtainedusing the shear wave velocity measurements, are reported. It can be noticed that their valuesare relatively low, indicating, however, that the potential liquefaction phenomena concentratesonly in the top part of the subsoil.
6.3 Assessment of the liquefaction potential using the cone penetration resistance
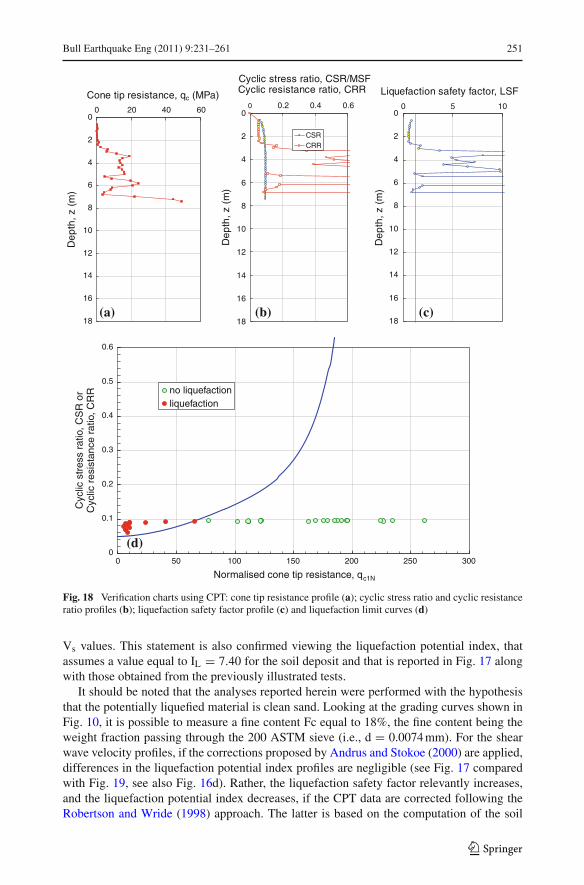
Verification charts obtained using the Cone Penetration Test data are reported in Fig. 18 usingthe same type of diagrams as that for the shear wave velocity (i.e., tip resistance in Fig. 18a;cyclic stress ratio and cyclic resistance ratio profiles in Fig. 18b; the liquefaction safety factorprofile in Fig. 18c and the liquefaction limit curve in Fig. 18d). It can be observed again thatthe computed liquefaction safety factors assume values lesser than one in the shallow partof the soil profile, so that the obtained results are very similar to those determined using the
123
Bull Earthquake Eng (2011) 9:231–261 251
0
2
4
6
8
10
12
14
16
18
Cone tip resistance, qc (MPa)
Dep
th, z
(m
)
0
2
4
6
8
10
12
14
16
18
0 20 40 60 0 0.2 0.4 0.6
Cyclic stress ratio, CSR/MSFCyclic resistance ratio, CRR
Dep
th, z
(m
)
CSRCRR
0
2
4
6
8
10
12
14
16
18
0 5 10
Liquefaction safety factor, LSF
Dep
th, z
(m
)
0
0.1
0.2
0.3
0.4
0.5
0.6
0 50 100 150 200 250 300
Normalised cone tip resistance, qc1N
Cyc
lic s
tres
s ra
tio, C
SR
or
Cyc
lic r
esis
tanc
e ra
tio, C
RR no liquefaction
liquefaction
(a) (b) (c)
(d)
Fig. 18 Verification charts using CPT: cone tip resistance profile (a); cyclic stress ratio and cyclic resistanceratio profiles (b); liquefaction safety factor profile (c) and liquefaction limit curves (d)
Vs values. This statement is also confirmed viewing the liquefaction potential index, thatassumes a value equal to IL = 7.40 for the soil deposit and that is reported in Fig. 17 alongwith those obtained from the previously illustrated tests.
It should be noted that the analyses reported herein were performed with the hypothesisthat the potentially liquefied material is clean sand. Looking at the grading curves shown inFig. 10, it is possible to measure a fine content Fc equal to 18%, the fine content being theweight fraction passing through the 200 ASTM sieve (i.e., d = 0.0074 mm). For the shearwave velocity profiles, if the corrections proposed by Andrus and Stokoe (2000) are applied,differences in the liquefaction potential index profiles are negligible (see Fig. 17 comparedwith Fig. 19, see also Fig. 16d). Rather, the liquefaction safety factor relevantly increases,and the liquefaction potential index decreases, if the CPT data are corrected following theRobertson and Wride (1998) approach. The latter is based on the computation of the soil
123

252 Bull Earthquake Eng (2011) 9:231–261
Fig. 19 Liquefaction potentialindex profiles for the investigatedsites in Vittorito using the shearwave velocity from SMDT andthe cone penetration resistancefrom CPT, accounting for the finecontent of the materials
0
2
4
6
8
10
12
14
16
18
0 5 10 15 20
Liquefaction potential index, IL
Dep
th, z
(m
)
SDMT1SMDT2SMDT3CPT
behaviour type index Ic that can be calculated based on the cone tip resistance qc and the sleeveresistance fs. Differences in the analytical results of the analyses can be re-observed compar-ing Fig. 17 with Fig. 19, where the liquefaction potential indices, computed by accounting forthe fine fraction, are plotted. It should be recalled that, as underlined by Idriss and Boulanger(2004), the use of CPT data alone to determine the grain size characteristics can lead to unre-liable results in many cases, particularly while dealing with soils in the transitional rangebetween silty sand and silty clay.
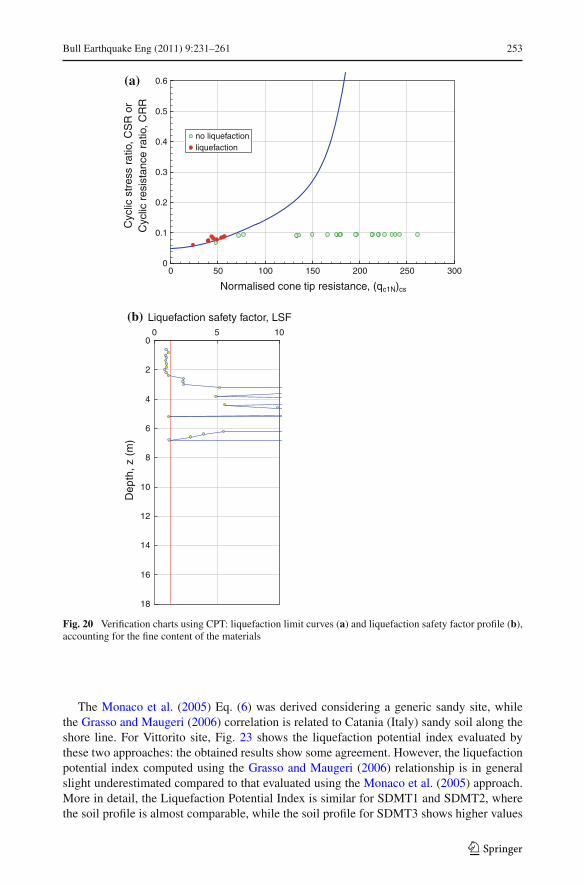
Liquefaction chart and liquefaction safety factor profile using data corrected for the finecontent are reported in Fig. 20.
It can be seen that liquefaction could occur at a depth ranging between 1 and 2.5 m fromthe ground level, where the liquefaction safety factor assumes value lesser than one; also thesafety factor is about one at some specific depth between 5 and 6.5 m below the ground level.
6.4 Assessment of the liquefaction potential using the DMT horizontal stress index
At the site of Vittorito, the cyclic stress ratio CSR calculated using Eq. (2) was comparedwith the cyclic resistance ratio CRR evaluated from KD according to Monaco et al. (2005):
CRR = 0.0107 K3D − 0.0741 K2
D + 0.2169 KD − 0.1306 (6)
Figure 21b shows the comparison of the profiles of CSR and CRR estimated from KD
obtained by SDMT1 (shown in Fig. 21a). Figure 21c shows the corresponding profile of theliquefaction safety factor. The CSR-KD data points obtained from SDMT1 are also plottedin Fig. 21d together with the liquefaction boundary curve. In this figure the red solid symbolsindicate the condition of possible occurrence of liquefaction.
Comparable results have been obtained for SDMT2 and SDMT3 (see profiles of theliquefaction potential index IL in Fig. 22).
Figure 23 shows a comparison of the liquefaction potential index computed according toMonaco et al. (2005) and that evaluated with the empirical CRR − KD correlation reportedby Grasso and Maugeri (2006):
CRR = 0.0308 e(0.6054KD) (7)
123
Bull Earthquake Eng (2011) 9:231–261 253
0
0.1
0.2
0.3
0.4
0.5
0.6
0 50 100 150 200 250 300
Normalised cone tip resistance, (qc1N)cs
Cyc
lic s
tres
s ra
tio, C
SR
or
Cyc
lic r
esis
tanc
e ra
tio, C
RR
no liquefactionliquefaction
0
2
4
6
8
10
12
14
16
18
0 5 10
Liquefaction safety factor, LSF
Dep
th, z
(m
)
(a)
(b)
Fig. 20 Verification charts using CPT: liquefaction limit curves (a) and liquefaction safety factor profile (b),accounting for the fine content of the materials
The Monaco et al. (2005) Eq. (6) was derived considering a generic sandy site, whilethe Grasso and Maugeri (2006) correlation is related to Catania (Italy) sandy soil along theshore line. For Vittorito site, Fig. 23 shows the liquefaction potential index evaluated bythese two approaches: the obtained results show some agreement. However, the liquefactionpotential index computed using the Grasso and Maugeri (2006) relationship is in generalslight underestimated compared to that evaluated using the Monaco et al. (2005) approach.More in detail, the Liquefaction Potential Index is similar for SDMT1 and SDMT2, wherethe soil profile is almost comparable, while the soil profile for SDMT3 shows higher values
123

254 Bull Earthquake Eng (2011) 9:231–261
(a) (b) (c)
(d)
Fig. 21 Example of verification charts using the horizontal stress index from SMDT1: horizontal stress indexprofile (a); cyclic stress ratio and cyclic resistance ratio profiles (b); liquefaction safety factor profile (c) andliquefaction limit curves (d)
of constrained modulus M and higher values of KD profiles, comparing with the values ofSDMT 1 and 2 (Fig. 11).
NTC (2008) proposes new criteria to detect the stratigraphic amplification, compared tothose reported in Eurocode 8 (EN 1998-1 2004). Particularly, the formulation incorporatesthe soil non-linearity to some extent.
Using the maximum proposed amplification factor given by NTC (2008), that is S=1.8for ground type D, the values of the liquefaction potential index evaluated by Monaco et al.(2005) and evaluated according to the empirical correlation reported by Grasso and Maugeri(2006) are recomputed and reported in Fig. 24. A moderate increase of the liquefactionpotential index, ranging between 5 and 10 can be noticed in this case.
Furthermore, even if the peak acceleration estimated at Vittorito for the April 6, 2009L’Aquila Earthquake is low because of the relatively large epicentral distance, the Italian
123

Bull Earthquake Eng (2011) 9:231–261 255
Fig. 22 Liquefaction potentialindex profiles for the investigatedsites in Vittorito using thehorizontal stress index fromSMDT, according to Monacoet al. (2005)
Technical Code for Constructions (NTC 2008) prescribes for the Vittorito area a PGA equalto 0.257 g with a probability of occurrence of 10% in 50 years (return period TR = 475 years).This is because the main seismic hazard for the area essentially derives from seismogenicsources different from those generating the L’Aquila earthquake and located at a closerdistance.
Figure 25 shows the potential liquefaction index computed for a PGA equal to 0.257 gat the bedrock, using the soil amplification factor of 1.49 given by the NTC (2008). Theliquefaction potential index evaluated by Monaco et al. (2005) and by Grasso and Maugeri(2006) for all the three SDMT tests is greater than 15, which not only points that liquefactionoccurred during the April 6, 2009 L’Aquila earthquake, but also indicates that the liquefactionhazard could be very high in the Vittorito area.
From Figs. 23–25 it can be seen that liquefaction could occur at a depth ranging between2 and 6 m, where the fine content is at a very low percentage, while in the upper 2 m KD
values are very high, due to the possible presence of more rigid upper crust, so that the CRRvalues evaluated by KD are very high; the possible presence of rigid upper crust is in generalnot felt by Vs profile and not felt enough by tip resistance qc.
7 Conclusions
The occurrence of liquefaction at the bank of the river Aterno, near the village of Vittorito, isanalysed and discussed in this paper. The site is relatively far from the epicentre of the April6, 2009 L’Aquila earthquake; the estimated seismic actions are relatively low, as confirmedfrom the limited damages in the area and from the analysis of the recorded accelerometerfield.
Among others, fast assessment criteria proposed by the recently introduced Building Codein Italy indicate the possible occurrence of the liquefaction phenomenon when the PGA atthe ground level exceeds 0.1 g. The PGA in the Vittorito area, induced by the 2009 L’Aquilaearthquake with a considerable epicentral distance of about 45 km, was estimated in 0.065 g
123

256 Bull Earthquake Eng (2011) 9:231–261
0
2
4
6
8
10
12
14
16
18
Dep
th, z
(m
)D
epth
, z (
m)
Liquefaction potential index, IL
Liquefaction potential index, IL
(Monaco et al. 2005) (Grasso and Maugeri 2006)
0
2
4
6
8
10
12
14
16
18
Dep
th, z
[m]
Liquefaction Potential Index, I L
(Monaco et al. 2005) (Grasso and Maugeri 2006)
(a) (b)
0
2
4
6
8
10
12
14
16
18
0 5 10 15 20 0 5 10 15 20
0 5 10 15 20
(Monaco et al. 2005) (Grasso and Maugeri 2006)
(c)
Fig. 23 Liquefaction potential index profiles for the investigated sites in Vittorito using the horizontal stressindex from SMDT, according to Grasso and Maugeri (2006): (a) SDMT 1; (b) SDMT 2; (c) SDMT 3
123

Bull Earthquake Eng (2011) 9:231–261 257
0
2
4
6
8
10
12
14
16
18
(Monaco et al. 2005) (Grasso and Maugeri 2006)
0
2
4
6
8
10
12
14
16
18(Monaco et al. 2005) (Grasso and Maugeri 2006)
(a) (b)
0
2
4
6
8
10
12
14
16
18
0 5 10 15 20 0 5 10 15 20
0 5 10 15 20
(Monaco et al. 2005) (Grasso and Maugeri 2006)
(c)
Liquefaction potential index, IL Liquefaction potential index, IL
Liquefaction potential index, IL
Dep
th, z
(m
)
Dep
th, z
(m
)
Dep
th, z
(m
)
Fig. 24 Liquefaction potential index profiles for the investigated sites in Vittorito using the horizontal stressindex from SMDT, according to Grasso and Maugeri (2006) using the amplification factor given by the NTC(2008): (a) SDMT 1; (b) SDMT 2; (c) SDMT 3
123

258 Bull Earthquake Eng (2011) 9:231–261
0
2
4
6
8
10
12
14
16
18
(Monaco et al. 2005) (Grasso and Maugeri 2006)
0
2
4
6
8
10
12
14
16
18
(Monaco et al. 2005) (Grasso and Maugeri 2006)
(a) (b)
0
2
4
6
8
10
12
14
16
18
0 5 10 15 20 0 5 10 15 20
0 5 10 15 20
(Monaco et al. 2005) (Grasso and Maugeri 2006)
(c)
Liquefaction potential index, IL Liquefaction potential index, IL
Liquefaction potential index, IL
Dep
th, z
(m
)D
epth
, z (
m)
Dep
th, z
(m
)
Fig. 25 Liquefaction potential index profiles for the investigated sites in Vittorito using the horizontal stressindex from SMDT, according to Grasso and Maugeri (2006) using the acceleration and amplification factorgiven by the NTC (2008): (a) SDMT 1; (b) SDMT 2; (c) SDMT 3
123

Bull Earthquake Eng (2011) 9:231–261 259
(less than 0.1 g) at bedrock level, but liquefaction occurred surprisingly and it was analysedin this paper.
The comparison of the profiles of the liquefaction safety factors estimated by differentliterature methods, where the soil resistance is obtained by measurements of shear wavevelocity, Vs, cone resistance, qc and horizontal stress index from flat dilatometer tests, KD,suggests that the liquefaction potential index is moderately high. As a matter of fact, theliquefaction occurred at the site of Vittorito, in shallow sand layers of limited thickness,during the April 6, 2009 L’Aquila earthquake. This statement seems to confirm the evidencescaptured in the aftermath of the 2009 L’Aquila earthquake, according to which some soilvolcanoes made by fine sands appeared along the banks of river Aterno in Vittorito.
Two methods, where the soil resistance to liquefaction is evaluated based on shear wavevelocity Vs and tip resistance qc, consistently indicate that possible liquefaction occurred atvery shallow depth, at approximately 1 ÷ 2.5 m below the ground level, in sandy silts soils.
Liquefaction may have occurred even at a the depth of 2–6 m below the ground level,according to analyses based on horizontal stress index KD.
In the case of occurrence in Vittorito of a closer earthquake with a PGA equal to 0.257 gand a site amplification S=1.49, according to the Italian Technical Code for Constructions(NTC 2008), the analysis shows that the liquefaction potential index reported in Fig. 25 couldbe very high, and so the soil liquefaction phenomena can occur even in case future shocks.
Acknowledgments The occurrence of liquefaction at some locations in the area of the village of Vittoritowas reported by a personal communication of Dr. Galadini, National Institute of Geophysics and Vulcanol-ogy, Italy, whose suggestion was really appreciated. The Authors whish to thank also Mr. Maurizio Calabrese,Ms. Nadia Calandrella, Mr. Angelo Civitareale, Dr. Arindam Dey, Dr. Anna d’Onofrio, Dr. Giovanni Lanzano,Mr. Diego Marchetti, Mr. Alfredo Ponzo, Prof. Francesco Silvestri, Dr. Giuseppe Tropeano for their help indeveloping this paper.
References
Ambraseys NN (1988) Engineering seismology. Earthq Eng Struct Dyn 17:1–105Ambraseys NN, Simpson KA, Bommer JJ (1996) Prediction of horizontal response spectra in Europe. Earthq
Eng Struct Dyn 25:371–400Ameri G, Augliera P, Bindi D, D’Alema E, Ladina C, Lovati S, Luzi L, Marzorati S, Massa M, Pacor F, Puglia
R (2009) Strong-motion parameters of the Mw = 6.3 Abruzzo (Central Italy) earthquake. INGV internalreport. http://www.mi.ingv.it/docs/report_RAN_20090406.pdf. Accessed 30 October 2010
Andrus DR, Stokoe KH II (2000) Liquefaction resistance of soils from shear-wave velocity. ASCE J GeotechGeoenviron Eng 126(11):1015–1025
Andrus DR, Stokoe KH II, Juanga H (2004) Guide for shear-wave-based liquefaction potential evaluation.Earthq Spectra 20(2):285–308
APAT (2010) Environment Protection Agency and Technical Service Agency. Carta Geologica d’Italia.Foglio 369 Sulmona. http://www.isprambiente.it/MEDIA/carg/369_SULMONA/Foglio.html. Accessed30 October 2010
Aydan O, Kumsar H, Toprak S, Barla G (2009) Characteristics of 2009. L’Aquila earthquake with an emphasison earthquake prediction and geotechnical damage. J Sch Marine Sci Tecnol, Tokai Univ 7(3):23–51
Biondi G, Cascone E, Maugeri M (2004) Number of uniform stress cycles equivalent to seismic loading. In:Doolin et al (ed) Proceedings of 11th ICSDEE & 3rd ICEGE. Berkeley, CA, USA, vol 2, pp 705–712
Caquot A (1934) Equilibre des massiffs à frottement interne. Gauthier Villars, ParisCirella A, Piatanesi A, Cocco M, Tinti E, Scognamiglio L, Michelini A, Lomax A, Boschi E (2009) Rupture
history of the 2009. L’Aquila (Italy) earthquake from non-linear joint inversion of strong motion andGPS data. Geophy Res Lett 36:L19304
EN 1998-1 (2004) Eurocode 8: design of structures for earthquake resistance—part 1: general rules, seismicactions and rules for buildings. CEN European Committee for Standardization, Bruxelles, Belgium
Galli P (2000) New empirical relationships between magnitude and distance for liquefaction. Tectonophysics324:169–187
123

260 Bull Earthquake Eng (2011) 9:231–261
GEER Working Group (2009) Preliminary report on the seismological and geotechnical aspects of the April 62009 L’Aquila earthquake in central Italy. Report for web dissemination, geotechnical earthquake engi-neering reconnaissance GEER Association, Report No. GEER-016, Version 2., May 6, 2009. http://www.geerassociation.org/GEER_Post%20EQ%20Reports/Italy_2009/Cover_Italy2009_Rev.html. Accessed30 October 2010
Grasso S, Maugeri M (2006) Using KD and Vs from Seismic Dilatometer (SDMT) for eval-uating soil liquefaction. Flat Dilatometer Testing. In: Proceedings of 2nd international con-ference on the Flat Dilatometer, Washington DC, pp 281–288. http://www.insitusoil.com/docs/Using_KD_and_Vs_from_seismic_dilatometer_for_evaluating_soil_liquefaction.pdf. Accessed 7November 2010
Harman DE (1976) A statistical study of static cone bearing capacity, vertical effective stress and relativedensity of dry and saturated fine sands in a large triaxial test chamber. MSc Thesis, Univ. of Florida
Idriss IM, Boulanger RW (2004) Semi-Empirical Procedures for Evaluating Liquefaction Potential DuringEarthquakes. In: Doolin et al (eds) Proceedings of 11th ICSDEE & 3rd ICEGE. Berkeley, CA, USA, vol1, pp 32–56
Il Centro (2009) http://ilcentro.gelocal.it/dettaglio/valle-peligna-piccoli-vulcani-del-sisma-dopo-la-grande-scossa-sorti-strani-crateri/1625754. Accessed 27 October 2010
INGV Istituto Nazionale di Geofisica e Vulcanologia (2009) The L’Aquila seismic sequence—April 2009.http://portale.ingv.it/primo-piano-1/news-archive/2009-news/april-6-earthquake/copythe-l-aquila-seismic-sequence-april-2009/view?set_language=en. Accessed 30 October 2010
ISSMGE Technical Committee for Earthquake Geotechnical Engineering—TC4 (1999) Manual for zonationon seismic geotechnical hazards. The Japanese Society of Soil Mechanics and Foundation Engineering
ISSMGE Technical Committee for Ground Property Characterization from In Situ Tests—TC16 (2001)The Flat Dilatometer Test (DMT) in Soil Investigations. A Report by the ISSMGE Committee TC16.Reprinted in Flat Dilatometer Testing. In: Proceedings of 2nd international conference on the Flat Dila-tometer, Washington, DC, pp 7–48
Iwasaki T, Tokida K, Tatsuoka F, Watanabe S, Yasuda S, Sato H (1982) Microzonation for soil liquefactionpotential using simplified methods. In: Proceedings of 3rd international conference on microzonation,Seattle, vol 3, pp 1319–1330
Jamiolkowski M, Lo Presti DCF, Manassero M (2001) Evaluation of relative density and shear strength ofsands from cone penetration test and Flat Dilatometer Test, soil behavior and soft ground construction(GSP 119). ASCE, Reston, Virginia, pp 201–238
Joyner W, Boore D (1981) Peak horizontal acceleration and velocity from strong-motion records includingrecords from the 1979 imperial valley, California, earthquake. Bull Seism Soc Am 71(3):2011–2038
Kulhawy FH, Mayne PW (1990) Manual on estimating soil properties for foundation design. Report EPRIEL-6800, electric power res. inst. Palo Alto, pp 306
Kuribayashi E, Tatsuoka F (1975) Brief review of liquefaction during earthquakes in Japan. Soils Found15(4):81–92
Leon E, Gassman SL, Talwani P (2006) Accounting for soil aging when assessing liquefaction potential.J Geotech Geoenv Eng ASCE 132(3):363–377
Marchetti S, Monaco P, Totani G, Marchetti D (2008) In Situ Tests by Seismic Dilatometer (SDMT). Fromresearch to practice in geotechnical engineering (GSP 180), ASCE, Reston, Virginia, pp 292–311
Maugeri M, Monaco P (2006) Liquefaction potential evaluation by SDMT. Flat Dilatometer Testing. In:Proceedings of 2nd internatinal conference on the Flat Dilatometer, Washington DC, pp 295–305
MedNet (2009) Mediterranean very broadband seismic network—regional centroid moment tensors. http://earthquake.rm.ingv.it/data_id/2206496920/event_out.php. Accessed 30 October 2010
Monaco P, Marchetti S, Totani G, Calabrese M (2005) Sand liquefiability assessment by Flat Dilatometer Test(DMT). Proc XVI ICSMGE, Osaka, 4:2693–2697
Monaco P, Marchetti S (2007) Evaluating liquefaction potential by seismic dilatometer (SDMT) accountingfor aging/stress history. In: Proceedings of 4th ICEGE, Thessaloniki, Greece
Monaco P, Schmertmann JH (2007) Discussion of “Accounting for soil aging when assessing liquefactionpotential” by Leon E. et al. (in J Geotech Geoenv Eng, ASCE, 132(3): 363–377). J Geotech Geoenv Eng,ASCE, 133(9): 1177–1179
Monaco P, Totani G, Barla G, Cavallaro A, Costanzo A, d’Onofrio A, Evangelista L, Foti S, Grasso S, Lanzo G,Madiai C, Maraschini M, Marchetti S, Maugeri M, Pagliaroli A, Pallara O, Penna A, Saccenti A, Santuccide Magistris F, Scasserra G, Silvestri F, Simonelli AL, Simoni G, Tommasi P, Vannucchi G, Verrucci L(2010) Geotechnical aspects of the L’Aquila earthquake. Earthquake geotechnical engineering, satelliteconference, XVIIth international conference soil soil mechanics and geotechnical engineering, vol 10,pp 2–3 2009, Alexandria, Egypt
123

Bull Earthquake Eng (2011) 9:231–261 261
NEID (2010) National Research Institute for Earth Science and Disaster Prevention, Digital strong-motionseismograph network KiK-net. http://www.kik.bosai.go.jp/kik/index_en.shtml. Accessed 30 October2010
NTC (2008) Approvazione delle nuove norme tecniche per le costruzioni. Gazzetta Ufficiale della Repubb-lica Italiana, n. 29 del 4 febbraio 2008—Suppl. Ordinario n. 30, http://www.cslp.it/cslp/index.php?option=com_docman&task=doc_download&gid=3269&Itemid=10. Accessed 30 October 2010
Okada Y, Kasahara K, Hori S, Obara K, Sekiguchi S, Fujiwara H, Yamamoto A (2004) Recent progress ofseismic observation networks in Japan —Hi-net, F-net, K-NET and KiK-net—. Earth Planets Space56:25–28
PIANC (2001) Seismic design guidelines for port structures. Working Group no. 34 of the Maritime NavigationCommission, International Navigation Association, Balkema, Lisse, 474 pp
Robertson PK, Wride CE (1998) Evaluating cyclic liquefaction potential using the cone penetration test. CanGeot J 35(3):442–459
Sabetta F, Pugliese A (1987) Attenuation of peak horizontal acceleration and velocity from Italian strong-motion records. Bull Seism Soc Am 77(5):1491–1513
Santucci de Magistris F (2006) Liquefaction: a contribution to the Eurocode from the Italian guideline“Geotechnical aspects of the design in Seismic Areas. ISSMGE ETC-12 workshop, NTUA Athens,Greece. http://users.ntua.gr/gbouck/etc12/Genera_Report%20_Proceedings_of_the_Athens_Workshop_2006b.pdf. Accessed 30 October 2010
Santucci de Magistris F, Evangelista L (2007) Simplified assessment of the liquefaction susceptibility for thecity of Naples, Italy. In: Proceedings of 4th international conference earthq geotechnical engineeringthessaloniki, Greece
Santucci de Magistris F, Evangelista L (2010) Some considerations on the 2009 Abruzzo earthquake groundmotion. In: Proceedings of 14th European conference on earthquake engineering, Ohrid, Macedonia
Seed HB, Idriss IM (1971) Simplified procedure for evaluating soil liquefaction potential. J Soil Mech FoundDiv, ASCE 97(9):1249–1273
Trifunac MD, Brady AG (1975) A study on the duration of strong earthquake ground motion. Bull Seism SocAm 65:581–626
Tsuchida H (1970) Prediction and countermeasure against the liquefaction in sand deposit. Abstract of theseminar, Port and Harbor Research Institute, Yokusuka, Japan (in Japanese)
Utsu T (1982) Relationships between earthquake magnitude scale. Bull Earthq Res Inst 57:465–497 (inJapanese)
Wakamatsu K (1991) Maps for historic liquefaction sites in Japan. Tokai University Press. Japan, 341 pp(in Japanese)
Wakamatsu K (1993) History of soil liquefaction in Japan and assessment of liquefaction potential based ongeo-morphology. Ph.D. Thesis. Waseda University, Tokyo, Japan
Working Group ITACA (2010) Data Base of the Italian strong motion data. http://itaca.mi.ingv.it. Accessed27 October 2010
Working Group UNISANNIO—CIMA–DIGA (2009) Rapporto preliminare sugli effetti indottisull’am-biente fisico dalla sequenza sismica dell’aquilano—ver.1.5. http://www.reluis.it/doc/pdf/Aquila/UniSANNIO_CIMA_UniNA_Report_v1.5.pdf. Accessed 30 October 2010
Yasuda S, Morimoto I, Kiku H, Tanaka T (2004) Reconnaissance report on the damage caused by threeJapanese earthquakes in 2003. In: Doolin et al. (eds) Proceedings of 11th ICSDEE and 3rd ICEGE,Berkeley, CA, USA, vol 1, pp 14–21
Youd TL et al (2001) Liquefaction resistance of soils: summary report from the 1996 NCEER and 1998NCEER/NSF workshops on evaluation of liquefaction resistance of soils. ASCE J Geot Geoenviron Eng127(10):817–833
123