analyzing results: considerations and =real cosrinfohouse.p2ric.org/ref/27/26843.pdf · selecting...
TRANSCRIPT

The Pollution Prevention course
_ -
ANALYZING THE RESULTS: WHAT ARE THE ECONOMIC CONSIDERATIONS AND =REAL cosr BENEFITS?
James E Clemmer, PhD., P.E RMT, Inc
Greedle, South Carolina
1. INTRODUCTION
One measurement of the success of a waste minim'kition project is the economic effect that it has on the faciiii where it is installed. In comparing waste minimization altematives, the cost of installing the project must be compared against several factors including:
0 Improved efficiency and profitabirity 0 Time value of money 0 Availability of disposal faciliies 0 Unpredictable escalation of disposal costs
The cost of constructing modifications to a process can be reasonably estimated. The time value of money is less predictable. However, the least predictable of the costs for implementing a waste minimization project is the availability and cost of future waste disposal. Therefore, the ultimate cost or cost savings for a waste minimization project is rarely predictable from historical cost information at the outset of a project. A regulatory change such as the RCRA landban can change disposal costs drastically.
Selecting an acceptable payback period, rate of retum on the hvestment, or present value is difficutt, Setting an economic selection criterion involves judgement as to the value of other selection criteria, such as community reaction or reduced future liability. What is it worth to reduce the quantity of emissions published in the local newspaper from your SARA report? In the 60s what was the rate of retum for burying those drums of waste on site rather than doing something else to dispose of them?
Often one assumes an acceptable selection criterion and computes the future waste disposal costs for several cases. The facility must then decide whether the assumed future waste dsposal costs are reasonable in comparison to historical trends and other, sometimes intangible, indicators of trends in waste disposal costs.
XIV-1 0 1991 Covemmcnt Institutes. Inc @

Tier I1 tailpipe standards would be set at 0.2 for NOx and 0.125 for HC in the year 2003, if EPA finds tha t tougher emissions limits are needed.
Over three years, and the vehicle must meet the limit for For CO, the law seta a 10 g/mi standard in 1994, phased in .
-
“Congress did anticipate to some extent that EPA might drop the ball and drafted “hammerd’into the law that shift r u l e making authority to the states i f EPA misses deadlines.”
50,000 miles or five years. The Phase I1 CO limit will be 9.5 ppm should EPA in 1996 find that second-phase controls are necesstuy.
The agency also must study the feasibility of on-board charcoal canisters for capturing evaporative emissions, and issue a determination within one year. Should EPA decide to issue rules requiring the canisters, and the Department of Transportation finds them to be safe, they will be phased in over a three-year period.
Cities with serious or worse ozone nonattainment would be required to set rules mandating clean-fuel vehicles in privately owned fleeta of 10 or more. The standards take effect in 1998 and apply to 70 percent of the vehicles. The law also mandatee a clean vehicle pilot program in Califor- nia.
By 1995, reformulated gasolines will be required in the nine cities with the worst smog problem The fuels will have to contain no more than 1 percent benzene, 25 percent aro- matics and 15 percent leas air toxics and VOCs. A t the turn of the century, stricter standards are to take effect. In the 40 cities with CO problems, the act requires oxygenated fuels to be sold.
Even though Rep. John DingeU (D-Mi.) managed to use his influential position as chairman of the House Energy and Commerce Committee to cushion the impact the mobile sources provisions will have on his home state automakers, some researchers have criticized the stricter tailpipe con- trols. They maintain tha t the tougher controls will have minimal effect on air quality, since research has shown that most mobile source pollution comes from older, more pollut- ing vehicles not addressed by the new law. More stringent contrbls add to the coat of new cars, providing an incentive for keeping the older, more polluting vehicles on the road longer, these scientists argue.
THle Ill-Alr Toxlu
The original Clean Air Act failed to addreas toric air emb- sions in any meaningful way. Of the scorea of toxics the law was intended to address, EPA managed to promulgate rules for only a handful.
The amendments take a two-phased approach to regulat- ing 189 air toxics. Within a year, EPA must publish a list of source categories emitting 10 tons annually of any one toxic or 25 tons annually of a Combination of toxic pollutants. The agency must then issue Maximum Achievable Control
,Technology (MAC”) standards based on the best demon- strated control technology or practices of the regulated in- dustry.
Within two years, EPA is required to issue MAC” stan- dards for 40 source categories. The remainder of sources will
*
on MACT compliance will be granted to companies h t voIuntarily reduce emissions according t x ~ prescribed con&- tiona. In a major concession to the steel industry, coke ovens were granted a 30-year extension on MACT, providing they significantly cut emissions of five toxica.
Eight years afier the fmt-phase MACT standards, the second-phase health risk-based standards are slated to a e effect if a facility’s emissions present a cancer risk of more than one in 1 million. However, EPA’s M o b said during the November 28 videoconference that the agency does not ex- pect there to be reaidual risk after the MACT standards are in place. The health-based standards are “more of a hack- stop,” he said.
The air toJa provisions will regulate commercial, indus- trial and municipal incinerators, but language requiring util- ities to cut mercury emissions wan dropped in favor of pro+ sions requiring EPA to study the problem before developing rules. The agency also ia required to study toxica deposition in the Great Lakes. All sources of air tox ia will required to obtain an operating permit under Title V of the act.
THle IV -Add DeporHlocl
The new law’s acid rain provisions marked the end of a nearly ten-year congressional debate of such legislation. The law will require sulfur dioxide emissions to be cut 10 million tons below the 17 million tons EPA estimates utilities emit- ted in 1980. To accomplish this, the agency will h u e emis- sion allowances in two phases.
The firat phase takes effect January 1,1995, and affects the 111 dirtiest power plants. A t that time, planb emitting more than 2.5 lbs of SO2 per million Btu will be required to cut back to tbe 2.5 lb level. Plants eliminating 90 percent or more of SO2 emissions will receive a two-year deadline ex- tension.
During Phase I, E P A will issue federal allowances permit- ting one ton of SO2 emissions. Facilities that cut back further than the 2.5 Ib rate wil l receive additional allowances, which may be sold or applied to other facilities that fail to meet the limit. In a concession to Midwest legislators, a special alloca- tion of 100,OOO allowances per year for each of the five yeare of Phase I will be allocated to p l ~ b in Illinois, Indiana and Ohio.
Phase Jl takes effect January 1,2080, and will eet an emissions limit for utilities of 1.2 Ibs of SO1 per million Btu. Bonus allowances will be distributed to states where utilities emit less than 0.8 lbs SO2 per million Btu.
Midwest plants that meet Phase I limita will receive an- other !iO,OOO allowances during Phase 11. Any plant that reduces SO2 by 90 percent will receive allowances on a two- for-one bask
During both phases, sources will be required to install equipment to continuously monitor emissions, track pro- gress, and mure compliance. Sources must have sufficient allowances to cover annual emissions, or become subject to a $2,000 per ton excess emissions fee and a requirement to offset future emissions equal to the amount of the ex- emissions.
Plants that emit lese than 1.2 Ibs per million Btu wi l l be allowed to increase emissions 20 percent by the time Phase Il takes effect. Within 18 months, E P A will be required to issue emission standards for nitrogen oxides that cut NOx emis- aisne 2 million tone by January 1,2OOO.
THIO V-Pomb
EPA hae 12 months to issue a final rule on air pollution permits, creating a program similar to the National Pollut- an t Discharge Elimination System established under the

The Pollution Prevention Course
The majofcosts for installing any process m o d i i are d i i in - - various swrce~. The
0 Purchased equipment costs
- -- -following summarizes the major direct and indirect costs (1).
- Land - Major equipment - lnst"enta!ion and Control - Piping - Electrid equipment and materials - ~ u i ~ d i i g s and services, e.g., process buildings, auxiiiiry buildings for storage, maintenance, process a"!, etc - Service facilities, e.g., steam, air, power, water, fuel, etc
0 Purchased equipment -hstallation - Site preparation ' - Installation of equipment
0 Indirect costs - Engineering fees - Construction supervision - conrractots fees - Construction expenses, e.g., construction, operation and maintenance of temporary facilities, o f f i , mads, parking lots, electrical service, etc - Storage of purchased equipment - secwity
0 Manufaduring costs - Raw materials - Operating labor and supelvision
- Maintenance and repairs - Operating supplies - Disposal costs - Laboratory charges
- Depr&iorl
- Power and utilities, ag., steam, e l m , fuel, water, refrigeration, etc
0 Fbed costs - interest
4 1
TaxeS t ' - Insurance - Rent
- Medid - Health and
0 Overhead costs
- Training - - Support labor, e.g., accounting, purchasing, payroll, shipping, . . receiving, etc Process laboratory -
The Pollution Prevention course
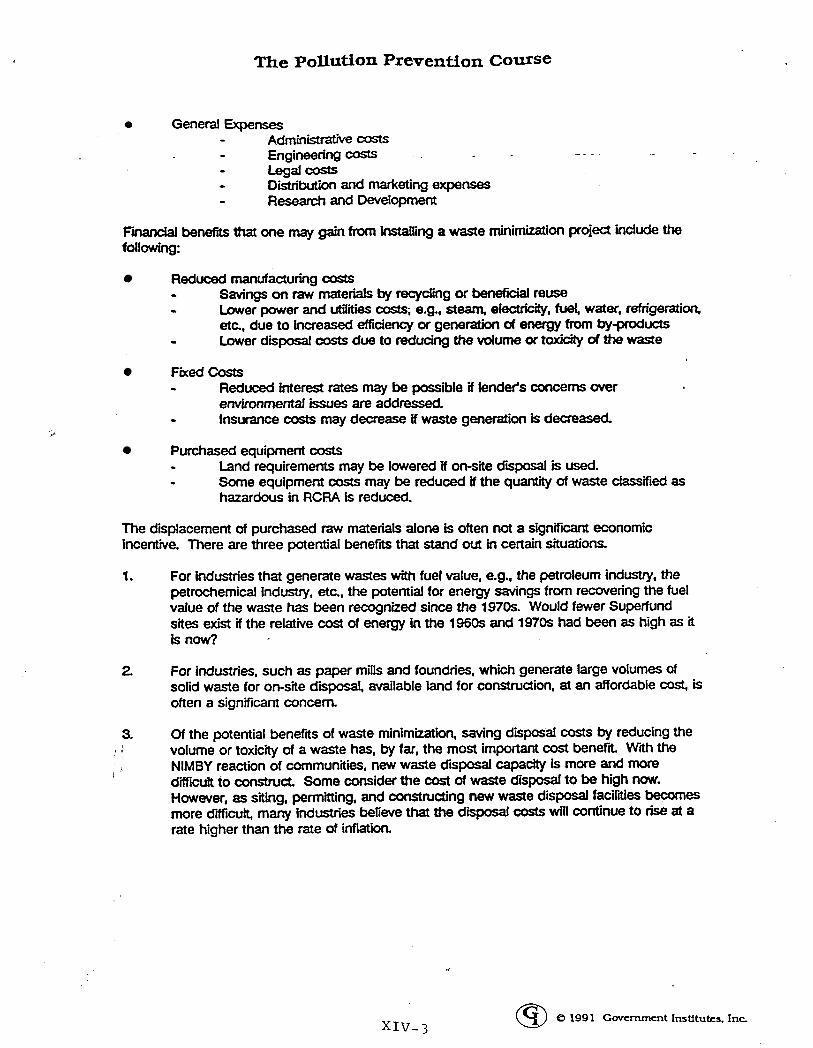
F i benefits that one may gain from Wl ing a waste minimization project indude the following:
Reduced manufaawing COSES Savings on raw materials by recyding or beneficial reuse
etc., due to increased efficiency or generation of energy frwn byproduds - Lower power and m-liies cos1s. e.g., steam, electricity, fuef, water, refrigeration,
Lower disposal costs due to reducing the vdume or toxicity of Zbe waste
Reduced interest rates may be possible if lender's concerns over
Insurance costs may decrease if waste generation is decreased
Land requirements may be lowered if on-site disposal is used. Some equipment costs may be reduced if the quantity of waste dassiied as
- Flied costs -
environmental issues are addressed *
Purchased equipment costs - - hazardous in RCRA is reduced.
The displacement of purchased raw materials alone b often not a significant economic incentive. There are three potential benefns that stand out in certain situations.
1. For industries that generate wastes with fuel value, e.g.. the petroleum industry, the petrochemical industry, etc., the potential for energy savings from recovering the fuel value of the waste has been recognized since the 1970s. Would fewer Superkrnd sites exist if the relative cost of energy in the 1960s and 1970s had been as high as it is now?
2 For industries, such as paper mills and foundries, which generate large vdumes of solid waste for on-site disposal available land for construction, at an affordable cost, is often a significant concern
3. Of the potential benefis of waste minimhation, saving disposal costs by reducing the volume or toxicity of a waste has, by far, the most important cost benefrt Wnh the NIMBY reaction of communities, new waste diposal capacity is more and more difficult to construct. Some consider the cost of waste disposal to be high nuw. However, as siting, permitting, and constructing new waste disposal faciriies becomes more difficult, many industties believe that the disposal casts will continue to rise at a rate higher than the rate of inflation.
; I
XIV-3
The Pollution Prevention course.-
We cannot include some m i c benefits of m e minimization in a dassical engineering economic analysis.
- - -.--- 1. - One difficult-toquantify benefit is the image and goodwnl in the communi?; that is built
by reducing waste quantity and toxicity. Many companies are m e m e d about their image when the local newspaper p u M i the waste quantities from SARA 313 rePo-
2 The reduction in long term Gabilii is also difficutt to quantify, but would a company today send its waste to a Chem-Dyne? If the manager of 25 yeas ago knew the potential economic f i i i , would he make the decision to bury drums of waste on site? Would a manager of today decide to build a landfill that is not lined?
3. ECONOMIC COMPARISON OF ALTERNATIVES
Waste minimization decisions almost always involve choosing between aJtematiVas, e.g., continuing with the operation as it exists or installing a modification. A number d methods are available for compan'ng attematives (1).
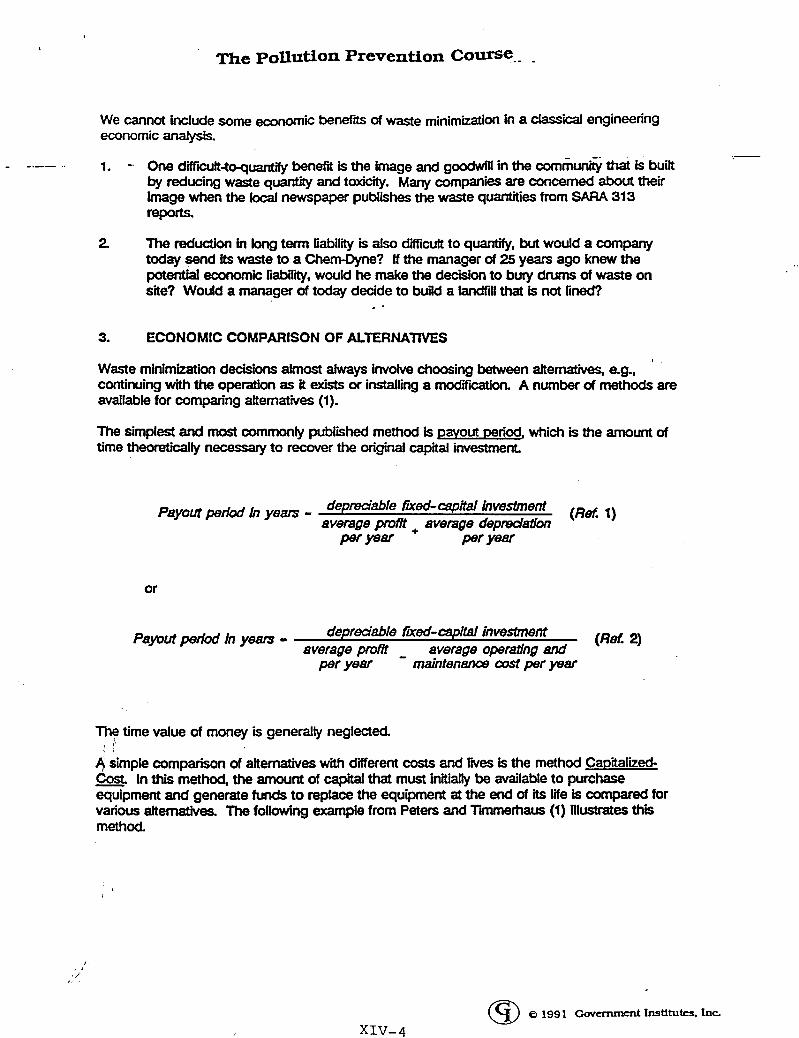
The simplest and most commonty published method is pavout period, which is the amount of time theoretically neceSSary to recover the original capital investment
(Ref 1) depmdable f"kapita/ lnvestmeni avmge pront + average depmdaiim
Payout pew In yeus - peryear Pryear
or
(Ref 2) depreciable fxed-capltal investment Payout period In yeam - average p12 - average operathg and -
Per Yew maintenance cast per par
The time d u e of money is generally neglected.
4 simple comparison of alternatives with different costs and r ies is the method Caoitaliied- Cost. In this method, the amount of capital that must initially be available to purchase equipment and generate funds to replace the equipment at the end of its life is compared for various alternatives. The following example from Peters and limmerhaus (1) illustrates this method.
I 1 ,
XIV-4

The Pollution Prevention Course
Example:
Assume:
A steel reactor costs $S,OOo and lasts 3 years. Astdnless steel reactorcosts $15,000 and lasts 8 years. No inflation; money toss 1096 per year; no salvage value.
Which fs less expensive?
K - C v + cr (1 + r)= 1
- $24,300 STEEL. $s.ooo+ ss,OOo (1 + 0.08)s - 1
- $32600 $1 5,000 STAIlVLESS SIEEL' $15,000 + (1 + 0.08)6 - 1
The Discounted Cash Flow method t a k e s into account the time value of money. The procedure allows one to estaMish (or calculate) a rate of retum which can be applied to the annual cash flow of the company so that the original investment is reduced to zero over the l ie of the project.
The rate of retum is the maximum interest rate at which money can be borrowed to pay all principal and interest accumulated over the life of the project However, the rate of retum used alone does show the magnitude of a project
A similar method is Present Worth or Present Value, which substitutes an interest rate or cost of capital for the discounted cash flow rate of retum. The present worth is the value above the principal and cost of capital. This results from this method depend on base year for caiculations.
Another discounted cash flow method, the Uniform Annual Eauivalent Cost, allows comparison of attematives w'ith diierent Wes. The present worth in base year dollars for each case is converted to a series of equal annual payments over the l ie of the project.
course, inflation significantly affects investments and cash flow on environmental projects. qccording to Peters and Timmerhaus (I), the Marshall and Swift All-Industry lnstalled- Equipment Cost Index, which b published in Chemical Enaineerinq, doubled between 1968 and 1978 and increased by another 60 percent between 1978 and 1986. The Chemical Engineering Plant Index, W i b also pubr ied by Chemical Enaineerinq, b specific to the chemical process Industry. This indicator of rising project construction costs has increased by almost 350 percent since 1959, but the increase has only been about 8 percent since 1983.
XIV-5

The Pollution Prevention Course
TABLE 1: EXAMPLE OF PRESEKT WORTH AND DISCOUNTED CASH FLOW
Example: lnitiai Fixed-Capital Investment - $1OO,OOO Working-C$i hestrnent 5 $1 0,000 Project Life - 5 years Salvage Value - $1 0,ooO
Present Worth at 15% ll Estimated
Cash Flow to
Project
D i U n t . Factor.
1 - (1 +I)" 0.15
Present Worth
1 0.870
$31 ,OOo
$26.100
$23,400
1- -
$40,000
,+
Working $lO,OOO Capital I Total
0.572
0.497 $31.300
$1 27,000
~
Discounted Cash Flow 20.7% Rate of
Retum
Factor Present
0.207
$21,200
0.570 $20.500
0.472 I $18,800
0.391 $24,600
I I $11O,oOo
The effect of inflation on discounted cash flow and present value can be estimated as follows (3):
1 (1 + Inflation Raze) (1 + Cost of Caprta3 (1 + Rare of Retunl)
Annual Cash Flow Annual Present Value - (1 + Infladon Rate) (1 + Cost of Capm
4. CASE STUDY: SIMPLE MODIFICATION WITH SHORT PAYBACK (4)
A common success story is that of the facility that discovers a very simple modification that can be made to a process, with economic beneffi which rapidly offset the cost of installing the modification.
XIV-6
The Pollution Prevention Course
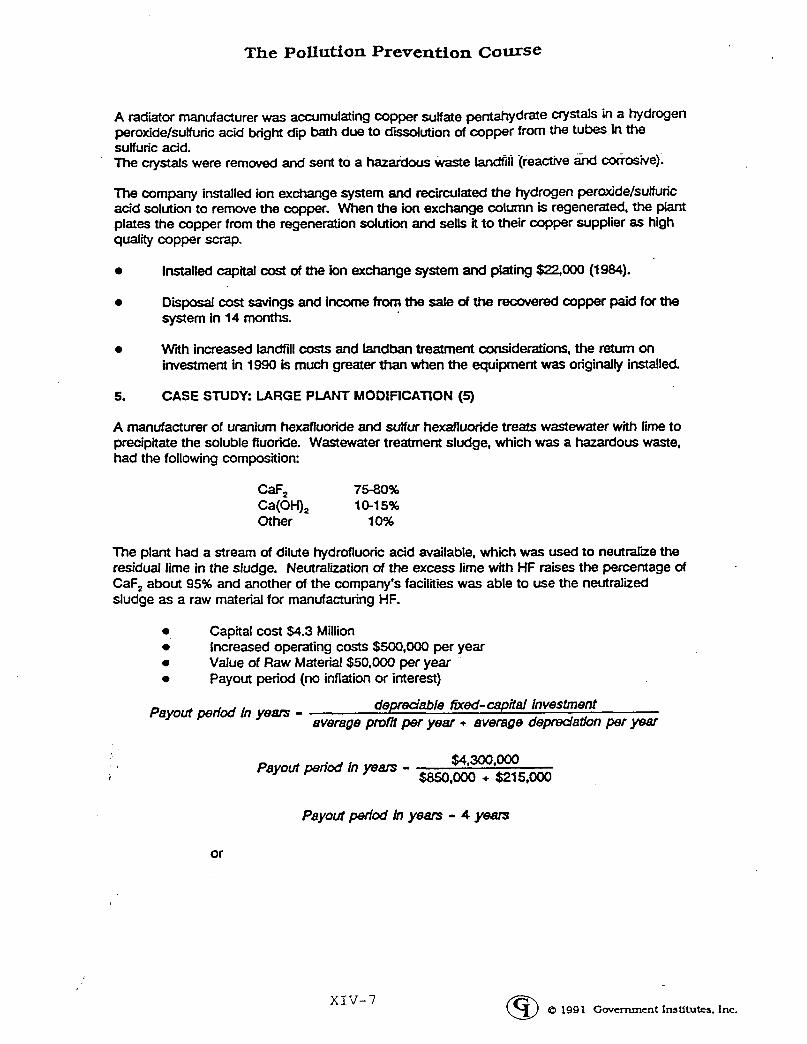
A radiator manufacturer was accumulating copper sulfate pentahydrate crystals in a hydrogen peroxide/sulfuric acid bright dip bath due to dssdution of copper from the tubes h the sutfi~ric acid. The crystals were ranwed and sent to a hazaidou~ waste mil (reactive and Corrosive).
The company installed ion exchange system and recirculated the hydrogen peroXide/suffuric acid solution to remove the copper. When the ion exchange column is regenerated, the plant plates the copper from the regeneration solution and sells it to their copper supplier as high quality copper scrap.
0 Installed capital cost of the ion exchange system and plating $22,OOO (1984).
0 Disposal cost savings and income from the sale ofthe recovered copper paid forthe system in 14 months.
0 WRh increased landfill costs and landban treatment considerations, the return on investment in 1990 is much greater than when the equipment was originally installed
5. CASE STUDY: LARGE PLANT MODlFlCATlON (5)
A manufacturer of uranium hexafluoride and sulfur hexafluoride treats wastewater with lime to precipitate the soluble fluoride. Wastewater treatment sludge, which was a hazardous waste, had the following composition:
The plant had a stream of dilute hydrofluoric acid available, which was used to neutraIiie the residual lime in the sludge. Neutralization of the excess lime with HF raises the percentage of CaF, about 95% and another of the company's facilities was able to use the neutralied sludge as a raw material for manufacturing HF.
0 Capital cost $4.3 Million 0
0
0
Increased operating costs $SOO,OOO per year Value of Raw Material $5O,OOO per year Payout period (no inflation or interest)
depreciable fixed-capital hvestment average pront per year + average dewation per p a f Payout perid in years -
$4,300,~ $sso,OOO + $215,000
Payout period h years - Payout Mod In years - 4 years
or
X I V - 7

The Pollution Prevention Course
Year
1
2
3
4 > '
I
1 ' 5
6
7
8
9
10
$4,3oo.OoO $7375,000 - $soo.o0o
P a m period in years -
Capital Discount Annual Total
Operating Savings cost Savings 1 Value Value and Environmental Disposal Income Total Factor Present Present
cost - (1 +i)"
($483w)
(=w $1 lo00 $325 $50 $875 0.9091 $795 $795
($525) $l,OOO $341 $53 $869 0.8264 $71 8 $1.513
(=l) $l,OOo $358 $55 $862 0.751 3 $648 $2.161
$1 loo0 $376 $58 sa55 0.6830 $584 $2745 ($579)
($608) $1 ,Ooo $395 $61 $848 0.6209 $527 $3,272
$1 ,oo0 $415 $64 $840 0.5645 $474 $3,746
($670) $1 lo00 $436 s67 $832 0.5132 $427 $4,174
($704) $1 ,OOo $457 $70 $824 0.4665 $384 $4,558
($739) $1 ,Ooo $480 $74 $815 0.4241 $346 $4,904
(W6) $1 8 0 0 0 $504 $78 $806 0.3855 $31 1 $521 5
Reafiically, infiation and the time value of money affect the payout on a project such as this and should be considered. Wnh the following assumptions, Table 2 shows that considering the time value of money and inflation adds suQstanWly to the payout period for this project.
0
0
0 Inflation rate 5% 0
Assume 10 year project life: straight line deprechtioq zero sahrage Assume an annual interest rate of 10% @rime rate on 10/15/90)
All investment in first year
The general inflation rate is expected to be 5% and the cost of capital is 10%.
TABLE 2: PAYOUT' PERIOD FOR MAJOR CAPITAL EXPENDJTURE INCLUDING THE TIME VALUE OF MONEY
Hundreds of Thousands of Dollars

The Pollution Prevention Course
1 + Inflai%n Rare)" (1 + Inter& Rari)"
'Dlsaount F0ctor -
L
TABLE 3: EFFECT OF INFLATION COST ON MAJOR CAPIT' EXPENDITURE
.- -. . ..
Annual PreSent Value
Total Present Value
Discount Factor'
$758
$1,409
$1,968
$2449
0.6490 $560
0.5619 $481 $1 ,OOo $376 $58 $ass
1 $l,OOo $395 $61 $84a
$1 ,OOo $415 $64 $840
$1 ,ooo $436 $67 $832
$1 ,OOo $457 $70 $824
$1 .OOo $480 $74 $81 5
0.4865 $413 ~~
$3.21 6 0.4212 $354
0.3647 $304 $331 9
$3.779
0.2734 $4.002
0.2367 ~ $191 $4,193
6. CASE STUDY: EFFECT OF DISPOSAL COST OF PROCESS SELECTION (6)
Often, the escalation of disposal costs is an important and difficult-toestimate variable in a decision of whether or not to proceed with a waste minimization project. The following
A manufacturer operates a process (Process A) that generates hazardous waste. The maintenance and operating costs for Process A are expected to be $5OO,OOO next year and the waste disposal costs are w e d to be $1,2OO,OOO per year.
! hypothetical example was adapted from Higgins (6). t
I
An ahemate process (Process B) is available with the following parameters:
0
t o 0
A capital investment of $14,000,000 is required for this process. The maintenance and operating costs are $6,500 in the first year. The waste disposal costs would be $l,OOO,OOO next year.
XIV-9
1 '
The Pollution Prevention Course
The rate of escalation of the hazardous waste d~posal cost was varied and the present WOnh estimated for each process. Figures 1 shows the present worth of each process Over a 10- year projed life, and Figure 2 shows the incremental present worth between the two processes. As the Figures indicate, Process A is more economical if disposal costs rise less
* than 20 percent per year, and process B is more economical if the disposal costs rise more than 20 percent p e r year.
No one can project the rate at which waste disposal costs will rise; therefore, the decision makers must deal with regulatory situations that are difficult or impossible to predin Among these concerns are the following:
0 Will future restrictions and disposal Capacity drasticalty increase the cost of harard0uS waste disposal?
- The landban with a requirement for incineration as the Best Demonstrated
The reluctance of states to build hazardous waste facilities suggests that
Available Technology (BDAT) has caused a tenfold increase in tbe cost of disposal of those wastes.
capacity will not increase rapidly. Some states, such as Alabama and South Carolina, are becoming reluctant to accept hazardous wastes from some other states, and they are increasing the disposal taxes.
in municipal landfills.
-
- Subtitle D will have a dramatic effect on the cost of disposing of solid wastes
0 Are benefiis of community and employee attitudes toward reduced waste generation sufficient to justify installing a waste minimization project that is more costly than the
-.
I -- existing waste disposal practice?
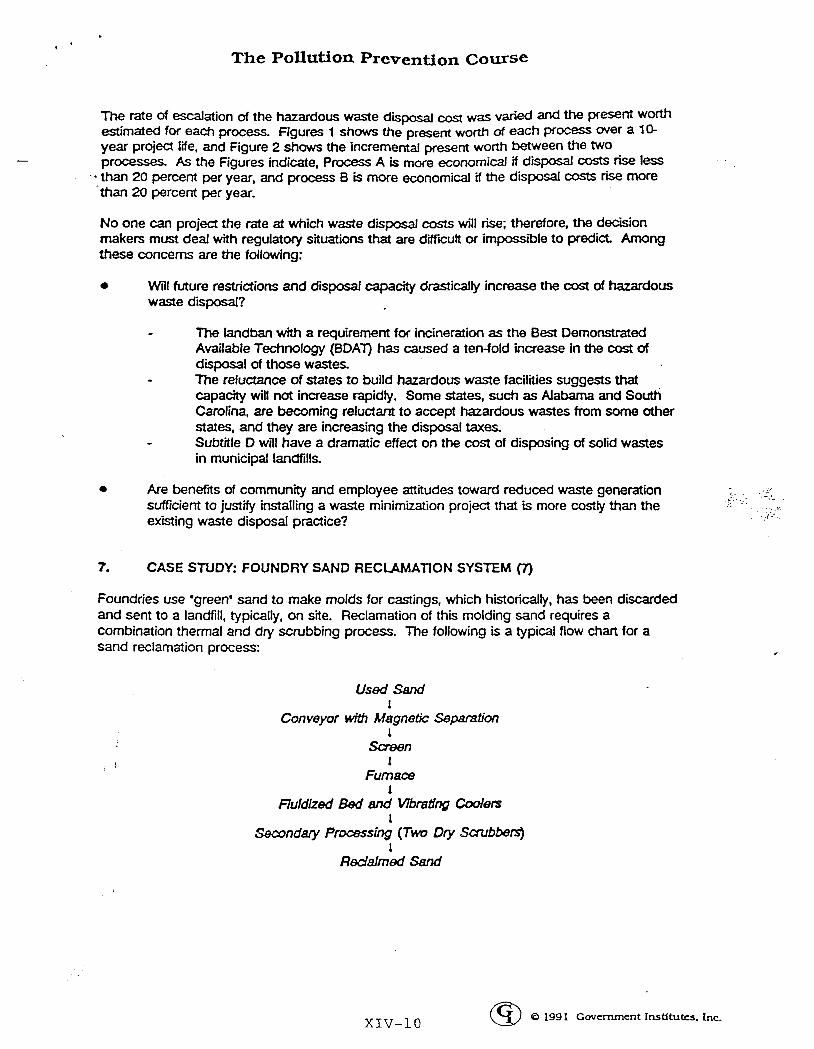
7. CASE STUDY: FOUNDRY SAND RECLAMATION SYSTEM (7)
Foundries use 'green' sand to make molds for castings, which historically, has been discarded and sent to a landfill, typically, on site. Reclamation of this molding sand requires a combination thermal and dry scrubbing process. The following is a typical flow chart for a sand reclamation process:
used sand 1
Conveyor with Magnetic Separation 1
Screen 1
Fumsce 1
Fluldlzed Bed and Wbrdng coolers 1
Seconday ProceSjing (Two Dry ScSubBerSj 1
Redalmed Sand
XIV-10 0 1991 Covcmmcnt Institutes. I n c G)

I
X H
7 r w
W 6
3 9 (55,000) 111
3 (65,000)
6 (70,000) 0 u) -
(75,000)
(80,000)
FIGU-RE. 1 : EFFECT OF DISPOSAL COST ON DISCOUNTED CASH FLOW
....................................................................................................................................................................... ......................................................................
......................................... ...................................................................................................
....................................................... ......................................................... ..............................
........................................ ................................................... .......................
................................................................. ................................................... ............................................
.......................................... ............................................................... -,.. ............................................................................ ........ .......................................... ............................................................... -,.. ............................................................................ -......
I I I I I I I
0 5 10 15 20 25 RATE OF INCREASE OF DISPOSAL COSTS (%)
PROCESS A PROCESS .B __()__ +
30
5 P

Table 4 shows the present worth of !he sand r m a i o n system for this foundry over the assumed 1 @year life of the project adjusted to 1982 do[[=. mis assumes an inflation rate of 7.5% and an interest rate of 15%.
TABLE 4: PRESENT WORTH FOR SAND RECLAMATION SYSTEM
Hundreds of Thousands of 1982 Dollars
Annual Annual Discount Annual Savings Cash Factor' Present
flaw WoRh
$1,656 $991 0.8089 $802
$1,758 $1,062 0.6543 $695
$1,860 $1,131 0.5293 $598
$1.962 81.197 0.4281 $512
Tatal Present worth
$802
$1,497
$2607
$3,044
6 ($596) ($2501 $2167 $1,321 0.2801 $370 $3,414
7 ($6401 (=!jo) $2,269 $1,378 0 . ~ 6 6 $312 $3,726
8 ($689) ($250) $2,371 $1,433 0.1833 $263 $3,989
9 (3740) ($250) $2,473 $1,483 0.1483 $220 $4.209
10 ($796) ($23) $2,575 $1,530 0.1199 $183 $4,392
1 + Inflation Rate)" (1 + lnteresf Rate)"
Discountfador - (
I ' I
' /
XIV-14
1. -
2
3.
4.
, (I’
1 I
,, ,
5.
6.
7.
REFERENCES
Peters, M. and K Timerhaus, plant Desian and Economics for Chemical Enaineers, Fourth Edition, McGraw-HiII, New York, 1991. -
US. EPA, The €PA Manual far Waste Minimization OpwmtnitV Assessments, EPA 600/288QW.
Peny, R, D. Green, and J. Maloney, Penv‘s Chemical Enaineers’ Handbook, Si Ediion, McGraw-HitI, New Yo& 1984.
Huisingh, 0.. L Martin, H. Hilger, and N. Seldman. Proven Prafits from Pollution Prevention: Case Studies h R e s w r c e Comervation and Waste Reduction. Institute for Local S e t f - R e l i i 1986. pp. 171-174.
Hulslngh, D., L Martin, H. Hilger, and N. Seldman Proven Profits from Potlution Prevention: Case Studies In Resource Conservation and Waste Reduction Institute for Local Seff-Reliice. 1986. pp 71-73. . Higgins, T.E., Hazadous Waste Minimization Handbook, Lewis Publishers, 1989, p. 6.
Stephens, W., and R Zayko, Internal RMT Report, 1982
XIV-15