anglo american metallurgical coal/media/files/a/anglo-american-plc-v... · 10 0 20 40 60 80 100 120...
TRANSCRIPT
ANGLO AMERICAN
METALLURGICAL COAL Investor & Analyst Briefing
14 June 2012
2
Disclaimer: This presentation has been prepared by Anglo American plc (“Anglo American”) and comprises the written materials/slides for a presentation concerning Anglo American. By attending this presentation and/or reviewing the slides you agree to be bound by the following conditions.
This presentation is for information purposes only and does not constitute an offer to sell or the solicitation of an offer to buy shares in Anglo American. Further, it does not constitute a recommendation by Anglo American or any other party to sell or buy shares in Anglo American or any other securities. All written or oral forward-looking statements attributable to Anglo American or persons acting on their behalf are qualified in their entirety by these cautionary statements.
Forward-Looking Statements
This presentation includes forward-looking statements. All statements other than statements of historical facts included in this presentation, including, without limitation, those regarding Anglo American‟s financial position, business and acquisition strategy, plans and objectives of management for future operations (including development plans and objectives relating to Anglo American‟s products, production forecasts and reserve and resource positions), are forward-looking statements. Such forward-looking statements involve known and unknown risks, uncertainties and other factors which may cause the actual results, performance or achievements of Anglo American, or industry results, to be materially different from any future results, performance or achievements expressed or implied by such forward-looking statements.
Such forward-looking statements are based on numerous assumptions regarding Anglo American‟s present and future business strategies and the environment in which Anglo American will operate in the future. Important factors that could cause Anglo American‟s actual results, performance or achievements to differ materially from those in the forward-looking statements include, among others, levels of actual production during any period, levels of global demand and commodity market prices, mineral resource exploration and development capabilities, recovery rates and other operational capabilities, the availability of mining and processing equipment, the ability to produce and transport products profitably, the impact of foreign currency exchange rates on market prices and operating costs, the availability of sufficient credit, the effects of inflation, political uncertainty and economic conditions in relevant areas of the world, the actions of competitors, activities by governmental authorities such as changes in taxation or safety, health, environmental or other types of regulation in the countries where Anglo American operates, conflicts over land and resource ownership rights and such other risk factors identified in Anglo American‟s most recent Annual Report. Forward-looking statements should, therefore, be construed in light of such risk factors and undue reliance should not be placed on forward-looking statements. These forward-looking statements speak only as of the date of this presentation. Anglo American expressly disclaims any obligation or undertaking (except as required by applicable law, the City Code on Takeovers and Mergers (the “Takeover Code”), the UK Listing Rules, the Disclosure and Transparency Rules of the Financial Services Authority, the Listings Requirements of the securities exchange of the JSE Limited in South Africa, the SWX Swiss Exchange, the Botswana Stock Exchange and the Namibian Stock Exchange and any other applicable regulations) to release publicly any updates or revisions to any forward-looking statement contained herein to reflect any change in Anglo American‟s expectations with regard thereto or any change in events, conditions or circumstances on which any such statement is based.
Nothing in this presentation should be interpreted to mean that future earnings per share of Anglo American will necessarily match or exceed its historical published earnings per share.
Certain statistical and other information about Anglo American included in this presentation is sourced from publicly available third party sources. As such it presents the views of those third parties, but may not necessarily correspond to the views held by Anglo American.
No Investment Advice
This presentation has been prepared without reference to your particular investment objectives, financial situation, taxation position and particular needs. It is important that you view this presentation in its entirety. If you are in any doubt in relation to these matters, you should consult your stockbroker, bank manager, solicitor, accountant, taxation adviser or other independent financial adviser (where applicable, as authorised under the Financial Services and Markets Act 2000 in the UK, or in South Africa, under the Financial Advisory and Intermediary Services Act 37 of 2002).
Resources - Anglo American Share, Excludes Callide
Coal Inventory: Occurrence of coal of economic interest which forms the physical envelope that encompasses a Coal Resource or Coal Reserve, or both, and includes Reconnaissance, Inferred, Indicated and Measured Coal Resources, together with any associated Probable and Proven Coal Reserves.
These data represent tonnage estimates compiled in accordance with the principles and guidelines of the JORC code or NI 43-101 by a Competent (Qualified) Person or Persons.
Due to the uncertainty which may be attached to some Inferred Mineral Resources, it cannot be assumed, but normally would be expected, that a major part of an Inferred Coal Resource will be upgraded to an Indicated or Measured Coal Resource as a result of continued exploration.
DISCLAIMER
CONTENTS
1. OUR BUSINESS
2. MARKETING & OUTLOOK
3. PEACE RIVER & ASSET OPTIMISATION
4. DELIVERING HIGH VALUE GROWTH PROJECTS
5. SUMMARY
4
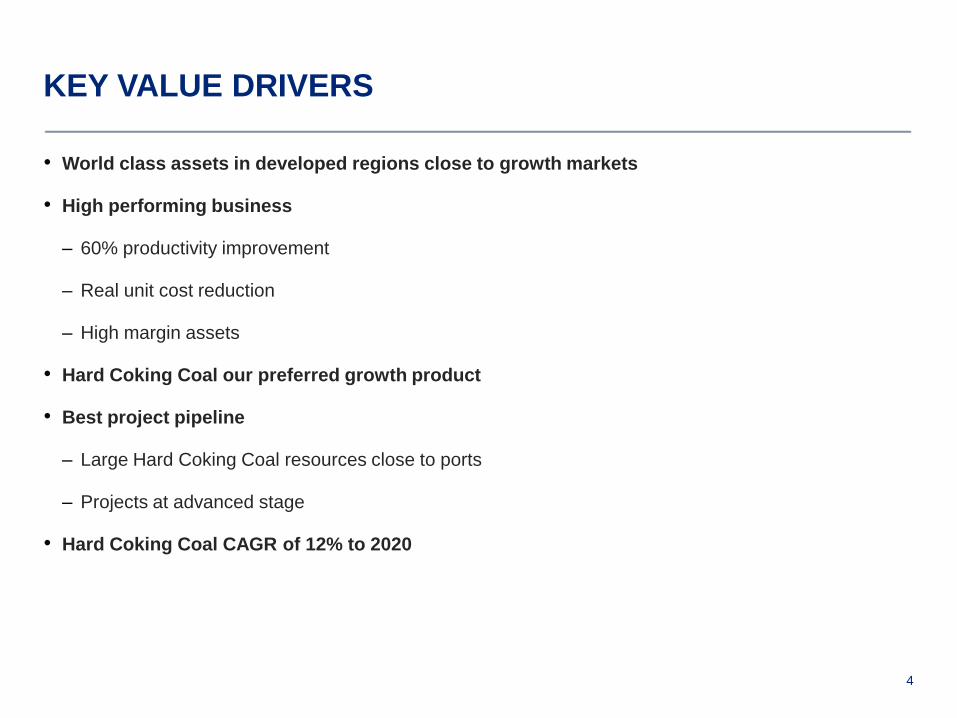
• World class assets in developed regions close to growth markets
• High performing business
– 60% productivity improvement
– Real unit cost reduction
– High margin assets
• Hard Coking Coal our preferred growth product
• Best project pipeline
– Large Hard Coking Coal resources close to ports
– Projects at advanced stage
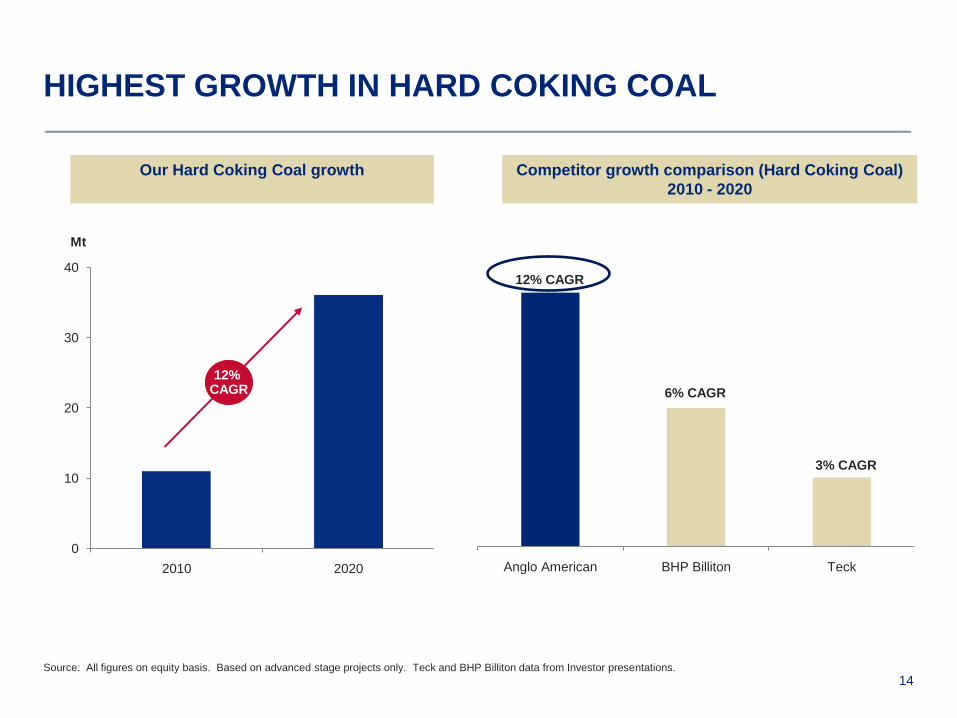
• Hard Coking Coal CAGR of 12% to 2020
KEY VALUE DRIVERS
OUR BUSINESS

6
ANGLO AMERICAN UNDERLYING EARNINGS BY
BUSINESS UNIT1
Copper
Thermal Coal
Metallurgical Coal
Iron Ore & Manganese
Other
Diamonds
Platinum
Nickel 0%
14%
25%
6%
7%
7%
15%
26%
1 Financial results 2011
7
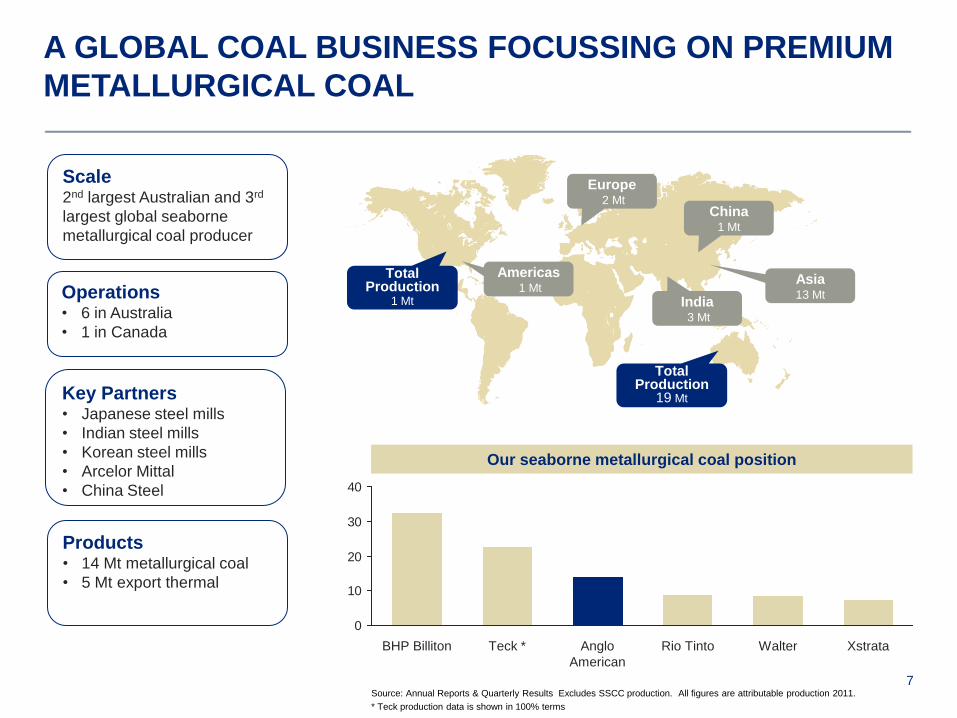
A GLOBAL COAL BUSINESS FOCUSSING ON PREMIUM
METALLURGICAL COAL
Scale2nd largest Australian and 3rd
largest global seaborne
metallurgical coal producer
Operations• 6 in Australia
• 1 in Canada
Key Partners• Japanese steel mills
• Indian steel mills
• Korean steel mills
• Arcelor Mittal
• China Steel
Products• 14 Mt metallurgical coal
• 5 Mt export thermal
Our seaborne metallurgical coal position
Europe2 Mt
China1 Mt
India3 Mt
Asia13 Mt
Total Production
19 Mt
Total Production
1 Mt
0
10
20
30
40
XstrataWalterRio TintoAnglo
American
Teck *BHP Billiton
Source: Annual Reports & Quarterly Results Excludes SSCC production. All figures are attributable production 2011.
* Teck production data is shown in 100% terms
Americas1 Mt
8
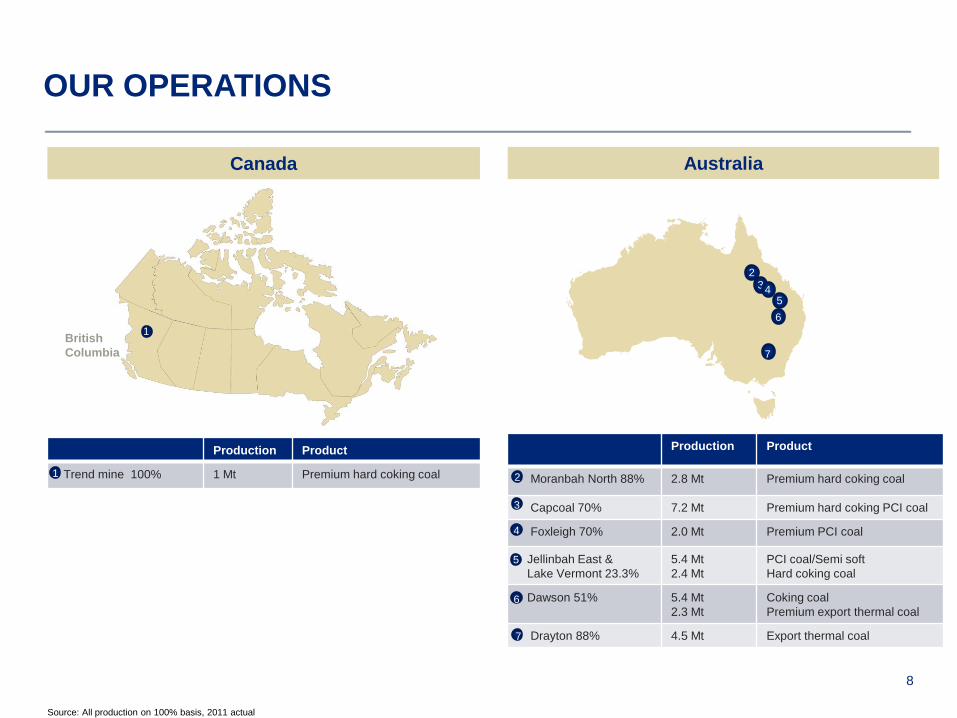
OUR OPERATIONS
Production Product
Trend mine 100% 1 Mt Premium hard coking coal
Production Product
Moranbah North 88% 2.8 Mt Premium hard coking coal
Capcoal 70% 7.2 Mt Premium hard coking PCI coal
Foxleigh 70% 2.0 Mt Premium PCI coal
Jellinbah East &
Lake Vermont 23.3%
5.4 Mt
2.4 Mt
PCI coal/Semi soft
Hard coking coal
Dawson 51% 5.4 Mt
2.3 Mt
Coking coal
Premium export thermal coal
Drayton 88% 4.5 Mt Export thermal coal
1 2
3
4
5
6
234
5
6
7
Canada Australia
7
Source: All production on 100% basis, 2011 actual
British
Columbia
1
9
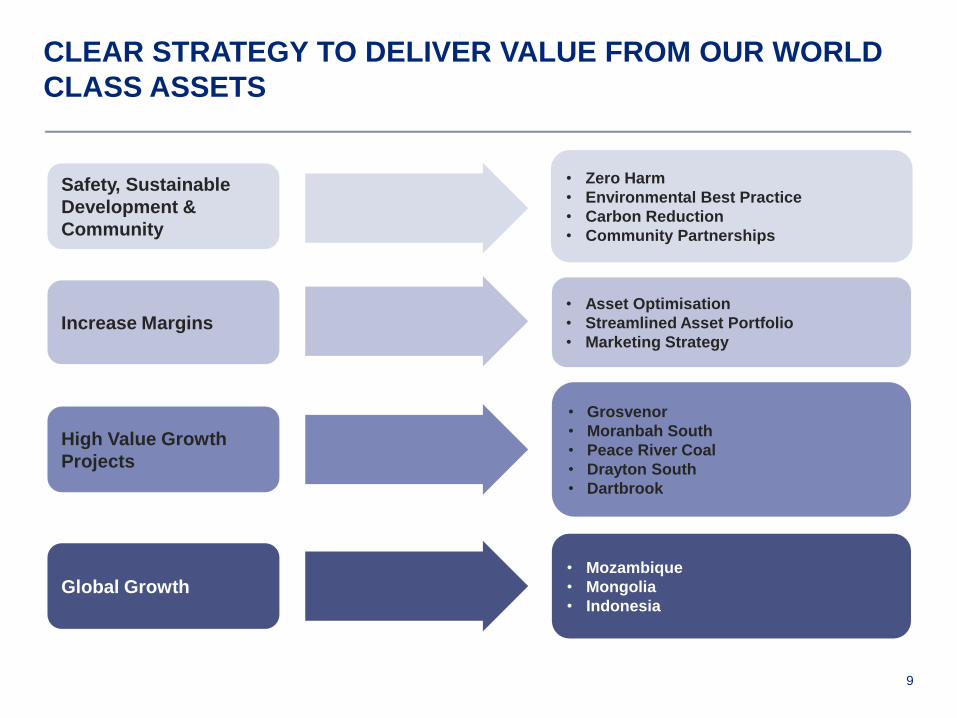
CLEAR STRATEGY TO DELIVER VALUE FROM OUR WORLD
CLASS ASSETS
Safety, Sustainable
Development &
Community
Increase Margins
High Value Growth
Projects
Global Growth
• Zero Harm
• Environmental Best Practice
• Carbon Reduction
• Community Partnerships
• Asset Optimisation
• Streamlined Asset Portfolio
• Marketing Strategy
• Grosvenor
• Moranbah South
• Peace River Coal
• Drayton South
• Dartbrook
• Mozambique
• Mongolia
• Indonesia
10
0
20
40
60
80
100
120
2007 2008 2009 2010 2011
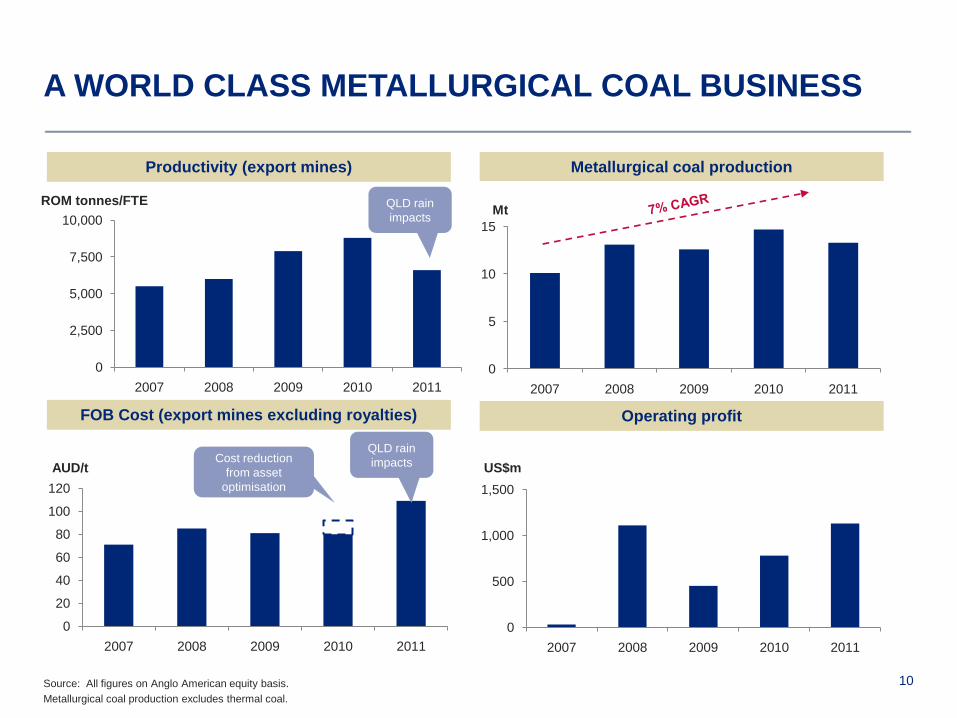
A WORLD CLASS METALLURGICAL COAL BUSINESS
Source: All figures on Anglo American equity basis.
Metallurgical coal production excludes thermal coal.
0
2,500
5,000
7,500
10,000
2007 2008 2009 2010 2011
0
5
10
15
2007 2008 2009 2010 2011
Metallurgical coal production
FOB Cost (export mines excluding royalties)
Productivity (export mines)
Mt
AUD/tCost reduction
from asset
optimisation
0
500
1,000
1,500
2007 2008 2009 2010 2011
Operating profit
US$m
ROM tonnes/FTE QLD rain
impacts
QLD rain
impacts
11
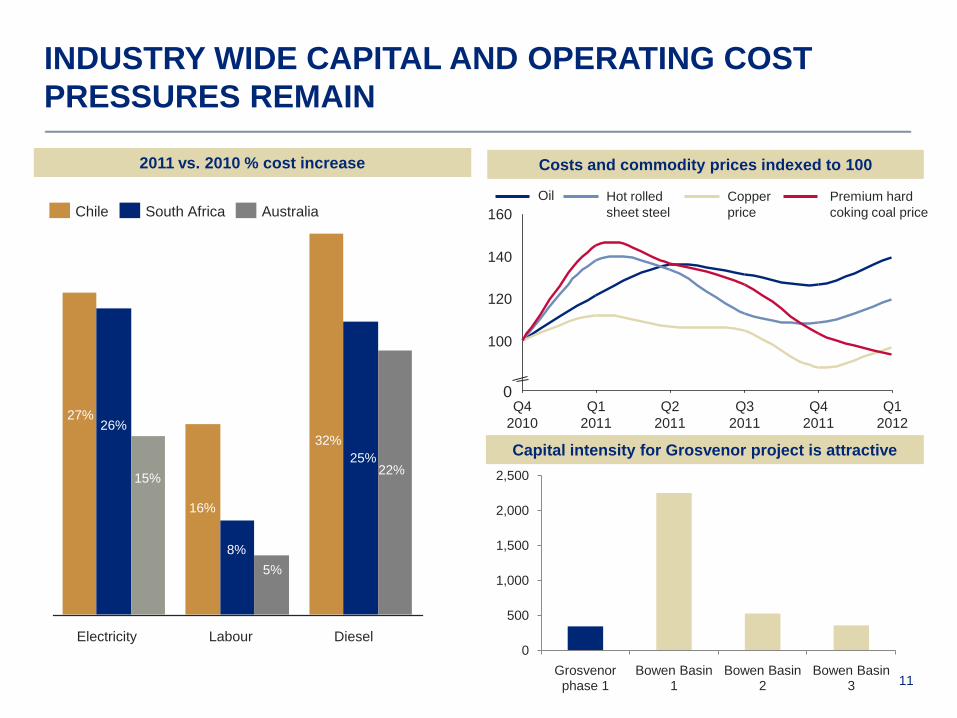
INDUSTRY WIDE CAPITAL AND OPERATING COST
PRESSURES REMAIN
160
140
120
100
0Q1
2012
Q4
2011
Q3
2011
Q2
2011
Q1
2011
Q4
2010
Costs and commodity prices indexed to 1002011 vs. 2010 % cost increase
Premium hard
coking coal price
Copper
price
Hot rolled
sheet steel
Oil
15%
26%27%
Electricity Diesel
22%25%
32%
Labour
5%
8%
16%
AustraliaSouth AfricaChile
Capital intensity for Grosvenor project is attractive
0
500
1,000
1,500
2,000
2,500
Grosvenor phase 1
Bowen Basin 1
Bowen Basin 2
Bowen Basin 3
12
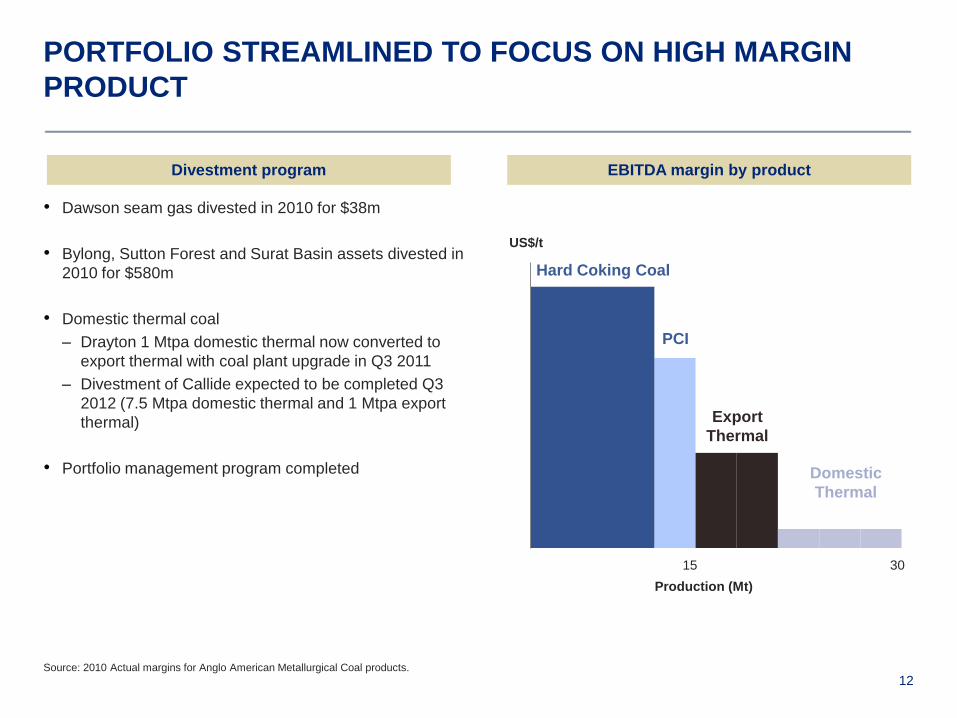
PORTFOLIO STREAMLINED TO FOCUS ON HIGH MARGIN
PRODUCT
• Dawson seam gas divested in 2010 for $38m
• Bylong, Sutton Forest and Surat Basin assets divested in
2010 for $580m
• Domestic thermal coal
– Drayton 1 Mtpa domestic thermal now converted to
export thermal with coal plant upgrade in Q3 2011
– Divestment of Callide expected to be completed Q3
2012 (7.5 Mtpa domestic thermal and 1 Mtpa export
thermal)
• Portfolio management program completed
Source: 2010 Actual margins for Anglo American Metallurgical Coal products.
EBITDA margin by productDivestment program
Production (Mt)
15 30
Hard Coking Coal
Export
Thermal
Domestic
Thermal
US$/t
PCI
13
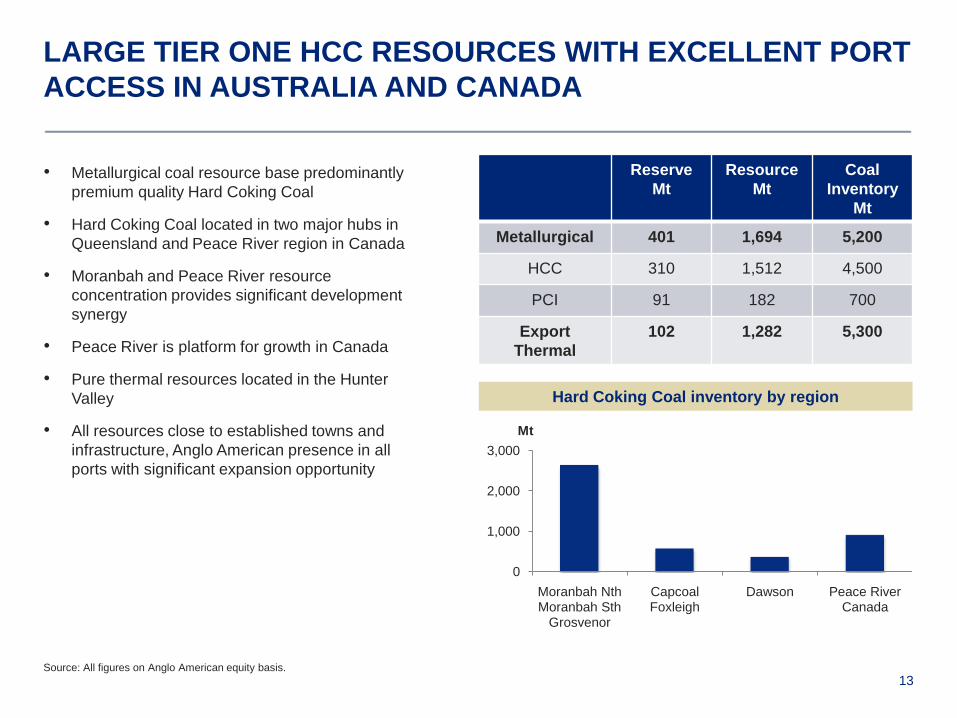
LARGE TIER ONE HCC RESOURCES WITH EXCELLENT PORT
ACCESS IN AUSTRALIA AND CANADA
• Metallurgical coal resource base predominantly
premium quality Hard Coking Coal
• Hard Coking Coal located in two major hubs in
Queensland and Peace River region in Canada
• Moranbah and Peace River resource
concentration provides significant development
synergy
• Peace River is platform for growth in Canada
• Pure thermal resources located in the Hunter
Valley
• All resources close to established towns and
infrastructure, Anglo American presence in all
ports with significant expansion opportunity
Source: All figures on Anglo American equity basis.
Hard Coking Coal inventory by region
0
1,000
2,000
3,000
Moranbah NthMoranbah Sth
Grosvenor
CapcoalFoxleigh
Dawson Peace RiverCanada
Reserve
Mt
Resource
Mt
Coal
Inventory
Mt
Metallurgical 401 1,694 5,200
HCC 310 1,512 4,500
PCI 91 182 700
Export
Thermal
102 1,282 5,300
Mt
14
0
10
20
30
40
2010 2020 Anglo American BHP Billiton Teck
HIGHEST GROWTH IN HARD COKING COAL
Source: All figures on equity basis. Based on advanced stage projects only. Teck and BHP Billiton data from Investor presentations.
Our Hard Coking Coal growth
12% CAGR
Competitor growth comparison (Hard Coking Coal)
2010 - 2020
3% CAGR
12% CAGR
6% CAGR
Mt
MARKETING
& OUTLOOK
16
51 60 67
15
24
28
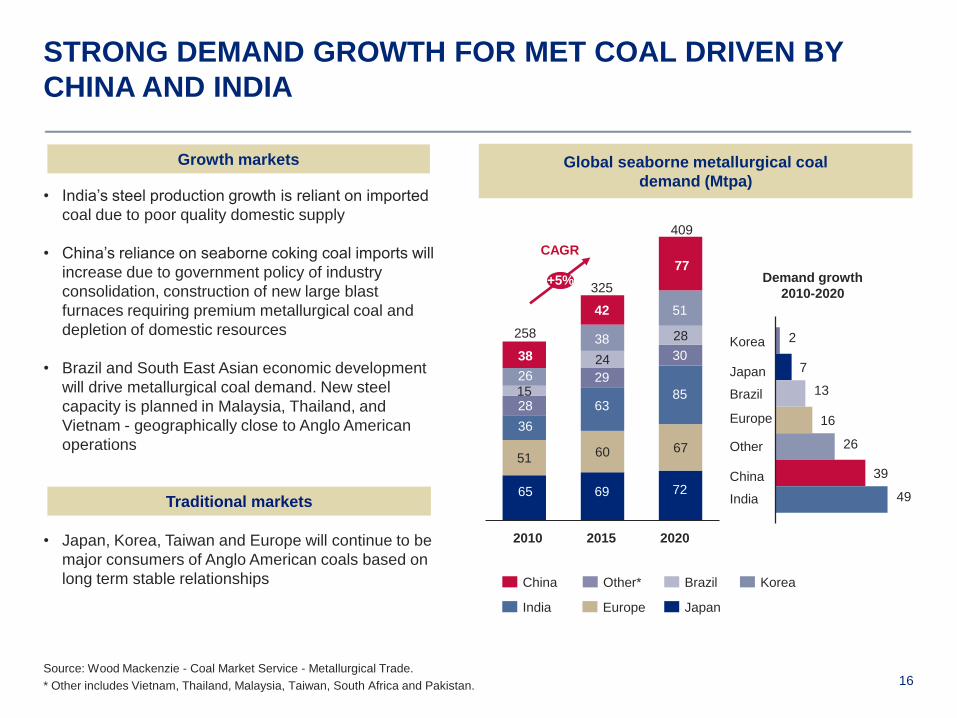
STRONG DEMAND GROWTH FOR MET COAL DRIVEN BY
CHINA AND INDIA
Source: Wood Mackenzie - Coal Market Service - Metallurgical Trade.
* Other includes Vietnam, Thailand, Malaysia, Taiwan, South Africa and Pakistan.
2020
409
77
2015
325
72
85
30
51
69
63
29
38
42
65
258
2010
26
36
38
28
2
7
13
16
26
39
49
Global seaborne metallurgical coal
demand (Mtpa)
Demand growth
2010-2020
India
Brazil
Other
China
Japan
Korea
Europe
+5%
CAGR
Other*
India
KoreaBrazil
JapanEurope
China
• India‟s steel production growth is reliant on imported
coal due to poor quality domestic supply
• China‟s reliance on seaborne coking coal imports will
increase due to government policy of industry
consolidation, construction of new large blast
furnaces requiring premium metallurgical coal and
depletion of domestic resources
• Brazil and South East Asian economic development
will drive metallurgical coal demand. New steel
capacity is planned in Malaysia, Thailand, and
Vietnam - geographically close to Anglo American
operations
• Japan, Korea, Taiwan and Europe will continue to be
major consumers of Anglo American coals based on
long term stable relationships
Growth markets
Traditional markets
17
Andhra
Pradesh
Chhattisgarh
Goa
Gujarat
Maharashtra
Rajasthan Uttar Pradesh
Orissa
JSW
RINL
Bhushan Steel
JSPL
Tata Steel
West Bengal
SAIL plants
Uttam Galva
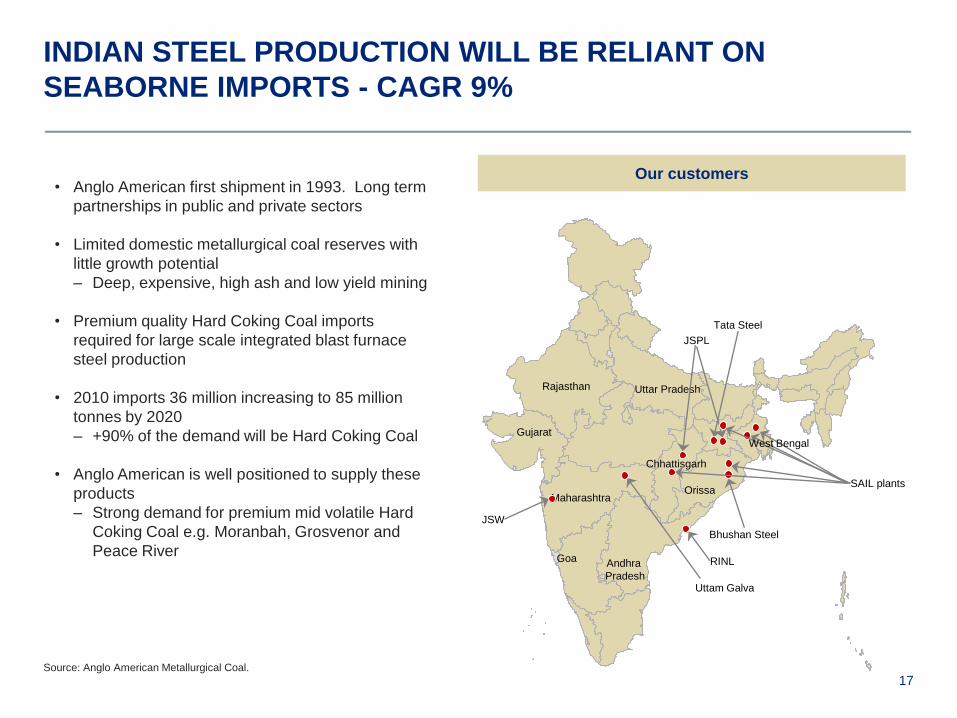
INDIAN STEEL PRODUCTION WILL BE RELIANT ON
SEABORNE IMPORTS - CAGR 9%
Source: Anglo American Metallurgical Coal.
• Anglo American first shipment in 1993. Long term
partnerships in public and private sectors
• Limited domestic metallurgical coal reserves with
little growth potential
– Deep, expensive, high ash and low yield mining
• Premium quality Hard Coking Coal imports
required for large scale integrated blast furnace
steel production
• 2010 imports 36 million increasing to 85 million
tonnes by 2020
– +90% of the demand will be Hard Coking Coal
• Anglo American is well positioned to supply these
products
– Strong demand for premium mid volatile Hard
Coking Coal e.g. Moranbah, Grosvenor and
Peace River
Our customers

18
CHINA IMPORTS FORECAST TO GROW
SIGNIFICANTLY - CAGR 8%
AnSteel Bayuquan Project
CapitalSteel Caofeidian Project
Shaanxi
Shanxi
Chongqing
Guizhou
Henan
Shandong Steel
Rizhao Project
BaoSteel
ShaSteel
HebeiSteel
BaoSteel Zhenjiang ProjectWuhanSteel Fangcheng Project
Source: Anglo American Metallurgical Coal.
Major Chinese steel mills
Domestic HCC
Seaborne HCC importers
Major coastal steel plant developments
• The majority of steel production capacity growth is
geared towards large coastal mills
• Major steel companies are commissioning large
capacity blast furnace (+4,000m3) requiring Hard
Coking Coal
• Depletion of domestic quality Hard Coking Coal
resources
• 2010 imports 38 million increasing to 77 million
tonnes by 2020
– + 90% of the demand will be Hard Coking Coal
• Anglo American is well positioned to supply these
products
– Strong demand for premium low volatile Hard
Coking Coal e.g. Capcoal, Moranbah South
19
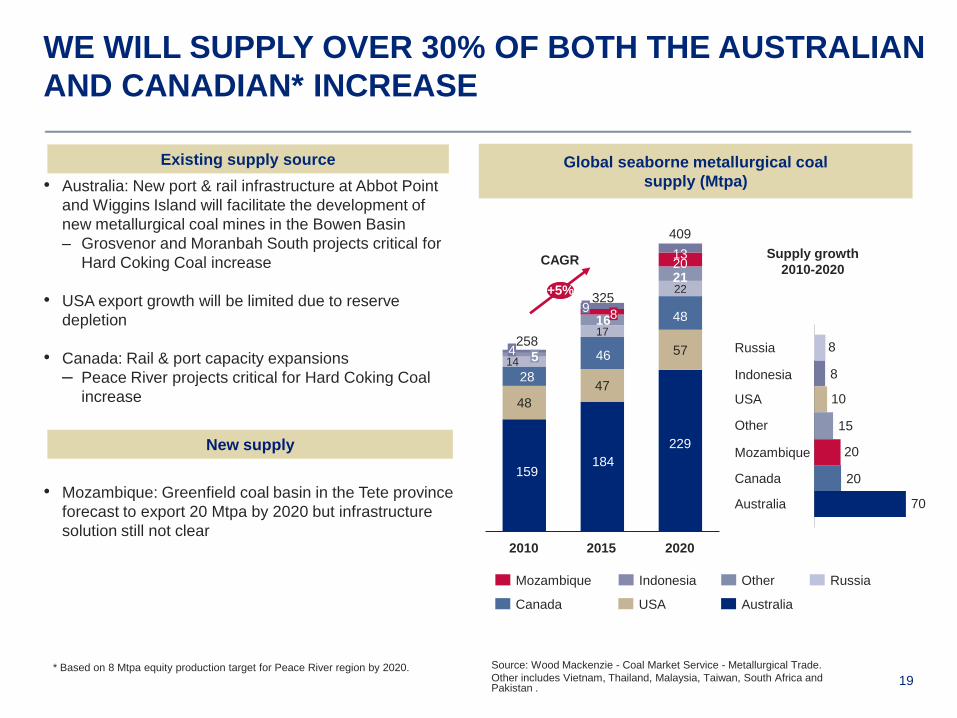
WE WILL SUPPLY OVER 30% OF BOTH THE AUSTRALIAN
AND CANADIAN* INCREASE
• Australia: New port & rail infrastructure at Abbot Point
and Wiggins Island will facilitate the development of
new metallurgical coal mines in the Bowen Basin
– Grosvenor and Moranbah South projects critical for
Hard Coking Coal increase
• USA export growth will be limited due to reserve
depletion
• Canada: Rail & port capacity expansions
– Peace River projects critical for Hard Coking Coal
increase
• Mozambique: Greenfield coal basin in the Tete province
forecast to export 20 Mtpa by 2020 but infrastructure
solution still not clear
Source: Wood Mackenzie - Coal Market Service - Metallurgical Trade.
Other includes Vietnam, Thailand, Malaysia, Taiwan, South Africa and Pakistan .
Global seaborne metallurgical coal
supply (Mtpa)
Supply growth
2010-2020
Australia
USA
Mozambique
Canada
Russia
Other
Indonesia
48
47
5714
17
22
2020
409
2015
325
258
2010
+5%
CAGR
159184
229
28
46
48
5
8
20
4
9
13
16
21
RussiaIndonesia
Canada
Other
AustraliaUSA
Mozambique
* Based on 8 Mtpa equity production target for Peace River region by 2020.
8
8
10
15
20
20
70
Existing supply source
New supply

20
MARKETING STRATEGY
• Focus on building our brand with new customers:
transition Anglo American from a mid-tier Australian
producer to the leading, reliable global supplier of
premium Hard Coking Coal
• Comprehensive Market Development Plans for each
customer segment to capture market share in target
markets, for example
• Establishing local presence through regional marketing
offices and/or distribution centers at new capesize disport
in India
• Investigate strategic alliances with major target
customers through technical co-operation, price
leadership, long term off take agreements
2011
2011 2020
PCI
20%
Coking Coal
80%
PCI
16%
Coking Coal
84%
2020
0%
22%
8%
1%
12%
57%
5%
33%
20%
7%
10%
25%
Other
India
China
Brazil
Europe
Japan, Korea, Taiwan
Product strategy
Customer strategy
21
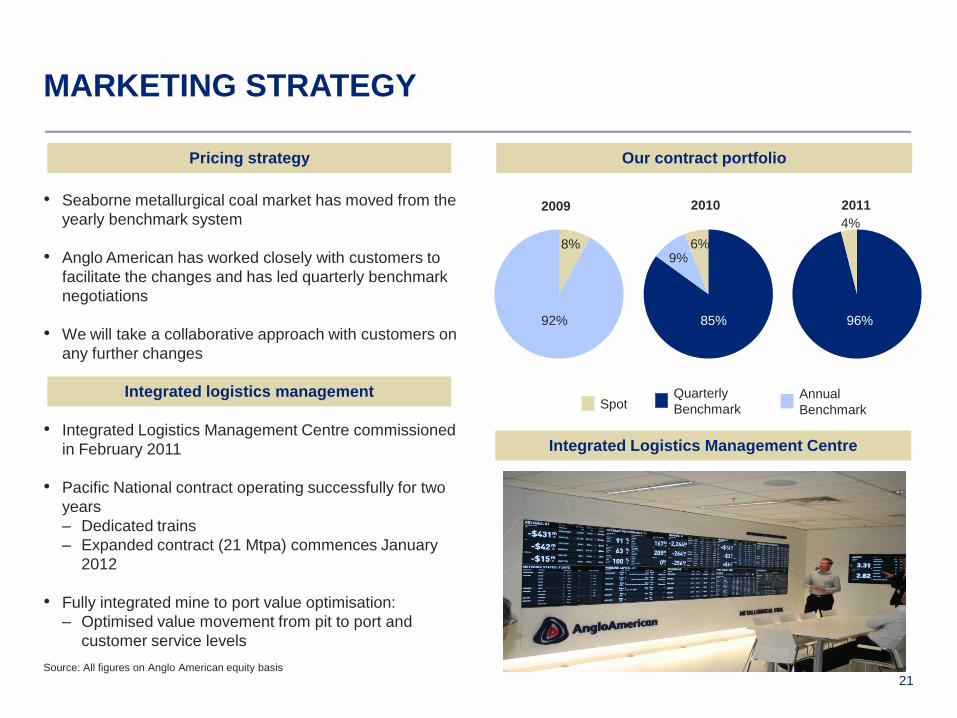
MARKETING STRATEGY
Source: All figures on Anglo American equity basis
Our contract portfolio
Integrated Logistics Management Centre
6%
85%
4%
96%
2009 2010 2011
92%
8%
SpotAnnual
Benchmark
Quarterly
Benchmark
9%
• Seaborne metallurgical coal market has moved from the
yearly benchmark system
• Anglo American has worked closely with customers to
facilitate the changes and has led quarterly benchmark
negotiations
• We will take a collaborative approach with customers on
any further changes
• Integrated Logistics Management Centre commissioned
in February 2011
• Pacific National contract operating successfully for two
years
– Dedicated trains
– Expanded contract (21 Mtpa) commences January
2012
• Fully integrated mine to port value optimisation:
– Optimised value movement from pit to port and
customer service levels
Pricing strategy
Integrated logistics management
PEACE RIVER &
ASSET
OPTIMISATION
23
0
2
4
6
8
10
12
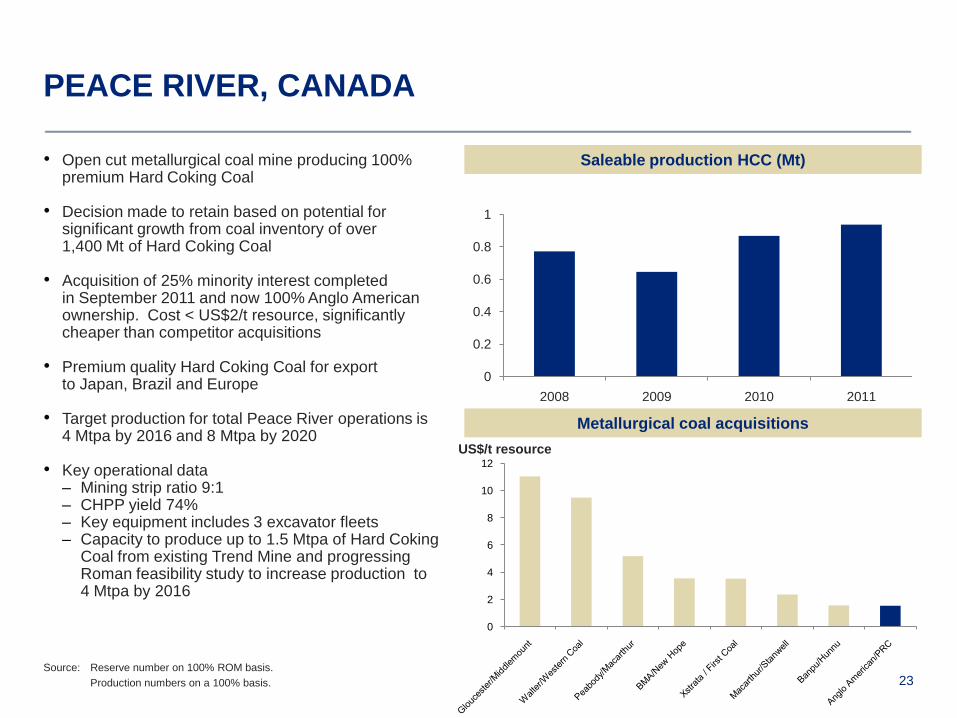
PEACE RIVER, CANADA
• Open cut metallurgical coal mine producing 100% premium Hard Coking Coal
• Decision made to retain based on potential for significant growth from coal inventory of over1,400 Mt of Hard Coking Coal
• Acquisition of 25% minority interest completedin September 2011 and now 100% Anglo American ownership. Cost < US$2/t resource, significantly cheaper than competitor acquisitions
• Premium quality Hard Coking Coal for exportto Japan, Brazil and Europe
• Target production for total Peace River operations is 4 Mtpa by 2016 and 8 Mtpa by 2020
• Key operational data– Mining strip ratio 9:1– CHPP yield 74%– Key equipment includes 3 excavator fleets– Capacity to produce up to 1.5 Mtpa of Hard Coking
Coal from existing Trend Mine and progressing Roman feasibility study to increase production to 4 Mtpa by 2016
Source: Reserve number on 100% ROM basis.
Production numbers on a 100% basis.
Saleable production HCC (Mt)
0
0.2
0.4
0.6
0.8
1
2008 2009 2010 2011
Metallurgical coal acquisitions
US$/t resource
24
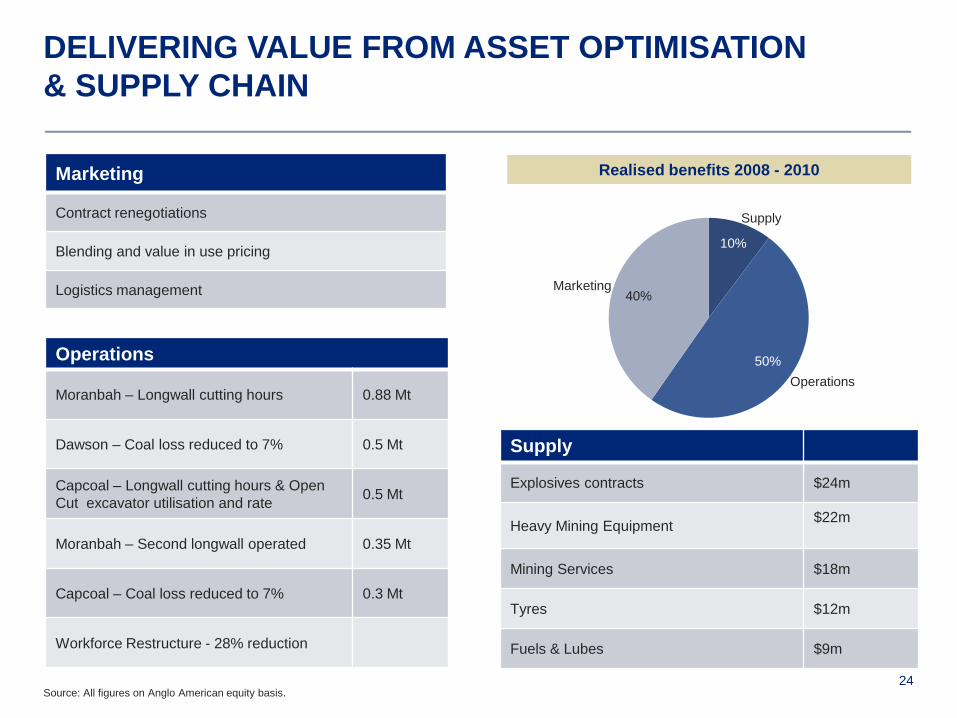
DELIVERING VALUE FROM ASSET OPTIMISATION
& SUPPLY CHAIN
Source: All figures on Anglo American equity basis.
Operations
Moranbah – Longwall cutting hours 0.88 Mt
Dawson – Coal loss reduced to 7% 0.5 Mt
Capcoal – Longwall cutting hours & Open
Cut excavator utilisation and rate0.5 Mt
Moranbah – Second longwall operated 0.35 Mt
Capcoal – Coal loss reduced to 7% 0.3 Mt
Workforce Restructure - 28% reduction
Marketing
Contract renegotiations
Blending and value in use pricing
Logistics management
Supply
Explosives contracts $24m
Heavy Mining Equipment$22m
Mining Services $18m
Tyres $12m
Fuels & Lubes $9m
Realised benefits 2008 - 2010
Marketing40%
Operations
50%
Supply
10%
25
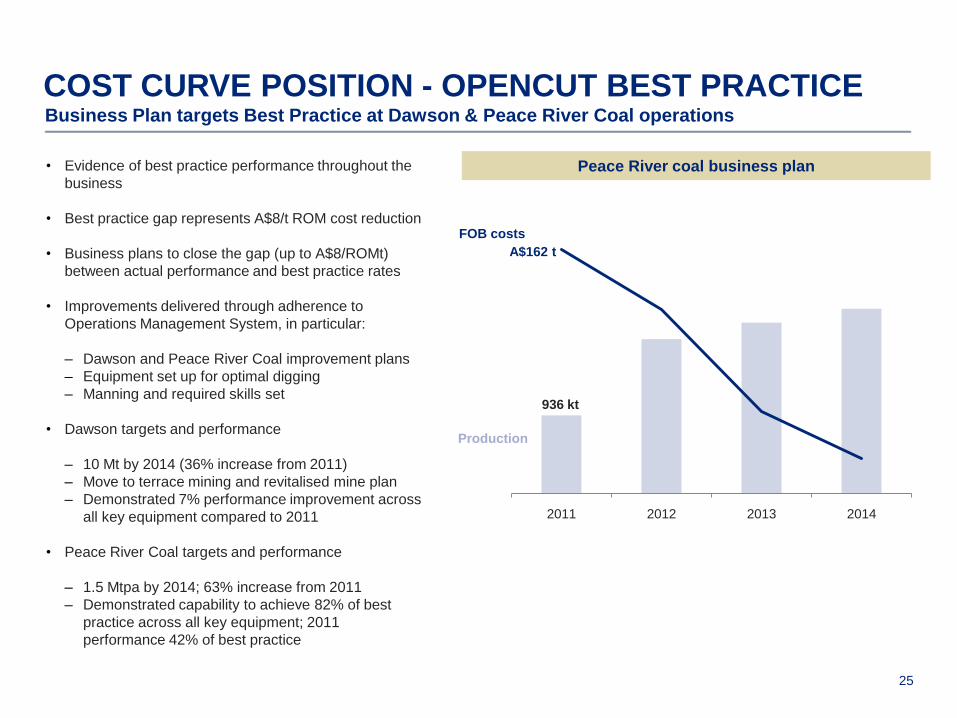
2011 2012 2013 2014
A$162 t
Business Plan targets Best Practice at Dawson & Peace River Coal operations
Peace River coal business plan• Evidence of best practice performance throughout the
business
• Best practice gap represents A$8/t ROM cost reduction
• Business plans to close the gap (up to A$8/ROMt)
between actual performance and best practice rates
• Improvements delivered through adherence to
Operations Management System, in particular:
– Dawson and Peace River Coal improvement plans
– Equipment set up for optimal digging
– Manning and required skills set
• Dawson targets and performance
– 10 Mt by 2014 (36% increase from 2011)
– Move to terrace mining and revitalised mine plan
– Demonstrated 7% performance improvement across
all key equipment compared to 2011
• Peace River Coal targets and performance
– 1.5 Mtpa by 2014; 63% increase from 2011
– Demonstrated capability to achieve 82% of best
practice across all key equipment; 2011
performance 42% of best practice
COST CURVE POSITION - OPENCUT BEST PRACTICE
Production
FOB costs
936 kt
26
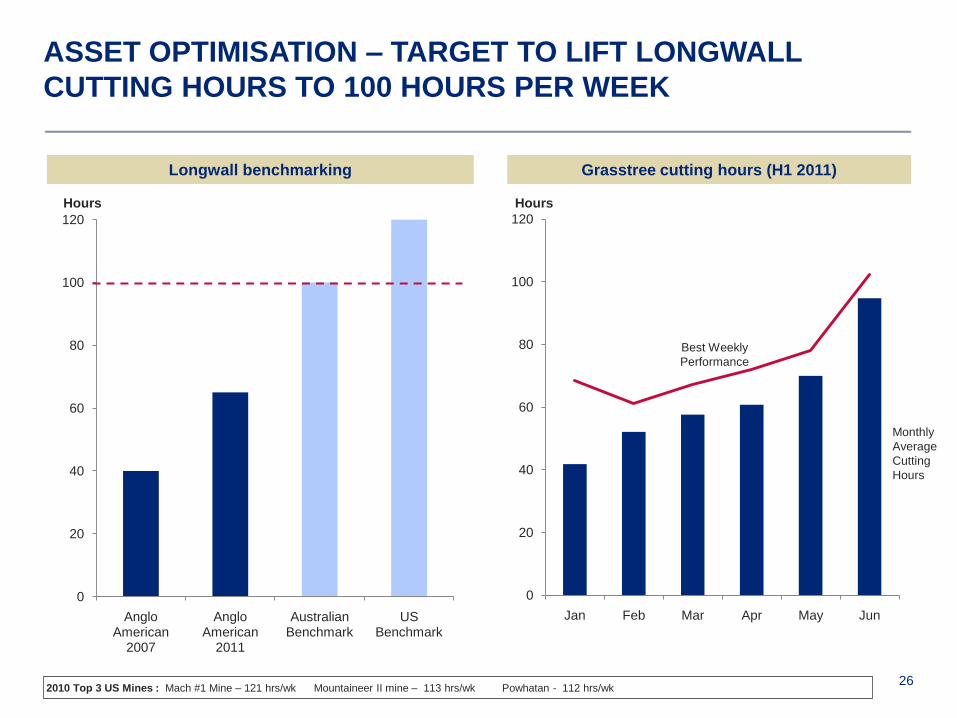
ASSET OPTIMISATION – TARGET TO LIFT LONGWALL
CUTTING HOURS TO 100 HOURS PER WEEK
0
20
40
60
80
100
120
Anglo American
2007
Anglo American
2011
Australian Benchmark
US Benchmark
0
20
40
60
80
100
120
Jan Feb Mar Apr May Jun
Monthly
Average
Cutting
Hours
Best Weekly
Performance
Grasstree cutting hours (H1 2011)Longwall benchmarking
HoursHours
2010 Top 3 US Mines : Mach #1 Mine – 121 hrs/wk Mountaineer II mine – 113 hrs/wk Powhatan - 112 hrs/wk
27
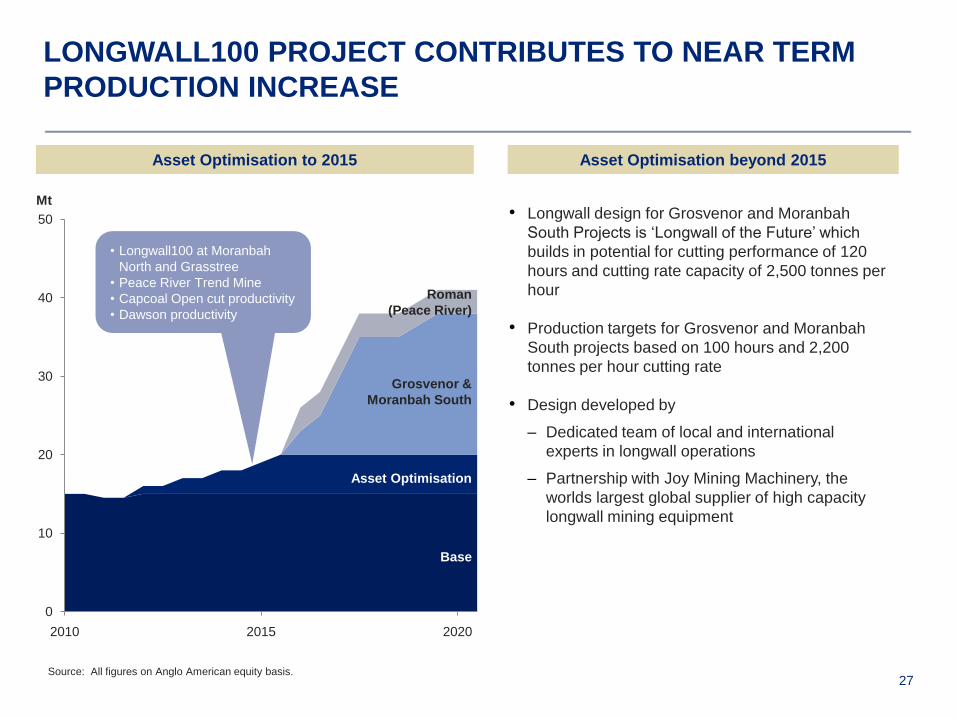
0
10
20
30
40
50
2010 2015 2020
LONGWALL100 PROJECT CONTRIBUTES TO NEAR TERM
PRODUCTION INCREASE
Source: All figures on Anglo American equity basis.
Asset Optimisation to 2015
Base
Asset Optimisation
Grosvenor &
Moranbah South
Roman
(Peace River)
Mt• Longwall design for Grosvenor and Moranbah
South Projects is „Longwall of the Future‟ which
builds in potential for cutting performance of 120
hours and cutting rate capacity of 2,500 tonnes per
hour
• Production targets for Grosvenor and Moranbah
South projects based on 100 hours and 2,200
tonnes per hour cutting rate
• Design developed by
– Dedicated team of local and international
experts in longwall operations
– Partnership with Joy Mining Machinery, the
worlds largest global supplier of high capacity
longwall mining equipment
Asset Optimisation beyond 2015
• Longwall100 at Moranbah
North and Grasstree
• Peace River Trend Mine
• Capcoal Open cut productivity
• Dawson productivity
DELIVERING HIGH
VALUE GROWTH
PROJECTS

29
PLATFORMS ESTABLISHED TO DELIVER OUR GROWTH
Source: All figures on Anglo American equity basis.
Growth
(Advanced stage projects only)
0
10
20
30
40
50
2010 2015 2020
Base
Asset Optimisation
Grosvenor &
Moranbah South
Roman
(Peace River)
Mt
Infrastructure
• Ongoing investigation of dedicated terminal
development options at Abbot Point and Dudgeon
Point
• Consideration of other terminal capacity options,
including Wiggins Island Stage 2
• Pacific National dedicated trains
• Port capacity for Peace River Roman Project
secured at Ridley Island
Partnerships
• Offtake agreements with key customers in
negotiation
• Joy partnership to deliver „Longwall
of the Future‟ for all longwall projects
Community
• Moranbah 2020 fund underpins our development
in the Moranbah region
People
• Program in place to build local skills and attract
overseas skills to both deliver and operate new
assets
All Hard
Coking Coal
30
0%
20%
40%
60%
80%
100%
120%
1 2 3 4 5 6
Cost Performance
Start-up Time
Operability
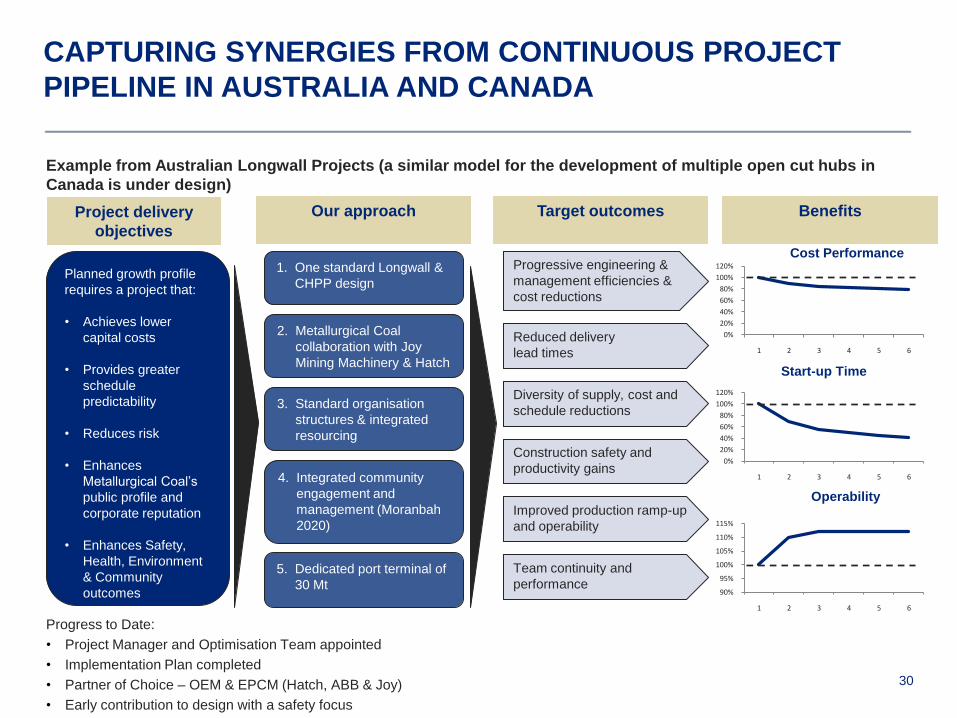
Project delivery
objectives
Our approach Target outcomes Benefits
Planned growth profile
requires a project that:
• Achieves lower
capital costs
• Provides greater
schedule
predictability
• Reduces risk
• Enhances
Metallurgical Coal‟s
public profile and
corporate reputation
• Enhances Safety,
Health, Environment
& Community
outcomes
1. One standard Longwall &
CHPP design
2. Metallurgical Coal
collaboration with Joy
Mining Machinery & Hatch
3. Standard organisation
structures & integrated
resourcing
4. Integrated community
engagement and
management (Moranbah
2020)
5. Dedicated port terminal of
30 Mt
Progressive engineering &
management efficiencies &
cost reductions
Reduced delivery
lead times
Diversity of supply, cost and
schedule reductions
Construction safety and
productivity gains
Improved production ramp-up
and operability
Team continuity and
performance
0%
20%
40%
60%
80%
100%
120%
1 2 3 4 5 6
90%
95%
100%
105%
110%
115%
1 2 3 4 5 6
Progress to Date:
• Project Manager and Optimisation Team appointed
• Implementation Plan completed
• Partner of Choice – OEM & EPCM (Hatch, ABB & Joy)
• Early contribution to design with a safety focus
CAPTURING SYNERGIES FROM CONTINUOUS PROJECT
PIPELINE IN AUSTRALIA AND CANADA
Example from Australian Longwall Projects (a similar model for the development of multiple open cut hubs in
Canada is under design)
31
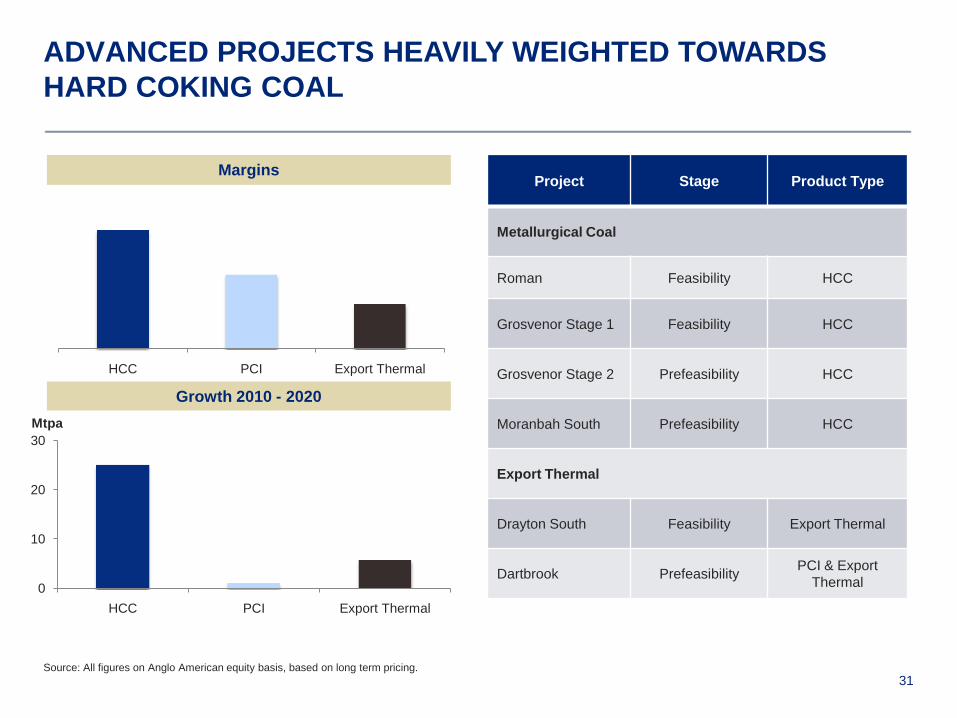
ADVANCED PROJECTS HEAVILY WEIGHTED TOWARDS
HARD COKING COAL
Project Stage Product Type
Metallurgical Coal
Roman Feasibility HCC
Grosvenor Stage 1 Feasibility HCC
Grosvenor Stage 2 Prefeasibility HCC
Moranbah South Prefeasibility HCC
Export Thermal
Drayton South Feasibility Export Thermal
Dartbrook PrefeasibilityPCI & Export
Thermal0
10
20
30
HCC PCI Export Thermal
HCC PCI Export Thermal
Mtpa
Margins
Growth 2010 - 2020
Source: All figures on Anglo American equity basis, based on long term pricing.

32
EXPLORATION IS FOCUSED ON PREMIUM HARD COKING
COAL TARGETS
Australia
• Significant exploration investment to firm up quality resource
base in all regions >$100m pa
• Priority targets are the Grosvenor and Moranbah South
resources
• Life of mine extensions at Moranbah North, Capcoal and
Foxleigh
• Hunter Valley targets at Drayton South and Dartbrook
Canada
• Regional exploration programme commenced
with total spend of $20m pa
• Priority targets are
– Roman
– Belcourt Saxon JV (50%), significant under explored
resource
New supplier regions
• Mozambique, Mongolia and Indonesia preferred
• Country office opened in Mozambique; assessment of
opportunities ongoing
• Exploration offices opening in the near future in Mongolia
and Indonesia
CAPCOAL/FOXLEIGH
$46 million
MORANBAH
$40 million
HUNTER VALLEY
$9 million
Brisbane
Sydney
DAWSON
$20 million

33
A SUBSTANTIAL AND ACTIVE RESOURCE DEVELOPMENT
PIPELINE PREDOMINATELY IN HARD COKING COAL
Source: Excludes Feasibility and Pre-Feasibility stage projects.
Project Stage Mining Product Type Location Growth/ Sustaining
Metallurgical Coal
Aquila Concept Longwall HCC Capcoal/Foxleigh Sustaining
Moranbah North LW2 Concept Longwall HCC Moranbah Growth
Belcourt Saxon Exploration Open Cut HCC Peace River Growth
Horizon ExplorationOpen Cut &
UndergroundHCC Peace River Growth
Rolfe Creek Exploration Underground HCC Capcoal/Foxleigh Sustaining
Capcoal Northern
LeasesExploration
Open Cut &
UndergroundHCC Capcoal/Foxleigh Sustaining
Capcoal Eastern
ExtensionExploration Underground HCC Capcoal/Foxleigh Sustaining
Dawson Far North Exploration Open Cut HCC Dawson Sustaining
Export Thermal Coal
Theodore South Desktop Open Cut Export Thermal Dawson Growth
34
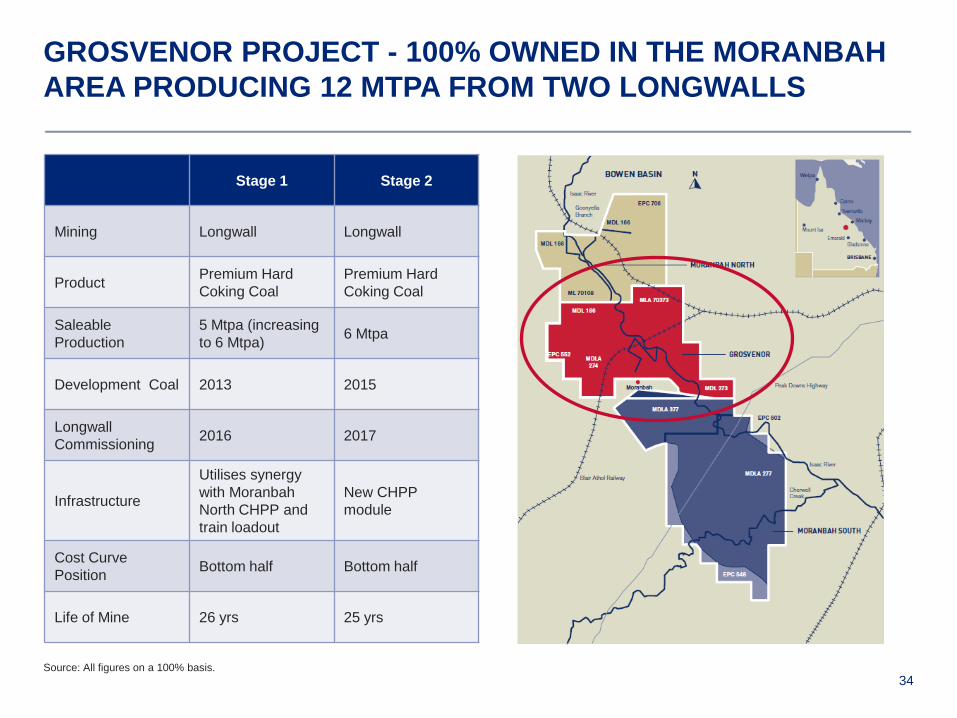
GROSVENOR PROJECT - 100% OWNED IN THE MORANBAH
AREA PRODUCING 12 MTPA FROM TWO LONGWALLS
Stage 1 Stage 2
Mining Longwall Longwall
ProductPremium Hard
Coking Coal
Premium Hard
Coking Coal
Saleable
Production
5 Mtpa (increasing
to 6 Mtpa)6 Mtpa
Development Coal 2013 2015
Longwall
Commissioning2016 2017
Infrastructure
Utilises synergy
with Moranbah
North CHPP and
train loadout
New CHPP
module
Cost Curve
PositionBottom half Bottom half
Life of Mine 26 yrs 25 yrs
Source: All figures on a 100% basis.
35
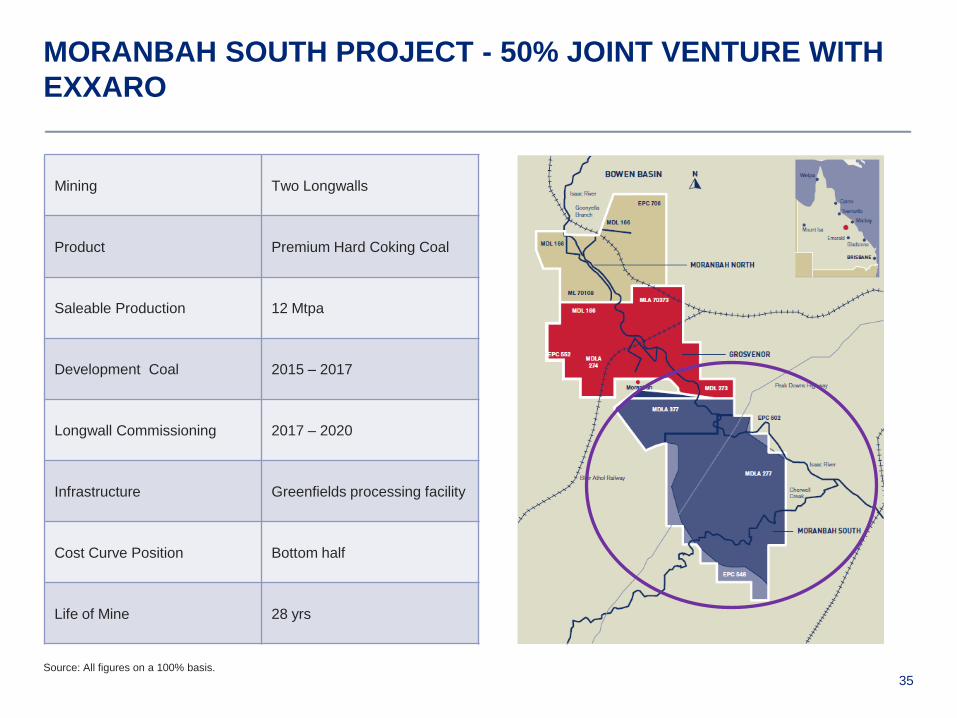
MORANBAH SOUTH PROJECT - 50% JOINT VENTURE WITH
EXXARO
Mining Two Longwalls
Product Premium Hard Coking Coal
Saleable Production 12 Mtpa
Development Coal 2015 – 2017
Longwall Commissioning 2017 – 2020
Infrastructure Greenfields processing facility
Cost Curve Position Bottom half
Life of Mine 28 yrs
Source: All figures on a 100% basis.
36
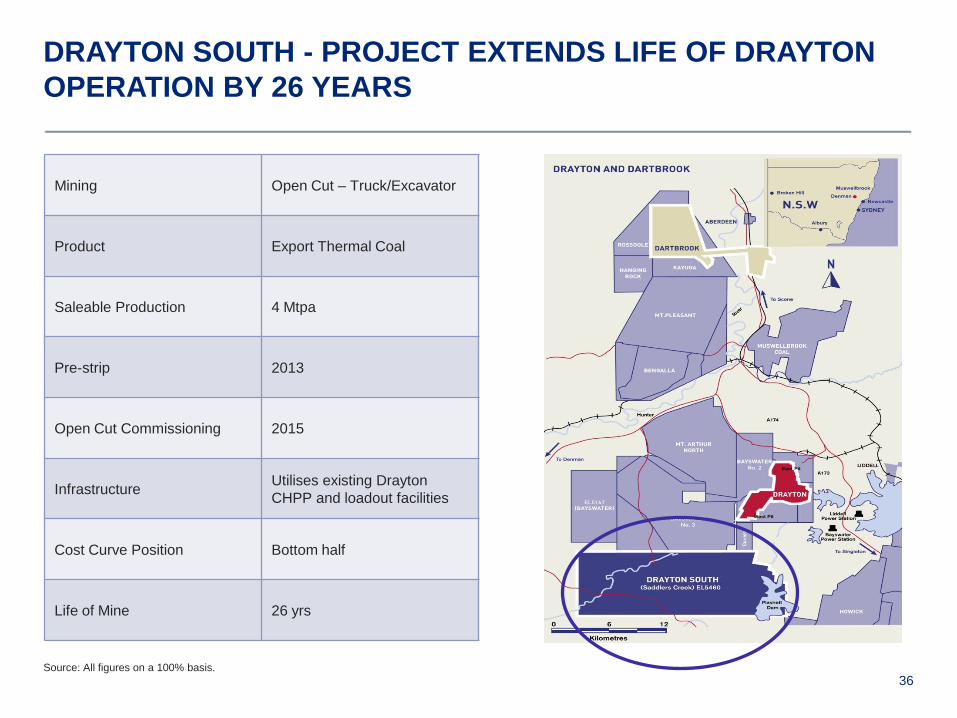
DRAYTON SOUTH - PROJECT EXTENDS LIFE OF DRAYTON
OPERATION BY 26 YEARS
Mining Open Cut – Truck/Excavator
Product Export Thermal Coal
Saleable Production 4 Mtpa
Pre-strip 2013
Open Cut Commissioning 2015
InfrastructureUtilises existing Drayton
CHPP and loadout facilities
Cost Curve Position Bottom half
Life of Mine 26 yrs
Source: All figures on a 100% basis.

37
DARTBROOK - OPEN CUT MINE USING EXISTING COAL
PLANT AND RAIL INFRASTRUCTURE
Mining Open Cut Truck/Excavator
ProductPCI (35%) and Export
Thermal Coal (65%)
Saleable Production 5 Mtpa
Pre-strip 2015
Open Cut Commissioning 2017
InfrastructureUtilises existing Dartbrook
CHPP and loadout facilities
Cost Curve Position Bottom half
Life of Mine 25 yrs
Source: All figures on a 100% basis.
38
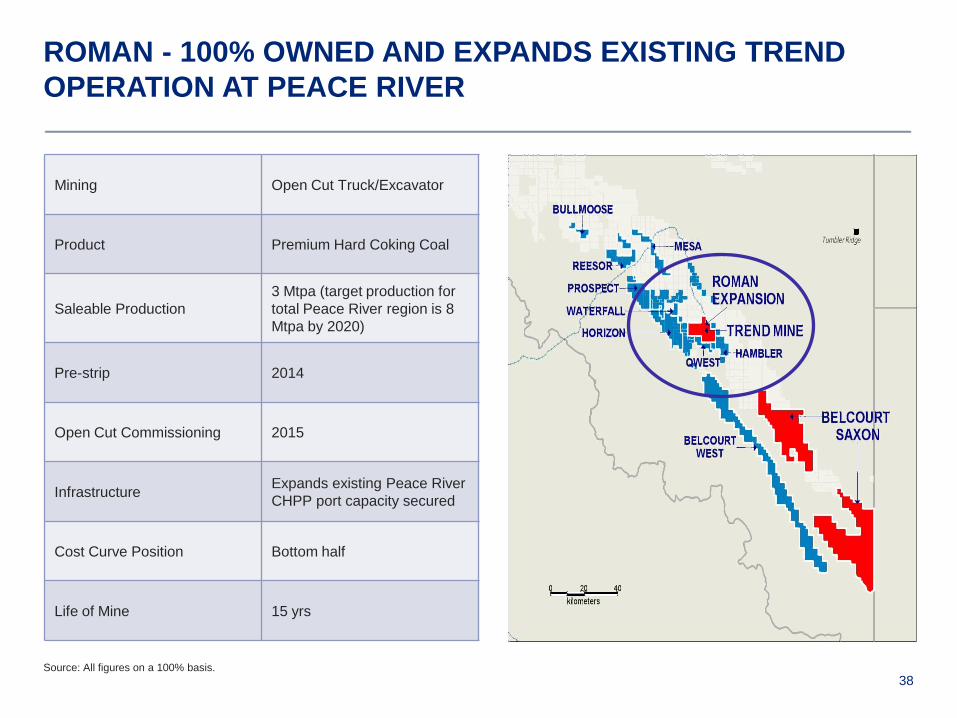
ROMAN - 100% OWNED AND EXPANDS EXISTING TREND
OPERATION AT PEACE RIVER
Mining Open Cut Truck/Excavator
Product Premium Hard Coking Coal
Saleable Production
3 Mtpa (target production for
total Peace River region is 8
Mtpa by 2020)
Pre-strip 2014
Open Cut Commissioning 2015
InfrastructureExpands existing Peace River
CHPP port capacity secured
Cost Curve Position Bottom half
Life of Mine 15 yrs
Source: All figures on a 100% basis.
SUMMARY
40
SUMMARY
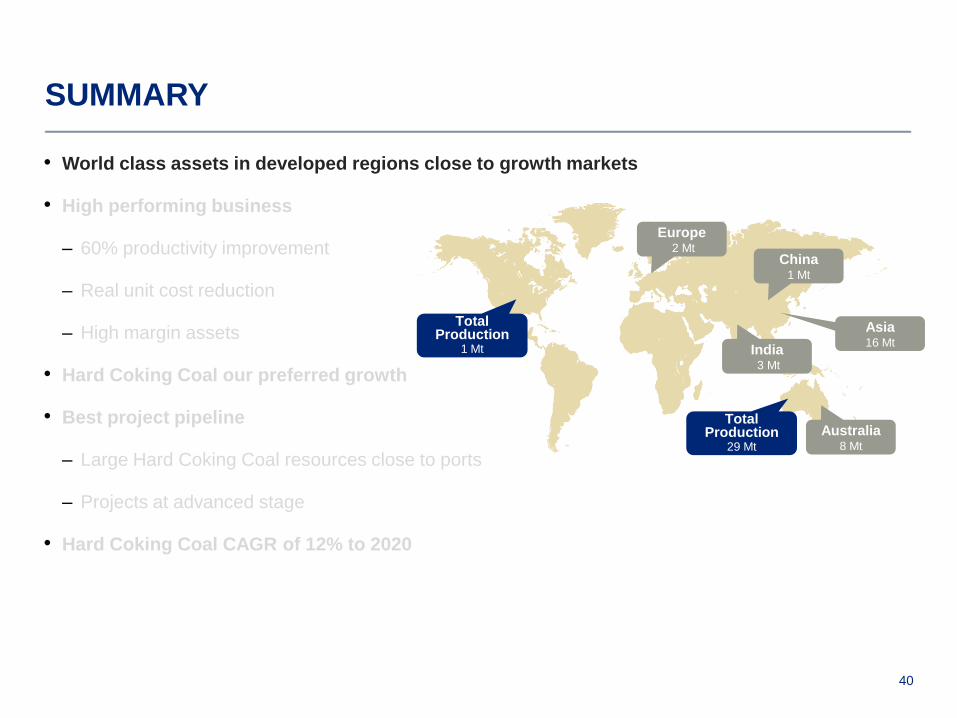
• World class assets in developed regions close to growth markets
• High performing business
– 60% productivity improvement
– Real unit cost reduction
– High margin assets
• Hard Coking Coal our preferred growth product
• Best project pipeline
– Large Hard Coking Coal resources close to ports
– Projects at advanced stage
• Hard Coking Coal CAGR of 12% to 2020
Europe2 Mt
China1 Mt
India3 Mt
Asia16 Mt
Australia8 Mt
Total Production
29 Mt
Total Production
1 Mt
41
SUMMARY
• World class assets in developed regions close to growth markets
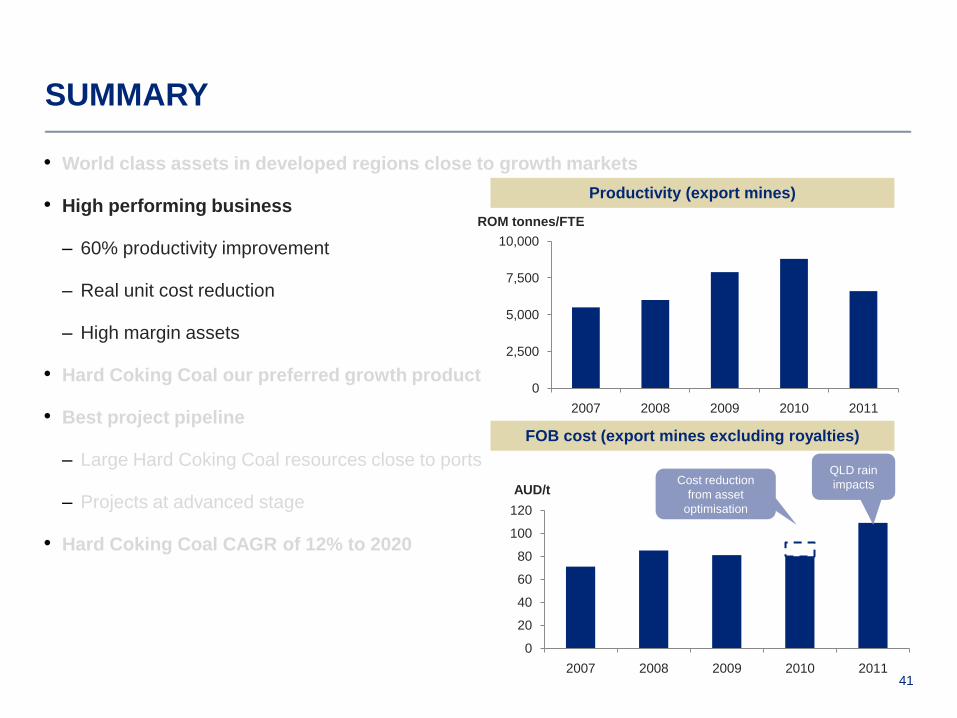
• High performing business
– 60% productivity improvement
– Real unit cost reduction
– High margin assets
• Hard Coking Coal our preferred growth product
• Best project pipeline
– Large Hard Coking Coal resources close to ports
– Projects at advanced stage
• Hard Coking Coal CAGR of 12% to 2020
FOB cost (export mines excluding royalties)
Productivity (export mines)
0
2,500
5,000
7,500
10,000
2007 2008 2009 2010 2011
ROM tonnes/FTE
0
20
40
60
80
100
120
2007 2008 2009 2010 2011
AUD/tCost reduction
from asset
optimisation
QLD rain
impacts

42
SUMMARY
• World class assets in developed regions close to growth markets
• High performing business
– 60% productivity improvement
– Real unit cost reduction
– High margin assets
• Hard Coking Coal our preferred growth product
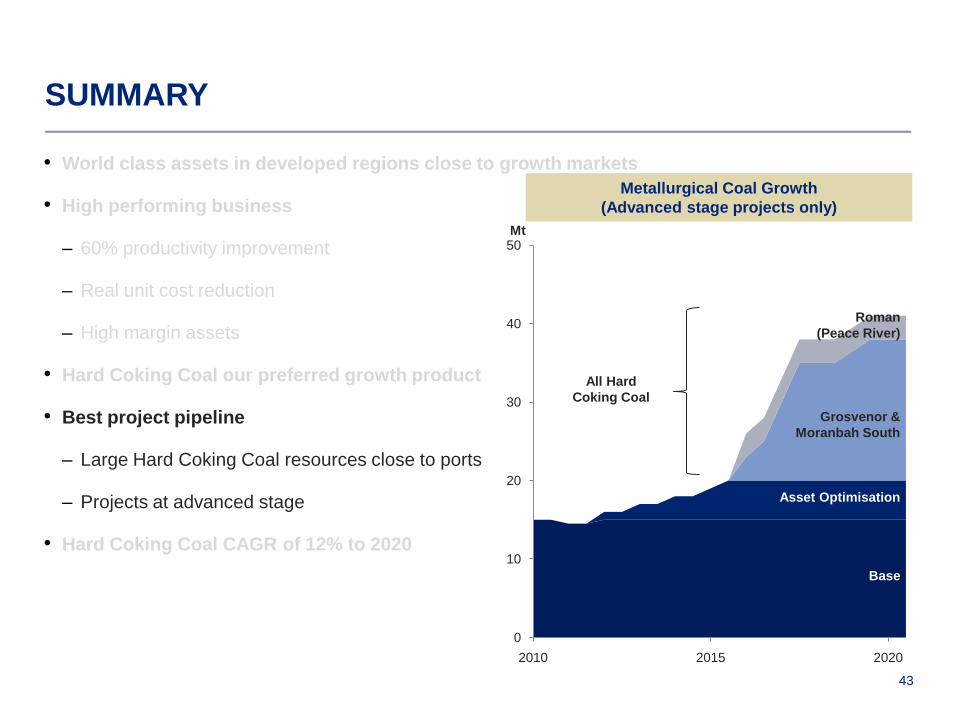
• Best project pipeline
– Large Hard Coking Coal resources close to ports
– Projects at advanced stage
• Hard Coking Coal CAGR of 12% to 2020
2
7
13
16
26
39
49
Seaborne metallurgical coal demand growth
2010-2020
India
Brazil
Other
China
Japan
Korea
Europe
90% Hard Coking
Coal
43
SUMMARY
• World class assets in developed regions close to growth markets
• High performing business
– 60% productivity improvement
– Real unit cost reduction
– High margin assets
• Hard Coking Coal our preferred growth product
• Best project pipeline
– Large Hard Coking Coal resources close to ports
– Projects at advanced stage
• Hard Coking Coal CAGR of 12% to 2020
0
10
20
30
40
50
2010 2015 2020
Base
Asset Optimisation
Grosvenor &
Moranbah South
Roman
(Peace River)
Mt
Metallurgical Coal Growth
(Advanced stage projects only)
All Hard
Coking Coal
44
SUMMARY
• World class assets in developed regions close to growth markets
• High performing business
– 60% productivity improvement
– Real unit cost reduction
– High margin assets
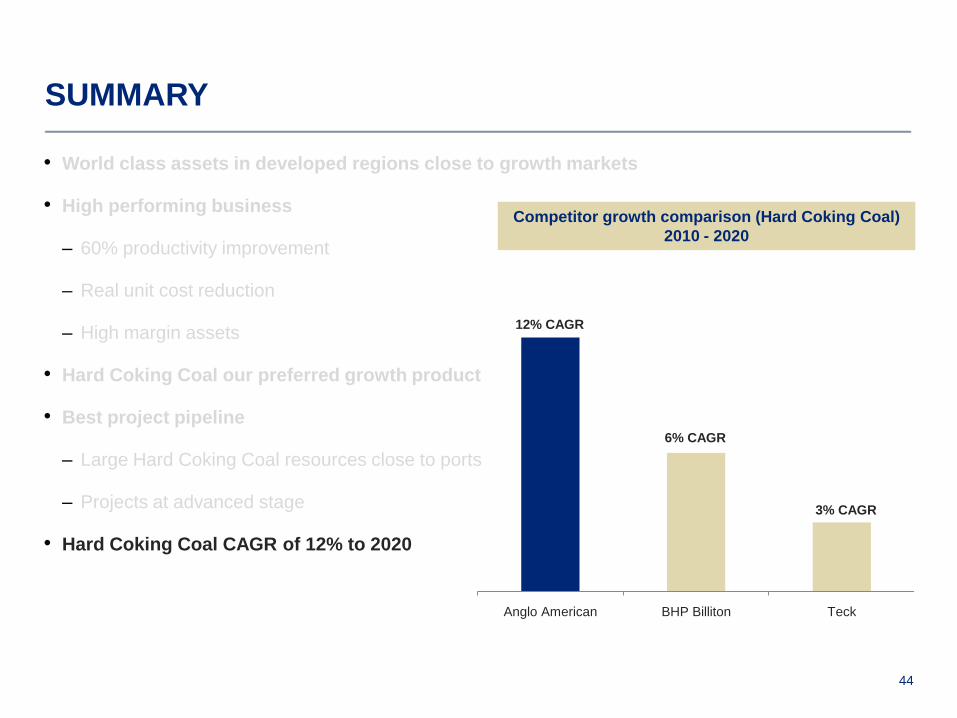
• Hard Coking Coal our preferred growth product
• Best project pipeline
– Large Hard Coking Coal resources close to ports
– Projects at advanced stage
• Hard Coking Coal CAGR of 12% to 2020
Anglo American BHP Billiton Teck
Competitor growth comparison (Hard Coking Coal)
2010 - 2020
3% CAGR
12% CAGR
6% CAGR
45
SUMMARY
• World class assets in developed regions close to growth markets
• High performing business
– 60% productivity improvement
– Real unit cost reduction
– High margin assets
• Hard Coking Coal our preferred growth product
• Best project pipeline
– Large Hard Coking Coal resources close to ports
– Projects at advanced stage
• Hard Coking Coal CAGR of 12% to 2020
APPENDIX
47
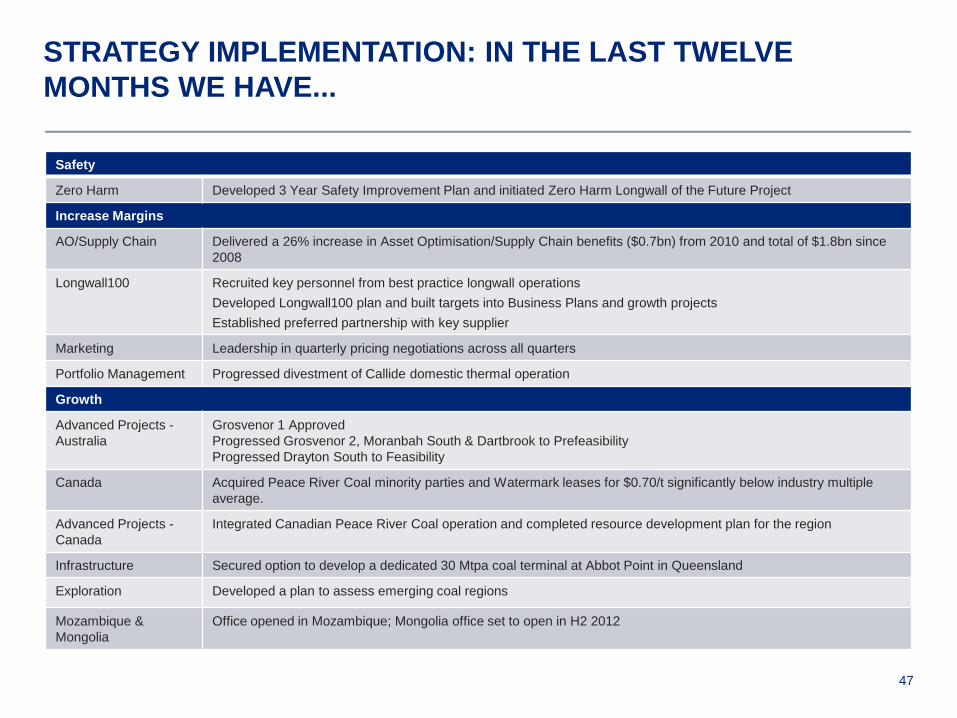
STRATEGY IMPLEMENTATION: IN THE LAST TWELVE
MONTHS WE HAVE...
Safety
Zero Harm Developed 3 Year Safety Improvement Plan and initiated Zero Harm Longwall of the Future Project
Increase Margins
AO/Supply Chain Delivered a 26% increase in Asset Optimisation/Supply Chain benefits ($0.7bn) from 2010 and total of $1.8bn since
2008
Longwall100 Recruited key personnel from best practice longwall operations
Developed Longwall100 plan and built targets into Business Plans and growth projects
Established preferred partnership with key supplier
Marketing Leadership in quarterly pricing negotiations across all quarters
Portfolio Management Progressed divestment of Callide domestic thermal operation
Growth
Advanced Projects -
Australia
Grosvenor 1 Approved
Progressed Grosvenor 2, Moranbah South & Dartbrook to Prefeasibility
Progressed Drayton South to Feasibility
Canada Acquired Peace River Coal minority parties and Watermark leases for $0.70/t significantly below industry multiple
average.
Advanced Projects -
Canada
Integrated Canadian Peace River Coal operation and completed resource development plan for the region
Infrastructure Secured option to develop a dedicated 30 Mtpa coal terminal at Abbot Point in Queensland
Exploration Developed a plan to assess emerging coal regions
Mozambique &
Mongolia
Office opened in Mozambique; Mongolia office set to open in H2 2012
48
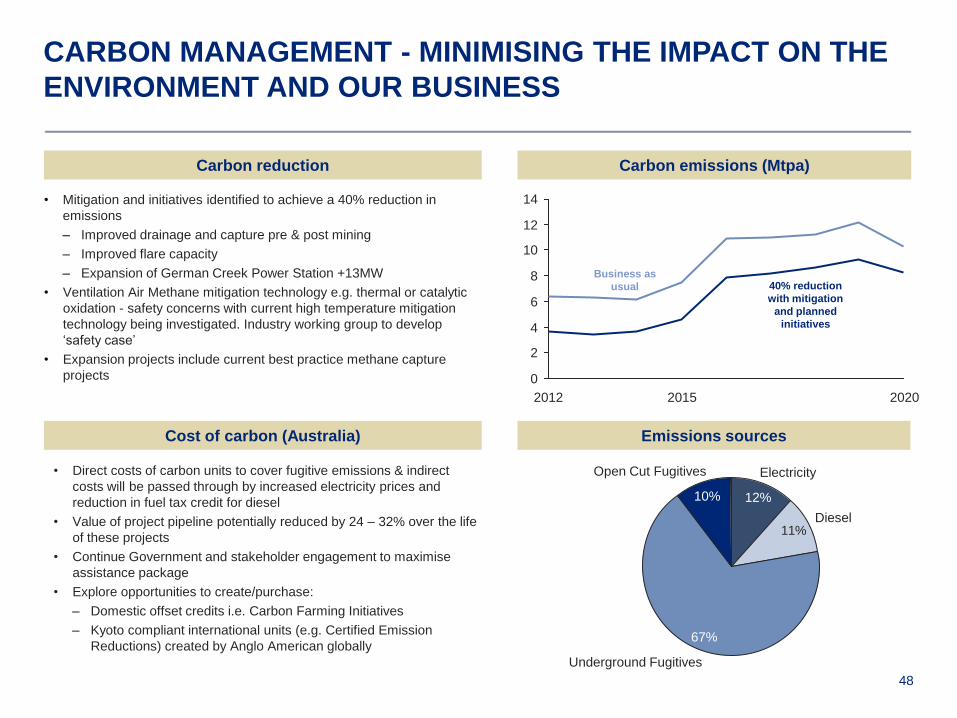
CARBON MANAGEMENT - MINIMISING THE IMPACT ON THE
ENVIRONMENT AND OUR BUSINESS
Carbon reduction
Cost of carbon (Australia)
Carbon emissions (Mtpa)
• Mitigation and initiatives identified to achieve a 40% reduction in
emissions
– Improved drainage and capture pre & post mining
– Improved flare capacity
– Expansion of German Creek Power Station +13MW
• Ventilation Air Methane mitigation technology e.g. thermal or catalytic
oxidation - safety concerns with current high temperature mitigation
technology being investigated. Industry working group to develop
„safety case‟
• Expansion projects include current best practice methane capture
projects
• Direct costs of carbon units to cover fugitive emissions & indirect
costs will be passed through by increased electricity prices and
reduction in fuel tax credit for diesel
• Value of project pipeline potentially reduced by 24 – 32% over the life
of these projects
• Continue Government and stakeholder engagement to maximise
assistance package
• Explore opportunities to create/purchase:
– Domestic offset credits i.e. Carbon Farming Initiatives
– Kyoto compliant international units (e.g. Certified Emission
Reductions) created by Anglo American globally
Emissions sources
11%
Open Cut Fugitives
10%
Underground Fugitives
67%
Diesel
Electricity
12%
0
202020152012
2
4
6
8
10
12
14
Business as
usual 40% reduction
with mitigation
and planned
initiatives
49
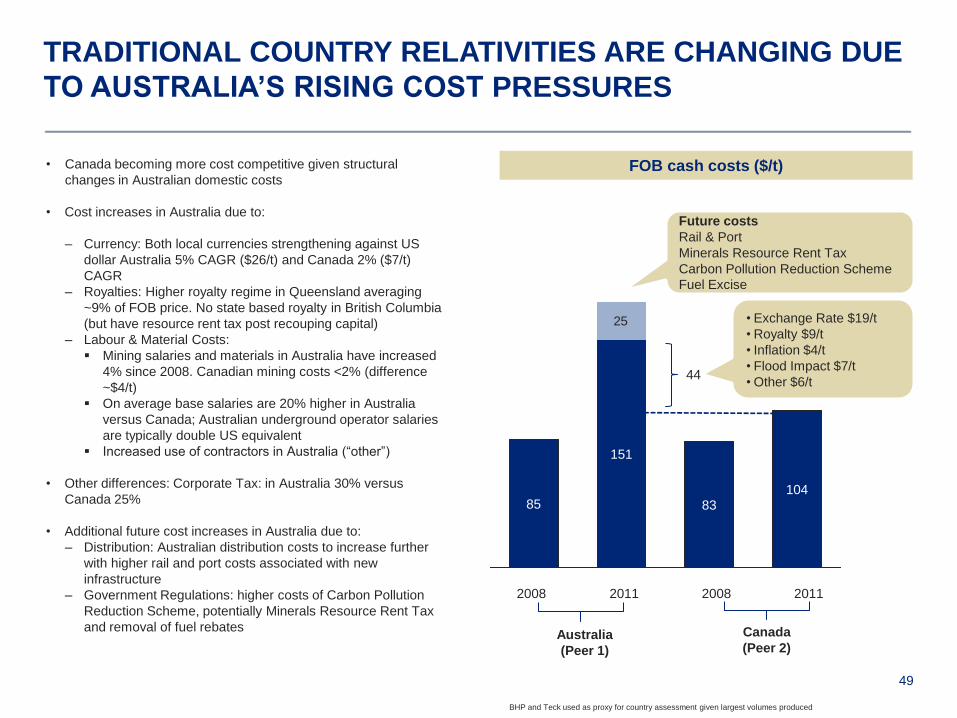
TRADITIONAL COUNTRY RELATIVITIES ARE CHANGING DUE
TO AUSTRALIA’S RISING COST PRESSURES
BHP and Teck used as proxy for country assessment given largest volumes produced
FOB cash costs ($/t)
106
20112008 2008 2011
151
Australia
(Peer 1)
Canada
(Peer 2)
10483
151
85
Future costs
Rail & Port
Minerals Resource Rent Tax
Carbon Pollution Reduction Scheme
Fuel Excise
• Exchange Rate $19/t
• Royalty $9/t
• Inflation $4/t
• Flood Impact $7/t
• Other $6/t44
• Canada becoming more cost competitive given structural
changes in Australian domestic costs
• Cost increases in Australia due to:
– Currency: Both local currencies strengthening against US
dollar Australia 5% CAGR ($26/t) and Canada 2% ($7/t)
CAGR
– Royalties: Higher royalty regime in Queensland averaging
~9% of FOB price. No state based royalty in British Columbia
(but have resource rent tax post recouping capital)
– Labour & Material Costs:
Mining salaries and materials in Australia have increased
4% since 2008. Canadian mining costs <2% (difference
~$4/t)
On average base salaries are 20% higher in Australia
versus Canada; Australian underground operator salaries
are typically double US equivalent
Increased use of contractors in Australia (“other”)
• Other differences: Corporate Tax: in Australia 30% versus
Canada 25%
• Additional future cost increases in Australia due to:
– Distribution: Australian distribution costs to increase further
with higher rail and port costs associated with new
infrastructure
– Government Regulations: higher costs of Carbon Pollution
Reduction Scheme, potentially Minerals Resource Rent Tax
and removal of fuel rebates
25
10483
151
85
50
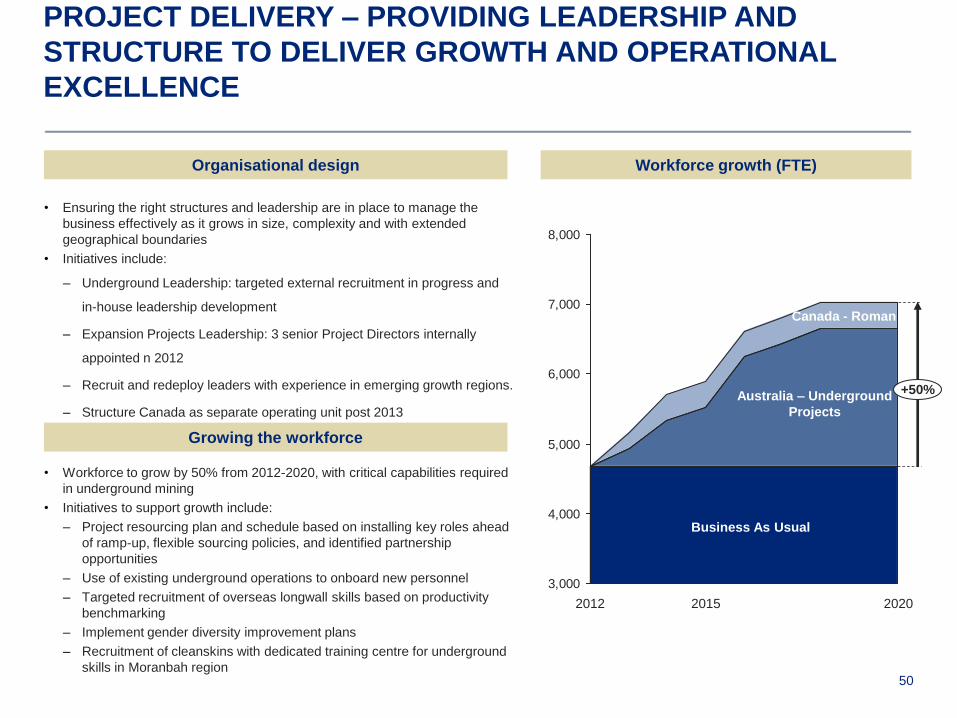
• Ensuring the right structures and leadership are in place to manage the
business effectively as it grows in size, complexity and with extended
geographical boundaries
• Initiatives include:
– Underground Leadership: targeted external recruitment in progress and
in-house leadership development
– Expansion Projects Leadership: 3 senior Project Directors internally
appointed n 2012
– Recruit and redeploy leaders with experience in emerging growth regions.
– Structure Canada as separate operating unit post 2013
• Workforce to grow by 50% from 2012-2020, with critical capabilities required
in underground mining
• Initiatives to support growth include:
– Project resourcing plan and schedule based on installing key roles ahead
of ramp-up, flexible sourcing policies, and identified partnership
opportunities
– Use of existing underground operations to onboard new personnel
– Targeted recruitment of overseas longwall skills based on productivity
benchmarking
– Implement gender diversity improvement plans
– Recruitment of cleanskins with dedicated training centre for underground
skills in Moranbah region
PROJECT DELIVERY – PROVIDING LEADERSHIP AND
STRUCTURE TO DELIVER GROWTH AND OPERATIONAL
EXCELLENCE
Organisational design
Growing the workforce
Workforce growth (FTE)
3,000
4,000
5,000
6,000
7,000
8,000
+50%
202020152012
Business As Usual
Australia – Underground
Projects
Canada - Roman
51
0
10
20
30
40
50
60
2009 2010 2011 2012 2013 2014 2015 2016 2017 2018 2019 2020
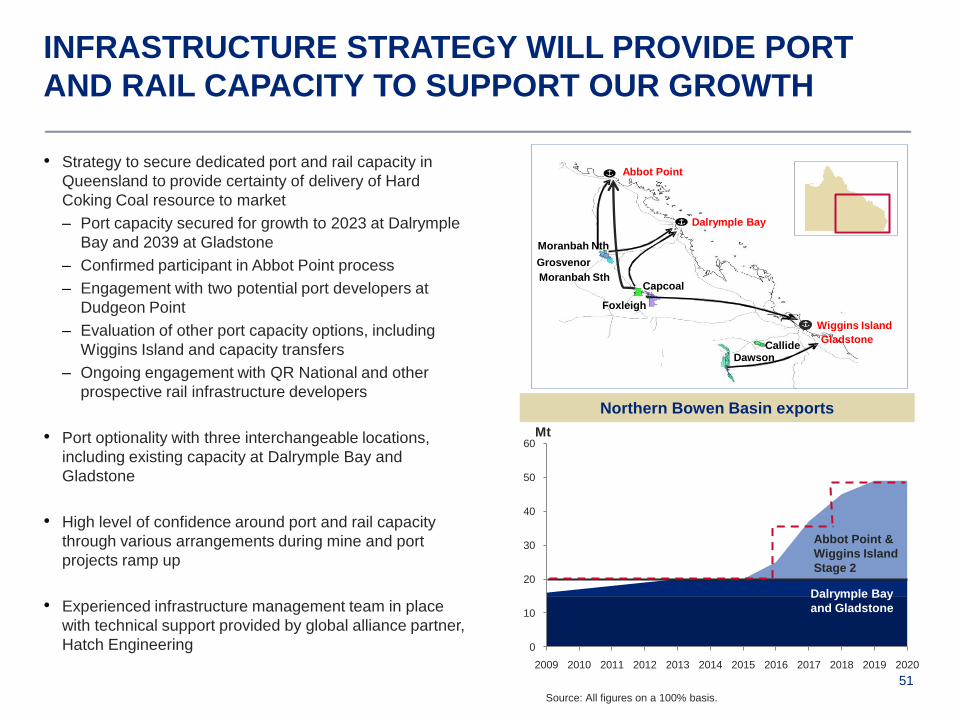
INFRASTRUCTURE STRATEGY WILL PROVIDE PORT
AND RAIL CAPACITY TO SUPPORT OUR GROWTH
Source: All figures on a 100% basis.
Dalrymple Bay
and Gladstone
Abbot Point &
Wiggins Island
Stage 2
Northern Bowen Basin exports
Dalrymple Bay
Moranbah Nth
Grosvenor
Moranbah SthCapcoal
Foxleigh
DawsonCallide
Abbot Point
Mt
Wiggins Island
• Strategy to secure dedicated port and rail capacity in
Queensland to provide certainty of delivery of Hard
Coking Coal resource to market
– Port capacity secured for growth to 2023 at Dalrymple
Bay and 2039 at Gladstone
– Confirmed participant in Abbot Point process
– Engagement with two potential port developers at
Dudgeon Point
– Evaluation of other port capacity options, including
Wiggins Island and capacity transfers
– Ongoing engagement with QR National and other
prospective rail infrastructure developers
• Port optionality with three interchangeable locations,
including existing capacity at Dalrymple Bay and
Gladstone
• High level of confidence around port and rail capacity
through various arrangements during mine and port
projects ramp up
• Experienced infrastructure management team in place
with technical support provided by global alliance partner,
Hatch Engineering
Gladstone
52
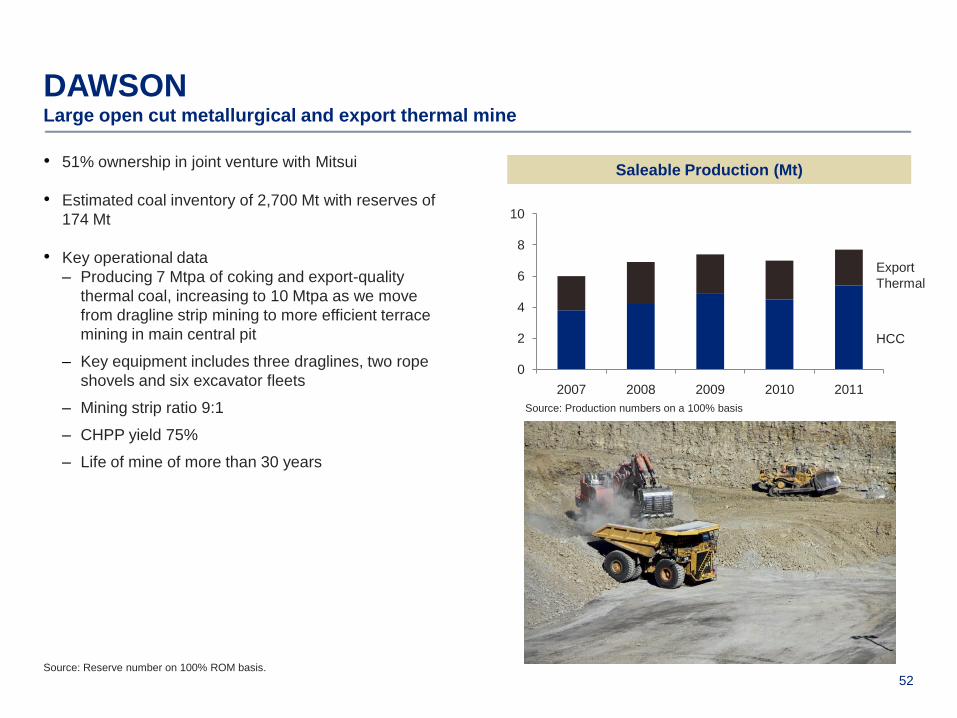
0
2
4
6
8
10
2007 2008 2009 2010 2011
DAWSONLarge open cut metallurgical and export thermal mine
• 51% ownership in joint venture with Mitsui
• Estimated coal inventory of 2,700 Mt with reserves of
174 Mt
• Key operational data
– Producing 7 Mtpa of coking and export-quality
thermal coal, increasing to 10 Mtpa as we move
from dragline strip mining to more efficient terrace
mining in main central pit
– Key equipment includes three draglines, two rope
shovels and six excavator fleets
– Mining strip ratio 9:1
– CHPP yield 75%
– Life of mine of more than 30 years
Source: Reserve number on 100% ROM basis.
Saleable Production (Mt)
HCC
Export
Thermal
Source: Production numbers on a 100% basis
53
0
1
2
3
2008 2009 2010 2011
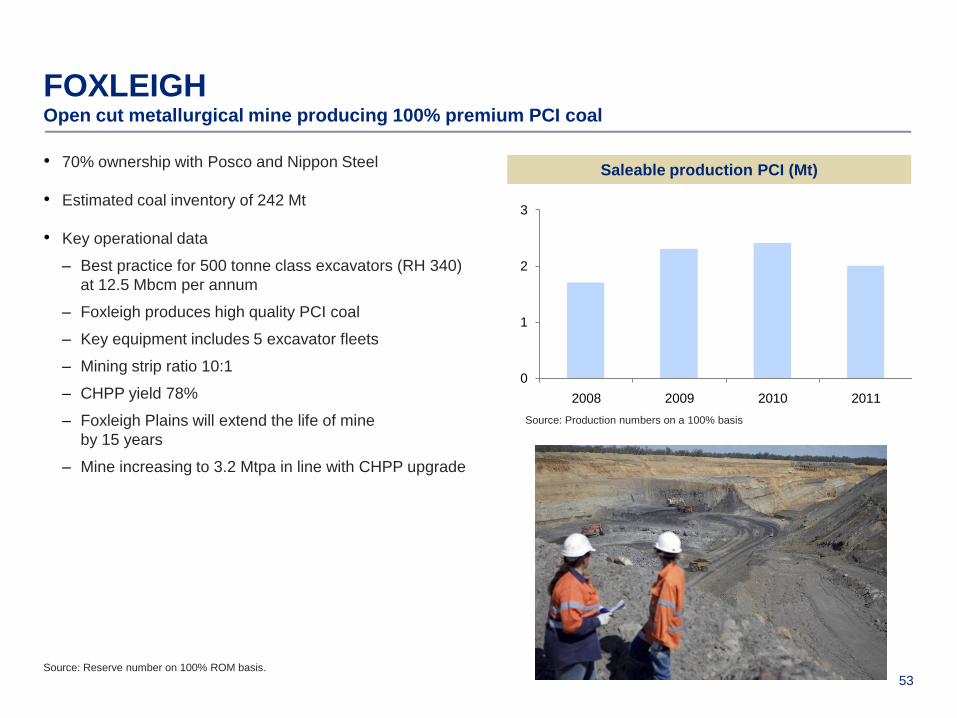
FOXLEIGHOpen cut metallurgical mine producing 100% premium PCI coal
• 70% ownership with Posco and Nippon Steel
• Estimated coal inventory of 242 Mt
• Key operational data
– Best practice for 500 tonne class excavators (RH 340)
at 12.5 Mbcm per annum
– Foxleigh produces high quality PCI coal
– Key equipment includes 5 excavator fleets
– Mining strip ratio 10:1
– CHPP yield 78%
– Foxleigh Plains will extend the life of mine
by 15 years
– Mine increasing to 3.2 Mtpa in line with CHPP upgrade
Source: Reserve number on 100% ROM basis.
Saleable production PCI (Mt)
Source: Production numbers on a 100% basis
54
0
1
2
3
4
5
2007 2008 2009 2010 2011
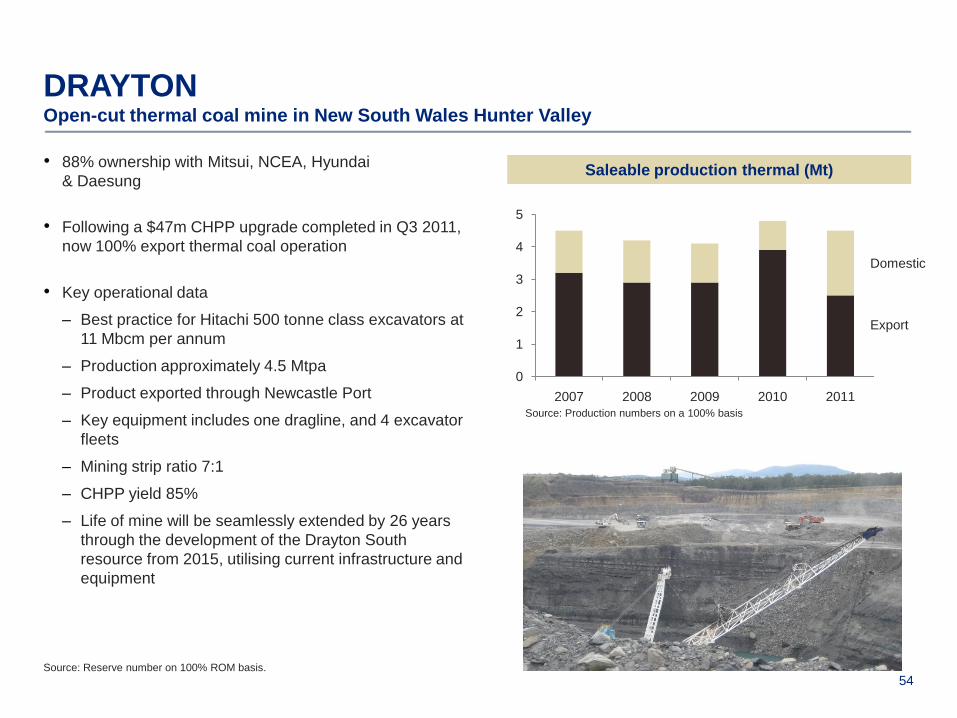
DRAYTONOpen-cut thermal coal mine in New South Wales Hunter Valley
• 88% ownership with Mitsui, NCEA, Hyundai
& Daesung
• Following a $47m CHPP upgrade completed in Q3 2011,
now 100% export thermal coal operation
• Key operational data
– Best practice for Hitachi 500 tonne class excavators at
11 Mbcm per annum
– Production approximately 4.5 Mtpa
– Product exported through Newcastle Port
– Key equipment includes one dragline, and 4 excavator
fleets
– Mining strip ratio 7:1
– CHPP yield 85%
– Life of mine will be seamlessly extended by 26 years
through the development of the Drayton South
resource from 2015, utilising current infrastructure and
equipment
Source: Reserve number on 100% ROM basis.
Saleable production thermal (Mt)
Domestic
Export
Source: Production numbers on a 100% basis
55
0
2
4
6
8
10
2007 2008 2009 2010 2011
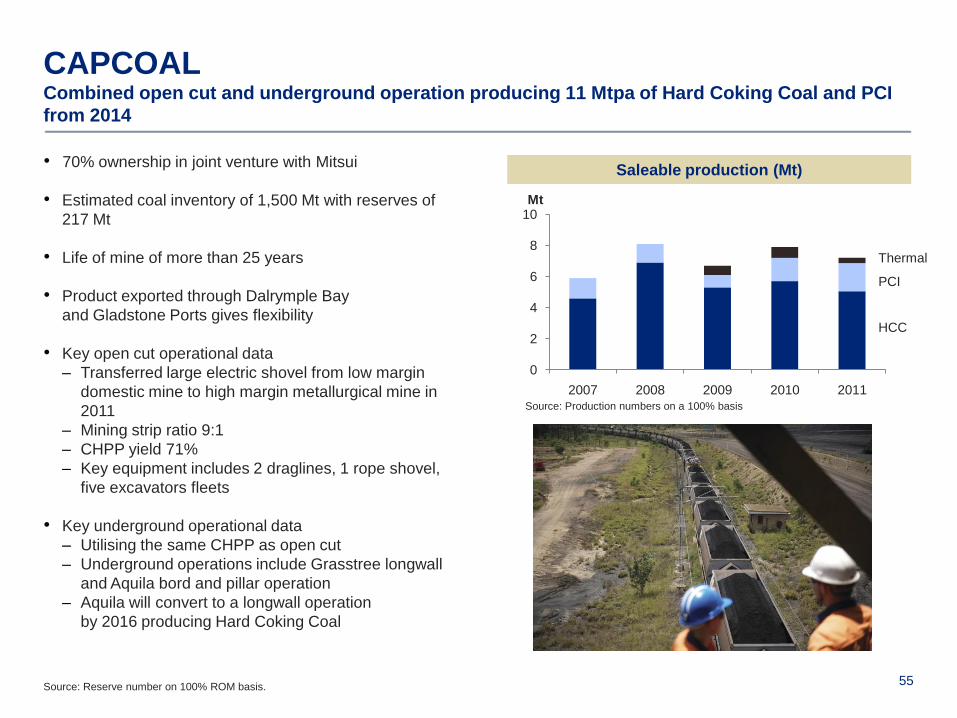
CAPCOALCombined open cut and underground operation producing 11 Mtpa of Hard Coking Coal and PCI
from 2014
• 70% ownership in joint venture with Mitsui
• Estimated coal inventory of 1,500 Mt with reserves of
217 Mt
• Life of mine of more than 25 years
• Product exported through Dalrymple Bay
and Gladstone Ports gives flexibility
• Key open cut operational data
– Transferred large electric shovel from low margin
domestic mine to high margin metallurgical mine in
2011
– Mining strip ratio 9:1
– CHPP yield 71%
– Key equipment includes 2 draglines, 1 rope shovel,
five excavators fleets
• Key underground operational data
– Utilising the same CHPP as open cut
– Underground operations include Grasstree longwall
and Aquila bord and pillar operation
– Aquila will convert to a longwall operation
by 2016 producing Hard Coking Coal
Source: Production numbers on a 100% basis
Saleable production (Mt)
Mt
HCC
PCI
Thermal
Source: Reserve number on 100% ROM basis.
56
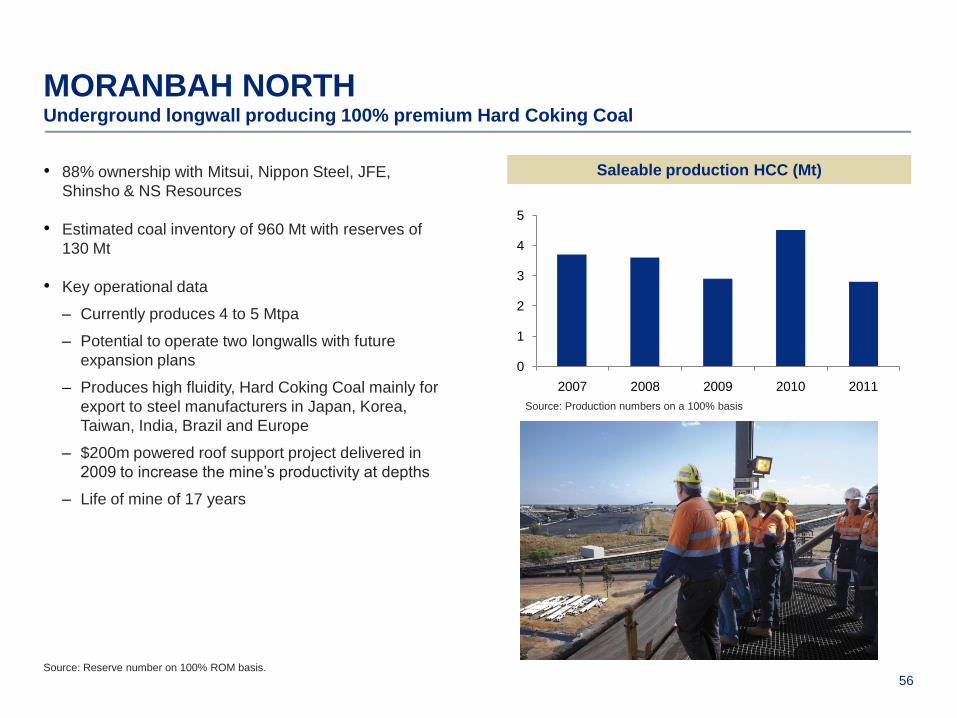
MORANBAH NORTHUnderground longwall producing 100% premium Hard Coking Coal
• 88% ownership with Mitsui, Nippon Steel, JFE,
Shinsho & NS Resources
• Estimated coal inventory of 960 Mt with reserves of
130 Mt
• Key operational data
– Currently produces 4 to 5 Mtpa
– Potential to operate two longwalls with future
expansion plans
– Produces high fluidity, Hard Coking Coal mainly for
export to steel manufacturers in Japan, Korea,
Taiwan, India, Brazil and Europe
– $200m powered roof support project delivered in
2009 to increase the mine‟s productivity at depths
– Life of mine of 17 years
Saleable production HCC (Mt)
Source: Production numbers on a 100% basis
0
1
2
3
4
5
2007 2008 2009 2010 2011
Source: Reserve number on 100% ROM basis.