annex 2. bujagali ii economic and financial evaluation
TRANSCRIPT

ANNEX 2. BUJAGALI II – ECONOMIC AND FINANCIAL EVALUATION STUDY – SUMMARY

International Finance Corporation Bujagali II: Economic and Financial Evaluation Study Final Report 1 February 2007 26/02/2007-20224
Bujagali II – Economic and Financial Evaluation Study
Final Report
Executive Summary
February 2007

International Finance Corporation Bujagali II: Economic and Financial Evaluation Study Final Report 2 February 2007 26/02/2007-20224
Executive Summary Power Planning Associates was appointed by the IFC in January 2006 to carry out an economic and financial evaluation study of the 250 MW Bujagali II hydropower project in Uganda. The ToR for the assignment are reproduced in Appendix A. The purpose of this study is to evaluate the economic viability of the Bujagali II project taking into account economic, financial, social and environmental aspects.
An Interim Report was submitted in February 2006; the report was presented to the Government of Uganda (GoU) and other stakeholders in Kampala in March 2006. Work was then held up for a number of months whilst the World Bank carried out an independent review of the analysis of the hydrology presented in the Interim Report. The demand forecast was also reviewed and amended to include updated GDP estimates and a detailed assessment of the assumptions of future levels of technical and commercial losses. The revised forecast was presented to GoU and other stakeholders in Kampala in September 2006.
The Draft Final Report was submitted to IFC in December 2006 and presented to the government and other stakeholders in Kampala in mid-January 2007. The report was also presented to the Bujagali lenders in London at the end of January.
We now present a brief synopsis of the results and conclusions of the study following the order of the sections in the Main Text of the Report. The Main Text volume is supported by Appendices which are included in a separate volume.
Background
The economic and financial analysis of the Bujagali project in this study includes an update for the hydrology of the lake and development of potential future hydrological scenarios, both for the short and medium term. Had the Bujagali project been commissioned in 2005/06, as envisaged back in 2000, the current problems would not have arisen, or at least not to the same extent. In the intervening years there has been continuing demand growth, coupled with severe supply constraints that would have been alleviated had Bujagali come into service in 2005. The experience has demonstrated the high cost penalties of long term delays in the Bujagali project that was needed to meet the growing electricity demand of Uganda.
International Finance Corporation Bujagali II: Economic and Financial Evaluation Study Final Report 3 February 2007 26/02/2007-20224
Electricity Demand Forecast for the Uganda System
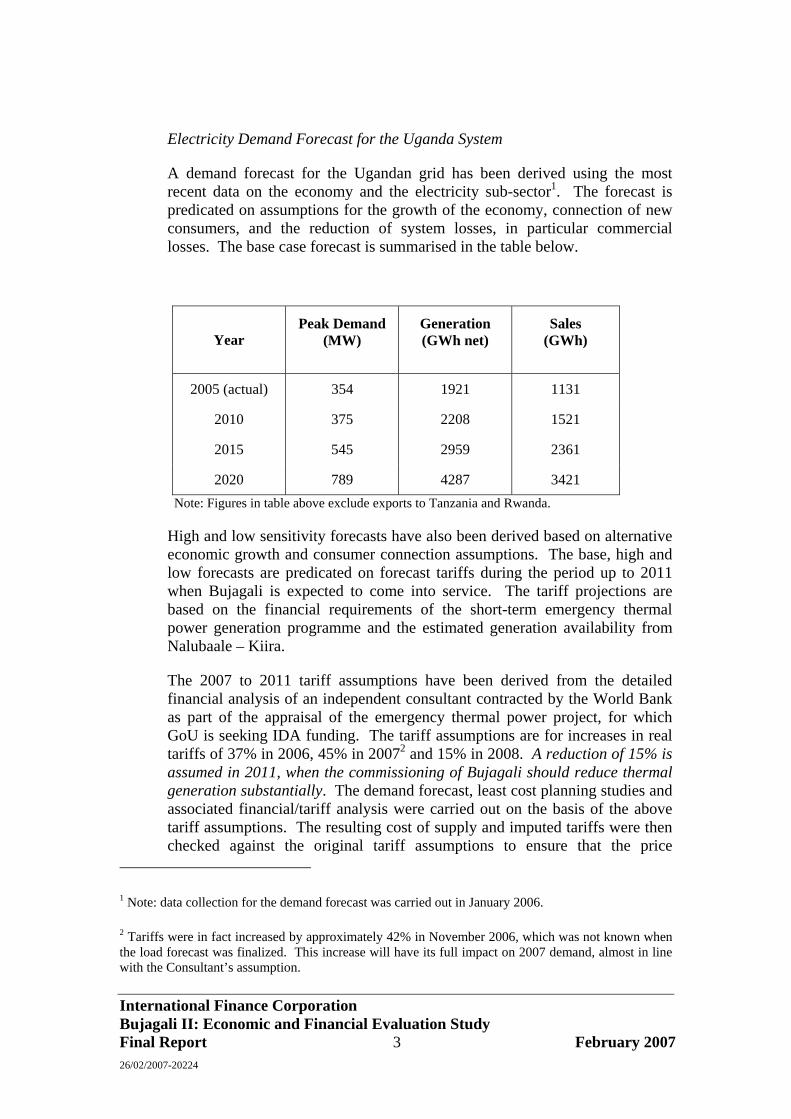
A demand forecast for the Ugandan grid has been derived using the most recent data on the economy and the electricity sub-sector1. The forecast is predicated on assumptions for the growth of the economy, connection of new consumers, and the reduction of system losses, in particular commercial losses. The base case forecast is summarised in the table below.
Year Peak Demand
(MW) Generation (GWh net)
Sales (GWh)
2005 (actual) 354 1921 1131
2010 375 2208 1521
2015 545 2959 2361
2020 789 4287 3421 Note: Figures in table above exclude exports to Tanzania and Rwanda.
High and low sensitivity forecasts have also been derived based on alternative economic growth and consumer connection assumptions. The base, high and low forecasts are predicated on forecast tariffs during the period up to 2011 when Bujagali is expected to come into service. The tariff projections are based on the financial requirements of the short-term emergency thermal power generation programme and the estimated generation availability from Nalubaale – Kiira.
The 2007 to 2011 tariff assumptions have been derived from the detailed financial analysis of an independent consultant contracted by the World Bank as part of the appraisal of the emergency thermal power project, for which GoU is seeking IDA funding. The tariff assumptions are for increases in real tariffs of 37% in 2006, 45% in 20072 and 15% in 2008. A reduction of 15% is assumed in 2011, when the commissioning of Bujagali should reduce thermal generation substantially. The demand forecast, least cost planning studies and associated financial/tariff analysis were carried out on the basis of the above tariff assumptions. The resulting cost of supply and imputed tariffs were then checked against the original tariff assumptions to ensure that the price
1 Note: data collection for the demand forecast was carried out in January 2006.
2 Tariffs were in fact increased by approximately 42% in November 2006, which was not known when the load forecast was finalized. This increase will have its full impact on 2007 demand, almost in line with the Consultant’s assumption.

International Finance Corporation Bujagali II: Economic and Financial Evaluation Study Final Report 4 February 2007 26/02/2007-20224
elasticity effect which has been factored into the demand forecast remained valid. It was found that the assumed tariffs were above the cost of supply, post-2011, by approximately 1.2 US¢/kWh (7%). Even if the tariff were to drop in line with cost of supply, the positive impact on the demand forecast would be minimal.
Hydrology and Energy Outputs of Hydro Plants
A detailed review has been carried out of the hydrology of Lake Victoria. Our conclusion is that the whole period of record from 1900 should be used to determine the future dependable flow for power generation at hydro power stations on the Victoria Nile.
Significantly contrasting values of Net Basin Inflows (NBI) have been observed between the periods 1900 to 1960 and 1961 to 2000, and the low inflow situation observed since 1999. The approach to hydrological risk has been to adopt two separate hydrological flow release scenarios for the 20 year period after 2010 over which the evaluation is being conducted, corresponding to a low hydrology scenario and a high hydrology scenario. The high hydrology scenario is based on the period 1961 to 2000 and the low hydrology scenario on the period 1900 to 1960. The likelihood of the low hydrology occurring has been assessed substantially higher than the high hydrology. The relative probabilities have been calculated at 79%/21% for the low/high hydrology scenarios.
The estimated energy generated at Bujagali and Karuma under the defined low and high hydrological conditions is summarised in the following table.
Low Hydrology
High Hydrology
Hydro plants Units Qmax m3/s
Mean Energy GWh/yr
Mean Energy GWh/yr
Bujagali Units 1 to 5 1240 1 165 1 991
Karuma Units 1 to 4 792 1 324 1 609 (1) energy figures include the impact of scheduled maintenance. (2) Qmax is the flow required to produce the total rated output of the turbine generators.
Interim Generation Programme
In order to meet the short term generation shortfall, GoU has contracted 100 MW of leased high speed diesel plant burning distillate fuel (AGO), and is planning a further 50 MW supported by IDA. This has been done to relieve the load shedding that has been exacerbated by the regional drought, and to allow Uganda to adhere to the agreement to restrict releases from Lake

International Finance Corporation Bujagali II: Economic and Financial Evaluation Study Final Report 5 February 2007 26/02/2007-20224
Victoria to the “Agreed Curve”3. A further 50 MW of medium speed diesel plants burning heavy fuel oil (HFO) is expected to be installed as an Independent Power Project (IPP). The emergency thermal plant is intended to fill the generation capacity gap until 2011 when Bujagali is expected to enter service. The thermal plant will be supplemented by several small hydro projects to be developed as IPPs. In addition, UETCL has negotiated contracts with two sugar producers for 15 MW of power produced from bagasse (sugar cane residue).
Geothermal Potential
We have made a detailed review of the geothermal potential of Uganda and conclude that the resource may be substantially lower than previously estimated. It is considered that only approximately 40 MW of geothermal power generating capacity may be developed economically on the basis of present knowledge, as discussed in detail in Appendix D.
Bujagali and Karuma Cost Estimates
A detailed review and update of the cost estimates for Bujagali and Karuma has been carried out. These are considered to be the only two major hydro plant options for the medium term. These estimates take into consideration the information received from the Bujagali sponsor on the EPC contract negotiations and on development costs relating to Bujagali.
The total economic cost estimates for Bujagali and Karuma resulting from our review are as follows (in constant 2006 US$)4:
3 The “Agreed Curve” represents the allowable outflow from Lake Victoria into the Nile, corresponding to the flow that would have occurred in the absence of man-made intervention, e.g. the dam at Nalubaale-Kiira.
4 Just after this report was completed, BEL informed PPA and the Bank Group of the most recent results of on-going negotiations with the EPC contractor, indicating the addition of a $20 to $ 30 million risk premium in exchange for a comprehensive turnkey contract, plus another $ 5 to $10 million for improvements to the electro-mechanical works, bringing the total EPC cost increase into a range of $30 to $35 millions, nominal and undiscounted. At the same time, BEL and the contractor are negotiating an incentive scheme to accelerate commissioning by 3 to 4 months, which would create for Uganda a real economic cost saving on thermal plant operation estimated at $30 to $40 million (in dollars of 2006). The net impact of these proposed changes on the project’s economic viability is judged to be minimal.
International Finance Corporation Bujagali II: Economic and Financial Evaluation Study Final Report 6 February 2007 26/02/2007-20224
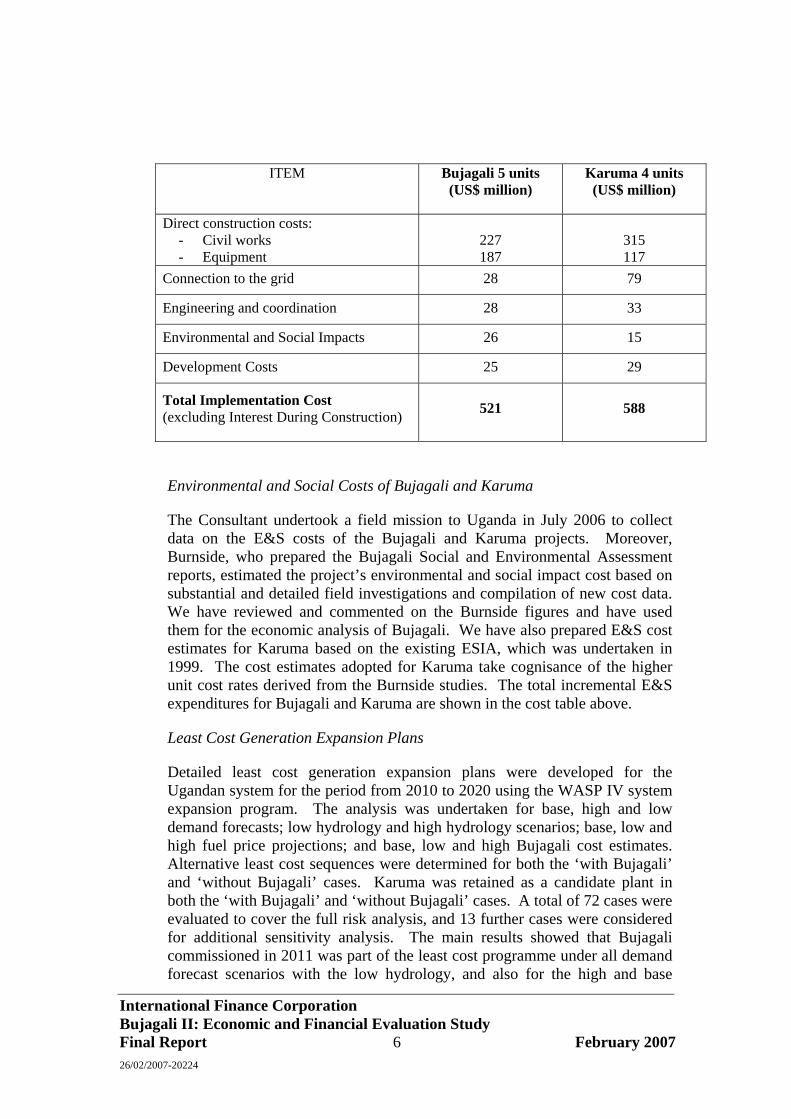
ITEM Bujagali 5 units (US$ million)
Karuma 4 units (US$ million)
Direct construction costs: - Civil works - Equipment
227 187
315 117
Connection to the grid 28 79
Engineering and coordination 28 33
Environmental and Social Impacts 26 15
Development Costs 25 29
Total Implementation Cost (excluding Interest During Construction) 521 588
Environmental and Social Costs of Bujagali and Karuma
The Consultant undertook a field mission to Uganda in July 2006 to collect data on the E&S costs of the Bujagali and Karuma projects. Moreover, Burnside, who prepared the Bujagali Social and Environmental Assessment reports, estimated the project’s environmental and social impact cost based on substantial and detailed field investigations and compilation of new cost data. We have reviewed and commented on the Burnside figures and have used them for the economic analysis of Bujagali. We have also prepared E&S cost estimates for Karuma based on the existing ESIA, which was undertaken in 1999. The cost estimates adopted for Karuma take cognisance of the higher unit cost rates derived from the Burnside studies. The total incremental E&S expenditures for Bujagali and Karuma are shown in the cost table above.
Least Cost Generation Expansion Plans
Detailed least cost generation expansion plans were developed for the Ugandan system for the period from 2010 to 2020 using the WASP IV system expansion program. The analysis was undertaken for base, high and low demand forecasts; low hydrology and high hydrology scenarios; base, low and high fuel price projections; and base, low and high Bujagali cost estimates. Alternative least cost sequences were determined for both the ‘with Bujagali’ and ‘without Bujagali’ cases. Karuma was retained as a candidate plant in both the ‘with Bujagali’ and ‘without Bujagali’ cases. A total of 72 cases were evaluated to cover the full risk analysis, and 13 further cases were considered for additional sensitivity analysis. The main results showed that Bujagali commissioned in 2011 was part of the least cost programme under all demand forecast scenarios with the low hydrology, and also for the high and base

International Finance Corporation Bujagali II: Economic and Financial Evaluation Study Final Report 7 February 2007 26/02/2007-20224
demand with high hydrology. In the high hydrology, low demand cases, the least cost expansion plan comprises only new thermal plant up to 2020, i.e. neither Bujagali nor Karuma could be justified. However, the total probability of occurrence of these cases is low, estimated at 5.5%, and the maximum probability of any one case occurring is only 1.5%.
Sensitivity studies were carried out to confirm the optimum timing of Bujagali, by delaying commissioning from 2011 to 2012 for the base demand. This leads to higher present worth (PW) costs for the low hydrology and marginally higher costs for the high hydrology. The analysis also showed that a 4-unit Bujagali design was less attractive economically than the 5-unit reference design. A further sensitivity study confirmed that Karuma commissioned before Bujagali (by forcing Karuma in 2012) leads to higher PW costs, and that the cost of Bujagali would need to increase by 49%5 to justify the commissioning of Karuma as the next plant before Bujagali.
A full risk analysis was made for the ‘with Bujagali’ and ‘without Bujagali’ cases, with the following probabilities assigned to the key variables:
Demand forecast: base/high/low - 40%/30%/30%
Hydrology: high/low - 21%/79%
Fuel Prices base/low/high – 40%/30%/30%
Bujagali Cost base/low/high - 60%/20%/20%
Assigning the probability weightings to the PW costs resulted in a total net present value (NPV) advantage of US$ 184.0 million (in 2006 US$ with discounting to 2006) in favour of the ‘with Bujagali’ cases. The NPV value is robust in respect of the assumption on hydrology. For example, if 100% probability is assigned to either the low or the high hydrology scenarios, the NPVs, representing the differences between the ‘with Bujagali’ and ‘without Bujagali’ programmes, are:
Low hydrology US$ 202 million, and
High hydrology US$ 116 million
in favour of the ‘with Bujagali’ cases.
5 This result was obtained by progressively increasing the cost of Bujagali in the simulation analysis until the WASP program no longer selected Bujagali as the next major plant. In this case the least cost sequence included Karuma in 2012.

International Finance Corporation Bujagali II: Economic and Financial Evaluation Study Final Report 8 February 2007 26/02/2007-20224
Bujagali Economic Internal Rate of Return (EIRR)
The EIRR for the Bujagali project was estimated by evaluating the cost and benefits of the project in terms of the capital and operating costs of Bujagali and the incremental transmission and distribution capital and operating costs associated with meeting the increment of demand supplied by the project. The benefits were measured in terms of the displacement of costly thermal power and incremental demand of the various categories of consumer, that is met by Bujagali, valued at their respective willingness to pay.
The EIRR values for the references cases obtained are summarised in the table below.
High hydrology Low Hydrology
EIRR 21.7% 22.0%
When the benefits of avoided greenhouses cases are included the EIRRs increase to 22.0% for the high hydrology and 22.9% for the low hydrology.
Sensitivity studies indicate that the project EIRR is robust against all key risk factors, including: hydrology, demand forecast, fuel prices and the capital cost of the project. The demand scenario has the greatest impact on EIRR, but in the most adverse combination of scenarios using the low demand case the resulting EIRR value of 12.5% remains comfortably greater than the 10% benchmark discount rate for World Bank Group-supported projects.
In addition to the sensitivity studies, a probabilistic risk analysis was undertaken on the EIRR value using the Crystal Ball software package with the following parameters subject to a probabilistic range of outcomes: demand forecast, crude oil price, Bujagali capital cost, T&D capital costs, willingness-to-pay of newly-connected customers, and hydrology. The following chart presents the Cumulative Probability Distribution of EIRR forecasts including the impact of greenhouse gas credits to the project. This chart shows there is a 100% probability of the EIRR being above the 10% benchmark discount rate, and a 100% probability of an EIRR greater than 11.7%. The same cumulative probability distribution can be used to show that there is a 50% probability of the EIRR being above 22.7%.

International Finance Corporation Bujagali II: Economic and Financial Evaluation Study Final Report 9 February 2007 26/02/2007-20224
The Cumulative Probability Distribution of EIRR forecasts without greenhouse gas benefits is very similar. There is also a 100% probability of the EIRR being above the 10% test discount rate, and a 100% probability of an EIRR greater than 11.5%. There is a 50% probability of the EIRR being above 21.9%. The greenhouse gas benefits are therefore not significant in the economic justification of the project.
Financial Analysis
The financial analysis evaluated the cost of supply for the reference (least-cost) expansion plan with Bujagali commissioned in 2011 – base demand forecast and low hydrology – over the period to 2020. The components of the costs and the resulting cost of supply/tariff assumptions are shown in the following chart.

International Finance Corporation Bujagali II: Economic and Financial Evaluation Study Final Report 10 February 2007 26/02/2007-20224
-
100
200
300
400
500
600
2007 2008 2009 2010 2011 2012 2013 2014 2015 2016 2017 2018 2019 2020
2006
US$
mill
ion
Bad debtsUmemeUETCLEmbedded renewablesThermalKarumaBujagaliEskom
The chart below compares the average cost of supply with the assumed average tariff over the period to 2020. In the period up to 2008, the assumed tariffs are below the calculated unsubsidized average cost of supply – largely due to the high costs of thermal generation. The IDA credit to assist Uganda in overcoming the consequences of the emergency thermal programme should be more than sufficient to offset the estimated subsidies required to bring average tariffs down to 17 US¢/kWh over the period 2007 to 2010.
-
5
10
15
20
25
30
2007 2008 2009 2010 2011 2012 2013 2014 2015 2016 2017 2018 2019 2020
2006
USc
/kW
h
Assumed tariff
Ave cost of supply
Tariff after available subsidies
Tariff in Jan 2007
Average cost of supply over this period is 16c/kWhcompared with an assumed tariff of 17.2c/kWh
High costs due to short-term thermal supplies
Available subsidies of $243m applied from 2007 to 2010 will reduce tariffs to around 17c/kWh
Over the period 2009-2011, the assumed tariffs and the calculated tariffs are close, although it is possible that tariffs could come down faster than assumed. The analysis was continued beyond 2012 to examine the impact of additional

International Finance Corporation Bujagali II: Economic and Financial Evaluation Study Final Report 11 February 2007 26/02/2007-20224
capacity requirements in the expansion plan, including the tariff impact of the Karuma plant. After 2012, the average tariff is approximately 1.2 US¢/kWh lower than the assumed constant tariff level of 17.2 US¢/kWh.
Macro-economic Impact
A macro-economic analysis was undertaken to evaluate the impact of Bujagali on the Ugandan economy. Overall, the impact of Bujagali relative to the next best option without Bujagali (which includes Karuma in 2012) is relatively small, and positive. There will be an immediate positive impact from Bujagali in 2011 resulting from the balancing of supply and demand, and therefore an end to load shedding. The main macro-economic impacts will be provided through power sector investments, which will add a maximum of 0.3 percent to GDP in 2009. In the longer term, the ‘with Bujagali’ expansion plan should afford 5 percent lower electricity tariffs than the ‘without Bujagali’ plan.

ANNEX 3. LAKE VICTORIA HYDROLOGY

1
ANNEX 3. LAKE VICTORIA HYDROLOGY1
1. Summary on Hydrological Performance of Lake Victoria. The period of time after commissioning of Bujagali when the energy generation represents most of the benefits of the project is approximately 20 years. This is the consequence of the discounting process in the economic evaluation of the project. Therefore, the hydrological scenarios considered for the calculation of energy generation and economic evaluation should be selected for being most representative of periods of 20 years duration that are likely to occur again in the future.
2. In the 1900 – 2005 historical series of the net inflow into the lake, also called Net Basin Supply (NBS = Run-off + Direct Lake Rainfall – Lake Evaporation), three homogeneous periods can be observed:
- 1900 – 1959: average net inflow = 662 m3/s - 1960 – 1999: average net inflow = 1206 m3/s - 2000 – 2005: average net inflow = 659 m3/s
3. Both periods 1900 – 1959 (60 year-duration) and 1960 – 1999 (40-year duration) appear to be homogeneous enough to define the two hydrological series that are most representative of the future net inflow pattern that is likely to occur for a period of approximately 20 years after commissioning of the next major hydropower plant on the Nile.
Figure 1: Lake Victoria Net Basin Supply – 20-Year Moving Average NBS and Mean Yearly NBS of each Reference Period
1 An assessment of the hydrology of Lake Victoria undertaken for the proposed project was carried out by Power Planning Associates (UK) in consultation with Coyne et Bellier (France), and ECON (Norway).
-500
0
500
1000
1500
2000
2500
3000
1900 1905 1910 1915 1920 1925 1930 1935 1940 1945 1950 1955 1960 1965 1970 1975 1980 1985 1990 1995 2000 2005
Years
Net
Bas
in S
uppl
y, m
3/s
Yearly NBS Mean 1900-2005 20-Year moving average1900 - 1959 mean NBS 1960 - 1999 mean NBS
867 m3/s

2
4. A scenario that would consider the whole period 1900 – 2005, leading to a long term average of 867 m3/s, is found not to be representative enough of 20-year periods, as shown by the 20-year moving average curve in the above figure, in which the Net Basin Supply is for most of the time clearly above or clearly below the long term average value. On the other hand, as no reason can be produced to discard the possibility that a future 20-year period will be similar to those observed in the historical record, the following scenarios are defined:
• Low Hydrology Scenario: the net inflow into the lake will be in broad agreement with what happened between 1900 and 1960, and again between 1998 and 2005, that is to say, annual variations around an average Net Basin Supply of 660 cubic meters per second(m3/s);
• High Hydrology Scenario: the net inflow will be in accordance with the period that started with the exceptional inflows of 1961-1964 (average 2300 m3/s), followed by approximately 35 years of NBS averaging more than 1000 m3/s, with an average net inflow of 1200 m3/s during the whole period.
5. The reservoir operation studies performed on the basis of each of these two net inflow series produced the values of constant release that are guaranteed with 95% reliability:
• Low Hydrology: the firm release is 687 m3/s
• High Hydrology: the firm release is 1247 m3/s.
6. Based on a combination of analysis of dry sequences and mean values, the probabilities associated to each of the above hydrology scenarios occurring during the period 2011 – 2030 are: 79% for the Low Hydrology and 21% for the High Hydrology. The possible influence of climatic changes was found not to be significant enough in the medium term (to 2030) to influence in one way or the other the hydrological scenarios.
7. Departure from the Agreed Curve and Recent Fall in the Level of Lake Victoria. The “Agreed Curve” is the relationship between the release at the Nalubaale hydropower facility and the level of Lake Victoria, for the release to follow the “rating curve” that used to be imposed by the level of the lake outlet before the construction of the Nalubaale hydropower facility in the 1950s, based on the Jinja Gauge.
8. The consequence of meeting the Agreed Curve is that, the lower the lake level, the lower the release, and the higher the lake level, the higher the release. The two extreme situations that were experienced by the lake level are as follows:
- lake level = 1133.2 the release according to the Agreed Curve is: 400 m3/s - lake level = 1136.2 the release according to the Agreed Curve is: 1850 m3/s
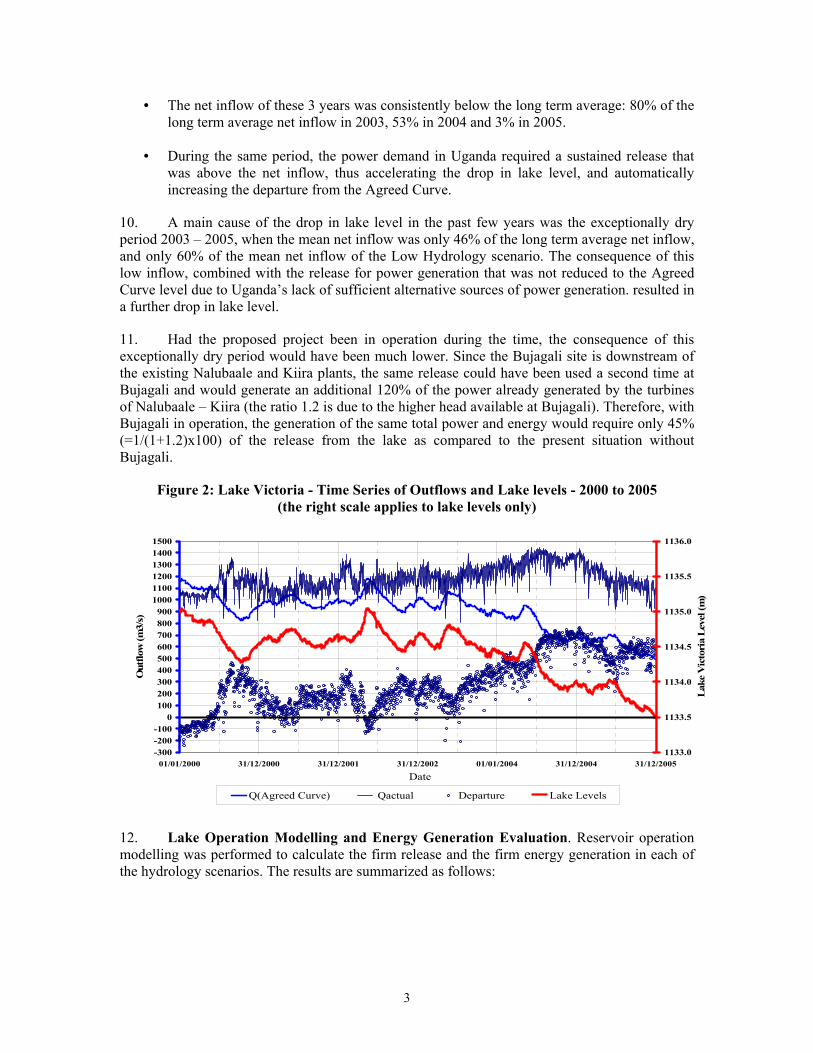
9. This Agreed Curve therefore constitutes a “moving reference”. If during a long dry period, when net inflows are consistently lower than the long term average, releases are consistently higher than the net inflow, then the drop in lake level is accelerated and the departure of release from the Agreed Curve is amplified. This is precisely what occurred during the period 2003 – 2005, and is illustrated in Figure 2 below:
3
• The net inflow of these 3 years was consistently below the long term average: 80% of the long term average net inflow in 2003, 53% in 2004 and 3% in 2005.
• During the same period, the power demand in Uganda required a sustained release that was above the net inflow, thus accelerating the drop in lake level, and automatically increasing the departure from the Agreed Curve.
10. A main cause of the drop in lake level in the past few years was the exceptionally dry period 2003 – 2005, when the mean net inflow was only 46% of the long term average net inflow, and only 60% of the mean net inflow of the Low Hydrology scenario. The consequence of this low inflow, combined with the release for power generation that was not reduced to the Agreed Curve level due to Uganda’s lack of sufficient alternative sources of power generation. resulted in a further drop in lake level.
11. Had the proposed project been in operation during the time, the consequence of this exceptionally dry period would have been much lower. Since the Bujagali site is downstream of the existing Nalubaale and Kiira plants, the same release could have been used a second time at Bujagali and would generate an additional 120% of the power already generated by the turbines of Nalubaale – Kiira (the ratio 1.2 is due to the higher head available at Bujagali). Therefore, with Bujagali in operation, the generation of the same total power and energy would require only 45% (=1/(1+1.2)x100) of the release from the lake as compared to the present situation without Bujagali.
Figure 2: Lake Victoria - Time Series of Outflows and Lake levels - 2000 to 2005 (the right scale applies to lake levels only)
-300-200-100
0100200300400500600700800900
100011001200130014001500
01/01/2000 31/12/2000 31/12/2001 31/12/2002 01/01/2004 31/12/2004 31/12/2005
Date
Out
flow
(m3/
s)
1133.0
1133.5
1134.0
1134.5
1135.0
1135.5
1136.0
Lak
e V
icto
ria
Lev
el (m
)
Q(Agreed Curve) Qactual Departure Lake Levels
12. Lake Operation Modelling and Energy Generation Evaluation. Reservoir operation modelling was performed to calculate the firm release and the firm energy generation in each of the hydrology scenarios. The results are summarized as follows:

4
Table 1: Energy Generation Capability of Each Hydropower Plant
Low Release / Low Hydrology High Release/ High Hydrology
Plants Units (2) Qmax m3/s
Available Capacity
MW
Firm Energy Generation
GWh/yr
Available Capacity
MW
Firm Energy Generation
GWh/yr Nalubaale - Kiira Units 1 to 15 2300 203 (1) 972 204 (1) 1740
Bujagali HPP Units 1 to 4 992 200 1 198 200 1 715 (candidate) Units 1 to 5 1240 250 1 198 250 2 132
Karuma HPP Units 1 to 3 594 150 1 295 150 1 302 (candidate) Units 1 to 4 792 158 1 360 200 1 722
Units 1 to 5 990 158 1 360 250 2 141 Units 1 to 6 1188 158 1 360 296 2 523 (1) this value may vary depending on the downstream plants and on the optimum operation rule (2) lines in bold characters indicate the plants considered as base options in the expansion plans modelling
13. Before the above figures were used in the economic evaluation and expansion plan modelling, adjustments were made to account for the impact of periods when the generating units are under maintenance. The decrease in energy output ranges between 2% and 7% of the above energy generation figures.

ANNEX 4.
CONSULTATIONS TO DATE ON THE PRIVATE POWER GENERATION (BUJAGALI) PROJECT

1
ANNEX 4. CONSULTATIONS TO DATE ON THE BUJAGALI HYDROPOWER PROJECT
January 2006: Initial consultations on the draft Social and Environmental Assessment (“SEA”) report terms of reference and the draft Public Consultation and Disclosure Plan (“PCDP”); government agencies in Kampala and Jinja.
January 2006: Economic Study workshop with key stakeholders of Uganda’s power sector on electricity demand forecast; Kampala.
March 2006: Consultations on draft SEA terms of reference with potential lenders; Washington, D.C.
March 2006: Consultations on the draft SEA terms of reference, draft PCDP, and tourism study; government agencies and tourism operators in Kampala and Jinja.
March 2006: Economic Study workshop with key stakeholders of Uganda’s power sector to present interim report; Kampala.
March 2006: Meetings/interviews with project-affected people (“PAPs”) resettled by AES Nile Power (“AESNP”) as part of the Assessment of Past Resettlement Activities and Action Plan (“APRAP”) preparation; Hydropower Project site area.
May 2006: Consultations on the draft SEA terms of reference and the draft PCDP; government agencies and Non-Governmental Organizations in Kampala.
July 2006: Meetings/interviews with PAPs resettled by AESNP as part of Assessment of Past Resettlement Activities and Action Plan (APRAP) preparation; Interconnection Project, Kawanda substation.
August 2006: Public notice (newspapers, newspaper website) announcing the draft SEA terms of reference and the draft PCDP, Kampala.
July/August 2006: Meetings with Non-Governmental Organizations and information package sent on the draft SEA terms of reference and the draft PCDP; Kampala.
July/August 2006: Meetings by Sub-County Level (LC3) consultation committees with communities potentially affected by the proposed Bujagali project; Hydropower and Interconnection Project site areas.
August 2006: Meetings with representatives of the Kingdoms of Busoga and Buganda on the draft SEA terms of reference and the draft PCDP; Hydropower Project site area.
August-October 2006: Socio-economic survey of the Interconnection Project corridor; Interconnection Project site area.
September 2006: Consultations on preliminary draft SEA report with potential lenders; Washington, D.C.
September 2006: Presentation by the Bujagali Implementation Unit at the Nile Basin Discourse (NBD) Forum; Kampala.

2
September 2006: Public notice (newspaper) and distribution of the SEA Consultation Summary Report; Kampala, Jinja, and hydropower and Interconnection Project site areas.
October 2006: Public meetings held with affected communities on the initial findings of the SEA; Budondo Sub-County and Wakisi Sub-County.
October 2006: Meeting with employees of whitewater rafting and tourism industries; Jinja.
October 2006: Meeting with Ugandan Non-Governmental Organization, the AIDS Support Organization (TASO); Kampala.
January 2007: Economic Study workshop with key stakeholders of Uganda’s power sector to present draft final report; Kampala.
March 2007: Public meetings held with affected communities; Hydropower Project site area.

ANNEX 5. ISSUES IDENTIFIED DURING CONSULTATIONS FOR THE PRIVATE POWER GENERATION (BUJAGALI) PROJECT

ANNEX 5 ISSUES IDENTIFIED DURING CONSULTATIONS FOR THE
BUJAGALI HYDROPOWER PROJECT Past resettlement activities and commitments of the previous project sponsor. Assessment of Past Resettlement Activities and Action Plan (“APRAP”) report
outlines the concerns/issues and proposed actions to be undertaken. The APRAP is Appendix I to the December 2006 Hydropower Project Social and Environmental Assessment (“SEA”) report.
Bujagali Energy Limited (“BEL”) is committed to completing the required provisions of the original resettlement and community development program. These commitments were included in the new Social and Environmental Action Plan (“SEAP”) of December 2006 for the Bujagali project.
Community development opportunities for local residents and governments. The Community Development Action Plan (“CDAP”) is Appendix J to the December
2006 Hydropower Project SEA.
BEL is committed to CDAP activities over a five-year period following the start of construction.
These commitments cover health care facilities; employment opportunities; water supply and sanitation; fisheries; education; small-scale tourism; training and financial services.
Completion of activities to mitigate spiritual and cultural impacts. The previous project sponsor prepared a Cultural Property Management Plan that
documented the surveys and studies of cultural issues and actions to be taken. Commitments that remain from the previous project were identified as part of the APRAP process.
BEL will complete all of these commitments, including a non-denominational service in remembrance of those buried in unmarked graves that will be inundated.
BEL is having on-going consultations with local traditional authorities and has committed to measures to ensure that these issues are properly addressed prior to and during construction.
Construction workforce impacts - social and health consequences of migrant workers coming into the communities. The Engineering-Procurement-Construction (“EPC”) contractor will encourage
workers to seek housing in near-by Jinja, which can accommodate families and thus avoid a major risk factor for HIV/AIDS among the local communities.
The Ugandan AIDS/HIV Non-Governmental Organization TASO will assist the project in developing an education and health campaign to inform the local communities and workers about communicable diseases.

2
Local community access to electricity as a community development initiative. BEL is committed to conduct a feasibility study on the commercial viability of
providing the communities with electricity in order to facilitate the process vis-à-vis UMEME, the current distribution private concessionaire.
Employment opportunities/training and priority in employment opportunities. BEL and the EPC contractor will give priority to hiring qualified local people for
dam, road, and other construction. The EPC contractor will also implement an apprenticeship program to build a local skills base.
BEL is identifying employment opportunities in addition to the income restoration programs of the CDAP. BEL is developing a tree planting program for both borders of the reservoir and the river banks between the hydropower project and the Kalagala Falls. This will provide additional local employment.
Consultation with communities and Non-Governmental Organizations in finalizing and implementing the CDAP. The CDAP focuses on “supporting communities’ needs based on culturally
appropriate means of consultations.”
BEL is committed to undertake ongoing consultation activities with the local community to help prioritize community needs and to finalize the CDAP. A finalized plan will be a disbursement condition of the World Bank Group investment.
Potential for job loss by the tourism industry employees and by self-employed and informal workers in the tourism industry. Tourism operators and workers will adjust to changes from the hydropower project by
moving their businesses downriver. Other tourism operators, such as small arts and crafts shops, restaurants, four wheeler rentals, and locally owned enterprises are expected to move their businesses nearer to Kalagala Falls.
Consultation with the tourism company owners has not indicated that they expect to experience significant decreases in tourist numbers - in fact, many are anticipating growth.
Actions are proposed as part of the CDAP, and developed in consultations with the communities, to increase opportunities for local people in the hydropower project area.
Safety issues from construction traffic along the west bank road, as the road is heavily used by pedestrians including school children. The EPC contractor will implement a Construction Traffic Management Plan that
addresses all construction-related traffic on both the east and west banks.
BEL and the EPC contractor will consult with local community leaders in the development of this plan.
Local community benefits from the project. The CDAP is based on ongoing consultation with the communities regarding their

3
future needs.
The proposed project employment benefits (direct and indirect) and induced economic benefits from the project are expected to be significant for these communities.
Concerns from the east bank communities that they will not benefit as much as the west bank communities (construction activities will be focused on the west bank). BEL is committed to providing programs and opportunities to both east and west
bank communities.
As part of the CDAP, resource centers will be developed on both banks of the river.
Local institution interest in participating in the project, through assisting in the delivery of the CDAP and environmental monitoring of mitigation/restoration activities. BEL will work with local institutions as part of the process to finalize the CDAP and
develop other project implementation plans.
Loss of access to the river by fishermen once the construction period begins. Although fencing along the west bank has been installed, access to the river has not
been cut off and use of the river in the vicinity of the project for fishing access has continued.
As detailed in the CDAP, once construction is initiated more formal facilities will be developed so as to allow access the river for fishing.
Impact of Bujagali on the low water levels in Lake Victoria and on the releases from Lake Victoria. Water levels in Lake Victoria will continue to be determined by rainfall, evaporation
and rate of discharge at the Nalubaale/Kiira dam complex.
The Bujagali project will reuse water already released through the Nalubaale/Kiira dam complex upstream.
Through this water use efficiency, Bujagali will assist the Government in its commitment to using the water of Lake Victoria in a sustainable manner.
Safety issues associated with the aging Nalubaale facilities. The Government, with the assistance of IDA, has conducted remedial works to
correct deficiencies at Nalubaale. These remedial works were concluded under the oversight of an international expert panel.
Monitoring of the affected structures is conducted annually by independent specialists, and corrective actions are implemented as needed.
BEL has formed the Dam Safety Panel (DSP) for Bujagali on March 27, 2007; safety risks from Nalubaale are part of this panel’s terms of reference.

ANNEX 6. REVIEW OF GEOTHERMAL PROSPECTS,
EXECUTIVE SUMMARY OF APPENDIX D OF THE ECONOMIC STUDY

International Finance Corporation Bujagali II: Economic and Financial Evaluation Study Final Report 214 February 2007 26.02.07-20224
D Appendix D - Geothermal
D.1 Introduction
The western branch of the East African rift runs through Uganda (Figure D2-1 and D2-2). The rift is the site of crustal thinning and extension that provides a high heat flow and creates permeable structures. As a result geothermal systems have formed, which is reflected in the abundance of hot springs in Uganda (Dixon and Morton, 1970). The widespread occurrence of thermal features in a favourable tectonic environment is possibly why an initial regional estimate for the potential of 450 MWe of geothermal electrical generation in Uganda was made (McNitt, 1982). Subsequent exploration has failed to confirm this estimate with only three potentially viable prospects identified. The degree of exploration of these prospects is sufficient to at least have confidence that their actual total generational capacity is much lower than 450 MWe, although the available data can only provide estimate of the prospect’s actual generational capacity.
Geothermal exploration and development experience elsewhere in Africa would suggest that the western branch of the East African rift is not as prospective as has been anticipated and that clear surficial indicators of rift systems viability for power generation that are present in the eastern branch are lacking in the geothermal systems of the western branch.
This report discusses the validity of the selection of the three prospects upon which exploration work has been focussed. It reviews the results of this exploration work in light of geothermal exploration and development elsewhere in Africa to provide a general estimate of geothermal electrical generation capacity for Uganda.
The potential of the three prospects is assessed and power cycle technologies for development are reviewed and costed and a development programme for one of the prospects is formulated.
D.2 Historical
The principal geothermal prospect areas in Uganda are located at Katwe, Buranga and Kibiro (Figure D2-2). These are all situated in the Albertine graben that runs along the border of Uganda with the Democratic Republic of Congo. The graben is part of the western branch of the East African Rift System commonly known as the Western Rift Valley.
There are also a number of areas of with lesser geothermal potential in Uganda. These are located in the vicinity of the rift valley in the SW and NW regions of Uganda and at a single isolated prospect area at Katabok in eastern Uganda, near the border with Kenya.

International Finance Corporation Bujagali II: Economic and Financial Evaluation Study Final Report 215 February 2007 26.02.07-20224
The common features of the three main prospects is that they have the hottest surface features, have high flow rates and a wide distribution (Dixon and Morton, 1970). No other thermal areas in Uganda come close to these three prospects in terms of these criteria. The historical interest in focussing exploration efforts on these areas is therefore valid and in the absence of any further information, geothermal systems that can potentially be developed for power generation are likely to be restricted to these three areas.
The Buranga geothermal field has the most impressive set of thermal features of any field in Uganda with a surficial heat flow of 30MW (Hochstein, 2005), to the extent that a geothermal exploration drilling programme was initiated between 1953 and 1954 (Dixon and Morton, 1970: Gislason, 1994). This drilling did not lead to any development or provide sufficient information to write the system off as being unsuited to development, particularly since one of the exploration wells had a steam blow out (Dixon and Morton, 1970). Given that the first large scale successful exploitation of a hot water geothermal field didn’t take place until 1958 (at Wairakei in New Zealand) it is possible that this early programme in Uganda was premature in terms of technical knowledge and capabilities.
Further geothermal exploration in Uganda was unsuccessfully proposed in 1972 (McNitt, 1972), and the Katwe area identified as a prospect in a review that concluded that as much as 450 Mwe of geothermal power generation was available in Uganda (McNitt, 1982). The 1972 proposal and a later proposal (Jonatansson and Thorsteinson, 1989) led to the visit of Stefansson (1989) to Uganda and the recommendation for exploration work at three prospects: Katwe, Buranga and Kibiro (Armannsson, 1994).

International Finance Corporation Bujagali II: Economic and Financial Evaluation Study Final Report 216 February 2007 26.02.07-20224
Figure D2-D-1 Location of Uganda in relation to the East Africa Rift system (EARS)
Figure D2-D-2 Location of the main geothermal prospects in Uganda (from: Bahati, 2005).
In spite of the long history of interest in the potential of the geothermal resources Uganda for commercial power generation, the exploration of these resources remains even today at a pre-feasibility level of investigation. However, there has been a considerable increase in interest and exploration activity over the past few years. Detailed surface geoscientific surveys were conducted in 2004 at the two most promising prospects at Katwe-Kikorongo (Katwe) and Kibiro, and similar surveys were undertaken at the Buranga prospect in 2005.
Given this recent exploration work, the next step to take in the further investigation of these prospects would be exploration drilling to test actual geothermal conditions at depth – providing of course that the results from the detailed surface exploration studies give sufficient confidence that commercially exploitable geothermal reservoir conditions will likely be encountered in order to justify the high costs of exploration drilling.

ANNEX 7. PHOTOGRAPHS OF RESETTLEMENT COMMUNITY


ANNEX 8. PUBLIC NOTICE BY THE ERA CONCERNING THE BUJAGALI PROJECT
