annex 3: sources, methods and technical … · 6 1country statistical agency source reference...
TRANSCRIPT

0
qwertyuiopasdfghjklzxcvbnmqwertyuiopasdfghjklzxcvbnmqwertyuiopasdfghjklzxcvbnmqwertyuiopasdfghjklzxcvbnmqwertyuiopasdfghjklzxcvbnmqwertyuiopasdfghjklzxcvbnmqwertyuiopasdfghjklzxcvbnmqwertyuiopasdfghjklzxcvbnmqwertyuiopasdfghjklzxcvbnmqwertyuiopasdfghjklzxcvbnmqwertyuiopasdfghjklzxcvbnmqwertyuiopasdfghjklzxcvbnmqwertyuiopasdfghjklzxcvbnmqwertyuiopasdfghjklzxcvbnmqwertyuiopasdfghjklzxcvbnmqwertyuiopasdfghjklzxcvbnmqwertyuiopasdfghjklzxcvbnmqwertyuiopasdfghjklzxcvbnmrtyuiopasdfghjklzxcvbnmqwertyuiopasdfghjklzxcvbnmqwertyuiopasdfghjklzxcvbnmqwertyuiopasdf
ANNEX 3: SOURCES, METHODS AND
TECHNICAL NOTES
Education at a Glance 2014

1
Description: This document is intended to provide guidance as to the methodology used during the data collection for each Indicator, the references to the sources and the specific notes for each country.
How to read this document: Annex 3 is organised by chapters. Click on each link below in order to be redirected to the Indicator and the information related to it.
Back_to_Table1
CHAPTER A: THE OUTPUT OF EDUCATIONAL INSTITUTIONS AND THE IMPACT OF
LEARNING
Indicator A1: To what level have adults studied?
Indicator A2: How many students are expected to complete secondary education?
Indicator A3: How many students are expected to complete tertiary education?
Indicator A4: To what extent does parents’ education influence access to tertiary
education?
Indicator A5: How does educational attainment affect participation in the labour
market?
Indicator A6: What are the earnings advantages from education?
Indicator A7: What are the incentives to invest in education?
Indicator A8: What are the social outcomes of education?
Indicator A9: How are student performance and equity in education related?

2
INDICATOR A1: To what level have adults studied?
A1 Tables A1.1-A1.5 Tables A1.6a-A1.9b
Sources Methodology
Standard Errors Sources
Argentina
Australia AUS
Austria AUT
Belgium
Brazil
Canada CAN
Chile CHL
China
Colombia
Czech Republic
Denmark
Estonia EST
Finland FIN
France FRA
Germany DEU
Greece
Hungary HUN
Iceland ISL
India
Indonesia
Ireland IRL
Israel ISR
Italy
Japan JPN
Korea
Latvia
Luxembourg LUX
Mexico MEX
Netherlands NLD
New Zealand NZL
Norway NOR
Poland POL
Portugal PRT
Russian Federation
Saudi Arabia
Slovak Republic
Slovenia
South Africa
Spain
Sweden SWE
Switzerland CHE
Turkey TUR
United Kingdom UKM
United States

3
Tables A1.1 to A1.5
Methodology The attainment profiles for most countries are based on the percentage of the population aged 25 to 64 that has completed a specified level of education. The International Standard Classification of Education (ISCED-97) is used to define the levels of education.
The table below shows the attainment levels and mappings for each country (with the sole exceptions of countries for which information is taken from the UIS database – see further explanation in the Sources section below). The cells indicate, for each country, the national programme categories that are included in the international levels of education indicated by the column headings. Back_to_Table1
Table 1: Standardised ISCED-97 national codes on attainment in LFS (2012)
Pre-primary and primary education
Lower secondary education
Upper secondary education
Post-secondary non-tertiary education
Tertiary education
ISCED 3C (short programme)
ISCED 3C (long programme)/3B
ISCED 3A
Type B Type A Advanced research programme
(1) (2) (3) (4) (5) (6) (7) (8) (9)
OECD
Australia 0/1 2 a 3CL 3A 4C 5B 5A 6
Austria x(2) 0/1/2 3CS 3B 3A 4A, 4B 5B 5A/6 x(8)
Belgium 0/1 2 a 3C 3A 4 5B 5A 6
Canada 0/1 2 a x(5) 3A 4 5B 5A/6 x(8)
Chile 0,1 2 a x(5) 3 a 5B 5A 6
Czech Republic
0/1 2 a 3CL 3A/3B/4
x(5) x(8) 5A/5B/6
x(8)
Denmark 0/1 2 3CS 3CL 3A/B 4A/B, 4C 5B 5A 6
Estonia 0,1 2 a 3B,3C 3A 4B 5B 5A 6
Finland 0/1 2 a a 3A 4C 5B 5A 6
France 0,1 2 a 3B,3CL,3CM
3A 4 5B 5AL,5AM,5AS
6
Germany 1 2A a 3B 3A 4 5B 5A 6
Greece 0/1 2 x(4) 3B, 3C 3A 4C 5B 5A 6
Hungary 1 2 a 3C 3A 4 5B 5A 6
Iceland 0/1 2 3CS 3CL 3A/B 4A/B,4C 5B 5A 6
Ireland 0/1 2 3CS x(5) 3, 3A/B 4C 5B 5A 6
Israel 0,1 2 a 3C 3A a 5B 5A 6
Italy 0/1 2 3CS 3CL 3A/3B 4 5B 5A 6
Japan x(5) x(5) x(5) x(5) 1/2/3 a 5B 5A/6 x(8)
Korea 0/1 2 a x(5) 3 a 4/5B 5A/6 x(8)
Luxembourg 0/1 2 3CS 3CL 3,3A/B 4 5B 5A 6
Mexico 0,1 2 a 3CL 3A a 5B 5A/6 x(8)
Netherlands 0/1 2 x(4) 3C 3A 4 5B 5A 6

4
New Zealand x(2) 1&2 3CS 3CL 3A 4 5B 5A/6 x(8)
Norway 0,1 2A a 3C 3A 4A,4C 5B 5A 6A
Poland x(2) 1/2 a 3C 3A 4C x(8) 5A/5B/6
x(8)
Portugal 0,1 2 x(5) x(5) 3 4 x(8) 5 6
Slovak Republic
0,1 2 x(4) 3C 3A x(5) 5B 5A 6
Slovenia 0/1 2 a 3CL 3A/3B a 5B 5A 6
Spain 0,1 2A,2C a 3C,3B 3A 4C 5B 5A 6
Sweden 1 2 a x(5) 3 4 5B 5A 5A/6
Switzerland 0/1 2 3CS 3CL,3B 3A 4 5B 5A 6
Turkey 0,1 2 a 3B 3A a a 5A/6 x(8)
United Kingdom
0 2 3CS 3CL, 3B 3A 4 5B 5A 6
United States 0/1 2 x(5) x(5) 3 x(5) 5B,5AI 5A 6
Partners
Brazil 0,1 2 x(5) x(5) 3 a x(8) 5A/5B/6
x(8)
Russian Federation
1 2 x(4) 3C 3A x(4) 5B 5A 6
Note: 5AS, 5AI, 5AM and 5AL refer to tertiary-type A short, intermediate, medium and large programmes, respectively. 3CM refer to upper secondary medium programmes. Source: National reports (data 2012, data collection 2013, Education at a Glance 2014).
In Education at a Glance 2014 historical/trend data on educational attainment are only available for the three major levels of education:
- Less than upper secondary education – ISCED levels 0/1/2/3C short.
- Upper secondary and post-secondary education – ISCED levels 3/4.
- Tertiary non-university and university – ISCED levels 5A/5B/6.
Back_to_Table1

5
Sources Data on population, educational attainment and labour market are taken from labour force surveys (LFS). The source is the LSO (OECD Labour market, economic and social outcomes of learning) Network Labour Force Survey (LFS) for most countries; the European Union LFS (EU-LFS) provided by Eurostat for Denmark, Finland, Iceland, Ireland, Latvia, Luxembourg and Slovenia; and data on educational attainment for Argentina, China, Colombia, Indonesia, Saudi Arabia and South Africa are taken from the UNESCO Institute of Statistics (UIS) database on educational attainment of the population aged 25 years and older, http://stats.uis.unesco.org (accessed on 17 March 2014). Attainment rates for ISCED levels 0/1 in these G20 non-OECD countries are calculated by adding UIS data in the categories “No schooling”, “Incomplete Primary” and “Primary”. In the case of South Africa, data also comprise people included in the “Unknown” category.
For tables with data from 2000, i.e. trend data, EU-LFS has also been used for France and Italy for the year 2000. Specific reliability thresholds have been applied; see Table below on National data collection sources and reliability thresholds (2012). Reliability thresholds refer to sample limits to the reliability of the indicator that implies that data are either not published or flagged as having a reduced reliability (please refer to the Reader’s Guide for details). Back_to_Table1
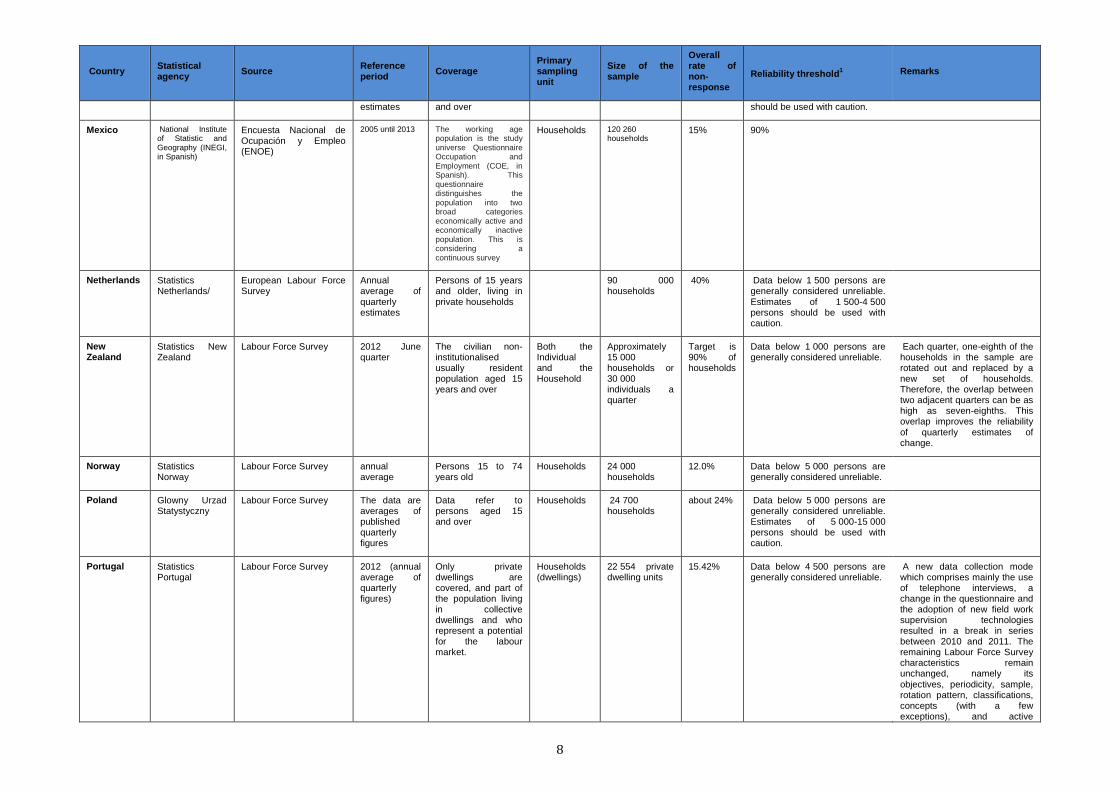
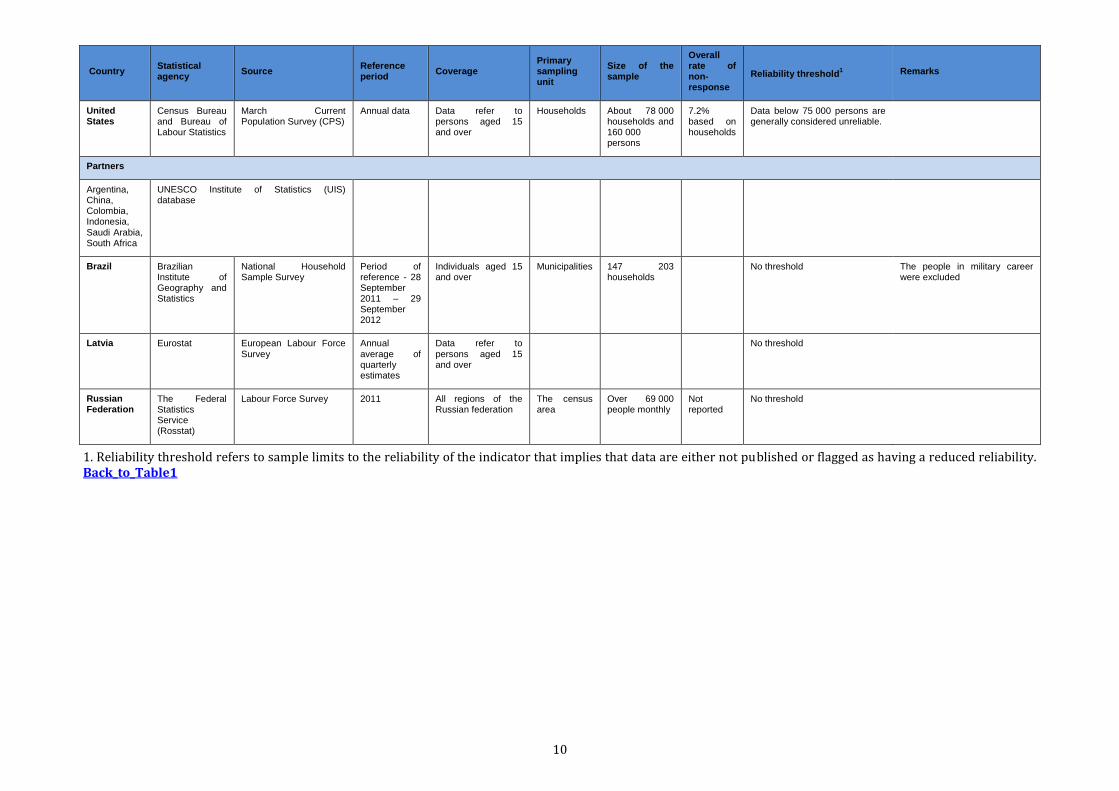
Table 2: National data collection sources and reliability thresholds (2012)
Country Statistical agency
Source Reference period
Coverage Primary sampling unit
Size of the sample
Overall rate of non-response
Reliability threshold1 Remarks
OECD countries
Australia Australian Bureau of Statistics
Survey of Education and Work (supplement to the monthly Labour Force Survey)
May 2012
Urban and non-urban areas, all persons aged 15-64 years
Respondents within households
39 500 persons 5.0%
Estimates of less than 2 000
persons generally have a Relative Standard Error of >=50%, and are considered too unreliable for general use. Estimates of 2 000-10 000 persons generally have a Relative Standard Error of between 25-50%, and should be interpreted with caution.
Information is collected using Any Responsible Adult (ARA) methodology - a responsible adult provides information about all usual residents aged 15-64 years. NB: Persons who have both ISCED 3a and 3c qualifications have been included under ISCED 3a.
Austria Bundesanstalt Statistik Österreich
Quarterly Mikrocensus
The data refer to annual averages of the quarterly Mikrocensus sample survey
Data refer to persons aged 15 and over
80 000 households(net)
5.4%
Data below 4 000 persons are generally considered unreliable. Estimates of 4 000-6 000 persons should be used with caution.
Belgium
FOD Economie, Algemene Directie Statistiek en Economische Informatie; SPF Économie – Direction générale Statistique et Information économique
Enquête naar de Arbeidskrachten/Enquête sur les Forces de Travail
2012 Persons above 14 years of age living in private households
Statistical section
78 796 persons 32.0%
Data below 5 000 persons are generally considered unreliable. Estimates of 5 000-10 000 persons should be used with caution.

6
Country Statistical agency
Source Reference period
Coverage Primary sampling unit
Size of the sample
Overall rate of non-response
Reliability threshold1 Remarks
Canada Statistics Canada
Monthly Labour Force Survey
The annual data are averages of monthly estimates
Data refer to persons aged 15 and over
Households Approximately 54 000 households
10.0% of eligible households
Data below 1 500 persons are generally considered unreliable.
Chile INE National socioeconomic characterization survey (CASEN)
2011 Data refer to persons aged 15 and over
Households
200 306 respondents from 59 084 households.
12.0%
No threshold
Czech Republic
Czech Statistical Office (CSU)
Labour Force Sample Survey
Annual average of quarterly estimates
Data refer to persons aged 15 and over
Persons
Approximately 25 000 households, i.e. approx. 58 000 persons, i.e. approx. 50 000 persons aged 15 or more
27%
Data below 3 000 persons are generally considered unreliable.
Denmark Eurostat European Labour Force Survey
Annual average of quarterly estimates
Data refer to persons aged 15 and over
Data below 2 500 persons are generally considered unreliable. Estimates of 5 000-3 500 persons should be used with caution
Estonia Statistics Estonia
Labour Force Survey 2012 Population aged 15 to 74
Individual 29 000 31.8%
Data below 1 100 persons are generally considered unreliable. Estimates of 1 100-2 500 persons should be used with caution.
All persons aged 15-74 years belonging into household of selected individual are interviewed
Finland Eurostat European Labour Force Survey
Annual average of quarterly estimates
Data refer to persons aged 15 and over
Data below 2 000 persons are generally considered unreliable. Estimates of 2 000-4 000 persons should be used with caution.
France INSEE Labour Force Survey
Annual average of quarterly estimates
Data refer to persons aged 15 to 64
Households
45 000 households and about 70 000 inhabitants per quarter
from 18% to 22% depending on the quarter in 2006
No threshold

7
Country Statistical agency
Source Reference period
Coverage Primary sampling unit
Size of the sample
Overall rate of non-response
Reliability threshold1 Remarks
Germany Federal Statistical Office
Labour Force Survey (Microcensus)
2012 Data refer to persons aged 15 and over
Households 1% of households
0.1% for questions on educational attainment
Data below 5 000 persons are generally considered unreliable.
Greece National Statistical Service of Greece (NSSG)
Labour force survey 2012 annual averages
Data refer to persons aged 15 and over
All members of private households
2005: 31 619 households
2005: 9.4% of the total surveyed households
Estimates of characteristics less than 8 000 have a coefficient of variation > 15% so they should not be considered as reliable.
Hungary Hungarian Central Statistical Office
Labour Force Survey Data are averages of quarterly figures of 2012
Persons aged 15-74 living in private households
Households 220 885 people (aged 15-74) in 2011
20,6% (for the whole survey in 2011)
Data below 4 800 persons are generally considered unreliable.
Iceland Eurostat European Labour Force Survey
Annual average of quarterly estimates
Data refer to persons aged 15 and over
Data below 1 000 persons are generally considered unreliable.
Ireland Eurostat European Labour Force Survey
Annual average of quarterly estimates
Data refer to persons aged 15 and over
Data below 2 500 persons are generally considered unreliable.
Israel Israel's Central Bureau of Statistics
Labour Force Survey Annual average for 2012
Permanent residents aged 15 and over
Households Approx. 21 500 households
18.1% Data below 500 persons are generally considered unreliable. Estimates of 500-1 000 persons should be used with caution.
Italy ISTAT Labour Force Survey Annual average of quarterly data collections
Data refer to persons aged 15 and over
Households (all the individuals in each sampled household are interviewed)
283 700 households
8.15% Data below 1 500 persons are generally considered unreliable. Estimates of 1 500-2 500 persons should be used with caution.
Sample design is a two-stage sampling with stratification of the primary units
Japan Statistics Bureau, Ministry of Internal Affairs and Communications
Labour Force Survey detailed tabulation
Annual average
Data refer to persons aged 15 and over
Households No threshold The special survey of the Labour Force Survey was integrated into the Labour Force Survey in January 2002
Korea National Statistical Office
Monthly economically active population survey (MEACS)
Annual average of monthly estimates
Data refer to persons aged 15 and over
33 000 households
No threshold Annual Report on the Economically Active Population Survey.
Luxembourg Eurostat European Labour Force Survey
Annual average of quarterly
Data refer to persons aged 15
Data below 500 persons are generally considered unreliable. Estimates of 500-1 500 persons
8
Country Statistical agency
Source Reference period
Coverage Primary sampling unit
Size of the sample
Overall rate of non-response
Reliability threshold1 Remarks
estimates and over should be used with caution.
Mexico National Institute of Statistic and Geography (INEGI, in Spanish)
Encuesta Nacional de Ocupación y Empleo (ENOE)
2005 until 2013 The working age population is the study universe Questionnaire Occupation and Employment (COE, in Spanish). This questionnaire distinguishes the population into two broad categories economically active and economically inactive population. This is considering a continuous survey
Households 120 260 households
15% 90%
Netherlands Statistics Netherlands/
European Labour Force Survey
Annual average of quarterly estimates
Persons of 15 years and older, living in private households
90 000 households
40% Data below 1 500 persons are generally considered unreliable. Estimates of 1 500-4 500 persons should be used with caution.
New Zealand
Statistics New Zealand
Labour Force Survey 2012 June quarter
The civilian non-institutionalised usually resident population aged 15 years and over
Both the Individual and the Household
Approximately 15 000 households or 30 000 individuals a quarter
Target is 90% of households
Data below 1 000 persons are generally considered unreliable.
Each quarter, one-eighth of the households in the sample are rotated out and replaced by a new set of households. Therefore, the overlap between two adjacent quarters can be as high as seven-eighths. This overlap improves the reliability of quarterly estimates of change.
Norway Statistics Norway
Labour Force Survey annual average
Persons 15 to 74 years old
Households 24 000 households
12.0% Data below 5 000 persons are generally considered unreliable.
Poland Glowny Urzad Statystyczny
Labour Force Survey The data are averages of published quarterly figures
Data refer to persons aged 15 and over
Households 24 700 households
about 24% Data below 5 000 persons are generally considered unreliable. Estimates of 5 000-15 000 persons should be used with caution.
Portugal Statistics Portugal
Labour Force Survey 2012 (annual average of quarterly figures)
Only private dwellings are covered, and part of the population living in collective dwellings and who represent a potential for the labour market.
Households (dwellings)
22 554 private dwelling units
15.42% Data below 4 500 persons are generally considered unreliable.
A new data collection mode which comprises mainly the use of telephone interviews, a change in the questionnaire and the adoption of new field work supervision technologies resulted in a break in series between 2010 and 2011. The remaining Labour Force Survey characteristics remain unchanged, namely its
objectives, periodicity, sample, rotation pattern, classifications, concepts (with a few exceptions), and active

9
Country Statistical agency
Source Reference period
Coverage Primary sampling unit
Size of the sample
Overall rate of non-response
Reliability threshold1 Remarks
population reference age.
Slovak Republic
Statistical Office of the Slovak Republic
Labour Force Survey Annual average of quarterly estimates
Data refer to persons aged 15 and over
Dwelling Approx. 10 250 dwellings per quarter/'approx. 26 1000 persons/approx. 22 800 persons 15 and over per quarter
7.8% Data below 2 000 persons are generally considered unreliable.
Classifications according to LFS questionnaire until 1999 and from 2000 used
Slovenia Statistics Slovenia
Labour Force Survey 2012 Data refer to persons aged 15-64
Household 28000 households
20% Data below 500 persons are generally considered unreliable. Estimates of 500-4 000 persons should be used with caution.
Spain Instituto Nacional de Estadística
Labour Force Survey Yearly average of quarterly data
Data refer to persons aged 16 and over
Enumeration area
Approximately 65 000 households
13.3% Data below 5 000 persons are generally considered unreliable.
Part of the non-response is treated. Final non-response rate: 8.1% (average year 2012).
Sweden Statistiska Centralbyran
Labour Force Survey 2nd January 2012 - 30 December 2012. Annual average 2012
Data refer to persons aged 15 - 74
Individuals Net sample 349 350 persons
27.2% Data below 1 000 persons are generally considered unreliable.
Based on 248 238 interviews
Switzerland Swiss Federal Statistical Office (SFSO)
Swiss Labour Force Survey (ESPA)
2012: First quarter of 2012; 2011 and 2010: annual averages
Data refer to persons aged 15 and over
Household 2011, 2012: 35 000 per quarter / 2010: 30 000 per quarter
30.0% If N<5, extrapolation cannot be made because of data protection. The results have not been published because of data protection”.
If 5 ≤ N < 90, extrapolation is possible but the results should be interpreted with caution
The reference person within the household is selected randomly. All data refer only to the reference person (no proxy data)
Turkey State Institute of Statistics (SIS)
Labour Force Survey Semi-annual survey. Annual average of April and October
Data refer to persons aged 15 and over
Household 15 000 households in each survey
10.0% (1 500 households in each survey)
Data below 1 500 persons are generally considered unreliable.
Semi-annual survey for the period of October 1988-1999 and survey was applied in October and April within this term. Annual results refer to average of April and October. From January 2000, the HLFS is applied monthly. The results of the survey are determined as quarterly and yearly estimates.
United Kingdom
ONS (Department for Business, Innovation and Skills)
Labour Force Survey 2012, fourth quarter
25-64 year olds in UK, the LFS covers 98.5% of whole population - excludes 1.5% living in Communal Establishments such as Nursing/Residential Care Homes
Households 100 000 people in 53 000 households
20% refusals plus 8% non-contacts.
Data below 10 000 persons are generally considered unreliable.
10
Country Statistical agency
Source Reference period
Coverage Primary sampling unit
Size of the sample
Overall rate of non-response
Reliability threshold1 Remarks
United States
Census Bureau and Bureau of Labour Statistics
March Current Population Survey (CPS)
Annual data Data refer to persons aged 15 and over
Households About 78 000 households and 160 000 persons
7.2% based on households
Data below 75 000 persons are generally considered unreliable.
Partners
Argentina, China, Colombia, Indonesia,
Saudi Arabia, South Africa
UNESCO Institute of Statistics (UIS) database
Brazil Brazilian Institute of Geography and Statistics
National Household Sample Survey
Period of reference - 28 September 2011 – 29 September 2012
Individuals aged 15 and over
Municipalities 147 203 households
No threshold The people in military career were excluded
Latvia Eurostat European Labour Force Survey
Annual average of quarterly estimates
Data refer to persons aged 15 and over
No threshold
Russian Federation
The Federal Statistics Service (Rosstat)
Labour Force Survey 2011 All regions of the Russian federation
The census area
Over 69 000 people monthly
Not reported
No threshold
1. Reliability threshold refers to sample limits to the reliability of the indicator that implies that data are either not published or flagged as having a reduced reliability. Back_to_Table1

11
Specific information on vocational education and training (VET) for Tables A1.5a and b
LSO (Labour market, economic and social outcomes of learning) Network Labour Force Survey (LFS) for most countries. EULFS_VET is the European Union LFS which contains information about the fields of education. This survey and all data related to it are provided by Eurostat. It has been used for Denmark, Finland, Iceland, Ireland, Latvia, Luxembourg and Slovenia in Tables A1.5a and b.
Vocational or technical education (VET) is defined as “Education which is mainly designed to lead participants to acquire the practical skills, know-how and understanding necessary for employment in a particular occupation or trade or class of occupations and trades. Successful completion of such programmes lead to a labour market relevant vocational qualification recognized by the competent authorities in the country in which it is obtained (e.g. Ministry of Education, employer’s associations, etc.)” (ISCED-97 paragraph 59).
The orientation is a dimension defined by ISCED as “the degree to which the programme is specifically oriented towards a specific class of occupation and trades”. ISCED-97 distinguishes the "orientations" vocational, prevocational and general of educational programmes. In this work, following the changes proposed for ISCED 2011, the countries used only two categories: “vocational” or “general”. VET has been identified through the orientation dimension of ISCED and apply to ISCED levels 3 and 4 and ISCED 5.
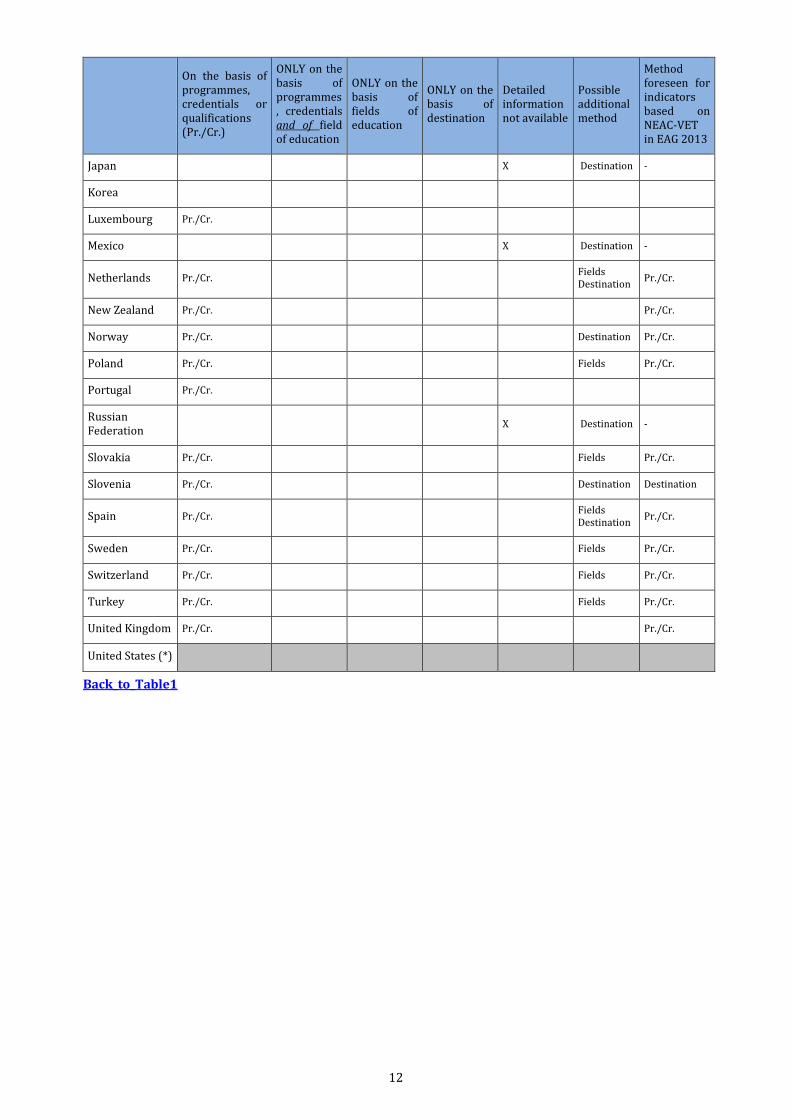
Countries have defined general or vocational orientation based on the features of the education programme and the resulting credentials and qualifications (first column of the table). Some countries may also use variables based on students’ choice of education field and students’ destinations after their studies, because such variables also reflect the distribution of students in general and vocational programmes. The table below summarizes the method used in determining the orientation of educational attainment at ISCED level 3 from Labour Force Survey. Back_to_Table1
Table 3: National methods of data collection at ISCED 3 level by programme orientation (2012)
On the basis of programmes, credentials or qualifications (Pr./Cr.)
ONLY on the basis of programmes, credentials and of field of education
ONLY on the basis of fields of education
ONLY on the basis of destination
Detailed information not available
Possible additional method
Method foreseen for indicators based on NEAC-VET in EAG 2013
Australia Pr./Cr. Destination Pr./Cr.
Austria Pr./Cr. Fields Pr./Cr.
Belgium Pr./Cr. Pr./Cr.
Brazil X -
Canada* X -
Chile X -
Czech Republic Fields Fields Fields
Denmark Pr./Cr. Pr./Cr.
Estonia Pr./Cr. Fields Fields
Finland Pr./Cr. Fields Fields
France Pr./Cr. Destination Destination
Germany Pr./Cr. Destination Pr./Cr.
Greece Pr./Cr. Destination Destination
Hungary Pr./Cr. Pr./Cr.
Iceland Pr./Cr. Destination Destination
Ireland Pr./Cr.
Israel Pr./Cr. Pr./Cr.
Italy Pr./Cr. Pr./Cr.
12
On the basis of programmes, credentials or qualifications (Pr./Cr.)
ONLY on the basis of programmes, credentials and of field of education
ONLY on the basis of fields of education
ONLY on the basis of destination
Detailed information not available
Possible additional method
Method foreseen for indicators based on NEAC-VET in EAG 2013
Japan X Destination -
Korea
Luxembourg Pr./Cr.
Mexico X Destination -
Netherlands Pr./Cr. Fields Destination
Pr./Cr.
New Zealand Pr./Cr. Pr./Cr.
Norway Pr./Cr. Destination Pr./Cr.
Poland Pr./Cr. Fields Pr./Cr.
Portugal Pr./Cr.
Russian Federation
X Destination -
Slovakia Pr./Cr. Fields Pr./Cr.
Slovenia Pr./Cr. Destination Destination
Spain Pr./Cr. Fields Destination
Pr./Cr.
Sweden Pr./Cr. Fields Pr./Cr.
Switzerland Pr./Cr. Fields Pr./Cr.
Turkey Pr./Cr. Fields Pr./Cr.
United Kingdom Pr./Cr. Pr./Cr.
United States (*)
Back_to_Table1
13
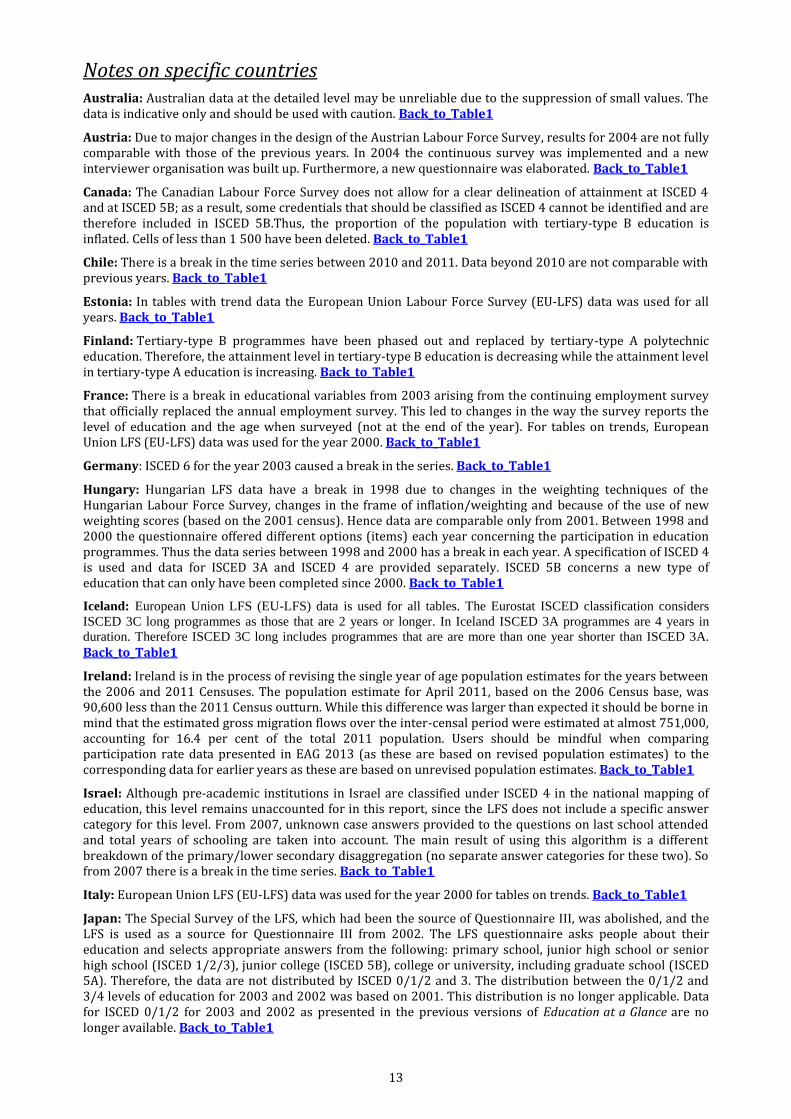
Notes on specific countries Australia: Australian data at the detailed level may be unreliable due to the suppression of small values. The data is indicative only and should be used with caution. Back_to_Table1
Austria: Due to major changes in the design of the Austrian Labour Force Survey, results for 2004 are not fully comparable with those of the previous years. In 2004 the continuous survey was implemented and a new interviewer organisation was built up. Furthermore, a new questionnaire was elaborated. Back_to_Table1
Canada: The Canadian Labour Force Survey does not allow for a clear delineation of attainment at ISCED 4 and at ISCED 5B; as a result, some credentials that should be classified as ISCED 4 cannot be identified and are therefore included in ISCED 5B.Thus, the proportion of the population with tertiary-type B education is inflated. Cells of less than 1 500 have been deleted. Back_to_Table1
Chile: There is a break in the time series between 2010 and 2011. Data beyond 2010 are not comparable with previous years. Back_to_Table1
Estonia: In tables with trend data the European Union Labour Force Survey (EU-LFS) data was used for all years. Back_to_Table1
Finland: Tertiary-type B programmes have been phased out and replaced by tertiary-type A polytechnic education. Therefore, the attainment level in tertiary-type B education is decreasing while the attainment level in tertiary-type A education is increasing. Back_to_Table1
France: There is a break in educational variables from 2003 arising from the continuing employment survey that officially replaced the annual employment survey. This led to changes in the way the survey reports the level of education and the age when surveyed (not at the end of the year). For tables on trends, European Union LFS (EU-LFS) data was used for the year 2000. Back_to_Table1
Germany: ISCED 6 for the year 2003 caused a break in the series. Back_to_Table1
Hungary: Hungarian LFS data have a break in 1998 due to changes in the weighting techniques of the Hungarian Labour Force Survey, changes in the frame of inflation/weighting and because of the use of new weighting scores (based on the 2001 census). Hence data are comparable only from 2001. Between 1998 and 2000 the questionnaire offered different options (items) each year concerning the participation in education programmes. Thus the data series between 1998 and 2000 has a break in each year. A specification of ISCED 4 is used and data for ISCED 3A and ISCED 4 are provided separately. ISCED 5B concerns a new type of education that can only have been completed since 2000. Back_to_Table1
Iceland: European Union LFS (EU-LFS) data is used for all tables. The Eurostat ISCED classification considers
ISCED 3C long programmes as those that are 2 years or longer. In Iceland ISCED 3A programmes are 4 years in
duration. Therefore ISCED 3C long includes programmes that are are more than one year shorter than ISCED 3A. Back_to_Table1
Ireland: Ireland is in the process of revising the single year of age population estimates for the years between the 2006 and 2011 Censuses. The population estimate for April 2011, based on the 2006 Census base, was 90,600 less than the 2011 Census outturn. While this difference was larger than expected it should be borne in mind that the estimated gross migration flows over the inter-censal period were estimated at almost 751,000, accounting for 16.4 per cent of the total 2011 population. Users should be mindful when comparing participation rate data presented in EAG 2013 (as these are based on revised population estimates) to the corresponding data for earlier years as these are based on unrevised population estimates. Back_to_Table1
Israel: Although pre-academic institutions in Israel are classified under ISCED 4 in the national mapping of education, this level remains unaccounted for in this report, since the LFS does not include a specific answer category for this level. From 2007, unknown case answers provided to the questions on last school attended and total years of schooling are taken into account. The main result of using this algorithm is a different breakdown of the primary/lower secondary disaggregation (no separate answer categories for these two). So from 2007 there is a break in the time series. Back_to_Table1
Italy: European Union LFS (EU-LFS) data was used for the year 2000 for tables on trends. Back_to_Table1
Japan: The Special Survey of the LFS, which had been the source of Questionnaire III, was abolished, and the LFS is used as a source for Questionnaire III from 2002. The LFS questionnaire asks people about their education and selects appropriate answers from the following: primary school, junior high school or senior high school (ISCED 1/2/3), junior college (ISCED 5B), college or university, including graduate school (ISCED 5A). Therefore, the data are not distributed by ISCED 0/1/2 and 3. The distribution between the 0/1/2 and 3/4 levels of education for 2003 and 2002 was based on 2001. This distribution is no longer applicable. Data for ISCED 0/1/2 for 2003 and 2002 as presented in the previous versions of Education at a Glance are no longer available. Back_to_Table1

14
Luxembourg: The results apply to those people living in Luxembourg who have been educated in Luxembourg, as well as to those who have been educated in another country. This means the figures cannot be used to analyse the national educational system. There was a break in 2003 due to transition to a quarterly continuous survey (Source Eurostat). Back_to_Table1
Mexico: Revised data series. There have been reclassifications on two occasions: First, for 1998/99 changes were introduced in the UOE: The specialty studies and the master’s degree were reclassified in ISCED 5A first degree. The technical professional was reclassified at ISCED 5B. Second, for 2002/03, the specialty studies and the master’s degree were reclassified in ISCED 5A second degree. Back_to_Table1
Netherlands: In tables with trend data the European Union Labour Force Survey (EU-LFS) data was used for all years. Back_to_Table1
New Zealand: ISCED 3C short programmes (3CS) are coded at ISCED level 3 for participation but they are less than 3 in terms of attainment – regardless of what level groupings or other ISCED dimensions are used. Back_to_Table1
Norway: A break in time series on educational attainment occurred in 2005, as the classification of educational attainment was re-classified. Attainment numbers for 2000-2004 follow the former classification of educational attainment and are not comparable with more recent years. The main change is an increase in ISCED 2 attainment, at the expense of ISCED 3. The attainment criteria for ISCED 3 were tightened from course completion to successful completion of the whole programme (studiekompetanse/fagbrev). A reasonable amount of movement also occurred between ISCED 3 and ISCED 5, but the net difference is marginal. A minimum of two years full-time study load, equivalent to 120 credit points, is defined as an attainment criterion for ISCED 5 (Detailed information: http://www.ssb.no/english/subjects/04/01/utniv_en/). Back_to_Table1
Poland: From 2006 onwards previous 3CS programmes for Poland have been reallocated to 3CLong, since 3C programmes in Poland last three years, which is similar to the typical cumulative duration of a standard national ISCED 3A general programme. Back_to_Table1
Slovenia: In tables with trend data the European Union Labour Force Survey (EU-LFS) data was used for all years.
Sweden: There were two breaks in the series: when the new standard for classification of education (SUN 2000) was applied in 2001, and in April 2005, when a new EU-harmonised questionnaire was introduced, leading, among other consequences, to a breakdown of ISCED 4 and 5B into two separate variables. The latter explains the decrease in tertiary attainment 2005. Back_to_Table1
Switzerland: Trend data have been revised from 1997 to 2008 to correct an error in the original data source. Changes in ISCED categories 3CS and 3CL were carried over the time series (1997 to 2008). Before 2001, however, ISCED 3CL only partially reflects the reality. It should not be distinguished from other categories of ISCED 3. In general, before 2001, it is not possible to distinguish between the ISCED categories 1 and 2, as well as to the ISCED categories 3 and 4 or that of ISCED 5A and 6. Back_to_Table1
Turkey: The 2007 figures were adjusted according to the new census showing a decrease in total population compared to the projections. For the moment no adjustment/revision are available for the previous years. When the new population projections will be ready, the series will be revised back in time, including 2007 figures. It is not correct to compare 2007 figures with previous years. Back_to_Table1
United Kingdom: An improved methodology introduced in 2009 led to an increase in measured educational attainment. For 25-64 year-olds the effect was an increase of 3.4 percentage points for those with at least upper secondary level education, and 3.4 percentage points for tertiary level attainment. Women aged 60-64 are included from 2009. The back time-series was revised in 2008, taking account of re-weighted (to mid-census population estimates) and revised (now using calendar rather than seasonal quarters) data. The revisions provided an opportunity to correct some long-standing anomalies in older data (reported up to 2005), such as an over-estimation of the proportion holding ISCED 6 (doctorate level), and where ISCED 3B was incorrectly grouped in 3A. Back_to_Table1

15
Standard errors for EAG 2014 (updated in January 2015) Tables A1.1a, A1.2a A1.2b, A1.3a and A1.3b below show the original estimates presented in the EAG 2014 (i.e. 2012 data) alongside the estimated standard errors.
An asterisk immediately following the estimate indicates whether or not the value is statistically significantly different from the OECD average. For most countries, the standard errors were computed under the assumption of a simple random sample. For Austria, Canada, Chile, Estonia, Finland, Germany, Italy, New Zealand, the Slovak Republic, Switzerland and the United States, country representatives either provided standard errors incorporating adjustments for the complex sample designs within their countries or provided unweighted sample sizes with or without an estimate of the design effect to improve the calculations of standard errors.
Standard error estimates incorporating a simple random sample assumption were based on sample size data collected from country-level labour force surveys as well as the Eurepean Union Labour Force Survey (EU-LFS), which contains survey data from many European countries. The sample sizes of the surveys differ widely, ranging from relatively small samples in Estonia, Iceland, Luxembourg, and New Zealand to relatively large surveys in France, Germany, Italy, the Netherlands, Spain, and the United Kingdom. In cases where 2012 sample size information could not be obtained, estimated standard errors or unweighted sample size data from prior years were substituted. For some countries in the analysis, sample size information was estimated using the sampling rate information provided in the NEAC survey metadata. For the purpose of the estimates, the sample rate was multiplied by the various weighted population groups to compute an estimated sample size.
In order to get a sense of the impact of these standard errors on the meaning and interpretation of EAG 2014 values it is helpful to compute the associated confidence intervals. These confidence intervals seem reasonably close to the reported EAG 2014 value in most cases, indicating that we can be fairly confident about the statistical accuracy of the values on Tables A1.1a, A1.2a, A1.2b, A1.3a and A1.3b using the available information on sample sizes. However, even though these estimates are relatively precise, small standard errors can still complicate some types of interpretations of these values, in particular, OECD rankings, due to the fact that small standard errors resul in narrow ranges for confidence intervals. It is crucial to note that employing the simple random survey assumption offers a conservative, “best-case scenario” of standard error estimates. As most, if not all, country’s labour force surveys use complex sample designs; the standard errors would generally be larger if the sample design information were used. The generally small standard errors in Tables A1.1a, A1.2a, A1.2b, A1.3a and A1.3b result in the finding that most of the values are statistically significantly different from the OECD average. If the standard errors were larger, indicating a wider range of possible true values, it would be harder to discern a significant difference between one country and the OECD average value.
While the findings generally support the validity of the tables appearing in EAG 2014, they also suggest that more attention to statistical testing and statistical validity is needed, particularly when detailed data using smaller segments of the population are presented. Also, the standard error estimates should incorporate appropriate adjustments for survey design effects, where the information is available. Back_to_Table1

16
Table 4: Standard errors for Table A1.1a for the year 2012 (EAG 2014)
Table A1.1a. Educational attainment of 25-64 year-olds (2012)
(10)
OECD
Australia 6 (0.14) 18 (0.22) a (†) 14 (0.20) 16 (0.21) 5 (0.12) 11 (0.17) 29 (0.25) 1 (0.05) 100
Austria x(2) (†) 16 (0.22) 1 (0.07) 47 (0.29) 6 (0.15) 10 (0.20) 7 (0.14) 13 (0.21) x(8) (†) 100
Belgium 12 (0.14) 16 (0.16) a (†) 10 (0.13) 24 (0.18) 3 (0.07) 17 (0.16) 18 (0.16) 1 (0.03) 100
Canada 3 (0.07) 8 (0.10) a (†) x(5) (†) 25 (0.16) 12 (0.11) 25 (0.16) 28 (0.23) x(8) (†) 100
Chile 1 18 (0.12) 25 (0.14) a (†) x(5) (†) 40 (0.16) a (†) 6 (0.07) 11 (0.10) 1 (0.03) 100
Czech Republic n (†) 7 (0.07) a (†) 38 (0.14) 35 (0.13) x(5) (†) x(8) (†) 19 (0.11) x(8) (†) 100
Denmark 1 (0.03) 20 (0.16) 1 (0.04) 37 (0.19) 6 (0.09) c (†) 6 (0.09) 28 (0.18) 1 (0.03) 100
Estonia 1 (0.11) 10 (0.40) a (†) 14 (0.46) 32 (0.63) 7 (0.35) 13 (0.45) 24 (0.63) n (†) 100
Finland 6 (0.11) 10 (0.14) a (†) a (†) 44 (0.24) 1 (0.04) 13 (0.17) 25 (0.21) 1 (0.05) 100
France 10 (0.06) 18 (0.07) a (†) 30 (0.09) 11 (0.06) n (†) 12 (0.06) 18 (0.08) 1 (0.02) 100
Germany 3 (0.03) 10 (0.05) a (†) 47 (0.10) 3 (0.03) 8 (0.05) 11 (0.06) 16 (0.07) 1 (0.02) 100
Greece 21 (0.11) 11 (0.09) x(4) (†) 7 (0.07) 27 (0.12) 8 (0.08) 9 (0.08) 17 (0.11) n (†) 100
Hungary 1 (0.03) 17 (0.10) a (†) 29 (0.12) 29 (0.12) 2 (0.04) 1 (0.02) 21 (0.11) 1 (0.02) 100
Iceland 21 (0.43) 7 (0.27) 2 (0.13) 19 (0.42) 10 (0.32) 6 (0.26) 4 (0.21) 30 (0.48) 1 (0.11) 100
Ireland 10 (0.09) 14 (0.10) 1 (0.03) x(5) (†) 21 (0.12) 13 (0.10) 15 (0.10) 24 (0.12) 1 (0.02) 100
Israel 10 (0.12) 6 (0.10) a (†) 7 (0.11) 31 (0.18) a (†) 14 (0.14) 31 (0.18) 1 (0.04) 100
Italy 10 (0.06) 32 (0.11) 1 (0.02) 8 (0.06) 33 (0.11) 1 (0.02) n (†) 15 (0.08) n (†) 100
Japan x(5) (†) x(5) (†) x(5) (†) x(5) (†) 53 (0.19) a (†) 20 (0.15) 26 (0.17) x(8) (†) 100
Korea 8 (0.14) 10 (0.15) a (†) x(5) (†) 41 (0.25) a (†) 13 (0.17) 28 (0.23) x(8) (†) 100
Luxembourg 8 (0.21) 9 (0.21) 5 (0.16) 16 (0.27) 20 (0.30) 4 (0.14) 13 (0.25) 25 (0.32) 1 (0.09) 100
Mexico 39 (0.07) 23 (0.06) a (†) 5 (0.03) 14 (0.05) a (†) 1 (0.01) 17 (0.05) x(8) (†) 100
Netherlands 8 (0.05) 19 (0.08) x(4) (†) 14 (0.07) 22 (0.08) 3 (0.03) 3 (0.03) 31 (0.09) 1 (0.02) 100
New Zealand x(2) (†) 19 (0.33) 7 (0.21) 14 (0.29) 9 (0.24) 11 (0.26) 15 (0.30) 25 (0.36) x(8) (†) 100
Norw ay n (†) 18 (0.16) a (†) 27 (0.19) 13 (0.14) 4 (0.08) 2 (0.06) 36 (0.20) 1 (0.03) 100
Poland x(2) (†) 10 (0.06) a (†) 31 (0.10) 31 (0.10) 4 (0.04) x(8) (†) 25 (0.09) x(8) (†) 100
Portugal 42 (0.17) 21 (0.14) x(5) (†) x(5) (†) 19 (0.13) n (†) x(8) (†) 16 (0.13) 3 (0.06) 100
Slovak Republic n (†) 8 (0.23) x(4) (†) 35 (0.39) 38 (0.40) x(5) (†) 1 (0.09) 17 (0.31) n (†) 100
Slovenia 1 (0.06) 14 (0.19) a (†) 27 (0.24) 32 (0.25) a (†) 12 (0.18) 12 (0.18) 2 (0.08) 100
Spain 17 (0.06) 29 (0.07) a (†) 9 (0.05) 14 (0.06) n (†) 10 (0.05) 22 (0.07) 1 (0.01) 100
Sw eden 4 (0.04) 9 (0.07) a (†) x(5) (†) 45 (0.12) 7 (0.06) 9 (0.07) 25 (0.10) 1 (0.03) 100
Sw itzerland 3 (0.06) 9 (0.10) 2 (0.05) 39 (0.18) 5 (0.09) 6 (0.09) 11 (0.12) 23 (0.16) 3 (0.06) 100
Turkey 55 (0.10) 12 (0.06) a (†) 9 (0.05) 10 (0.06) a (†) x(8) (†) 15 (0.07) x(8) (†) 100
United Kingdom n (†) 9 (0.06) 13 (0.07) 30 (0.10) 7 (0.06) a (†) 10 (0.06) 30 (0.10) 1 (0.02) 100
United States 4 (0.10) 7 (0.11) x(5) (†) x(5) (†) 46 (0.21) x(5) (†) 10 (0.12) 31 (0.22) 1 (0.04) 100
OECD average
EU21 average
Partners
Argentina 2 44 (†) 14 (†) a (†) x(5) (†) 28 (†) a (†) x(8) (†) 14 (†) x(8) (†) 100
Brazil 40 (0.11) 15 (0.08) x(5) (†) x(5) (†) 32 (0.10) a (†) x(8) (†) 13 (0.07) x(8) (†) 100
China 3 35 (†) 43 (†) m (†) x(5) (†) 14 (†) 5 (†) x(8) (†) 4 (†) x(8) (†) 100
Colombia 1 44 (†) 14 (†) a (†) x(5) (†) 22 (†) a (†) x(8) (†) 20 (†) x(8) (†) 100
India m (†) m (†) m (†) m (†) m (†) m (†) m (†) m (†) m (†) m
Indonesia 1 56 (†) 16 (†) a (†) x(5) (†) 21 (†) a (†) x(8) (†) 8 (†) x(8) (†) 100
Latvia 1 (0.07) 10 (0.27) m (†) 3 (0.16) 48 (0.44) 8 (0.24) 1 (0.10) 27 (0.39) n (†) 100
Russian Federation 1 0 5 0 x(4) (†) 19 0 21 0 x(4) (†) 26 0 28 0 n (†) 100
Saudi Arabia 4 33 (†) 18 (†) a (†) x(5) (†) 23 (†) 5 (†) x(8) (†) 21 (†) x(8) (†) 100
South Africa 26 (†) 14 (†) a (†) x(5) (†) 47 (†) 7 (†) x(8) (†) 6 (†) x(8) (†) 100
G20 average
Sources: OECD. Argentina, China, Colombia, India, Indonesia, Saudi Arabia, South Africa: UNESCO Institute for Statistics. Latvia: Eurostat. See Annex 3 for notes (www.oecd.org/edu/eag.htm).
Please refer to the Reader's Guide for information concerning the symbols replacing missing data and the “r” symbol next to some figures.
No
tes
Pre-primary
and primary
education
Lower
secondary
education
ISCED 3C
(short
programme)
(1) (2) (3)
All levels of
educationISCED 3C
(long
programme)/
3B
ISCED 3A Type B Type A
Advanced
research
programmes
Upper secondary education
Below upper secondary education Upper secondary level of education Tertiary level of education
Post-secondary
non-tertiary
education
Tertiary education
(4) (5) (6) (7) (8) (9)
36 36 27
Note: Due to discrepancies in the data, OECD and EU21 averages have not been calculated for each column individually.
1. Year of reference 2011.
2. Year of reference 2003.
3. Year of reference 2010.
4. Year of reference 2013.
24 44 33
23 48 29

17
Table 5: Standard errors for Table A1.2a for the year 2012 (EAG 2014)
Table A1.2a. Proportion of the population that has attained at least upper secondary education, by age group (2012)
OECD
Australia 76 * (0.25) 86 * (0.59) 87 * (0.41) 81 * (0.45) 71 * (0.51) 64 (0.59)
Austria 83 * (0.24) 89 * (0.70) 89 * (0.50) 86 * (0.45) 83 * (0.41) 74 * (0.55)
Belgium 72 * (0.19) 82 (0.49) 82 (0.35) 79 (0.35) 69 * (0.38) 56 * (0.43)
Canada 89 * (0.13) 93 * (0.25) 92 * (0.19) 92 * (0.19) 88 * (0.22) 84 * (0.26)
Chile 1 57 * (0.16) 72 * (0.41) 77 * (0.27) 61 * (0.30) 50 * (0.30) 38 * (0.35)
Czech Republic 92 * (0.07) 93 * (0.21) 94 * (0.15) 95 * (0.12) 93 * (0.15) 87 * (0.17)
Denmark 78 * (0.16) 83 (0.49) 82 * (0.36) 82 * (0.30) 77 * (0.29) 71 * (0.35)
Estonia 90 * (0.41) 86 * (1.30) 86 * (0.95) 90 * (0.77) 94 * (0.62) 88 * (0.83)
Finland 85 * (0.18) 91 * (0.42) 90 * (0.32) 90 * (0.31) 87 * (0.32) 74 * (0.40)
France 73 * (0.09) 83 * (0.22) 83 * (0.16) 79 * (0.16) 69 * (0.17) 59 * (0.19)
Germany 86 * (0.12) 87 * (0.47) 87 * (0.32) 87 * (0.31) 87 * (0.27) 84 * (0.31)
Greece 68 * (0.13) 81 * (0.33) 83 (0.23) 74 * (0.24) 65 * (0.26) 50 * (0.28)
Hungary 82 * (0.10) 87 * (0.26) 88 * (0.18) 84 * (0.19) 82 * (0.21) 75 * (0.21)
Iceland 71 * (0.48) 77 * (1.16) 75 * (0.87) 75 * (0.91) 71 * (0.94) 61 * (1.12)
Ireland 75 * (0.13) 86 * (0.26) 86 * (0.19) 80 * (0.21) 70 * (0.27) 55 * (0.32)
Israel 85 * (0.15) 89 (†) 90 * (0.23) 86 * (0.28) 81 * (0.35) 77 * (0.41)
Italy 57 * (0.14) 70 * (0.51) 72 * (0.37) 62 * (0.29) 53 * (0.28) 42 * (0.28)
Japan m (†) m (†) m (†) m (†) m (†) m (†)
Korea 82 * (0.20) 98 (†) 98 * (0.14) 96 * (0.19) 78 * (0.42) 48 * (0.63)
Luxembourg 78 * (0.31) 86 * (0.83) 86 * (0.58) 80 * (0.60) 76 * (0.59) 69 * (0.67)
Mexico 37 * (0.06) 42 (†) 46 * (0.12) 37 * (0.12) 35 * (0.13) 25 * (0.15)
Netherlands 73 * (0.09) 83 * (0.25) 83 * (0.17) 78 * (0.17) 72 * (0.16) 61 * (0.20)
New Zealand 74 * (0.37) 81 (0.98) 80 * (0.72) 78 (0.67) 73 (0.70) 64 (0.82)
Norw ay 82 * (0.16) 84 * (0.48) 82 (0.36) 86 * (0.29) 79 * (0.34) 82 * (0.33)
Poland 90 * (0.06) 94 * (0.14) 94 * (0.10) 92 * (0.12) 90 * (0.12) 81 * (0.15)
Portugal 38 * (0.17) 55 * (0.56) 58 * (0.39) 43 * (0.35) 27 * (0.28) 20 * (0.26)
Slovak Republic 92 * (0.23) 94 * (0.60) 94 * (0.41) 94 * (0.39) 92 * (0.44) 86 * (0.55)
Slovenia 85 * (0.19) 94 * (0.40) 94 * (0.27) 89 * (0.37) 83 * (0.38) 74 * (0.45)
Spain 55 * (0.08) 65 * (0.23) 64 * (0.17) 62 * (0.15) 51 * (0.15) 35 * (0.16)
Sw eden 88 * (0.08) 90 * (0.20) 91 * (0.14) 92 * (0.13) 88 * (0.15) 79 * (0.18)
Sw itzerland 86 * (0.13) 89 * (0.35) 89 * (0.28) 88 * (0.23) 86 * (0.23) 82 * (0.27)
Turkey 34 * (0.09) 43 * (0.25) 46 * (0.18) 32 * (0.17) 25 * (0.17) 21 * (0.19)
United Kingdom 78 * (0.09) 85 * (0.22) 85 * (0.16) 81 * (0.16) 76 * (0.18) 69 * (0.20)
United States 89 * (0.16) 89 * (0.32) 89 * (0.29) 89 * (0.24) 89 * (0.26) 90 * (0.23)
OECD average 75 (0.03) 82 (0.10) 82 (0.07) 79 (0.06) 73 (0.06) 64 (0.08)
EU21 average 77 (0.04) 84 (0.11) 84 (0.08) 81 (0.07) 75 (0.07) 66 (0.08)
Partners
Argentina 2 42 (†) m (†) m (†) m (†) m (†) m (†)
Brazil 45 (0.11) 56 (†) 59 (0.19) 45 (0.21) 38 (0.22) 27 (0.25)
China 3 22 (†) m (†) m (†) m (†) m (†) m (†)
Colombia 1 42 (†) m (†) m (†) m (†) m (†) m (†)
India m (†) m (†) m (†) m (†) m (†) m (†)
Indonesia 1 29 (†) m (†) m (†) m (†) m (†) m (†)
Latvia 89 (0.27) 84 (0.97) 85 (0.69) 89 (0.52) 94 (0.37) 87 (0.63)
Russian Federation 94 (0.05) 94 (†) 94 (0.10) 95 (0.10) 96 (0.09) 92 (0.15)
Saudi Arabia 4 49 (†) m (†) m (†) m (†) m (†) m (†)
South Africa 61 (†) m (†) m (†) m (†) m (†) m (†)
G20 average 61 (†) m (†) m (†) m (†) m (†) m (†)
Please refer to the Reader's Guide for information concerning the symbols replacing missing data and the “r” symbol next to some figures.
45-54 55-64
Sources : OECD. Argentina, China, Colombia, India, Indonesia, Saudi Arabia, South Africa: UNESCO Institute for Statistics. Latvia:
Eurostat. See Annex 3 for notes (www.oecd.org/edu/eag.htm ).
Note: These calculations exclude ISCED 3C short programmes.
1. Year of reference 2011.
2. Year of reference 2003.
3. Year of reference 2010.
4. Year of reference 2013.
(1) (2) (3) (4) (5) (6)No
tes
Age group
25-64 30-34 25-34 35-44

18
Table 6: Standard errors for Table A1.2b for the year 2012 (EAG 2014)
Table A1.2b (Web only). Proportion of the population that has attained at least upper secondary education, by age group and gender (2012)
OECD
Australia 78 # (†) 86 # (†) 86 # (†) 82 # (†) 72 # (†) 70 # (†) 75 # (†) 87 # (†) 88 # (†) 80 # (†) 70 # (†) 58 # (†)
Austria 88 * (0.27) 91 * (0.70) 89 * (0.58) 90 * (0.56) 89 * (0.46) 83 * (0.63) 78 * (0.34) 88 * (0.70) 88 * (0.67) 83 * (0.58) 77 * (0.60) 65 * (0.85)
Belgium 71 * (0.28) 79 * (0.73) 79 * (0.53) 77 (0.51) 68 * (0.54) 58 * (0.61) 73 * (0.27) 85 (0.64) 85 (0.45) 80 (0.48) 70 * (0.52) 55 * (0.60)
Canada 88 * (0.16) 91 * (0.36) 91 * (0.27) 90 * (0.27) 86 * (0.29) 84 * (0.33) 90 * (0.15) 94 * (0.31) 94 * (0.24) 93 * (0.22) 90 * (0.27) 84 * (0.33)
Chile 1 58 * (0.23) 72 * (0.59) 76 * (0.39) 60 * (0.45) 50 * (0.45) 41 * (0.52) 57 * (0.22) 73 * (0.56) 77 * (0.37) 61 * (0.41) 50 * (0.41) 35 * (0.47)
Czech Republic 95 * (0.09) 94 * (0.28) 94 * (0.20) 96 * (0.15) 95 * (0.18) 93 * (0.19) 90 * (0.12) 93 * (0.30) 93 * (0.22) 95 * (0.18) 91 * (0.23) 81 * (0.28)
Denmark 78 * (0.24) 79 (0.77) 78 * (0.56) 80 * (0.45) 77 * (0.42) 75 * (0.47) 78 * (0.22) 86 * (0.62) 86 * (0.45) 84 * (0.39) 78 * (0.40) 66 * (0.51)
Estonia 87 * (0.65) 81 (2.08) 82 (1.49) 88 * (1.22) 93 * (0.98) 86 * (1.37) 92 * (0.47) 91 * (1.44) 90 * (1.09) 93 * (0.87) 95 * (0.72) 90 * (0.99)
Finland 82 * (0.27) 89 * (0.65) 87 * (0.49) 87 * (0.50) 84 * (0.49) 72 * (0.58) 87 * (0.23) 94 * (0.50) 93 * (0.39) 93 * (0.37) 89 * (0.40) 76 * (0.55)
France 73 * (0.12) 82 * (0.33) 82 * (0.24) 79 (0.23) 70 * (0.25) 63 * (0.26) 72 * (0.12) 85 * (0.30) 85 * (0.21) 80 * (0.21) 67 * (0.24) 55 * (0.26)
Germany 89 * (0.20) 87 * (0.68) 87 * (0.47) 88 * (0.45) 89 * (0.41) 89 * (0.47) 84 * (0.20) 86 * (0.68) 87 * (0.48) 85 * (0.45) 85 * (0.40) 80 * (0.43)
Greece 69 * (0.19) 77 * (0.49) 79 * (0.34) 72 * (0.35) 66 * (0.37) 54 * (0.39) 68 * (0.18) 84 * (0.42) 86 * (0.30) 77 * (0.32) 63 * (0.36) 46 * (0.38)
Hungary 85 * (0.14) 87 * (0.36) 87 * (0.26) 84 * (0.27) 85 * (0.28) 82 * (0.28) 80 * (0.15) 88 * (0.36) 88 * (0.26) 83 * (0.27) 79 * (0.30) 69 * (0.30)
Iceland 73 * (0.67) 75 * (1.64) 70 * (1.30) 74 * (1.31) 75 (1.28) 71 * (1.44) 69 * (0.69) 80 * (1.63) 80 * (1.14) 77 * (1.26) 67 * (1.35) 51 * (1.65)
Ireland 72 * (0.19) 84 * (0.39) 83 * (0.30) 77 * (0.32) 66 * (0.39) 53 * (0.46) 77 * (0.17) 88 * (0.34) 88 * (0.25) 83 * (0.28) 73 * (0.36) 57 * (0.45)
Israel 84 (†) 88 (†) 89 (†) 85 (†) 81 (†) 77 (†) 85 (†) 90 (†) 92 (†) 87 (†) 81 (†) 78 (†)
Italy 56 * (0.21) 66 * (0.71) 68 * (0.52) 59 * (0.42) 51 * (0.40) 45 * (0.43) 59 * (0.21) 74 * (0.76) 76 * (0.55) 65 * (0.44) 55 * (0.41) 40 * (0.39)
Japan m (†) m (†) m (†) m (†) m (†) m (†) m (†) m (†) m (†) m (†) m (†) m (†)
Korea 87 (†) 98 (†) 98 (†) 97 (†) 84 (†) 59 (†) 78 (†) 99 (†) 98 (†) 96 (†) 72 (†) 36 (†)
Luxembourg 80 * (0.44) 85 * (1.21) 84 * (0.86) 83 * (0.83) 78 * (0.84) 74 * (0.97) 76 * (0.43) 86 * (1.13) 88 * (0.77) 78 (0.86) 73 (0.83) 63 * (0.93)
Mexico 39 (†) 42 (†) 46 (†) 38 (†) 38 (†) 28 (†) 36 (†) 42 (†) 46 (†) 37 (†) 32 (†) 22 (†)
Netherlands 75 * (0.13) 81 (0.38) 81 (0.26) 77 * (0.25) 73 * (0.23) 68 (0.26) 72 * (0.13) 86 * (0.32) 86 * (0.23) 80 (0.23) 70 * (0.23) 54 * (0.29)
New Zealand 75 * (0.53) 80 (1.46) 79 (1.07) 77 (1.01) 74 (1.01) 67 (1.16) 74 * (0.50) 81 (1.32) 81 * (0.96) 79 (0.90) 72 (0.97) 61 (1.14)
Norw ay 82 * (0.23) 83 * (0.69) 80 * (0.52) 85 * (0.41) 79 * (0.48) 83 * (0.45) 82 * (0.23) 85 * (0.66) 84 (0.48) 86 * (0.41) 78 * (0.48) 80 * (0.48)
Poland 90 * (0.09) 93 * (0.22) 93 * (0.15) 91 * (0.17) 90 * (0.18) 83 * (0.21) 90 * (0.09) 95 * (0.19) 96 * (0.13) 93 * (0.15) 90 * (0.17) 80 * (0.22)
Portugal 34 * (0.24) 50 * (0.80) 52 * (0.56) 37 * (0.49) 25 * (0.40) 21 * (0.39) 41 * (0.23) 60 * (0.76) 64 * (0.54) 50 * (0.48) 30 * (0.40) 19 * (0.34)
Slovak Republic 93 * (0.29) 93 * (0.85) 94 * (0.56) 95 * (0.54) 93 * (0.57) 91 * (0.68) 90 * (0.35) 94 * (0.86) 94 * (0.60) 94 * (0.58) 90 * (0.67) 81 * (0.83)
Slovenia 86 * (0.21) 92 * (0.47) 92 * (0.34) 88 * (0.40) 84 * (0.43) 80 * (0.47) 84 * (0.22) 96 * (0.36) 97 * (0.24) 89 * (0.38) 81 * (0.45) 69 * (0.50)
Spain 53 * (0.12) 60 * (0.34) 59 * (0.25) 59 * (0.22) 51 * (0.22) 39 * (0.24) 56 * (0.11) 70 * (0.32) 70 * (0.23) 66 * (0.21) 52 * (0.21) 32 * (0.22)
Sw eden 86 * (0.11) 89 * (0.30) 89 * (0.21) 91 * (0.19) 86 * (0.23) 77 * (0.27) 89 * (0.10) 92 * (0.27) 92 * (0.19) 92 * (0.17) 90 * (0.20) 82 * (0.24)
Sw itzerland 89 * (0.17) 90 * (0.49) 90 * (0.40) 90 * (0.32) 89 * (0.30) 87 * (0.34) 84 * (0.19) 88 * (0.50) 89 * (0.38) 85 * (0.34) 83 * (0.36) 77 * (0.41)
Turkey 38 * (0.14) 48 * (0.36) 51 * (0.26) 37 * (0.26) 30 * (0.26) 24 * (0.28) 29 * (0.12) 38 * (0.34) 41 * (0.25) 26 * (0.23) 20 * (0.22) 16 * (0.23)
United Kingdom 80 * (0.13) 84 * (0.33) 84 * (0.24) 82 * (0.24) 77 * (0.25) 76 * (0.27) 76 * (0.13) 86 * (0.29) 85 * (0.22) 81 * (0.23) 75 * (0.25) 63 * (0.29)
United States 88 * (0.20) 88 * (0.49) 88 * (0.39) 88 * (0.33) 88 * (0.36) 90 * (0.31) 90 * (0.17) 90 * (0.40) 91 * (0.32) 90 * (0.26) 90 * (0.30) 90 * (0.29)
OECD average 76 (0.05) 81 (0.15) 81 (0.11) 78 (0.10) 74 (0.10) 68 (0.11) 75 (0.05) 83 (0.13) 84 (0.09) 79 (0.09) 72 (0.09) 61 (0.11)
EU21 average 77 (0.06) 82 (0.16) 82 (0.12) 80 (0.11) 76 (0.10) 70 (0.12) 77 (0.05) 86 (0.14) 86 (0.10) 82 (0.10) 75 (0.10) 63 (0.11)
Partners
Argentina 2 40 (†) m (†) m (†) m (†) m (†) m (†) 44 (†) m (†) m (†) m (†) m (†) m (†)
Brazil 42 (†) 52 (†) 55 (†) 42 (†) 37 (†) 27 (†) 47 (†) 60 (†) 63 (†) 48 (†) 40 (†) 27 (†)
China 3 25 (†) m (†) m (†) m (†) m (†) m (†) 19 (†) m (†) m (†) m (†) m (†) m (†)
Colombia 1 41 (†) m (†) m (†) m (†) m (†) m (†) 42 (†) m (†) m (†) m (†) m (†) m (†)
India m (†) m (†) m (†) m (†) m (†) m (†) m (†) m (†) m (†) m (†) m (†) m (†)
Indonesia 1 33 (†) m (†) m (†) m (†) m (†) m (†) 25 (†) m (†) m (†) m (†) m (†) m (†)
Latvia 86 (0.45) 80 (1.57) 81 (1.12) 84 (0.89) 92 (0.63) 85 (0.97) 92 (0.32) 88 (1.15) 90 (0.82) 93 (0.57) 96 (0.42) 89 (0.82)
Russian Federation 94 (†) 93 (†) 93 (†) 94 (†) 95 (†) 91 (†) 95 (†) 95 (†) 96 (†) 96 (†) 96 (†) 92 (†)
Saudi Arabia 4 51 (†) m (†) m (†) m (†) m (†) m (†) 46 (†) m (†) m (†) m (†) m (†) m (†)
South Africa 62 (†) m (†) m (†) m (†) m (†) m (†) 59 (†) m (†) m (†) m (†) m (†) m (†)
G20 Average 63 (†) m (†) m (†) m (†) m (†) m (†) 60 (†) m (†) m (†) m (†) m (†) m (†)
25-34 30-34 35-44 45-54 55-64
(1) (2) (3) (4) (5) (6) (7) (8)
45-54 55-64 25-64 30-3425-34 35-44
Please refer to the Reader's Guide for information concerning the symbols replacing missing data and the “r” symbol next to some figures.
(9) (10) (11) (12)
Note: These calculations exclude ISCED 3C short programmes.
1. Year of reference 2011.
2. Year of reference 2003.
3. Year of reference 2010.
4. Year of reference 2013.
Sources: OECD. Argentina, China, Colombia, India, Indonesia, Saudi Arabia, South Africa: UNESCO Institute for Statistics. Latvia: Eurostat. See Annex 3 for notes (www.oecd.org/edu/eag.htm ).
No
tes
Men Women
Age group Age group
25-64

19
Table 7: Standard errors for Table A1.3a for the year 2012 (EAG 2014)
Table A1.3a. Proportion of the population that has attained tertiary education, by type of programme and age group (2012)
(19)
OECD
Australia 11 * (0.17) 11 (0.48) 10 (0.33) 13 * (0.34) 12 * (0.36) 10 * (0.35) 30 * (0.25) 38 * (0.76) 37 * (0.53) 32 * (0.50) 25 * (0.47) 23 * (0.50) 41 * (0.27) 49 * (0.79) 47 * (0.56) 45 * (0.54) 37 * (0.53) 33 * (0.56) 4,846
Austria 7 * (0.14) 6 * (0.44) 5 * (0.29) 7 * (0.28) 8 * (0.29) 8 (0.30) 13 * (0.21) 20 * (0.76) 18 * (0.47) 14 * (0.46) 10 * (0.33) 8 * (0.37) 20 * (0.23) 26 * (0.80) 23 * (0.50) 22 * (0.52) 19 * (0.43) 17 * (0.47) 934
Belgium 17 * (0.16) 20 * (0.50) 18 * (0.35) 20 * (0.34) 16 * (0.30) 13 * (0.29) 18 * (0.17) 24 * (0.54) 25 * (0.39) 21 * (0.35) 16 * (0.30) 12 * (0.28) 35 * (0.20) 44 * (0.62) 43 * (0.45) 40 * (0.42) 32 * (0.38) 25 * (0.38) 2,089
Canada 25 * (0.16) 26 * (0.43) 25 * (0.32) 27 * (0.32) 25 * (0.28) 22 * (0.28) 28 * (0.23) 32 (0.54) 32 * (0.41) 32 * (0.41) 24 * (0.34) 22 * (0.34) 53 * (0.23) 58 * (0.53) 57 * (0.40) 59 * (0.39) 50 * (0.35) 44 * (0.38) 9,981
Chile 1 6 * (0.07) 6 * (0.22) 6 * (0.15) 7 * (0.16) 6 * (0.14) 4 * (0.13) 12 * (0.10) 17 * (0.34) 16 * (0.23) 12 * (0.20) 9 * (0.18) 9 * (0.21) 18 * (0.12) 23 * (0.38) 22 * (0.26) 19 * (0.24) 16 * (0.22) 13 * (0.24) 1,492
Czech Republic x(7) (†) x(8) (†) x(9) (†) x(10) (†) x(11) (†) x(12) (†) 19 * (0.11) 26 * (0.37) 28 * (0.28) 19 * (0.22) 18 * (0.22) 13 * (0.17) 19 * (0.11) 26 * (0.37) 28 * (0.28) 19 * (0.22) 18 * (0.22) 13 * (0.17) 1,164
Denmark 6 * (0.09) 6 * (0.31) 5 * (0.21) 6 * (0.19) 6 * (0.16) 5 * (0.17) 29 * (0.18) 37 * (0.63) 35 * (0.45) 32 * (0.37) 27 * (0.31) 24 * (0.33) 35 * (0.19) 43 * (0.65) 40 * (0.46) 39 * (0.38) 32 * (0.33) 29 * (0.35) 817
Estonia 13 * (0.45) 12 (1.26) 13 * (0.98) 12 (0.83) 13 * (0.85) 12 * (0.88) 25 (0.64) 27 * (1.82) 27 * (1.37) 24 (1.25) 24 * (1.16) 23 * (1.18) 37 * (0.69) 39 (1.96) 40 (1.46) 36 (1.33) 37 * (1.28) 35 * (1.32) 272
Finland 13 * (0.17) 2 * (0.19) 1 * (0.10) 15 * (0.37) 21 * (0.38) 17 * (0.34) 26 * (0.22) 44 * (0.73) 39 * (0.51) 33 * (0.48) 21 (0.38) 15 * (0.32) 40 * (0.24) 46 * (0.73) 40 (0.52) 47 * (0.75) 41 * (0.46) 31 * (0.42) 1,136
France 12 * (0.06) 17 * (0.22) 16 * (0.16) 16 * (0.14) 10 * (0.11) 7 * (0.09) 19 * (0.08) 27 * (0.26) 27 * (0.19) 22 * (0.16) 14 * (0.13) 13 * (0.13) 31 * (0.09) 44 * (0.29) 43 * (0.21) 38 * (0.19) 24 * (0.16) 20 * (0.15) 10,049
Germany 11 * (0.06) 10 * (0.16) 9 * (0.11) 11 (0.12) 12 * (0.11) 11 * (0.12) 17 * (0.07) 22 * (0.24) 19 * (0.16) 19 * (0.15) 15 * (0.12) 15 * (0.14) 28 * (0.08) 32 * (0.29) 29 * (0.19) 30 * (0.19) 28 * (0.16) 26 * (0.18) 12,612
Greece 9 * (0.08) 11 * (0.26) 13 * (0.21) 8 * (0.15) 8 * (0.15) 5 * (0.12) 18 * (0.11) 20 * (0.33) 21 * (0.25) 19 * (0.21) 16 * (0.20) 15 * (0.20) 27 * (0.12) 31 * (0.38) 35 * (0.29) 27 * (0.24) 24 * (0.23) 20 * (0.22) 1,641
Hungary 1 * (0.02) 1 * (0.08) 1 * (0.07) 1 * (0.05) c (†) c (†) 21 * (0.11) 29 * (0.35) 29 * (0.25) 22 * (0.21) 19 * (0.21) 15 * (0.18) 22 * (0.11) 30 * (0.35) 30 * (0.26) 22 * (0.21) 19 * (0.21) 15 * (0.18) 1,225
Iceland 4 * (0.21) c (†) 3 * (0.32) 5 * (0.45) 5 * (0.43) 5 * (0.48) 31 * (0.49) 40 * (1.36) 36 * (0.97) 37 * (1.02) 30 * (0.94) 20 * (0.92) 35 * (0.50) 40 (1.36) 38 (0.98) 42 * (1.04) 34 * (0.98) 25 (0.99) 56
Ireland 15 * (0.10) 18 * (0.28) 16 * (0.20) 18 * (0.20) 13 * (0.20) 10 * (0.20) 25 * (0.12) 33 * (0.35) 33 * (0.26) 28 * (0.24) 19 * (0.23) 15 * (0.23) 40 * (0.14) 51 * (0.37) 49 * (0.28) 46 * (0.26) 32 * (0.27) 25 * (0.28) 965
Israel 14 * (0.14) 13 (†) 12 * (0.25) 14 * (0.29) 14 * (0.30) 16 * (0.32) 33 * (0.18) 38 (†) 33 * (0.35) 36 * (0.37) 30 * (0.37) 30 * (0.38) 46 * (0.20) 51 (†) 44 * (0.38) 50 * (0.39) 45 * (0.41) 47 * (0.43) 1,691
Italy n (†) n (†) n (†) n (†) n (†) n (†) 15 * (0.08) 21 * (0.29) 22 * (0.21) 17 * (0.16) 12 * (0.14) 11 * (0.15) 16 * (0.08) 22 * (0.30) 22 * (0.21) 17 * (0.16) 12 * (0.14) 11 * (0.16) 5,272
Japan 20 * (0.15) m (†) 23 * (0.35) 25 * (0.33) 20 * (0.34) 13 * (0.30) 26 * (0.17) m (†) 35 * (0.39) 27 * (0.33) 26 * (0.37) 19 * (0.36) 47 * (0.19) m (†) 59 * (0.40) 52 * (0.38) 46 * (0.42) 32 * (0.42) 30,890
Korea 13 * (0.17) 25 (†) 26 * (0.43) 17 * (0.31) 6 * (0.22) 2 * (0.16) 28 * (0.23) 40 (†) 40 * (0.47) 36 * (0.44) 23 * (0.40) 11 * (0.40) 42 * (0.25) 66 (†) 66 * (0.46) 52 * (0.46) 29 (0.43) 14 * (0.42) 12,331
Luxembourg 13 * (0.25) 12 (0.76) 14 * (0.58) 15 * (0.54) 12 * (0.45) 10 * (0.43) 26 * (0.33) 38 * (1.14) 36 * (0.80) 30 * (0.69) 20 (0.55) 17 (0.54) 39 * (0.36) 50 * (1.18) 50 * (0.83) 45 * (0.75) 32 * (0.64) 26 * (0.64) 114
Mexico 1 * (0.00) 1 (†) 1 * (0.00) 1 * (0.00) 1 * (0.00) 1 * (0.00) 17 * (0.00) 20 (†) 23 * (0.00) 15 * (0.00) 15 * (0.00) 12 * (0.00) 18 * (0.00) 21 (†) 24 * (0.00) 16 * (0.00) 17 * (0.00) 13 * (0.00) 9,661
Netherlands 3 * (0.03) 3 * (0.11) 3 * (0.07) 3 * (0.07) 3 * (0.06) 2 * (0.06) 32 * (0.09) 41 * (0.32) 40 * (0.23) 34 * (0.19) 28 * (0.16) 25 * (0.18) 34 * (0.10) 44 * (0.33) 43 * (0.23) 37 * (0.20) 31 * (0.17) 28 * (0.18) 2,922
New Zealand 15 * (0.30) 14 * (0.87) 14 * (0.62) 15 * (0.57) 16 * (0.58) 17 * (0.63) 25 * (0.36) 34 * (1.18) 33 * (0.84) 28 * (0.73) 22 * (0.65) 18 (0.65) 41 * (0.41) 48 * (1.24) 47 * (0.89) 42 * (0.80) 38 * (0.76) 35 * (0.81) 882
Norw ay 2 * (0.06) c (†) 1 * (0.08) 2 * (0.12) 3 * (0.14) 3 * (0.15) 36 * (0.21) 47 * (0.64) 44 * (0.46) 41 * (0.41) 32 * (0.39) 27 * (0.38) 39 * (0.21) 47 * (0.64) 45 * (0.46) 44 * (0.41) 35 * (0.39) 30 * (0.39) 1,017
Poland x(7) (†) x(8) (†) x(9) (†) x(10) (†) x(11) (†) x(12) (†) 25 * (0.09) 39 * (0.30) 41 * (0.21) 26 * (0.19) 16 * (0.15) 13 * (0.13) 25 * (0.09) 39 (0.30) 41 * (0.21) 26 * (0.19) 16 * (0.15) 13 * (0.13) 5,157
Portugal x(7) (†) x(8) (†) x(9) (†) x(10) (†) x(11) (†) x(12) (†) 19 * (0.13) 27 * (0.50) 28 * (0.36) 20 * (0.28) 14 * (0.22) 11 * (0.20) 19 * (0.13) 27 * (0.50) 28 * (0.36) 20 * (0.28) 14 * (0.22) 11 * (0.20) 1,095
Slovak Republic 1 * (0.09) 1 * (0.30) 1 * (0.19) 1 * (0.19) 1 * (0.19) 1 * (0.18) 18 * (0.32) 22 * (1.03) 26 * (0.76) 16 * (0.63) 15 * (0.57) 12 * (0.52) 19 * (0.32) 24 * (1.05) 27 * (0.77) 17 * (0.65) 16 * (0.59) 14 * (0.54) 598
Slovenia 12 * (0.18) 15 * (0.60) 14 * (0.40) 13 * (0.39) 11 * (0.32) 9 (0.30) 15 * (0.19) 24 * (0.71) 22 * (0.48) 18 * (0.45) 12 * (0.33) 8 * (0.28) 26 * (0.24) 39 (0.82) 35 * (0.55) 30 * (0.54) 23 * (0.43) 17 * (0.39) 315
Spain 10 * (0.05) 13 * (0.17) 13 * (0.12) 12 * (0.10) 8 * (0.08) 4 * (0.07) 23 * (0.07) 27 * (0.22) 27 * (0.16) 27 * (0.14) 20 (0.12) 15 * (0.12) 32 (0.08) 40 (0.24) 39 (0.18) 39 * (0.15) 28 * (0.14) 19 * (0.13) 8,508
Sw eden 9 * (0.07) 9 * (0.20) 9 * (0.14) 8 * (0.13) 9 * (0.13) 10 * (0.13) 27 * (0.10) 39 * (0.34) 34 * (0.23) 32 * (0.21) 21 * (0.19) 19 * (0.18) 36 * (0.11) 48 * (0.35) 43 * (0.24) 40 * (0.23) 30 * (0.21) 29 * (0.20) 1,736
Sw itzerland 11 * (0.12) 10 (0.34) 9 * (0.25) 12 * (0.23) 12 * (0.23) 10 * (0.22) 26 * (0.17) 34 * (0.55) 32 * (0.44) 29 * (0.31) 23 * (0.29) 19 * (0.29) 37 * (0.18) 44 * (0.57) 41 * (0.46) 41 * (0.34) 35 * (0.33) 29 * (0.33) 1,619
Turkey x(7) (†) x(8) (†) x(9) (†) x(10) (†) x(11) (†) x(12) (†) 15 * (0.07) 19 * (0.20) 21 * (0.15) 15 * (0.13) 10 * (0.12) 10 * (0.14) 15 * (0.07) 19 * (0.20) 21 * (0.15) 15 * (0.13) 10 * (0.12) 10 * (0.14) 5,271
United Kingdom 10 * (0.06) 9 * (0.17) 8 * (0.12) 11 * (0.13) 11 * (0.13) 10 * (0.13) 31 * (0.10) 42 * (0.31) 40 * (0.22) 35 * (0.20) 26 * (0.18) 22 * (0.18) 41 * (0.11) 50 * (0.31) 48 * (0.23) 45 * (0.21) 37 * (0.20) 33 * (0.20) 13,508
United States 10 * (0.12) 11 (0.29) 10 (0.20) 11 (0.25) 10 (0.22) 11 * (0.28) 33 * (0.22) 35 * (0.55) 34 * (0.43) 35 * (0.41) 31 * (0.38) 31 * (0.41) 43 * (0.24) 45 * (0.57) 44 * (0.42) 46 * (0.42) 41 * (0.39) 42 * (0.45) 70,207
OECD average 10 (0.03) 10 (0.10) 10 (0.06) 11 (0.06) 10 (0.06) 9 (0.06) 24 (0.04) 31 (0.13) 30 (0.08) 26 (0.08) 20 (0.07) 17 (0.07) 32 (0.04) 40 (0.13) 39 (0.09) 35 (0.08) 29 (0.08) 24 (0.08)
OECD total (in thousands) 222,074
EU21 average 9 (0.04) 9 (0.11) 9 (0.08) 10 (0.08) 10 (0.08) 8 (0.08) 22 (0.05) 30 (0.15) 29 (0.11) 24 (0.09) 18 (0.08) 15 (0.08) 30 (0.05) 38 (0.15) 37 (0.11) 33 (0.10) 26 (0.09) 22 (0.09)
Partners
Argentina 2 x(13) (†) m (†) m (†) m (†) m (†) m (†) x(13) (†) m (†) m (†) m (†) m (†) m (†) 14 (†) m (†) m (†) m (†) m (†) m (†) m
Brazil x(7) (†) x(8) (†) x(9) (†) x(10) (†) x(11) (†) x(12) (†) 13 (0.07) 15 (†) 14 (0.12) 13 (0.13) 13 (0.14) 10 (0.16) 13 (0.07) 15 (†) 14 (0.12) 13 (0.13) 13 (0.14) 10 (0.16) 13,199
China 3 x(13) (†) m (†) m (†) m (†) m (†) m (†) x(13) (†) m (†) m (†) m (†) m (†) m (†) 4 (†) m (†) m (†) m (†) m (†) m (†) m
Colombia 1 x(13) (†) m (†) m (†) m (†) m (†) m (†) x(13) (†) m (†) m (†) m (†) m (†) m (†) 20 (†) m (†) m (†) m (†) m (†) m (†) m
India m (†) m (†) m (†) m (†) m (†) m (†) m (†) m (†) m (†) m (†) m (†) m (†) m (†) m (†) m (†) m (†) m (†) m (†) m
Indonesia 1 x(13) (†) m (†) m (†) m (†) m (†) m (†) x(13) (†) m (†) m (†) m (†) m (†) m (†) 8 (†) m (†) m (†) m (†) m (†) m (†) m
Latvia 1 (0.10) 2 (0.34) 3 (0.32) 2 (0.21) 1 (0.14) n (†) 28 (0.39) 36 (1.25) 36 (0.94) 27 (0.73) 26 (0.70) 22 (0.78) 29 (0.40) 37 (1.27) 39 (0.95) 29 (0.75) 27 (0.71) 22 (0.78) 321
Russian Federation 26 (†) 22 (†) 21 (†) 26 (†) 28 (†) 28 (†) 28 (†) 34 (†) 35 (†) 29 (†) 24 (†) 21 (†) 53 (†) 56 (†) 57 (†) 55 (†) 52 (†) 49 (†) 44,583
Saudi Arabia 4 x(13) (†) m (†) m (†) m (†) m (†) m (†) x(13) (†) m (†) m (†) m (†) m (†) m (†) 21 (†) m (†) m (†) m (†) m (†) m (†) m
South Africa x(13) (†) m (†) m (†) m (†) m (†) m (†) x(13) (†) m (†) m (†) m (†) m (†) m (†) 6 (†) m (†) m (†) m (†) m (†) m (†) m
G20 average x(13) (†) m (†) m (†) m (†) m (†) m (†) x(13) (†) m (†) m (†) m (†) m (†) m (†) 27 (†) m (†) m (†) m (†) m (†) m (†)
G20 total (in thousands) m
1. Year of reference 2011.
2. Year of reference 2003.
3. Year of reference 2010.
4. Year of reference 2013.
Sources: OECD. Argentina, China, Colombia, India, Indonesia, Saudi Arabia, South Africa: UNESCO Institute for Statistics. Latvia: Eurostat. See Annex 3 for notes (www.oecd.org/edu/eag.htm ).
Please refer to the Reader's Guide for information concerning the symbols replacing missing data and the “r” symbol next to some figures.
Total tertiary
25-64
in
thousands25-64 30-34 25-34 35-44 35-44 45-54 55-64 25-34 35-44
No
tes
Tertiary-type B Tertiary-type A or advanced research programmes
45-54 55-64 25-64 30-34 25-34
(1) (2) (3) (4) (5) (6) (7) (8)
45-54 55-64 25-64 30-34
(15) (16) (17) (18)(9) (10) (11) (12) (13) (14)

20
Table 8: Standard errors for Table A1.3b for the year 2012 (EAG 2014)
Table A1.3b (Web only). Proportion of the population that has attained tertiary education, by type of programme, age group and gender (2012)
OECD
Australia 10 (†) 9 (†) 9 (†) 11 (†) 10 (†) 9 (†) 28 (†) 34 (†) 33 (†) 29 (†) 24 (†) 23 (†) 38 (†) 44 (†) 42 (†) 40 (†) 35 (†) 32 (†)
Austria 9 (0.27) 6 * (0.44) 5 * (0.42) 9 * (0.42) 10 (0.46) 11 * (0.49) 13 * (0.41) 20 * (0.76) 16 * (0.61) 15 * (0.56) 12 * (0.46) 10 * (0.57) 22 * (0.47) 26 * (0.80) 22 * (0.72) 23 * (0.67) 22 * (0.68) 21 * (0.70)
Belgium 13 * (0.21) 15 * (0.63) 13 * (0.44) 16 * (0.44) 13 * (0.39) 12 * (0.40) 19 * (0.24) 23 * (0.75) 23 * (0.54) 21 * (0.49) 18 * (0.45) 15 * (0.44) 33 * (0.29) 37 * (0.87) 36 * (0.62) 36 * (0.58) 31 * (0.54) 27 * (0.55)
Canada 21 * (0.20) 22 * (0.56) 22 * (0.41) 23 * (0.39) 21 * (0.36) 18 * (0.35) 26 * (0.26) 27 (0.66) 26 (0.49) 30 * (0.49) 24 * (0.42) 24 * (0.45) 47 * (0.27) 49 * (0.73) 48 * (0.53) 53 * (0.51) 45 * (0.45) 42 * (0.48)
Chile 1 6 * (0.11) 6 * (0.32) 6 * (0.21) 6 * (0.22) 6 * (0.20) 4 * (0.20) 12 * (0.15) 17 * (0.49) 16 * (0.33) 12 * (0.30) 10 * (0.27) 11 * (0.33) 18 * (0.18) 23 * (0.55) 22 * (0.37) 19 * (0.35) 16 * (0.32) 15 * (0.38)
Czech Republic x(7) (†) x(8) (†) x(9) (†) x(10) (†) x(11) (†) x(12) (†) 19 * (0.16) 22 * (0.50) 23 * (0.37) 18 * (0.31) 18 * (0.33) 16 * (0.27) 19 * (0.16) 22 * (0.50) 23 * (0.37) 18 * (0.31) 18 * (0.33) 16 * (0.27)
Denmark 6 * (0.14) 6 * (0.45) 5 * (0.30) 7 * (0.30) 6 * (0.24) 5 * (0.25) 24 * (0.24) 28 (0.85) 26 (0.59) 26 * (0.50) 22 * (0.42) 21 * (0.45) 30 (0.26) 34 (0.90) 31 * (0.62) 33 (0.54) 28 (0.45) 26 * (0.48)
Estonia 9 (0.58) 8 (1.43) 10 (1.29) 8 * (1.04) 9 (1.04) 9 (1.13) 20 * (0.79) 20 * (2.20) 20 * (1.64) 19 * (1.61) 18 (1.44) 21 (1.53) 28 * (0.89) 28 * (2.44) 29 * (1.90) 27 * (1.77) 27 (1.64) 31 * (1.73)
Finland 10 * (0.21) 1 * (0.23) 1 * (0.12) 10 (0.45) 15 * (0.48) 13 * (0.44) 23 (0.29) 36 * (0.99) 30 * (0.68) 29 * (0.67) 19 (0.53) 16 * (0.47) 33 * (0.33) 37 (0.99) 31 * (0.68) 39 * (0.72) 35 * (0.64) 29 * (0.59)
France 11 * (0.09) 14 * (0.30) 14 * (0.21) 15 * (0.20) 8 * (0.15) 5 * (0.12) 18 * (0.11) 24 * (0.37) 25 * (0.27) 20 * (0.22) 15 * (0.19) 14 * (0.19) 29 * (0.13) 38 * (0.41) 38 * (0.30) 35 * (0.26) 23 * (0.23) 20 * (0.22)
Germany 12 * (0.08) 10 (0.23) 9 * (0.15) 12 * (0.17) 14 * (0.16) 13 * (0.19) 19 * (0.10) 21 * (0.34) 18 * (0.22) 20 * (0.22) 17 * (0.19) 19 (0.22) 30 (0.13) 31 * (0.41) 27 * (0.27) 32 * (0.27) 31 * (0.25) 32 * (0.29)
Greece 9 (0.12) 10 (0.35) 12 * (0.28) 8 * (0.22) 9 (0.23) 6 * (0.19) 18 * (0.15) 18 * (0.45) 17 * (0.32) 17 * (0.30) 17 * (0.29) 18 (0.31) 27 * (0.18) 28 * (0.53) 30 * (0.39) 26 * (0.34) 27 * (0.34) 25 (0.34)
Hungary n (†) c (†) 1 * (0.08) c (†) c (†) c (†) 19 * (0.15) 24 * (0.45) 24 * (0.33) 18 * (0.28) 16 * (0.28) 16 * (0.27) 19 * (0.15) 24 * (0.45) 25 * (0.34) 18 * (0.28) 16 * (0.28) 16 * (0.27)
Iceland 2 * (0.22) c (†) c (†) c (†) c (†) c (†) 27 * (0.66) 32 * (1.76) 28 (1.27) 29 * (1.36) 27 * (1.31) 23 * (1.34) 29 (0.68) 32 (1.76) 28 * (1.27) 29 * (1.36) 27 (1.31) 23 (1.34)
Ireland 12 * (0.14) 15 * (0.38) 13 * (0.28) 15 * (0.27) 12 * (0.27) 8 * (0.25) 24 * (0.18) 29 * (0.49) 29 * (0.37) 27 * (0.34) 19 * (0.33) 16 * (0.34) 36 * (0.20) 44 * (0.53) 43 * (0.40) 43 * (0.38) 31 * (0.38) 24 * (0.40)
Israel 13 (†) 13 (†) 11 (†) 14 (†) 13 (†) 15 (†) 29 (†) 31 (†) 25 (†) 33 (†) 29 (†) 30 (†) 42 (†) 44 (†) 36 (†) 47 (†) 43 (†) 45 (†)
Italy n (†) n (†) n (†) n (†) n (†) n (†) 14 * (0.11) 17 * (0.38) 17 * (0.28) 15 * (0.22) 11 * (0.20) 11 * (0.23) 14 * (0.11) 17 * (0.39) 17 * (0.28) 15 * (0.22) 11 * (0.21) 11 * (0.23)
Japan 11 (†) m (†) 15 (†) 14 (†) 9 (†) 6 (†) 36 (†) m (†) 41 (†) 35 (†) 38 (†) 30 (†) 47 (†) m (†) 56 (†) 49 (†) 47 (†) 36 (†)
Korea 13 (†) 23 (†) 23 (†) 16 (†) 7 (†) 3 (†) 33 (†) 42 (†) 39 (†) 41 (†) 31 (†) 16 (†) 46 (†) 66 (†) 62 (†) 57 (†) 38 (†) 19 (†)
Luxembourg 12 * (0.36) 10 (1.00) 12 * (0.75) 14 * (0.76) 12 * (0.68) 10 (0.66) 30 * (0.50) 41 * (1.67) 36 * (1.13) 34 * (1.04) 24 * (0.88) 22 * (0.92) 42 * (0.54) 50 * (1.69) 48 * (1.17) 48 * (1.09) 37 * (0.99) 32 * (1.03)
Mexico 1 (†) 1 (†) 1 (†) 1 (†) 1 (†) 1 (†) 19 (†) 21 (†) 23 (†) 16 (†) 19 (†) 17 (†) 20 (†) 21 (†) 24 (†) 17 (†) 20 (†) 18 (†)
Netherlands 3 * (0.05) 3 * (0.15) 2 * (0.10) 3 * (0.10) 3 * (0.09) 3 * (0.09) 33 * (0.14) 39 * (0.46) 37 * (0.32) 34 * (0.28) 31 * (0.24) 30 * (0.26) 36 * (0.14) 41 * (0.47) 39 * (0.33) 37 * (0.29) 34 * (0.25) 33 * (0.27)
New Zealand 13 * (0.41) 13 * (1.23) 13 * (0.89) 12 * (0.79) 13 * (0.78) 12 * (0.81) 23 (0.51) 30 (1.69) 28 (1.18) 25 (1.04) 20 (0.92) 18 (0.96) 36 * (0.59) 43 * (1.82) 41 * (1.30) 38 * (1.16) 33 * (1.08) 31 * (1.14)
Norw ay 3 * (0.10) c (†) c (†) 2 * (0.17) 4 * (0.22) 6 * (0.28) 31 * (0.28) 38 * (0.88) 36 * (0.62) 35 * (0.56) 28 * (0.53) 24 * (0.52) 34 * (0.29) 38 * (0.88) 36 * (0.62) 37 * (0.56) 31 * (0.55) 30 * (0.55)
Poland x(7) (†) x(8) (†) x(9) (†) x(10) (†) x(11) (†) x(12) (†) 20 * (0.12) 32 * (0.40) 32 * (0.28) 22 * (0.26) 13 * (0.20) 12 * (0.19) 20 * (0.12) 32 * (0.40) 32 * (0.28) 22 * (0.26) 13 * (0.20) 12 * (0.19)
Portugal x(7) (†) x(8) (†) x(9) (†) x(10) (†) x(11) (†) x(12) (†) 16 * (0.18) 24 * (0.68) 23 * (0.48) 16 * (0.37) 11 * (0.30) 11 * (0.30) 16 * (0.18) 24 * (0.68) 23 * (0.48) 16 * (0.37) 11 * (0.30) 11 * (0.30)
Slovak Republic 1 * (0.11) 1 * (0.35) 1 * (0.09) 1 * (0.21) 1 * (0.22) 1 * (0.24) 16 * (0.43) 18 * (1.32) 21 * (0.96) 14 * (0.88) 14 * (0.79) 14 * (0.80) 17 * (0.44) 19 * (1.35) 21 * (0.97) 15 * (0.90) 14 * (0.81) 15 * (0.82)
Slovenia 9 (0.17) 12 * (0.57) 10 (0.37) 10 (0.37) 8 * (0.33) 8 * (0.32) 12 * (0.20) 18 * (0.67) 15 * (0.45) 13 * (0.42) 11 * (0.37) 9 * (0.33) 21 * (0.25) 29 * (0.80) 25 * (0.54) 23 * (0.52) 19 * (0.47) 17 * (0.44)
Spain 11 * (0.07) 14 * (0.24) 14 * (0.17) 12 * (0.15) 10 * (0.13) 6 * (0.12) 20 * (0.09) 21 * (0.28) 21 * (0.21) 23 * (0.19) 19 * (0.17) 16 * (0.18) 31 * (0.11) 35 (0.33) 34 (0.24) 35 * (0.21) 29 * (0.20) 22 * (0.20)
Sw eden 8 * (0.09) 9 (0.29) 9 (0.20) 8 * (0.18) 6 * (0.16) 6 * (0.16) 23 (0.14) 33 * (0.46) 28 * (0.31) 26 * (0.29) 18 * (0.25) 18 * (0.25) 30 (0.15) 42 * (0.49) 37 * (0.33) 34 * (0.31) 25 * (0.28) 24 * (0.27)
Sw itzerland 14 * (0.19) 12 * (0.53) 10 (0.39) 16 * (0.36) 16 * (0.37) 13 * (0.37) 29 * (0.25) 35 * (0.82) 31 * (0.64) 33 * (0.47) 27 * (0.44) 24 * (0.46) 43 * (0.28) 47 * (0.84) 41 * (0.68) 48 * (0.50) 43 * (0.49) 37 * (0.52)
Turkey x(7) (†) x(8) (†) x(9) (†) x(10) (†) x(11) (†) x(12) (†) 17 * (0.11) 20 * (0.29) 22 * (0.22) 17 * (0.20) 12 * (0.18) 12 * (0.22) 17 * (0.11) 20 * (0.29) 22 * (0.22) 17 * (0.20) 12 * (0.18) 12 * (0.22)
United Kingdom 9 (0.09) 8 * (0.24) 8 * (0.18) 10 * (0.18) 10 * (0.18) 10 (0.19) 31 * (0.14) 39 * (0.45) 38 * (0.33) 35 * (0.29) 26 * (0.26) 24 * (0.27) 40 * (0.15) 47 * (0.46) 46 * (0.34) 45 * (0.30) 37 * (0.29) 33 * (0.30)
United States 9 (0.15) 10 (0.42) 9 (0.28) 9 * (0.30) 9 (0.32) 9 (0.33) 32 * (0.28) 32 * (0.70) 31 * (0.58) 33 * (0.50) 30 * (0.49) 33 * (0.53) 41 * (0.30) 41 * (0.78) 40 * (0.58) 42 * (0.54) 40 * (0.56) 42 * (0.57)
OECD average 9 (0.05) 10 (0.13) 10 (0.10) 10 (0.09) 10 (0.09) 8 (0.09) 23 (0.06) 27 (0.17) 26 (0.12) 24 (0.11) 20 (0.10) 19 (0.11) 30 (0.06) 35 (0.18) 34 (0.13) 33 (0.12) 28 (0.11) 25 (0.12)
EU21 average 9 (0.05) 9 (0.14) 8 (0.11) 10 (0.10) 9 (0.10) 8 (0.10) 20 (0.06) 26 (0.19) 25 -(0.13) 22 (0.12) 18 (0.11) 17 (0.11) 27 (0.07) 33 (0.20) 31 (0.15) 30 (0.14) 25 (0.13) 23 (0.13)
Partners
Argentina 2 m (†) m (†) m (†) m (†) m (†) m (†) m (†) m (†) m (†) m (†) m (†) m (†) 12 (†) m (†) m (†) m (†) m (†) m (†)
Brazil x(7) (†) x(8) (†) x(9) (†) x(10) (†) x(11) (†) x(12) (†) 11 (†) 13 (†) 12 (†) 11 (†) 11 (†) 10 (†) 11 (†) 13 (†) 12 (†) 11 (†) 11 (†) 10 (†)
China 3 m (†) m (†) m (†) m (†) m (†) m (†) m (†) m (†) m (†) m (†) m (†) m (†) 4 (†) m (†) m (†) m (†) m (†) m (†)
Colombia 1 m (†) m (†) m (†) m (†) m (†) m (†) m (†) m (†) m (†) m (†) m (†) m (†) 19 (†) m (†) m (†) m (†) m (†) m (†)
India m (†) m (†) m (†) m (†) m (†) m (†) m (†) m (†) m (†) m (†) m (†) m (†) m (†) m (†) m (†) m (†) m (†) m (†)
Indonesia 1 m (†) m (†) m (†) m (†) m (†) m (†) m (†) m (†) m (†) m (†) m (†) m (†) 8 (†) m (†) m (†) m (†) m (†) m (†)
Latvia 1 (0.13) 2 (0.52) 3 (0.45) 1 (0.24) c (†) c (†) 20 (0.51) 24 (1.67) 24 (1.22) 19 (0.95) 19 (0.92) 19 (1.06) 21 (0.52) 26 (1.71) 26 (1.26) 20 (0.97) 19 (0.92) 19 (1.06)
Russian Federation 21 (†) 19 (†) 19 (†) 21 (†) 21 (†) 21 (†) 25 (†) 30 (†) 31 (†) 25 (†) 22 (†) 21 (†) 46 (†) 48 (†) 50 (†) 46 (†) 43 (†) 42
Saudi Arabia 4 m (†) m (†) m (†) m (†) m (†) m (†) m (†) m (†) m (†) m (†) m (†) m (†) 21 (†) m (†) m (†) m (†) m (†) m (†)
South Africa m (†) m (†) m (†) m (†) m (†) m (†) m (†) m (†) m (†) m (†) m (†) m (†) 7 (†) m (†) m (†) m (†) m (†) m (†)
G20 average m (†) m (†) m (†) m (†) m (†) m (†) m (†) m (†) m (†) m (†) m (†) m (†) 27 (†) m (†) m (†) m (†) m (†) m (†)
1. Year of reference 2011.
2. Year of reference 2003.
3. Year of reference 2010.
4. Year of reference 2013.
Sources: OECD. Argentina, China, Colombia, India, Indonesia, Saudi Arabia, South Africa: UNESCO Institute for Statistics. Latvia: Eurostat. See Annex 3 for notes (www.oecd.org/edu/eag.htm ).
Please refer to the Reader's Guide for information concerning the symbols replacing missing data and the “r” symbol next to some figures.
No
tes
Men
Tertiary-type B Tertiary-type A or advanced research programmes Total tertiary
55-64 25-64 30-34 25-34 35-44 45-54 55-64 25-64 30-34 25-34 35-44 45-54 25-64 30-34 25-34 35-44 45-54 55-64
(12)(1) (2) (3) (4) (5) (6) (7) (8) (9) (10) (11) (13) (14) (15) (16) (17) (18)

21
Table 8 (cont.): Standard errors for Table A1.3b for the year 2012 (EAG 2014)
Table A1.3b (Web only). Proportion of the population that has attained tertiary education, by type of programme, age group and gender (2012)
OECD
Australia 13 (†) 12 (†) 12 (†) 15 (†) 14 (†) 11 (†) 32 (†) 42 (†) 40 (†) 35 (†) 26 (†) 23 (†) 45 (†) 54 (†) 53 (†) 50 (†) 40 (†) 34 (†)
Austria 6 * (0.27) 6 * (0.44) 5 * (0.34) 5 * (0.35) 6 * (0.33) 7 * (0.35) 12 * (0.41) 20 * (0.76) 19 * (0.69) 14 * (0.62) 9 * (0.37) 6 * (0.45) 18 * (0.46) 27 * (0.80) 25 * (0.71) 20 * (0.65) 15 * (0.45) 13 * (0.58)
Belgium 20 * (0.24) 25 * (0.76) 23 * (0.53) 24 * (0.51) 20 * (0.46) 15 * (0.43) 17 * (0.23) 26 * (0.77) 27 * (0.56) 21 * (0.49) 14 * (0.39) 9 * (0.34) 38 * (0.29) 51 * (0.88) 50 * (0.63) 44 * (0.60) 34 * (0.54) 24 (0.51)
Canada 29 * (0.22) 30 * (0.63) 29 * (0.45) 30 * (0.43) 30 * (0.39) 26 * (0.39) 29 * (0.25) 37 * (0.70) 37 * (0.50) 35 * (0.49) 24 * (0.40) 21 * (0.40) 58 * (0.25) 67 * (0.62) 66 * (0.46) 65 * (0.46) 54 * (0.44) 47 * (0.46)
Chile 1 6 * (0.10) 6 * (0.31) 6 * (0.21) 8 * (0.22) 6 * (0.20) 4 * (0.18) 12 * (0.14) 17 * (0.47) 17 * (0.33) 12 * (0.27) 9 * (0.24) 8 * (0.27) 18 * (0.17) 23 * (0.53) 23 * (0.37) 19 * (0.34) 15 * (0.30) 12 * (0.31)
Czech Republic x(25) (†) x(26) (†) x(27) (†) x(28) (†) x(29) (†) x(30) (†) 20 * (0.16) 29 * (0.53) 33 * (0.41) 19 * (0.30) 17 * (0.30) 10 * (0.21) 20 * (0.16) 29 * (0.53) 33 * (0.41) 19 * (0.30) 17 * (0.30) 10 * (0.21)
Denmark 5 * (0.12) 6 * (0.43) 5 * (0.29) 5 * (0.24) 5 * (0.21) 4 * (0.22) 35 * (0.26) 47 * (0.90) 44 * (0.65) 39 * (0.52) 32 * (0.45) 26 * (0.47) 40 * (0.27) 53 * (0.90) 50 * (0.65) 44 * (0.53) 36 * (0.47) 31 * (0.50)
Estonia 16 * (0.65) 17 * (2.04) 16 * (1.45) 16 * (1.22) 17 * (1.27) 14 * (1.23) 29 * (0.84) 33 (2.53) 34 (1.88) 29 (1.67) 29 * (1.60) 25 * (1.54) 45 * (0.89) 50 * (2.67) 51 * (1.96) 45 * (1.74) 46 * (1.72) 39 * (1.71)
Finland 17 * (0.26) 2 * (0.30) 1 * (0.15) 19 * (0.57) 26 * (0.58) 20 * (0.51) 29 * (0.31) 53 * (1.04) 48 * (0.75) 37 * (0.70) 22 * (0.54) 14 * (0.45) 46 * (0.34) 55 * (1.04) 49 * (0.75) 56 * (0.72) 48 * (0.66) 34 * (0.61)
France 13 * (0.09) 20 * (0.33) 18 * (0.23) 16 * (0.20) 11 * (0.16) 8 * (0.14) 19 * (0.11) 29 * (0.37) 29 * (0.27) 24 * (0.23) 14 * (0.18) 12 * (0.17) 33 * (0.13) 49 * (0.41) 47 * (0.30) 40 * (0.26) 25 * (0.22) 19 * (0.21)
Germany 10 * (0.08) 10 * (0.24) 10 * (0.17) 10 * (0.16) 11 (0.15) 9 * (0.15) 15 * (0.09) 23 * (0.35) 21 * (0.24) 17 * (0.21) 13 * (0.16) 12 * (0.17) 26 * (0.12) 33 * (0.42) 31 * (0.29) 27 * (0.26) 24 * (0.22) 21 * (0.23)
Greece 8 * (0.11) 12 (0.38) 15 * (0.31) 8 * (0.21) 7 * (0.19) 4 * (0.15) 18 * (0.15) 22 * (0.49) 25 * (0.38) 21 * (0.31) 15 * (0.27) 11 * (0.24) 27 * (0.17) 35 * (0.55) 40 * (0.42) 29 * (0.34) 22 * (0.31) 16 * (0.28)
Hungary 1 * (0.04) c (†) 2 * (0.11) 1 * (0.08) c (†) c (†) 24 * (0.15) 34 (0.52) 35 (0.38) 25 * (0.31) 22 * (0.31) 15 (0.23) 25 * (0.16) 34 * (0.52) 36 * (0.39) 26 * (0.32) 22 * (0.31) 15 * (0.23)
Iceland 6 * (0.35) c (†) c (†) 7 * (0.77) 7 * (0.71) 7 * (0.85) 36 * (0.71) 49 * (2.02) 44 * (1.42) 45 * (1.48) 32 * (1.34) 18 * (1.27) 41 * (0.74) 49 * (2.02) 44 (1.42) 52 * (1.49) 39 * (1.40) 25 (1.43)
Ireland 17 * (0.15) 20 * (0.42) 18 * (0.30) 20 * (0.29) 15 * (0.29) 12 * (0.30) 26 * (0.18) 38 * (0.50) 37 * (0.37) 29 * (0.33) 19 * (0.32) 13 * (0.31) 43 * (0.20) 58 * (0.51) 55 * (0.38) 49 * (0.37) 34 * (0.39) 26 * (0.40)
Israel 15 (†) 13 (†) 13 (†) 15 (†) 16 (†) 18 (†) 36 (†) 45 (†) 41 (†) 38 (†) 31 (†) 30 (†) 51 (†) 58 (†) 53 (†) 53 (†) 47 (†) 48 (†)
Italy n (†) n (†) n (†) n (†) 1 * (0.03) n (†) 17 * (0.12) 26 * (0.47) 27 * (0.34) 19 * (0.25) 12 * (0.21) 11 * (0.22) 17 * (0.12) 26 * (0.47) 27 * (0.34) 19 * (0.25) 13 * (0.21) 11 * (0.22)
Japan 29 (†) m (†) 32 (†) 36 (†) 31 (†) 19 (†) 17 (†) m (†) 30 (†) 18 (†) 14 (†) 9 (†) 46 (†) m (†) 61 (†) 54 (†) 45 (†) 28 (†)
Korea 14 (†) 27 (†) 29 (†) 17 (†) 5 (†) 2 (†) 24 (†) 38 (†) 40 (†) 30 (†) 15 (†) 6 (†) 38 (†) 65 (†) 69 (†) 48 (†) 20 (†) 8 (†)
Luxembourg 14 * (0.35) 14 (1.13) 17 * (0.88) 16 * (0.77) 12 (0.60) 10 (0.57) 22 * (0.42) 35 (1.56) 35 (1.13) 25 * (0.91) 15 * (0.67) 11 * (0.60) 36 * (0.49) 49 * (1.64) 52 * (1.18) 42 * (1.03) 27 * (0.83) 21 * (0.77)
Mexico 1 (†) 1 (†) 2 (†) 1 (†) 2 (†) 1 (†) 15 (†) 20 (†) 22 (†) 14 (†) 12 (†) 7 (†) 16 (†) 21 (†) 24 (†) 15 (†) 13 (†) 8 (†)
Netherlands 3 * (0.05) 3 * (0.16) 3 * (0.11) 4 * (0.10) 3 * (0.08) 2 * (0.08) 31 * (0.13) 43 * (0.45) 44 * (0.32) 34 * (0.27) 25 * (0.22) 21 * (0.24) 33 * (0.13) 46 * (0.45) 47 * (0.32) 37 * (0.27) 28 * (0.22) 23 (0.24)
New Zealand 18 * (0.43) 15 * (1.21) 15 * (0.87) 16 * (0.82) 19 * (0.84) 21 * (0.95) 27 * (0.51) 37 (1.63) 37 * (1.18) 30 * (1.01) 23 * (0.91) 18 * (0.89) 45 * (0.57) 53 * (1.68) 52 * (1.22) 47 * (1.10) 42 * (1.07) 39 * (1.14)
Norw ay 2 * (0.08) c (†) c (†) 3 * (0.18) 2 * (0.17) c (†) 42 * (0.30) 56 * (0.91) 53 * (0.66) 48 * (0.59) 36 * (0.56) 29 * (0.55) 43 * (0.30) 56 * (0.91) 53 * (0.66) 50 * (0.59) 38 * (0.57) 29 * (0.55)
Poland x(25) (†) x(26) (†) x(27) (†) x(28) (†) x(29) (†) x(30) (†) 29 * (0.13) 47 * (0.43) 50 * (0.31) 31 * (0.28) 20 (0.23) 13 * (0.18) 29 * (0.13) 47 * (0.43) 50 * (0.31) 31 * (0.28) 20 * (0.23) 13 * (0.18)
Portugal x(25) (†) x(26) (†) x(27) (†) x(28) (†) x(29) (†) x(30) (†) 21 * (0.19) 30 * (0.72) 33 (0.53) 25 * (0.41) 16 * (0.32) 11 * (0.28) 21 * (0.19) 30 * (0.72) 33 * (0.53) 25 * (0.41) 16 * (0.32) 11 * (0.28)
Slovak Republic 2 * (0.15) 2 * (0.49) 2 * (0.45) 2 * (0.32) 2 * (0.32) 2 * (0.27) 19 * (0.46) 26 * (1.58) 31 * (1.18) 18 * (0.91) 16 * (0.82) 11 * (0.67) 21 * (0.47) 28 * (1.62) 33 * (1.19) 20 * (0.95) 18 * (0.86) 13 * (0.71)
Slovenia 14 * (0.21) 18 * (0.70) 18 * (0.49) 16 * (0.44) 14 * (0.40) 10 (0.32) 18 * (0.22) 31 * (0.84) 28 * (0.58) 23 * (0.51) 13 * (0.38) 7 * (0.28) 32 * (0.27) 50 * (0.91) 46 (0.64) 38 (0.59) 27 * (0.51) 18 * (0.41)
Spain 8 * (0.06) 12 (0.23) 12 * (0.16) 12 * (0.14) 6 * (0.10) 3 * (0.07) 25 * (0.10) 33 * (0.32) 33 * (0.24) 30 * (0.20) 22 * (0.18) 13 * (0.16) 34 * (0.11) 45 * (0.34) 44 (0.25) 42 * (0.21) 28 * (0.19) 16 * (0.17)
Sw eden 11 * (0.10) 8 * (0.26) 9 * (0.20) 9 * (0.18) 12 (0.21) 13 * (0.21) 31 * (0.15) 46 * (0.48) 41 * (0.34) 37 * (0.31) 25 * (0.28) 20 * (0.25) 41 * (0.16) 54 * (0.48) 50 * (0.35) 46 * (0.32) 36 * (0.31) 33 * (0.30)
Sw itzerland 8 * (0.14) 8 * (0.43) 8 * (0.32) 9 * (0.27) 8 * (0.25) 6 * (0.22) 23 * (0.22) 32 * (0.73) 32 * (0.59) 25 * (0.40) 19 * (0.37) 14 (0.34) 30 * (0.24) 40 * (0.76) 40 * (0.61) 34 * (0.44) 27 * (0.42) 20 * (0.39)
Turkey x(25) (†) x(26) (†) x(27) (†) x(28) (†) x(29) (†) x(30) (†) 13 * (0.09) 18 * (0.26) 20 * (0.20) 12 * (0.17) 8 * (0.15) 7 * (0.17) 13 * (0.09) 18 * (0.26) 20 * (0.20) 12 * (0.17) 8 * (0.15) 7 * (0.17)
United Kingdom 11 * (0.09) 9 * (0.25) 8 * (0.17) 11 * (0.18) 12 * (0.19) 11 * (0.19) 31 * (0.14) 44 * (0.42) 42 * (0.30) 35 * (0.28) 25 * (0.25) 21 * (0.25) 42 * (0.15) 53 * (0.42) 50 * (0.31) 46 * (0.29) 38 * (0.28) 32 * (0.28)
United States 12 (0.17) 11 * (0.43) 11 * (0.33) 12 (0.34) 11 (0.31) 12 * (0.39) 34 * (0.26) 38 * (0.68) 38 * (0.49) 37 * (0.48) 31 * (0.49) 30 * (0.53) 45 * (0.29) 49 * (0.66) 48 * (0.47) 49 * (0.49) 42 * (0.49) 41 * (0.60)
OECD average 11 (0.05) 12 (0.15) 13 (0.11) 13 (0.10) 11 (0.10) 10 (0.10) 24 (0.06) 35 (0.18) 34 (0.13) 27 (0.12) 20 (0.10) 15 (0.10) 34 (0.06) 44 (0.19) 44 (0.14) 38 (0.12) 30 (0.11) 23 (0.11)
EU21 average 10 (0.06) 12 (0.18) 11 (0.12) 11 (0.11) 11 (0.11) 9 (0.11) 23 (0.06) 34 (0.20) 34 (0.15) 26 (0.13) 19 (0.11) 14 (0.10) 32 (0.07) 43 (0.21) 43 (0.16) 36 (0.14) 27 (0.12) 21 (0.12)
Partners
Argentina 2 m (†) m (†) m (†) m (†) m (†) m (†) m (†) m (†) m (†) m (†) m (†) m (†) 15 (†) m (†) m (†) m (†) m (†) m (†)
Brazil x(25) (†) x(26) (†) x(27) (†) x(28) (†) x(29) (†) x(30) (†) 15 (†) 17 (†) 17 (†) 15 (†) 15 (†) 11 (†) 15 (†) 17 (†) 17 (†) 15 (†) 15 (†) 11 (†)
China 3 m (†) m (†) m (†) m (†) m (†) m (†) m (†) m (†) m (†) m (†) m (†) m (†) 3 (†) m (†) m (†) m (†) m (†) m (†)
Colombia 1 m (†) m (†) m (†) m (†) m (†) m (†) m (†) m (†) m (†) m (†) m (†) m (†) 20 (†) m (†) m (†) m (†) m (†) m (†)
India m (†) m (†) m (†) m (†) m (†) m (†) m (†) m (†) m (†) m (†) m (†) m (†) m (†) m (†) m (†) m (†) m (†) m (†)
Indonesia 1 m (†) m (†) m (†) m (†) m (†) m (†) m (†) m (†) m (†) m (†) m (†) m (†) 8 (†) m (†) m (†) m (†) m (†) m (†)
Latvia 2 (0.16) 2 (0.45) 3 (0.46) 2 (0.34) 1 (0.24) 1 (0.23) 35 (0.57) 46 (1.77) 48 (1.34) 35 (1.08) 32 (1.03) 24 (1.12) 36 (0.58) 48 (1.77) 51 (1.34) 37 (1.09) 34 (1.04) 25 (1.13)
Russian Federation 30 (†) 25 (†) 24 (†) 30 (†) 34 (†) 34 (†) 30 (†) 38 (†) 40 (†) 32 (†) 26 (†) 21 (†) 60 (†) 63 (†) 64 (†) 63 (†) 60 (†) 55 (†)
Saudi Arabia 4 m (†) m (†) m (†) m (†) m (†) m (†) m (†) m (†) m (†) m (†) m (†) m (†) 21 (†) m (†) m (†) m (†) m (†) m (†)
South Africa m (†) m (†) m (†) m (†) m (†) m (†) m (†) m (†) m (†) m (†) m (†) m (†) 6 (†) m (†) m (†) m (†) m (†) m (†)
G20 average m m m m m m m m m m m m 28 m m m m m
1. Year of reference 2011.
2. Year of reference 2003.
3. Year of reference 2010.
4. Year of reference 2013.
Sources: OECD. Argentina, China, Colombia, India, Indonesia, Saudi Arabia, South Africa: UNESCO Institute for Statistics. Latvia: Eurostat. See Annex 3 for notes (www.oecd.org/edu/eag.htm ).
Please refer to the Reader's Guide for information concerning the symbols replacing missing data and the “r” symbol next to some figures.
No
tes
Women
Tertiary-type B Tertiary-type A or advanced research programmes Total tertiary
55-64 25-64 30-34 25-34 35-44 45-54 55-64 25-64 30-34 25-34 35-44 45-54 55-64 25-64 30-34 25-34 35-44 45-54
(24)(19) (20) (21) (22) (23) (36)(25) (26) (27) (28) (29) (30) (31) (32) (33) (34) (35)

22
Tables A1.6a-A1.9b : PIAAC
Sources and Methodology All data on PIAAC proficiency levels and mean scores in Tables A1.6a-A1.9b are based on the Survey of Adult Skills (PIAAC) 2012. PIAAC is the OECD Programme for the International Assessment of Adult Competencies. For more information on PIAAC please consult http://www.oecd.org/site/piaac/
The literacy and numeracy proficiency levels are based on a 500-point scale. Each level has been defined by particular score-point ranges. Six levels are defined for literacy and numeracy (Levels 1 through 5 plus below Level 1) which are grouped in four proficiency levels in Education at a Glance: Level 1 or below - all scores below 226 points, Level 2 - scores from 226 points to less than 276 points, Level 3 - scores from 276 points to less than 326 points, Level 4 or 5 - scores from 326 points and higher.
This indicator presents the educational attainment levels divided in three groups (Below upper secondary education, Upper secondary or post-secondary non-tertiary education and Tertiary education), the age group 25-64 year-olds (variable AGE_R), the distinction male and female (variable GENDER_R), the 10-year age groups (variable AGEG10LFS), and the distinction for upper secondary education between general and vocational programmes (variable VET: Respondent's highest level of education obtained is vocationally oriented (ISCED-97 levels 3 and 4 only). In addition, the percentiles 5, 10, 25, 50, 75, 90, 95 are calculated.
The variable used in the Box A1.2 on Adults’ skills and readiness to use information and communication technologies (ICT) for problem solving is the derived variable called PBROUTE dividing people according to their route in assessment (people with no computer experience, people failed in ICT core, people who refused to take part in computer-based assessment, people who took computer-based assessment), plausible values for problem-solving in technology-rich environment (variables PVPSL1-PVPSL10), index of use of ICT skills at home – variable derived from self-assessed frequency of using 7 computer and/or internet-related activities at home (variable ICTHOME, mean score for the variable is 2 and standard deviation 1). For salary variable EARNMTHALLPPP (monthly earnings including bonuses for wage and salary earners and self-employed, per purchasing power parity --or PPP-- corrected $USD) with min and max 1% excluded was used. In regression analysis also age (variable AGE_R) and the highest level of education in three groups (Below upper secondary education, Upper secondary or post-secondary non-tertiary education and Tertiary education) were used, the regression analysis is calculated only for 25-64 year-olds and was used for figure 3 to control for age and educational attainment.
The problem-solving proficiency scale was divided into four levels: Below Level 1 – scores below 241 points, Level 1 – scores from 241 point to less than 291 points, Level 2 – scores from 291 points to less than 341 points, and Level 3 – score equal or higher than 341 points.
Back_to_Table1

23
INDICATOR A2: How many students are expected to complete upper secondary education?
A2 A2.1a/b A2.1a/b A2.c. A2.5-6
Methodology Summary of upper secondary
programme completion requirements (ISCED 3)
Methodology Methodology
Argentina
Austria AUT AUT
Belgium BEL BEL
Brazil BRA
Canada CAN
Chile CHL CHL
China
Colombia
Czech Republic CZE CZE
Denmark DNK DNK
Estonia EST
Finland FIN
France FRA FRA
Germany DEU DEU Greece GRC GRC GRC
Hungary HUN HUN
Iceland ISL ISL
India
Indonesia
Ireland IRL IRL
Israel ISR ISR ISR
Italy ITA
Japan JPN
Korea KOR
Latvia
Luxembourg LUX LUX Mexico MEX
Netherlands NLD NLD
New Zealand NZL NZL
Norway NOR NOR
Poland POL POL
Portugal
Russian Federation
Saudi Arabia
Slovak Republic SVK SVK SVK
Slovenia SVN
South Africa
Spain ESP ESP
Sweden SWE SWE
Switzerland CHE
Turkey TUR TUR TUR
United Kingdom UKM UKM
United States USA USA

24
Tables A2.1a/b : Upper secondary graduation rates
Methodology In order to calculate gross graduation rates, countries identified the age at which graduation typically occurs. The graduates themselves, however, could be of any age. To estimate gross graduation rates, the number of graduates is divided by the population at the typical graduation age (Annex 1).
In many countries, defining a typical age of graduation is difficult because the ages of graduates vary so much. The typical age refers to the age of the students at the beginning of the school year; students will generally be one year older than the age indicated when they graduate at the end of the school year. Typical ages of graduation and graduation rate calculation methods are shown in Annex 1 of this publication.
The unduplicated count of all ISCED 3 graduates gives the number of persons who graduate in the reference period from any ISCED 3 programme for the first time, i.e. students who have not obtained an ISCED 3 (A, B or C) qualification in previous reference periods. For example, students who graduated from ISCED 3A programmes in the period of reference, but obtained a short ISCED 3C graduation in an earlier year, should (correctly) be reported as ISCED 3A graduates, but must be excluded from the unduplicated count of graduates in column 1 of Table A2.1. Similar cases may occur in the reporting of vocational and general programmes.
Upper secondary graduation rates for general or for pre-vocational/vocational programmes are based on all graduates, not first-time graduates. Back_to_Table1
Notes on specific countries Austria: Upper secondary graduation rates do not take into account ISCED 4A programmes (Berufsbildende Höhere Schule) that span ISCED levels 3A and 4A. Graduates of these programmes were not counted as ISCED 3A graduates; therefore upper secondary graduation rates are underestimated. Back_to_Table1
Belgium: Data on the German-speaking Community and for independent private institutions are not integrated in the data for Belgium in the UOE data collection. Data on graduates are not available for special education. Back_to_Table1
Brazil: Data includes Youth and Adult Education Programmes (EJA), Special Education Programmes and distance-learning programmes (higher education programmes). For ISCED 3, only the total number of graduates has been provided given that the classification (fields of education) adopted by Brazil is not aligned with ISCED 97. Back_to_Table1
Chile: From 2010 (UOE 2011 data collection), the adult education programmes have been included. The trend data series have been updated accordingly from 2004. Back_to_Table1
Czech Republic: Upper graduation rate in 2010 is underestimated by about 3-4 percentage points because of changing data collection methodology (especially in vocational programmes). From the 2013 edition of Education at a Glance, the Age structure at ISCED 3 level and ISCED 4 level is (partially) available now due to the new method of data collection (collecting individual data). Also number of foreign graduates is now available for ISCED 3. Back_to_Table1
France: In the UOE 2007 data collection, students who graduated at ISCED 3 pre-vocational programmes are represented under ISCED 3 general programmes. In France, all – or almost all – ISCED 3B students are already ISCED 3C graduates. In the UOE 2010 data collection, all the trend data have been revised. Between 2010 and 2011, the sharp increase of graduation rate at ISCED 3B is due to the reform of the upper secondary vocational path that started in 2008. Back_to_Table1
Germany: For Gymnasium in most German Länder, an educational reform took place that reduced the length of study for the university entrance qualification (Abitur) from nine to eight years (after four years in primary school). This reform is known as the G8. As a result, the Gymnasium curriculum was restructured and afternoon classes were introduced. The introduction stage (Einführungsphase - E1) in grade 10 of the G8-Gymnasium is now allocated to upper secondary education. But in most Länder the "classical" G9-Gymnasium still exists besides G8. For these G9-Gymnasium grade 10 is still reported in lower secondary education. According to the ongoing process (depending on the number of the Länder concerned and the starting year of the reform in each Land), the number of students in grade E1 will increase in the next years. As a result (depending on the starting year in each Land) there will be double graduation years in the Länder. This means that the last volume of G9-Gymnasium (which had been reformed to G8) and the first volume of G8-Gymnasium achieve their Abitur (university entrance qualification) in the same year. This is a one-time effect in each Land introducing G8-Gymnasium, but the relevant year differs from Land to Land.

25
Vocational programmes in the Federal Länder: An important achievement of the project "database of the vocational programmes in the Federal Länder" is the detailed analysis of all programmes at vocational schools in the Federal Länder by content of the programme, main diplomas, credentials and certifications awarded. The analysis was based on information comparable to the ISCED-Mapping which had been collected for each programme. The main result of this project is a consistent classification of education programmes, pathways and sectors for all national and international purposes. Programmes at vocational schools which offer only lower secondary general qualifications or which have only pre-vocational content are now allocated to ISCED 2A or 2B, respectively. These changes mainly refer to Berufsfachschulen (of which there are more than 50 different types in the Federal Länder) and those students at Berufsschulen who have no contract in the dual system (full-time students). In the German Educational Report, the whole sector is identified as the transition system: preparatory vocational training, vocational education in training programmes not leading to a recognised qualification, practice placement or partial qualification. Until 2008, programmes at Berufsfachschulen aimed at qualifying Kindergarten teachers and school-based vocational education for medical assistants, nurses, midwives or social assistants had been allocated to ISCED 3B while the respective programmes at health-sector schools, or Fachschulen, had been allocated to ISCED 5B. Now all these programmes, regardless of the type of school, are allocated to ISCED 5B. Back_to_Table1
Hungary: First-time graduates are estimated. The main reason for the decrease in the number of graduates from vocational programmes in 2007 is an increase from one to two years in the duration of vocational programmes in many of professions. This explains why there are no graduates in these professions for this particular year, yet an increase in the graduation figure in 2008. Furthermore, in 2004 a new programme (3AG programmes with a language preparatory grade) was introduced. This programme’s duration is five years (the typical duration at 3A level is four years), therefore students in this programme will graduate in 2009 instead of 2008. The increase in upper secondary graduation rates for ISCED 3 general programmes and the decrease in graduation rates for ISCED 3 pre-vocational/vocational programmes in 2004 are due to the change in the ISCED classification of the vocational secondary school programmes. Previously they were classified as ISCED 3A pre-vocational programmes, but the proportion of vocational subjects has dropped below 25% in recent years. Therefore, these programmes have been reclassified as ISCED 3A general programmes in the revised UOE questionnaire. At the same time, in Grades 9 and 10 of the vocational school, the proportion of vocational (or rather pre-vocational) subjects was raised somewhat above 25% of the total instruction time. Therefore, this programme (formerly classified as 3C general) was reclassified as ISCED 3C pre-vocational. Graduation rates for 2000 are “missing” because that year’s statistics cannot be compared to those of subsequent years. The structure of upper secondary education changed in such a way that a large part of vocational training was elevated to the post-secondary level, while in former years vocational secondary schools’ programme were changed from ISCED 3B to ISCED 3A. In the transition year, therefore, there is duplication in the data. Due to the multi-cycle training (Bologna structure) introduced in 2006 in ISCED level 5A, the proportion of graduates in some fields of training changed. For example, the former teacher-training in college was classified into the field “education”. In the Bologna structure it was separated into two cycles and the first, bachelor cycle was classified into other fields (e.g. humanities or science). There were changes in vocational secondary and post-secondary education by field due to the new National Vocational Qualification List introduced from 2006. The decrease in the post-secondary graduation rates from 2004 is due to the fact that ISCED 4A programmes (general programmes designed for students who have graduated with a 3C vocational qualification but want to pass a maturity examination) were abolished in 2003. Students can now enrol in secondary vocational programmes preparing for maturity examinations at grade 10 or 11, depending on their study achievements. Graduation rates in post-secondary non-tertiary education now refer only to students enrolled in ISCED 4C vocational programmes. In recent years more and more people have got involved in 3 years for upper secondary vocational programmes (instead of 4 years programmes). As a result, the number of graduates and graduation rates increased at the upper secondary level. The effect of this process was perceived in 2012. Back_to_Table1
Ireland: in the 2013 edition of Education at a Glance, trend data on population has been revised. Furthermore, one third of the public institutions have been re-classified as private institutions. Back_to_Table1
Iceland: Graduation data for ISCED 3 in 1995 refer to the school year 1995/96. At ISCED 3, all graduates are counted except for the journeymen’s exam (since they usually have another graduation first) and a few introductory programmes. Back_to_Table1
Israel: From the 2013 edition of Education at a Glance, students who appeared as active students at the same level at the beginning of the following year have been removed from ISCED3 graduates count. Back_to_Table1
Luxembourg: A significant proportion of the youth cohort study in neighbouring countries at ISCED 3 level. Back_to_Table1
New Zealand: Upper secondary-level graduate data for New Zealand relates only to initial upper secondary level education in schools. The data excludes all ISCED 3 graduates from post-secondary-school programmes.
26
Initial school-based upper secondary education is generally-oriented. The vast majority of post-school study at ISCED 3 is vocational, of one year or less duration. While post-school certificates are at the same level as school-based qualifications, they are not part of the upper secondary school system in New Zealand. Students who do not graduate from initial upper secondary programmes at school, may at a later stage go on to graduate from a vocational ISCED 3 post-school programme. However, these graduates are excluded from the New Zealand in these Education at a Glance statistics. The inclusion of these graduates leads to upper secondary graduation rates near or sometimes above 100%. While this is technically correct according to the UOE definitions, these rates have limited interpretability for measuring New Zealand upper secondary school performance in an international context. For this reason, for EAG 2013 and EAG 2012, New Zealand did not report ISCED 3 graduates. Prior to EAG 2012, New Zealand reported all ISCED 3 grads (school and post-school). For EAG 2014, only school-based (i.e. initial education) ISCED 3 graduates are being reported. However, data on upper secondary graduates has been revised and resupplied on this new basis for all years back to 2005, so that EAG 2014 trends of upper secondary graduation rates for New Zealand are comparable.
ISCED 3 graduation from school is measured when the student leaves school rather than the year in which the qualification is attained. This mismatch in the timing of measurement of graduates is not considered significant. A new system of national school qualifications was introduced between 2002 and 2004, and the measure of attainment associated with school graduation is higher than the one used prior to this. Back_to_Table1
Norway: A break in time series on graduation occurred in 2005, as the definition of an ISCED3 graduate was tightened from course completion to successful completion of the whole programme (studiekompetanse/fagbrev). Back_to_Table1
Saudi Arabia: Prior to 2011, data collection by fields of study was not exhaustive. However, since the school year 2011 the Technical and Vocational Training Corporation has begun reporting detailed data on fields of education. This step has helped to distribute the graduates of the corporation clearly on various disciplines and fields of study and not only on the field of Engineering, which resulted in significant decrease in the number of graduates in this field and a significant increase in the fields of Computing and social sciences. Back_to_Table1
Slovak Republic: The lower level of graduation rates at ISCED 3 level between 2001 and 2003 has been caused by gradual transfer of 8-years´ basic schools to 9-years´ from the school year 1997/98 (the transition lasted 3 years). Back_to_Table1
Spain: The break in series in 2005 is due to the inclusion of the programme Occupational Training (one semester and more) classified as ISCED 3C (short programme). Back_to_Table1
Switzerland: Changes in graduations from ISCED 4 are due to changes in the educational system: programmes in ISCED 4 have been replaced by either programmes in ISCED 3 or 5B. The increase in ISCED 3 is partially due to the aforementioned change in educational systems, but partially also due to a change in methodology. Back_to_Table1
Sweden: In Sweden, graduation from upper secondary education exists only in the part of the school system designed for students under the age of 21. Students studying in adult education may complete ISCED 3 and be awarded a certificate. These certificates may fulfil the entry requirement for higher education, but there is currently no registration of whether or not they are formally equivalent to graduation. Back_to_Table1
Turkey: Open education is excluded. Graduates from ISCED 3C short programmes are missing. During the 2005-2006 school year, the duration of the all secondary education programmes that lasted three years was extended to four years. Therefore fewer students graduated in the school year 2007-2008. Back_to_Table1
United States: The majority (nearly all) ISCED 3 graduates are first-time graduates. While the graduates may be in programs described as vocational, academic, or general, all graduates must have met requirements for completing a designated number of academic courses. General Educational Development (GED) programmes and other alternative forms of upper secondary school completion are not included in the graduation-rate calculations. U.S. data for graduates by age are calculated by applying totals by ISCED level from universe data to age distributions by ISCED level, which are drawn from a nationally representative sample of households in the United States. These age distributions fluctuate from year to year, resulting in estimates at some ages increasing and at other ages decreasing. These fluctuations become particularly notable for population bands on the fringe of an ISCED level from which relatively few people graduate. Back_to_Table1

27
Summary of completion requirements for upper secondary programmes (ISCED 3)
Notes on specific countries Czech Republic : 3A - Certificates at the end of each year are based on current checking. Final exam (maturita) is a comprehensive one. 3B - Certificates at the end of each year are based on current checking. Final exam (absolutorium) is a comprehensive one. 3C - Current checking rather than exams. Certificates at the end of each year are based on the current checking. Final exam is a comprehensive one. Back_to_Table1
Denmark: 3C - The main course in vocational training is normally completed with a "journeyman's test" or a similar examination testing. The test may be taken after the school period as an actual journey man's test performed in the business. Back_to_Table1
Greece: 3A - Students are examined twice/at the end of each year after compulsory attendance; 3C - Students are examined at the end of each year after compulsory attendance. Back_to_Table1
Ireland: 3A - To be a candidate for the exam a student must either have completed the 2 year LC programme or have attained the age of 17 years. 3C - The Leaving Certificate Applied assessment takes place over the two years under three headings: Satisfactory Completion of Modules, Performance of Student Tasks and Performance in the Terminal Examinations. The two-year programme consists of four half-year blocks called Sessions and achievements are credited in each of these Sessions. At the end of each Session a student is credited on satisfactory completion of the appropriate modules. Student Tasks are assessed by external examiners appointed by the Department of Education and Science. These Tasks may be in a variety of formats - written, audio, video, artefact etc. Each student is also required to produce a report on the process of completing the Task. This report may be incorporated in the evidence of task performance. Terminal Examinations are provided in the following areas: English and Communication, Two Vocational Specialism, Mathematical Applications, Language (Gaeilge Chumarsaideach & Modern European Languages) and Social Education. Back_to_Table1
Israel: In Israel, students who complete 12th grade are considered upper secondary graduates. Matriculation exams are used as an extra indicator for completion but not the only one. Number of hours per student in upper secondary education to complete the programme is 110 hours within three years of studying (10th to 12th grade). Back_to_Table1
Netherlands: 3A - Each course can be finalised by an exam. Together with the result of the final exam the results of these exams determine the final result for the respective study subject. Since 1999 the Netherlands introduced a new second phase of secondary education. This means that pupils are encouraged and taught to study independently. The number of course hours prescribed by the government now describe the number of hours that a typical pupil is expected to need to get familiar with the contents of the course. For each course this number is given by the government. The total number of these 'course hours' amounts to 1 600 / year. 1 000 hours of them are taken care of during school time as part of the educational programme. For the remaining hours pupils are expected to study themselves. 3C - Minimum entrance requirement is ISCED 2. Back_to_Table1
Poland: The Świadectwo maturalne certificate, which gives access to tertiary education, is awarded on the basis of a final examination and the grades obtained in the final year. Those pupils who do not wish to take the matura examination are awarded the secondary school leaving certificate, which is based solely on the grades and work over the year. Except for the Świadectwo maturalne certificate students of technical secondary schools can be awarded a diploma confirming vocational qualifications at the technical level after passing the final examination. Students of basic vocational schools who do not wish to take examination (confirming obtaining of vocational qualifications at the basic vocational level) are awarded the basic vocational school leaving certificate, which is based solely on the grades and work over the year. Back_to_Table1
Slovak Republic: 3A - practical training in grade 2 and 3 per 2 weeks in some cases up to 4 weeks for all grades e.g. in veterinary medicine. Or typical apprenticeship programme with one third of practical training. (certificate on apprenticeship) extended by increased portion of general subjects which are also included in final examination (matura examination) and also giving access to higher education. 3C - training for children with special needs, two thirds of which represent practical training, final examination consists only from vocational subjects, including a practical part; or final examination consists only of vocational subjects, including practical part; or typical apprenticeship programme with one third of practical training. Back_to_Table1
Turkey: 3C - Obligatory vocational training of at least eight hours per week. Candidates have to pass the assistant mastership exam after three years of study or five years of work experience. Back_to_Table1

28
United Kingdom: For the majority of general 3A (such as A levels and Scottish Highers) and 3C programmes (such as GCSEs and Scottish Standards) there are modular examinations at intervals during the programme as well as at the end. For most subjects, assessed coursework also contributes to the grade. For each separate subject within the programme, there is a range of possible attainment grades. For vocational 3A/B programmes such as NVQs there may be some formal tests but the pass criterion is demonstrable competence in the workplace (or simulated workplace). Evidence for the assessment is gathered mainly by direct observation of the candidate performing in a workplace setting, often supplemented by a portfolio of documentary evidence relating to work task undertaken by the candidate. There are typical course hours especially for general 3A and 3C programmes (less so for vocational programmes), but these are not strictly mandatory and for most programmes it is possible to register for the assessment whether or not the candidate is enrolled in the regular education system. Back_to_Table1
Successful completion of upper secondary programmes, by gender and programme orientation (Tables A2.5, A2.6 and Box A2.2)
The data are based on a special survey carried out in December 2013. Successful completion of upper secondary programmes is estimated using different methods: true cohort, longitudinal survey and proxy cohort data. A detailed description of the method used for each country is presented below (years of new entrants, years of graduates, programmes taken into account, etc.)
Methodology Data on successful completion of upper secondary programmes were collected through a special survey undertaken in December 2013. The completion is calculated as the ratio of the number of students who graduate from an upper secondary programme during the reference year to the number of new entrants in this degree N years before, with N being the duration of the programme. The calculation of the completion is defined from a cohort analysis in three quarters of the countries (true cohort method and longitudinal sample). The estimation for the other countries assumes constant student flows at the upper secondary level, owing to the need for consistency between the graduate cohort in the reference year and the entrant cohort N years before (Proxy cohort data). This assumption may be an oversimplification.
These two methodologies to estimate completion rates are:
True cohort method
The calculations are based on information from individual student registers. The completion rate gives the proportion of entrants who graduated within N years (or N+2). The year of entrance gives the year when the observed cohort of students entered the level. These individual students are followed up on an individual basis within the normal duration of the programme N, or within N+2, to establish whether they drop out, change orientation or graduate.
Proxy cohort data
To calculate the successful completion using the Proxy cohort data method, the number of graduates from upper secondary programmes (2012 data) is divided by the number of new entrants into these programmes N years before multiplied by 100. N is the normal duration of the programmes. This ratio is adjusted to take into account changes in the population (deaths, international migration factors).
Notes on specific countries Austria:
Method: True cohort
Year used for new entrants: 2007-08
Theoretical duration of the programmes:
• 4 years for general programmes
Back_to_Table1

29
Flemish Community (Belgium):
Scope of the data in the survey
Method: True cohort
Year used for new entrants: 2007-08
Theoretical duration of the programmes: The theoretical duration of all programmes in scope of this survey is 4 years (2 stages of 2 years each).
The data in the survey are based on the pupils’ register for regular full-time secondary education. Information by individual pupil is available in this database.
The data in scope of this survey cannot be compared with the UOE data collection. The UOE data collection takes into account special secondary education, part-time secondary education, apprenticeship courses organised by Syntra Vlaanderen, adult education, …
New entrants The reference year for the new entrants is the school year 2007-2008. The entrants integrated in the survey are limited to the pupils from whom we are sure that they haven’t been enrolled in 2006-2007 in the 1st grade of the 2nd stage of regular secondary education (= first grade of ISCED 3).
For some pupils entering ISCED 3 it is not possible do determine whether they are repeaters. Pupils repeating a year are not integrated in the new entrants. For some pupils it is not possible to define whether they are repeater or not. This concerns pupils who have been:
• Enrolled in special secondary education,
• Enrolled in part-time secondary education,
• Enrolled in the reception class for newly arrived immigrant children,
• Not enrolled the year before the reference year on the reference date at the beginning of February.
All these pupils are integrated in the category ‘New entrants’.
About 92% of the pupils in the 1st grade of the 2nd stage of regular secondary education are new entrants.
New entrants over 20 years old: pupils whose year of birth is 1987 or earlier.
Number of entrants who graduate at ISCED 3 The data integrated in this row of the survey refer to the new entrants who graduated at the end of the school year 2010-2011 (theoretical duration of the programmes in scope of this survey = 4 year) and following (information integrated in the N+2 years).
Pupils who have been graduated before the end of the school year 2010-2011 (for example pupils who jumped a grade) have been excluded.
The allocation by type of education (general versus vocational) is based on the start position of the pupil and not on the type of education in which the pupil graduated.
Number of students still in education The number of students refers to the students who are still enrolled in secondary education at ISCED 3 level. Students who have entered adult education, Syntra-training, higher education, or other ISCED levels … are not taken into account.
The pupils are allocated by type of education (general versus vocational) on the basis of their start position in the school year 2007-2008.
Number of students who dropped out Number of students who dropped out = number of new entrants decreased with the number of entrants who graduated at ISCED 3 and the number of students still in education at ISCED 3 level. These pupils are no longer enrolled in secondary education at ISCED 3 level but it is possible that they are still in other forms of education (for example already in higher education, in training offered by Syntra).
Data collection by parental education (Highest attainment level of either the father or the mother) The data integrated in this part of the survey refer to the information on the highest attainment level of the mother. This information is collected at the level of the individual pupil and collected for additional needs provision in schools. The attainment level of the mother is one of the equal opportunities indicators which are collected. Only information on the attainment level of the mother is available.
The following information is collected and reported in this survey as follows:

30
The information which is reported on this issue refers to the data for the reference year 2007-2008.
Back_to_Table1
Canada:
Method: Proxy cohort data
Year used for new entrants: Canada is not able to collect data on new entrants. For the survey, they used grade 10 enrolments for the school year 2008-09.
Theoretical duration of the programmes: Three years - 2011 (2010-2011) 16-19 year-old first-time secondary graduates (in Quebec, 15-18 year-olds graduating from Secondaire 5) adjusted for deaths and net interprovincial and international migration that occur in the period between grade 10 and the graduating year. For Canada, the adjustment factor is below 100% as there is more in-migration than out-migration. It is also necessary to note that there are possible flows in and out of the public school system between enrolment in Grade 10 and graduation at the end of Grade 12, such as a move between public and private schools which are not taken into account.
Back_to_Table1
Chile:
Method: True cohort
Year used for new entrants: 2007
Theoretical duration of the programmes:
• 4 years for general and vocational programme
Back_to_Table1
Denmark:
Method: True cohort
Year used for new entrants: 2004-05
Theoretical duration of the programmes:
• 3-4 years for general programmes
• 2-5 years for vocational programmes
Back_to_Table1
Estonia:
Method: True cohort
Year used for new entrants: 2005
Theoretical duration of the programmes:
Primary education not completed ISCED 0-2
Primary education completed ISCED 0-2
Lower secondary education completed ISCED 0-2
Upper secondary education completed ISCED 3
Higher education completed ISCED 5-6
Unknown Integrated in ‘No information available’

31
• 3 years for general programmes
• 3-4 years for vocational programmes
New entrants “ISCED 3 entrants” follows those born in 1989 who entered ISCED 3 level general (3G) and vocational (3V) programmes in 2005 (13788 persons). It covers 70% of the total of age cohort enrolled at ISCED 3 level programmes at any time up till 2011 (according to in the register – Estonian Education Information System (EHIS)). Another large group of 4777 people (in total 24%) entered secondary education in 2006 and the rest started within 2007-2011 in diminishing numbers each year.
Reference year 2005 represents the time when majority of 1989 cohort started their secondary education for the first time. Completion and drop-out numbers are reported for 2008-2009 (the nominal length of general education programmes is 3 years and vocational programmes is 3-4 years) and then again for 2010-2011 (n+2) and 2011-2012 (n+3).
Number of entrants who graduate at ISCED 3 “Graduates” represent those who completed 3G or 3V programmes. Division between the respective groups is based on their initial choice of track. Number of persons has changed their study programmes during the follow-up period. Their progress is reported within their initial group but distinction is made between the 3G and 3V graduates, e.g. if a person started his/her studies in 2005 in 3V but switched to 3G at some point of time and managed to complete the programme by 2008 (or by 2010 and 2011 in respective tables), (s)he is still considered as graduate in the total number of graduates of the group of 3V but (s)he is reported separately from those who started at 3V and graduated from the same track. This approach allows following the path chosen by entrants and at the same time reporting their status in the graduate-drop-out-still in education scale properly.
Number of students still in education “Number of students still in education” includes those from the ISCED 3 entrants who were still studying in 2008 (and 2010, 2011 respectively). In accordance with the representation of graduates, students still in secondary education are reported as such regardless of their movements between 3G and 3V programmes during the years. Those who switched from 3G to 3V (or vice versa) are still reported within the group of their initial choice of track but their current status in their second choice is given separately.
Number of students who dropped out “Number of students who dropped out” includes only students who have dropped out from their initial choice of programme and have not by 2008 (or 2010 and 2011 respectively) obtained any ISCED 3 level qualification elsewhere and are not studying in any secondary education programme during the year in question. In case there is intent to see the number of drop-outs from 3G, for example, irrespective of their progress elsewhere within secondary education, it could be done by adding to the reported number of students who dropped out those students, who left 3G to study in 3V and those who graduated in 3V. Both numbers are available in the table.
Back_to_Table1
Finland:
Method: True cohort
Year used for new entrants: 2006
Theoretical duration of the programmes: 3 years for general and vocational programmes
Data collection by parental education (Highest attainment level of either the father or the mother)
Data is based on Statistics Finland's individual-based register data on students and qualifications/degrees.
First generation immigrant background includes persons whose country of birth is not Finland (excluding those persons whose parent or both parents are born in Finland).
Second generation immigrant background includes persons whose country of birth is Finland but both parents are born outside Finland or parents' country of birth is not known.
Persons who don't have data on the identity number are not included (these cases are mainly foreign citizens or immigrants). However the number of persons with missing data on the identity number is small.
Back_to_Table1

32
France:
Method: Longitudinal sample survey
Year used for new entrants: 1999-2005
Theoretical duration of the programmes:
• 3 years for general programmes
• 2 years for vocational programmes
The cohort has been followed up since the first year of education at ISCED 2. The theoretical duration of ISCED 2 education is 4 years. Grade repetitions occur once or twice in certain cases. Therefore, the entrance to ISCED 3 occurred from 1999 (school year 1999-2000) to 2005 (school year 2005/06). The period for passing exams is about n+3 years. France only took into account the first graduation from ISCED 3 for these calculations. Students who began "baccalauréat technologique" after a first vocational graduation are not considered as having graduated from a general programme.
Back_to_Table1
Greece
Method: Cross-cohort
Year used for new entrants: 1999-2005
Theoretical duration of the programmes:
• 3 years for general programmes
• 2 years for vocational programmes
Back_to_Table1
Hungary:
Method: Cross-cohort
Year used for new entrants: 2009-10
Theoretical duration of the programmes:
• 4 years for general programmes
• 3 years for vocational programmes
Back_to_Table1
Iceland:
Method: True cohort
Year used for new entrants: 2003
Theoretical duration of the programmes: 4 years used for both general and vocational programmes. There are vocational programmes taking from 0.5-5 years but 4 year programmes are most common. A one year general programme also exists but a large majority of students in general programmes study in a 4 year programme.
New entrants New entrants are those who are students at ISCED 3 and have not been students at ISCED 3 before since the start of the student register in 1975. The survey is limited to students in day school programmes. All new entrants are included, not considering the duration of the programme they are entering. Students in pre-vocational programmes are counted with students in vocational programmes.
Number of entrants who graduate at ISCED 3 Graduates are those who had successfully completed an ISCED 3 programme of at least 2 years duration by 2007 (N) or 2009 (N+2). Entrants who successfully completed shorter programmes than 2 years are not included with graduates. The data are based on the programme the student entered in 2003. Some students have changed their programme of study during this period, e.g. switched from a general to a vocational programme and vice versa. It is also quite common to complete both a general and a vocational programme. Students who graduate both from general and vocational programmes in this period are counted both with graduates from general and vocational programmes but only once in the total number of graduates. A few of

33
the students have completed a higher exam even though they did not complete ISCED 3, but they are not counted with graduates. A considerable number of graduates have completed a two year vocational programme. Many of those graduates continue in school and also complete a 4 year general programme. The existence of 2 year vocational programmes is the main reason for the higher graduation rate from vocational programmes than from general programmes.
Number of students still in education Students still in education in Iceland at ISCED levels 3-6 in the autumn of 2007 (N) or 2009 (N+2). In addition, a few students are receiving student loans to study abroad, and even though they have not graduated from ISCED 3, they are not included in student numbers.
Number of students who dropped out These are new entrants in 2003 who have not graduated from an ISCED 3 programme of at least 2 years duration and are not studying in schools in Iceland at ISCED levels 3-6 within the timeframe given.
Data collection by parental education (Highest attainment level of either the father or the mother) The calculation of completion rate by immigrant background uses data from a database on the background of the population. Students of mixed Icelandic and foreign background are excluded. Since there are so few second generation immigrants in the cohort we suggest either combining data for first and second generation immigrants or only publishing data for first generation immigrants.
Back_to_Table1
Ireland:
Method: True cohort
Year used for new entrants: 2007
Theoretical duration of the programmes:
• 5-6 years for general and vocational programmes
Note: This data relates to a cohort of pupils who entered the second level system in 2001. These pupils followed ISCED 2 programmes for 3 years. Following this, students have an option of taking an ISCED 3 level programme, called Transition Year, for one year before embarking on a two-year Leaving Certificate programme. Hence the theoretical duration is 2 or 3 years.
Number of entrants who graduate at ISCED 3 This data is an underestimate, as the figure is not adjusted for factors such as students who left the state- aided school sector to pursue their senior-cycle education in private, non-aided institutions, or emigration or death. Also adjustments have not been made for students who left the state-aided school sector to pursue alternative educational pathways, such as apprenticeships.
Back_to_Table1
Israel:
Method: True cohort
Year used for new entrants: 2009
Theoretical duration of the programmes: 3 years for general and vocational programmes
The data for Israel are based solely on student files under the responsibility of their Ministry of Education, and therefore exclude two types of programmes:
- Apprenticeships under the responsibility of the Ministry of Labour. These institutions, classified as upper secondary education, account for 3-4% of all upper secondary students.
- Higher Yeshivas, which cater to Ultra-Orthodox Jewish boys. In principle it is a post-secondary type of education, but the Ultra-Orthodox system allows for boys to enter these institutions before the official completion age for upper secondary education.
Thus, the gender gap found in completion rates for Israel can be traced back to these two phenomena, as boys account for the large majority of apprenticeship students, while Yeshivas cater for boys only. These two populations may be viewed as dropping out of the system, while in fact they only “drop” from the system which is under the Ministry of Education.
Back_to_Table1

34
Italy:
Method: Cross-cohort
Year used for new entrants: 2005-06
Theoretical duration of the programmes: 5 years for general and vocational programmes
Back_to_Table1
Japan:
Method: True cohort
Year used for new entrants: 2009
Theoretical duration of the programmes: 3 years for general and vocational programmes
Back_to_Table1
Korea:
Method: Cross-cohort
Year used for new entrants: 2009
Theoretical duration of the programmes: 3 years for general and vocational programmes
Back_to_Table1
Luxembourg:
Method: True cohort
Year used for new entrants: 2006-07
Theoretical duration of the programmes:
• 4 years for general programmes
• 2-5 years for vocational programmes
Back_to_Table1
Mexico:
Method: True cohort
Year used for new entrants: 2008
Theoretical duration of the programmes:
• 3 years for general and vocational programmes
Note: In vocational programmes are included two different educational services called Professional Technician and Technical High School, both provide a vocational component that allows students to work on a technical level at the end of their studies.
Back_to_Table1
Netherlands:
Method: True cohort
Year used for new entrants: 2007-08
Theoretical duration of the programmes:
• 2-3 years for general programmes
• 2-4 years for vocational programmes

35
Immigrant background is determined by one parent born in another country (CBS-definition).
Back_to_Table1
New Zealand:
Method: True cohort
Year used for new entrants: 2008
Theoretical duration of the programmes: 3 years maximum for general initial education, however, students can leave with recognised qualifications after 1 year or after 2 years.
Upper secondary completion rates for New Zealand relate to initial education programmes only, and include only entrants to ISCED 3 in secondary school settings. These programmes are almost entirely generally-oriented. Vocationally-oriented initial education school-based programmes are largely non-existent. The vast majority of New Zealand students enter ISCED 3 in initial school-based settings, rather than in post-school settings. New entrants to ISCED 3 general or vocational programmes in post-school institutions, either as adults or youth, have not been included.
The starting cohort (denominator) relates to those starting in initial school programmes. The numerator includes any of these who go on to complete an ISCED 3 qualification, whether in the regular school environment or after they have left regular school. Most will complete at school, but some drop out of school and subsequently enrol in a post-secondary institution - and go on to complete a qualification that may be quite different from the standard school qualifications, but is nonetheless deemed to be equivalent to ISCED 3.
Most students enter ISCED 3 (usually aged 15) in year 11. Most students entering ISCED 3 do so into a one-year programme (called the "National Certificate of Educational Achievement Level 1", or "NCEA 1"). The flexibility of the New Zealand National Qualifications Framework and NCEA allows students to build up credits over time. Students who do not gain a qualification in one year retain credits and may obtain qualifications in subsequent years. Typically students gain NCEA 1 after their first year, NCEA 2 after two years and NCEA 3 after three years. Upon reaching age 16 (or 15 under rare circumstances) students may choose to leave school for the labour market or tertiary study with or without one or all of these school qualifications.
Those who leave school after just one year of upper secondary education with the NCEA 1 qualification are coded to ISCED 3CS. This group represents an established educational pathway for about 8% to 10% of regular school ISCED 3 entrants. This established pathway is one reason for the lower upper secondary completion rate in New Zealand (given that 3CS does not count as ISCED 3 completion).
Students completing NCEA 2 or higher are considered to have completed ISCED 3. The most common entrance requirement for students wanting to go on to higher education is known as ‘University Entrance’. This requirement is met by attaining 4 reading and 4 writing credits from NCEA 2 or higher; 14 credits from Mathematics at level 1 or higher; and 42 credits at Level 3 or higher, including 14 credits in each of two subjects from an approved list and 14 credits from no more than two additional approved subjects.
All students who enter NCEA 1 enter the same programme, regardless of whether they plan to leave school with NCEA 1 as their final school qualification, or whether they plan to use their NCEA 1 to gain NCEA 2, or NCEA 3. Back_to_Table1
Norway:
Method: True cohort
Year used for new entrants: 2006
Theoretical duration of the programmes:
• 3 years for general programmes
• 4 years for vocational programmes
Back_to_Table1

36
Poland:
Method: True cohort
Year used for new entrants: 2008-09
Theoretical duration of the programmes:
• 3 years for general programmes
• 3-4 years for vocational programmes
Completion of the level / of a programme is considered finishing the highest grade (year) of a given programme at a given level (i.e. obtaining the certificate of level / programme completion - a school-leaving certificate). It does not mean, however, passing the exam granting particular qualifications or allowing the student (an exam-taker) to progress to a higher level of education (e.g. ISCED 5A).
First time enrolled at ISCED3 equal ISCED3 entrants as all second-chance / bridging or supplementary programmes at ISCED3 level have been excluded.
Students of second-chance / bridging or supplementary courses have been excluded due to incompleteness of data on continuity of their progress in education (partly due to the lack of individual register).
Students of 1st grade of ISCED3 programmes (excluding second-chance or bridging ones, supplementary programmes) have been reported as new entrants to ISCED3.
Students of bilingual programmes in general upper-secondary schools (lasting usually 1 year longer than typical general upper-secondary programmes) have been omitted due to incomparability of data (no data on graduates serving as basis for calculation of completion rates).
Entrants and graduates of 3 and 4 year-long vocational programmes have been calculated separately.
Back_to_Table1
Slovak Republic:
Method: Proxi cohort data
Year used for new entrants: 2008-11
Theoretical duration of the programmes:
• 4 years for general programmes
• 2-4 years for vocational programmes
Back_to_Table1
Slovenia:
Method: Cross-cohort
Year used for new entrants: 2009-11
Theoretical duration of the programmes:
• 4 years for general programmes
• 3-4 years for vocational programmes
Back_to_Table1
Spain:
Method: Proxy cohort data
Year used for new entrants: 2008-09
Theoretical duration of the programmes: 2 years for general programmes
Back_to_Table1
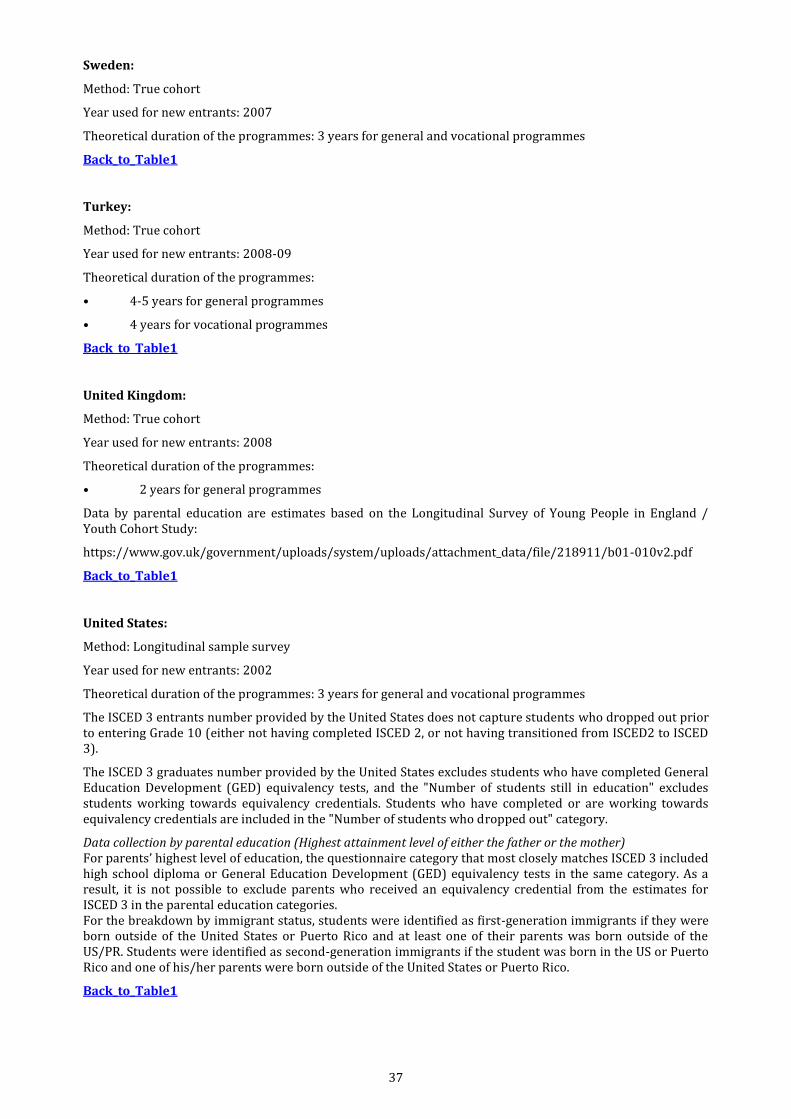
37
Sweden:
Method: True cohort
Year used for new entrants: 2007
Theoretical duration of the programmes: 3 years for general and vocational programmes
Back_to_Table1
Turkey:
Method: True cohort
Year used for new entrants: 2008-09
Theoretical duration of the programmes:
• 4-5 years for general programmes
• 4 years for vocational programmes
Back_to_Table1
United Kingdom:
Method: True cohort
Year used for new entrants: 2008
Theoretical duration of the programmes:
• 2 years for general programmes
Data by parental education are estimates based on the Longitudinal Survey of Young People in England / Youth Cohort Study:
https://www.gov.uk/government/uploads/system/uploads/attachment_data/file/218911/b01-010v2.pdf
Back_to_Table1
United States:
Method: Longitudinal sample survey
Year used for new entrants: 2002
Theoretical duration of the programmes: 3 years for general and vocational programmes
The ISCED 3 entrants number provided by the United States does not capture students who dropped out prior to entering Grade 10 (either not having completed ISCED 2, or not having transitioned from ISCED2 to ISCED 3).
The ISCED 3 graduates number provided by the United States excludes students who have completed General Education Development (GED) equivalency tests, and the "Number of students still in education" excludes students working towards equivalency credentials. Students who have completed or are working towards equivalency credentials are included in the "Number of students who dropped out" category.
Data collection by parental education (Highest attainment level of either the father or the mother) For parents’ highest level of education, the questionnaire category that most closely matches ISCED 3 included high school diploma or General Education Development (GED) equivalency tests in the same category. As a result, it is not possible to exclude parents who received an equivalency credential from the estimates for ISCED 3 in the parental education categories. For the breakdown by immigrant status, students were identified as first-generation immigrants if they were born outside of the United States or Puerto Rico and at least one of their parents was born outside of the US/PR. Students were identified as second-generation immigrants if the student was born in the US or Puerto Rico and one of his/her parents were born outside of the United States or Puerto Rico.
Back_to_Table1
38
Post-secondary non-tertiary graduation rates (Table A2.1c (web))
Methodology In order to calculate gross graduation rates, countries identified the age at which graduation typically occurs. The graduates themselves, however, could be of any age. To estimate gross graduation rates, the number of graduates is divided by the population at the typical graduation age (Annex 1). In many countries, defining a typical age of graduation is difficult because the ages of graduates vary so much.
The typical age refers to the age of the students at the beginning of the school year; students will generally be one year older than the age indicated when they graduate at the end of the school year. Typical ages of graduation and graduation rate calculation methods are shown in Annex 1 of this publication.
Tertiary graduates who receive their qualification in the reference year are classified by field of education based on their subject of specialisation. The 25 fields of education used in the UOE data collection instruments follow the revised ISCED classification by field of education. The same classification by field of education is used for all levels of education. For definitions and instructions refer to the ISCED Classification (UNESCO, 1997). The classification is in accordance with the fields of training defined in the Fields of Training – Manual (EUROSTAT, 1999).
Back_to_Table1
Notes on specific countries Greece: Data for ISCED 4 are estimates. Back_to_Table1
Germany: Until 2008, programmes at Berufsfachschulen aimed at qualifying Kindergarten teachers and school-based vocational education for medical assistants, nurses, midwives or social assistants had been allocated to ISCED 3B while the respective programmes at health-sector schools, or Fachschulen, had been allocated to ISCED 5B. Now all these programmes, regardless of the type of school, are allocated to ISCED 5B. This leads to a decline of the percentage of health and welfare in ISCED 3 and a rise in the percentage of health and welfare in ISCED 5B. Back_to_Table1

39
INDICATOR A3: How many students are expected to graduate from tertiary education?
A3
A3.1 A3.2 A3.3
Methodology Classification of tertiary programmes
Argentina
Australia AUS AUS
Austria AUT AUT
Belgium BEL BEL
Brazil BRA
Canada CAN CAN
Chile
China
Colombia
Czech Republic CZE
Denmark DNK DNK
Estonia EST
Finland FIN FIN
France FRA
Germany DEU DEU
Greece GRC
Hungary HUN
Iceland ICE
India
Indonesia
Ireland IRL
Israel ISR
Italy ITA ITA
Japan JPN
Korea KOR
Latvia
Luxembourg LUX LUX
Mexico MEX
Netherlands NLD NLD
New Zealand NZL
Norway NOR NOR
Poland POL
Portugal PRT PRT
Russian Federation RUS
Saudi Arabia SAU SAU
Slovak Republic SVK
Slovenia
South Africa
Spain ESP ESP
Sweden SWE SWE
Switzerland CHE CHE
Turkey TUR
United Kingdom UKM
United States USA USA

40
Tables A3.1 to A3.3: Graduation rates in tertiary education
Methodology Typical ages of graduation and graduation rate calculation methods are shown in Annex 1. Back_to_Table1
Notes on specific countries Australia: The growth in the number of foreign students in Australia has contributed to the rise of this indicator since 2000. From 2013 edition of Education at a Glance, a disclosure control technique called input perturbation has been applied to the University data. To avoid any risk of disseminating identifiable data, small random adjustments have been made to cell counts. Under the Higher Education Support Act 2003, sections 179-5, 10, 15, 20(c) and the Privacy Act 1988, section 14 (IPP11), it is an offence to release any information that is likely to enable identification of any particular individual. This change in methodology has only a very minor, and insignificant, impact on the data. Back_to_Table1
Austria: During the 2007/08 school year (UOE 2009 data collection), post-secondary colleges for teacher training (ISCED 5B) were transformed into ISCED 5A programmes offered at University Colleges of Teacher Education and post-secondary colleges for medical services were partially transformed into Fachhochschul programmes. University courses and private universities (partly ISCED 5A, partly ISCED 5B) are also included for the first time in the UOE data collection. During the 2008/09 school year (UOE 2010 data collection), courses with credits offered by teacher training institutions were reported for the first time. Furthermore, an evaluation of the entry requirements and acquired qualifications of two small programmes led to their re-classification. In previous years Aufbaulehrgänge and Berufsbildende höhere Schulen für Berufstätige were classified as ISCED 4, in more current data collections they are reported as ISCED 5B programmes. From 2013 edition of Education at a Glance, the calculation of first time graduates was for the first time based on the educational attainment register, taking into account the history (recorded previous degrees) of persons. Back_to_Table1
Belgium: Data for the German speaking Community are not integrated in the Belgian data. Back_to_Table1
Belgium (Flemish Community): Data are not available for the following institutions: K.M.S. (Royal Military Academy) and the Protestant Faculty. Most data on first-time graduates are missing.
Due to the introduction of the BAMA structure and allocation to ISCED, the data cannot be compared from one year to the next. From the UOE 2011 data collection on, the associate degree is integrated in ISCED 5. On 1 September 2009, 2 new training forms have been introduced in the Flemish educational system: the associate degree (‘HBO5’) and advanced secondary education (‘Se-n-Se’). Legally advanced secondary education is allocated at the level of secondary education; the associate degree is allocated at the level of higher education. In ISCED 1997 advanced secondary education is allocated at ISCED 4; the associate degree is allocated at ISCED 5B. Back_to_Table1
Belgium (French Community): The gradual implementation of the Bologna process affects the number of graduates taken into account at the ISCED 5A level. In 2007, following the introduction of the BAMA structure, bachelors’ degrees (obtained at the end of a 3-year programme) were granted for the first time and considered as first degrees at this level. Previously, at least 4 years were necessary at the 5A level to obtain a 1st degree. In the 2013 edition of Education at a Glance, data at tertiary level have been estimated based on previous data collection and the number of students in each type of programmes (bachelors, masters, doctorates). Back_to_Table1
Brazil: Master degree programmes are included in ISCED 5 data. The Higher Education Census (ISCED 5) does not collect data on first and second qualifications separately. The number of Master’s graduates on Tertiary-type B programmes are included with tertiary-type A. The classification (fields of education) adopted by Brazil for second or futher qualification on ISCED 5 and ISCED 6 is not aligned with ISCED 97. Back_to_Table1
Canada: Tertiary-type A and tertiary-type B results are those from publicly funded institutions. The reference year is 2010. From the 2013 edition of Education at a Glance, the methodology to report the graduates has slightly changed: some ISCED4 programmes that were previously included with ISCED5B programmes have been correctly re-affected. Tertiary graduates are estimates. Back_to_Table1
Czech Republic: From 2009, new data source for students belonging to ISCED 5B (from students´ register). It allows for a better split concerning the age of the students. In previous years data was estimated. From the 2013 edition of Education at a Glance, data on foreign graduates are now available at ISCED 5B level. Back_to_Table1
Denmark: From the 2005 UOE data collection, some parts of adult education (part-time) have been included according to the revised tables and the UOE manual. This explains the large increase in the tertiary-type B

41
entry rates compared since then and the changes in the distribution of fields of education. Concerning data on foreign/mobile students, the implementation of the operational definition have been changed. We have observed that the population register does not always have the right immigration date for mobile students. Foreign students who are registered in the population register with an immigration date after start of the educational program are now included as mobile students. Back_to_Table1
Estonia: The reference date for ages for graduates has changed from 2007 data to conform to the UOE data collection manual. This change may cause a break in the series. Back_to_Table1
Finland: Due to a structural change in the tertiary education system, ISCED 5B programmes (vocational college) have been phased out. At the same time, the volume of polytechnic education (ISCED 5A) has increased, hence the increase in ISCED 5A graduates. From the 2013 edition of Education at a Glance, degrees taken in the National Defence University are included for the first time in graduate data. Back_to_Table1
The long master's degrees are reported as first degrees until UOE 2009 collection data (year 2008 data). Since then the long master's degrees are reported as second degrees. Since the UOE 2007 collection data (year 2006 data) on graduates who are non-citizens of reporting country are based on annual individual data-based qualification and degree register data. Previously data on graduates who are non-citizens of the reporting country were based on the Register of Completed Education and Degrees. The high number of graduates in ISCED 5A education in 2008 is caused by the termination of the option to graduate, according to the pre-Bologna study programmes in most of the fields of education. The number of graduates was record high in university education because of this. Though the increase was real, it was temporary as in 2009 the graduate numbers decreased back to their normal level. Back_to_Table1
Germany: Until 2008, programmes at Berufsfachschulen aimed at qualifying Kindergarten teachers and school-based vocational education for medical assistants, nurses, midwives or social assistants had been allocated to ISCED 3B while the respective programmes at health-sector schools, or Fachschulen, had been allocated to ISCED 5B. Now all these programmes, regardless of the type of school, are allocated to ISCED 5B. This leads to a significant rise in ISCED 5B graduation rates. Back_to_Table1
Italy: ISCED 5A second degree graduates and ISCED 6 graduates are not available. The number of students graduated from three to five year programmes decreased due to a reclassification of the old programmes. Reference date for ages is 31/12/09 at tertiary level (UOE 2010 data collection). Back_to_Table1
Luxembourg: A significant proportion of the youth cohort studies in neighbouring countries at the ISCED 5 and 6 levels. Back_to_Table1
Netherlands: Graduate data only include publicly financed institutions, referred to as “public institutions” by the Dutch national statistical and educational environment.
Starting academic year 2011/12 the methodology for calculating the number of mobile students has been changed.
The variable we normally used to decide whether a tertiary student is mobile or not, has been changed permanently in the registration of students ISCED 5A/B. It does not deliver the correct number of mobile students anymore. The new methodology is based on the assumption that all students in ISCED 5A/B with foreign nationality that have not been found in existing national enrollment registers of ISCED 3A, can be considered as mobile students. The new number of mobile students is higher and its variation in time is much closer to that of the number of foreigners.
The fact that the new number of mobile students is higher than we used to publish, can be explained by the fact that in this new methodology those foreign students of whom it is unknown if they come from abroad or not, are considered as mobile, if they cannot be found in existing Dutch registers of ISCED 3A. Back_to_Table1
Norway: As the bachelor–master system has been introduced, some educational programmes have changed from ISCED 5B to ISCED 5A. This causes a decrease in the number of graduates from ISCED 5B programmes and a corresponding increase in graduates in 5A programmes. Back_to_Table1
Portugal: Data exclude post-doctorate degrees. The increase between 2009 and 2011 in the number of ISCED 5A
second and further graduates and the corresponding decrease of the number of ISCED 6 graduates resulted from the
bologna process because the “Mestre” qualification according to Bologna process is reported in ISCED 5A – Second
and further degrees, and the "Mestre" qualification, according to the pre-Bologna process, and given its
characteristics, has always been classified as ISCED 6, and with the Bologna process, these qualifications will tend
to disappear, leaving only in ISCED 6, the “Doutor” qualification. Furthermore, from the 2013 edition of Education
at a Glance, new programmes have been included : “Diploma de especialização – Curso de mestrado”; “Diploma de
especialização – curso de doutoramento”. Back_to_Table1
Russian Federation: Data on advanced research programmes include only data on public institutions. Back_to_Table1

42
Spain: There is a break in first-time graduates series at ISCED 5A level in the 2008 school year, as gross graduation rates have been replaced by net rates, with an important impact due to the structure of the population. The new degree structure according to the Bologna Process is being implemented gradually, replacing the previous university model. The new duration of first degree is 4 years, 1 year longer than before, which produces in 2012 a decrease in the graduation rates. Also the number of the first long degrees graduates should decrease and the number of second degrees should increase gradually.Back_to_Table1
Sweden: Many mobile students study in master programmes. As the master degree is their first degree in Sweden it partially explains why the graduation age is quite high. Back_to_Table1
Saudi Arabia: The statistics department of the Ministry of Higher Education does not collect data on first–time graduates neither on graduates by age. All graduates are reported as first-time graduates. Graduation rates may be overestimated. Back_to_Table1
Switzerland: First-time graduates ISCED 5B are estimated using labour force survey data. The rapid increase of graduation rates at tertiary-type B level in Switzerland between 2006 and 2007 is due to a better coverage of the data and to the upgrading of a number of programmes in the field of “health and welfare” to the tertiary level. This had led to an increase in the number of female graduates in tertiary-type B. From the 2013 edition of Education at a Glance, ISCED 5B very short postgraduate programmes (rather non formal than formal education) have not been included in the data collection any more. ISCED 5A Institutions not recognised by Swiss authorities are not covered any more. Back_to_Table1
United States: US data for graduates by age are calculated by applying totals by ISCED level from universe data to age distributions by ISCED level which are drawn from a nationally representative sample of households in the United States. These age distributions fluctuate from year to year, resulting in estimates at some ages increasing and at other ages decreasing. These fluctuations become particularly notable for population bands on the fringe of an ISCED level which have relatively few people graduating. Some programmes are included in “Bologna sheet” of the questionnaire, which are not included in ISCED, such as graduates from academic associate’s degrees in the US. Back_to_Table1

43
Classification of tertiary programmes Tertiary graduates are those who obtain a tertiary qualification in the specified reference year (graduation at the end of the academic year). This indicator distinguishes among different categories of tertiary qualifications according to the International Standardized Classification of Education (ISCED 97):
i) tertiary-type B qualifications (ISCED 5B);
ii) tertiary-type A qualifications (ISCED 5A); and
iii) advanced research degree of doctorate standard (ISCED 6).
For some countries, data are not available for the categories requested. In such cases, the OECD has assigned graduates to the most appropriate category. Programmes included at the tertiary levels are listed below for each country.
Australia:
ISCED5A
First “Bachelor’s” (Degree) (3-4 years); “Bachelor's” (Degree with Honours) (4-5 years); Bachelor of Dentistry (5 years); Bachelor of Veterinary Science (5 years); Bachelor of Medicine and Surgery (7 years); Graduate Diplomas (1.5 years)
Second Master’s Degree (2 years) (by coursework or research); Doctorate (by course work) (3 years)
ISCED 5B
First Diplomas, Advanced Diplomas (2 years); Associate Degree (2 years)
Second a
ISCED 6 Doctorates (by research) (3 years)
Back_to_Table1
Austria:
ISCED 5A
First Bachelor programme “Bachelor” (3 years); Diploma programme “Magister/Diplomingenieur/Doktor (1st)” (4-6 years)
Second Master programme “Master/ Diplomingenieur” (2 years); Post-graduate studies “MSc, MBA” (2 years)
ISCED 5B
First Master craftsmen/ foreman courses “Meisterprüfung/ Werkmeisterprüfung” (2 years); Technical and vocational education colleges “Diplomprüfung” (2 years); Post-secondary colleges for medical services “Diplom”(3 years)
Second University courses “akademische Bezeichnung” (2 years)
ISCED 6 Doctorate “Doktor”(2 years), Doctorate Ph.D. (3 years)
Back_to_Table1

44
Belgium (Flemish Community)
ISCED 5A
First Basic academic education, two cycles: Basisopleidingen aan de universiteiten (4-7 years); Basic academic education, Open University: Basisopleidingen, Open Universiteit; Basic academic education, Protestant Theological Faculty: Basisopleidingen aan de Universitaire Faculteit voor Protestantse Godsgeleerdheid (4 years); Royal Military Academy : Koninklijke Militaire School (4.5 years); Academic bachelor’s programmes: academisch gerichte bacheloropleidingen;
Second Masters degree; Specific teacher education after master: Specifieke lerarenopleiding na master; Master after profesionnal bachelor: Master na professionneel gerichte bachelor; ; Academic teacher training: Academische initiële lerarenopleiding (1 year); Advanced studies at the Institute for Tropical Science: Voortgezette opleidingen aan het Instituut voor Tropische Geneeskunde; Academic teacher training provided by ‘hogescholen’: Initiële lerarenopleiding van academisch niveau (1 year); Doctoral training: Doctoraatsopleiding; Advanced master’s programmes: master-na-masteropleiding
ISCED 5B
First Associate degree (‘HBO’); Professional bachelors degree:; Adult education - higher vocational adult education: Volwassenenonderwijs – hoger beroepsonderwijs van het volwassenenonderwijs; Specific teacher education: Specifieke lerarenopleiding
Second Bachelor following bachelor; Specific teacher training after profesional bachelor: specieke lerarenopleiding na professionele bachelor
ISCED 6 Doctorate, Universities: Doctoraat, universiteiten; Doctorate at the Instititute for Tropical Science: Doctoraat aan het Instituut voor Tropische Geneeskunde; Doctoraat aan de Universitaire Faculteit voor Protestantse Godsgeleerdheid
Back_to_Table1
Belgium (French Community):
ISCED 5A
First Enseignement supérieur de promotion sociale de type long; Enseignement supérieur de type long (4-5 years); Enseignement universitaire (1er et 2e cycle) (4, 5, 6 or 7 years); Ecole Royale Militaire (4-5 years); Faculté de théologie protestante
Second Agrégation de l'enseignement secondaire supérieur (2 years); Enseignement supérieur de type long: année complémentaire (1 year); Enseignement universitaire: année complémentaire et 3e cycle (1+ years)
ISCED 5B
First Enseignement supérieur de promotion sociale de type court; Enseignement supérieur de type court (3 years); Enseignement artistique supérieur (musique et arts plastiques) (3 years)
Second Enseignement supérieur de type court complémentaire (1 year)
ISCED 6 Doctorat et Agrégation de l'enseignement supérieur
Back_to_Table1
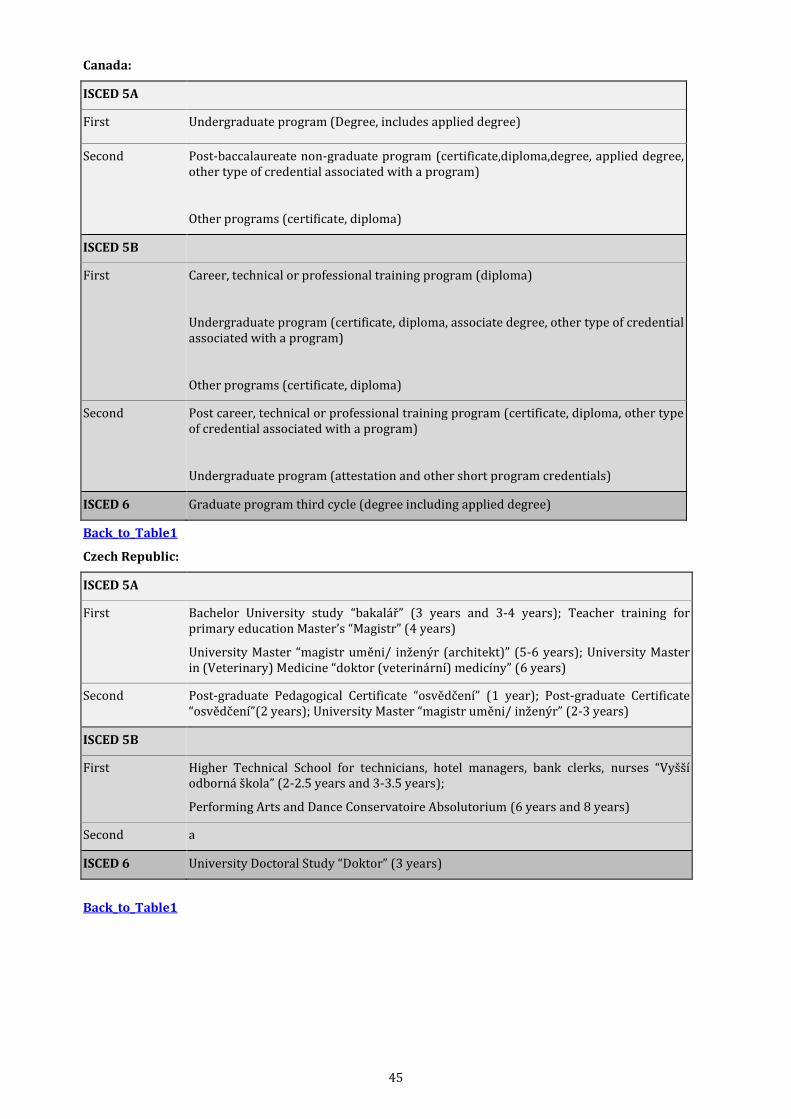
45
Canada:
ISCED 5A
First Undergraduate program (Degree, includes applied degree)
Second Post-baccalaureate non-graduate program (certificate,diploma,degree, applied degree, other type of credential associated with a program)
Other programs (certificate, diploma)
ISCED 5B
First Career, technical or professional training program (diploma)
Undergraduate program (certificate, diploma, associate degree, other type of credential associated with a program)
Other programs (certificate, diploma)
Second Post career, technical or professional training program (certificate, diploma, other type of credential associated with a program)
Undergraduate program (attestation and other short program credentials)
ISCED 6 Graduate program third cycle (degree including applied degree)
Back_to_Table1
Czech Republic:
ISCED 5A
First Bachelor University study “bakalář” (3 years and 3-4 years); Teacher training for primary education Master’s “Magistr” (4 years)
University Master “magistr uměni/ inženýr (architekt)” (5-6 years); University Master in (Veterinary) Medicine “doktor (veterinární) medicíny” (6 years)
Second Post-graduate Pedagogical Certificate “osvědčení” (1 year); Post-graduate Certificate “osvědčení”(2 years); University Master “magistr uměni/ inženýr” (2-3 years)
ISCED 5B
First Higher Technical School for technicians, hotel managers, bank clerks, nurses “Vyšší odborná škola” (2-2.5 years and 3-3.5 years);
Performing Arts and Dance Conservatoire Absolutorium (6 years and 8 years)
Second a
ISCED 6 University Doctoral Study “Doktor” (3 years)
Back_to_Table1

46
Denmark:
ISCED 5A
First Tertiary education medium cycle “Diplomingeniør, maskin- mester, sygeplejerske, folke- skolelærer m.fl.” (3-5 years); Bachelor’s degree (3 years); Tertiary education long cycle, museum conservator, e.g. from Music Academy “Konservator, konservatorieuddannelserne” (5-7 years)
Second Tertiary education long cycle “Cand. Mag., cand. Scient., cand. Polyt., etc.” (2 years)
ISCED 5B
First Tertiary education short cycle, including technician qualification “Datamatiker/ byggetekniker/ Maskintekniker” (2-3 years)
Second a
ISCED 6 Doctoral Programmes Ph.D. (3 years); Doctorate “Doktorgrad” (5-10 years)
Back_to_Table1
Finland:
ISCED 5A
First Lower University Programmes (Bachelor's degree, 3 years); Polytechnic
Bachelor's Degree Programmes (3-4 years)
Second Higher University Programmes (Master's Degree, 2 years after graduation from Lower University Programme or 5-6-years); Polytechnic Master's Degree Programmes (1-1.5 years after graduation from Polytechnic Bachelor's Degree Programme); Specialists in Medicine/Dentistry/Veterinary Medicine (5-6 years)
ISCED 5B
First a (tertiary-type B programmes have been phased out. Thus the number of students in tertiary-type B education is at the moment negligible)
Second a
ISCED 6 Doctorate programmes – “Licentiate” (2 years); “Doctor” (4 years)
Back_to_Table1

47
France:
ISCED 5A
First First university diploma “Licence” (3 years); Higher engineering school diploma “Diplôme d’ingénieur” (3-4 years) and Higher business school diploma “Diplôme d’ingénieur commercial” (3 years) including ‘ les Classes préparatoires aux grandes écoles (CPGE)” (2 years); Specialised higher schools diverse professional diplomas including in architecture, veterinary surgery, art etc “Diplômes professionnels divers (notaire, architecte, vétérinaire, journaliste,etc.)” (3-4 years); University pharmacy diploma “Diplôme de pharmacien” (5 years); University Diploma in Medicine/ Dentistry “Docteur en medicine/ Diplôme de dentiste” (7 years)
Second University education 2nd cycle 2 year “Master”. Teaching in university institute of training Master (IUFM) “CAPES, Professeur des écoles, etc.” (2 years); Special diploma in health “Diplôme d’études spécialisées” (3 years)
ISCED 5B
First Specific vocational training diploma “Diplôme universitaire de technologie (DUT) » (2 years); Specialised higher school short professional diploma, e.g. in special education, laboratory technician, social worker “Diplômes professionnels divers (éducateur spécialisé, laborantin, assistante sociale, infirmier-infirmière, etc.) » (2-3 years); High-level technician award (school or school and work-based) “Brevet de technicien supérieur (BTS)” (2 years)
Second
ISCED 6 Doctorate programmes “Diplôme de docteur” (3 years)
Back_to_Table1
Germany:
ISCED 5A
First Bachelor’s degrees (3 years)
Fachhochschulen: degree “Diplom (FH)“ (4 years);
University degree “Diplom oder Staatsprüfung“ (5 years)
Second Master’s degrees (2 years, cumulative duration of 5 years)
ISCED 5B
First Specialised academies (Bavaria) “Abschluss der Fachakademie/ Fachhochschulreife” (2 years);
Health sector schools for medical assistants/ nurses “Abschlusszeugnis für medizinische Assistenten, Krankenschwestern/ -pfleger” (3 years);
Specialised vocational schools (Berufsfachschulen): Abschlusszeugnis in Gesundheits- und Sozialberufen bzw. Erzieher- oder Kinderpflegerausbildung (2 years & 3 years);
Trade and technical schools “Fachschulabschluss, Meister/Techniker, Erzieher” (2 years & 3-4 years); Colleges of public administration diploma “Diplom (FH)” (3 years);
Second a
ISCED 6 Doctoral studies “Promotion” (2-5 years)
Back_to_Table1

48
Greece:
ISCED 5A
First University (University Sector): Panepistimio:
University (Panepistimio) (8, 10 or 12 semesters)
Technical University (Polytechneio) (10 semesters)
School of Fine Arts (Scholi Kalon Technon) (10 semesters)
Greek Open University (Elliniko Anoikto Panepistimio – E.A.P.)
(12 subject units – 4 years)
Second University Sector: Post-graduate studies (Master):
University (Panepistimio) (1-2 calendar years)
Technical University (Polytechneio) (1-2 calendar years)
School of Fine Arts (Scholi Kalon Technon) (1-2 calendar years)
Greek Open University (Elliniko Anoikto Panepistimio-E.A.P.) (3 years)
ISCED 5B
First Technological educational institution (technological sector):
Technologiko Ekpaideftiko Idryma (T.E.I.);
(4 years of which 3.5 years school-based, plus 1 semester work-based)
Second Technological sector: post-graduate studies (Master):
a. Technological educational institutions (offering programmes in co-operation with university sector institutions in Greece, subcategory a: Panepistimio) (1-2 calendar years)
b. Technological educational institutions (offering programmes in co-operation with overseas University Sector Institutions) (1-2 calendar years)
Note: The data concerning these programmes are reported under ISCED 5A, second qualification.
ISCED 6
University sector (Post-graduate studies): Doctorate programme (Didaktoriko diploma);
University (Panepistimio) (6 semesters)
Technical University (Polytechneio) (6 semesters)
School of Fine Arts (Scholi Kalon Technon) (6 semesters)
Greek Open University (Elliniko Anoikto Panepistimio-E.A.P.) (6 semesters)
Post-graduate studies: post-doctorate programme (Metadidaktoriko diploma);
University sector (Panepistimio)
Research institutions
Note: Greek legislation does not give information concerning post-doc programmes such as theoretical duration of the programme under study. Also, institutions offering post-doc programmes are not classified into a specific category of institutions and thus an exhaustive list cannot be compiled
Back_to_Table1

49
Hungary:
ISCED 5A
First Ba/BSc programmes (3-3,5 years); College first programmes (3-4 years); University first programmes (4-6 years)
Second Ma/MSc programmes (2 years); postgraduate specialisation programmes (1-2 years)
ISCED 5B
First Tertiary vocational programmes (2-3 years)
Second a
ISCED 6 Doctoral programmes (Ph.D., DLA) (3 years)
The information on length refers to theoretical duration of the programme. Back_to_Table1
Iceland:
ISCED 5A
First First University Degree “Háskólanám 3ja/ 4ra/ 5/ 6 ára til fyrstu gráðu” (3, 4, 5 or 6 years);
Second Master’s Degree after 3-4 years 1st degree “Háskólanám, 1,5-2 viðbótarár ofan á 3-4 ár, tekin viðbótargráða” (1.5-2 years); Master's Degree after 5-6 years 1st degree “Háskólanám, 2 viðbótarár ofan á 5-6 ár, tekin viðbótargráða” (2 years)
ISCED 5B
First Tertiary Diploma “Æðra nám í 2 ár án háskólagráðu” (2 years); Tertiary Diploma “ Æðra nám í 3 ár án háskólagráðu ” (3 years); Teacher's Qualification (no degree) “Nám til kennsluréttinda án háskólagráðu” (1 year).
Second a
ISCED 6 Doctoral programme (Ph.D.) “Doktorsnám” (3-4 years)
Back_to_Table1
Ireland:
ISCED 5A
First Honours Bachelor’s Degree (3-4 years); Honours Bachelor’s Degree in (Veterinary) Medicine/ Dental Science/ Architecture (5-6 years)
Second Post-graduate Diploma (1 year); Master’s Degree (taught) (1 year); Masters Degree (by research) (2 years)
ISCED 5B
First Higher Certificate (2 years); Ordinary Bachelor Degree (3 years)
Second Ordinary Bachelor Degree (3 years)
ISCED 6 Doctoral Degree (Ph.D.) (3 years)
Back_to_Table1

50
Israel:
ISCED 5A
First Bachelor’s degree from universities (3 years); Bachelor’s degree from the Open University (6 years); Teacher training colleges – academic track (2-4 years)
Second University Second Degree (2 years); University Post-Graduate Diploma (2 years); Second Degree from academic colleges (2 years); Second Degree from the Open University
ISCED 5B
First Post-secondary education (2 years); Teacher training colleges – non-academic track (2 years)
Second a
ISCED 6 Third Degree (5-6 years)
Back_to_Table1
Italy:
ISCED 5A
First University Degree "Diploma di Laurea" (4-6 years); University Degree "Diploma Universitario" (3 years); Diploma di laurea di 1° livello (3 years); Diploma di laurea specialistica a ciclo unico (5-6 years)
Second Professional Post-graduate Diploma "Diploma di specializzazione" (2-5 years); Post-graduate Certificate "Attestato di partecipazione al Corso di perfezionamento" (1 year); Master’s of first and second level “master di 1°/2° livello”; Specialisation course “Specializzazione post-laurea”
ISCED 5B
First Diploma from Fine Arts Academy "Diploma di Accademia di Belle Arti" (4 years); Dramatic Art Studies Diploma "Accademia di arte drammatica – Diploma di attore o diploma di regista” (3 years); Higher Artistic Studies Diploma “Diploma di Istituto Superiore Industrie Artistiche" (4 years); Music Conservatory Diploma "Conservatorio musicale (specializzione di 2 anni)" (2 years); Dance Studies Diploma “Accademia di Danza – Diploma di avviamento e/o perfezionamento” (3 years)
Second a
ISCED 6 Doctorate "Titolo di Dottore di ricerca" (3 years)
Back_to_Table1
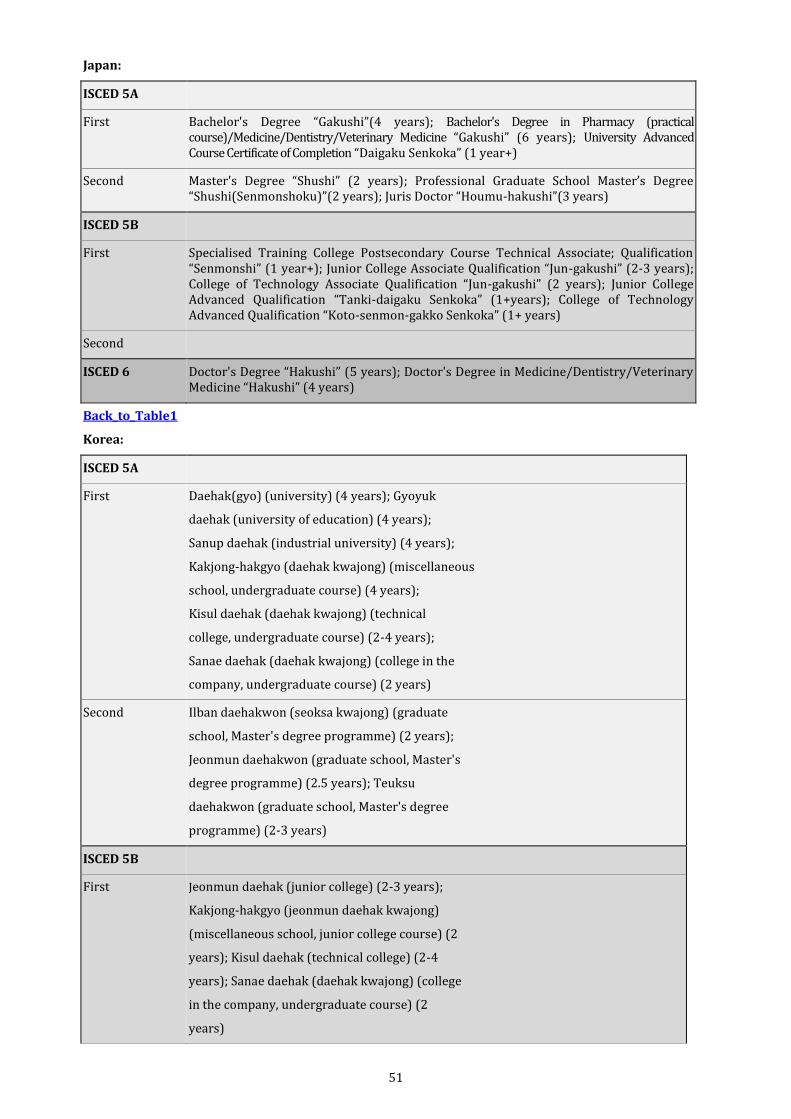
51
Japan:
ISCED 5A
First Bachelor's Degree “Gakushi”(4 years); Bachelor's Degree in Pharmacy (practical course)/Medicine/Dentistry/Veterinary Medicine “Gakushi” (6 years); University Advanced Course Certificate of Completion “Daigaku Senkoka” (1 year+)
Second Master's Degree “Shushi” (2 years); Professional Graduate School Master’s Degree “Shushi(Senmonshoku)”(2 years); Juris Doctor “Houmu-hakushi”(3 years)
ISCED 5B
First Specialised Training College Postsecondary Course Technical Associate; Qualification “Senmonshi” (1 year+); Junior College Associate Qualification “Jun-gakushi” (2-3 years); College of Technology Associate Qualification “Jun-gakushi” (2 years); Junior College Advanced Qualification “Tanki-daigaku Senkoka” (1+years); College of Technology Advanced Qualification “Koto-senmon-gakko Senkoka” (1+ years)
Second
ISCED 6 Doctor's Degree “Hakushi” (5 years); Doctor's Degree in Medicine/Dentistry/Veterinary Medicine “Hakushi” (4 years)
Back_to_Table1
Korea:
ISCED 5A
First Daehak(gyo) (university) (4 years); Gyoyuk
daehak (university of education) (4 years);
Sanup daehak (industrial university) (4 years);
Kakjong-hakgyo (daehak kwajong) (miscellaneous
school, undergraduate course) (4 years);
Kisul daehak (daehak kwajong) (technical
college, undergraduate course) (2-4 years);
Sanae daehak (daehak kwajong) (college in the
company, undergraduate course) (2 years)
Second Ilban daehakwon (seoksa kwajong) (graduate
school, Master's degree programme) (2 years);
Jeonmun daehakwon (graduate school, Master's
degree programme) (2.5 years); Teuksu
daehakwon (graduate school, Master's degree
programme) (2-3 years)
ISCED 5B
First Jeonmun daehak (junior college) (2-3 years);
Kakjong-hakgyo (jeonmun daehak kwajong)
(miscellaneous school, junior college course) (2
years); Kisul daehak (technical college) (2-4
years); Sanae daehak (daehak kwajong) (college
in the company, undergraduate course) (2
years)

52
Second
ISCED 6 Ilban daehakwon (baksa kwajong) (graduate
school, doctoral programme) (3 years);
Jeonmun daehakwon(baksa kwajong) (graduate
school, doctoral programme) (3 years);
Back_to_Table1
Luxembourg:
ISCED 5A
First University courses: Cours universitaires 1er cycle:DPCU (2 years); Stage pédagogique ; formation obligatoire pour l'accès à une profession de professeur d'enseignement secondaire (2 years); Stage pédagogique: formation obligatoire pour l'accès à une profession d'avocat avoué (2 years)
Second -
ISCED 5B
First Higher technician certificate: Brevet de technicien supérieur (BTS) (2 years); Short-term course in higher studies of administration or studies of informatics: Cycle court d'études supérieures en gestion ou en informatique (2 years)
Second Training of industrial engineers: Formation à l'ingénieur industriel (4 years); Initial training of primary and pre-primary teachers: Formation des instituteurs (3 years); Training of graduated educators, full-time: Formation d'éducateurs gradués (plein temps) (3 years); Training of graduated educators, while working: Formation d'éducateurs gradués (en cours d'emploi) (6 years)
ISCED 6 Etudes supérieures spécialisées en contentieux communautaires
Back_to_Table1
Mexico:
ISCED 5A
First Educación normal licenciatura [teacher training school programmes (Bachelor's degree programme)] (4 years); Licenciatura universitaria [university degree programmes (Bachelor's degree programme)] (4-5 years); Licenciatura tecnológica [technological institutes programmes (Bachelor's degree programme)] (4-5 years)
Second Programa de especialización [specialisation programme (short)] (1 years); Programa de maestría [Master's degree programme (long)] (2 years)
ISCED 5B
First Técnico superior [technological universities programmes (vocational associate's degree programmes)] (2 years)
Second -
ISCED 6 Programa de doctorado [Doctoral programme – Doctorate (Ph.D. Research)] (3 years)
Back_to_Table1

53
Netherlands:
ISCED 5A
First and second Higher professional education (long programmes) and university education, full-time programmes; (Lang) HBO en WO, voltijd (4-6 years); higher professional education (long programmes) and university education, part-time programmes, excl. the Open University; (Lang) HBO en WO, deeltijd, excl. the Open University; Open University qualification programmes; Open University, diploma programmes
ISCED 5B
First ISCED 5B programmes have been reintroduced in the Netherlands in 2007/08. It is therefore a growing field. In 2008/09 the number of students enrolled in ISCED 5B is sufficient for publication. The number of graduates is sufficient for publication from 2009/10 onwards.
Second -
ISCED 6 Research assistants; AIOs (4 years)
Back_to_Table1
New Zealand:
ISCED 5A
First Bachelor's Degree (3-5 years); Bachelor’s Honours Degree (4 years); Graduate Certificates, Graduate Diploma (1/2-1 year);
Second Master's Degree, (1-2 years), Post-graduate Certificate, Post-graduate Diploma (1 year)
ISCED 5B
First National and Local (institution-specific) Diploma (2 years)
Second a
ISCED 6 Doctor of Philosophy “Ph.D.”/ Higher Doctorate (3-5 years)
Back_to_Table1
Norway:
ISCED 5A
First First/lower degree (lavere grad), bachelor’s degree, short professional education, (3-4 years),
Second Second/higher degree (høyere grad: hovedfag/mag.art (2-3 years), master’s degree (2 years); Long professional programmes (lange profesjonsutdanninger), integrated master’s degrees (integrerte mastergrader): (5 years); Very long professional programmes (6 years)
ISCED 5B
First Tertiary education, < 3 years, 1st degree: Høyere utd., < 3 år, lavere grad (2-2.5 years)
Second a
ISCED 6 Doctorate, Ph.D.: Doktorgrad (3 years)/ unspecified
Back_to_Table1

54
Poland:
ISCED 5A
First 3-4 years of duration leading to a first degree
1st degree studies – Bachelor or Bachelor of Applied Science Studies; Studia pierwszego stopnia licencjackie lub inżynierskie; Professional degree (Bachelor’s degree) Licencjat (3 years); Professional degree Engineer (Bachelor of Applied Science degree); Inżynier (3.5-4 years)
Long-term first degree - Long first degrees considered to be part of the Bologna structure (duration 5 or more years)
University studies Master’s degree; Jednolite studia magisterskie (4.5-6 years); Master or Medical Doctor degree; Magister lub lekarz
University medical studies, veterinary studies; studia medyczne, studia weterynaryjne (5.5-6 years); Degree in medical sciences Master, Medical Doctor, Dentist, Veterinary Surgeon, Master of Pharmacy degree; Magister, lekarz, lekarz dentysta, lekarz weterynarii, magister farmacji
Second 2nd degree post-Bachelor Master diploma studies; Studia drugiego stopnia uzupełniające magisterskie (1.5-2 years); Professional degree: Master; Magister; Professional degree: Master of Applied Science; Magister inżynier
Non-dergee postgraduate studies; Studia podyplomowe (1-2 years); Postgraduate studies certificate; Świadectwo ukończenia studiów podyplomowych
ISCED 5B
First Teacher Training College Diploma Dyplom ukończenia Kolegium Nauczycielskiego (3 years); Foreign Language Teacher Training College Diploma Dyplom ukończenia Nauczycielskiego Kolegium Języków Obcych (3 years)
Social Workers’ College Diploma Dyplom ukończenia Kolegium Pracowników Służb Społecznych
(3 years)
Second a
ISCED 6 Scientific degree of Doctor (PhD.) Stopień naukowy doktora (approx. 4 years)
Back_to_Table1

55
Portugal:
ISCED 5A
First Licenciatura programmes (4 or 5 years, 6 years in special cases) provided by universities and polytechnics, leading to the licenciado degree
The licenciatura programmes provided by polytechnic education in most fields are two cycles/programmes called cursos bietápicos de licenciatura: the first cycle (3 years) leads to the bacharel degree (5B first), and the second cycle (1-2 years) leads to the licenciado degree (5A first)
Universities and polytechnics also offer to bacharéis (5B first), in the fields of teacher training and nursing, 1-2 year programmes leading to the licenciado degree, called cursos complementares de licenciatura
Second Especialização de pós-licenciatura (also identified frequently as Pós-Graduação) (1-2 years) – Specialised studies taken after licenciatura, leading to a certificate.
ISCED 5B
First Bacharelato (3 years) programmes provided by universities (rarely) and polytechnics, leading to the bacharel degree
Second Especialização pós-bacharelato (1 year) – Specialised studies taken after bacharelato, leading to a certificate
ISCED 6 Mestrado programmes (2 years after licenciatura) provided by university education, leading to the mestre degree.
Doutoramento programmes (variable, usually 3 years, sometimes 4 or 5 years after mestrado or, in certain conditions, after licenciatura), provided by universities, leading to the doutor degree
Back_to_Table1
The Slovak Republic:
ISCED 5A
First "Bachelor's" Degree 3-4 years; "Master's" degree (4 years); "Master's" degree in Engineering (5-5.5 years); Degree in Engineering/Architecture/Medicine/Veterinary Medicine (6 years)
Second Supplementary Educational Study – "Certificate" (2 years); Teaching an Additional Subject – "Diploma" (2-4 years) Examina Rigorosa – "Academic Degree (JUDr., PaedDr., RNDr., PhDr., etc.)" (usually 1 year);
ISCED 5B
First Post-secondary Specialisation Study – "Graduate's Diploma" (2-3 years); Higher Professional Studies – "Graduate's Diploma" (3 years); Dance Conservatory – "Graduate's Diploma" and "Certificate on Maturita Examination" (8 years); Conservatory and Secondary Schools Specialising in Arts – "Graduate's Diploma" and "Certificate on Maturita Examination" (6 years)
Second
ISCED 6 Doctorate Study (Ph.D., ArtD.) (3 years)
Back_to_Table1

56
Spain:
ISCED 5A
First Bachelor's degree – “Grado” (4 years); “Diplomado Universitario, Arquitecto Técnico e Ingeniero Técnico” (3 years);
Long first degree – First and Second Cycle “Licenciado, Arquitecto e Ingeniero” (5-6 years);
Second Master's degree – “Máster oficial” (1-2 years); “Especialidades Médicas” (2-5 years)
ISCED 5B
First Vocational Training – Advanced Level Qualification: “Técnico Superior – Ciclos Formativos de Formación Profesional de Grado Superior”; “Artes Plásticas y Diseño de Grado Superior” and “Deportivas de Grado Superior” (2 years); Military Programme Basic Grade “Militar de carrera de la escala básica” (2 years);
Second a
ISCED 6 Doctorate “Doctor” (4-6 years)
Back_to_Table1
Sweden:
ISCED 5A
First Bachelor's programme (general and professional qualifications, 3-3.5 years); Master's programme (professional qualifications, 4-4.5 years); Master's programme in Engineering, Pharmacy, Architecture, Forestry, Psychology and Dental Surgery (5 years); Master's programme in Medicine and Veterinary Medicine (5.5 years)
Second Master's programme (general qualifications, 2 years); Master's programme (general qualifications, 1 year); Postgraduate Diploma in Specialist Nursing (1-1.25 years); Postgraduate Diploma in Midwifery, Psychotherapy and Special Educational Needs (1.5 years)
ISCED 5B
First Diploma (general and professional qualifications, 2 years); Degree Certificate in Advanced Vocational Education and Training (2-3 years)
Second a
ISCED 6 Doctorate programmes – Licentiate (2 years) and Doctor (4 years)
Back_to_Table1

57
Switzerland:
ISCED 5A
First Universities of Teacher Education (“Pädagogische Hochschule / Haute École Pédagogique”) Certificate and Bachelor’s Degree (3 years); University of Applied Science (“Fachhochschule / Haute École Spécialisée”) Diploma and Bachelor’s Degree (3 years); University Bachelor's Degree (3 years) and Diploma “Hochschulen – Lizentiat, Diplom, Staatsexamen” (4-6 years)
Second University Master's Degree (2 years), Universities of Teacher Education (“Pädagogische Hochschule / Haute École Pédagogique”) Master's Degree (2 years), University of Applied Science (“Fachhochschule / Haute École Spécialisée”) Master's Degree (2 years), Univerisity, Universities of Teacher Education, or University of Applied Science Postgraduate Degree “Nachdiplom/ Diplôme du troisième cycle/ Postgrade” (1 year)
ISCED 5B
First Diploma of Higher Vocational Education – Stage I "Berufsprüfung/ Examen professionel" (1-2 years);
Diploma of Technical School "Höhere Fach- und Berufsschule/ École technique" (2 years); Teacher’s Certificate – Teacher Training II "Primarlehrerpatent/ Fachlehrerpatent" (3 years);
Polytechnic School Diploma from a Higher Vocational College “Höhere Fachschule/ École Professionnelle Supérieure/ Scuola Professionale Superiore” (3 years)
Second Trade Master's Diploma or equivalent in Higher Vocational Education – Stage II “Höhere Fachprüfung/ Examen Professionnel Supérieur” (1-2 years)
ISCED 6 University Doctorate “Doktorat/ Ph.D.” (4 years); Post doctorate degrees “Uni-versitäre Habiltationen” (number of years unknown)
Back_to_Table1
Turkey:
ISCED 5A
First University: Üniversite (4 years); Integrated higher school for hearing impaired: İşitme Engelliler Entegre Yüksek Okulu; Open Training Faculty: Açık Öğretim Fakültesi (4 years); Conservatory: Konservatuar (4 years); Medical science, veterinary, dentistry: Eczacılık Veterinerlik ve Tıp Fakültesi (5-6 years)
Second Enstitüler: Mastır (2 years); Specialisation in medical science: Tıpta Uzmanlık (4 years)
ISCED 5B
First Vocational higher Schools: Meslek Yüksek Okulu (2 years); Open training Faculty: Açık Öğretim Fakültesi (2 years); Integrated higher school for hearing impaired: İşitme Engelliler Entegre Yüksek Okulu (2 years)
Second
ISCED 6 Enstitüler: Doktora (4 years)
Back_to_Table1

58
The United Kingdom:
ISCED 5A
First Bachelor's Degree “BA, BSc, etc.” (3-4 years); Bachelor of Education “BEd” (4 years); Bachelor of Medicine “MB” (5 years+)
Second Master's Degree taught “MA, MSc, MBA, etc." (1 year); "Postgraduate Diploma/Certificate “PG Dip/PG Cert” (9m); Teaching Qualification – Postgraduate Certificate in Education “PGCE” (1 year); Master's Degree by Research “Mphil, etc.” (2 years+)
ISCED 5B
First Higher National Certificate “HNC” (1 year); Diploma of Higher Education “DipHE” (2 years); Higher National Diploma “HND” (2 years); Foundation Degree, National Vocational Qualification (NVQ) Level 4, and NVQ Level 5
Second a
ISCED 6 Doctor of Philosophy “Ph.D.” (3 years+)
Back_to_Table1
The United States:
ISCED 5A
First Bachelor's Degree Programme (4 years)
Second Master's Degree programme (short) (1-2 years); Master's Degree programme (long) (2-3 years); First-Professional Degree Programme (3 years); First-Professional Degree Programme – Medical (4 years)
ISCED 5B
First Vocational Associate's Degree Programme (2 years)
Second a
ISCED 6 Doctorate (Ph.D. – Research) (5 years)
Note: Academic associate's degree programmes (2 years) are not included, as for international comparisons these degrees are regarded as “intermediate degrees”. Post-graduate certificate programmes (typically 1 year) are not included. Back_to_Table1

59
Saudi Arabia:
ISCED 5A
First Bachelor's (4 years); Bachelor of Education (4 years); Bachelor of Medicine (5 years+)
Second Master's MA, MSc, MBA, etc." (2-3 years); "Postgraduate Diploma/Certificate (1 year)
ISCED 5B
First Intermediate Diploma (2 years), National Vocational Diploma (2-3 years)
Second a
ISCED 6 Doctor of Philosophy “Ph.D.” (3 years+)
Back_to_Table1

60
INDICATOR A4: To what extent does parents’ education influence access to tertiary education?
A4
Tables A4.1a-A4.4
Sources
Argentina
Australia
Austria
Belgium
Brazil
Canada
Chile
China
Colombia
Czech Republic
Denmark
Estonia
Finland
France
Germany
Greece
Hungary
Iceland
India
Indonesia
Ireland
Israel
Italy
Japan
Korea
Latvia
Luxembourg
Mexico
Netherlands
New Zealand
Norway
Poland
Portugal
Russian Federation
Saudi Arabia
Slovak Republic
Slovenia
South Africa
Spain
Sweden
Switzerland
Turkey
United Kingdom
United States

61
Sources and Methodology All data are based on the Survey of Adult Skills (PIAAC) 2012. PIAAC is the OECD Programme for the International Assessment of Adult Competencies. For more information on PIAAC please consult http://www.oecd.org/site/piaac/
For tables A4.1a and b only the 20-34 year-old students in tertiary education by gender, are included. The variables are: AGE_R, GENDER_R, B_Q02a=1; B_Q02b>=10 and B_Q02b<=13; B_Q02b identifies the students enrolled in higher education, “What is the level of the qualification you are currently studying for? 10: ISCED 5B, 11: ISCED 5A bachelor, 12: ISCED 5A master, 13: ISCED 6. This indicator includes information by parents education: variable PARED - Highest of mother or father's level of education: 1: Neither parent has attained upper secondary, 2: At least one parent has attained secondary and post-secondary, non-tertiary, 3: At least one parent has attained tertiary.
In table A4.3, the literacy and numeracy proficiency levels are based on a 500-point scale. Each level has been defined by particular score-point ranges. Six levels are defined for literacy and numeracy (Levels 1 through 5 plus below Level 1) which are grouped in four proficiency levels in Education at a Glance: Level 1 or below - all scores below 226 points, Level 2 - scores from 226 points to less than 276 points, Level 3 - scores from 276 points to less than 326 points, Level 4 or 5 - scores from 326 points and higher.
For Table A4.4 mobility is measured by comparing the level of educational attainment of the respondent (variable EDCAT3) with the level of education of the parents (variable PARED). The variables for downward mobility are: EDCAT3< PARED, upward mobility: EDCAT3> PARED, status quo: EDCAT3=PARED.
Back_to_Table1

62
INDICATOR A5: How does educational attainment affect participation in the labour market?
A5
Tables A5.1-A5.6 Tables A5.7a-A5.10b
Methodology Sources
Sources
Argentina Australia AUS
Austria AUT
Belgium
Brazil
Canada CAN
Chile
China
Colombia
Czech Republic
Denmark
Estonia EST
Finland FIN
France FRA
Germany DEU
Greece
Hungary HUN
Iceland ISL
India
Indonesia
Ireland IRL
Israel ISR
Italy
Japan JPN
Korea
Latvia
Luxembourg LUX
Mexico MEX
Netherlands NLD
New Zealand
Norway NOR
Poland POL
Portugal PRT
Russian Federation
Saudi Arabia
Slovak Republic
Slovenia
South Africa
Spain
Sweden SWE
Switzerland CHE
Turkey TUR
United Kingdom UKM
United States

63
Tables A5.1 to A5.6
Methodology The attainment profiles are based on the percentage of the population aged 25 to 64 that has completed a specified level of education. The International Standard Classification of Education (ISCED-97) is used to define the levels of education (see Indicator A1).
The active population (labour force) is the total number of employed and unemployed persons, in accordance with the definition in the Labour Force Survey.
Employed individuals are those who, during the survey reference week: i) work for pay (employees) or profit (self-employed and unpaid family workers) for at least one hour; or ii) have a job but are temporarily not at work (through injury, illness, holiday, strike or lock-out, educational or training leave, maternity or parental leave, etc.). The employment rate refers to the number of persons in employment as a percentage of the working-age population (the number of employed people is divided by the number of all working-age people). Employment rates by gender, age, educational attainment, programme orientation and age groups are calculated within each of these categories; for example the employment rate among women is calculated by dividing the number of employed women by the total number of women who are active in the labour force.
Inactive individuals are those who are, during the survey’s reference week, neither employed nor unemployed, i.e. individuals who are not looking for a job. The number of inactive individuals is calculated by subtracting the number of active people (labour force) from the number of all working-age people. The inactive rate refers to inactive persons as a percentage of the population (i.e. the number of inactive people is divided by the number of all working-age people). Inactive rates by gender, age, educational attainment, programme orientation and age groups are calculated within each of these categories; for example, the inactive rate among individuals with a tertiary education degree is calculated by dividing the number of inactive individuals with tertiary education by the total number of working-age people with tertiary education.
Unemployed individuals are those who are, during the survey reference week, without work (i.e. neither had a job nor were at work for one hour or more in paid employment or self-employment), actively seeking employment (i.e. had taken specific steps during the four weeks prior to the reference week to seek paid employment or self-employment), and currently available to start work (i.e. were available for paid employment or self-employment before the end of the two weeks following the reference week). The unemployment rate refers to unemployed persons as a percentage of the labour force (i.e. the number of unemployed people is divided by the sum of employed and unemployed people). Unemployment rates by gender, age, educational attainment, programme orientation and age groups are calculated within each of these categories; for example, the unemployment rate among women is calculated by dividing the number of unemployed women by the total number of women who are active in the labour force.
Back_to_Table1
Sources Data on educational attainment and labour market status are taken from OECD and Eurostat databases. LSO (Labour market, economic and social outcomes of learning) Network Labour Force Survey (LFS) for most countries; and European Union LFS (EU-LFS) for Denmark, Finland, Iceland, Ireland, Latvia, Luxembourg and Slovenia. For tables with data from 2000, EU-LFS has also been used for France and Italy for the year 2000. Specific reliability thresholds have been applied; see Table 1 (Indicator A1).
Data for Denmark, Finland, Iceland, Ireland, Latvia, Luxembourg and Slovenia for tables A5.5a, A5.5b (web), A5.5c (web) has been obtained through the European Union LFS-VET, the European Union LFS which contains information about the fields of education. This survey and all data related to it are provided by Eurostat. For more information on VET see Indicator A1.
Finally, data on earnings for table A5.6 are taken from a special data collection carried out by the OECD LSO (labour market, economic and social outcomes of learning) Network on the earnings of those working full-time and full-year. Full-time basis refers to people who have worked all year long and at least 30 hours per week. The length of the reference period varies from one week to one year. Self-employed people are excluded in some countries. For national definitions of full-time employment, see Definitions in Indicator A6 and subsection on Indicator A6 in this Annex 3.
For further information on sources and notes on specific countries see Indicator A1, Back_to_Table1

64
Tables A5.7a-A5.10b : PIAAC
Sources and Methodology All data in Tables A5.7a-A5.10b are based on the Survey of Adult Skills (PIAAC) 2012. PIAAC is the OECD Programme for the International Assessment of Adult Competencies. For more information on PIAAC please consult http://www.oecd.org/site/piaac/
The literacy and numeracy proficiency levels are based on a 500-point scale. Each level has been defined by particular score-point ranges. Six levels are defined for literacy and numeracy (Levels 1 through 5 plus below Level 1) which are grouped in four proficiency levels in Education at a Glance: Level 1 or below - all scores below 226 points, Level 2 - scores from 226 points to less than 276 points, Level 3 - scores from 276 points to less than 326 points, Level 4 or 5 - scores from 326 points and higher.
The variables used in this indicator are:
- Educational attainment levels divided in three groups: Below upper secondary education, Upper secondary or post-secondary non-tertiary education and Tertiary education;
- Age group 25-64 year-olds: variable AGE_R:
- Distinction male and female: variable GENDER_R;
- Labour market status: variable C_D05, 1: employed, 2: unemployed, 3: inactive
For Tables A5.10 only those working are taken into account (variable C_D09=1) and part-time work is defined by those working less than 30 hours per week (variable D_Q10>0 and D_Q10<30).
Back_to_Table1

65
INDICATOR A6: What are the earnings premiums from education?
A6
Tables A6.1-A6.6 Tables A6.6a-A6.7
Methodology Sources
Sources
Argentina
Australia
Austria
Belgium
Brazil
Canada CAN
Chile
China
Colombia
Czech Republic CZE
Denmark DNK
Estonia
Finland
France FRA
Germany
Greece
Hungary
Iceland
India
Indonesia
Ireland IRL
Israel
Italy
Japan
Korea
Latvia
Luxembourg
Mexico
Netherlands
New Zealand NZL
Norway NOR
Poland
Portugal
Russian Federation
Saudi Arabia
Slovak Republic
Slovenia
South Africa
Spain
Sweden
Switzerland
Turkey
United Kingdom
United States

66
Tables A6.1-A6.7
Methodology The total (men plus women, i.e. M+W) average for earnings is not the simple average of the earnings figures for men and women, but the average based on earnings of the total population. This overall average weights the average earnings figure separately for men and women by the share of men and women at different levels of attainment.
Back_to_Table1
Sources The indicator is based on two different data collections. One is the regular data collection by the OECD LSO (Labour Market and Social Outcomes of Learning) Network that takes account of earnings from work for all individuals during the reference period, even if the individual has worked part time or part year; this database contains data on student versus non-student earnings. It also gathers information on the earnings of those working full time and full year, for Table A6.3a. The second data collection is the Survey of Adult Skills (PIAAC), for Tables A6.6a, b and c and A6.7. Data on PIAAC proficiency levels are based on the Survey of Adult Skills (PIAAC) 2012. PIAAC is the OECD Programme for the International Assessment of Adult Competencies. For more information on PIAAC please consult http://www.oecd.org/site/piaac/
Regular earnings data collection
Regular earnings data collection (used in all tables except Tables A6.6 and A6.7) provides information based on an annual, monthly or weekly reference period, depending on the country. The length of the reference period for earnings also differs. Australia, New Zealand and the United Kingdom reported data on weekly earnings; Belgium, Brazil, Chile, Estonia, Finland, Israel (three months), Korea, Portugal and Switzerland reported monthly data; and all other countries reported annual data. France reported annual data from 2008 onwards, and monthly data up to and including 2007. Data on earnings are before income tax, except for Belgium, Korea and Turkey, where earnings reported are net of income tax. Data on earnings for individuals in part-time work are excluded in the regular data collection for the Czech Republic, Hungary, Portugal and Slovenia; and data on part-year earnings are excluded for the Czech Republic, Hungary and Portugal. Finally, earnings for self-employed are excluded for many countries and, in general, there is no simple and comparable method to separate earnings from employment and returns to capital invested in the business.
Since earnings data differ across countries in a number of ways, the results should be interpreted with caution. For example, in countries reporting annual earnings, differences in the incidence of seasonal work among individuals with different levels of educational attainment will have an effect on relative earnings that is not similarly reflected in the data for countries reporting weekly or monthly earnings. In addition, data available in Tables A6.2a and b concern relative earnings and therefore should be used with caution to assess the evolution of relative earnings for different levels of education. For Tables A6.5a and b, differences between countries could be the result of differences in data sources and in the length of the reference period. For further details, see Annex 3.
Full-time and full-year data collection
Full-time and full-year data collection supplies the data for Table A6.3a (gender differences in full-time earnings) and Table A5.6 (differences in full-time earnings by educational attainment).
For the definition of full-time earnings (in Tables A6.3a and A5.6), countries were asked whether they had applied a self-designated full-time status or a threshold value of typical number of hours worked per week. Belgium, France, Italy, Luxembourg, Portugal, Spain, Sweden and the United Kingdom reported self-designated full-time status; the other countries defined the full-time status by the number of working hours per week. The threshold was 44/45 hours per week in Chile, 37 hours per week in the Slovak Republic, 36 hours in Hungary and Slovenia, 35 hours in Australia, Canada, Estonia, Germany, Israel, Korea, Norway and the United States, and 30 hours in the Czech Republic, Greece and New Zealand. Other participating countries did not report a minimum normal number of working hours for full-time work. For some countries, data on full-time, full-year earnings are based on the European Survey on Income and Living Conditions (EU-SILC), which uses a self-designated approach in establishing full-time status.

67
Survey of Adult Skills (PIAAC)
Data for Tables A6.6 and A6.7 are taken from the Survey of Adult Skills (PIAAC); PIAAC is the OECD Programme for the International Assessment of Adult Competencies.
“Monthly earnings” includes bonuses for wage and salary earners and self-employed individuals, PPP corrected USD. The wage distribution was trimmed to eliminate the 1st and 99th percentiles.
Only people working full time are taken into account; a person is considered to be working full time if the working hours per week are greater than or equal to 30.
Back_to_Table1

68
National sources and reliability thresholds Table 6: National data collection sources and reliability thresholds (2012)
Country Source Reference period
Length of reference period
Earnings annual calculation method
Full-time definition
Full-time method
Full-year method
Primary Sampling Unit
Sample size Non-response rate
Minimum cell value
OECD
Australia Australian Bureau of Statistics: Survey of Disability, Ageing and Carers
2012 Week Not reported
35 hours per week
Employed persons who usually worked 35 hours or more a week (in all jobs) and those who, although usually working less than 35 hours a week, worked 35 hours or more during the reference week (week prior to interview).
Employed persons who usually worked 35 hours or more a week (in all jobs) and those who, although usually working less than 35 hours a week, worked 35 hours or more during the reference week (week prior to interview).
Household 27,400 private dwellings and 500 non-private dwellings and 1,000 cared-accommodation establishments. Resulting in 68,802 people in private and non-private dwellings and 10,362 people in cared-accommodation establishments. Note people in care cared-accommodation establishments were not asked questions on earnings and are therefore excluded from the data provided.
Private dwellings = 10.2%,
Non-private dwellings = 19.6%.
Population estimates with a relative standard error of 25% to 50% should be used with caution. Population estimates with a relative standard error greater than 50% are considered too unreliable for general use.
Austria Wage tax data (administrative data), micro census
2012 The calendar year
Not reported
Administrative data source includes information about full-time
Working full-time during the main part of the reference period
Administrative source includes information about length of work in the reference period
Household Not reported 5.5% 6 000
Belgium Labour Force Survey
2011 Month Not applicable
Not applicable Not applicable Not applicable
Household 39 500 households, 95 940 individuals
36.6% 5 000
Belgium (for FTFY)
European Union Statistics on Income and Living
2011 The calendar year
Not reported
Working hours recognized as full-time by
Working full-time the whole reference
Source has verified that the person
Household 5 910 households 36.7% 50 observations

69
Country Source Reference period
Length of reference period
Earnings annual calculation method
Full-time definition
Full-time method
Full-year method
Primary Sampling Unit
Sample size Non-response rate
Minimum cell value
Conditions (EU-SILC)
respondent (self-designated)
period had been working full-time the whole reference period
Canada Survey of Labour and Income Dynamics
2011 The calendar year
Not reported
35 hours per week
Working full-time the whole reference period
Source has verified that the person had been working full-time the whole reference period
Household 35 007 respondents (individual level)
67.3% (household response rate)
Unweighted count: 25 => Weighted, this corresponds to about 12 500.
Chile National Socioeconomical Caracterization Survey
2011 Month Monthly earning * 12, with adjustments for typical additional payments/ reductions
44 hours for public sector employees and 45 hours for private sector employees
Working full-time the whole reference period
Working full-time at the time of the survey
Household 59,084 households , 200,302 individuals
Not reported 50
Czech Republic
Average Earnings Information System
2011 The calendar year
Not reported
30 hours per week
Working full-time the whole reference period
Source has verified that the person had been working full-time the whole reference period
Establishment 18 290 establishments, 2 092 313 employees
23.3% 10 employees in 3 establishments
Denmark Personal Income Statistics, The attainment Register
2012 The calendar year
Not reported
Not reported Working full-time the whole reference period
Working hours during the whole year are min. 1 724 hours
Not reported Not reported Not reported Not reported
Estonia Labour Force Survey
2012 Month Not reported
35 hours per week
Working full-time during a part of the reference period for earnings (no
Working full-time during a part of the reference period for earnings (no
Individual Not reported 3.2% 1.1

70
Country Source Reference period
Length of reference period
Earnings annual calculation method
Full-time definition
Full-time method
Full-year method
Primary Sampling Unit
Sample size Non-response rate
Minimum cell value
info for the whole reference period)
info for the whole reference period)
Finland Employment Statistics and Structure of Earnings Survey
Regular earnings: 2011
FTFY data : 2012
Student earnings: 2011
Month Not reported
90% of contractual working hours
Working full-time during a part of the reference period for earnings (no info for the whole reference period)
Working full-time during a part of the reference period for earnings (no info for the whole reference period)
Individual Not reported Not reported 30
France European Union Statistics on Income and Living Conditions (EU-SILC)
2010 The calendar year
Not reported
Working hours recognized as full-time by respondent (self-designated)
Working full-time the whole reference period
Source has verified that the person had been working full-time the whole reference period
Household Not reported 17% 0 for numerator, a sample of 100 for a denominator, i.e. a weighted number of 235 000
Germany German Socio-economic Panel Study (SOEP)
2012 The calendar year
Monthly earning * 12, with adjustments for typical additional payments/ reductions
Working hours recognized as full-time by respondent (self-designated)
Working full-time the whole reference period
Source has verified that the person had been working full-time the whole reference period
Individual Not reported Not reported 30
Greece European Union Statistics on Income and Living Conditions (EU-SILC)
2012 The calendar year
Not reported
30 hours per week
Working full-time the whole reference period
Source has verified that the person had been working full-time the whole reference period
Household Not reported Not reported 40 cases
Hungary Structure of Earnings Survey
2012 The calendar
Monthly earning * 12, with
Minimum 36 hours per week
Working full-time at the time of the
Working full-time during a part of the
Individual Not reported 20% In our publications the mean earning values are not published if the SD is bigger than 20% of the

71
Country Source Reference period
Length of reference period
Earnings annual calculation method
Full-time definition
Full-time method
Full-year method
Primary Sampling Unit
Sample size Non-response rate
Minimum cell value
year adjustments for typical additional payments/ reductions
survey reference period for earnings (no complete information for the whole reference period)
mean, and the cell value is flagged if the SD is bigger than 10% of the mean.
Iceland Not applicable Not applicable
Not applicable
Not applicable
Not applicable Not applicable Not applicable
Not applicable Not applicable Not applicable Not applicable
Ireland European Union Statistics on Income and Living Conditions (EU-SILC)
2011 Not reported
Not reported
Not reported Not reported Not reported Not reported Not reported 0.7% Not reported
Israel Income Survey & Household Expenditure Survey
2012 3 months Monthly earning * 12, with adjustments for typical additional payments/ reductions
35 hours per week
Working full-time at the time of the survey
Working full-time at the time of the survey
Household 14 996 for the Income Survey and 6 051 for the Household Expenditure Survey
13% 30 cases (sample size)
Italy European Union Statistics on Income and Living Conditions (EU-SILC)
2010 The calendar year
Monthly earnings times 12 without any adjustments
Working hours recognized as full-time by respondent (self-designated)
Working full-time for most of the reference period
The number of months of monthly earnings was the main source when available; for independent workers this number was estimated on the basis of yearly incomes
Counties (two-stage sample: Counties/Households)
19 399 households, 47 841 individuals
23.08% 0; minimum number of sample units below which data are to be published (or not): 15
Japan Not reported 2012 Not reported
Not reported
Not reported Not reported Not reported Not reported Not reported Not reported Not reported
Korea Labour Force Survey
2012 Month We report information of
35 hours per week
Working full-time the whole reference
Working full-time during a part of the
Household Not reported Not available Not available

72
Country Source Reference period
Length of reference period
Earnings annual calculation method
Full-time definition
Full-time method
Full-year method
Primary Sampling Unit
Sample size Non-response rate
Minimum cell value
earnings by monthly data (August, 2012)
period reference period for earnings (no complete information for the whole reference period)
Luxembourg European Union Statistics on Income and Living Conditions (EU-SILC)
2012 The calendar year
Not reported
Working hours recognized as full-time by respondent (self-designated)
Working full-time the whole reference period
Source has verified that the person had been working full-time the whole reference period
Household 5 000 households, 11 000 individuals
44% 50
Mexico Not applicable Not applicable
Not applicable
Not applicable
Not applicable Not applicable Not applicable
Not applicable Not applicable Not applicable Not applicable
Netherlands Structure of Earnings Survey
2010 Not reported
Not reported
Not reported Working full-time the whole reference period
Source has verified that the person had been working full-time the whole reference period
Not reported Not reported Not available 100
New Zealand New Zealand Income Survey
2012 Week No estimation is made
30 hours a week or more
Working full-time at the time of the survey
Working full-time at the time of the survey
Individual 29000 respondents Total response rate = 82.0% Part refusal rate = 3.3%
1 000 weighted people
Norway Income Statistics for Households
2011 The calendar year
Not reported
35 hours per week
Working full-time the whole reference period
Source has verified that the person had been working full-time the whole reference period
Not reported Not reported Not reported Not reported
Poland Not reported 2012 Not Not Not reported Not reported Not reported Not reported Not reported Not reported Not reported

73
Country Source Reference period
Length of reference period
Earnings annual calculation method
Full-time definition
Full-time method
Full-year method
Primary Sampling Unit
Sample size Non-response rate
Minimum cell value
reported reported
Portugal Staff Lists 2011 Month Not reported
Working hours recognized as full-time by respondent (self-designated)
Working full-time at the time of the survey
Not reported Not reported Not reported Not reported Not reported
Slovak Republic
Average Earnings Information System
2012 The calendar year
Not reported
37 hours per week
Working full-time the whole reference period
Source has verified that the person had been working full-time the whole reference period
Individual Not reported Not reported Minimum value is 3 companies 10 employees
Slovenia Tax Register, Statistical Register of Employment
2012 The calendar year
Not reported
36 hours per week
Working full-time for the same employer in both December of the reference year and of the previous year
Working full-time for the same employer in December of the reference year and in December of the previous year
Not reported Not reported Not reported 10
Spain European Union Statistics on Income and Living Conditions (EU-SILC)
2011 The calendar year
Not reported
Working hours recognized as full-time by respondent (self-designated)
Working full-time the whole reference period
Source has verified that the person had been working full-time the whole reference period
Household 12 714 households 26% Not reported
Sweden Income Register and European Union Statistics on Income and Living Conditions (EU-SILC)
2012 The calendar year
Not reported
Working hours recognized as full-time by respondent (self-designated)
Working full-time the whole reference period
Working full-time during a part of the reference period for earnings (no complete information for the whole reference
Individual Not reported Not reported Not reported

74
Country Source Reference period
Length of reference period
Earnings annual calculation method
Full-time definition
Full-time method
Full-year method
Primary Sampling Unit
Sample size Non-response rate
Minimum cell value
period)
Switzerland Swiss Labour Force Survey
2011 Month Monthly earning * 12, with adjustments for typical additional payments/ reductions
Not reported Not reported Not reported Household Not reported 30.0% If N<5, extrapolation cannot be made because of data protection. The results have not been published because of data protection”.
If 5 ≤ N < 90, extrapolation is possible but the results should be interpreted with caution.
Turkey Not reported 2012 Not reported
Not reported
Not reported Not reported Not reported Not reported Household: 17 562 Total household member aged 15 and over: 47 526
9% Not reported
United Kingdom
Labour Force Survey
2012 Week Weekly earnings *52 without any adjustments
Working hours recognized as full-time by respondent (self-designated)
Working full-time at the time of the survey
Working full-time at the time of the survey
Household Approximately 60 00 households / 130 000 persons
Approx. 20% 18 000
United States Annual Social and Economic Supplement to the Current Population Survey
2012 The calendar year
Not reported
35 hours per week
Working full-time the whole reference period
In the survey, respondents are categorized as FTFY when working Full Year (50+ weeks), Full Time (35+ hours per week)
Household 204 983 persons who represent the civilian non institutional population in the United States
Not reported Population estimates greater than or equal to 75 000
Partners
Argentina Not applicable Not applicable
Not applicable
Not applicable
Not applicable Not applicable Not applicable
Not applicable Not applicable Not applicable Not applicable
Brazil Household Survey 2011 Month Not reported
Not reported Not reported The question used is: "Number of years in the main job,
Household Not reported Not reported Not reported

75
Country Source Reference period
Length of reference period
Earnings annual calculation method
Full-time definition
Full-time method
Full-year method
Primary Sampling Unit
Sample size Non-response rate
Minimum cell value
counted until the reference date" and we considered working full year who had at least one complete year in the main job in the reference date.
China Not applicable Not
applicable Not applicable
Not applicable
Not applicable Not applicable Not applicable
Not applicable Not applicable Not applicable Not applicable
India Not applicable Not
applicable Not applicable
Not applicable
Not applicable Not applicable Not applicable
Not applicable Not applicable Not applicable Not applicable
Indonesia Not applicable Not
applicable Not applicable
Not applicable
Not applicable Not applicable Not applicable
Not applicable Not applicable Not applicable Not applicable
Russian Federation
Not applicable Not applicable
Not applicable
Not applicable
Not applicable Not applicable Not applicable
Not applicable Not applicable Not applicable Not applicable
Saudi Arabia Not applicable Not
applicable Not applicable
Not applicable
Not applicable Not applicable Not applicable
Not applicable Not applicable Not applicable Not applicable
South Africa Not applicable Not
applicable Not applicable
Not applicable
Not applicable Not applicable Not applicable
Not applicable Not applicable Not applicable Not applicable

76
Notes on specific countries Canada: The methodology used for calculating earnings has changed in 2012. As a result, the data from the current publication is not directly comparable with data from editions previous to Education at a Glance 2012. Back_to_Table1
Czech Republic: The term full time is a self-designated full-time status. Working hours are defined for a concrete position which is the same as real time usage defined as a full-time. As far as the working hours defined for concrete job differ from real time the employee spends at work, it is defined as part-time. There is another additional criterion that says: if the defined working hours for concrete position are less than 30 hours per week, it automatically marked as a part-time. But the usual working time is 40 hours per week for full-time. Back_to_Table1
Denmark: There was a change in the coverage of the income definition in 2003. As a consequence, the data from 2003 and onwards in the trends series on earnings are not directly comparable with data from 2002 and earlier years. Back_to_Table1
France: From 2006 inclusion of quarterly and yearly bonuses and self-employed declared earnings from work tend to increase earnings differences between educational levels and relative indexes. The French source on incomes data has changed. The source on incomes data has been the French Enquête Emploi en Continu (EEC) (Labour Force Survey, LFS) until year 2007; incomes were caught within a reference period of one month. Starting for incomes on year 2008, the new source is Statistiques sur les Revenus et les Conditions de Vie (SRCV) (Statistics on Incomes and Living Conditions, SILC), whose the reference period lasts 12 months.Back_to_Table1
Ireland: The source for the data in all tables is the EU statistics on income and living conditions (EU-SILC). The results for the Irish EU-SILC for 2010 have been revised following extensive investigation of anomalies in the data. There was no significant change in the deprivation and consistent poverty rates. Due to the timescale involved there was not time to revise the 2010 data published for Ireland in this years EAG. The data for 2010 to be published in subsequent editions of EAG will be based on the revised data. It is estimated that there will be little or no change to the EAG indicators. Back_to_Table1
New Zealand: There is a gender and level interaction affecting earnings differentials for tertiary-type B in Education at a Glance. New Zealand men with type B qualifications earn more than men with upper secondary qualifications; women likewise. However, when men and women are combined, the combined earnings for those with type B have in past years appeared lower than those with upper secondary. The much higher proportion of women with older lower-paying type B qualifications (e.g. nursing diplomas) acts to artificially lower the overall Men + Women type B premium. Back_to_Table1
Norway: Information on those working full time full year is collected from an administrative register on employees; the Employer and Employee register (EE-register). The group is defined as those being registered with a job each month through the year with a contractual number of at least 35 hours per week each month. The EE register covers about 90 per cent of all the employees. Those not covered are mainly employees with short term jobs.
The EE-register has not been used for compiling these kind of data so far. There are some quality problems with the EE-register which probably results in an overestimation of the number of full time full year employees. Updating of the EE-register is done by the employers. Some employers might have forgotten to report about employees that have left their job before the end of the year and some might have forgotten to report about employees that have decreased their contractual hours below 35 hours.
Back_to_Table1
Tables A6.6a-A6.7: PIAAC
Sources All data in Tables A6.6a-A6.7 are based on the Survey of Adult Skills (PIAAC) 2012. PIAAC is the OECD Programme for the International Assessment of Adult Competencies. For more information on PIAAC please consult http://www.oecd.org/site/piaac/
The variables used in this indicator are the educational attainment levels divided in three groups (Below upper secondary education, Upper secondary or post-secondary non-tertiary education and Tertiary education), the age group 25-64 year-olds (variable AGE_R), the distinction male and female (variable GENDER_R) and only those working full time are taken into account (variable C_D09=1 and D_Q10>=30). For

77
salary variable EARNMTHALLPPP (monthly earnings including bonuses for wage and salary earners and self-employed, PPP corrected $USD) with min and max 1% excluded was used.
For Tables A6.7a and b, available on line, it is included the information on the years since obtained the most recent qualification (variable LEAVEDU, Less than 15 years: AGE_R-LEAVEDU<15, More than 15 years: AGE_R-LEAVEDU>=15).
The literacy and numeracy proficiency levels are based on a 500-point scale. Each level has been defined by particular score-point ranges. Six levels are defined for literacy and numeracy (Levels 1 through 5 plus below Level 1) which are grouped in four proficiency levels in Education at a Glance: Level 1 or below - all scores below 226 points, Level 2 - scores from 226 points to less than 276 points, Level 3 - scores from 276 points to less than 326 points, Level 4 or 5 - scores from 326 points and higher. Back_to_Table1

78
INDICATOR A7: What are the incentives to invest in education?
A7
Tables A7.1-A7.6
Methodology Sources
Argentina
Australia
Austria
Belgium BEL
Brazil
Canada
Chile
China
Colombia
Czech Republic
Denmark DNK
Estonia
Finland
France
Germany
Greece
Hungary
Iceland
India
Indonesia
Ireland
Israel
Italy
Japan
Korea
Latvia
Luxembourg
Mexico
Netherlands
New Zealand NZL
Norway
Poland
Portugal
Russian Federation
Saudi Arabia
Slovak Republic
Slovenia
South Africa
Spain
Sweden
Switzerland
Turkey
United Kingdom
United States

79
Methodology The Net Present Value (NPV) represents a measure of the economic benefit obtained, over an individual’s working life, relative to the cost of obtaining higher levels of education. The NPV can be measured from either the individual’s or society’s point of view. Private NPV measures the discounted net economic payoff to an individual investing in obtaining a higher level of education. Public NPV measures the net fiscal benefits to society of an individual obtaining a higher level of education. The formulae for calculating both types of return are the same, although the costs and benefits differ between the two.
The Net Present Value (NPV) calculation is an actuarial method of discounting over time the cost of making an investment relative to the benefits that the investment produces. NPV is a traditional criterion for making investment choices, in that it provides a monetary estimate of the value of investments in terms of their economic benefits, after accounting for the costs of the investments. NPV is calculated as follows:
da
dt
t
t
d
t
t
t iBiCNPV641
0
)1()1( //
Where:
Ct = costs at period t (t 0, d-1)
Bt = benefits at period t (t d, 64-a-d)
i = the discount rate at which future costs and benefits are valued in the present
d = the duration of studies (in years)
a = age at the beginning of education/training
64 = age at the last year of activity in the labour market.
The discount rate (i) is fixed to 3%, which reflects the real interest one can expect, under normal circumstances, by investing in long-term government bonds in most countries.
The composition of costs and benefits
The cost elements are the following:
1. Foregone earnings
Foregone earnings are the value of earnings that would have been obtained if the individual had worked at the lower level of education instead of making the investment in education.
2. Training costs
Two forms of educational expenditure are taken into account in the analysis:
- Public expenditures on education (for infrastructure, teachers’ wages, as well as subsidies, etc.).
- Private expenditures (tuition, other fees, etc.).
3. Additional tax payments resulting from an education-induced increase in taxable income and decrease in transfers.
These costs can be grouped as follows:
Private costs:
Public costs:
Lost tax receipts during the training + public expenditures + grants allocated (at tertiary level of education only)
Foregone earnings
+ direct private expenditures - grants allocated (at tertiary level of education only)+ increased future taxes + lost transfers

80
In the calculation of private NPV, private costs are included; and in the calculation of public rates of return, public costs are included.
The benefits associated with the individual’s decision to invest in training are:
1. Increased earnings levels arising from a higher level of education.
2. A lower probability of being unemployed associated with higher education.
3. For the public sector, additional tax receipts, plus less transfers to pay.
These can be grouped as follows:
Private benefits:
Public benefits:
In calculating the private NPV, private benefits are included. In calculating the public NPV, public benefits are included.
NPV calculations are based on the same method as internal rate of return (IRR) calculations. The main difference between the two methods lies in how the interest rate is set. For calculations developed within the IRR framework, the interest rate is raised to the level at which the economic benefits equal the cost of the investment and it pinpoints the discount rate at which the investment breaks even. In the NPV approach, the discount rate is fixed at the beginning of the analysis and the economic benefits and costs are then valued in line with the chosen interest rate. The NPV has some advantages over IRR in that it is better suited to long-term investments. IRR typically favours short-term investments with large cash flows that are close in time with the investment. The NPV is thus better suited for educational investments that typically span several decades. A further advantage of the NPV method is its flexibility and the possibility of analysing the different components that make up the overall returns.
The NPV ranks investments differently from the IRR because of differences in the magnitude of cash flows and how these are distributed over the lifetime of the investment. Internal rates of return are given in the tables to provide some guidance on the interest rate at which the investment breaks even in different countries. However, the analysis focuses on how the value of education differs between countries. The economic benefits of tertiary education are compared to upper secondary education, and those for upper secondary education are compared to below upper secondary education. In the calculations, women are benchmarked against women and men against men. Back_to_Table1
Data and model assumptions
Data
1. Data on earnings for individuals in part-time work are excluded for the Netherlands, Japan and the United Kingdom. The source of these data is The Education and Earnings database for which data were collected by Statistics Sweden.
2. Starting age of education and duration of studies are based on indicator B1 (Education at a Glance 2011), or school expectancy, indicator C1 (Education at a Glance 2011).
3. Annual expenditure on educational institutions per student for all services by type of programme (lower, upper and tertiary), as well as relative proportions of public and private expenditure on educational institutions, by level of education (no distinction lower/upper secondary) refer to indicators B1 and B3 (Education at a Glance 2011), respectively.
4. Tax rates on earnings and transfers (housing benefits + social assistance) are taken from the OECD database on Benefits and Wages, provided by the Directorate for Employment, Labour and Social Affairs.
5. Unemployment rates by age and by level of education are derived from NEAC Network B database (Education at a Glance 2011).
6. Grants are derived from a LSO network special data collection, Economic Working Group.
Increases in earnings+ higher probability of being employed
Additional tax receipts + transfers saving

81
The assumptions of the model
1. Foregone earnings during the training period are assumed to be the minimum wage when the individual has continued directly to the next highest level of education (at upper secondary level of education, as well as at the tertiary level of education) before entering the labour market.
2. Lifetime earnings streams are estimated from cross-section data based on age cohorts. The average annual earnings for each age group were assigned to the midpoint of the interval. Between two midpoints, earnings have been adjusted to fit a straight line using the method of least squares, along a linear trend. In cross-section data, earnings differentials between age cohorts reflect accumulated work experience, additional training investments made on the job and technological change. Earnings for all educational categories are likely to increase over time with productivity increases in the economy as a whole over long periods.
3. Employment probabilities (one minus the unemployment rate) are applied to average annual earnings for each education, gender and age group cohort.
4. Earnings of the individual during the training period are assumed to be zero.
5. The duration of education varies from one country to another with the national average.
6. The estimate does not take account of certain tax effects which would have a non negligible impact among these are:
- that people with high incomes pay more VAT, due to higher levels of consumption,
- that people with high incomes to a greater extent than people with lower incomes own private property and hence pay a private property tax,
- that people with high incomes to a greater extent than people with low incomes have private pensions and,
- that such pensions are taxed.
Back_to_Table1
Sources This indicator builds on information collected in other chapters of Education at a Glance 2013 (OECD, 2013a), with one exception: to be able to calculate public returns and examine net benefits for individuals, information from the OECD Taxing Wages database is used. The earnings data used are from the earnings data collection database, compiled by the LSO (Labour Market and Social Outcomes of Learning) Network (available as relative earnings in EAG 2013, Indicator A6). The data on direct costs of education are from Indicators B1 and B3. Data for the probability of finding a job (unemployment rates for different educational categories and age groups) are from Indicator A5. The minimum wage is used as an approximation for what a student could potentially earn if not in school in calculating the foregone earnings at the upper secondary or post-secondary non-tertiary level of education. See Annex 3 (www.oecd.org/edu/eag.htm) for additional information. Back_to_Table1
Notes on specific countries Belgium: Belgium cannot be included in this analysis because upper secondary education is compulsory (see earlier EAG publications; see earlier remarks on the draft text). Back_to_Table1
Denmark: Most tertiary students (about 70%) work while studying and hence pay taxes on their wages. Back_to_Table1
New Zealand: One factor for New Zealand that affects lower returns comparisons is the mix effect when type B and type A are combined and reported as tertiary. Countries with a high proportion of type B might show as lower returns to tertiary, even though both returns for B and A might be higher. For New Zealand, this has an effect given is relatively large vocational sector – although it is by no means the only, or maybe even the biggest factor. Their returns are still relatively lower despite this.
For further information on how to interpret A7, please refer to The User’s Guide to Indicator A9 available on www.oecd.org/edu/eag.htm
Back_to_Table1

82
INDICATOR A8: What are the social outcomes of education?
A8
Tables A8.1-A8.4
Sources
Argentina
Australia
Austria
Belgium
Brazil
Canada
Chile
China
Colombia
Czech Republic
Denmark
Estonia
Finland
France
Germany
Greece
Hungary
Iceland
India
Indonesia
Ireland
Israel
Italy
Japan
Korea
Latvia
Luxembourg
Mexico
Netherlands
New Zealand
Norway
Poland
Portugal
Russian Federation
Saudi Arabia
Slovak Republic
Slovenia
South Africa
Spain
Sweden
Switzerland
Turkey
United Kingdom
United States

83
Sources All data are based on the Survey of Adult Skills (PIAAC) 2012. PIAAC is the OECD Programme for the International Assessment of Adult Competencies. For more information on PIAAC please consult http://www.oecd.org/site/piaac/
The variables used in this indicator are the educational attainment levels divided in three groups (Below upper secondary education, Upper secondary or post-secondary non-tertiary education and Tertiary education), the age group 25-64 year-olds (variable AGE_R) and the distinction male and female (variable GENDER_R). Interpersonal trust (i.e. can trust others) is defined as those who strongly disagree or disagree that there are only few people you can trust completely. Political efficacy (i.e. believe they have a say in government) is defined as those who strongly agree or agree with the statement: “People like me don't have any say about what the government does”. Self-reported health (i.e. good health) is defined as those who report that they are in excellent, very good or good health. Volunteering is defined as those who report that they volunteer at least once a month.
The literacy and numeracy proficiency levels are based on a 500-point scale. Each level has been defined by particular score-point ranges. Six levels are defined for literacy and numeracy (Levels 1 through 5 plus below Level 1) which are grouped in four proficiency levels in Education at a Glance: Level 1 or below - all scores below 226 points, Level 2 - scores from 226 points to less than 276 points, Level 3 - scores from 276 points to less than 326 points, Level 4 or 5 - scores from 326 points and higher. Back_to_Table1
84
INDICATOR A9: How are student performance and equity in education related?
Methodology Leading experts in countries participating in PISA provide advice on the scope and nature of the assessments, with final decisions taken by the PISA Governing Board. Substantial efforts and resources are devoted to achieving cultural and linguistic comparability in the assessment materials. Stringent quality assurance mechanisms are applied in the item development, translation, sampling, data collection, scoring and data management stages to ensure comparability of the results. Around 510 000 15-year-old students in 65 participating countries or economies were assessed in PISA 2012. Comparability in the assessments over time (equating of the tests) is possible by the inclusion of common items in successive assessments. Because the results are based on probability samples, standard errors (S.E.) are shown in the tables and only statistically significant differences should be considered as differences that exist in the population of 15-year-old students.
For further information on the PISA assessment instruments and the methods used in PISA, see the PISA 2012 Technical Report (OECD, forthcoming).
For further information on the PISA 2012 Results, please refer to http://www.oecd.org/pisa/keyfindings/pisa-2012-results.htm
Back_to_Table1