annual and special meeting of shareowners may 1, 2018 · − advisory vote on executive...
TRANSCRIPT

Annual and Special Meeting of ShareownersMay 1, 2018
Toronto, ON Canada

Welcome to Cott’s2018 Annual and Special Meeting of Shareowners
David Gibbons, Chairman

2
• Chairman Welcome
• Formal Business
• Resolutions for Consideration
• CFO Financial Review
• CEO Remarks
• Q&A
Agenda

3
Board of Directors
• David Gibbons, Chairman of the Board
• Eric Rosenfeld, Lead Independent Director, and Chairman of the Corporate Governance Committee
• Graham Savage, Chairman of the Audit Committee
• Stephen Halperin
• Betty Jane Hess
• Casey Keller
• Gregory Monahan
• Mario Pilozzi
• Jerry Fowden

Formal Business
Marni Poe, Vice PresidentGeneral Counsel and Secretary

5
Safe Harbor Statements
Forward Looking Statements: This presentation contains forward-looking statements within the meaning of Section 27A of the SecuritiesAct of 1933, Section 21E of the Securities Exchange Act of 1934 and applicable Canadian securities laws conveying management'sexpectations as to the future based on plans, estimates and projections at the time the Company makes the statements. Forward-lookingstatements involve inherent risks and uncertainties and the Company cautions you that a number of important factors could cause actualresults to differ materially from those contained in any such forward-looking statement. The forward-looking statements contained in thispresentation include, but are not limited to, statements related to the execution of our strategic priorities, expected revenue, revenuegrowth, free cash flow, and margin expansion. The forward-looking statements are based on assumptions regarding management’s currentplans and estimates. Factors that could cause actual results to differ materially from those described in this presentation include, amongothers: risks relating to any unforeseen changes to or effects on liabilities, future capital expenditures, revenues, expenses, earnings,synergies, indebtedness, financial condition, losses and future prospects; and the effect of economic, competitive, legal, governmental andtechnological factors on Cott’s business. The foregoing list of factors is not exhaustive. Readers are cautioned not to place undue relianceon these forward-looking statements, which speak only as of the date hereof. Readers are urged to carefully review and consider thevarious disclosures, including but not limited to risk factors contained in the Company's Annual Report in the Form 10-K for the year endedDecember 30, 2017 and its quarterly reports on Form 10-Q, as well as other periodic reports filed with the securities commissions. TheCompany does not, except as expressly required by applicable law, undertake to update or revise any of these statements in light of newinformation or future events.
Non-GAAP Measures: The Company routinely supplements its reporting of GAAP measures by utilizing certain non-GAAP measures toseparate the impact of certain items from its underlying business results. Since the Company uses these non-GAAP measures in themanagement of its business, management believes this supplemental information, including on a pro forma basis, is useful to investors fortheir independent evaluation and understanding of Cott’s business. The non-GAAP financial measures described above are in addition to,and not meant to be considered superior to, or a substitute for, the Company's financial statements prepared in accordance with GAAP. Inaddition, the non-GAAP financial measures included in this presentation reflect management's judgment of particular items, and may bedifferent from, and therefore may not be comparable to, similarly titled measures reported by other companies. A copy of thispresentation may be found on www.cott.com.

6
Order of Business
• Notice of Meeting
• Quorum
• Formalities
• Minutes of Last Meeting of Shareowners
• Annual Report and Auditor’s Report
• Introduction of Resolutions
• CFO & CEO Comments
• Q & A

7
Order of Business - Continued
• Introduction of Resolutions
− Election of Directors
− Appointment of Auditors
− Advisory Vote on Executive Compensation
− Approval of Cott Corporation 2018 Equity Incentive Plan
− Approval of Cott Corporation Shareholder Rights Plan
− Approval of Amendment to Cott Corporation Articles of Incorporation (Change of Registered Office Address)
− Approval of Amendment to Cott Corporation Articles of Incorporation and By-Laws (Place of Meetings)

Financial Results
Jay WellsChief Financial Officer
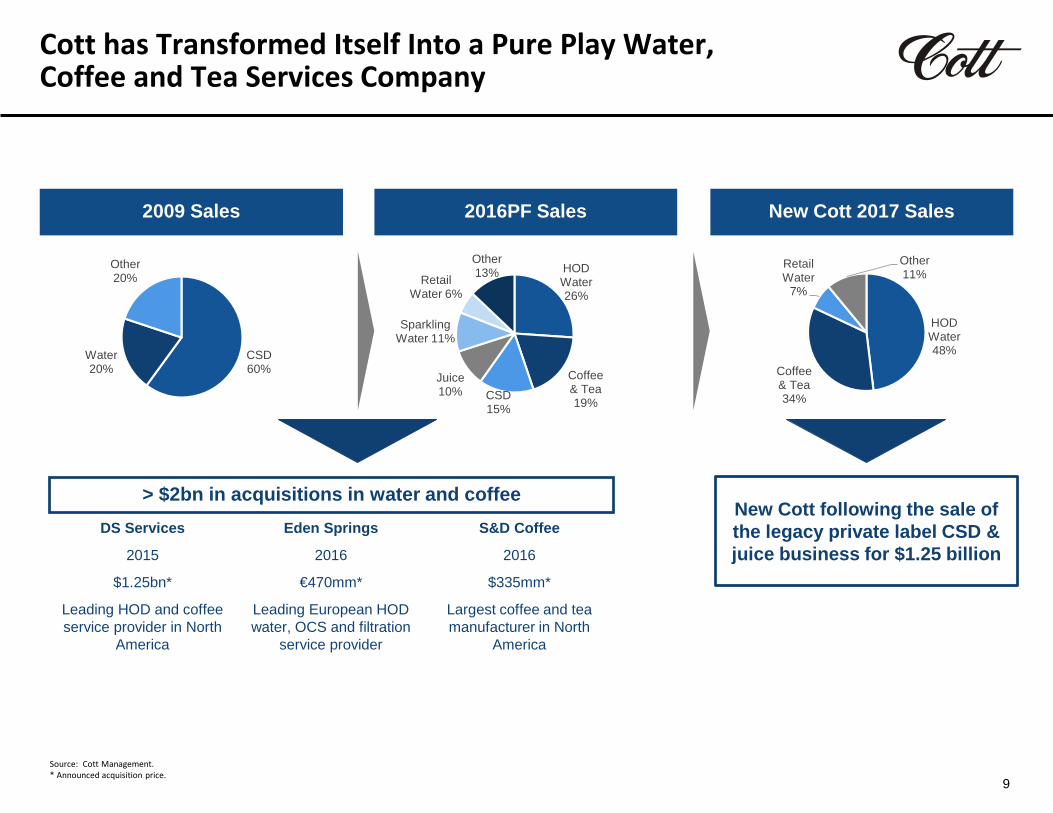
9Source: Cott Management.* Announced acquisition price.
2009 Sales 2016PF Sales New Cott 2017 Sales
New Cott following the sale of the legacy private label CSD & juice business for $1.25 billion
> $2bn in acquisitions in water and coffeeDS Services Eden Springs S&D Coffee
2015 2016 2016
$1.25bn* €470mm* $335mm*
Leading HOD and coffee service provider in North
America
Leading European HOD water, OCS and filtration
service provider
Largest coffee and tea manufacturer in North
America
Cott has Transformed Itself Into a Pure Play Water, Coffee and Tea Services Company
CSD60%
Water20%
Other20%
HOD Water26%
Coffee & Tea19%CSD
15%
Juice10%
Sparkling Water 11%
Retail Water 6%
Other13%
HOD Water48%
Coffee & Tea34%
Retail Water
7%
Other11%

10
2017 Financial Overview
Continuing Operations - Full Year Comparisons
(in millions USD) 2017 2016Revenue $2,270M $1,623MGross Margins 49.7% 52.4%Adj. EBITDA* $296M $212MAdj. Free Cash Flow* $78M $70M
Revenue from continuing operations increased 40% driven primarily by the additions of S&D and Eden alongside growth at DS Services.
Gross margin for the fiscal year decreased 270 basis points as full year of S&D operations were included within the mix of our gross margin.
Adjusted EBITDA* increased 40% due to the ongoing success of the profitability improvement plan at DS Services as well as a full year contributions from the Eden and S&D businesses.
Adjusted free cash flow* was $78 million.
Full Year 2017 Performance Summary
___________________________*See Appendix for NON-GAAP reconciliation

CEO Remarks and 2018 Priorities
Jerry FowdenChief Executive Officer

12
Annual Sales >$2.3bn (2018E)
>2.4mm customers served annually
>3,600 direct-to-consumer routes
We are a leading route based North American and European water, coffee, tea and filtration service provider within HOD, food service, convenience and hospitality
>60 manufacturing sites and >360
branch distribution and
warehouse facilities
Operations in the US, Canada, Israel
and17 European
countries
1 2 3
4 5 6Track record of
successfully integrating acquisitions
Source: Cott Management.
The New Cott Overview A Leading International Services Company

The New Cott OverviewOur Mission
1
2
3
4
5
Organic Growth from “Better-for-You” product offerings (positioned in growing categories of water, coffee, tea, filtration and extracts)
Modest margin expansion driven by scaled platforms with increased customer and route density
Focused innovation within product development, route logistics and technology creating further growth, cross sell and customer service opportunities
Strong compound free cash flow generation (10% plus compound annual growth in adjusted free cash flow)
Customer list / tuck-in acquisition opportunities at highly synergistic values
13

14
Questions and Answers

15
Appendix

16
Non-GAAP – Earnings Before Interest, Taxes, Depreciation & Amortization (EBITDA)Unaudited
(in millions of U.S. dollars)For the Year Ended
December 30, 2017 December 31, 2016Net loss from continuing operations $ (3.6) $ (60.3)Interest expense, net 85.5 43.0 Income tax (benefit) expense (30.0) 21.2 Depreciation & amortization 188.6 151.1 EBITDA $ 240.5 $ 155.0
Acquisition and integration costs 25.9 27.8 Share-based compensation costs 14.0 6.6 Inventory step up and other purchase accounting adjustments - 6.2 Commodity hedging loss (gain), net (0.3) 4.1 Foreign exchange and other (gains) losses, net (2.0) 0.2 Loss on disposal of property, plant & equipment, net 11.1 6.6 Gain on extinguishment of long-term debt (1.5) -Other adjustments 7.9 5.1 Adjusted EBITDA $ 295.6 $ 211.6

17
Non-GAAP – Adjusted Free Cash FlowUnaudited
(in millions of U.S. dollars) For the Year Ended December 30, 2017 December 31, 2016
Net cash provided by operating activities fromcontinuing operations $ 176.0 $ 145.5 Less: Additions to property, plant & equipment (121.3) (95.1)
Free Cash Flow $ 54.7 $ 50.4
Plus: Acquisition and integration cash costs 23.6 18.6 Other adjustments - 1.2
Adjusted Free Cash Flow $ 78.3 $ 70.2