annual aps enrollment projections report - … aps enrollment projections report ecember 2016 2 the...
TRANSCRIPT

Annual APS Enrollment Projections Report
Arlington Public Schools1426 N. Quincy StreetArlington, VA 22207
DECEMBER 2016


Table of Contents
Executive Summary........................................................................................1
Introduction.....................................................................................................3
Historical Enrollment at APS..................................................................4
Current Enrollment at APS...………………………….....…………...…................5
Projected Enrollment at APS......................................................….........7
Standard Methodology………………..............................................................8
Birth Data.............................................................................................10
New Housing.........................................................................................13
Migration..............................................................................................13
Accuracy of Projections.………………….…………………………………................14
Alternative Projection Scenarios.……….……………………………..…............16
List of Tables
2017 Enrollment............................................................................................19
2018 Enrollment...........................................................................................20
2019 Enrollment............................................................................................21
2020 Enrollment...........................................................................................22
2021 Enrollment..........................................................................................23
2022 Enrollment...........................................................................................24
2023 Enrollment..........................................................................................25
2024 Enrollment..........................................................................................26
2025 Enrollment..........................................................................................27
2026 Enrollment..........................................................................................28
Actual Versus Projection, Prior Year Comparison...............................................................................29
Percentage of Individual Schools Within 95% Accuracy.................................................................................30


Annual APS Enrollment Projections Report | December 2016 1
Executive Summary
The Arlington Public Schools (APS) Annual Enrollment Report provides a comprehensive look at the Fall ten-year student enrollment projections. Theintent of this document is to provide APS staff with data from which it may make informed decisions around budgeting, facilities, and programs. Specific information about each school is provided, as well as an overall look at enrollment by school level and system wide.
Projections of student enrollment are produced twice a year. Fall projections for the upcoming ten school years are published every November, based on thenumber of enrolled students on September30th each year (i.e., official count day). The Fall projection is used to create the Superintendent’s Budget for the next fiscal year. Spring updates to the Fall projections are then produced every February anduse the January 31st enrollment count to fine-tune the Fall projections. It is from the
Spring projections that staffing decisions for the next fiscal year are made. The Fall enrollment projections inform long-term facilities planning decisions, such as the need to relocate programs, perform school boundary refinements, deploy temporary relocatable classrooms, construct permanent classroom additions to existing schools, and re-construct or build new schools.
The “official count” of enrollment on September 30, 2016 was 26,152 students. This school year represents the tenth consecutive school year of student enrollment growth at APS. Since Fall 2006 (18,451 students), APS enrollment has increased by 7,701 students, which equates to 42% growth over the past decade.

Annual APS Enrollment Projections Report | December 2016 2
The projected enrollment for school year2017-18 is 27,197 students, which is a gain of 1,045 students over the 2016-17 school year and represents a robust one-year increase of 4.0 percent. Provided below are the fall ten-year projections for school years 2017-18 through 2026-27. The ten-year projections show positive growth that gradually wanes over the projection horizon.
APS is projected to surpass the 30,000 student milestone in Fall 2021. Overall, the projections suggest significant growth of nearly 6,400 students from now through school year 2026-27.
School YearActual & Projected PreK-12 Enrollment
Projected Growth %
2016-17 26,152 --
2017-18 27,197 4.0%
2018-19 27,879 2.5%
2019-20 28,708 3.0%
2020-21 29,435 2.5%
2021-22 30,139 2.4%
2022-23 30,799 2.2%
2023-24 31,274 1.5%
2024-25 31,848 1.8%
2025-26 32,184 1.1%
2026-27 32,493 1.0%
Projected Annual Enrollment Change
Annual APS Enrollment Projections Report | December 2016 3
Introduction
This is the second formal Annual Enrollment
Projection Report for Arlington Public
Schools (APS). The report provides detailed
information on the number of students
projected to be enrolled by grade for each
school at APS on September 30th of the
school year for the ten-year period beginning
in 2017-18 and ending in 2026-27. To estimate
future enrollment, APS uses three sets of
statistics, which include the number of
resident live births for Arlington County (for
kindergarten projections only), the three-
year history of enrollment change (i.e., cohort
transition rate), and the anticipated student
yield from “future” housing units. Enrollment
projections are a valuable planning tool to
help predict the need for new or expanded
schools and determine how many teachers
are needed each year in each school and
grade. Enrollment projections are also used
for facility planning purposes to estimate the
expected number of students in each school.
Methodology Used for APS Enrollment Projections
Cohort Transition Ratio. Most districts
across the United States use the cohort
transition ratio method to project
enrollment. This method captures the
enrollment patterns of a cohort of students
as they transition from grade to grade. It
is calculated by dividing the number of
students in a particular cohort (i.e., grade)
by the number of students from the previous
cohort in the previous school year. A cohort
transition ratio greater than one means there
are more students entering school than
enrolled in the previous grade. A cohort
transition ratio less than one means there
are less students returning to school than in
the previous grade. Because grade-specific
transition ratios may vary considerably from
one year to the next, APS uses a three-year
rolling average in its projection methodology.
The most recent three-year cohort transition
ratio is applied to current and future
school enrollments to produce the ten-year
projections by grade for each school.
Annual APS Enrollment Projections Report | December 2016 4
Historical Enrollment at APS
Enrollment projections typically use the most
recent three to five years of historic data to
predict future enrollment. While the most
recent past is viewed as the best predictor of
the near future, it is also important to analyze
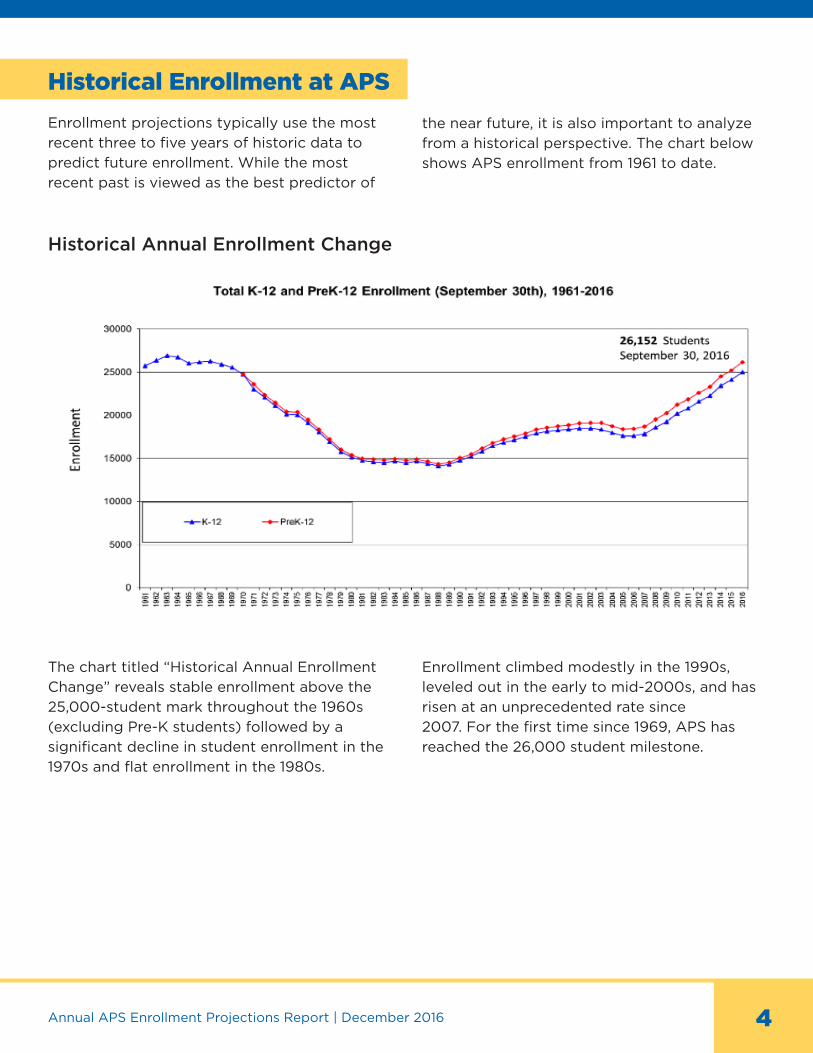
from a historical perspective. The chart below
shows APS enrollment from 1961 to date.
Historical Annual Enrollment Change
The chart titled “Historical Annual Enrollment
Change” reveals stable enrollment above the
25,000-student mark throughout the 1960s
(excluding Pre-K students) followed by a
significant decline in student enrollment in the
1970s and flat enrollment in the 1980s.
Enrollment climbed modestly in the 1990s,
leveled out in the early to mid-2000s, and has
risen at an unprecedented rate since
2007. For the first time since 1969, APS has
reached the 26,000 student milestone.
Annual APS Enrollment Projections Report | December 2016 5
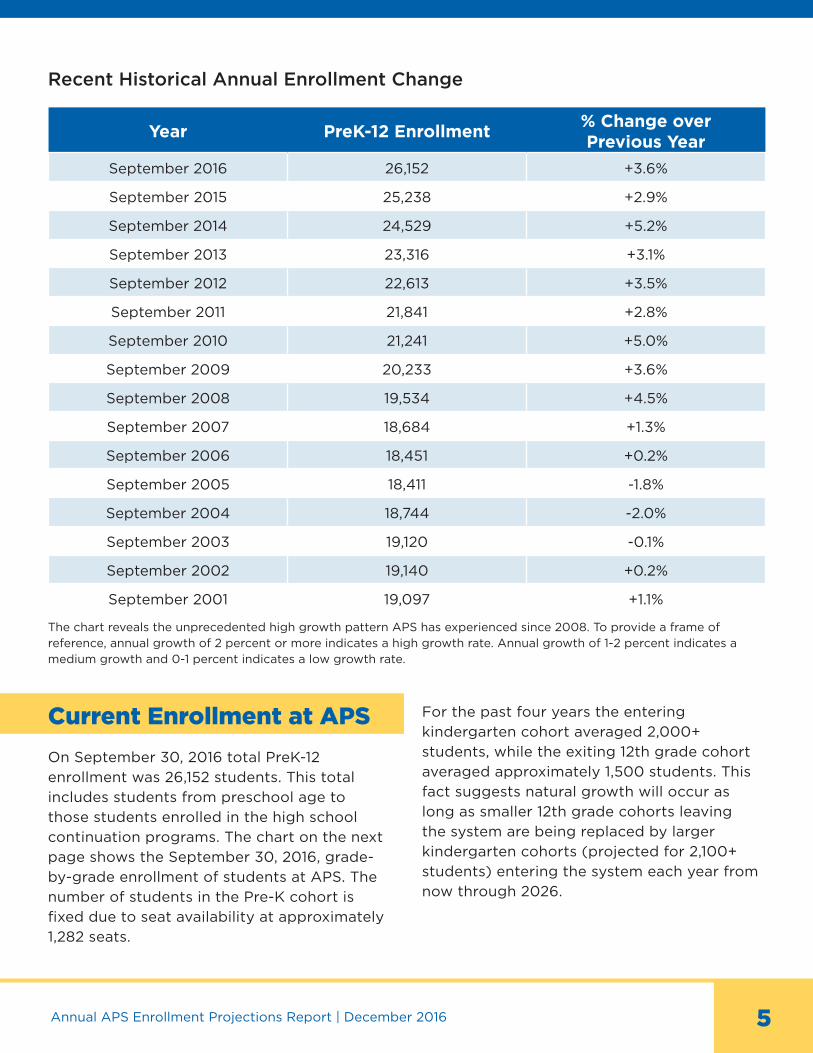
Recent Historical Annual Enrollment Change
The chart reveals the unprecedented high growth pattern APS has experienced since 2008. To provide a frame of reference, annual growth of 2 percent or more indicates a high growth rate. Annual growth of 1-2 percent indicates a medium growth and 0-1 percent indicates a low growth rate.
Year PreK-12 Enrollment% Change over Previous Year
September 2016 26,152 +3.6%
September 2015 25,238 +2.9%
September 2014 24,529 +5.2%
September 2013 23,316 +3.1%
September 2012 22,613 +3.5%
September 2011 21,841 +2.8%
September 2010 21,241 +5.0%
September 2009 20,233 +3.6%
September 2008 19,534 +4.5%
September 2007 18,684 +1.3%
September 2006 18,451 +0.2%
September 2005 18,411 -1.8%
September 2004 18,744 -2.0%
September 2003 19,120 -0.1%
September 2002 19,140 +0.2%
September 2001 19,097 +1.1%
Current Enrollment at APS
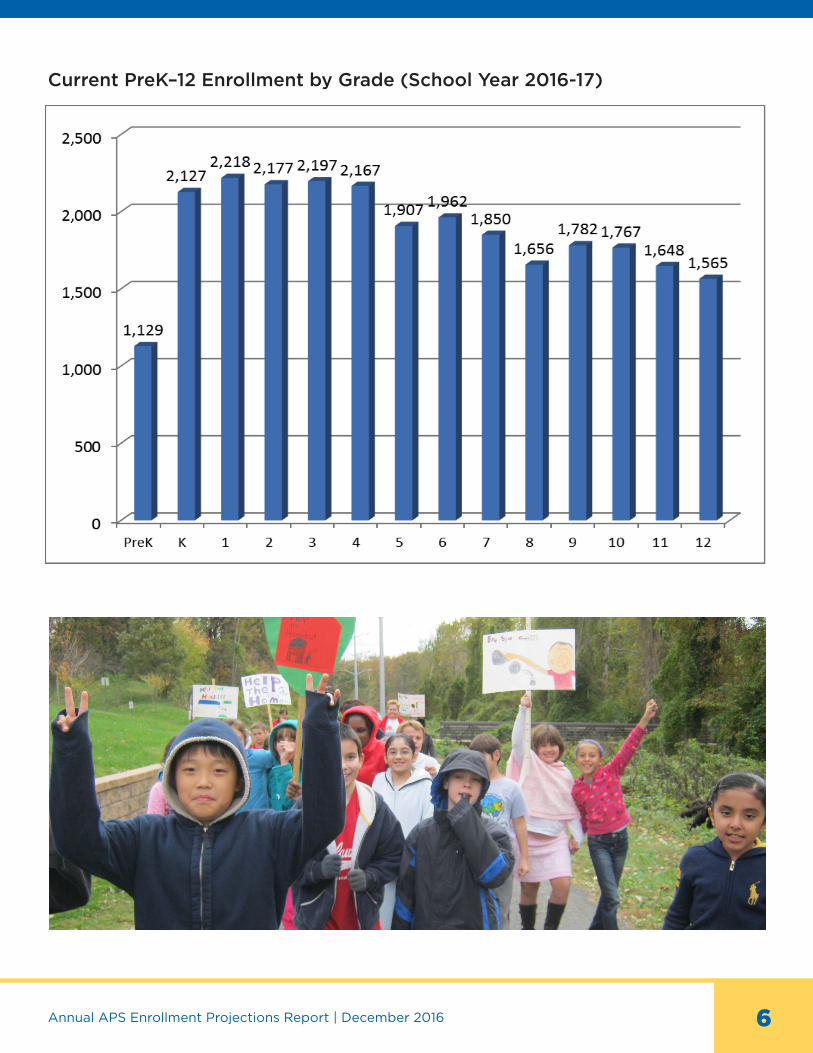
On September 30, 2016 total PreK-12
enrollment was 26,152 students. This total
includes students from preschool age to
those students enrolled in the high school
continuation programs. The chart on the next
page shows the September 30, 2016, grade-
by-grade enrollment of students at APS. The
number of students in the Pre-K cohort is
fixed due to seat availability at approximately
1,282 seats.
For the past four years the entering
kindergarten cohort averaged 2,000+
students, while the exiting 12th grade cohort
averaged approximately 1,500 students. This
fact suggests natural growth will occur as
long as smaller 12th grade cohorts leaving
the system are being replaced by larger
kindergarten cohorts (projected for 2,100+
students) entering the system each year from
now through 2026.
Annual APS Enrollment Projections Report | December 2016 6
Current PreK–12 Enrollment by Grade (School Year 2016-17)
77
Projected Enrollment Change Over Next Ten Years
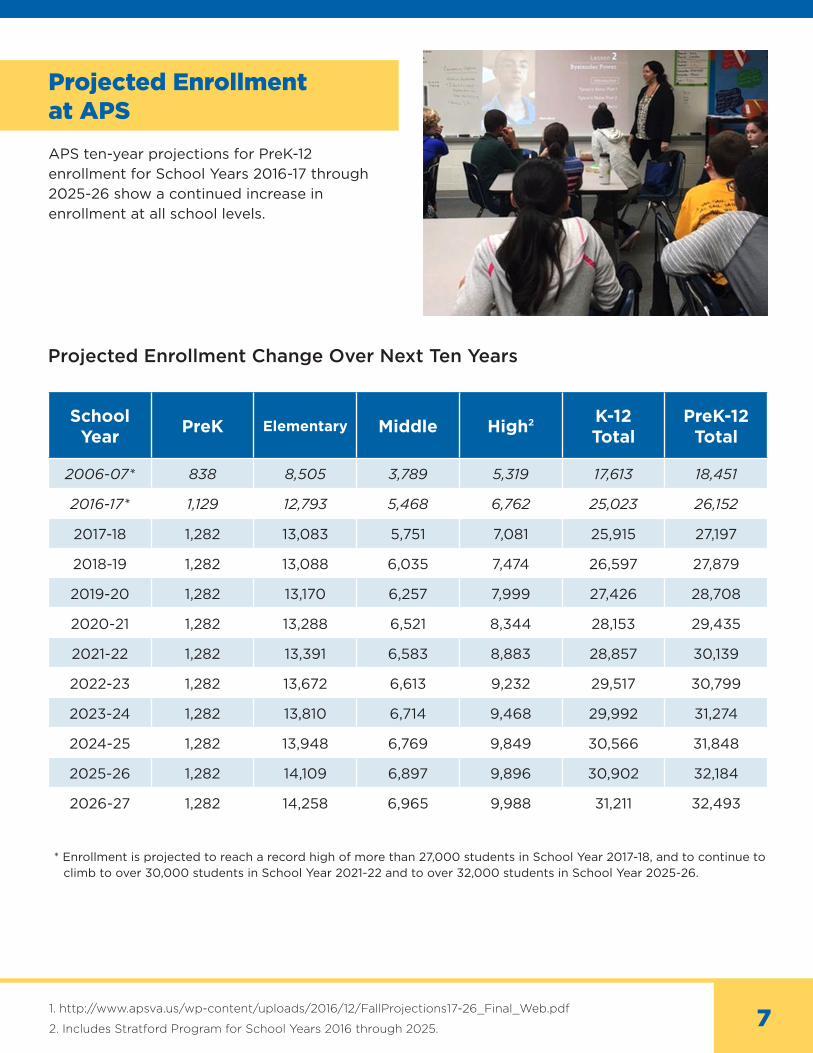
Projected Enrollment at APS
APS ten-year projections for PreK-12
enrollment for School Years 2016-17 through
2025-26 show a continued increase in
enrollment at all school levels.
School Year
PreK Elementary Middle High2 K-12Total
PreK-12Total
2006-07* 838 8,505 3,789 5,319 17,613 18,451
2016-17* 1,129 12,793 5,468 6,762 25,023 26,152
2017-18 1,282 13,083 5,751 7,081 25,915 27,197
2018-19 1,282 13,088 6,035 7,474 26,597 27,879
2019-20 1,282 13,170 6,257 7,999 27,426 28,708
2020-21 1,282 13,288 6,521 8,344 28,153 29,435
2021-22 1,282 13,391 6,583 8,883 28,857 30,139
2022-23 1,282 13,672 6,613 9,232 29,517 30,799
2023-24 1,282 13,810 6,714 9,468 29,992 31,274
2024-25 1,282 13,948 6,769 9,849 30,566 31,848
2025-26 1,282 14,109 6,897 9,896 30,902 32,184
2026-27 1,282 14,258 6,965 9,988 31,211 32,493
* Enrollment is projected to reach a record high of more than 27,000 students in School Year 2017-18, and to continue to climb to over 30,000 students in School Year 2021-22 and to over 32,000 students in School Year 2025-26.
1. http://www.apsva.us/wp-content/uploads/2016/12/FallProjections17-26_Final_Web.pdf
2. Includes Stratford Program for School Years 2016 through 2025.
Annual APS Enrollment Projections Report | December 2016 8
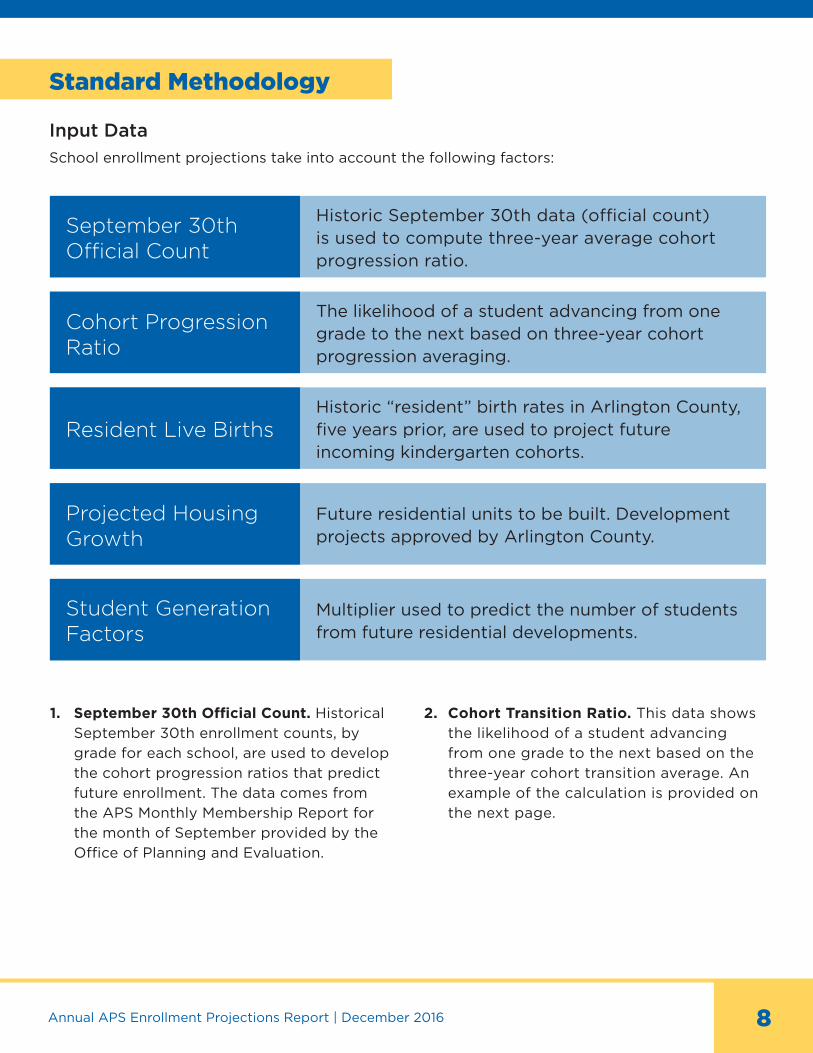
Standard Methodology
Input Data
School enrollment projections take into account the following factors:
September 30th Official Count
Historic September 30th data (official count) is used to compute three-year average cohort progression ratio.
Cohort ProgressionRatio
The likelihood of a student advancing from one grade to the next based on three-year cohort progression averaging.
Resident Live BirthsHistoric “resident” birth rates in Arlington County, five years prior, are used to project future incoming kindergarten cohorts.
Projected HousingGrowth
Future residential units to be built. Development projects approved by Arlington County.
Student Generation Factors
Multiplier used to predict the number of students from future residential developments.
1. September 30th Official Count. Historical
September 30th enrollment counts, by
grade for each school, are used to develop
the cohort progression ratios that predict
future enrollment. The data comes from
the APS Monthly Membership Report for
the month of September provided by the
Office of Planning and Evaluation.
2. Cohort Transition Ratio. This data shows
the likelihood of a student advancing
from one grade to the next based on the
three-year cohort transition average. An
example of the calculation is provided on
the next page.

Annual APS Enrollment Projections Report | December 2016 9
September 30th MembershipCohort Progression Rate
Grade 2-3
Grade 2 Grade 3One-Year Average
Three-Year Average
2011 99 105 -- --
2012 101 98 0.989 --
2013 102 104 1.029 --
2014 93 99 0.970 0.996
The current three-year average of the
cohort transition rate by grade is provided
below to give a snapshot of the current
trend. Values greater than one indicate
the percent cohort growth as students
transition from one grade to the next.
Values less than one indicate the percent
cohort loss as students transition to the
next grade.
Three-Year Cohort Transition Ratio By Grade SY 2013-14 Through SY 2016-17
Annual APS Enrollment Projections Report | December 2016 10
The latest three-year trend data clearly
show that APS receives the highest cohort
transition growth (9.5 percent) as students
transition from eighth to ninth grade. This
is likely due to families choosing to transfer
their children from non-APS schools to take
advantage of the broad range of course
offerings at APS high schools. Conversely,
the greatest decline in the cohort transition
rate (-1.1 percent) happens as students
transition from tenth to eleventh grade. Do
not be alarmed by this statistic because
it suggests nearly 99% of tenth graders
remain at APS for the 11th grade.
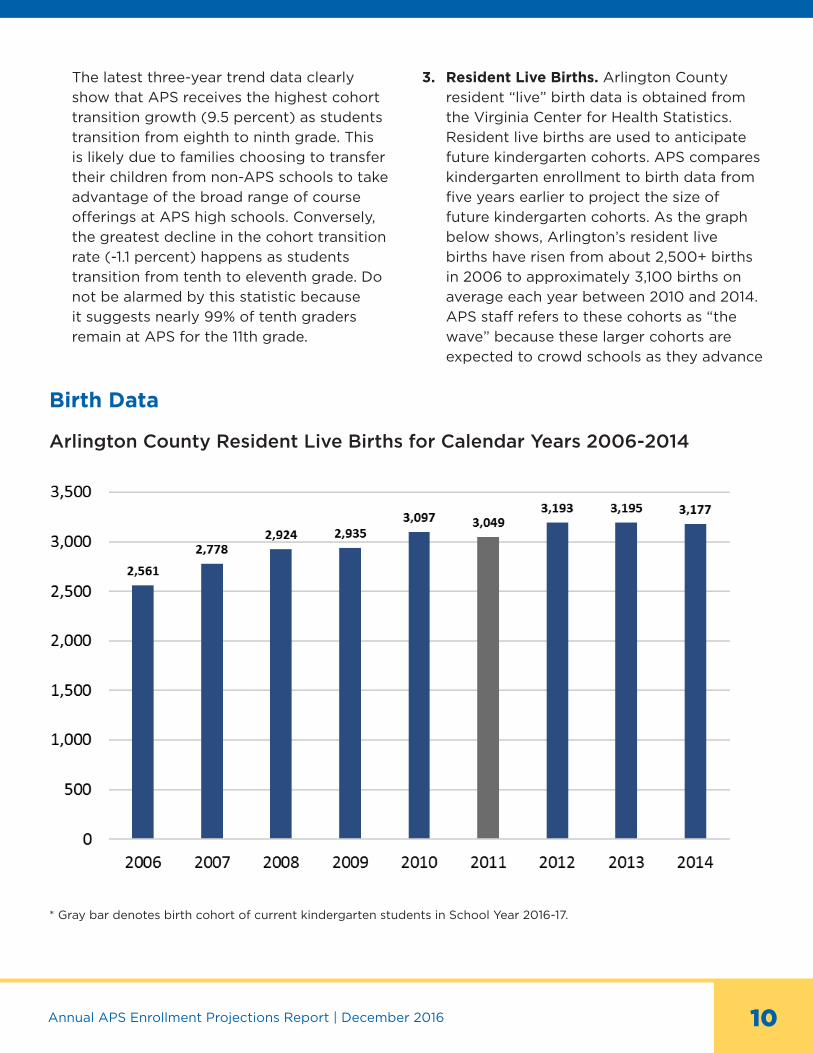
3. Resident Live Births. Arlington County
resident “live” birth data is obtained from
the Virginia Center for Health Statistics.
Resident live births are used to anticipate
future kindergarten cohorts. APS compares
kindergarten enrollment to birth data from
five years earlier to project the size of
future kindergarten cohorts. As the graph
below shows, Arlington’s resident live
births have risen from about 2,500+ births
in 2006 to approximately 3,100 births on
average each year between 2010 and 2014.
APS staff refers to these cohorts as “the
wave” because these larger cohorts are
expected to crowd schools as they advance
Birth Data
Arlington County Resident Live Births for Calendar Years 2006-2014
* Gray bar denotes birth cohort of current kindergarten students in School Year 2016-17.
Annual APS Enrollment Projections Report | December 2016 11
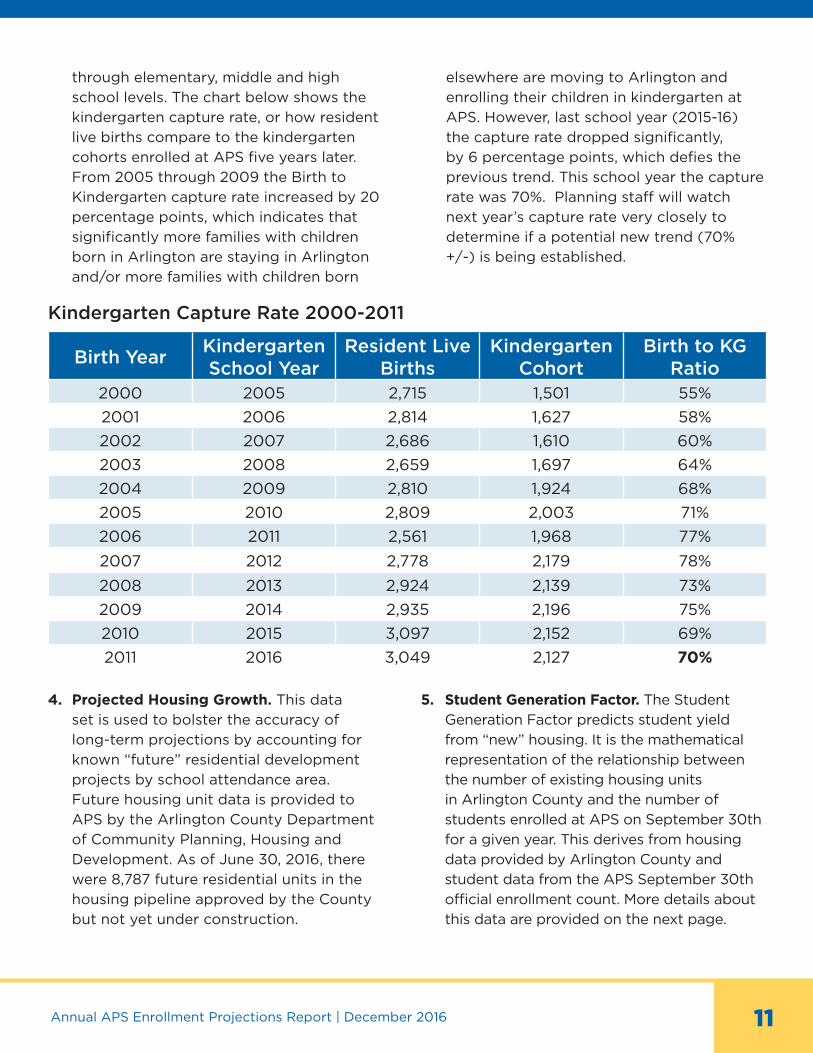
through elementary, middle and high
school levels. The chart below shows the
kindergarten capture rate, or how resident
live births compare to the kindergarten
cohorts enrolled at APS five years later.
From 2005 through 2009 the Birth to
Kindergarten capture rate increased by 20
percentage points, which indicates that
significantly more families with children
born in Arlington are staying in Arlington
and/or more families with children born
elsewhere are moving to Arlington and
enrolling their children in kindergarten at
APS. However, last school year (2015-16)
the capture rate dropped significantly,
by 6 percentage points, which defies the
previous trend. This school year the capture
rate was 70%. Planning staff will watch
next year’s capture rate very closely to
determine if a potential new trend (70%
+/-) is being established.
Birth YearKindergarten School Year
Resident Live Births
Kindergarten Cohort
Birth to KG Ratio
2000 2005 2,715 1,501 55%
2001 2006 2,814 1,627 58%
2002 2007 2,686 1,610 60%
2003 2008 2,659 1,697 64%
2004 2009 2,810 1,924 68%
2005 2010 2,809 2,003 71%
2006 2011 2,561 1,968 77%
2007 2012 2,778 2,179 78%
2008 2013 2,924 2,139 73%
2009 2014 2,935 2,196 75%
2010 2015 3,097 2,152 69%
2011 2016 3,049 2,127 70%
4. Projected Housing Growth. This data
set is used to bolster the accuracy of
long-term projections by accounting for
known “future” residential development
projects by school attendance area.
Future housing unit data is provided to
APS by the Arlington County Department
of Community Planning, Housing and
Development. As of June 30, 2016, there
were 8,787 future residential units in the
housing pipeline approved by the County
but not yet under construction.
5. Student Generation Factor. The Student
Generation Factor predicts student yield
from “new” housing. It is the mathematical
representation of the relationship between
the number of existing housing units
in Arlington County and the number of
students enrolled at APS on September 30th
for a given year. This derives from housing
data provided by Arlington County and
student data from the APS September 30th
official enrollment count. More details about
this data are provided on the next page.
Kindergarten Capture Rate 2000-2011
Annual APS Enrollment Projections Report | December 2016 12
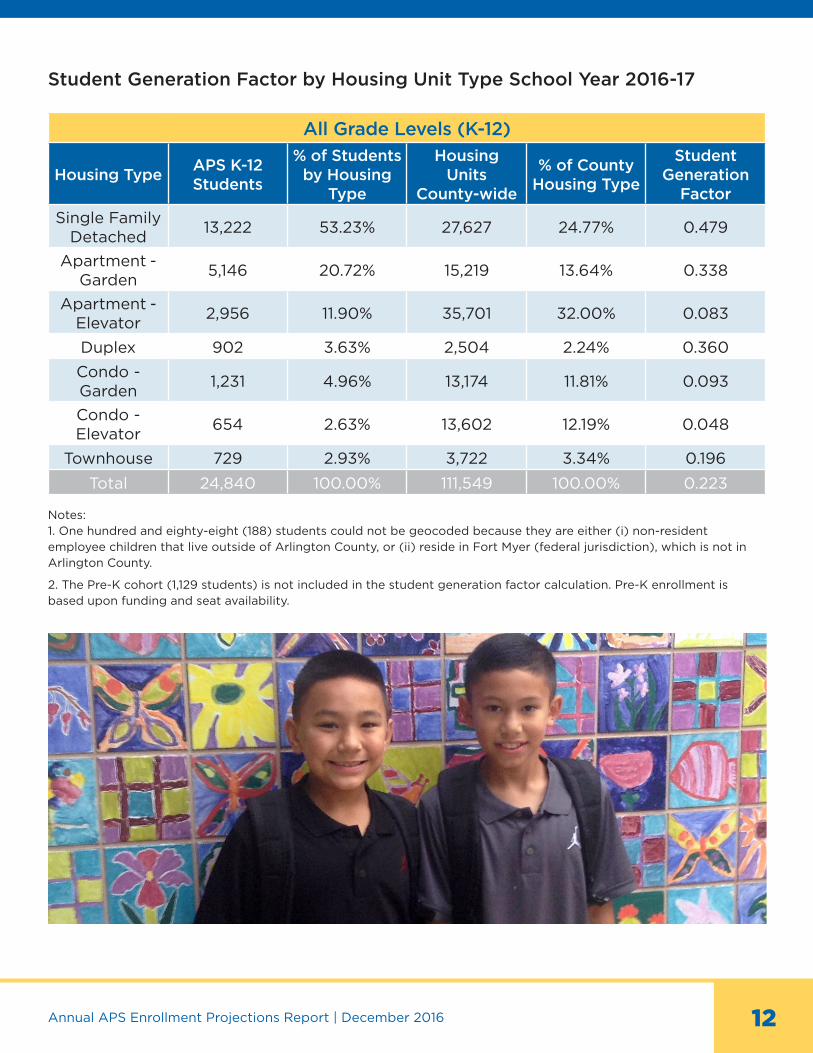
Student Generation Factor by Housing Unit Type School Year 2016-17
All Grade Levels (K-12)
Housing TypeAPS K-12 Students
% of Students by Housing
Type
Housing Units
County-wide
% of County Housing Type
Student Generation
Factor
Single Family Detached 13,222 53.23% 27,627 24.77% 0.479
Apartment - Garden
5,146 20.72% 15,219 13.64% 0.338
Apartment - Elevator
2,956 11.90% 35,701 32.00% 0.083
Duplex 902 3.63% 2,504 2.24% 0.360
Condo - Garden
1,231 4.96% 13,174 11.81% 0.093
Condo - Elevator
654 2.63% 13,602 12.19% 0.048
Townhouse 729 2.93% 3,722 3.34% 0.196
Total 24,840 100.00% 111,549 100.00% 0.223
Notes:1. One hundred and eighty-eight (188) students could not be geocoded because they are either (i) non-resident employee children that live outside of Arlington County, or (ii) reside in Fort Myer (federal jurisdiction), which is not in Arlington County.
2. The Pre-K cohort (1,129 students) is not included in the student generation factor calculation. Pre-K enrollment is based upon funding and seat availability.
Annual APS Enrollment Projections Report | December 2016 13
New Housing
Student Yield from Future Housing
The anticipated student yield from “future”
housing units is included in the projections
by the impacted neighborhood elementary,
middle, and high schools. Projected students
from “known” residential developments that
have been approved by Arlington County
were calculated using the appropriate student
generation factor for the housing unit types to
be provided in the development.
Student yields from residential developments
are phased into the projections as follows:
� Recently completed residential housing
units (from October 1, 2015 through
September 30, 2016) were phased equally
in Year 1 (SY 2017-18) and Year 2 (SY 2018-
19) of the projections;
� Residential development projects currently
under construction were phased equally in
Year 3 (SY 2019-20), Year 4 (SY 2020-21)
and Year 5 (SY 2021-22); and
� Residential development projects that are
“Approved by the County but not yet under
construction” were phased equally in Years
6 (SY 2022-23) through 10 (SY 2026-27).
Migration
The table titled “Estimated Net Migration in
Arlington County” was developed from 2015 US
Census Bureau data. This table shows estimated
net domestic migration and net international
migration data from 2010 through 2015. It is
apparent that Arlington County continues to
have positive net international migration. Net
international migration is the difference between
the number of people moving into Arlington
County from other countries and the number
of people leaving Arlington to reside in other
countries. Positive net international migration
indicates that more people are entering from
other countries than leaving Arlington to reside
abroad. While net international migration
in Arlington continues to be positive, the
magnitude was significantly smaller in 2010 as
compared to 2011 through 2015.
Net domestic migration is the difference
between the number of people moving into
Arlington from other parts of the United States
and the number of people leaving Arlington
to reside in other United States locations.
Negative net domestic migration indicates that
more people are moving out of Arlington to
other parts of the United States than are coming
into Arlington from other parts of the country.
From 2010 through 2012 Arlington experienced
positive net domestic migration. In 2013,
Arlington shifted to negative domestic migration,
and the magnitude was significantly less in 2015
(-3,901) than 2014 (-1,929).
While Arlington received a net of more than
2,549 people from other countries in 2015, a
net of approximately 1,929 people left Arlington
for other locations in the United States. When
the data from net international migration and
net domestic migration are added together,
the resulting value is total net migration. In
2015, Arlington experienced a positive total
net migration, with a gain of more than 620
persons. APS planning staff will continue to
monitor changes in migration estimates and
how those changes may be associated with
increasing enrollment.

Annual APS Enrollment Projections Report | December 2016 14
Accuracy of Projections
Individual school and grade level projections
are subject to more variation than overall
school system numbers. Enrollment estimates
are more accurate projecting one year ahead
than those projecting five years ahead. The
“Review of Projection Methodologies for the
Arlington County Government and Arlington
Public Schools” prepared by Statistical
Forecasting LLC and RLS Demographics
suggests that for a fast-growing district such
as APS, with many variables that contribute to
changing enrollment, +/- 2 percent error rate
is acceptable. Using this criterion, for a system
with 10,000 students, an error rate of +/- 200
students would be acceptable in Year 1, +/-
400 students would be acceptable in Year 2,
+/- 1,000 students would be acceptable in Year
5 and +/- 2,000 students would be acceptable
in Year 10.
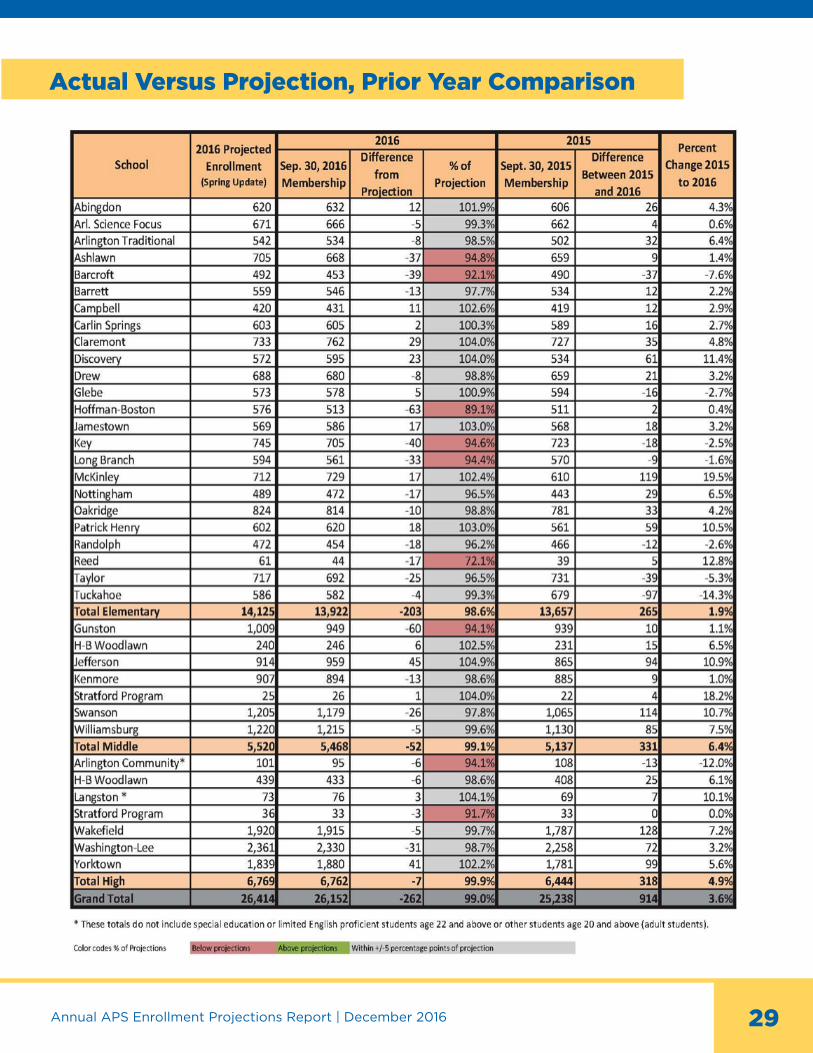
The actual enrollment on September 30,
2016 was 26,152 students. One year prior, the
projection for School Year 2016-17 was 26,414
students, a difference of -262 students or 0.82
percent, which is within the standard +/- 2
percent error range. Since School Year 2008-
09, the one-year enrollment projections for
Arlington Public Schools have varied from the
actual enrollment by an average of 1.37 percent
(see chart on next page).
In School Year 2011-12, the projection for the
2016-17 School Year was 26,069 students.
Actual enrollment five years later on September
30, 2016, was 26,152; a difference of 83 students
or 0.32% from the projection and well within
the accepted standard of 10 percent for a
five-year forecast. This fact suggests that the
mid-range projection from five years prior
was reasonably accurate. Since School Year
2008-09, five-year enrollment projections for
Arlington Public Schools have varied from the
actual enrollment by an average of about 9
percent (see chart below), which meets the
acceptable standard of 10 percent for a five-
year forecast.
Estimated Net Migration in Arlington County 2010-2015
YearNet International
MigrationNet Domestic
MigrationTotal Net Migration
2010 553 567 1,120
2011 2,133 2,797 4,930
2012 2,321 774 3,095
2013 2,396 -392 2,004
2014 2,381 -3,901 -1,520
2015 2,549 -1,929 620
Data Source: 2015 US Census Bureau. PEPTCOMP - Estimates of the Components of Resident Population Change: April 1, 2010 to July 1, 2015

15
Sch
oo
lYear
Offi
cia
l C
ou
nt
on
9
/30
His
tori
cal E
nro
llm
en
t P
roje
cti
on
sO
ne Y
ear
Befo
re
(Fall P
roje
cti
on
s)Tw
o Y
ears
Befo
re
(Fall P
roje
cti
on
s)F
ou
r Years
Befo
re
(Fall P
roje
cti
on
s)F
ive Y
ears
Befo
re
(Fall P
roje
cti
on
s)
Pro
jecti
on
Accu
racy
%E
rro
r %
Pro
jecti
on
Accu
racy
%E
rro
r %
Pro
jecti
on
Accu
racy
%E
rro
r %
Pro
jecti
on
Accu
racy
%E
rro
r %
20
05
-06
18,4
1118
,237
99
.05
%-0
.95
%18
,817
102.2
1%2.2
1%D
NA
DN
AD
NA
DN
AD
NA
DN
A
20
06
-07
18,4
51
18,2
31
98
.81%
-1.19
%17
,89
79
7.0
0%
-3.0
0%
DN
AD
NA
DN
AD
NA
DN
AD
NA
20
07-0
818
,68
418
,38
09
8.3
7%
-1.6
3%
17,9
06
95
.84
%-4
.16
%18
,479
98
.90
%-1
.10
%D
NA
DN
AD
NA
20
08
-09
19,5
34
18,8
68
96
.59
%-3
.41%
18,2
68
93
.52%
-6.4
8%
17,2
59
88
.35
%-1
1.6
5%
18,3
26
93
.82%
-6.18
%
20
09
-10
20
,23
320
,08
49
9.2
6%
-0.7
4%
19,0
29
94
.05
%-5
.95
%17
,30
18
5.5
1%-1
4.4
9%
16,9
45
83
.75
%-1
6.2
5%
20
10-1
121,
24
120
,93
39
8.5
5%
-1.4
5%
20
,65
09
7.22%
-2.7
8%
18,3
24
86
.27%
-13
.73
%17
,00
28
0.0
4%
-19
.96
%
20
11-1
221,
84
122,2
01
101.
65
%1.
65
%21,
657
99
.16
%-0
.84
%19
,318
88
.45
%-1
1.5
5%
18,3
58
84
.05
%-1
5.9
5%
20
12-1
322,6
1322,6
81
100
.30
%0
.30
%23
,05
110
1.9
4%
1.9
4%
21,
85
99
6.6
7%
-3.3
3%
19,4
64
86
.07%
-13
.93
%
20
13-1
423
,316
23
,58
610
1.16
%1.16
%23
,59
110
1.18
%1.18
%23
,074
98
.96
%-1
.04
%22,4
85
96
.44
%-3
.56
%
20
14-1
524
,529
24
,15
39
8.4
7%
-1.5
3%
24
,40
29
9.4
8%
-0.5
2%
25
,00
610
1.9
4%
1.9
4%
23
,83
89
7.18
%-2
.82%
20
15-1
625
,23
825
,64
910
1.6
3%
1.6
3%
24
,94
69
8.8
4%
-1.16
%25
,213
99
.90
%-0
.10
%25
,86
710
2.4
9%
2.4
9%
20
16-1
726
,15
226
,36
610
0.8
2%
0.8
2%
26
,56
810
1.5
9%
1.5
9%
26
,14
39
9.9
7%
-0.0
3%
26
,06
99
9.6
8%
-0.3
2%
Mean
Ab
solu
te P
erc
en
tag
e E
rro
r1.
37%
2.6
5%
5.9
0%
9.0
5%
Lo
ng
itu
din
al A
naly
sis
of
Pro
jecti
on
Accu
racy
NO
TE
:
1. “
DN
A”
= P
roje
cti
on
data
no
t availa
ble
.
2. A
ccu
racy a
bo
ve 1
00
perc
en
t in
dic
ate
s th
e p
roje
cti
on
is
over-
fore
cast
, co
nvers
ely
an
accu
racy le
ss t
han
10
0 p
erc
en
t in
dic
ate
s an
un
der-
fore
cast
of
the S
ep
tem
ber
30
th o
fficia
l co
un
t.
3. A
po
siti
ve (
+)
err
or
perc
en
tag
e in
dic
ate
s an
over-
fore
cast
, co
nvers
ely
a n
eg
ati
ve (
-) e
rro
r p
erc
en
tag
e in
dic
ate
s an
un
der-
fore
cast
of
the
Sep
tem
ber
30
th o
fficia
l co
un
t.
4. A
+/-
2 p
erc
en
t an
nu
al ra
ng
e o
f err
or
is a
n a
ccep
ted
sta
nd
ard
fo
r fa
st g
row
ing
sch
oo
l d
istr
icts
lik
e A
rlin
gto
n P
ub
lic S
ch
oo
ls.

Annual APS Enrollment Projections Report | December 2016 16
Alternative Projection Scenarios
Enrollment projections of the number of future
students almost always differ from the actual
number of students enrolled for a given point
in time due to changes in social, economic,
housing, and demographic trends, as well as
the many inherent assumptions in the model.
Therefore, six alternative projections are
provided in the graph below to denote the
uncertainty involved in making projections.
The alternative projection scenarios include:
� Five-Year Linear Regression
� Three-Year Linear Regression
� Five-Year Average Rate of Change
� Three-Year Average Rate of Change
� Increase of 2 Percent Per Year
� Increase of 3 Percent Per Year
These alternatives are not statistical confidence
limits, but instead represent judgments made
by Planning Staff as to reasonable upper and
lower bounds.
Alternative Projection Scenarios Fall 2016-2026
40,000
38,000
30,000
36,000
28,000
34,000
26,000
32,000
24,000
Annual APS Enrollment Projections Report | December 2016 17
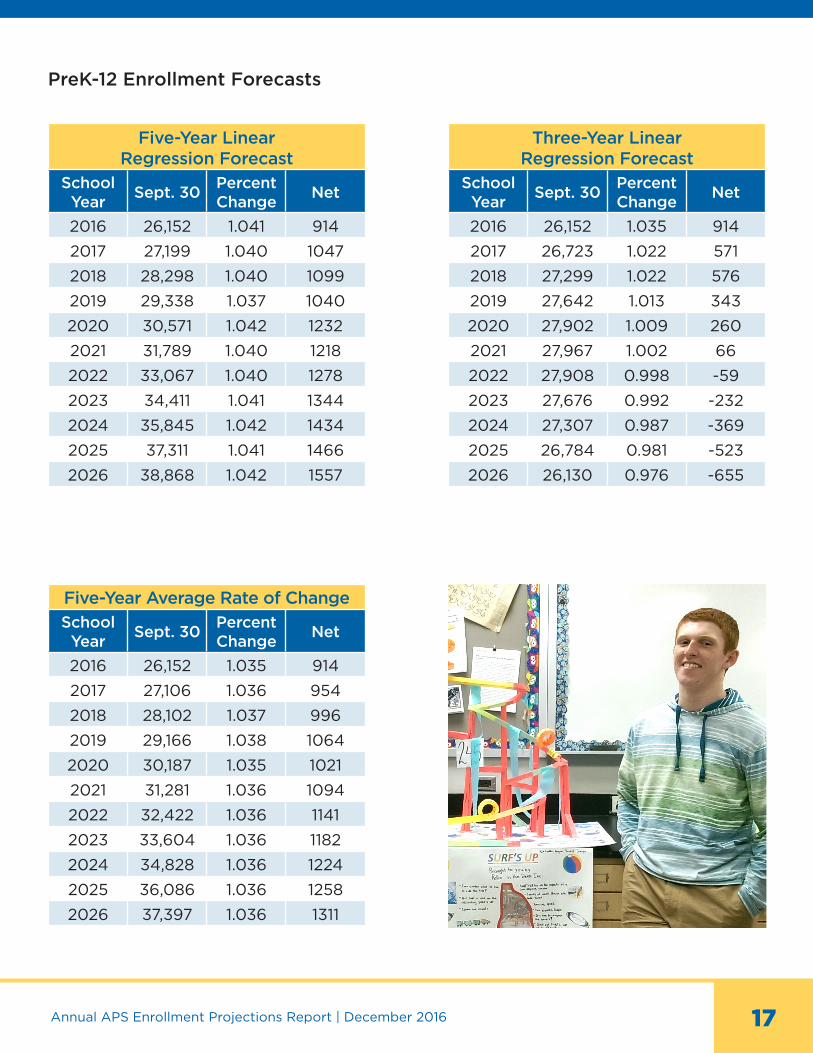
Five-Year Linear Regression Forecast
School Year
Sept. 30Percent Change
Net
2016 26,152 1.041 914
2017 27,199 1.040 1047
2018 28,298 1.040 1099
2019 29,338 1.037 1040
2020 30,571 1.042 1232
2021 31,789 1.040 1218
2022 33,067 1.040 1278
2023 34,411 1.041 1344
2024 35,845 1.042 1434
2025 37,311 1.041 1466
2026 38,868 1.042 1557
Five-Year Average Rate of Change
School Year
Sept. 30Percent Change
Net
2016 26,152 1.035 914
2017 27,106 1.036 954
2018 28,102 1.037 996
2019 29,166 1.038 1064
2020 30,187 1.035 1021
2021 31,281 1.036 1094
2022 32,422 1.036 1141
2023 33,604 1.036 1182
2024 34,828 1.036 1224
2025 36,086 1.036 1258
2026 37,397 1.036 1311
Three-Year Linear Regression Forecast
School Year
Sept. 30Percent Change
Net
2016 26,152 1.035 914
2017 26,723 1.022 571
2018 27,299 1.022 576
2019 27,642 1.013 343
2020 27,902 1.009 260
2021 27,967 1.002 66
2022 27,908 0.998 -59
2023 27,676 0.992 -232
2024 27,307 0.987 -369
2025 26,784 0.981 -523
2026 26,130 0.976 -655
PreK-12 Enrollment Forecasts

Annual APS Enrollment Projections Report | December 2016 18
Three-Year Average Rate of Change
School Year
Sept. 30Percent Change
Net
2016 26,152 1.037 914
2017 27,183 1.039 1031
2018 28,140 1.035 957
2019 29,191 1.037 1050
2020 30,280 1.037 1090
2021 31,389 1.037 1109
2022 32,554 1.037 1164
2023 33,759 1.037 1205
2024 35,005 1.037 1246
2025 36,300 1.037 1295
2026 37,642 1.037 1342
Static 3 Percent Increase Per Year
School Year
Sept. 30PercentChange
Net
2016 26,152 1.030 914
2017 26,937 1.030 785
2018 27,745 1.030 808
2019 28,577 1.030 832
2020 29,434 1.030 857
2021 30,317 1.030 883
2022 31,227 1.030 910
2023 32,164 1.030 937
2024 33,129 1.030 965
2025 34,122 1.030 994
2026 35,146 1.030 1024
Static 2 Percent Increase Per Year
School Year
Sept. 30Percent Change
Net
2016 26,152 1.020 914
2017 26,675 1.020 523
2018 27,209 1.020 534
2019 27,753 1.020 544
2020 28,308 1.020 555
2021 28,874 1.020 566
2022 29,451 1.020 577
2023 30,040 1.020 589
2024 30,641 1.020 601
2025 31,254 1.020 613
2026 31,879 1.020 625

Annual APS Enrollment Projections Report | December 2016 1919
2017 Fall Enrollment Projections
ARLINGTON PUBLIC SCHOOLSFacilities Planning
BASELINE PROJECTIONS -- NOT ADJUSTED FOR HIGH SCHOOL BOUNDARY REFINEMENTSFALL 2017 ENROLLMENT PROJECTIONS
12/12/2016
VPIPreKSPED
3&4Mont
DualEnrl
PeerPals
PreKTotal
Abingdon 101 104 98 93 108 105 609 32 8 0 11 0 51 660Arlington Science Focus 104 85 124 120 113 109 655 16 0 0 1 0 17 672Arlington Traditional 96 96 72 72 72 96 504 32 6 0 0 0 38 542Ashlawn 104 84 127 139 108 92 654 16 16 0 4 0 36 690Barcroft 71 59 65 75 66 64 400 32 8 0 2 0 42 442Barrett 83 84 82 76 77 99 501 32 8 17 0 0 57 558Campbell 68 61 64 60 61 53 367 48 8 17 2 0 75 442Carlin Springs 80 77 88 78 94 91 508 64 16 17 6 0 103 611Claremont 133 132 99 123 123 108 718 32 0 0 0 0 32 750Discovery 90 92 87 77 113 112 571 0 8 17 3 1 29 600Drew 91 88 89 94 85 85 532 32 24 119 2 0 177 709Glebe 91 102 96 86 92 112 579 0 8 0 10 4 22 601Henry 121 122 112 98 96 78 627 32 12 0 6 0 50 677Hoffman-Boston 67 57 60 61 61 62 368 80 34 68 3 0 185 553Jamestown 87 90 80 100 82 86 525 0 16 51 2 2 71 596Key 135 135 117 122 116 88 713 32 8 0 9 0 49 762Long Branch 93 87 111 92 103 79 565 16 6 0 4 1 27 592McKinley 105 120 127 125 116 147 740 0 0 17 5 0 22 762Nottingham 84 84 89 78 91 72 498 0 0 0 1 0 1 499Oakridge 127 132 114 126 139 143 781 16 8 0 8 0 32 813Randolph 73 61 77 69 59 75 414 48 16 0 5 0 69 483Taylor 114 104 124 118 111 119 690 0 8 0 8 0 16 706Tuckahoe 107 88 100 81 96 92 564 0 8 0 6 4 18 582Integration Station (Reed) 0 62 0 1 0 63 63ELEMENTARY TOTAL 2,225 2,144 2,202 2,163 2,182 2,167 13,083 560 288 323 99 12 1,282 6 7 8 MID 14,365Gunston 383 326 327 1,036 1,036Jefferson 339 359 317 1,015 1,015Kenmore 340 309 282 931 931Stratford Program 8 11 5 24 22Swanson 347 447 445 1,239 1,239Williamsburg 416 445 396 1,257 1,257H-B Woodlawn 83 83 83 249 249MIDDLE TOTAL 1,916 1,980 1,855 5,751 9 10 11 12 HIGH 5,751Arlington Community 24 19 20 22 85 85Arlington Tech 100 40 140 140Langston 1 4 17 47 69 69Stratford Program 5 4 4 23 36 36Wakefield 497 546 464 461 1,968 1,968Washington-Lee 595 587 657 552 2,391 2,391Yorktown 495 509 488 449 1,941 1,941H-B Woodlawn 110 110 114 117 451 451 HIGH TOTAL 1,827 1,819 1,764 1,671 7,081 7,081
TOTAL 2,225 2,144 2,202 2,163 2,182 2,167 13,083 560 288 323 99 12 1,282 1,916 1,980 1,855 5,751 1,827 1,819 1,764 1,671 7,081 7,081K-12 TOTAL 25,915Career Center - FTE's 459Reed (community services) 42 PreK-12 Total 27,197Five-year-old Montessori students are reported in Kindergarten. Career Center FTE are not included in the total as the students are already counted in their home school.All Special Education students, including those in self-contained classes, all ESOL/HILT/HILTEX students, and all Transition Program students are included within the grade totals at each school.Langston and Arlington Community membership does not include students over 20 years old. The above projections do not include the adult students at Arlington Community and at Langston.
1
APS provides specialized services (i.e., Speech) to “dual-enrolled” students on a limited basis and invites PreK students to serve as “peer models” in PreK classrooms that are under-enrolled. Although both dual-enrolled and peer model students are counted towards total enrollment, they are not counted toward capacity utilization since they are in attendance in school only intermittently. The Fall 2017 projections are subject to program relocation decisions which will be reflected in the Spring update produced in February 2018.
SCHOOL 5432
Preschool
K TOTALK-5

Annual APS Enrollment Projections Report | December 2016 20
2018 Fall Enrollment Projections
ARLINGTON PUBLIC SCHOOLSFacilities Planning
BASELINE PROJECTIONS -- NOT ADJUSTED FOR HIGH SCHOOL BOUNDARY REFINEMENTSFALL 2018 ENROLLMENT PROJECTIONS
12/12/2016
VPIPreKSPED
3&4Mont
DualEnrl
PeerPals
PreKTotal
Abingdon 100 101 102 97 94 105 599 32 8 0 11 0 51 650Arlington Science Focus 102 109 85 128 116 114 654 16 0 0 1 0 17 671Arlington Traditional 96 96 96 72 72 72 504 32 6 0 0 0 38 542Ashlawn 102 106 82 126 144 109 669 16 16 0 4 0 36 705Barcroft 70 67 59 63 70 65 394 32 8 0 2 0 42 436Barrett 82 85 83 83 79 79 491 32 8 17 0 0 57 548Campbell 67 62 62 64 58 58 371 48 8 17 2 0 75 446Carlin Springs 81 80 75 92 80 92 500 64 16 17 6 0 103 603Claremont 131 127 126 97 114 120 715 32 0 0 0 0 32 747Discovery 88 92 94 89 77 114 554 0 8 17 3 1 29 583Drew 89 90 81 86 94 86 526 32 24 119 2 0 177 703Glebe 92 92 100 94 86 93 557 0 8 0 10 4 22 579Henry 119 122 124 106 100 96 667 32 12 0 6 0 50 717Hoffman-Boston 66 59 59 58 59 59 360 80 34 68 3 0 185 545Jamestown 86 89 92 80 102 83 532 0 16 51 2 2 71 603Key 133 134 133 115 118 115 748 32 8 0 9 0 49 797Long Branch 95 94 90 114 93 105 591 16 6 0 4 1 27 618McKinley 105 105 120 127 125 116 698 0 0 17 5 0 22 720Nottingham 80 88 88 93 77 88 514 0 0 0 1 0 1 515Oakridge 125 130 135 116 128 141 775 16 8 0 8 0 32 807Randolph 72 75 61 79 70 63 420 48 16 0 5 0 69 489Taylor 112 115 103 123 114 107 674 0 8 0 8 0 16 690Tuckahoe 105 108 86 101 80 95 575 0 8 0 6 4 18 593Integration Station (Reed) 0 62 0 1 0 63 63ELEMENTARY TOTAL 2,198 2,226 2,136 2,203 2,150 2,175 13,088 560 288 323 99 12 1,282 6 7 8 MID 14,370Gunston 443 369 326 1,138 1,138Jefferson 393 340 360 1,093 1,093Kenmore 316 340 309 965 965Stratford Program 10 6 6 22 22Swanson 452 347 447 1,246 1,246Williamsburg 459 417 446 1,322 1,322H-B Woodlawn 83 83 83 249 249MIDDLE TOTAL 2,156 1,902 1,977 6,035 9 10 11 12 HIGH 6,035Arlington Community 24 38 18 26 106 106Arlington Tech 100 100 40 240 240Langston 1 4 18 49 72 72Stratford Program 9 6 6 12 33 33Wakefield 551 483 518 448 2,000 2,000Washington-Lee 727 597 592 641 2,557 2,557Yorktown 511 509 510 492 2,022 2,022H-B Woodlawn 110 110 110 114 444 444 HIGH TOTAL 2,033 1,847 1,812 1,782 7,474 7,474
TOTAL 2,198 2,226 2,136 2,203 2,150 2,175 13,088 560 288 323 99 12 1,282 2,156 1,902 1,977 6,035 2,033 1,847 1,812 1,782 7,474 7,474K-12 TOTAL 26,597Career Center - FTE's 459Reed (community services) 36 PreK-12 Total 27,879Five-year-old Montessori students are reported in Kindergarten. Career Center FTE are not included in the total as the students are already counted in their home school.All Special Education students, including those in self-contained classes, all ESOL/HILT/HILTEX students, and all Transition Program students are included within the grade totals at each school.Langston and Arlington Community membership does not include students over 20 years old. The above projections do not include the adult students at Arlington Community and at Langston.
APS provides specialized services (i.e., Speech) to “dual-enrolled” students on a limited basis and invites PreK students to serve as “peer models” in PreK classrooms that are under-enrolled. Although both dual-enrolled and peer model students are counted towards total enrollment, they are not counted toward capacity utilization since they are in attendance in school only intermittently. The Fall 2017 projections are subject to program relocation decisions which will be reflected in the Spring update produced in February 2018.
TOTALKSCHOOL 5432 K-51
Preschool
Annual APS Enrollment Projections Report | December 2016 21
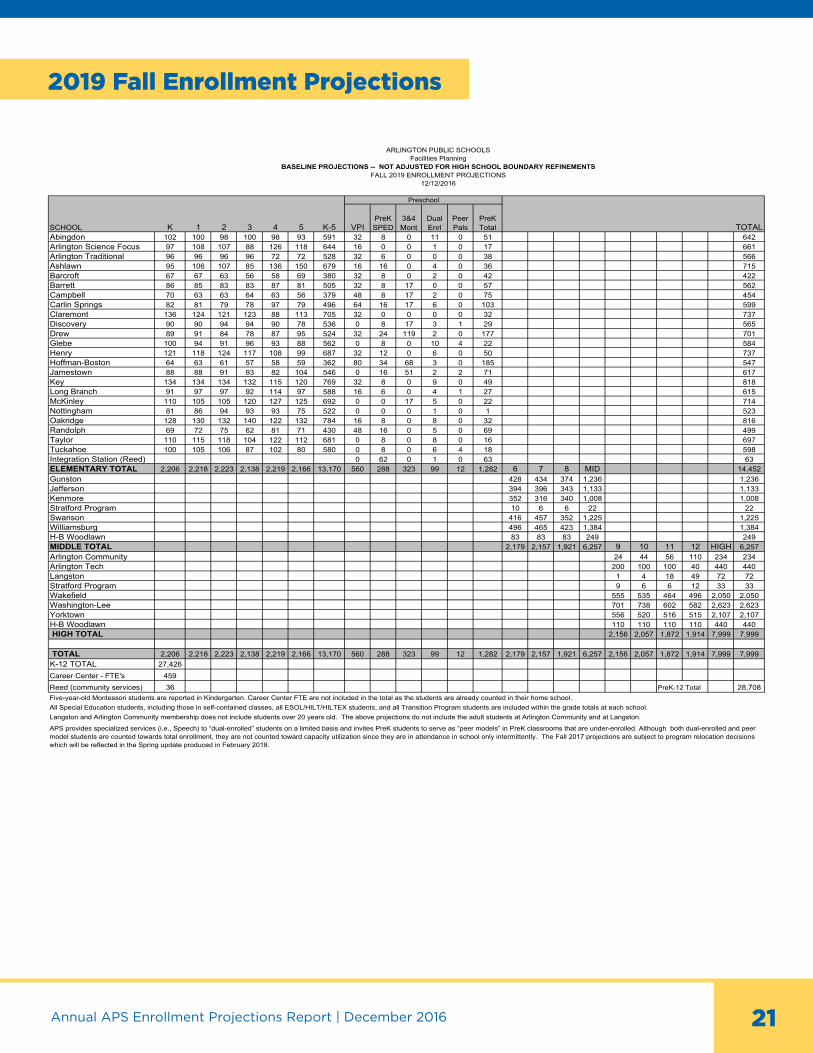
2019 Fall Enrollment Projections
ARLINGTON PUBLIC SCHOOLSFacilities Planning
BASELINE PROJECTIONS -- NOT ADJUSTED FOR HIGH SCHOOL BOUNDARY REFINEMENTSFALL 2019 ENROLLMENT PROJECTIONS
12/12/2016
VPIPreKSPED
3&4Mont
DualEnrl
PeerPals
PreKTotal
Abingdon 102 100 98 100 98 93 591 32 8 0 11 0 51 642Arlington Science Focus 97 108 107 88 126 118 644 16 0 0 1 0 17 661Arlington Traditional 96 96 96 96 72 72 528 32 6 0 0 0 38 566Ashlawn 95 106 107 85 136 150 679 16 16 0 4 0 36 715Barcroft 67 67 63 56 58 69 380 32 8 0 2 0 42 422Barrett 86 85 83 83 87 81 505 32 8 17 0 0 57 562Campbell 70 63 63 64 63 56 379 48 8 17 2 0 75 454Carlin Springs 82 81 79 78 97 79 496 64 16 17 6 0 103 599Claremont 136 124 121 123 88 113 705 32 0 0 0 0 32 737Discovery 90 90 94 94 90 78 536 0 8 17 3 1 29 565Drew 89 91 84 78 87 95 524 32 24 119 2 0 177 701Glebe 100 94 91 96 93 88 562 0 8 0 10 4 22 584Henry 121 118 124 117 108 99 687 32 12 0 6 0 50 737Hoffman-Boston 64 63 61 57 58 59 362 80 34 68 3 0 185 547Jamestown 88 88 91 93 82 104 546 0 16 51 2 2 71 617Key 134 134 134 132 115 120 769 32 8 0 9 0 49 818Long Branch 91 97 97 92 114 97 588 16 6 0 4 1 27 615McKinley 110 105 105 120 127 125 692 0 0 17 5 0 22 714Nottingham 81 86 94 93 93 75 522 0 0 0 1 0 1 523Oakridge 128 130 132 140 122 132 784 16 8 0 8 0 32 816Randolph 69 72 75 62 81 71 430 48 16 0 5 0 69 499Taylor 110 115 118 104 122 112 681 0 8 0 8 0 16 697Tuckahoe 100 105 106 87 102 80 580 0 8 0 6 4 18 598Integration Station (Reed) 0 62 0 1 0 63 63ELEMENTARY TOTAL 2,206 2,218 2,223 2,138 2,219 2,166 13,170 560 288 323 99 12 1,282 6 7 8 MID 14,452Gunston 428 434 374 1,236 1,236Jefferson 394 396 343 1,133 1,133Kenmore 352 316 340 1,008 1,008Stratford Program 10 6 6 22 22Swanson 416 457 352 1,225 1,225Williamsburg 496 465 423 1,384 1,384H-B Woodlawn 83 83 83 249 249MIDDLE TOTAL 2,179 2,157 1,921 6,257 9 10 11 12 HIGH 6,257Arlington Community 24 44 56 110 234 234Arlington Tech 200 100 100 40 440 440Langston 1 4 18 49 72 72Stratford Program 9 6 6 12 33 33Wakefield 555 535 464 496 2,050 2,050Washington-Lee 701 738 602 582 2,623 2,623Yorktown 556 520 516 515 2,107 2,107H-B Woodlawn 110 110 110 110 440 440 HIGH TOTAL 2,156 2,057 1,872 1,914 7,999 7,999
TOTAL 2,206 2,218 2,223 2,138 2,219 2,166 13,170 560 288 323 99 12 1,282 2,179 2,157 1,921 6,257 2,156 2,057 1,872 1,914 7,999 7,999K-12 TOTAL 27,426Career Center - FTE's 459Reed (community services) 36 PreK-12 Total 28,708Five-year-old Montessori students are reported in Kindergarten. Career Center FTE are not included in the total as the students are already counted in their home school.All Special Education students, including those in self-contained classes, all ESOL/HILT/HILTEX students, and all Transition Program students are included within the grade totals at each school.Langston and Arlington Community membership does not include students over 20 years old. The above projections do not include the adult students at Arlington Community and at Langston.
APS provides specialized services (i.e., Speech) to “dual-enrolled” students on a limited basis and invites PreK students to serve as “peer models” in PreK classrooms that are under-enrolled. Although both dual-enrolled and peer model students are counted towards total enrollment, they are not counted toward capacity utilization since they are in attendance in school only intermittently. The Fall 2017 projections are subject to program relocation decisions which will be reflected in the Spring update produced in February 2018.
SCHOOL 54321K TOTALK-5
Preschool
Annual APS Enrollment Projections Report | December 2016 22
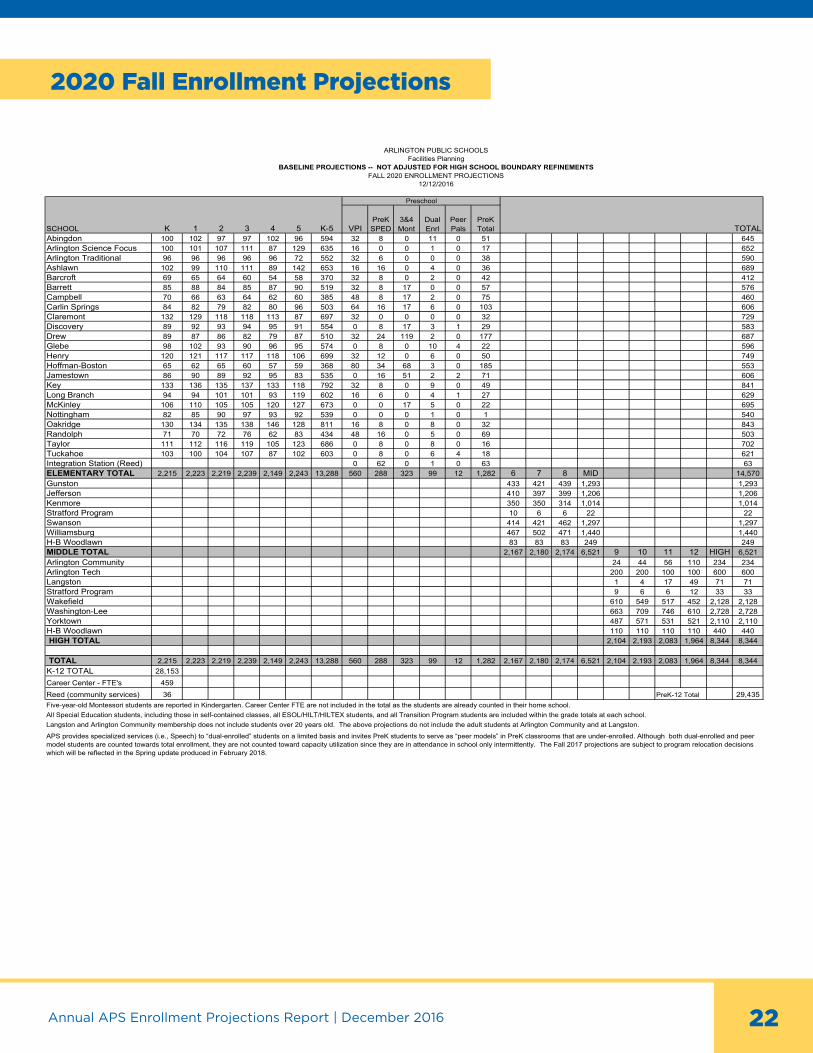
2020 Fall Enrollment Projections
ARLINGTON PUBLIC SCHOOLSFacilities Planning
BASELINE PROJECTIONS -- NOT ADJUSTED FOR HIGH SCHOOL BOUNDARY REFINEMENTSFALL 2020 ENROLLMENT PROJECTIONS
12/12/2016
VPIPreKSPED
3&4Mont
DualEnrl
PeerPals
PreKTotal
Abingdon 100 102 97 97 102 96 594 32 8 0 11 0 51 645Arlington Science Focus 100 101 107 111 87 129 635 16 0 0 1 0 17 652Arlington Traditional 96 96 96 96 96 72 552 32 6 0 0 0 38 590Ashlawn 102 99 110 111 89 142 653 16 16 0 4 0 36 689Barcroft 69 65 64 60 54 58 370 32 8 0 2 0 42 412Barrett 85 88 84 85 87 90 519 32 8 17 0 0 57 576Campbell 70 66 63 64 62 60 385 48 8 17 2 0 75 460Carlin Springs 84 82 79 82 80 96 503 64 16 17 6 0 103 606Claremont 132 129 118 118 113 87 697 32 0 0 0 0 32 729Discovery 89 92 93 94 95 91 554 0 8 17 3 1 29 583Drew 89 87 86 82 79 87 510 32 24 119 2 0 177 687Glebe 98 102 93 90 96 95 574 0 8 0 10 4 22 596Henry 120 121 117 117 118 106 699 32 12 0 6 0 50 749Hoffman-Boston 65 62 65 60 57 59 368 80 34 68 3 0 185 553Jamestown 86 90 89 92 95 83 535 0 16 51 2 2 71 606Key 133 136 135 137 133 118 792 32 8 0 9 0 49 841Long Branch 94 94 101 101 93 119 602 16 6 0 4 1 27 629McKinley 106 110 105 105 120 127 673 0 0 17 5 0 22 695Nottingham 82 85 90 97 93 92 539 0 0 0 1 0 1 540Oakridge 130 134 135 138 146 128 811 16 8 0 8 0 32 843Randolph 71 70 72 76 62 83 434 48 16 0 5 0 69 503Taylor 111 112 116 119 105 123 686 0 8 0 8 0 16 702Tuckahoe 103 100 104 107 87 102 603 0 8 0 6 4 18 621Integration Station (Reed) 0 62 0 1 0 63 63ELEMENTARY TOTAL 2,215 2,223 2,219 2,239 2,149 2,243 13,288 560 288 323 99 12 1,282 6 7 8 MID 14,570Gunston 433 421 439 1,293 1,293Jefferson 410 397 399 1,206 1,206Kenmore 350 350 314 1,014 1,014Stratford Program 10 6 6 22 22Swanson 414 421 462 1,297 1,297Williamsburg 467 502 471 1,440 1,440H-B Woodlawn 83 83 83 249 249MIDDLE TOTAL 2,167 2,180 2,174 6,521 9 10 11 12 HIGH 6,521Arlington Community 24 44 56 110 234 234Arlington Tech 200 200 100 100 600 600Langston 1 4 17 49 71 71Stratford Program 9 6 6 12 33 33Wakefield 610 549 517 452 2,128 2,128Washington-Lee 663 709 746 610 2,728 2,728Yorktown 487 571 531 521 2,110 2,110H-B Woodlawn 110 110 110 110 440 440 HIGH TOTAL 2,104 2,193 2,083 1,964 8,344 8,344
TOTAL 2,215 2,223 2,219 2,239 2,149 2,243 13,288 560 288 323 99 12 1,282 2,167 2,180 2,174 6,521 2,104 2,193 2,083 1,964 8,344 8,344K-12 TOTAL 28,153Career Center - FTE's 459Reed (community services) 36 PreK-12 Total 29,435Five-year-old Montessori students are reported in Kindergarten. Career Center FTE are not included in the total as the students are already counted in their home school.All Special Education students, including those in self-contained classes, all ESOL/HILT/HILTEX students, and all Transition Program students are included within the grade totals at each school.Langston and Arlington Community membership does not include students over 20 years old. The above projections do not include the adult students at Arlington Community and at Langston.
APS provides specialized services (i.e., Speech) to “dual-enrolled” students on a limited basis and invites PreK students to serve as “peer models” in PreK classrooms that are under-enrolled. Although both dual-enrolled and peer model students are counted towards total enrollment, they are not counted toward capacity utilization since they are in attendance in school only intermittently. The Fall 2017 projections are subject to program relocation decisions which will be reflected in the Spring update produced in February 2018.
TOTAL5 K-5
Preschool
SCHOOL K 1 2 3 4

Annual APS Enrollment Projections Report | December 2016 23
2021 Fall Enrollment Projections
ARLINGTON PUBLIC SCHOOLSFacilities Planning
BASELINE PROJECTIONS -- NOT ADJUSTED FOR HIGH SCHOOL BOUNDARY REFINEMENTSFALL 2021 ENROLLMENT PROJECTIONS
12/12/2016
VPIPreKSPED
3&4Mont
DualEnrl
PeerPals
PreKTotal
Abingdon 101 101 101 97 98 101 599 32 8 0 11 0 51 650Arlington Science Focus 103 105 100 112 110 88 618 16 0 0 1 0 17 635Arlington Traditional 96 96 96 96 96 96 576 32 6 0 0 0 38 614Ashlawn 102 106 103 115 115 91 632 16 16 0 4 0 36 668Barcroft 71 66 62 61 56 53 369 32 8 0 2 0 42 411Barrett 88 88 87 86 89 89 527 32 8 17 0 0 57 584Campbell 72 67 67 65 62 60 393 48 8 17 2 0 75 468Carlin Springs 86 84 81 83 85 79 498 64 16 17 6 0 103 601Claremont 137 126 123 115 108 111 720 32 0 0 0 0 32 752Discovery 92 91 95 93 95 96 562 0 8 17 3 1 29 591Drew 92 87 82 84 83 81 509 32 24 119 2 0 177 686Glebe 102 100 101 91 90 98 582 0 8 0 10 4 22 604Henry 120 119 118 110 117 116 700 32 12 0 6 0 50 750Hoffman-Boston 67 63 64 65 60 58 377 80 34 68 3 0 185 562Jamestown 89 88 91 91 94 96 549 0 16 51 2 2 71 620Key 138 136 137 138 138 136 823 32 8 0 9 0 49 872Long Branch 94 96 99 105 103 98 595 16 6 0 4 1 27 622McKinley 107 106 110 105 105 120 653 0 0 17 5 0 22 675Nottingham 85 87 90 94 99 93 548 0 0 0 1 0 1 549Oakridge 130 138 139 143 146 150 846 16 8 0 8 0 32 878Randolph 73 73 70 74 77 63 430 48 16 0 5 0 69 499Taylor 115 113 113 116 119 105 681 0 8 0 8 0 16 697Tuckahoe 103 104 99 104 107 87 604 0 8 0 6 4 18 622Integration Station (Reed) 0 62 0 1 0 63 63ELEMENTARY TOTAL 2,263 2,240 2,228 2,243 2,252 2,165 13,391 560 288 323 99 12 1,282 6 7 8 MID 14,673Gunston 423 434 426 1,283 1,283Jefferson 431 412 399 1,242 1,242Kenmore 355 350 352 1,057 1,057Stratford Program 10 6 6 22 22Swanson 441 415 424 1,280 1,280Williamsburg 483 466 501 1,450 1,450H-B Woodlawn 83 83 83 249 249MIDDLE TOTAL 2,226 2,166 2,191 6,583 9 10 11 12 HIGH 6,583Arlington Community 24 44 56 110 234 234Arlington Tech 200 200 200 100 700 700Langston 1 4 18 49 72 72Stratford Program 9 6 6 12 33 33Wakefield 665 607 541 503 2,316 2,316Washington-Lee 785 662 707 752 2,906 2,906Yorktown 589 487 570 536 2,182 2,182H-B Woodlawn 110 110 110 110 440 440 HIGH TOTAL 2,383 2,120 2,208 2,172 8,883 8,883
TOTAL 2,263 2,240 2,228 2,243 2,252 2,165 13,391 560 288 323 99 12 1,282 2,226 2,166 2,191 6,583 2,383 2,120 2,208 2,172 8,883 8,883K-12 TOTAL 28,857Career Center - FTE's 459Reed (community services) 36 PreK-12 Total 30,139Five-year-old Montessori students are reported in Kindergarten. Career Center FTE are not included in the total as the students are already counted in their home school.All Special Education students, including those in self-contained classes, all ESOL/HILT/HILTEX students, and all Transition Program students are included within the grade totals at each school.Langston and Arlington Community membership does not include students over 20 years old. The above projections do not include the adult students at Arlington Community and at Langston.
APS provides specialized services (i.e., Speech) to “dual-enrolled” students on a limited basis and invites PreK students to serve as “peer models” in PreK classrooms that are under-enrolled. Although both dual-enrolled and peer model students are counted towards total enrollment, they are not counted toward capacity utilization since they are in attendance in school only intermittently. The Fall 2017 projections are subject to program relocation decisions which will be reflected in the Spring update produced in February 2018.
TOTAL5 K-5
Preschool
SCHOOL K 1 2 3 4
Annual APS Enrollment Projections Report | December 2016 24
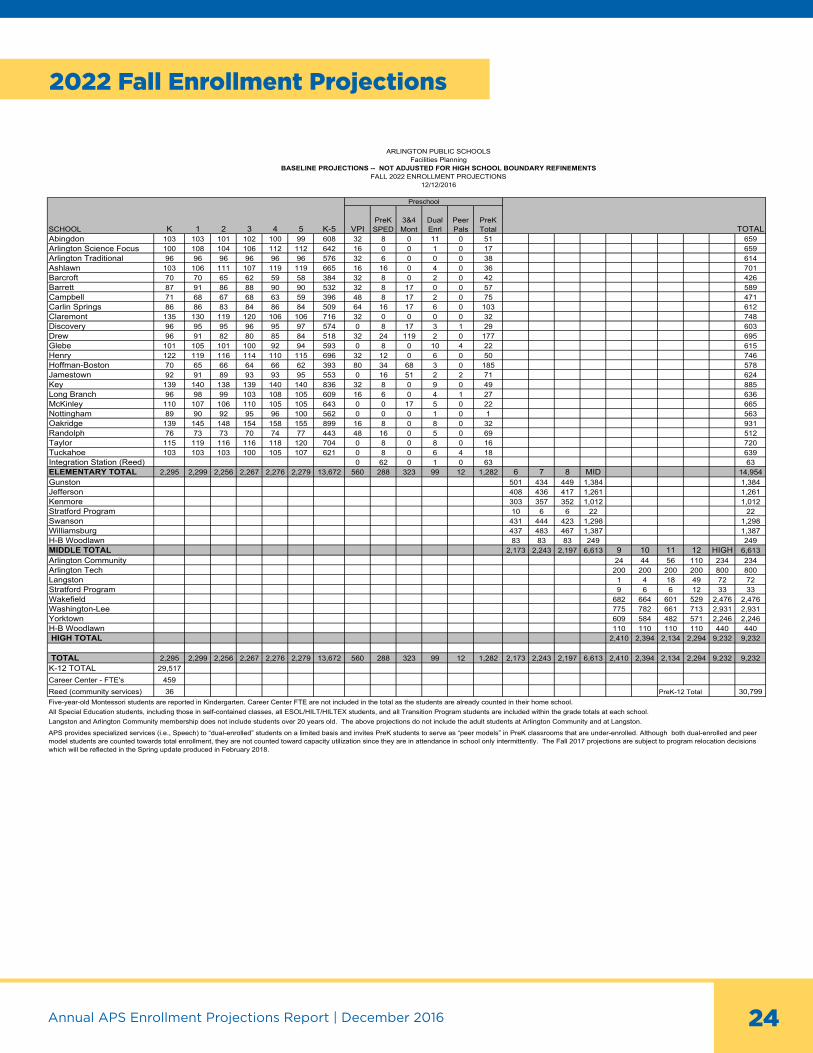
2022 Fall Enrollment Projections
ARLINGTON PUBLIC SCHOOLSFacilities Planning
BASELINE PROJECTIONS -- NOT ADJUSTED FOR HIGH SCHOOL BOUNDARY REFINEMENTSFALL 2022 ENROLLMENT PROJECTIONS
12/12/2016
VPIPreKSPED
3&4Mont
DualEnrl
PeerPals
PreKTotal
Abingdon 103 103 101 102 100 99 608 32 8 0 11 0 51 659Arlington Science Focus 100 108 104 106 112 112 642 16 0 0 1 0 17 659Arlington Traditional 96 96 96 96 96 96 576 32 6 0 0 0 38 614Ashlawn 103 106 111 107 119 119 665 16 16 0 4 0 36 701Barcroft 70 70 65 62 59 58 384 32 8 0 2 0 42 426Barrett 87 91 86 88 90 90 532 32 8 17 0 0 57 589Campbell 71 68 67 68 63 59 396 48 8 17 2 0 75 471Carlin Springs 86 86 83 84 86 84 509 64 16 17 6 0 103 612Claremont 135 130 119 120 106 106 716 32 0 0 0 0 32 748Discovery 96 95 95 96 95 97 574 0 8 17 3 1 29 603Drew 96 91 82 80 85 84 518 32 24 119 2 0 177 695Glebe 101 105 101 100 92 94 593 0 8 0 10 4 22 615Henry 122 119 116 114 110 115 696 32 12 0 6 0 50 746Hoffman-Boston 70 65 66 64 66 62 393 80 34 68 3 0 185 578Jamestown 92 91 89 93 93 95 553 0 16 51 2 2 71 624Key 139 140 138 139 140 140 836 32 8 0 9 0 49 885Long Branch 96 98 99 103 108 105 609 16 6 0 4 1 27 636McKinley 110 107 106 110 105 105 643 0 0 17 5 0 22 665Nottingham 89 90 92 95 96 100 562 0 0 0 1 0 1 563Oakridge 139 145 148 154 158 155 899 16 8 0 8 0 32 931Randolph 76 73 73 70 74 77 443 48 16 0 5 0 69 512Taylor 115 119 116 116 118 120 704 0 8 0 8 0 16 720Tuckahoe 103 103 103 100 105 107 621 0 8 0 6 4 18 639Integration Station (Reed) 0 62 0 1 0 63 63ELEMENTARY TOTAL 2,295 2,299 2,256 2,267 2,276 2,279 13,672 560 288 323 99 12 1,282 6 7 8 MID 14,954Gunston 501 434 449 1,384 1,384Jefferson 408 436 417 1,261 1,261Kenmore 303 357 352 1,012 1,012Stratford Program 10 6 6 22 22Swanson 431 444 423 1,298 1,298Williamsburg 437 483 467 1,387 1,387H-B Woodlawn 83 83 83 249 249MIDDLE TOTAL 2,173 2,243 2,197 6,613 9 10 11 12 HIGH 6,613Arlington Community 24 44 56 110 234 234Arlington Tech 200 200 200 200 800 800Langston 1 4 18 49 72 72Stratford Program 9 6 6 12 33 33Wakefield 682 664 601 529 2,476 2,476Washington-Lee 775 782 661 713 2,931 2,931Yorktown 609 584 482 571 2,246 2,246H-B Woodlawn 110 110 110 110 440 440 HIGH TOTAL 2,410 2,394 2,134 2,294 9,232 9,232
TOTAL 2,295 2,299 2,256 2,267 2,276 2,279 13,672 560 288 323 99 12 1,282 2,173 2,243 2,197 6,613 2,410 2,394 2,134 2,294 9,232 9,232K-12 TOTAL 29,517Career Center - FTE's 459Reed (community services) 36 PreK-12 Total 30,799Five-year-old Montessori students are reported in Kindergarten. Career Center FTE are not included in the total as the students are already counted in their home school.All Special Education students, including those in self-contained classes, all ESOL/HILT/HILTEX students, and all Transition Program students are included within the grade totals at each school.Langston and Arlington Community membership does not include students over 20 years old. The above projections do not include the adult students at Arlington Community and at Langston.
APS provides specialized services (i.e., Speech) to “dual-enrolled” students on a limited basis and invites PreK students to serve as “peer models” in PreK classrooms that are under-enrolled. Although both dual-enrolled and peer model students are counted towards total enrollment, they are not counted toward capacity utilization since they are in attendance in school only intermittently. The Fall 2017 projections are subject to program relocation decisions which will be reflected in the Spring update produced in February 2018.
TOTAL5 K-5
Preschool
SCHOOL K 1 2 3 4

Annual APS Enrollment Projections Report | December 2016 25
2023 Fall Enrollment Projections
ARLINGTON PUBLIC SCHOOLSFacilities Planning
BASELINE PROJECTIONS -- NOT ADJUSTED FOR HIGH SCHOOL BOUNDARY REFINEMENTSFALL 2023 ENROLLMENT PROJECTIONS
12/12/2016
VPIPreKSPED
3&4Mont
DualEnrl
PeerPals
PreKTotal
Abingdon 101 104 104 102 103 101 615 32 8 0 11 0 51 666Arlington Science Focus 101 105 107 110 106 114 643 16 0 0 1 0 17 660Arlington Traditional 96 96 96 96 96 96 576 32 6 0 0 0 38 614Ashlawn 101 107 110 115 111 123 667 16 16 0 4 0 36 703Barcroft 70 70 70 65 61 61 397 32 8 0 2 0 42 439Barrett 86 90 88 88 93 91 536 32 8 17 0 0 57 593Campbell 71 67 69 69 66 61 403 48 8 17 2 0 75 478Carlin Springs 85 86 85 86 87 85 514 64 16 17 6 0 103 617Claremont 135 128 124 116 110 104 717 32 0 0 0 0 32 749Discovery 98 99 99 96 98 97 587 0 8 17 3 1 29 616Drew 98 94 85 80 81 86 524 32 24 119 2 0 177 701Glebe 100 104 106 101 101 95 607 0 8 0 10 4 22 629Henry 122 121 118 111 115 109 696 32 12 0 6 0 50 746Hoffman-Boston 71 71 66 67 65 67 407 80 34 68 3 0 185 592Jamestown 95 94 92 91 94 94 560 0 16 51 2 2 71 631Key 139 139 140 138 139 140 835 32 8 0 9 0 49 884Long Branch 96 100 101 103 106 110 616 16 6 0 4 1 27 643McKinley 107 110 107 106 110 105 645 0 0 17 5 0 22 667Nottingham 90 92 93 94 98 99 566 0 0 0 1 0 1 567Oakridge 140 147 153 156 162 166 924 16 8 0 8 0 32 956Randolph 77 76 73 73 70 74 443 48 16 0 5 0 69 512Taylor 115 118 122 120 119 121 715 0 8 0 8 0 16 731Tuckahoe 102 103 103 104 100 105 617 0 8 0 6 4 18 635Integration Station (Reed) 0 62 0 1 0 63 63ELEMENTARY TOTAL 2,296 2,321 2,311 2,287 2,291 2,304 13,810 560 288 323 99 12 1,282 6 7 8 MID 15,092Gunston 468 511 449 1,428 1,428Jefferson 427 413 441 1,281 1,281Kenmore 346 305 358 1,009 1,009Stratford Program 10 6 6 22 22Swanson 444 435 452 1,331 1,331Williamsburg 474 437 483 1,394 1,394H-B Woodlawn 83 83 83 249 249MIDDLE TOTAL 2,252 2,190 2,272 6,714 9 10 11 12 HIGH 6,714Arlington Community 24 44 56 110 234 234Arlington Tech 200 200 200 200 800 800Langston 1 4 17 49 71 71Stratford Program 9 6 6 12 33 33Wakefield 709 683 659 594 2,645 2,645Washington-Lee 788 774 782 669 3,013 3,013Yorktown 562 605 580 485 2,232 2,232H-B Woodlawn 110 110 110 110 440 440 HIGH TOTAL 2,403 2,426 2,410 2,229 9,468 9,468
TOTAL 2,296 2,321 2,311 2,287 2,291 2,304 13,810 560 288 323 99 12 1,282 2,252 2,190 2,272 6,714 2,403 2,426 2,410 2,229 9,468 9,468K-12 TOTAL 29,992Career Center - FTE's 459Reed (community services) 36 PreK-12 Total 31,274Five-year-old Montessori students are reported in Kindergarten. Career Center FTE are not included in the total as the students are already counted in their home school.All Special Education students, including those in self-contained classes, all ESOL/HILT/HILTEX students, and all Transition Program students are included within the grade totals at each school.Langston and Arlington Community membership does not include students over 20 years old. The above projections do not include the adult students at Arlington Community and at Langston.
APS provides specialized services (i.e., Speech) to “dual-enrolled” students on a limited basis and invites PreK students to serve as “peer models” in PreK classrooms that are under-enrolled. Although both dual-enrolled and peer model students are counted towards total enrollment, they are not counted toward capacity utilization since they are in attendance in school only intermittently. The Fall 2017 projections are subject to program relocation decisions which will be reflected in the Spring update produced in February 2018.
TOTAL5 K-5
Preschool
SCHOOL K 1 2 3 4

Annual APS Enrollment Projections Report | December 2016 26
2024 Fall Enrollment Projections
ARLINGTON PUBLIC SCHOOLSFacilities Planning
BASELINE PROJECTIONS -- NOT ADJUSTED FOR HIGH SCHOOL BOUNDARY REFINEMENTSFALL 2024 ENROLLMENT PROJECTIONS
12/12/2016
VPIPreKSPED
3&4Mont
DualEnrl
PeerPals
PreKTotal
Abingdon 101 102 105 105 103 104 620 32 8 0 11 0 51 671Arlington Science Focus 101 106 104 114 110 107 642 16 0 0 1 0 17 659Arlington Traditional 96 96 96 96 96 96 576 32 6 0 0 0 38 614Ashlawn 101 105 111 115 119 116 667 16 16 0 4 0 36 703Barcroft 70 70 70 71 64 64 409 32 8 0 2 0 42 451Barrett 87 89 87 90 92 93 538 32 8 17 0 0 57 595Campbell 71 67 68 70 67 64 407 48 8 17 2 0 75 482Carlin Springs 85 85 85 88 89 86 518 64 16 17 6 0 103 621Claremont 136 128 122 121 107 108 722 32 0 0 0 0 32 754Discovery 99 101 103 100 98 100 601 0 8 17 3 1 29 630Drew 99 96 89 83 81 82 530 32 24 119 2 0 177 707Glebe 101 103 104 106 102 104 620 0 8 0 10 4 22 642Henry 122 120 120 113 112 114 701 32 12 0 6 0 50 751Hoffman-Boston 72 72 72 67 68 66 417 80 34 68 3 0 185 602Jamestown 96 97 95 94 92 96 570 0 16 51 2 2 71 641Key 141 140 139 140 138 139 837 32 8 0 9 0 49 886Long Branch 97 100 103 105 106 108 619 16 6 0 4 1 27 646McKinley 107 107 110 107 106 110 647 0 0 17 5 0 22 669Nottingham 92 93 94 96 97 101 573 0 0 0 1 0 1 574Oakridge 144 148 155 161 164 170 942 16 8 0 8 0 32 974Randolph 79 77 76 73 73 70 448 48 16 0 5 0 69 517Taylor 117 118 121 126 123 122 727 0 8 0 8 0 16 743Tuckahoe 102 103 104 104 104 100 617 0 8 0 6 4 18 635Integration Station (Reed) 0 62 0 1 0 63 63ELEMENTARY TOTAL 2,316 2,323 2,333 2,345 2,311 2,320 13,948 560 288 323 99 12 1,282 6 7 8 MID 15,230Gunston 477 479 526 1,482 1,482Jefferson 433 432 418 1,283 1,283Kenmore 343 348 307 998 998Stratford Program 10 6 6 22 22Swanson 453 449 443 1,345 1,345Williamsburg 477 475 438 1,390 1,390H-B Woodlawn 83 83 83 249 249MIDDLE TOTAL 2,276 2,272 2,221 6,769 9 10 11 12 HIGH 6,769Arlington Community 24 44 56 110 234 234Arlington Tech 200 200 200 200 800 800Langston 1 4 18 49 72 72Stratford Program 9 6 6 12 33 33Wakefield 701 713 679 657 2,750 2,750Washington-Lee 825 790 776 792 3,183 3,183Yorktown 588 560 604 585 2,337 2,337H-B Woodlawn 110 110 110 110 440 440 HIGH TOTAL 2,458 2,427 2,449 2,515 9,849 9,849
TOTAL 2,316 2,323 2,333 2,345 2,311 2,320 13,948 560 288 323 99 12 1,282 2,276 2,272 2,221 6,769 2,458 2,427 2,449 2,515 9,849 9,849K-12 TOTAL 30,566Career Center - FTE's 459Reed (community services) 36 PreK-12 Total 31,848Five-year-old Montessori students are reported in Kindergarten. Career Center FTE are not included in the total as the students are already counted in their home school.All Special Education students, including those in self-contained classes, all ESOL/HILT/HILTEX students, and all Transition Program students are included within the grade totals at each school.Langston and Arlington Community membership does not include students over 20 years old. The above projections do not include the adult students at Arlington Community and at Langston.
APS provides specialized services (i.e., Speech) to “dual-enrolled” students on a limited basis and invites PreK students to serve as “peer models” in PreK classrooms that are under-enrolled. Although both dual-enrolled and peer model students are counted towards total enrollment, they are not counted toward capacity utilization since they are in attendance in school only intermittently. The Fall 2017 projections are subject to program relocation decisions which will be reflected in the Spring update produced in February 2018.
TOTAL5 K-5
Preschool
SCHOOL K 1 2 3 4

Annual APS Enrollment Projections Report | December 2016 27
2025 Fall Enrollment Projections
ARLINGTON PUBLIC SCHOOLSFacilities Planning
BASELINE PROJECTIONS -- NOT ADJUSTED FOR HIGH SCHOOL BOUNDARY REFINEMENTSFALL 2025 ENROLLMENT PROJECTIONS
12/12/2016
VPIPreKSPED
3&4Mont
DualEnrl
PeerPals
PreKTotal
Abingdon 101 102 103 106 106 104 622 32 8 0 11 0 51 673Arlington Science Focus 101 106 105 111 115 112 650 16 0 0 1 0 17 667Arlington Traditional 96 96 96 96 96 96 576 32 6 0 0 0 38 614Ashlawn 101 105 110 115 119 124 674 16 16 0 4 0 36 710Barcroft 70 72 72 73 71 69 427 32 8 0 2 0 42 469Barrett 87 90 86 89 95 91 538 32 8 17 0 0 57 595Campbell 71 68 68 69 68 64 408 48 8 17 2 0 75 483Carlin Springs 85 85 83 88 91 88 520 64 16 17 6 0 103 623Claremont 135 129 122 119 111 105 721 32 0 0 0 0 32 753Discovery 102 102 105 105 102 100 616 0 8 17 3 1 29 645Drew 102 97 90 86 84 82 541 32 24 119 2 0 177 718Glebe 100 104 104 105 107 105 625 0 8 0 10 4 22 647Henry 123 121 119 116 115 112 706 32 12 0 6 0 50 756Hoffman-Boston 74 73 73 73 68 69 430 80 34 68 3 0 185 615Jamestown 99 98 99 97 96 94 583 0 16 51 2 2 71 654Key 143 142 140 140 140 138 843 32 8 0 9 0 49 892Long Branch 98 101 103 107 108 108 625 16 6 0 4 1 27 652McKinley 107 107 107 110 107 106 644 0 0 17 5 0 22 666Nottingham 94 95 96 97 99 100 581 0 0 0 1 0 1 582Oakridge 148 152 156 163 169 172 960 16 8 0 8 0 32 992Randolph 81 79 77 76 73 73 459 48 16 0 5 0 69 528Taylor 117 120 122 125 129 126 739 0 8 0 8 0 16 755Tuckahoe 102 103 104 104 104 104 621 0 8 0 6 4 18 639Integration Station (Reed) 0 62 0 1 0 63 63ELEMENTARY TOTAL 2,337 2,347 2,340 2,370 2,373 2,342 14,109 560 288 323 99 12 1,282 6 7 8 MID 15,391Gunston 496 487 494 1,477 1,477Jefferson 432 438 437 1,307 1,307Kenmore 342 345 350 1,037 1,037Stratford Program 10 6 6 22 22Swanson 460 456 457 1,373 1,373Williamsburg 480 477 475 1,432 1,432H-B Woodlawn 83 83 83 249 249MIDDLE TOTAL 2,303 2,292 2,302 6,897 9 10 11 12 HIGH 6,897Arlington Community 24 44 56 110 234 234Arlington Tech 200 200 200 200 800 800Langston 1 4 18 49 72 72Stratford Program 9 6 6 12 33 33Wakefield 782 702 706 681 2,871 2,871Washington-Lee 707 824 789 784 3,104 3,104Yorktown 593 585 557 607 2,342 2,342H-B Woodlawn 110 110 110 110 440 440 HIGH TOTAL 2,426 2,475 2,442 2,553 9,896 9,896
TOTAL 2,337 2,347 2,340 2,370 2,373 2,342 14,109 560 288 323 99 12 1,282 2,303 2,292 2,302 6,897 2,426 2,475 2,442 2,553 9,896 9,896K-12 TOTAL 30,902Career Center - FTE's 459Reed (community services) 36 PreK-12 Total 32,184Five-year-old Montessori students are reported in Kindergarten. Career Center FTE are not included in the total as the students are already counted in their home school.All Special Education students, including those in self-contained classes, all ESOL/HILT/HILTEX students, and all Transition Program students are included within the grade totals at each school.Langston and Arlington Community membership does not include students over 20 years old. The above projections do not include the adult students at Arlington Community and at Langston.
APS provides specialized services (i.e., Speech) to “dual-enrolled” students on a limited basis and invites PreK students to serve as “peer models” in PreK classrooms that are under-enrolled. Although both dual-enrolled and peer model students are counted towards total enrollment, they are not counted toward capacity utilization since they are in attendance in school only intermittently. The Fall 2017 projections are subject to program relocation decisions which will be reflected in the Spring update produced in February 2018.
SCHOOL K 1 2 3 4 5 K-5
Preschool
TOTAL
Annual APS Enrollment Projections Report | December 2016 28
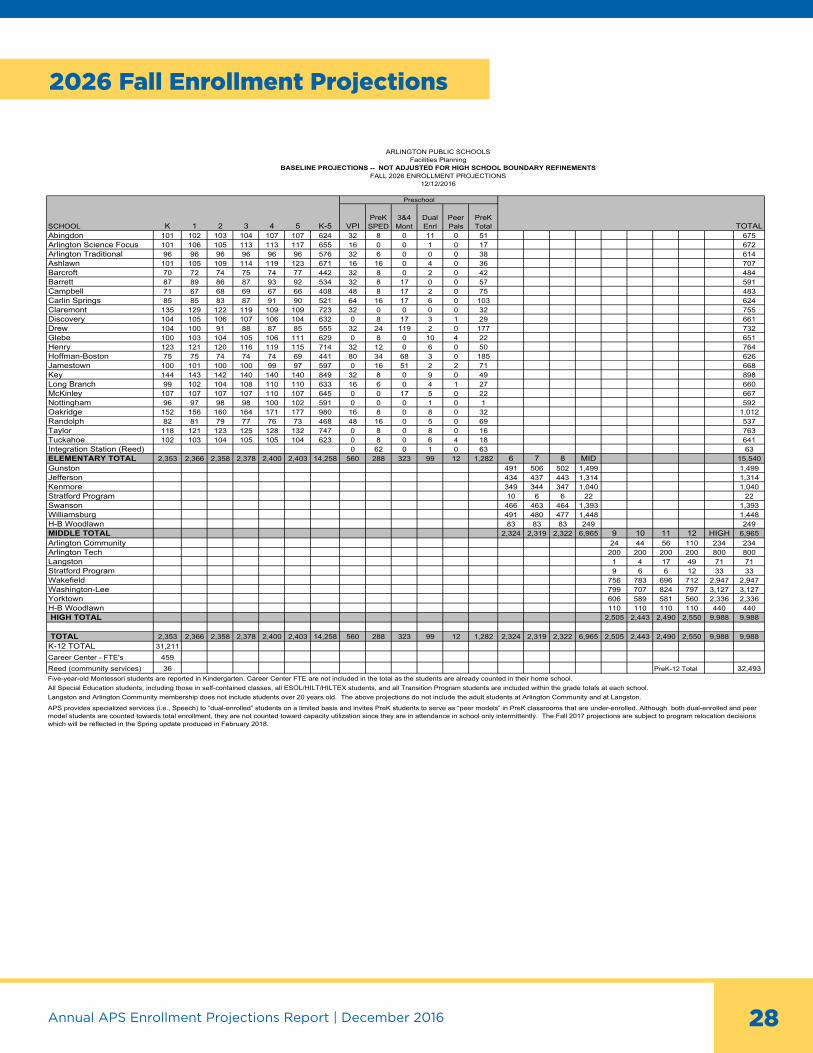
2026 Fall Enrollment Projections
ARLINGTON PUBLIC SCHOOLSFacilities Planning
BASELINE PROJECTIONS -- NOT ADJUSTED FOR HIGH SCHOOL BOUNDARY REFINEMENTSFALL 2026 ENROLLMENT PROJECTIONS
12/12/2016
VPIPreKSPED
3&4Mont
DualEnrl
PeerPals
PreKTotal
Abingdon 101 102 103 104 107 107 624 32 8 0 11 0 51 675Arlington Science Focus 101 106 105 113 113 117 655 16 0 0 1 0 17 672Arlington Traditional 96 96 96 96 96 96 576 32 6 0 0 0 38 614Ashlawn 101 105 109 114 119 123 671 16 16 0 4 0 36 707Barcroft 70 72 74 75 74 77 442 32 8 0 2 0 42 484Barrett 87 89 86 87 93 92 534 32 8 17 0 0 57 591Campbell 71 67 68 69 67 66 408 48 8 17 2 0 75 483Carlin Springs 85 85 83 87 91 90 521 64 16 17 6 0 103 624Claremont 135 129 122 119 109 109 723 32 0 0 0 0 32 755Discovery 104 105 106 107 106 104 632 0 8 17 3 1 29 661Drew 104 100 91 88 87 85 555 32 24 119 2 0 177 732Glebe 100 103 104 105 106 111 629 0 8 0 10 4 22 651Henry 123 121 120 116 119 115 714 32 12 0 6 0 50 764Hoffman-Boston 75 75 74 74 74 69 441 80 34 68 3 0 185 626Jamestown 100 101 100 100 99 97 597 0 16 51 2 2 71 668Key 144 143 142 140 140 140 849 32 8 0 9 0 49 898Long Branch 99 102 104 108 110 110 633 16 6 0 4 1 27 660McKinley 107 107 107 107 110 107 645 0 0 17 5 0 22 667Nottingham 96 97 98 98 100 102 591 0 0 0 1 0 1 592Oakridge 152 156 160 164 171 177 980 16 8 0 8 0 32 1,012Randolph 82 81 79 77 76 73 468 48 16 0 5 0 69 537Taylor 118 121 123 125 128 132 747 0 8 0 8 0 16 763Tuckahoe 102 103 104 105 105 104 623 0 8 0 6 4 18 641Integration Station (Reed) 0 62 0 1 0 63 63ELEMENTARY TOTAL 2,353 2,366 2,358 2,378 2,400 2,403 14,258 560 288 323 99 12 1,282 6 7 8 MID 15,540Gunston 491 506 502 1,499 1,499Jefferson 434 437 443 1,314 1,314Kenmore 349 344 347 1,040 1,040Stratford Program 10 6 6 22 22Swanson 466 463 464 1,393 1,393Williamsburg 491 480 477 1,448 1,448H-B Woodlawn 83 83 83 249 249MIDDLE TOTAL 2,324 2,319 2,322 6,965 9 10 11 12 HIGH 6,965Arlington Community 24 44 56 110 234 234Arlington Tech 200 200 200 200 800 800Langston 1 4 17 49 71 71Stratford Program 9 6 6 12 33 33Wakefield 756 783 696 712 2,947 2,947Washington-Lee 799 707 824 797 3,127 3,127Yorktown 606 589 581 560 2,336 2,336H-B Woodlawn 110 110 110 110 440 440 HIGH TOTAL 2,505 2,443 2,490 2,550 9,988 9,988
TOTAL 2,353 2,366 2,358 2,378 2,400 2,403 14,258 560 288 323 99 12 1,282 2,324 2,319 2,322 6,965 2,505 2,443 2,490 2,550 9,988 9,988K-12 TOTAL 31,211Career Center - FTE's 459Reed (community services) 36 PreK-12 Total 32,493Five-year-old Montessori students are reported in Kindergarten. Career Center FTE are not included in the total as the students are already counted in their home school.All Special Education students, including those in self-contained classes, all ESOL/HILT/HILTEX students, and all Transition Program students are included within the grade totals at each school.Langston and Arlington Community membership does not include students over 20 years old. The above projections do not include the adult students at Arlington Community and at Langston.
TOTAL
APS provides specialized services (i.e., Speech) to “dual-enrolled” students on a limited basis and invites PreK students to serve as “peer models” in PreK classrooms that are under-enrolled. Although both dual-enrolled and peer model students are counted towards total enrollment, they are not counted toward capacity utilization since they are in attendance in school only intermittently. The Fall 2017 projections are subject to program relocation decisions which will be reflected in the Spring update produced in February 2018.
5 K-5
Preschool
SCHOOL K 1 2 3 4
Annual APS Enrollment Projections Report | December 2016 2929
Actual Versus Projection, Prior Year Comparison
Annual APS Enrollment Projections Report | December 2016 30
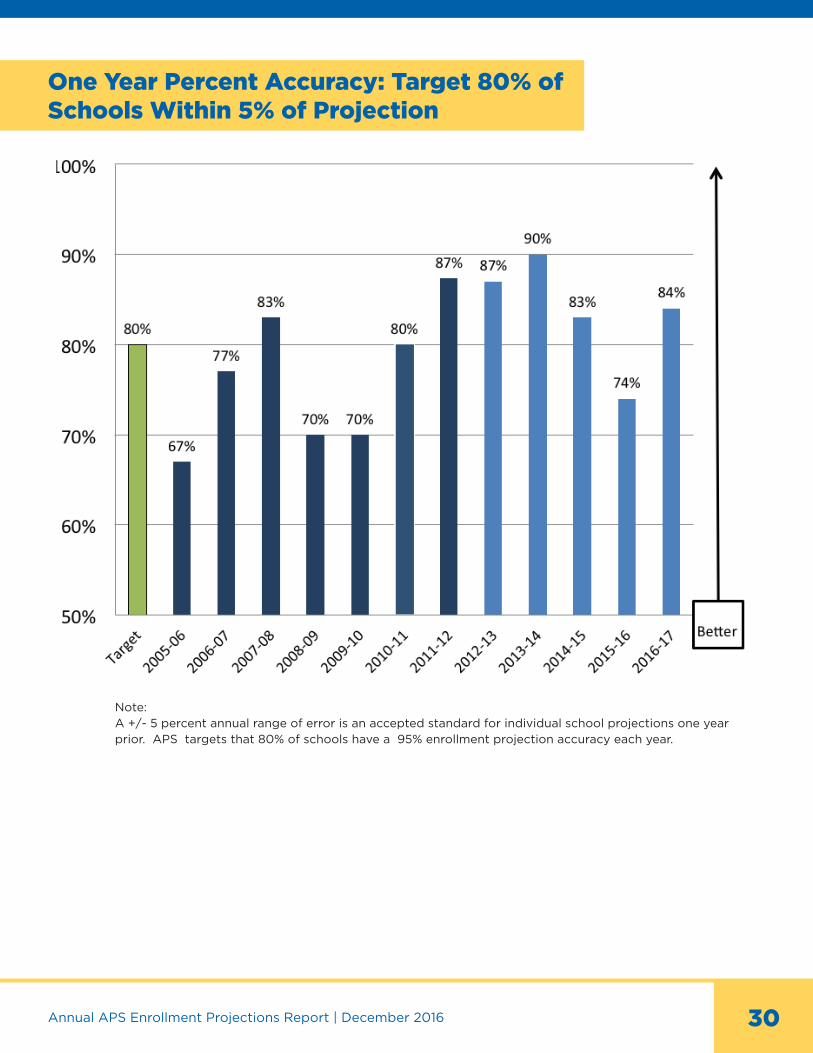
One Year Percent Accuracy: Target 80% of Schools Within 5% of Projection
Note:A +/- 5 percent annual range of error is an accepted standard for individual school projections one year prior. APS targets that 80% of schools have a 95% enrollment projection accuracy each year.


/ArlingtonPublicSchools
@APSVirginia
APSVirginia
www.APSva.us
Prepared by: Lionel A. White,Director, Facilities PlanningArlington Public [email protected]