hi projections - aspe · •ffs enrollment •utilization •unit cost. enrollment ... utilization....
TRANSCRIPT

HI Projections
Medicare Technical Panel

Part A FFS Benefits
• Inpatient hospital• Skilled nursing facility• Home health agency• Hospice

HI FFS Benefits
Hospital73%
SNF16%
HHA3%
Hospice8%
HI FFS Benefits

Projections (3 factors)
• FFS Enrollment• Utilization• Unit cost
Enrollment
• Take out managed care• Aged• Disabled• ESRD

Unit Cost
• Price (function of MB)• Case mix
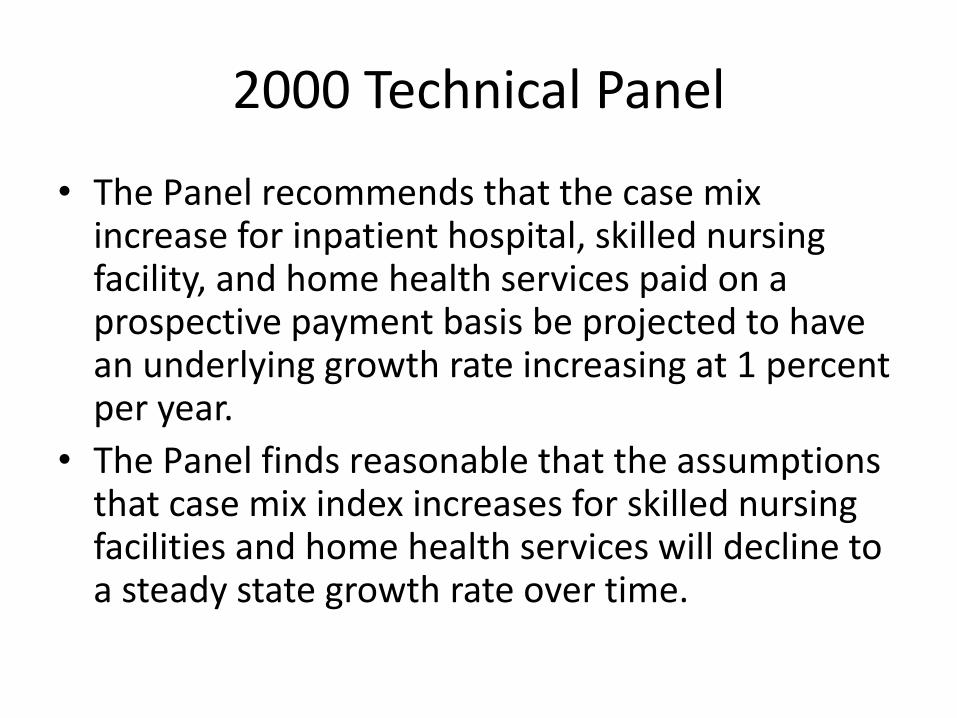
2000 Technical Panel
• The Panel recommends that the case mix increase for inpatient hospital, skilled nursing facility, and home health services paid on a prospective payment basis be projected to have an underlying growth rate increasing at 1 percent per year.
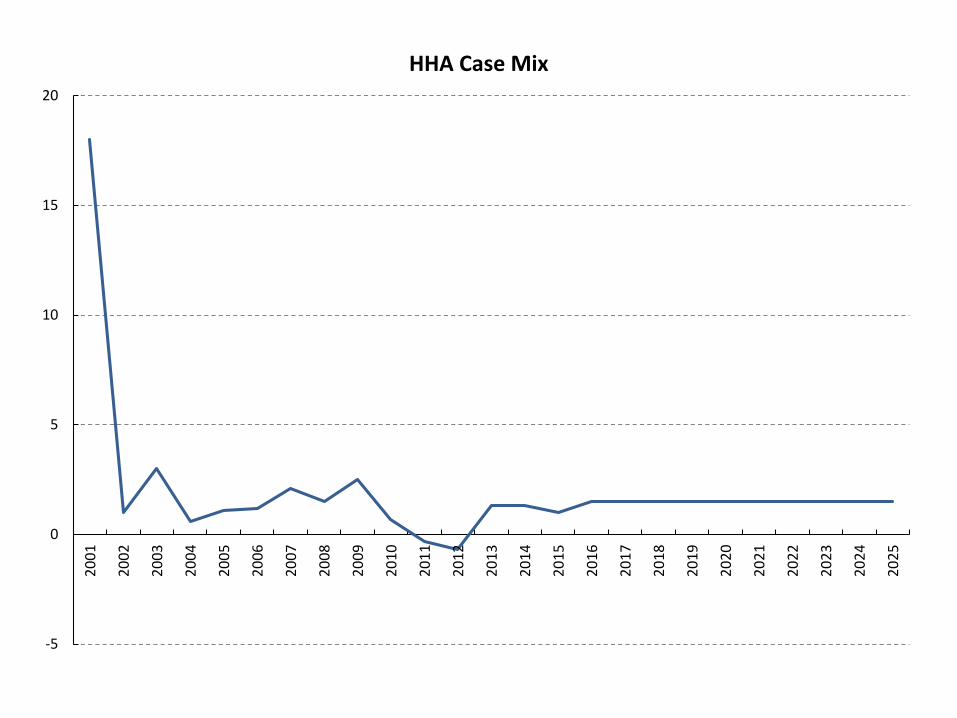
• The Panel finds reasonable that the assumptions that case mix index increases for skilled nursing facilities and home health services will decline to a steady state growth rate over time.

2011 Technical Panel
• The Panel finds that the current assumptions for inpatient hospital case-mix growth may be too high and that those for skilled nursing facilities and home health care may be too low.
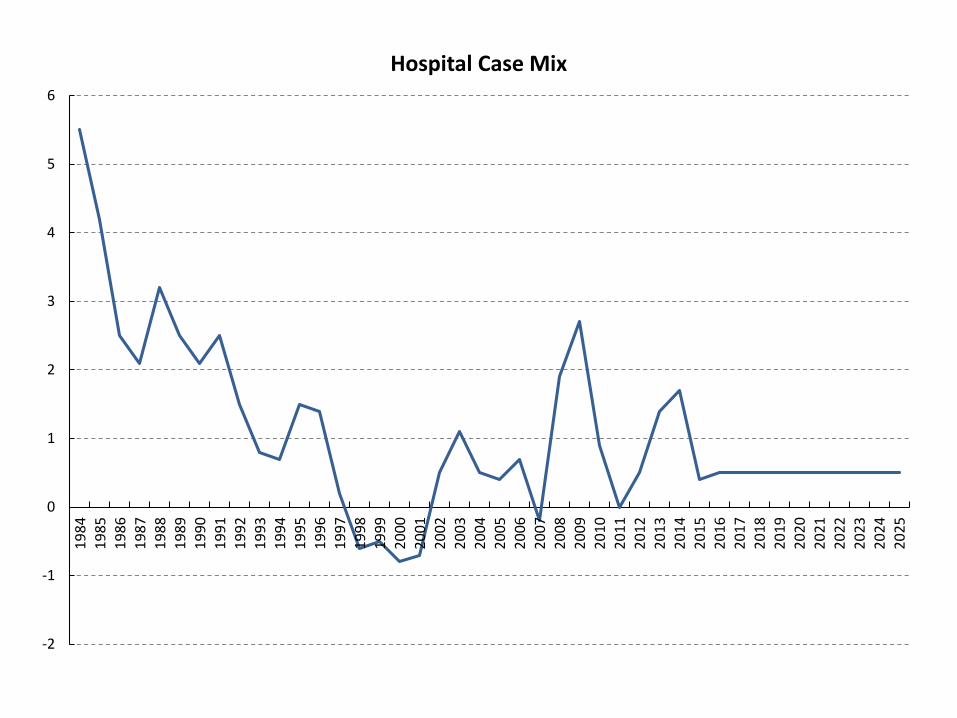
Hospital Case Mix
-2
-1
0
1
2
3
4
5
619
8419
8519
8619
8719
8819
8919
9019
9119
9219
9319
9419
9519
9619
9719
9819
9920
0020
0120
0220
0320
0420
0520
0620
0720
0820
0920
1020
1120
1220
1320
1420
1520
1620
1720
1820
1920
2020
2120
2220
2320
2420
25
Hospital Case Mix

SNF Case Mix
0
2
4
6
8
10
12
14
1619
99
2000
2001
2002
2003
2004
2005
2006
2007
2008
2009
2010
2011
2012
2013
2014
2015
2016
2017
2018
2019
2020
2021
2022
2023
2024
2025
SNF Case Mix
HHA Case Mix
-5
0
5
10
15
2020
01
2002
2003
2004
2005
2006
2007
2008
2009
2010
2011
2012
2013
2014
2015
2016
2017
2018
2019
2020
2021
2022
2023
2024
2025
HHA Case Mix
Utilization
• Base trend• Age sex• MA switchers impact

2000 Technical Panel
• The panel recommends that an explicit assumption of selection effects be incorporated in the managed care shift effect.

2000 Technical Panel
• The panel recommends a trend in the next decade toward lower inpatient hospital utilization.
Current forecasts project no increase in per-beneficiary utilization of HI services after the next few years. The Panel concludes that this assumption is generally reasonable and suggests a slight decrease in the use of inpatient hospital services in this time period.

2000 Technical Panel
• The Panel recommends a trend in the next decade toward no change in utilization of home health or skilled nursing facilities.

2011 Technical Panel
• The Panel recommends reconsideration of the current assumption that growth in SNF per capita utilization will rapidly decline from recent historical levels to zero percent per year for the balance of the short-range period. In view of past trends, the Panel believes an ultimate growth rate of 1 percent per year would be more appropriate.

2011 Technical Panel
• The Panel recommends reconsideration of the current assumption that growth in per capita home health utilization will rapidly decline from recent historical levels to zero percent per year for the balance of the short-range period. In view of past trends, the Panel believes an ultimate growth rate of 1 percent per year would be more appropriate.
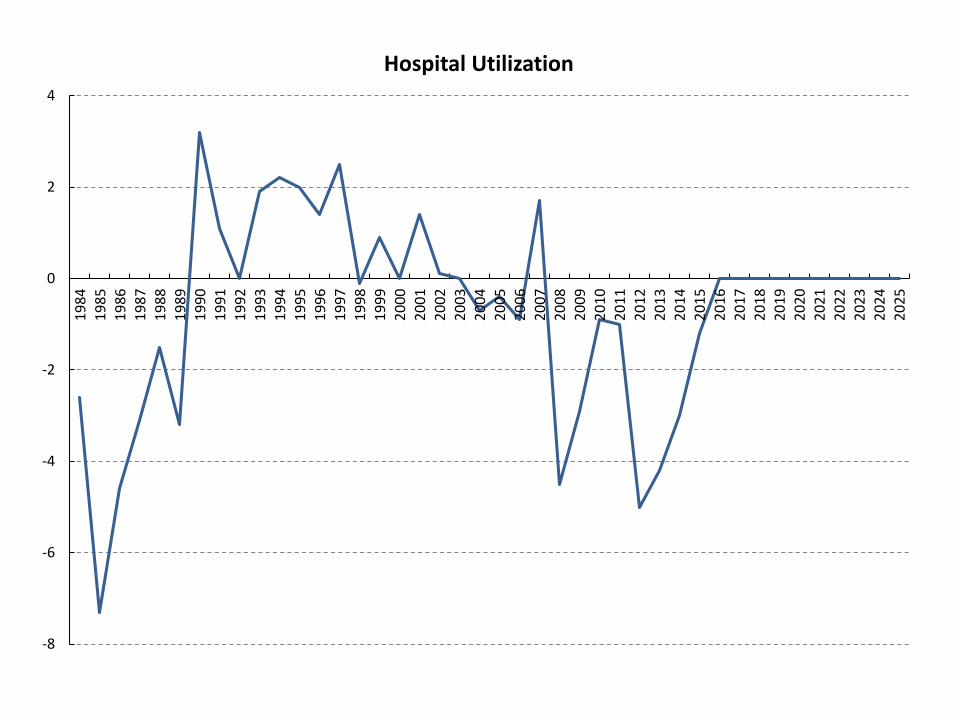
Hospital Utilization
-8
-6
-4
-2
0
2
419
8419
8519
8619
8719
8819
8919
9019
9119
9219
9319
9419
9519
9619
9719
9819
9920
0020
0120
0220
0320
0420
0520
0620
0720
0820
0920
1020
1120
1220
1320
1420
1520
1620
1720
1820
1920
2020
2120
2220
2320
2420
25
Hospital Utilization

SNF Utilization
-8
-6
-4
-2
0
2
4
6
819
99
2000
2001
2002
2003
2004
2005
2006
2007
2008
2009
2010
2011
2012
2013
2014
2015
2016
2017
2018
2019
2020
2021
2022
2023
2024
2025
SNF Utilization

HHA Utilization
-6
-5
-4
-3
-2
-1
0
1
2
3
4
520
01
2002
2003
2004
2005
2006
2007
2008
2009
2010
2011
2012
2013
2014
2015
2016
2017
2018
2019
2020
2021
2022
2023
2024
2025
HHA Utilization

Episode/Visit
-6
-4
-2
0
2
4
620
01
2002
2003
2004
2005
2006
2007
2008
2009
2010
2011
2012
2013
2014
2015
2016
2017
2018
2019
2020
2021
2022
2023
2024
2025
Episode/Visit

HHA Episode Utilization
-6
-4
-2
0
2
4
620
01
2002
2003
2004
2005
2006
2007
2008
2009
2010
2011
2012
2013
2014
2015
2016
2017
2018
2019
2020
2021
2022
2023
2024
2025
HHA Episode Utilization

2011 Technical Panel
• The Panel recommends that the Trustees and OACT continue to monitor the home health percentage shares of Part A and Part B expenditures and adjust assumed future shares as necessary as CMS expands its program-integrity efforts and as the cap on outlier payments affects expenditures.

HHA Part A %
0
10
20
30
40
50
6020
01
2002
2003
2004
2005
2006
2007
2008
2009
2010
2011
2012
2013
2014
2015
2016
2017
2018
2019
2020
2021
2022
2023
2024
2025
HHA Part A %

Hospice Residual
-10
0
10
20
30
40
50
60
7019
9219
9319
9419
9519
9619
9719
9819
9920
0020
0120
0220
0320
0420
0520
0620
0720
0820
0920
1020
1120
1220
1320
1420
1520
1620
1720
1820
1920
2020
2120
2220
2320
2420
25
Hospice Residual