fte enrollment projections by · pdf file401 fte enrollment projections by grade wicomico...
TRANSCRIPT
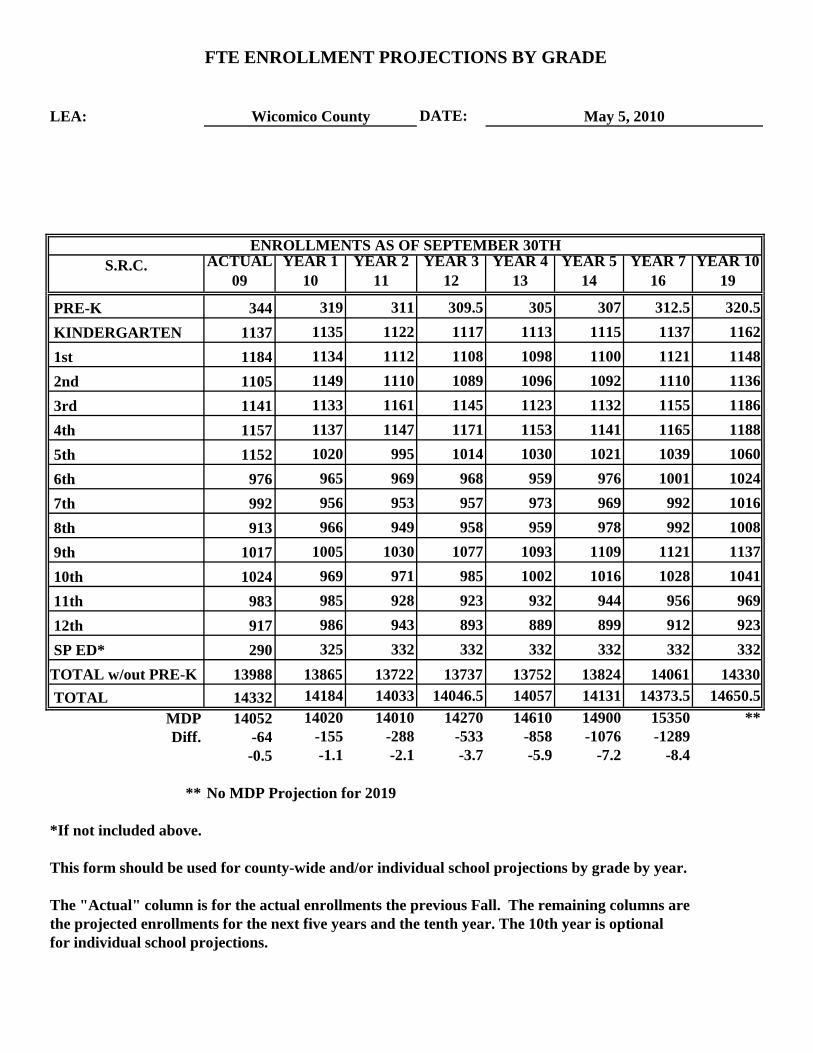
LEA: DATE:
S.R.C. ACTUAL 09
YEAR 1 10
YEAR 2 11
YEAR 3 12
YEAR 4 13
YEAR 5 14
YEAR 7 16
YEAR 10 19
PRE-K 344 319 311 309.5 305 307 312.5 320.5 KINDERGARTEN 1137 1135 1122 1117 1113 1115 1137 1162 1st 1184 1134 1112 1108 1098 1100 1121 1148 2nd 1105 1149 1110 1089 1096 1092 1110 1136 3rd 1141 1133 1161 1145 1123 1132 1155 1186 4th 1157 1137 1147 1171 1153 1141 1165 1188 5th 1152 1020 995 1014 1030 1021 1039 1060 6th 976 965 969 968 959 976 1001 1024 7th 992 956 953 957 973 969 992 1016 8th 913 966 949 958 959 978 992 1008 9th 1017 1005 1030 1077 1093 1109 1121 1137 10th 1024 969 971 985 1002 1016 1028 1041 11th 983 985 928 923 932 944 956 969 12th 917 986 943 893 889 899 912 923 SP ED* 290 325 332 332 332 332 332 332TOTAL w/out PRE-K 13988 13865 13722 13737 13752 13824 14061 14330 TOTAL 14332 14184 14033 14046.5 14057 14131 14373.5 14650.5
MDP 14052 14020 14010 14270 14610 14900 15350 **Diff. -64 -155 -288 -533 -858 -1076 -1289
-0.5 -1.1 -2.1 -3.7 -5.9 -7.2 -8.4
** No MDP Projection for 2019
for individual school projections.
ENROLLMENTS AS OF SEPTEMBER 30TH
*If not included above.
This form should be used for county-wide and/or individual school projections by grade by year.
The "Actual" column is for the actual enrollments the previous Fall. The remaining columns arethe projected enrollments for the next five years and the tenth year. The 10th year is optional
FTE ENROLLMENT PROJECTIONS BY GRADE
Wicomico County May 5, 2010
LEA: DATE:
SCHOOL:
S.R.C. 563 ACTUAL09
YEAR 1 10
YEAR 2 11
YEAR 3 12
YEAR 4 13
YEAR 5 14
YEAR 7 16
YEAR 10 19
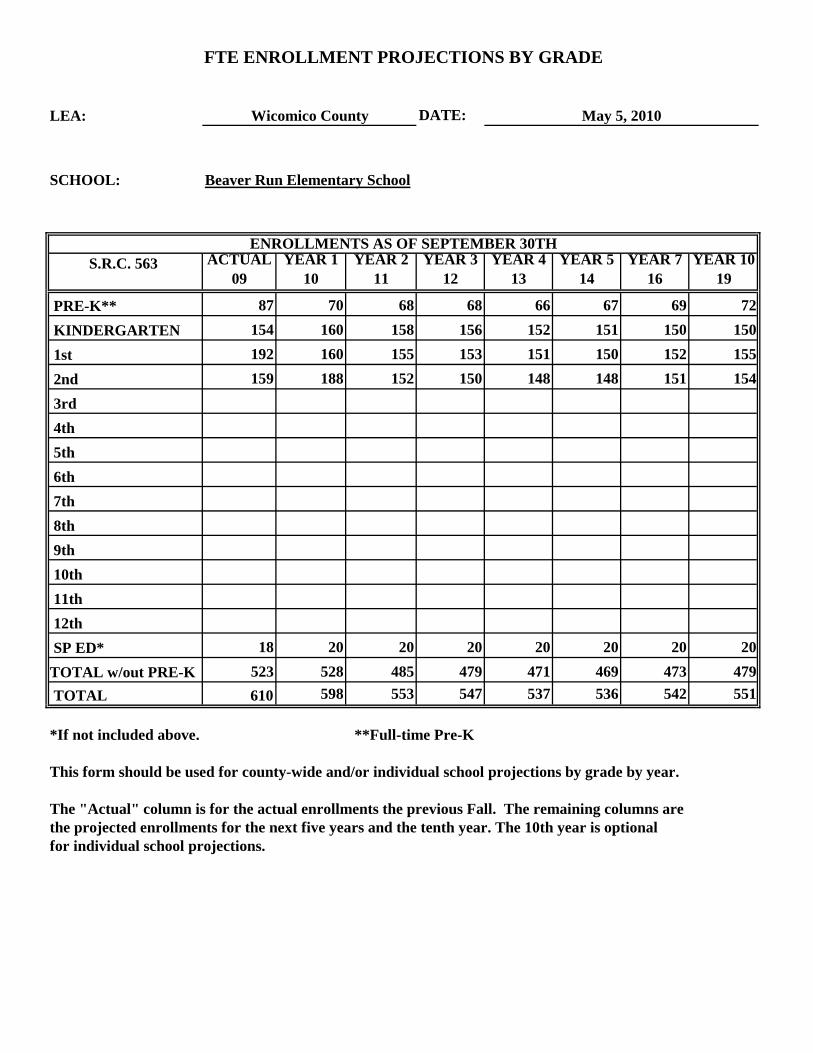
PRE-K** 87 70 68 68 66 67 69 72 KINDERGARTEN 154 160 158 156 152 151 150 150 1st 192 160 155 153 151 150 152 155 2nd 159 188 152 150 148 148 151 154 3rd 4th 5th 6th 7th 8th 9th 10th 11th 12th SP ED* 18 20 20 20 20 20 20 20TOTAL w/out PRE-K 523 528 485 479 471 469 473 479 TOTAL 610 598 553 547 537 536 542 551
for individual school projections.
*If not included above.
ENROLLMENTS AS OF SEPTEMBER 30TH
This form should be used for county-wide and/or individual school projections by grade by year.
The "Actual" column is for the actual enrollments the previous Fall. The remaining columns are
**Full-time Pre-K
the projected enrollments for the next five years and the tenth year. The 10th year is optional
FTE ENROLLMENT PROJECTIONS BY GRADE
Wicomico County May 5, 2010
Beaver Run Elementary School
LEA: DATE:
SCHOOL:
S.R.C. 409 ACTUAL 09
YEAR 1 10
YEAR 2 11
YEAR 3 12
YEAR 4 13
YEAR 5 14
YEAR 7 16
YEAR 10 19
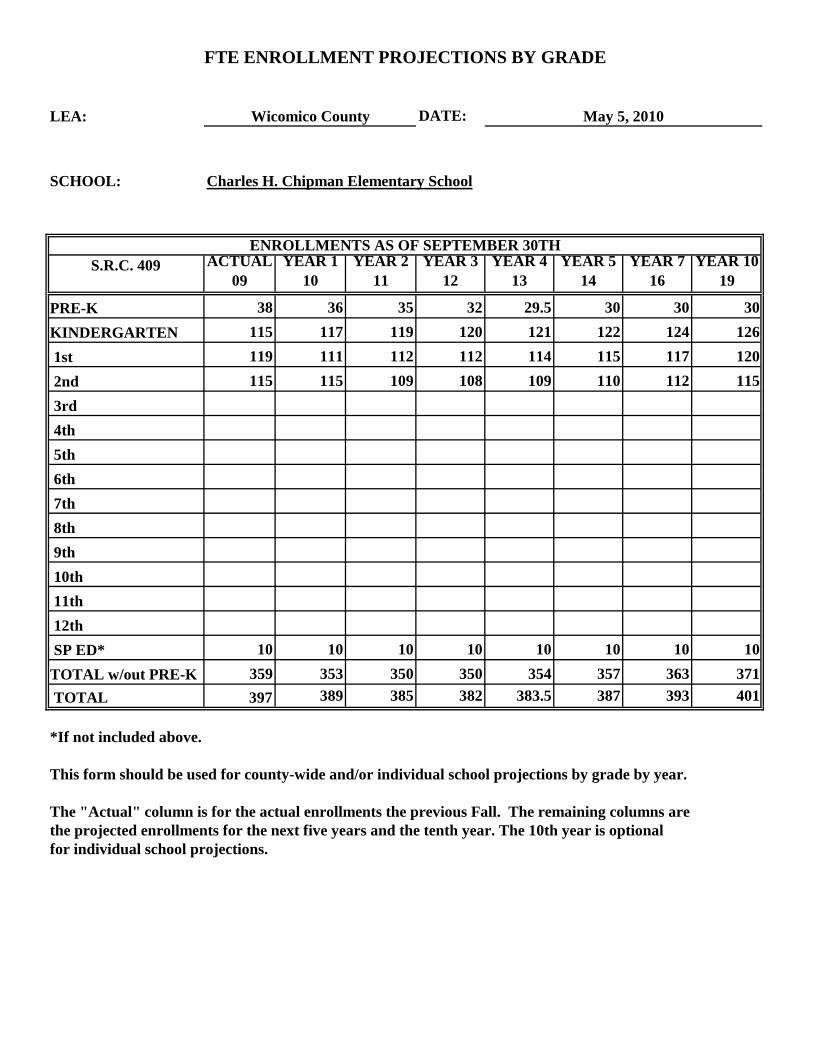
PRE-K 38 36 35 32 29.5 30 30 30KINDERGARTEN 115 117 119 120 121 122 124 126 1st 119 111 112 112 114 115 117 120 2nd 115 115 109 108 109 110 112 115 3rd 4th 5th 6th 7th 8th 9th 10th 11th 12th SP ED* 10 10 10 10 10 10 10 10TOTAL w/out PRE-K 359 353 350 350 354 357 363 371 TOTAL 397 389 385 382 383.5 387 393 401
FTE ENROLLMENT PROJECTIONS BY GRADE
Wicomico County May 5, 2010
Charles H. Chipman Elementary School
for individual school projections.
This form should be used for county-wide and/or individual school projections by grade by year.
The "Actual" column is for the actual enrollments the previous Fall. The remaining columns are
ENROLLMENTS AS OF SEPTEMBER 30TH
*If not included above.
the projected enrollments for the next five years and the tenth year. The 10th year is optional
LEA: DATE:
SCHOOL:
S.R.C. 726 ACTUAL 09
YEAR 1 *10
YEAR 2 11
YEAR 3 12
YEAR 4 13
YEAR 5 14
YEAR 7 16
YEAR 10 19
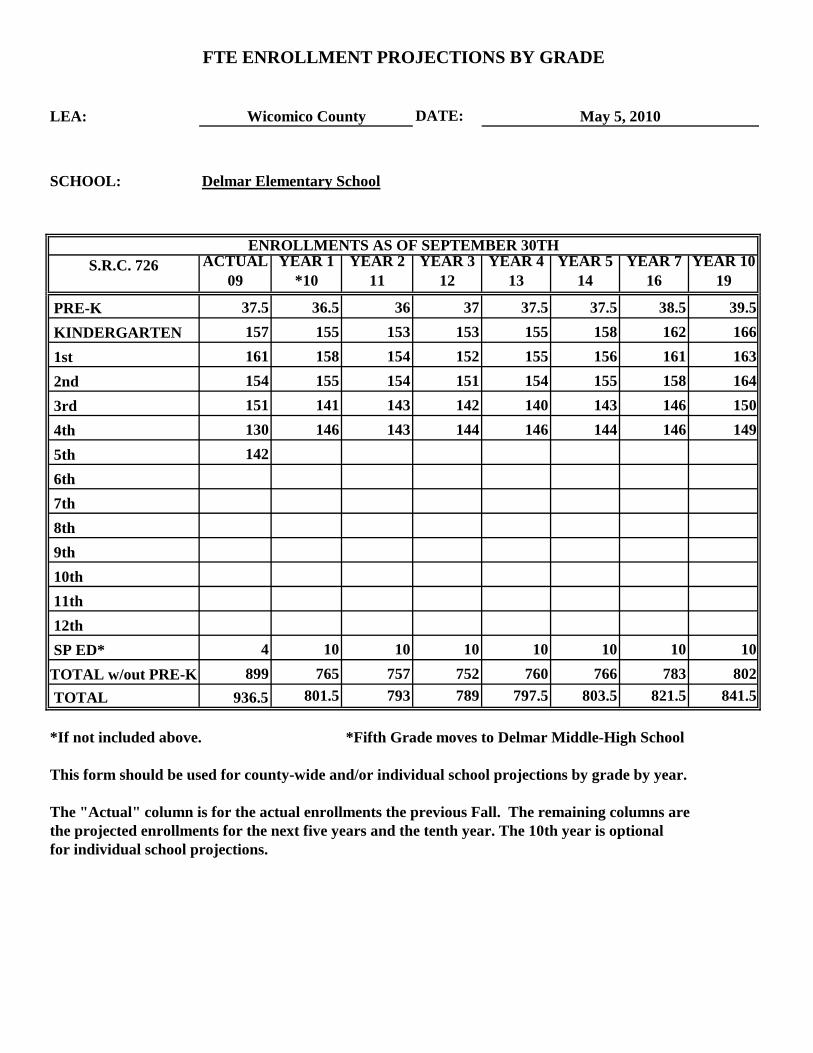
PRE-K 37.5 36.5 36 37 37.5 37.5 38.5 39.5 KINDERGARTEN 157 155 153 153 155 158 162 166 1st 161 158 154 152 155 156 161 163 2nd 154 155 154 151 154 155 158 164 3rd 151 141 143 142 140 143 146 150 4th 130 146 143 144 146 144 146 149 5th 142 6th 7th 8th 9th 10th 11th 12th SP ED* 4 10 10 10 10 10 10 10TOTAL w/out PRE-K 899 765 757 752 760 766 783 802 TOTAL 936.5 801.5 793 789 797.5 803.5 821.5 841.5
the projected enrollments for the next five years and the tenth year. The 10th year is optional for individual school projections.
ENROLLMENTS AS OF SEPTEMBER 30TH
*If not included above.
This form should be used for county-wide and/or individual school projections by grade by year.
*Fifth Grade moves to Delmar Middle-High School
The "Actual" column is for the actual enrollments the previous Fall. The remaining columns are
FTE ENROLLMENT PROJECTIONS BY GRADE
Wicomico County May 5, 2010
Delmar Elementary School
LEA: DATE:
SCHOOL:
S.R.C. 483 ACTUAL 09
YEAR 1 10
YEAR 2 11
YEAR 3 12
YEAR 4 13
YEAR 5 14
YEAR 7 16
YEAR 10 19
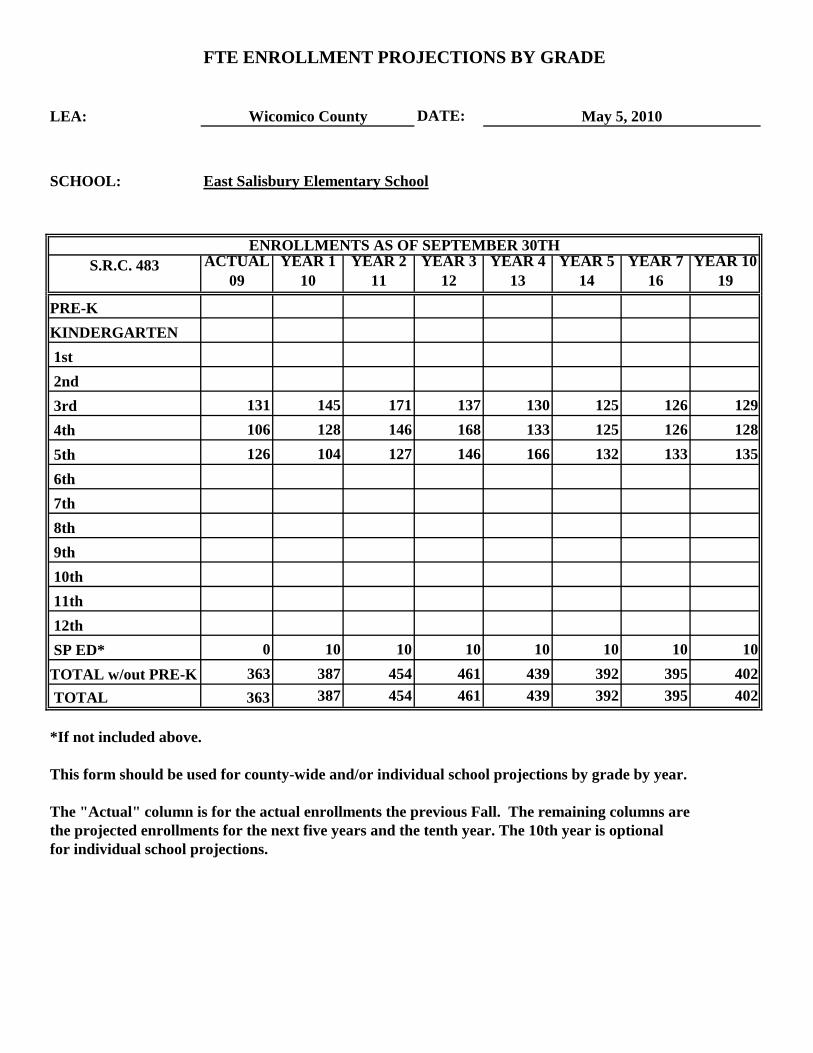
PRE-KKINDERGARTEN 1st 2nd 3rd 131 145 171 137 130 125 126 129 4th 106 128 146 168 133 125 126 128 5th 126 104 127 146 166 132 133 135 6th 7th 8th 9th 10th 11th 12th SP ED* 0 10 10 10 10 10 10 10TOTAL w/out PRE-K 363 387 454 461 439 392 395 402 TOTAL 363 387 454 461 439 392 395 402
the projected enrollments for the next five years and the tenth year. The 10th year is optional for individual school projections.
ENROLLMENTS AS OF SEPTEMBER 30TH
*If not included above.
This form should be used for county-wide and/or individual school projections by grade by year.
The "Actual" column is for the actual enrollments the previous Fall. The remaining columns are
FTE ENROLLMENT PROJECTIONS BY GRADE
Wicomico County May 5, 2010
East Salisbury Elementary School
LEA: DATE:
SCHOOL:
S.R.C. 368 ACTUAL 09
YEAR 1 10
YEAR 2 11
YEAR 3 12
YEAR 4 13
YEAR 5 14
YEAR 7 16
YEAR 10 19
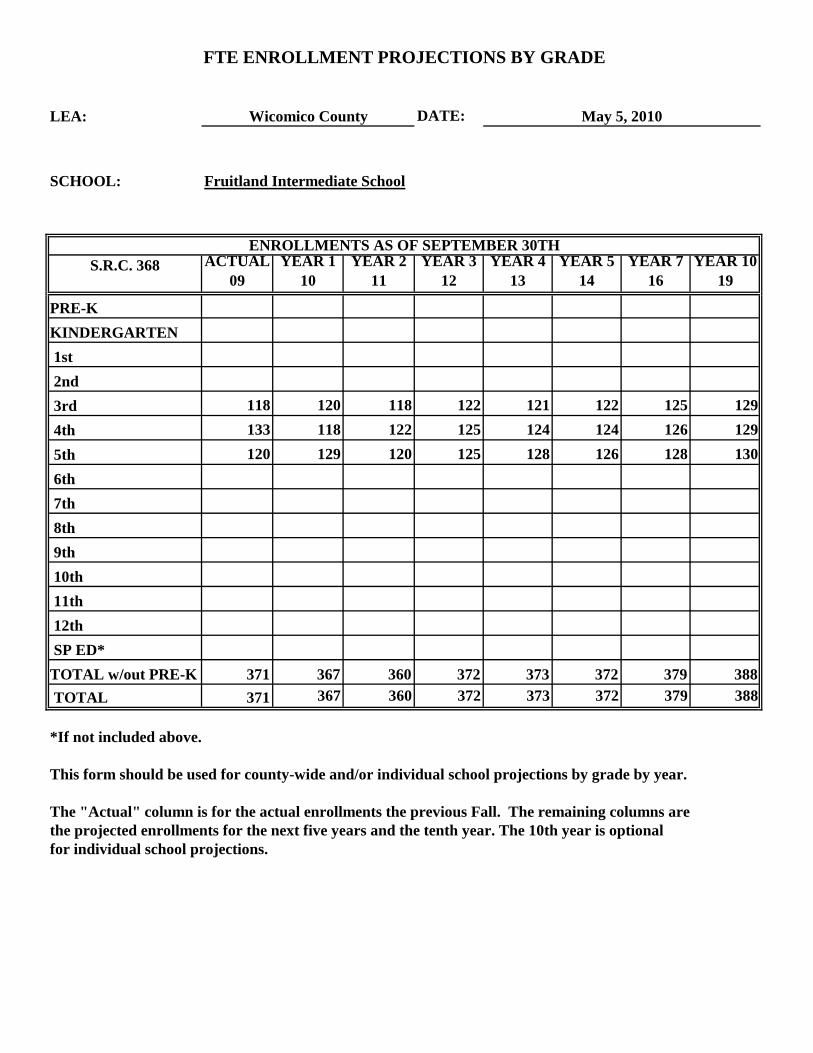
PRE-KKINDERGARTEN 1st 2nd 3rd 118 120 118 122 121 122 125 129 4th 133 118 122 125 124 124 126 129 5th 120 129 120 125 128 126 128 130 6th 7th 8th 9th 10th 11th 12th SP ED*TOTAL w/out PRE-K 371 367 360 372 373 372 379 388 TOTAL 371 367 360 372 373 372 379 388
the projected enrollments for the next five years and the tenth year. The 10th year is optional for individual school projections.
ENROLLMENTS AS OF SEPTEMBER 30TH
*If not included above.
This form should be used for county-wide and/or individual school projections by grade by year.
The "Actual" column is for the actual enrollments the previous Fall. The remaining columns are
FTE ENROLLMENT PROJECTIONS BY GRADE
Wicomico County May 5, 2010
Fruitland Intermediate School
LEA: DATE:
SCHOOL:
S.R.C. 474 ACTUAL 09
YEAR 1 10
YEAR 2 11
YEAR 3 12
YEAR 4 13
YEAR 5 14
YEAR 7 16
YEAR 10 19
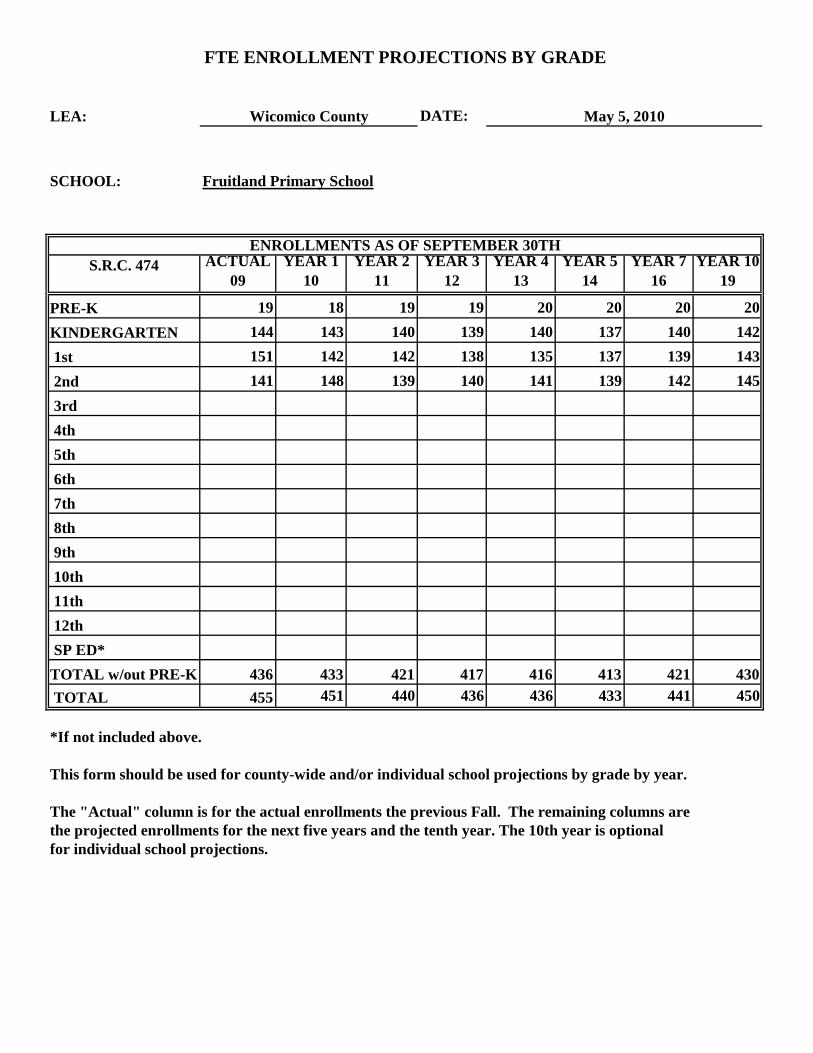
PRE-K 19 18 19 19 20 20 20 20KINDERGARTEN 144 143 140 139 140 137 140 142 1st 151 142 142 138 135 137 139 143 2nd 141 148 139 140 141 139 142 145 3rd 4th 5th 6th 7th 8th 9th 10th 11th 12th SP ED*TOTAL w/out PRE-K 436 433 421 417 416 413 421 430 TOTAL 455 451 440 436 436 433 441 450
the projected enrollments for the next five years and the tenth year. The 10th year is optional for individual school projections.
ENROLLMENTS AS OF SEPTEMBER 30TH
*If not included above.
This form should be used for county-wide and/or individual school projections by grade by year.
The "Actual" column is for the actual enrollments the previous Fall. The remaining columns are
FTE ENROLLMENT PROJECTIONS BY GRADE
Wicomico County May 5, 2010
Fruitland Primary School
LEA: DATE:
SCHOOL:
S.R.C. 345 ACTUAL 09
YEAR 1 10
YEAR 2 11
YEAR 3 12
YEAR 4 13
YEAR 5 14
YEAR 7 16
YEAR 10 19
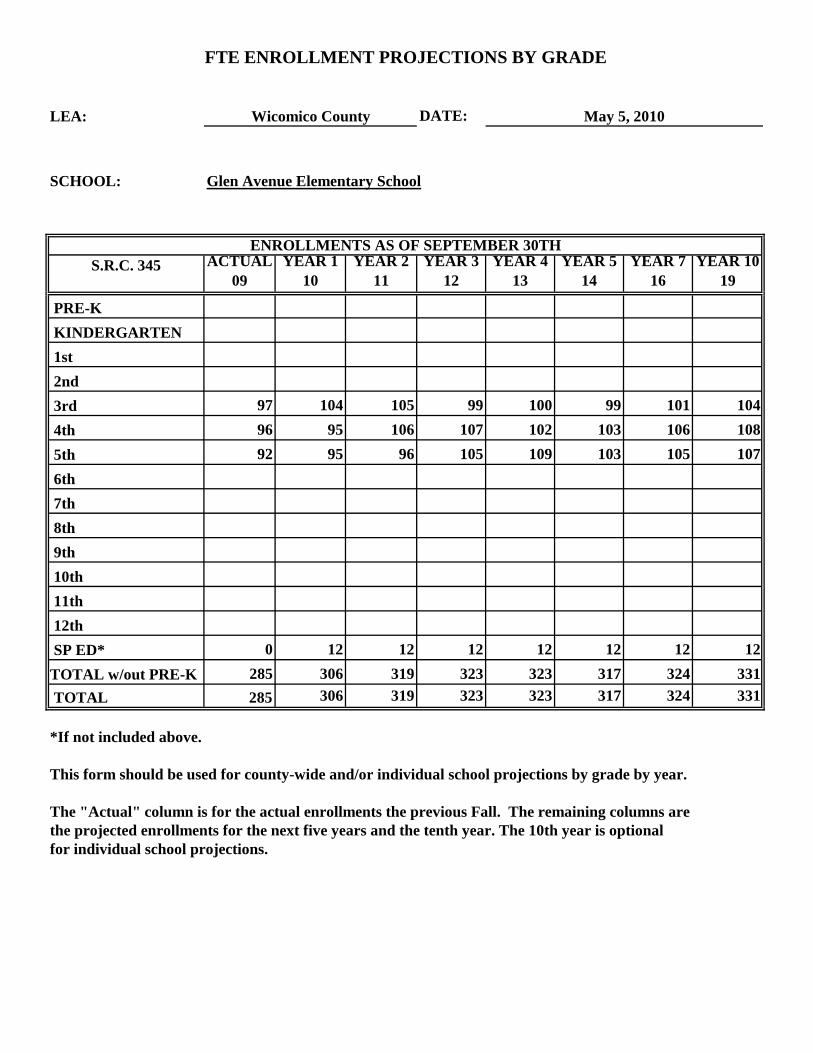
PRE-K KINDERGARTEN 1st 2nd 3rd 97 104 105 99 100 99 101 104 4th 96 95 106 107 102 103 106 108 5th 92 95 96 105 109 103 105 107 6th 7th 8th 9th 10th 11th 12th SP ED* 0 12 12 12 12 12 12 12TOTAL w/out PRE-K 285 306 319 323 323 317 324 331 TOTAL 285 306 319 323 323 317 324 331
the projected enrollments for the next five years and the tenth year. The 10th year is optional for individual school projections.
ENROLLMENTS AS OF SEPTEMBER 30TH
*If not included above.
This form should be used for county-wide and/or individual school projections by grade by year.
The "Actual" column is for the actual enrollments the previous Fall. The remaining columns are
FTE ENROLLMENT PROJECTIONS BY GRADE
Wicomico County May 5, 2010
Glen Avenue Elementary School
LEA: DATE:
SCHOOL:
S.R.C. 529 ACTUAL 09
YEAR 1 10
YEAR 2 11
YEAR 3 12
YEAR 4 13
YEAR 5 14
YEAR 7 16
YEAR 10 19
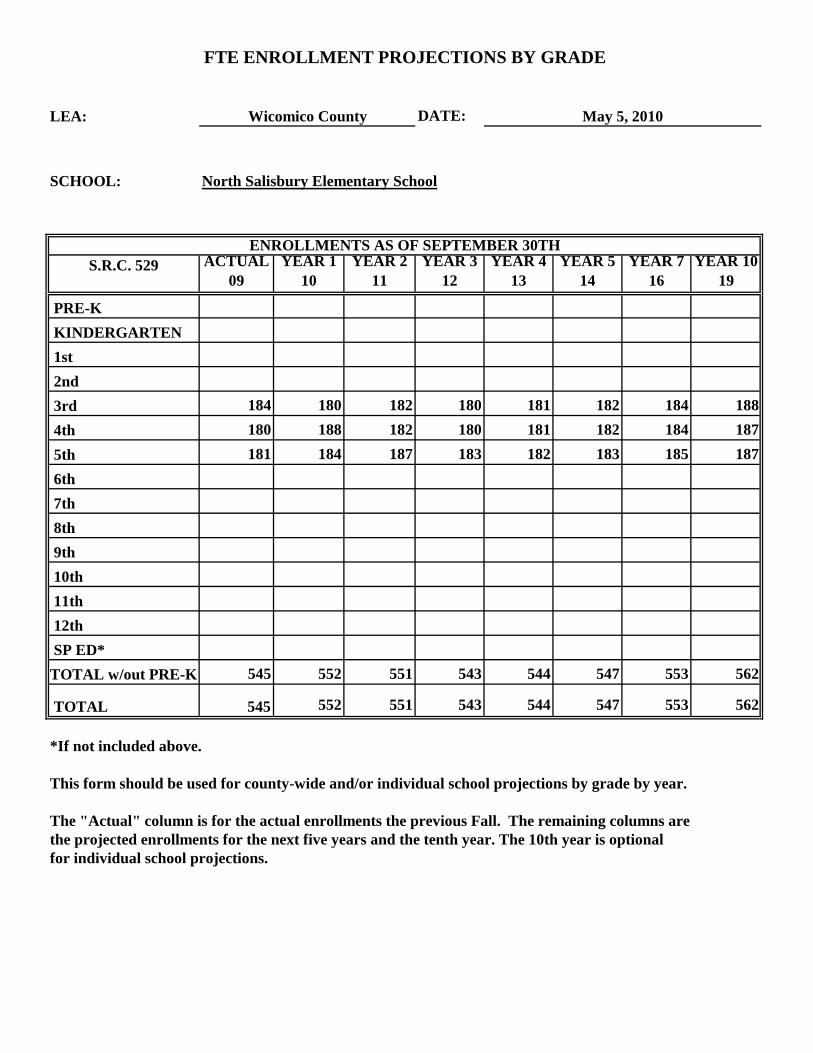
PRE-K KINDERGARTEN 1st 2nd 3rd 184 180 182 180 181 182 184 188 4th 180 188 182 180 181 182 184 187 5th 181 184 187 183 182 183 185 187 6th 7th 8th 9th 10th 11th 12th SP ED*TOTAL w/out PRE-K 545 552 551 543 544 547 553 562
TOTAL 545 552 551 543 544 547 553 562
FTE ENROLLMENT PROJECTIONS BY GRADE
Wicomico County May 5, 2010
North Salisbury Elementary School
The "Actual" column is for the actual enrollments the previous Fall. The remaining columns arethe projected enrollments for the next five years and the tenth year. The 10th year is optional for individual school projections.
ENROLLMENTS AS OF SEPTEMBER 30TH
*If not included above.
This form should be used for county-wide and/or individual school projections by grade by year.
LEA: DATE:
SCHOOL:
S.R.C. 274 ACTUAL 09
YEAR 1 10
YEAR 2 11
YEAR 3 12
YEAR 4 13
YEAR 5 14
YEAR 7 16
YEAR 10 19
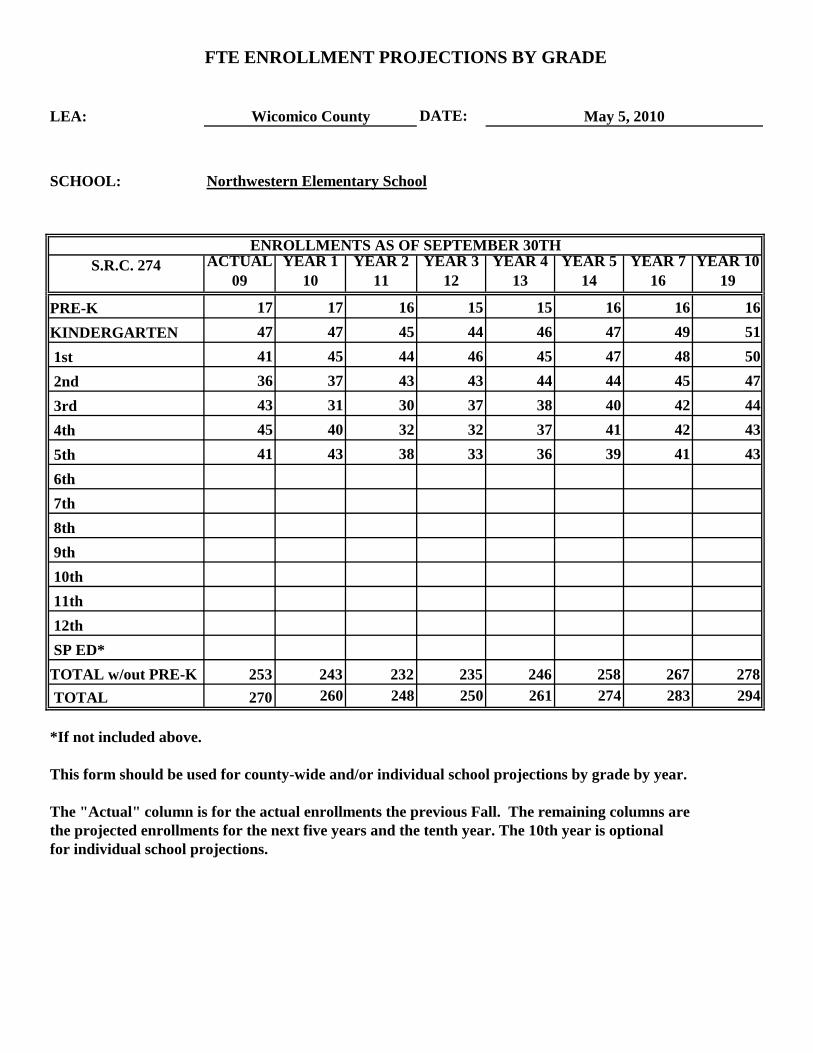
PRE-K 17 17 16 15 15 16 16 16KINDERGARTEN 47 47 45 44 46 47 49 51 1st 41 45 44 46 45 47 48 50 2nd 36 37 43 43 44 44 45 47 3rd 43 31 30 37 38 40 42 44 4th 45 40 32 32 37 41 42 43 5th 41 43 38 33 36 39 41 43 6th 7th 8th 9th 10th 11th 12th SP ED*TOTAL w/out PRE-K 253 243 232 235 246 258 267 278 TOTAL 270 260 248 250 261 274 283 294
FTE ENROLLMENT PROJECTIONS BY GRADE
Wicomico County May 5, 2010
Northwestern Elementary School
The "Actual" column is for the actual enrollments the previous Fall. The remaining columns arethe projected enrollments for the next five years and the tenth year. The 10th year is optional for individual school projections.
ENROLLMENTS AS OF SEPTEMBER 30TH
*If not included above.
This form should be used for county-wide and/or individual school projections by grade by year.
LEA: DATE:
SCHOOL:
S.R.C. 617 ACTUAL 09
YEAR 1 10
YEAR 2 11
YEAR 3 12
YEAR 4 13
YEAR 5 14
YEAR 7 16
YEAR 10 19
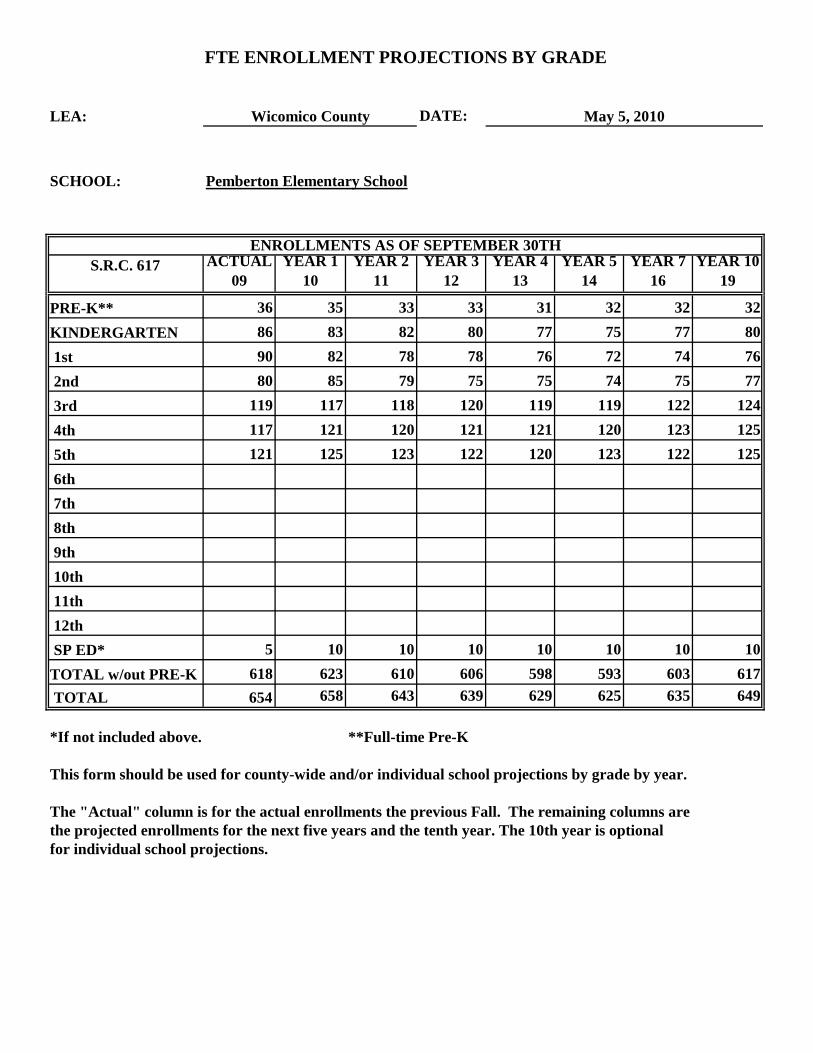
PRE-K** 36 35 33 33 31 32 32 32KINDERGARTEN 86 83 82 80 77 75 77 80 1st 90 82 78 78 76 72 74 76 2nd 80 85 79 75 75 74 75 77 3rd 119 117 118 120 119 119 122 124 4th 117 121 120 121 121 120 123 125 5th 121 125 123 122 120 123 122 125 6th 7th 8th 9th 10th 11th 12th SP ED* 5 10 10 10 10 10 10 10TOTAL w/out PRE-K 618 623 610 606 598 593 603 617 TOTAL 654 658 643 639 629 625 635 649
FTE ENROLLMENT PROJECTIONS BY GRADE
Wicomico County May 5, 2010
Pemberton Elementary School
ENROLLMENTS AS OF SEPTEMBER 30TH
*If not included above. **Full-time Pre-K
for individual school projections.
This form should be used for county-wide and/or individual school projections by grade by year.
The "Actual" column is for the actual enrollments the previous Fall. The remaining columns arethe projected enrollments for the next five years and the tenth year. The 10th year is optional
LEA: DATE:
SCHOOL:
S.R.C. 465 ACTUAL 09
YEAR 1 10
YEAR 2 11
YEAR 3 12
YEAR 4 13
YEAR 5 14
YEAR 7 16
YEAR 10 19
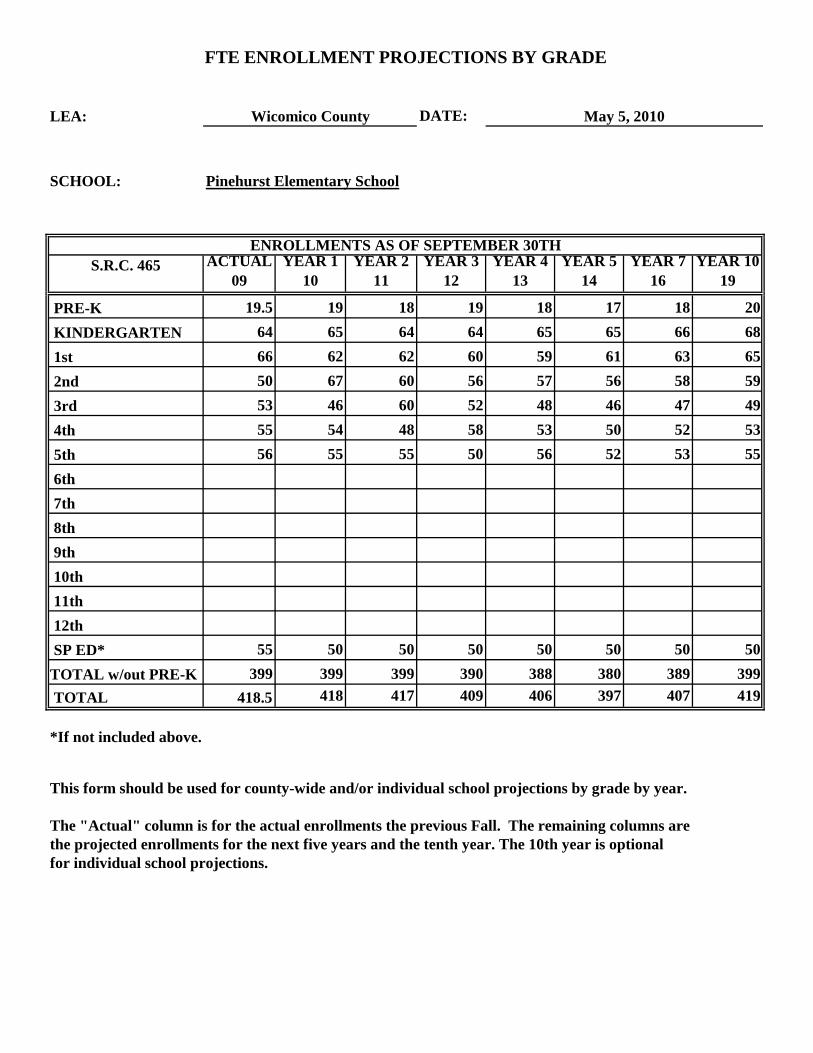
PRE-K 19.5 19 18 19 18 17 18 20 KINDERGARTEN 64 65 64 64 65 65 66 68 1st 66 62 62 60 59 61 63 65 2nd 50 67 60 56 57 56 58 59 3rd 53 46 60 52 48 46 47 49 4th 55 54 48 58 53 50 52 53 5th 56 55 55 50 56 52 53 55 6th 7th 8th 9th 10th 11th 12th SP ED* 55 50 50 50 50 50 50 50TOTAL w/out PRE-K 399 399 399 390 388 380 389 399 TOTAL 418.5 418 417 409 406 397 407 419
FTE ENROLLMENT PROJECTIONS BY GRADE
Wicomico County May 5, 2010
Pinehurst Elementary School
The "Actual" column is for the actual enrollments the previous Fall. The remaining columns arethe projected enrollments for the next five years and the tenth year. The 10th year is optional for individual school projections.
ENROLLMENTS AS OF SEPTEMBER 30TH
*If not included above.
This form should be used for county-wide and/or individual school projections by grade by year.
LEA: DATE:
SCHOOL:
S.R.C. 207 ACTUAL 09
YEAR 1 10
YEAR 2 11
YEAR 3 12
YEAR 4 13
YEAR 5 14
YEAR 7 16
YEAR 10 19
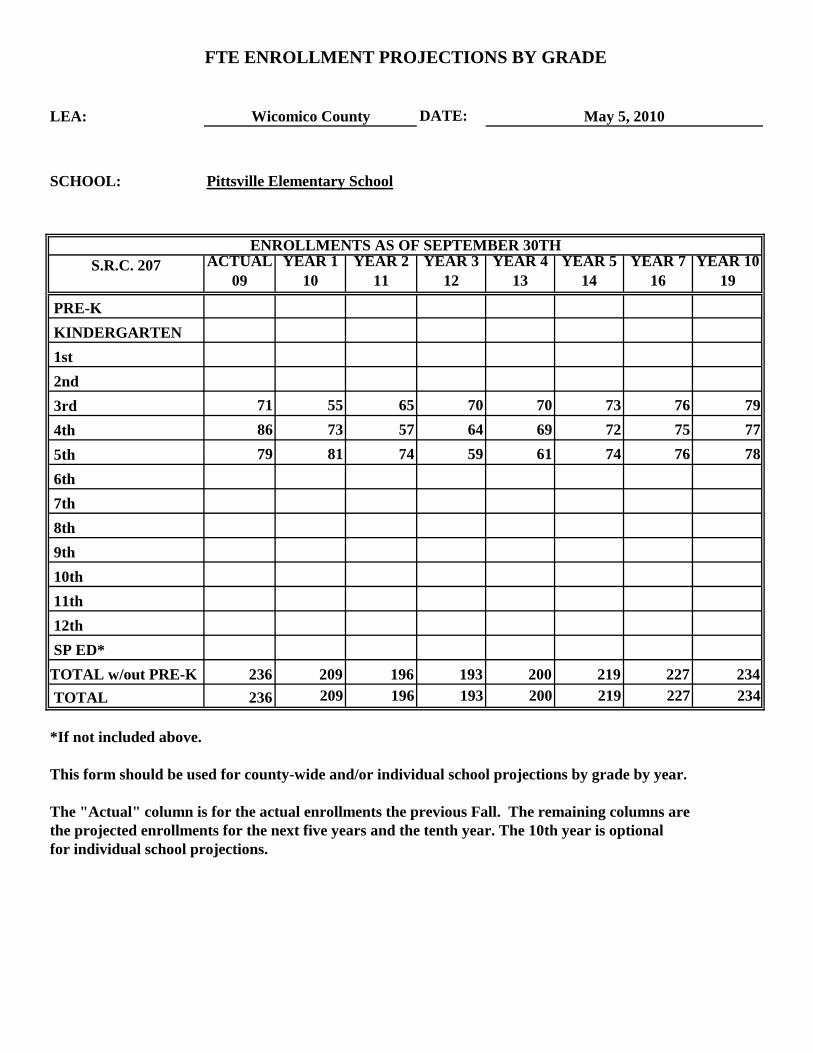
PRE-K KINDERGARTEN 1st 2nd 3rd 71 55 65 70 70 73 76 79 4th 86 73 57 64 69 72 75 77 5th 79 81 74 59 61 74 76 78 6th 7th 8th 9th 10th 11th 12th SP ED*TOTAL w/out PRE-K 236 209 196 193 200 219 227 234 TOTAL 236 209 196 193 200 219 227 234
FTE ENROLLMENT PROJECTIONS BY GRADE
Wicomico County May 5, 2010
Pittsville Elementary School
The "Actual" column is for the actual enrollments the previous Fall. The remaining columns arethe projected enrollments for the next five years and the tenth year. The 10th year is optional for individual school projections.
ENROLLMENTS AS OF SEPTEMBER 30TH
*If not included above.
This form should be used for county-wide and/or individual school projections by grade by year.
LEA: DATE:
SCHOOL:
S.R.C. 509 ACTUAL 09
YEAR 1 10
YEAR 2 11
YEAR 3 12
YEAR 4 13
YEAR 5 14
YEAR 7 16
YEAR 10 19
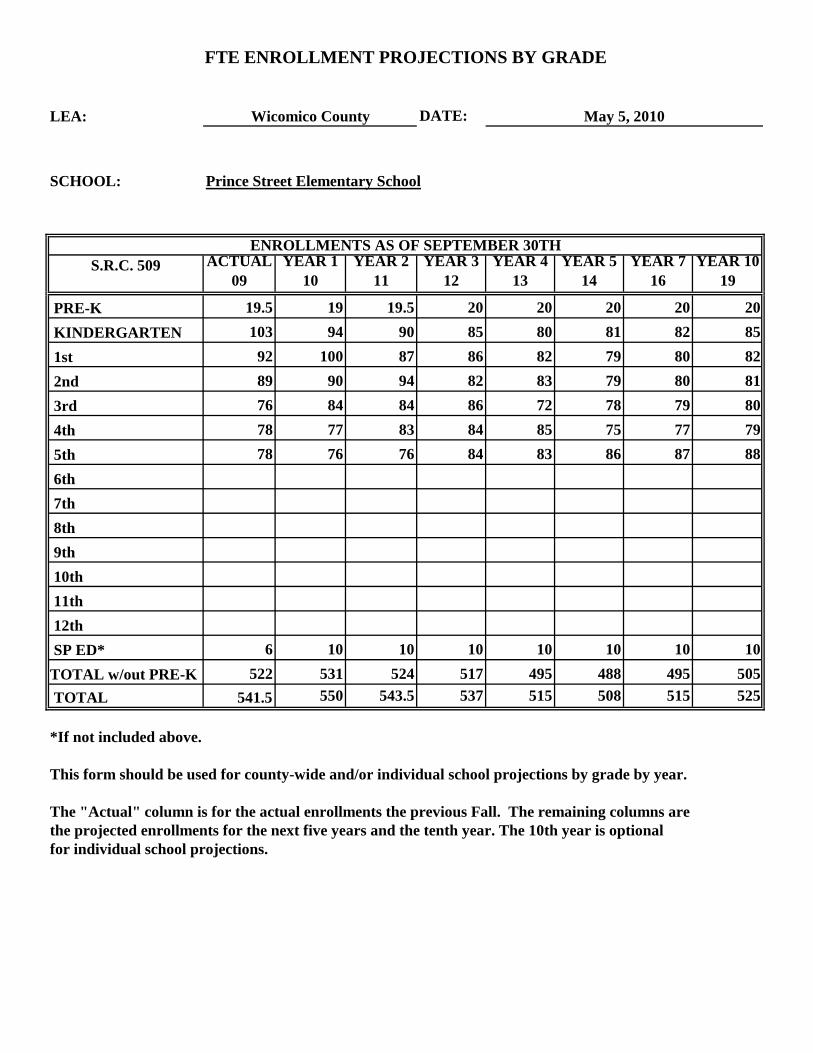
PRE-K 19.5 19 19.5 20 20 20 20 20 KINDERGARTEN 103 94 90 85 80 81 82 85 1st 92 100 87 86 82 79 80 82 2nd 89 90 94 82 83 79 80 81 3rd 76 84 84 86 72 78 79 80 4th 78 77 83 84 85 75 77 79 5th 78 76 76 84 83 86 87 88 6th 7th 8th 9th 10th 11th 12th SP ED* 6 10 10 10 10 10 10 10TOTAL w/out PRE-K 522 531 524 517 495 488 495 505 TOTAL 541.5 550 543.5 537 515 508 515 525
FTE ENROLLMENT PROJECTIONS BY GRADE
Wicomico County May 5, 2010
Prince Street Elementary School
The "Actual" column is for the actual enrollments the previous Fall. The remaining columns arethe projected enrollments for the next five years and the tenth year. The 10th year is optional for individual school projections.
ENROLLMENTS AS OF SEPTEMBER 30TH
*If not included above.
This form should be used for county-wide and/or individual school projections by grade by year.
LEA: DATE:
SCHOOL:
S.R.C. 269 ACTUAL 09
YEAR 1 10
YEAR 2 11
YEAR 3 12
YEAR 4 13
YEAR 5 14
YEAR 7 16
YEAR 10 19
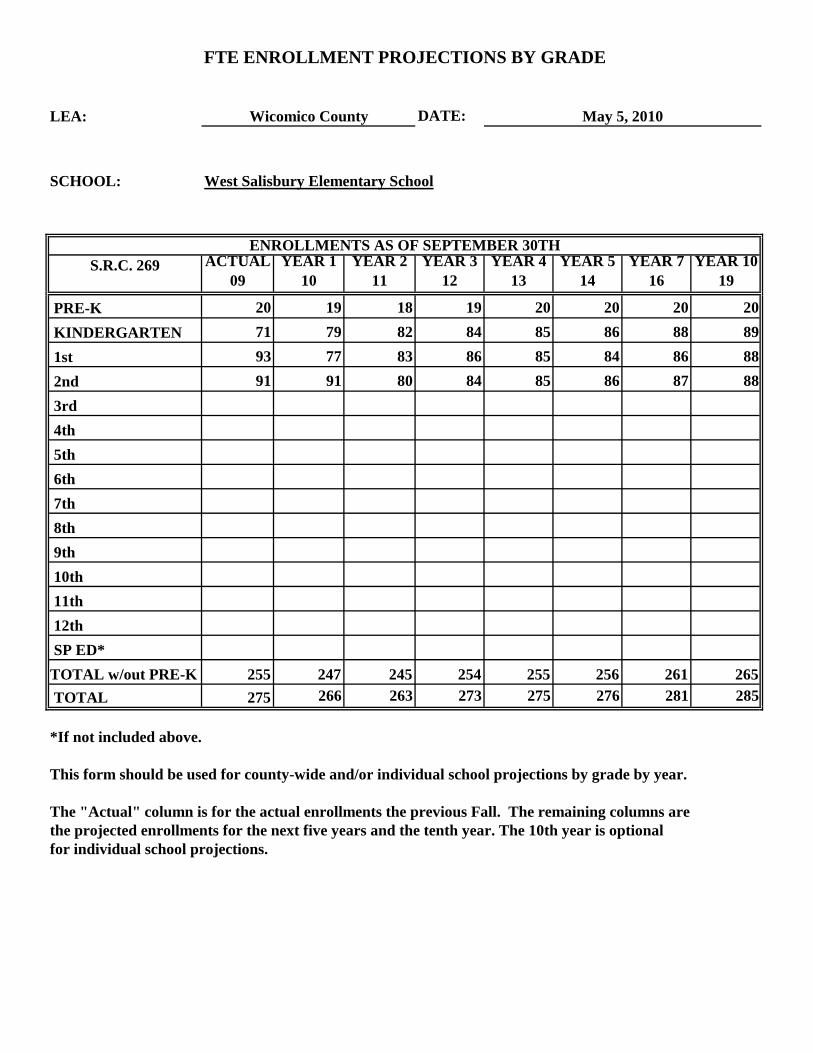
PRE-K 20 19 18 19 20 20 20 20 KINDERGARTEN 71 79 82 84 85 86 88 89 1st 93 77 83 86 85 84 86 88 2nd 91 91 80 84 85 86 87 88 3rd 4th 5th 6th 7th 8th 9th 10th 11th 12th SP ED*TOTAL w/out PRE-K 255 247 245 254 255 256 261 265 TOTAL 275 266 263 273 275 276 281 285
FTE ENROLLMENT PROJECTIONS BY GRADE
Wicomico County May 5, 2010
West Salisbury Elementary School
The "Actual" column is for the actual enrollments the previous Fall. The remaining columns arethe projected enrollments for the next five years and the tenth year. The 10th year is optional for individual school projections.
ENROLLMENTS AS OF SEPTEMBER 30TH
*If not included above.
This form should be used for county-wide and/or individual school projections by grade by year.
LEA: DATE:
SCHOOL:
S.R.C. 460 ACTUAL 09
YEAR 1 10
YEAR 2 11
YEAR 3 12
YEAR 4 13
YEAR 5 14
YEAR 7 16
YEAR 10 19
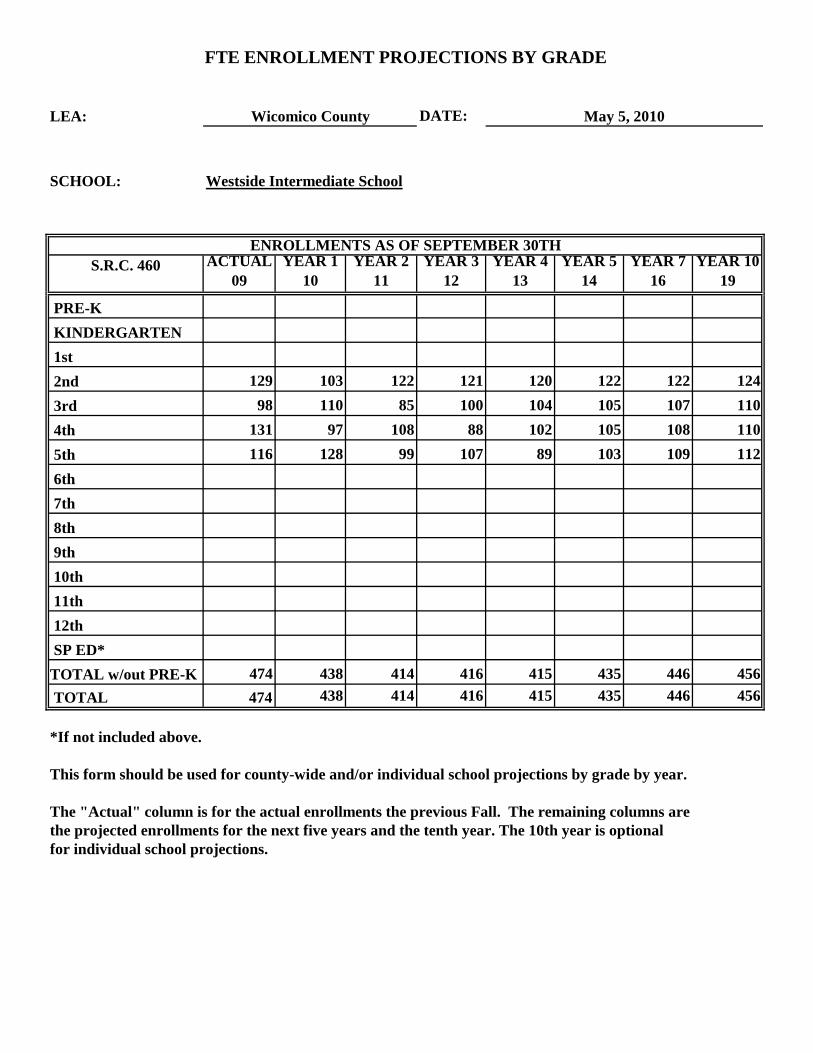
PRE-K KINDERGARTEN 1st 2nd 129 103 122 121 120 122 122 124 3rd 98 110 85 100 104 105 107 110 4th 131 97 108 88 102 105 108 110 5th 116 128 99 107 89 103 109 112 6th 7th 8th 9th 10th 11th 12th SP ED*TOTAL w/out PRE-K 474 438 414 416 415 435 446 456 TOTAL 474 438 414 416 415 435 446 456
FTE ENROLLMENT PROJECTIONS BY GRADE
Wicomico County May 5, 2010
Westside Intermediate School
The "Actual" column is for the actual enrollments the previous Fall. The remaining columns arethe projected enrollments for the next five years and the tenth year. The 10th year is optional for individual school projections.
ENROLLMENTS AS OF SEPTEMBER 30TH
*If not included above.
This form should be used for county-wide and/or individual school projections by grade by year.
LEA: DATE:
SCHOOL:
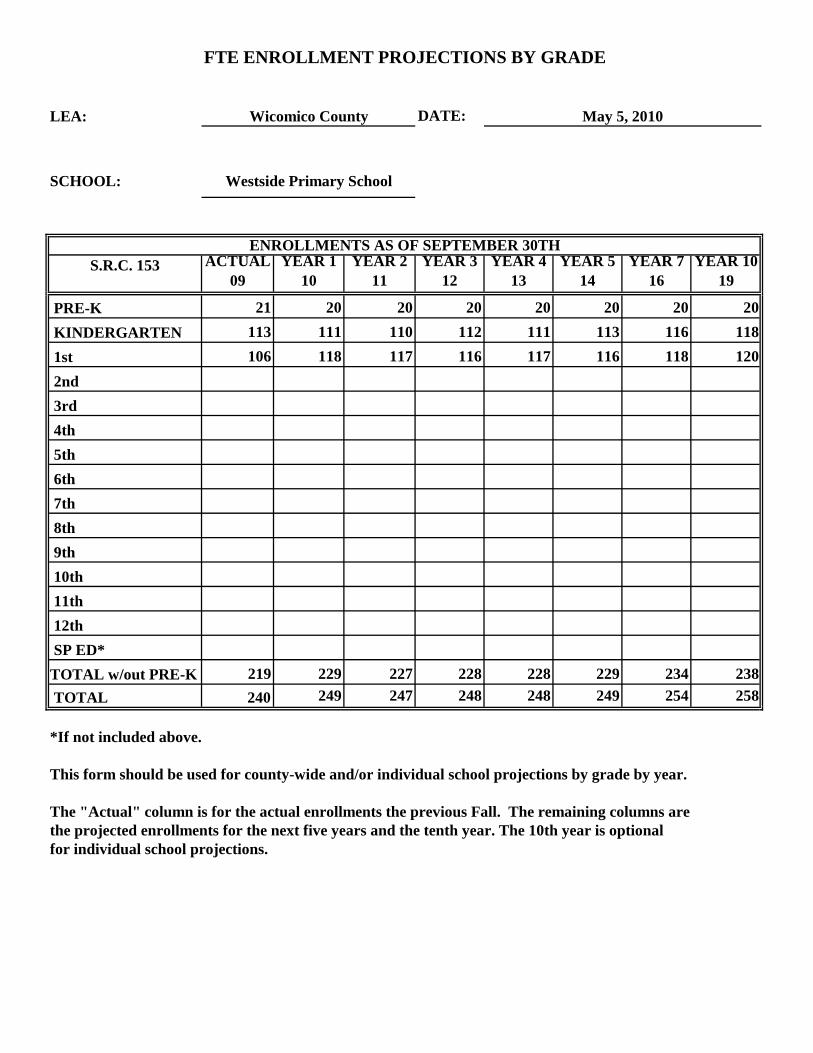
S.R.C. 153 ACTUAL 09
YEAR 1 10
YEAR 2 11
YEAR 3 12
YEAR 4 13
YEAR 5 14
YEAR 7 16
YEAR 10 19
PRE-K 21 20 20 20 20 20 20 20 KINDERGARTEN 113 111 110 112 111 113 116 118 1st 106 118 117 116 117 116 118 120 2nd 3rd 4th 5th 6th 7th 8th 9th 10th 11th 12th SP ED*TOTAL w/out PRE-K 219 229 227 228 228 229 234 238 TOTAL 240 249 247 248 248 249 254 258
FTE ENROLLMENT PROJECTIONS BY GRADE
Wicomico County May 5, 2010
Westside Primary School
The "Actual" column is for the actual enrollments the previous Fall. The remaining columns arethe projected enrollments for the next five years and the tenth year. The 10th year is optional for individual school projections.
ENROLLMENTS AS OF SEPTEMBER 30TH
*If not included above.
This form should be used for county-wide and/or individual school projections by grade by year.
LEA: DATE:
SCHOOL:
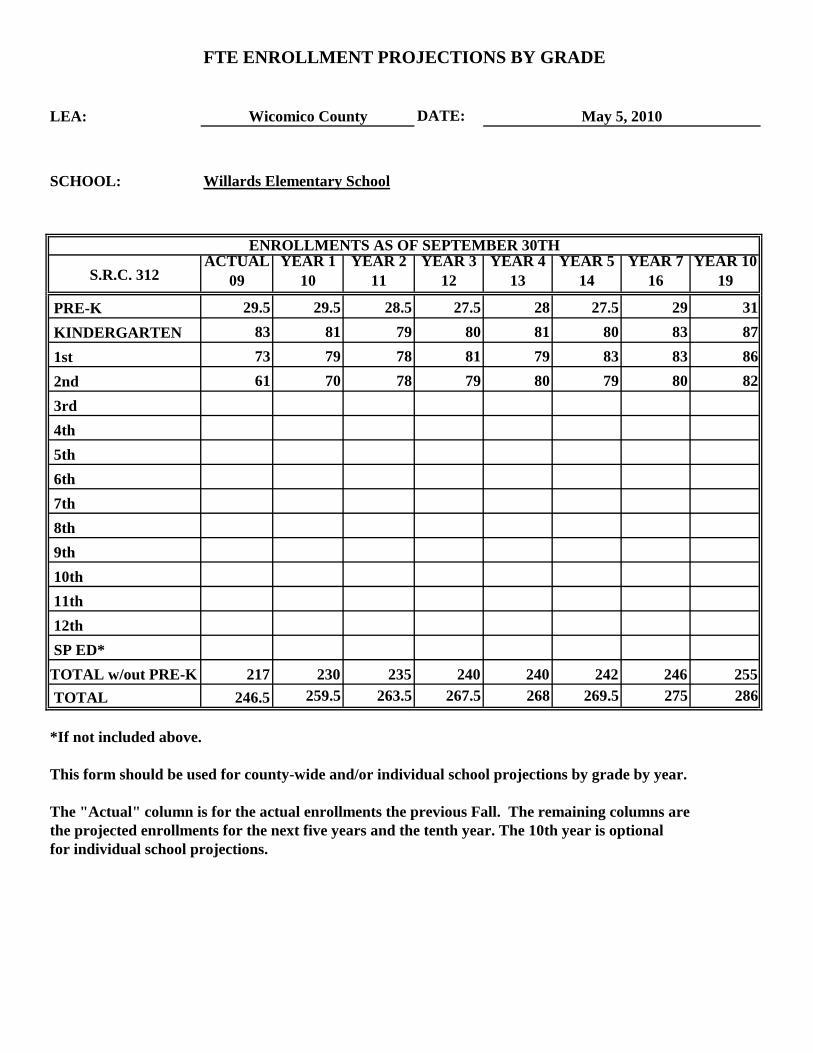
S.R.C. 312ACTUAL
09 YEAR 1
10 YEAR 2
11YEAR 3
12YEAR 4
13YEAR 5
14YEAR 7
16YEAR 10
19
PRE-K 29.5 29.5 28.5 27.5 28 27.5 29 31 KINDERGARTEN 83 81 79 80 81 80 83 87 1st 73 79 78 81 79 83 83 86 2nd 61 70 78 79 80 79 80 82 3rd 4th 5th 6th 7th 8th 9th 10th 11th 12th SP ED*TOTAL w/out PRE-K 217 230 235 240 240 242 246 255 TOTAL 246.5 259.5 263.5 267.5 268 269.5 275 286
FTE ENROLLMENT PROJECTIONS BY GRADE
Wicomico County May 5, 2010
Willards Elementary School
The "Actual" column is for the actual enrollments the previous Fall. The remaining columns arethe projected enrollments for the next five years and the tenth year. The 10th year is optional for individual school projections.
ENROLLMENTS AS OF SEPTEMBER 30TH
*If not included above.
This form should be used for county-wide and/or individual school projections by grade by year.

LEA: DATE:
SCHOOL:
S.R.C. 935 ACTUAL 09
YEAR 1 10
YEAR 2 11
YEAR 3 12
YEAR 4 13
YEAR 5 14
YEAR 7 16
YEAR 10 19
PRE-K KINDERGARTEN 1st 2nd 3rd 4th 5th 6th 305 290 287 289 291 295 300 308 7th 307 294 285 285 290 296 302 307 8th 256 293 288 287 288 295 309 312 9th 10th 11th 12th SP ED* 18 20 20 20 20 20 20 20TOTAL w/out PRE-K 886 897 880 881 889 906 931 947 TOTAL 886 897 880 881 889 906 931 947
the projected enrollments for the next five years and the tenth year. The 10th year is optional for individual school projections.
ENROLLMENTS AS OF SEPTEMBER 30TH
*If not included above.
This form should be used for county-wide and/or individual school projections by grade by year.
The "Actual" column is for the actual enrollments the previous Fall. The remaining columns are
FTE ENROLLMENT PROJECTIONS BY GRADE
Wicomico County May 5, 2010
Bennett Middle School
LEA: DATE:
SCHOOL:
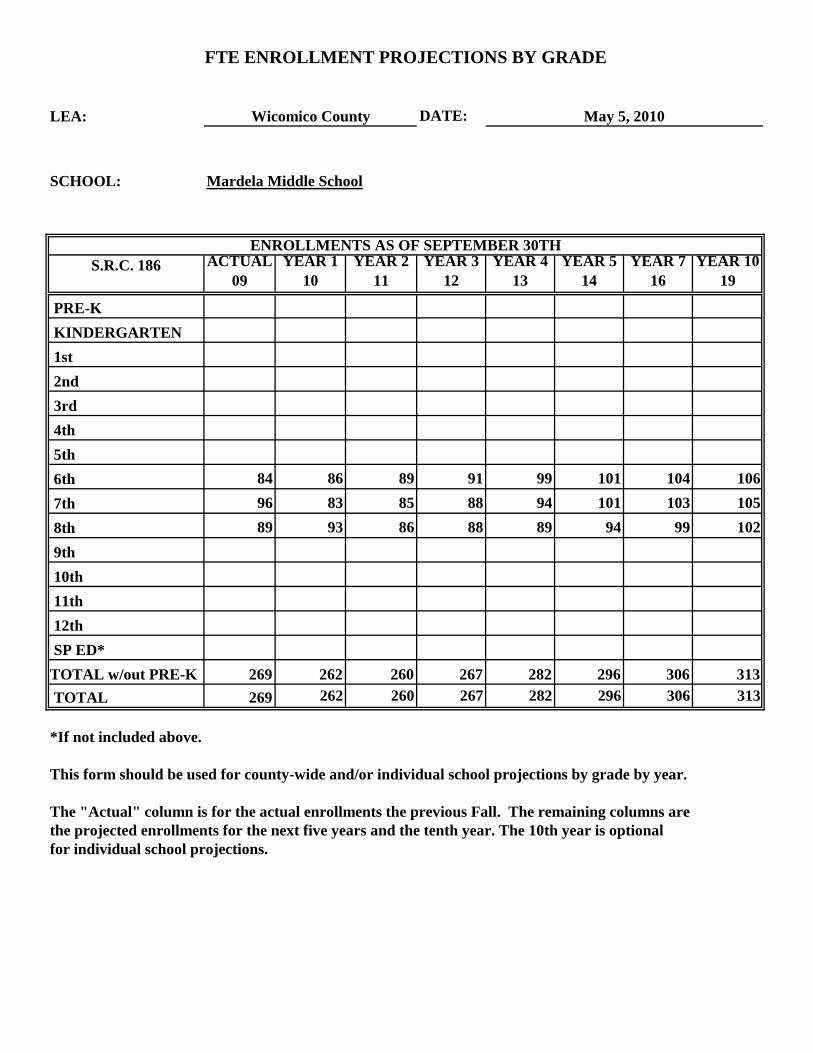
S.R.C. 186 ACTUAL 09
YEAR 1 10
YEAR 2 11
YEAR 3 12
YEAR 4 13
YEAR 5 14
YEAR 7 16
YEAR 10 19
PRE-K KINDERGARTEN 1st 2nd 3rd 4th 5th 6th 84 86 89 91 99 101 104 106 7th 96 83 85 88 94 101 103 105 8th 89 93 86 88 89 94 99 102 9th 10th 11th 12th SP ED*TOTAL w/out PRE-K 269 262 260 267 282 296 306 313 TOTAL 269 262 260 267 282 296 306 313
FTE ENROLLMENT PROJECTIONS BY GRADE
Wicomico County May 5, 2010
Mardela Middle School
The "Actual" column is for the actual enrollments the previous Fall. The remaining columns arethe projected enrollments for the next five years and the tenth year. The 10th year is optional for individual school projections.
ENROLLMENTS AS OF SEPTEMBER 30TH
*If not included above.
This form should be used for county-wide and/or individual school projections by grade by year.

LEA: DATE:
SCHOOL:
S.R.C. 298 ACTUAL 09
YEAR 1 10
YEAR 2 11
YEAR 3 12
YEAR 4 13
YEAR 5 14
YEAR 7 16
YEAR 10 19
PRE-K KINDERGARTEN 1st 2nd 3rd 4th 5th 6th 85 77 79 75 60 63 68 70 7th 74 82 75 76 73 61 67 69 8th 72 74 81 77 76 74 65 68 9th 10th 11th 12th SP ED*TOTAL w/out PRE-K 231 233 235 228 209 198 200 207 TOTAL 231 233 235 228 209 198 200 207
FTE ENROLLMENT PROJECTIONS BY GRADE
Wicomico County May 5, 2010
Pittsville Middle School
The "Actual" column is for the actual enrollments the previous Fall. The remaining columns arethe projected enrollments for the next five years and the tenth year. The 10th year is optional for individual school projections.
ENROLLMENTS AS OF SEPTEMBER 30TH
*If not included above.
This form should be used for county-wide and/or individual school projections by grade by year.

LEA: DATE:
SCHOOL:
S.R.C. 999 ACTUAL 09
YEAR 1 10
YEAR 2 11
YEAR 3 12
YEAR 4 13
YEAR 5 14
YEAR 7 16
YEAR 10 19
PRE-K KINDERGARTEN 1st 2nd 3rd 4th 5th 6th 257 272 279 275 268 276 286 295 7th 285 255 270 275 281 274 280 292 8th 273 280 257 267 273 279 281 285 9th 10th 11th 12th SP ED* 33 30 30 30 30 30 30 30TOTAL w/out PRE-K 848 837 836 847 852 859 877 902 TOTAL 848 837 836 847 852 859 877 902
FTE ENROLLMENT PROJECTIONS BY GRADE
Wicomico County May 5, 2010
Salisbury Middle School
The "Actual" column is for the actual enrollments the previous Fall. The remaining columns arethe projected enrollments for the next five years and the tenth year. The 10th year is optional for individual school projections.
ENROLLMENTS AS OF SEPTEMBER 30TH
*If not included above.
This form should be used for county-wide and/or individual school projections by grade by year.

LEA: DATE:
SCHOOL:
S.R.C. 914 ACTUAL 09
YEAR 1 10
YEAR 2 11
YEAR 3 12
YEAR 4 13
YEAR 5 14
YEAR 7 16
YEAR 10 19
PRE-KKINDERGARTEN 1st 2nd 3rd 4th 5th 6th 245 240 235 238 241 241 243 245 7th 230 242 238 233 235 237 240 243 8th 223 226 237 239 233 236 238 241 9th 10th 11th 12th SP ED* 15 20 20 20 20 20 20 20TOTAL w/out PRE-K 713 728 730 730 729 734 741 749 TOTAL 713 728 730 730 729 734 741 749
FTE ENROLLMENT PROJECTIONS BY GRADE
Wicomico County May 5, 2010
Wicomico Middle School
The "Actual" column is for the actual enrollments the previous Fall. The remaining columns arethe projected enrollments for the next five years and the tenth year. The 10th year is optional for individual school projections.
ENROLLMENTS AS OF SEPTEMBER 30TH
*If not included above.
This form should be used for county-wide and/or individual school projections by grade by year.
LEA: DATE:
SCHOOL:
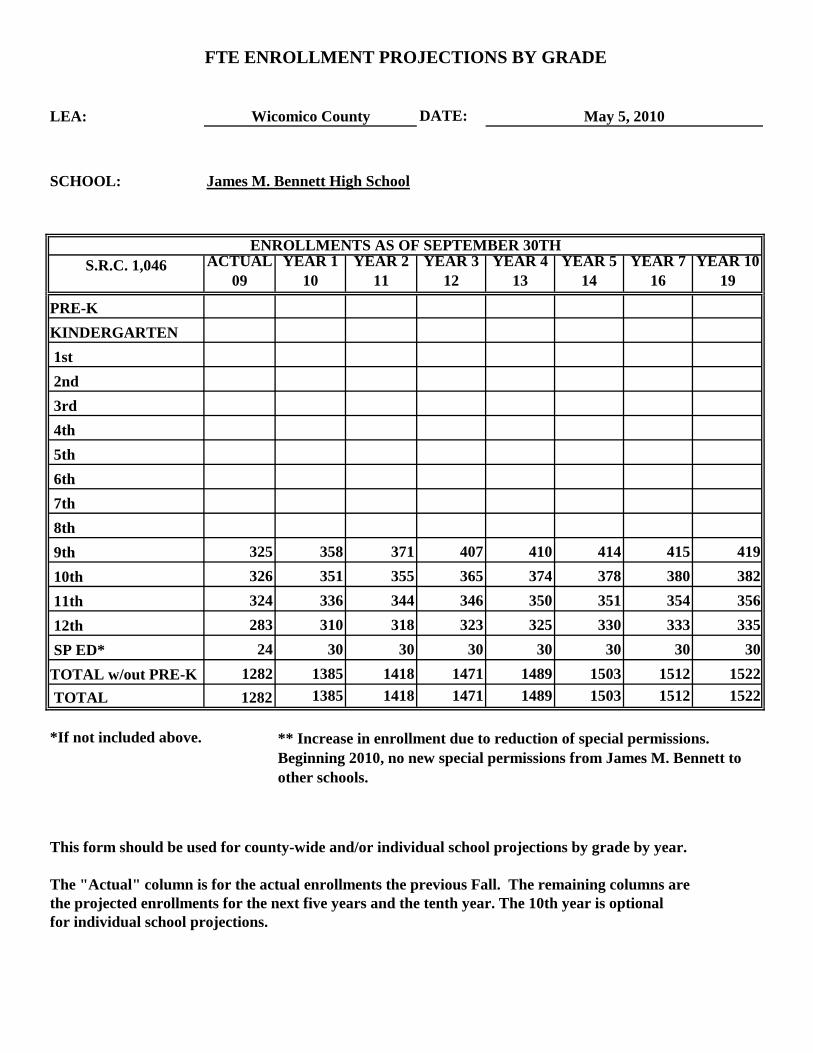
S.R.C. 1,046 ACTUAL 09
YEAR 1 10
YEAR 2 11
YEAR 3 12
YEAR 4 13
YEAR 5 14
YEAR 7 16
YEAR 10 19
PRE-KKINDERGARTEN 1st 2nd 3rd 4th 5th 6th 7th 8th 9th 325 358 371 407 410 414 415 419 10th 326 351 355 365 374 378 380 382 11th 324 336 344 346 350 351 354 356 12th 283 310 318 323 325 330 333 335 SP ED* 24 30 30 30 30 30 30 30TOTAL w/out PRE-K 1282 1385 1418 1471 1489 1503 1512 1522 TOTAL 1282 1385 1418 1471 1489 1503 1512 1522
The "Actual" column is for the actual enrollments the previous Fall. The remaining columns are
** Increase in enrollment due to reduction of special permissions. Beginning 2010, no new special permissions from James M. Bennett to other schools.
the projected enrollments for the next five years and the tenth year. The 10th year is optional for individual school projections.
ENROLLMENTS AS OF SEPTEMBER 30TH
*If not included above.
This form should be used for county-wide and/or individual school projections by grade by year.
FTE ENROLLMENT PROJECTIONS BY GRADE
Wicomico County May 5, 2010
James M. Bennett High School
LEA: DATE:
SCHOOL:
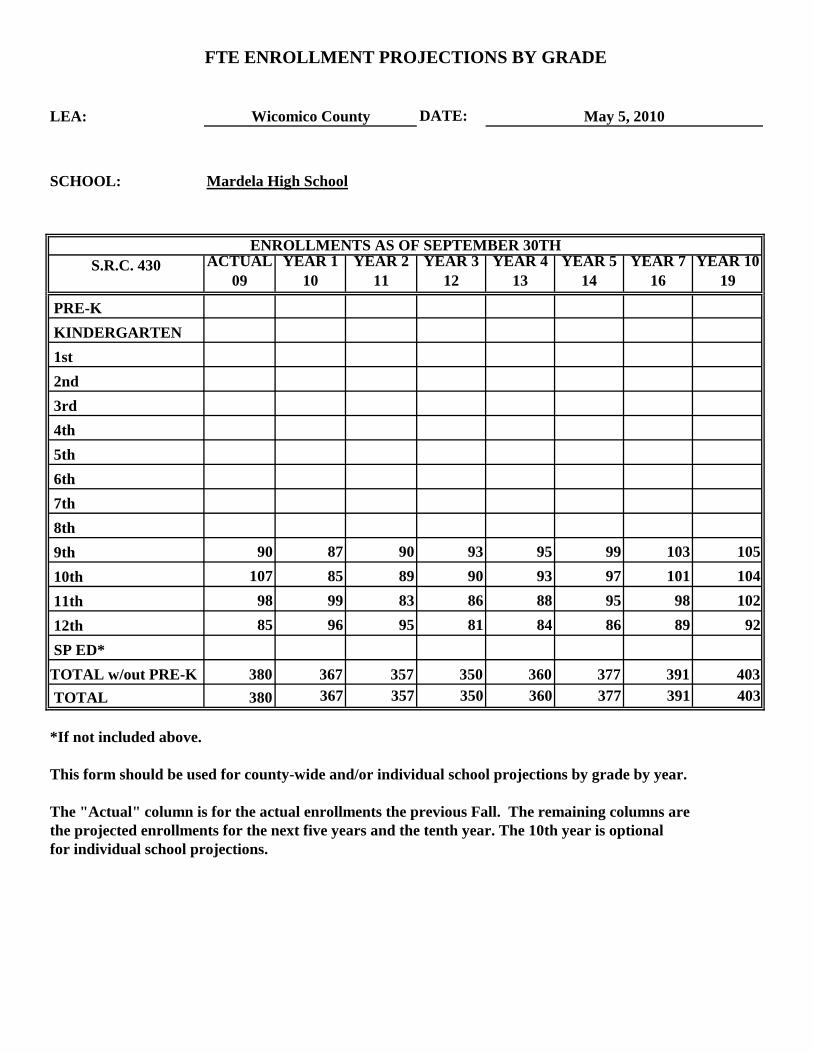
S.R.C. 430 ACTUAL 09
YEAR 1 10
YEAR 2 11
YEAR 3 12
YEAR 4 13
YEAR 5 14
YEAR 7 16
YEAR 10 19
PRE-K KINDERGARTEN 1st 2nd 3rd 4th 5th 6th 7th 8th 9th 90 87 90 93 95 99 103 105 10th 107 85 89 90 93 97 101 104 11th 98 99 83 86 88 95 98 102 12th 85 96 95 81 84 86 89 92 SP ED*TOTAL w/out PRE-K 380 367 357 350 360 377 391 403 TOTAL 380 367 357 350 360 377 391 403
FTE ENROLLMENT PROJECTIONS BY GRADE
Wicomico County May 5, 2010
Mardela High School
The "Actual" column is for the actual enrollments the previous Fall. The remaining columns arethe projected enrollments for the next five years and the tenth year. The 10th year is optional for individual school projections.
ENROLLMENTS AS OF SEPTEMBER 30TH
*If not included above.
This form should be used for county-wide and/or individual school projections by grade by year.
LEA: DATE:
SCHOOL:
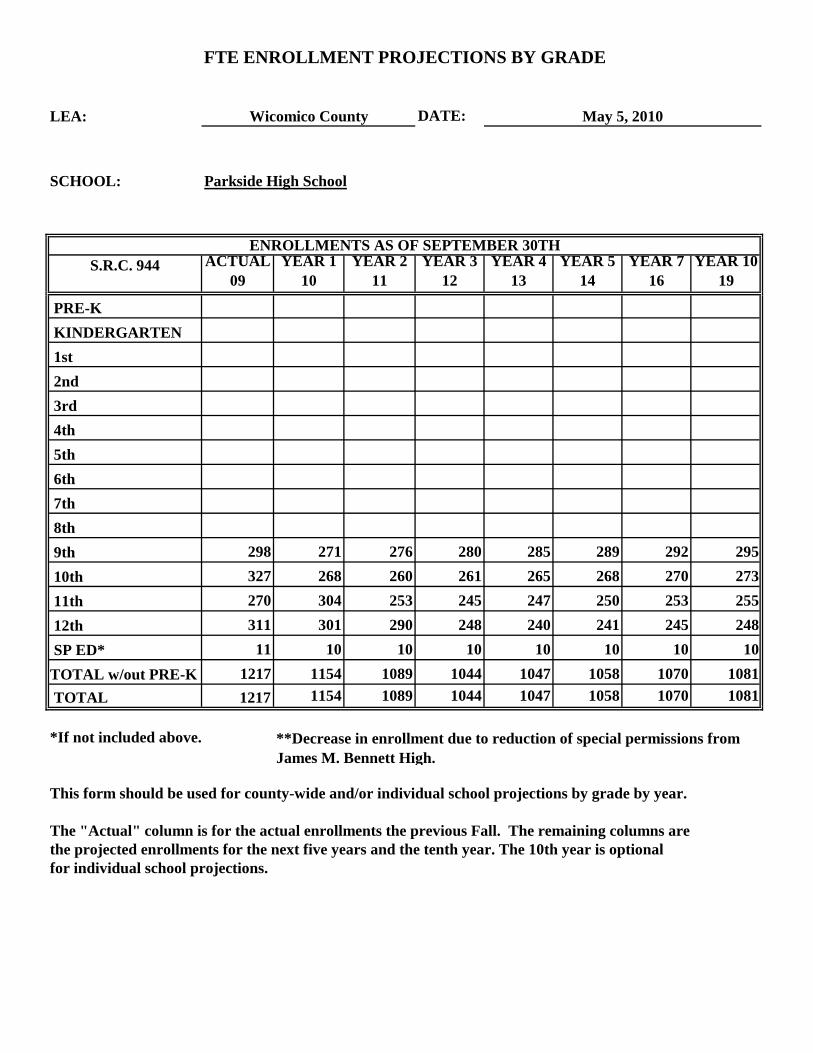
S.R.C. 944 ACTUAL 09
YEAR 1 10
YEAR 2 11
YEAR 3 12
YEAR 4 13
YEAR 5 14
YEAR 7 16
YEAR 10 19
PRE-K KINDERGARTEN 1st 2nd 3rd 4th 5th 6th 7th 8th 9th 298 271 276 280 285 289 292 295 10th 327 268 260 261 265 268 270 273 11th 270 304 253 245 247 250 253 255 12th 311 301 290 248 240 241 245 248 SP ED* 11 10 10 10 10 10 10 10TOTAL w/out PRE-K 1217 1154 1089 1044 1047 1058 1070 1081 TOTAL 1217 1154 1089 1044 1047 1058 1070 1081
FTE ENROLLMENT PROJECTIONS BY GRADE
Wicomico County May 5, 2010
Parkside High School
The "Actual" column is for the actual enrollments the previous Fall. The remaining columns arethe projected enrollments for the next five years and the tenth year. The 10th year is optional for individual school projections.
ENROLLMENTS AS OF SEPTEMBER 30TH
*If not included above.
This form should be used for county-wide and/or individual school projections by grade by year.
**Decrease in enrollment due to reduction of special permissions from James M. Bennett High.

LEA: DATE:
SCHOOL:
S.R.C. 1,199 ACTUAL 09
YEAR 1 10
YEAR 2 11
YEAR 3 12
YEAR 4 13
YEAR 5 14
YEAR 7 16
YEAR 10 19
PRE-K KINDERGARTEN 1st 2nd 3rd 4th 5th 6th 7th 8th 9th 304 289 293 297 303 307 311 318 10th 264 265 267 269 270 273 277 282 11th 291 246 248 246 247 248 251 256 12th 238 279 240 241 240 242 245 248 SP ED* 91 90 90 90 90 90 90 90TOTAL w/out PRE-K 1188 1169 1138 1143 1150 1160 1174 1194 TOTAL 1188 1169 1138 1143 1150 1160 1174 1194
FTE ENROLLMENT PROJECTIONS BY GRADE
Wicomico County May 5, 2010
Wicomico High School
The "Actual" column is for the actual enrollments the previous Fall. The remaining columns arethe projected enrollments for the next five years and the tenth year. The 10th year is optional for individual school projections.
ENROLLMENTS AS OF SEPTEMBER 30TH
*If not included above.
This form should be used for county-wide and/or individual school projections by grade by year.