annual benchmarking report - australian energy … 2017 transmission network...annual benchmarking...
TRANSCRIPT

Annual benchmarking report | Electricity transmission network service providers | 2017 0
Annual Benchmarking
Report
Electricity transmission
network service providers
November 2017

Annual benchmarking report | Electricity transmission network service providers | 2017 1
© Commonwealth of Australia 2017
This work is copyright. In addition to any use permitted under the Copyright Act 1968,
all material contained within this work is provided under a Creative Commons
Attributions 3.0 Australia licence, with the exception of:
the Commonwealth Coat of Arms
the ACCC and AER logos
any illustration, diagram, photograph or graphic over which the Australian
Competition and Consumer Commission does not hold copyright, but which may be
part of or contained within this publication. The details of the relevant licence
conditions are available on the Creative Commons website, as is the full legal code
for the CC BY 3.0 AU licence.
Requests and inquiries concerning reproduction and rights should be addressed to the:
Director, Corporate Communications
Australian Competition and Consumer Commission
GPO Box 4141, Canberra ACT 2601
Inquiries about this publication should be addressed to:
Australian Energy Regulator
GPO Box 520
Melbourne Vic 3001
Tel: (03) 9290 1444
Fax: (03) 9290 1457
Email: [email protected]

Annual benchmarking report | Electricity transmission network service providers | 2017 2
Contents
Contents .......................................................................................................... 2
Shortened forms ............................................................................................. 4
Glossary........................................................................................................... 5
Executive Summary ........................................................................................ 6
1 Introduction ............................................................................................. 10
1.1 Why we benchmark electricity networks? ..................................... 10
1.2 What's in this year's report? ........................................................... 11
1.3 How was this report produced? ..................................................... 12
2 Electricity network benchmarking and its uses ................................... 14
2.1 What is benchmarking? .................................................................. 14
2.2 What data is used? .......................................................................... 15
2.3 Network revenue determinations and the role of benchmarking 17
2.3.1 The regulatory framework ............................................................ 17
2.3.2 The uses of benchmarking ........................................................... 19
2.3.3 Limitations of transmission benchmarking .................................... 20
2.3.4 Why do we care about network charges? ..................................... 20
2.4 AER's 2017 review of transmission benchmarking ...................... 21
3 Benchmarking results ............................................................................ 24
3.1 The productivity results .................................................................. 24
3.1.1 Industry TFP results ..................................................................... 25
3.1.2 MTFP results by TNSP ................................................................. 28
3.1.3 Relative performance of TNSPs over 2016 .................................. 30
3.2 Interpreting the productivity results .............................................. 31
3.2.1 Input and output drivers of industry TFP ....................................... 31

Annual benchmarking report | Electricity transmission network service providers | 2017 3
3.2.2 Drivers of individual TNSP productivity ......................................... 33
A References and further reading ............................................................ 36
B Inputs and outputs ................................................................................. 37
B.1 Outputs ............................................................................................. 37
B.1.1 Line length ................................................................................... 37
B.1.2 Energy transported ....................................................................... 38
B.1.3 Maximum demand ........................................................................ 39
B.1.4 Voltage of entry and exit points (original output) ........................... 40
B.1.5 End User Numbers (new output) .................................................. 41
B.1.6 Reliability ...................................................................................... 42
B.1.7 Total outputs ................................................................................ 43
B.2 Inputs ................................................................................................ 44
C Results from supporting benchmarking techniques ........................... 46
C.1 Multilateral partial factor productivity ............................................ 46
C.2 Partial performance indicators ....................................................... 49
D Map of the National Electricity Market .................................................. 54
E List of submissions ................................................................................ 55

Annual benchmarking report | Electricity transmission network service providers | 2017 4
Shortened forms Shortened form Extended form
AEMC Australian Energy Market Commission
AEMO Australian Energy Market Operator
AER Australian Energy Regulator
ANT AusNet Services (transmission)
capex Capital expenditure
EB RIN Economic Benchmarking Regulatory
Information Notice
ENT ElectraNet
MTFP Multilateral total factor productivity
NEL National Electricity Law
NEM National Electricity Market
NER National Electricity Rules
opex Operating expenditure
PLK Powerlink
PPI Partial performance indicator
RAB Regulatory asset base
TFP Total factor productivity
TNI Transmission node identifiers
TNT TasNetworks (transmission)
TNSP Transmission network service provider
TRG TransGrid

Annual benchmarking report | Electricity transmission network service providers | 2017 5
Glossary Term Description
Inputs Inputs are the resources TNSPs use to provide services.
MPFP
Multilateral partial factor productivity is a PIN technique that
measures the relationship between total output and one
input. It allows partial productivity levels to be compared
between entities (networks).
MTFP
Multilateral total factor productivity is a PIN technique that
measures the relationship between total output and total
input. It allows total productivity levels to be compared
between entities (networks).
Prescribed transmission
services
Prescribed transmission services are the services that are
shared across the users of transmission networks. These
capture the services that TNSPs must provide under
legislation.
OEFs
Operating environment factors are factors beyond a TNSP’s
control that can affect its costs and benchmarking
performance.
Opex Operation and maintenance expenditure
Outputs Outputs are quantitative or qualitative measures that
represent the services TNSPs provide.
PIN
Productivity index number techniques determine the
relationship between inputs and outputs using a
mathematical index.
PPI Partial performance indicator are simple techniques that
measure the relationship between one input and one output.
Ratcheted maximum demand
Ratcheted maximum demand is the highest value of
maximum demand for each TNSP, observed in the time
period up to the year in question. It recognises capacity that
has been used to satisfy demand and gives the TNSP credit
for this capacity in subsequent years, even though annual
maximum demand may be lower in subsequent years.
TFP
Total factor productivity is a PIN technique that measures the
relationship between total output and total input over time. It
allows total productivity growth rates to be compared across
networks but does not allow productivity levels to be
compared across networks. It is used to decompose
productivity change into its constituent input and output parts.
VCR Value of Customer Reliability. VCR represents a customer's
willingness to pay for the reliable supply of electricity.
Annual benchmarking report | Electricity transmission network service providers | 2017 6
Executive Summary
Benchmarking helps consumers to pay no more than necessary for the safe and
reliable transmission and distribution of electricity
Benchmarking provides consumers with useful information about the relative efficiency
of the electricity networks they rely on, helping them to better understand the
performance of their networks, the drivers of network productivity and the charges that
make up 40-55 per cent of their electricity bills.
Benchmarking also provides managers and investors with information on the relative
efficiency of their network businesses. Combined with incentives under the regulatory
framework, this information promotes ongoing efficiency that can lead to lower network
charges and retail prices. It provides the governments that set regulatory standards
with information on the impact of regulation on network efficiency, charges and
ultimately electricity prices. Finally, benchmarking is one of the tools the AER draws on
when setting the maximum revenues networks can recover through consumers' bills.
Output specifications have been updated
This year's TNSP benchmarking results are based on updated output specifications
following the AER's 2017 TNSP Benchmarking Review. The changes include:
the substitution of the end–user numbers output measure for the voltage–weighted
connections output measure
the introduction of a cap on the weighting given to the reliability output measure
(energy not supplied or ENS)
the updating of cost share weights for outputs other than reliability.
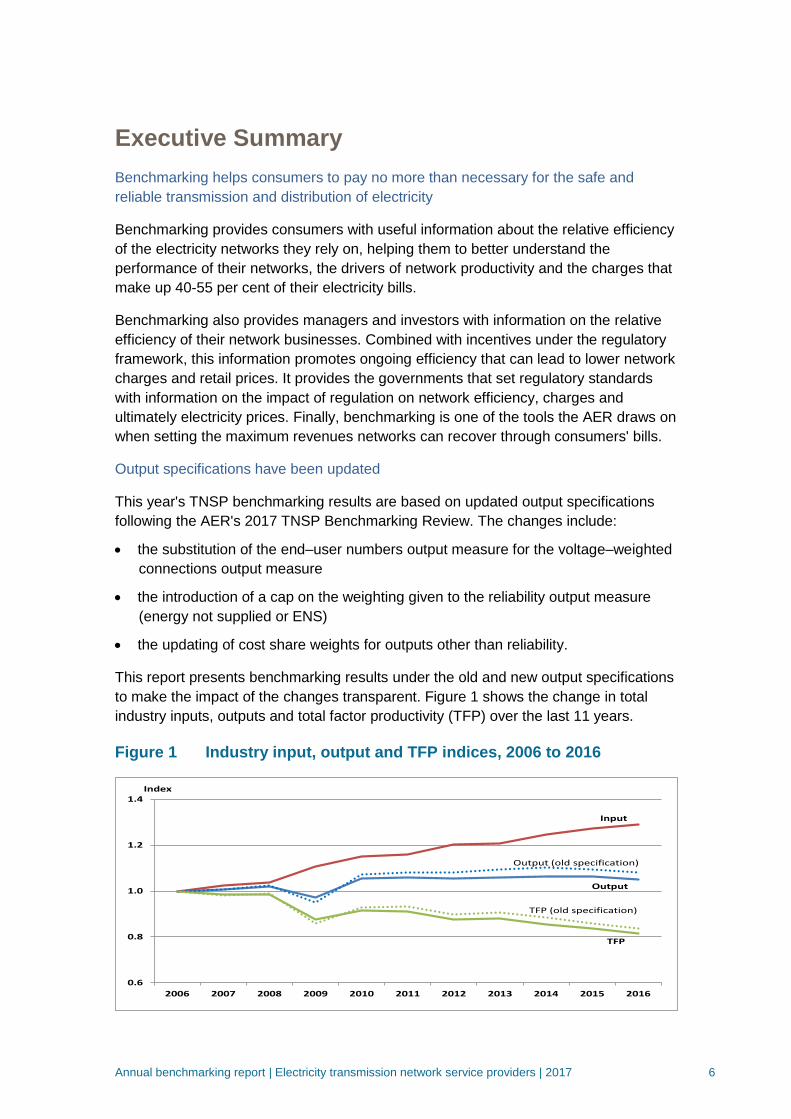
This report presents benchmarking results under the old and new output specifications
to make the impact of the changes transparent. Figure 1 shows the change in total
industry inputs, outputs and total factor productivity (TFP) over the last 11 years.
Figure 1 Industry input, output and TFP indices, 2006 to 2016
0.6
0.8
1.0
1.2
1.4
2006 2007 2008 2009 2010 2011 2012 2013 2014 2015 2016
Index
Input
TFP
Output
Output (old specification)
TFP (old specification)

Annual benchmarking report | Electricity transmission network service providers | 2017 7
At the industry level, the impact of the new output specifications is to decrease the rate
of growth in total outputs over 2006-16 (from an average annual rate of 0.8 per cent to
0.5 per cent). As productivity is a function of outputs divided by inputs, the lower rate of
growth in outputs increases the rate of decline in TFP (from an average annual -1.8 per
cent over 2006-16 to -2.1 per cent). The rate of change in total inputs does not change
under the new specifications as no changes were made to the input side of the
benchmarking models.1
Transmission network productivity continued to decline over 2016
As can be seen in figure 1, industry-wide TFP continued to decline over 2016
decreasing by 2.7 per cent.2 This is the third consecutive year of declining TNSP
productivity – TFP decreased by 2.9 percent over 2014 and 2.2 per cent over 2015. It
is also a faster rate of decline than the long term industry rate of a -2.1 per cent
average annual decrease over 2006-16.
The long term decrease in TFP – by 19 per cent over the last 11 years – has been
driven by network inputs growing at a faster rate than outputs. Total inputs increased
29 per cent over 2006-16 while total outputs grew by only five per cent.
Lower network reliability drove productivity lower over 2016
Analysis undertaken for this year's report reveals what changes in network inputs and
outputs are driving changes in productivity. Figure 2 shows the percentage point
contributions of each input and each output (the red bars) to the change in TFP
between 2015 and 2016 (the yellow bar).3 It shows that the primary drivers of the 2.7
percent decrease in TFP over 2016 were:
a decrease in network reliability (energy not supplied or ENS), which
contributed -1.4 percentage points (ppts) to the rate of TFP decline
growth in capital inputs (transformers and overhead lines) which contributed -0.5
ppts each
growth in opex spending which contributed a further -0.4 ppts to the rate of TFP
decline.
The steady rise in end user numbers made the only significant positive contribution to
industry TFP over 2016 adding 0.3 ppts to rate of change in TFP.
1 Documents related to the AER's 2017 TNSP Benchmarking Review (including documents giving a detailed
description of the output specification changes and the rationale and impact of the changes) can be found online
at: https://www.aer.gov.au/networks-pipelines/guidelines-schemes-models-reviews/annual-benchmarking-report-
2017/initiation. 2 All references to results refer to results under the new specifications unless otherwise noted.
3 A full set of the input/output analysis at the industry level and for each transmission business is available in the
Economic Insights report and associated spreadsheets available at the AER's benchmarking page online.

Annual benchmarking report | Electricity transmission network service providers | 2017 8
Figure 2 TNSP output and input percentage point contributions to
average annual TFP change, change from 2015 to 2016
Powerlink made productivity gains over 2016, all other TNSPs saw declines
The relative rankings of each TNSP, as measured by their multilateral total factor
productivity score (MTFP), is shown Table 1. Despite large declines in some TNSP
productivity scores the rankings of the five networks did not change in 2016. Powerlink
was the only TNSP to record an increase in MTFP (of two per cent), although it
continues to be the lowest ranked transmission network in terms of MTFP score. The
other four TNSPs saw declines in MTFP over 2016 with Electranet and TransGrid
recording the largest falls of nine and five percent respectively.
Table 1 TNSP MTFP scores, rankings and change, 2015 and 20164
TNSP Rank
(2016)
Rank
(2015)
MTFP
Score
(2016)
MTFP
Score
(2015)
% change
between
2015-16
TasNetwork 1 1 0.92 0.95 -3%
AusNet Services 2 2 0.83 0.83 -1%
ElectraNet 3 3 0.75 0.83 -9%
TransGrid 4 4 0.72 0.75 -5%
Powerlink 5 5 0.71 0.70 +2%
4 Results based on new output specifications. The rankings in Table 1 are only indicative of relative performance
because there may be other operating environment variables not captured in the MTFP model. There may be
small differences between MTFP and TFP rates of change for a given firm due to differences between the two
methodologies. Appendix A of the 2017 Economic Insights Report contains an explanation for these differences.
-3.0%
-2.5%
-2.0%
-1.5%
-1.0%
-0.5%
0.0%
0.5%
End-UserNos
Circuitkms
U/GCables
RMD GWh Opex O/HLines
Trf ENS TFP
Annual benchmarking report | Electricity transmission network service providers | 2017 9
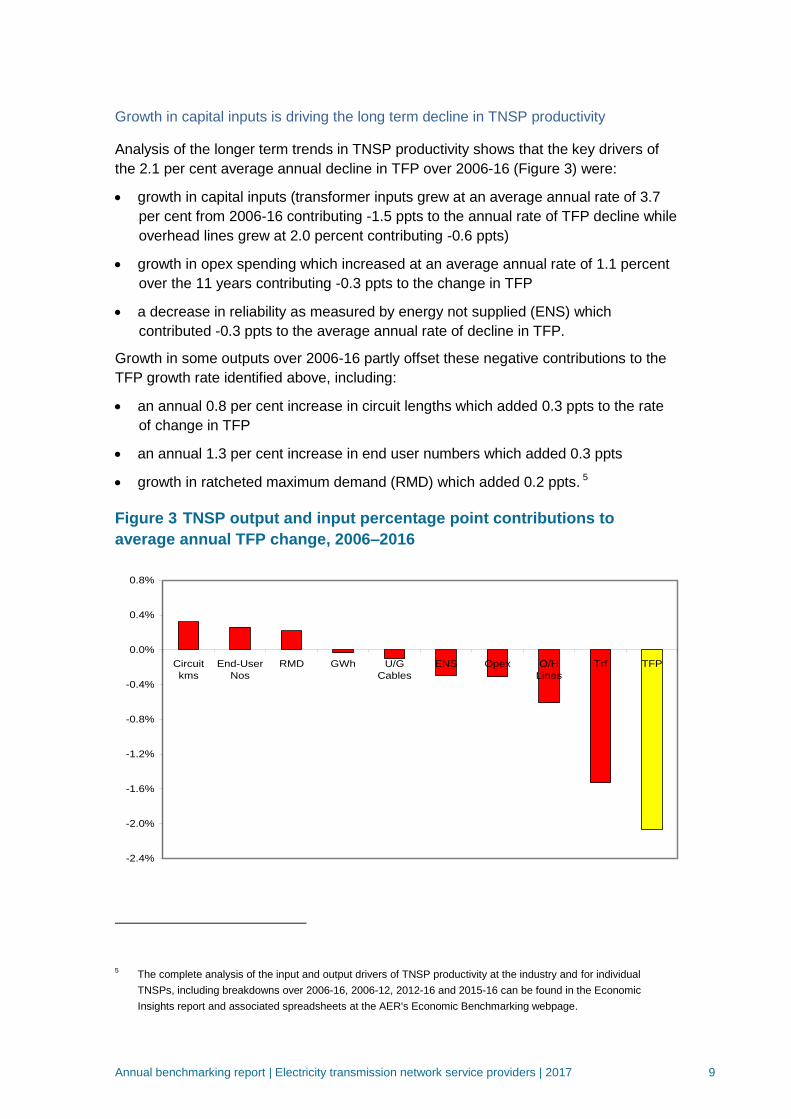
Growth in capital inputs is driving the long term decline in TNSP productivity
Analysis of the longer term trends in TNSP productivity shows that the key drivers of
the 2.1 per cent average annual decline in TFP over 2006-16 (Figure 3) were:
growth in capital inputs (transformer inputs grew at an average annual rate of 3.7
per cent from 2006-16 contributing -1.5 ppts to the annual rate of TFP decline while
overhead lines grew at 2.0 percent contributing -0.6 ppts)
growth in opex spending which increased at an average annual rate of 1.1 percent
over the 11 years contributing -0.3 ppts to the change in TFP
a decrease in reliability as measured by energy not supplied (ENS) which
contributed -0.3 ppts to the average annual rate of decline in TFP.
Growth in some outputs over 2006-16 partly offset these negative contributions to the
TFP growth rate identified above, including:
an annual 0.8 per cent increase in circuit lengths which added 0.3 ppts to the rate
of change in TFP
an annual 1.3 per cent increase in end user numbers which added 0.3 ppts
growth in ratcheted maximum demand (RMD) which added 0.2 ppts. 5
Figure 3 TNSP output and input percentage point contributions to
average annual TFP change, 2006–2016
5 The complete analysis of the input and output drivers of TNSP productivity at the industry and for individual
TNSPs, including breakdowns over 2006-16, 2006-12, 2012-16 and 2015-16 can be found in the Economic
Insights report and associated spreadsheets at the AER's Economic Benchmarking webpage.
-2.4%
-2.0%
-1.6%
-1.2%
-0.8%
-0.4%
0.0%
0.4%
0.8%
Circuit
kms
End-User
Nos
RMD GWh U/G
Cables
ENS Opex O/H
Lines
Trf TFP
Annual benchmarking report | Electricity transmission network service providers | 2017 10
1 Introduction
1.1 Why we benchmark electricity networks?
Electricity networks are 'natural monopolies' which do not face the typical commercial
pressures experienced by firms in competitive markets. Without appropriate regulation,
network operators could increase their prices above efficient levels and would face
limited pressure to control their operating costs or invest efficiently.
Under the National Electricity Rules (NER or the rules), the AER regulates electricity
network revenues with the goal of ensuring that consumers pay no more than
necessary for the safe and reliable delivery of electricity services. This is done though
a periodic regulatory process (known as revenue determinations or resets) which
typically occurs every five years. An electricity network provides the AER with a
revenue proposal outlining its forecast expenditures or costs over the five year period.
Following requirements set out in the NER, the AER assesses and, where necessary,
amends the proposal to ensure it represents efficient expenditures/costs. Based on
these cost, the AER then sets the network's revenue allowance for the five year period,
which is the maximum amount the network can recover from their retail customers
through electricity bills. Transmission network revenue costs typically account for
between five and thirteen per cent of the retail price of electricity.6
In 2012, the Australian Energy Market Commission (AEMC) amended the rules to
strengthen the AER's power to assess and amend network expenditure proposals.7
The rule changes were made in response to concerns raised by the AER and other
industry participants that restrictions in the NER had resulted in inefficient increases in
capital and operating expenditure allowances of NSPs and higher charges for
consumers.8
The rule changes required the AER to develop a benchmarking program to measure
the relative efficiency of all electricity networks in the national electricity market (NEM)
and to have regard to the benchmarking results when assessing capital expenditure
(capex) and operational expenditure (opex) allowances for network businesses.9 The
6 AEMC, 2016 residential electricity price trends, fact sheet.
7 See: AEMC, Rule Determination, National Electricity Amendment (Economic Regulation of Network Service
Providers) Rule 2012, National Gas Amendment (Price and Revenue Regulation of Gas Services) Rule, 2012, 29
November 2012 (AEMC Rule Determination), p. vii. 8 AEMC final rule determination 2012, p. viii.
9 The benchmarking presented in this report is one of a number of factors we consider when making our revenue
determinations. For a revenue determination, we examine the efficiency of an individual TNSP's forecast opex and
capex. In this report we primarily examine the efficiency of transmission networks overall. Though the efficiency of
networks as a whole is relevant to our determinations, we also undertake further analysis when reviewing opex
and capex forecasts.
Annual benchmarking report | Electricity transmission network service providers | 2017 11
new rules also required the AER to publish the benchmarking results in an annual
benchmarking report.10
National Electricity Rules reporting requirement
6A.31 Annual Benchmarking Report
(a) The AER must prepare and publish a network service provider performance report (an
annual benchmarking report) the purpose of which is to describe, in reasonably plain language,
the relative efficiency of each Transmission Network Service Provider in providing prescribed
transmission services over a 12 month period.
The stated aims of the 2012 rule changes were to reduce inefficient capital and
operational network expenditures, which had been a significant factor in higher network
charges, so that electricity consumers did not pay more than necessary for reliable
energy supplies. The changes also aimed to provide consumers with useful information
about the relative performance of their electricity network service provider (NSP) to
help them participate in regulatory determinations and other interactions with their
NSP.11
This is the fourth benchmarking report for transmission network service providers
(TNSPs). The previous three benchmarking reports can be found on the AER's website
at: https://www.aer.gov.au/networks-pipelines/guidelines-schemes-models-
reviews/annual-benchmarking-report-2016
1.2 What's in this year's report?
Consistent with the rules, this report describes the relative efficiency of each TNSP in
the NEM for the 2016 reporting period (box 1). It also examines longer term trends
and changes in network productivity and efficiency from 2006 to 2016 and identifies the
key changes in inputs and outputs driving these trends and changes.
Chapter two of this report describes the AER’s approach to benchmarking TNSPs
(including the techniques, methodology and data we use), the regulatory framework
applying to TNSPs and the role benchmarking plays within that framework.12 The
chapter also summarises the outcomes of the AER's 2017 Review of Transmission
Benchmarking, including the updated output specifications adopted for this year's
report and the rationale for making the changes.
10
NER, cl.6A.31(a) & (c). 11
AEMC, Rule Determination, National Electricity Amendment (Economic Regulation of Network Service Providers)
Rule 2012, National Gas Amendment (Price and Revenue Regulation of Gas Services) Rule, 2012, 29 November
2012 (AEMC Rule Determination), p. vii-viii. 12
A fuller description of the benchmarking methodologies and data on the inputs and outputs used can be found in
the Economic Insights papers listed in Appendix A.

Annual benchmarking report | Electricity transmission network service providers | 2017 12
Box 1: What is a transmission network service provider?
The electricity industry in Australia is divided into four parts — generation, transmission,
distribution and retail.
As electricity generators (i.e. coal, gas, hydro, wind etc.) are usually located near fuel sources
and often long distances from electricity consumers, networks of poles and wires are required
to transport power from the generation sources to end use consumers. These networks include:
High voltage transmission lines operated by transmission network service providers
(TNSPs) which transport electricity from generators to distribution networks in urban and
regional areas.
Transformers, poles and wires operated by distribution network service providers (DNSPs)
which convert electricity from the high voltage network into medium and low voltages and
transport electricity to residential and business consumers.
Appendix D presents a map of the showing the service area for each of the five TNSPs
operating in the national electricity market.
Chapter three presents the key productivity benchmarking results (TFP and MTFP) at
the industry and individual TNSP level for the 12 month reporting period (for 2016) and
over the longer term (from 2006 to 2016). Results using the old and new model
specifications are reported to allow readers to see the impact of the changes. The
chapter also decomposes observed changes in TFP into its constituent input and
output drivers to shows what changes in TNSP inputs and outputs drove industry-wide
and individual TNSP productivity trends from 2006 to 2016.
Results from the supplementary benchmarking techniques (including opex and capital
multilateral partial factor productivity (MPFP) and the partial performance indicators)
are reported in Appendix C.
A complete set of the benchmarking results at the industry and individual TNSP level is
available in the Economic Insights Report available at the AER's benchmarking
webpage online.13
1.3 How was this report produced?
The benchmarking techniques presented in this report and the AER's approach to
applying benchmarking in network revenue determinations are the result of a
development program undertaken over 2011 to 2013 by AER staff in conjunction with
expert consultants at Economic Insights.14 The development program included
extensive reviews and assessments of best practice approaches used by regulators
13
See Annual Benchmarking Report 2017 at: https://www.aer.gov.au/networks-pipelines/guidelines-schemes-
models-reviews/annual-benchmarking-report-2017. 14
The AER's Expenditure Forecast Assessment Guidelines 2013 outline how benchmarking is used by the AER in
network revenue determinations. See: https://www.aer.gov.au/networks-pipelines/guidelines-schemes-models-
reviews/expenditure-forecast-assessment-guideline-2013.

Annual benchmarking report | Electricity transmission network service providers | 2017 13
internationally, the development of a set of proposed benchmarking techniques,
methodologies and data sets, and rounds of consultation with network businesses,
consumer groups and the broader public.15
To prepare this year's report, each TNSP provided the AER with input and output data
from their businesses as defined in standardised economic benchmarking regulatory
information notices (EB RINs). This data was verified by the TNSP’s chief executive
officer and independently audited. We separately tested and validated the data
provided by the networks. Economic Insights prepared the benchmarking results using
(as discussed above) the old and new benchmarking techniques. We provided the
TNSPs with a draft version of the benchmarking report to allow each network to
provide feedback on the results before this final benchmarking report was publicly
released.
15
Appendix A lists Economic Insights publications which explain how it developed and applied the economic
benchmarking techniques we use, and ACCC/AER publications which provide a comprehensive overview of
overseas benchmarking approaches reviewed by the AER.

Annual benchmarking report | Electricity transmission network service providers | 2017 14
2 Electricity network benchmarking and its uses
2.1 What is benchmarking?
Productivity benchmarking is a quantitative or data driven approach used widely by
governments and businesses around the world to measure how productive (or
efficient) firms are at producing outputs compared with their peers. Broadly, this is
done by using standardised statistical techniques to compare the quantity of input(s) a
firm uses to produce a quantity of output(s), and then compare the firm's relative
performance with other firms. A more productive firm produces more using a given
level of inputs compared with less productive firms (or alternatively the more productive
firm uses fewer inputs to produce a given level of outputs).
The benchmarking in this report uses several techniques (described below) to measure
TNSP productivity and efficiency by comparing the combination of inputs electricity
networks use (such as capital and labour) to provide various services (outputs) to their
customers (such as the quantity of electricity consumed). A TNSP's benchmarking
results relative to other networks reflect that network's relative efficiency, specifically
their cost efficiency. TNSPs are cost efficient when they produce services at least
possible cost given their operating environments and prevailing input prices.16 A more
productive network is likely to be relatively more efficient and have lower costs
compared with less productive networks (controlling for its operating environments and
the prices it pays for its inputs).
This report presents results from two types of 'top-down' benchmarking techniques.17
Each technique uses a different method for relating outputs to inputs to measure and
compare TNSP efficiency:
Productivity index numbers (PIN). These techniques use a mathematical index to
determine the relationship between outputs and inputs:
16
Cost efficiency is made up of technical efficiency and allocative efficiency. Technical efficiency is an engineering
concept and means that an input cannot be further reduced to produce the given quantity of output without
increasing the use of another input, Allocative efficiency requires inputs to be used in the proportions that would
minimise cost given prevailing input prices. In simple terms, technical efficiency is about getting to the efficient
frontier while allocative efficiency is about getting to the right point on the frontier. Another type of efficiency,
dynamic efficiency, is achieved when TNSPs are technically and allocatively efficient over time. Measuring cost
efficiency helps us determine efficient prices/revenues for services. Measuring cost efficiency over time provides
an insight into the dynamic efficiency of TNSPs. 17
See Appendix A for detailed descriptions of each technique. Top down techniques measure a network's efficiency
overall, taking into account any synergies and trade-offs that may exists between input components. Alternative
bottom up benchmarking techniques are more resource intensive in that they examine each input component
separately then aggregate them to form a total input. Bottom up techniques do not take into account potential
efficiency trade-offs between input components of a NSP’s operations. This is particularly the case with opex. It is
should be recognised that in some cases, a bottom up assessment can be useful for capex where a discrete
number of projects can be clearly identified. Most regulators overseas use top down economic benchmarking
techniques rather than bottom up benchmarking techniques.

Annual benchmarking report | Electricity transmission network service providers | 2017 15
o Total factor productivity (TFP) relates total inputs to total outputs and
provides a measure of overall productivity growth for a single entity (a
network or the whole industry). It allows total productivity growth rates to be
compared for different periods of time for the one entity. It allows total
productivity growth rates to be compared across networks but does not allow
productivity levels to be compared across networks. It is used to decompose
productivity change into its constituent input and output parts.
o Multilateral total factor productivity (MTFP) relates total inputs to total
outputs and provides a measure of overall network efficiency relative to
other networks. It thus allows total productivity levels to be compared
between networks.18 It is applied to combined time-series, cross-section (or
'panel') data.
o Multilateral partial factor productivity (MPFP) is a partial efficiency measure
which uses the same output specification as MTFP but separately examines
the productivity of opex and capital against total output. It allows partial
productivity levels to be compared between networks.
Partial performance indicators (PPIs). These techniques, also partial efficiency
measures, relate one input to one output (contrasting with the above techniques
that relate one or all inputs to total outputs). PPIs measure the average amount of
an input (such as total cost) used to produce one unit of a given output (such as
total customer numbers, megawatts of maximum electricity demand or kilometres
of circuit line length).
MTFP, as the measure of overall network efficiency, is the primary indicator we use to
measure and compare the relative efficiency of TNSPs for this report. The various
partial efficiency measures (including PFP and PPIs) provide alternative measures of
comparative performance and are used as supporting efficiency indicators.19 Partial
efficiency metrics provide information about a network's relative efficiency at using
specific inputs and so are particularly useful for understanding which components of a
network's production process are more or less efficient compared with other networks.
2.2 What data is used?
The inputs and updated outputs used in the benchmarking techniques for this report
are described in box 2 below. The inputs represent the resources (such as capital and
labour) a TNSP uses to provide electricity services. The outputs represent the
electricity services delivered (such as the line length and how much electricity they
transport).
18
There may be minor differences in MTFP and TFP growth rates for a particular firm due to differences in the
properties of the indices. The Economic Insights Report – Economic Benchmarking Results for the Australian
Energy Regulator’s 2017 TNSP Benchmarking Report, November 2017 contains a description of TFP and MTFP
methodologies. 19
Rankings of networks on MTFP and supporting metrics may differ as they measure different aspects of efficiency.

Annual benchmarking report | Electricity transmission network service providers | 2017 16
Three changes have been made to output specifications as a result of the review of
TNSP benchmarking. These changes have been noted in box 2. No changes were
made to input specifications. Section 2.4 summarises the overall outcomes of the
TNSP benchmarking review including the rationale for the changes. Appendix A
includes references to the review's issues paper, position paper and Economic Insights
report outlining the final changes.
Box 2: Categories of inputs and outputs used in TNSP benchmarking (original output
specifications are also noted)
Outputs (three changes have been made to outputs)
Outputs are measures that represent the services the TNSPs provide. The outputs we use to
measure service provision are:
o Energy throughput (GWh)
o Ratcheted maximum demand (RMD)
o Circuit length (Circuit kms)
o End–user numbers (End User nos) (updated - previously the voltage–weighted
connection numbers output was used)
o (minus) Minutes off–supply/Energy not supplied (ENS) (updated - previously no cap
was placed on the weight applied to reliability, this year a weight based on current
AEMO VCRs capped at a maximum absolute value of 5.5 per cent of gross revenue
has been applied).
Previous TNSP benchmarking used output cost shares to weight outputs apart from reliability
(ENS). Output cost shares for outputs other than reliability were also updated this year.
Inputs (no changes have been made to inputs)
TNSPs use a mix of physical assets and operational spending to deliver services.
Capital stock (assets) include:
o Overhead lines (quantity proxied by overhead MVAkms) (O/H lines)
o Underground cables (quantity proxied by underground MVAkms) (U/G cables)
o Transformers and other capital (quantity proxied by transformer MVA) (Trfs)
Operating expenditure (expenditure TNSPs spend to operate and maintain their assets)
(opex).
Data for each of these input and output categories is provided each year by the TNSPs
in response to economic benchmarking regulatory information notices (EB RINs). The
EB RINs require all TNSPs to provide a consistent set of data which is verified by the
TNSP’s chief executive officer and independently audited. We separately test and
validated the data. The complete data sets for all inputs and outputs from 2006 to
2016, along with the Basis of Preparation provided by each TNSP, are published on
our website.20
20
This dataset is available at: https://www.aer.gov.au/node/483.

Annual benchmarking report | Electricity transmission network service providers | 2017 17
2.3 Network revenue determinations and the role of benchmarking
Under the National Electricity Law (NEL) and the National Electricity Rules (NER or
Rules), the AER regulates the maximum revenue an electricity network can recover
from consumers through their electricity bills. The efficiency benchmarking reported
here informs these regulatory decisions.
2.3.1 The regulatory framework
Network services are ‘natural’ monopolies with little scope in any given location for a
competitor to duplicate the network efficiently. Monopoly businesses do not have an
incentive to set prices at an efficient level because there is no competitive discipline on
their decisions. They do not need to consider how and whether or not rivals will
respond to their prices. Without regulation, the resulting market power would lead to
high prices and probably inefficient investment.
The AER regulates electricity network revenues with the goal of ensuring that
consumers pay no more than necessary for the safe and reliable delivery of electricity
services. Transmission and distribution network revenues are paid by electricity
consumers through their electricity bills. Consequently, AER TNSP revenue
determinations have an impact on electricity networks as well as electricity consumers.
The AER applies incentive-based regulation across all energy networks we regulate—
consistent with the NER. Broadly speaking, incentive regulation is designed to align the
commercial goals of the business to the goals of the NEO.21
The AER determines the revenues that an efficient and prudent business would require
at the start of each five-year regulatory period. The business is then given financial
rewards when it improves its efficiency and spends less than the forecast during the
regulatory period—while maintaining or improving its service standards. If the business
spends less than the forecast it will still earn revenue to cover the total forecast
amount. Hence it can ‘keep the difference’ between the forecast and its actual
expenditure until the end of the regulatory control period. Conversely, if its spending
exceeds the forecast, it must carry the difference itself until the end of the period.
The AER determines network revenues through a ‘propose-respond’ framework
(box 3).22 Network businesses propose the expenditure they believe they need to make
21
The National Electricity Objective, as stated in the National Electricity Law (NEL section 7), is: to promote efficient
investment in, and efficient operation and use of, electricity services for the long term interests of consumers of
electricity with respect to – price, quality, safety, reliability, and security of supply of electricity; and the reliability,
safety and security of the national electricity system. 22
The AER assesses the expenditure proposal in accordance with the Expenditure Forecast Assessment Guideline
which describe the process, techniques and associated data requirements for our approach to setting efficient
expenditure allowances for network businesses, including how the AER assesses a network business’s revenue

Annual benchmarking report | Electricity transmission network service providers | 2017 18
during the regulatory control period to provide safe and reliable electricity and meet
predicted demand. The AER responds to the networks' proposals by assessing, and
where necessary, amending them to reflect ‘efficient’ costs.23
Box 3: Three stages of the revenue determination process
1. Network businesses submit a network expenditure proposal to the AER for a coming
regulatory control period, including forecast costs for each of the building blocks of their network
expenditure (figure 1).24
The proposals include data and information to support the estimates of
needed expenditure.
Figure 1 The building block approach for determining total revenue
2. The AER assesses the proposal against relevant criteria and tests in the NER and using the
assessment methods and tools developed as part of our Better Regulation Guidelines.25
Network efficiency benchmarking is one of these assessment tools (see below).
3. Where a network business’ proposed expenditure for a building block meets the criteria and
tests specified under the NER, the AER accepts the proposal. Where the AER is not satisfied
that the relevant regulatory criteria and tests are met, the AER cannot accept the proposal and
must estimate an amount it believes reasonably reflect the regulatory requirements.
Benchmarking can also inform these AER estimates. The AER must also explain its reasons for
each of its constituent decisions.26
proposal and determines a substitute forecast when required. See: https://www.aer.gov.au/networks-
pipelines/guidelines-schemes-models-reviews/expenditure-forecast-assessment-guideline-2013 23
Efficient costs, broadly defined, are costs that best contribute to the achievement of the National Electricity
Objective (NEO), which is ‘to promote efficient investment in, and efficient operation and use of, electricity services
for the long term interests of consumers of electricity with respect to: price, quality, safety, reliability and security of
supply of electricity; and the reliability, safety and security of the national electricity system’ (see s.7 of the National
Electricity Law). 24
NER Schedule 6A.1 25
Better Regulation Guidelines, see: https://www.aer.gov.au/networks-pipelines/better-regulation 26
NER 6A.14.1 & 6A.14.2
Return on capital (forecast RAB × cost of capital)
Regulatory depreciation (net of indexation to RAB)
Corporate tax (net of imputation credits)
Capex
Operating expenditure
Efficiency benefit sharing scheme (EBSS)
Total
revenue Opex

Annual benchmarking report | Electricity transmission network service providers | 2017 19
An AER determination does not set network expenditures or costs but establishes a
cap on the maximum revenue that a network can recover from its customers during the
regulatory control period. Consequently, a network can decide how best to use this
revenue in providing transmission services and fulfilling their obligations. This provides
an ongoing incentive for networks to operate more efficiently and at 'least cost' to
consumers. It also provides incentives for the network operator to innovate and invest
in response to changes in consumer needs and technology which is consistent with
economic efficiency principles.
2.3.2 The uses of benchmarking
The NER requires the AER to have regard to network benchmarking results when
assessing and amending network capex and opex expenditures and to publish the
results in this annual benchmarking report. 27
The AEMC added these requirements to the NER in 2012 to strengthen the AER's
power to assess and amend network expenditure proposals in response to concerns
(raised by the AER and other industry participants) that restrictions in the rules had
resulted in inefficient increases in network expenditure allowances and higher charges
for consumers. The stated aims of these rule changes were to:
reduce inefficient capital and operational network expenditures so that electricity
consumers would not pay more than necessary for reliable energy supplies
to provide consumers with useful information about the relative performance of their
electricity NSP to help them participate in regulatory determinations and other
interactions with their NSP.28
The AER uses benchmarking in various ways when assessing and amending network
expenditure proposals. We use it to measure the efficiency of network opex, capex and
total expenditures and changes in the efficiency of these expenditures over time. This
gives us an additional source of information on the efficiency of historical network opex
and capex expenditures and the appropriateness of using them in forecasts. We also
use benchmarking to understand the drivers of trends in network efficiency over time
and changes in these trends. As we have done in this year's report, this can help us
understand why network productivity is increasing or decreasing and where best to
target our expenditure reviews.29
The benchmarking results also provide network owners and investors, governments
and electricity consumers with useful information on the relative performance of the
electricity networks they own, invest in, regulate or use. Network owners, managers
27
NER 6A.31(a), 6A.6.6(e)(4) and 6A.6.7(e)(4) 28
AEMC final rule determination 2012, p. viii. 29
AER Explanatory Statement Expenditure Forecast Assessment Guideline November 2013:
https://www.aer.gov.au/system/files/Expenditure%20Forecast%20Assessment%20Guideline%20-
%20Explanatory%20Statement%20-%20FINAL.pdf, p. 78-79

Annual benchmarking report | Electricity transmission network service providers | 2017 20
and investors can use the benchmarking results to better understand the relative
efficiency of network business. This information, in conjunction with the financial
rewards available to businesses under the regulatory framework and business profit
maximising incentives can facilitate reforms to improve network efficiency which can
lead to lower network costs and retail prices.
Benchmarking also provides government policy makers (who set regulatory standards
and obligations for networks) with information about the impacts of regulation on
network costs, productivity and ultimately electricity prices. Additionally, benchmarking
can provide information to measure the success of the regulatory regime over time.
Finally, benchmarking provides consumers with accessible information about the
relative efficiency of the electricity networks they rely on. The breakdown of inputs and
outputs driving network productivity in particular, allow consumers to clearly see what
factors are driving network efficiency and the network cost component of their retail
electricity bills. This helps to inform their participation in our regulatory processes and
broader debates about energy policy and regulation.
2.3.3 Limitations of transmission benchmarking
When undertaking economic benchmarking, it is important to recognise that TNSPs
operate in different environments. Certain factors arising from a TNSP’s operating
environment are beyond its control. These ‘operating environment factors’ (OEFs) may
influence a TNSP’s costs and, therefore, its benchmarking performance. The
benchmarking techniques presented in this report capture key OEFs. For example
MTFP takes into account a TNSP’s assets and its connection, maximum demand and
energy throughput densities. However, not all OEFs can be captured in the models.
Transmission networks have undertaken cost benchmarking for a number of years, but
whole of business benchmarking of electricity transmission networks is relatively new.
Compared to electricity distribution networks there have not been many whole of
business benchmarking studies of transmission networks. MTFP analysis is in its early
stage of development in application to transmission networks. Further, there are only a
few electricity transmission networks within Australia which makes efficiency
comparisons at the aggregate expenditure level difficult.
That being said, we consider that the benchmarking analysis presented in this report is
reasoned and comprehensive. We have collected data on all major inputs and outputs
for transmission businesses, and we consider the dataset used is robust.
2.3.4 Why do we care about network charges?
Consumers pay electricity transmission and distribution network charges through their
retail electricity bills. In total, these charges account for 40 per cent and 55 percent of
what consumers pay (with transmission charges accounting for five to thirteen per cent
of residential bills) (box 4).

Annual benchmarking report | Electricity transmission network service providers | 2017 21
Using benchmarking to inform our decisions in setting efficient TNSP revenue
allowances assists us in ensuring that consumers pay no more than necessary for the
transmission network cost component of their electricity services.
Box 4: Electricity network costs and retail electricity prices
Retail electricity bills cover the costs of generating, transporting and retailing electricity, as well
as various regulatory programs. A typical electricity retail bills (shown in figure 2) includes:
network costs for the transmission and distribution of electricity across poles and wires
(40-55 per cent of a bill) (under the NER, the AER regulates this component of network
charges to cover the efficient costs of building and operating electricity networks and to
provide a commercial return to the network owner on their invested capital)
wholesale costs for generating the electricity and retail costs to cover selling and billing
electricity to retail consumers (40–50 per cent of a bill)
regulatory costs for renewable generation and energy efficiency (such as the renewable
energy target and feed-in tariffs for solar PV installations) (5–15 per cent of a bill).30
Figure 2 Network revenue as a proportion of retail electricity bills, 2016
2.4 AER's 2017 review of transmission benchmarking
The changes to the output model specification introduced in this report (box 2) are the
outcomes from the AER's 2017 review of the TNSP benchmarking models. The review
considered issues raised by industry participants about the specifications of the TNSP
benchmarking models and involved extensive consultation, including:
30
AEMC, 2016 residential electricity price trends, fact sheet.
41% 43%48%
48%
41% 46%45%
10%12%
5%
9%
13% 12%
8%
35%37%
40%
33%
41%
29%
38%
14%
8%
7%
10%
6%
13%
8%
0
5
10
15
20
25
30
35
Queensland NSW Victoria SouthAustralia
Tasmania ACT National
Cent
s p
er k
ilow
att
ho
ur
Wholesale and retail Transmission Distribution Green schemes
Source: AMEC, 2016 residential electricity price trends, final report.

Annual benchmarking report | Electricity transmission network service providers | 2017 22
the release of an issues paper in April 2017
an industry stakeholder roundtable in May 2017 to discuss responses to the issues
paper
the release of a position paper in August prepared by our consultant Economic
Insights (the paper presented our proposed approach to updating output
specifications and was informed by submissions to the issues paper and forum
discussions)
consultation with transmission networks on the draft version of this report.
After considering submissions to the draft of this report and further advice from our
expert consultants at Economic Insights, we are of the view that the revised
specifications proposed in the position paper and applied in the draft benchmarking
report should be adopted. We note that there was general support for the proposed
revisions, apart from the substitution of end–user numbers for the voltage–weighted
number of connections. A summary of our rationale for the changes can be found in
box 5.
Box 5: Rationale for updated TNSP benchmarking output specifications
The outputs used in the economic benchmarking of TNSPs (see box 2) are chosen on the basis
of how well they meet a range of performance standards and other functions, including under
the AER’s criteria for economic benchmarking that:
1) the output aligns with the NEL and NER objectives
2) the output reflects services provided to consumers
3) the output is significant.
The AER has had regard to the submissions of industry participants and the above criteria in
finalising the output changes adopted in this year’s report. The rationale for the changes are
summarised here and in more detail in this year’s Economic Insight report.
The first issue is the appropriateness and measurability of the voltage-weighted entry and exit
connections output as a measure of the scale of transmission output provided by TNSPs. While
voltage-weighted entry and exit connection points is considered to meet the AER’s first and
third criteria, it less satisfactorily meets the second criterion since end-users are not direct
beneficiaries of the services provided at the connection points. There are also issues identifying
the number of connection points on a consistent basis, and whether voltage-weighted
connections appropriately reflect the relative scale of transmission output provided by TNSPs.
These issues prompted consideration of a number of options for this output: continuing to use
the voltage-weighted connection output, change to using TNSP Megavolt Amp (MVA) rating of
connections as a method of weighting, change to using end-user numbers, or exclude this
output altogether.
Jurisdictional end-user numbers was considered superior to the other options because it
satisfied all three criteria, and scored more highly than other outputs for the second criterion.
The data on the number of end-users is also readily available, robust and provides a direct
measure of the scale and complexity of the transmission services. While many of the outputs
provided by TNSPs are not directly consumed by end-users, end-users are the ultimate
beneficiaries of transmission services and ultimately bear the related costs. Jurisdictional end-
user numbers was therefore substituted for voltage-weighted connections.

Annual benchmarking report | Electricity transmission network service providers | 2017 23
The second issue relates to the weights assigned to network outages for the reliability output
measure. The reliability output measure is a ‘negative’ output since it corresponds to network
outages and energy not supplied (ENS). Network outages are low probability but high
consequence events. The weight applied to ENS is currently based on the Australian Energy
Market Operator’s (AEMO) jurisdictional values of customer reliability (VCR), which are
estimates of a customer’s willingness to pay for a reliable supply of electricity. However, issues
were raised that the weight applied to network outages is too large. As a result, an outage event
may dominate all other outputs such that the MTFP result may therefore not be representative
of a TNSP’s underlying productivity.
Two options were considered, both of which cap the impact of outages on the productivity of
TNSPs. The first option was to cap the value of reliability as a share of gross revenue to 5.5 per
cent, since there was a 95 per cent chance that outage events result in a reliability share of
revenue that is less than 5.5 per cent. When the cap binds, the original volume of ENS is
retained but the price of ENS falls below the AEMO jurisdictional VCR. The second option was
to maintain the AEMO jurisdictional VCR for all outage events, but cap the volume of ENS such
that the impact of outages on the reliability share of revenue is no greater than 5.5 per cent.
The first option was considered a more appropriate output reliability measure as it provides a
better balance of limiting the anomalous influence of extreme outages on TNSP productivity –
by reducing the price of outages when the cap is exceeded – with the high consequence of an
outage on output and productivity. In regard to the latter, the first option records more of the
downturn in productivity as a result of an outage compared to the second option because the
original volume of ENS is not capped in the former.
An update of the output-cost share weights for non-reliability outputs was also considered
necessary given the change to the output specification. Translog cost function estimates of
weights were replaced with estimates obtained from the Leontief cost function using the latest
data set. Compared to the translog estimates, the Leontief estimates are more plausible, stable
and are consistent with the index number method component of economic benchmarking of
DNSPs.
A more detailed description of the updated TNSP benchmarking specifications,
stakeholder comments and our rationale for the changes can be found in the TNSP
Benchmarking Review documents listed in appendix A and available online.31
31
See Annual Benchmarking Report 2017 at: https://www.aer.gov.au/networks-pipelines/guidelines-schemes-
models-reviews/annual-benchmarking-report-2017/initiation

Annual benchmarking report | Electricity transmission network service providers | 2017 24
3 Benchmarking results
Key points
Industry-wide productivity, as measured by total factor productivity (TFP), decreased by 2.7
per cent over 2016.32
This is the third consecutive year of declining TNSP productivity - TFP
decreased by 2.9 percent over 2014 and 2.2 per cent over 2015.
The primary factors driving the decrease in TNSP productivity over 2016 were:
o a decrease in network reliability (energy not supplied (ENS))
o growth in capital inputs (transformers and overhead lines)
o growth in opex spending.
Powerlink was the only network to record an increase in multilateral factor productivity
(MTFP) over 2016 of two per cent. The other four TNSPs saw declines in MTFP with
Electranet and TransGrid recording the largest falls of nine and five percent respectively.
TasNetwork and AusNet Services are the highest ranking TNSPs by MTFP score over
2016. ElectraNet is ranked mid-range while TransGrid and Powerlink ranked lowest by
MTFP score over 2016.
For the first time, this year’s report includes analysis of the benchmarking data over the
longer term to provide more information on how changes to network inputs and outputs
drive their productivity results. This analysis shows that industry level TNSP productivity
(TFP) declined at an average annual rate of 2.1 per cent over 2006-16 and that the key
drivers of this decline were:
o growth in capital inputs (transformer inputs grew at an average annual rate of 3.7
per cent over the 11 years while overhead lines grew at 2.0 per cent annually)
o growth in opex spending (which increased at an average annual rate of 1.1 percent)
o a decrease in reliability as measured by energy not supplied (ENS).
A full set of this analysis for each TNSP can be found in the Economic Insights Report on
the AER's benchmarking website.
3.1 The productivity results
This chapter presents the TFP results at the industry level and MTFP results for
individual TNSPs for the period 2006 to 2016 and for the 12 month reporting period of
2016. Note that percentage changes in TFP or MTFP over 2016 refer to the
percentage change in TFP/MTFP scores between the calendar years 2015 and 2016.
In this report, this can be referred to as a 'change over 2016' or 'a change over 2015-
16'.
32
The 2.7 per cent decrease in TFP over 2016 refers to the percentage change in productivity scores between the
calendar years 2015 and 2016. In this report, this change can be referred to as 'a change over 2016' or 'a change
over 2015-16'.

Annual benchmarking report | Electricity transmission network service providers | 2017 25
Industry-level and individual TNSP results are reported using the original and updated
output specifications.
MTFP is the primary technique we use to measure the relative productivity and
efficiency of TNSPs under the NER reporting requirement. TFP results are primarily
used to measure the change in productivity of an individual TNSP and the whole
industry over time, and to decompose changes in productivity into its constituent input
and output drivers.33
Results from the full set of supplementary productivity measures, including multilateral
partial factor productivity (MPFP) and the partial performance indicators (PPIs) can be
found in appendix C.
Links to the full benchmarking results for each TNSP can be found in Appendix A and
online at the AER's benchmarking report webpage.
3.1.1 Industry TFP results
Industry-wide transmission network productivity, as measured by total factor
productivity (TFP), continued to decline over 2016 decreasing by 2.7 per cent (Figure
3). This is the third consecutive year of declining TNSP productivity - TFP decreased
by 2.9 percent over 2014 and 2.2 per cent over 2015. It is also a faster rate of decline
than the long term industry rate of a 2.1 per cent average annual decrease over 2006-
16.
Figure 3 Industry input, output and productivity indices, 2006 to 2016
33
There may be small differences between MTFP and TFP rates of change due to difference between the two
methodologies. Appendix A of the 2017 Economic Insights Report contains an explanation for these differences.
0.6
0.8
1.0
1.2
1.4
2006 2007 2008 2009 2010 2011 2012 2013 2014 2015 2016
Index
Input
TFP
Output
Output (old specification)
TFP (old specification)

Annual benchmarking report | Electricity transmission network service providers | 2017 26
This long term decline in TNSP productivity is due to total inputs growing faster than
total outputs. Inputs increased by 29 per cent from 2006 to 2016 while outputs grew by
just 5 per cent, resulting in19 per cent decline in industry-level TFP over the period.
There are noticeable differences in output and TFP growth rates between the original
and the new output specifications (Figure 3). Growth in outputs over 2006 to 2016
decreases from an average annual rate of 0.8 per cent under the original specifications
to an average annual rate of 0.5 per cent under the new model. As productivity is a
function of outputs divided by inputs (and the rate of growth in inputs is unchanged
under the new specifications)34, the rate of decline in industry TFP increases from an
average annual rate of -1.8 per cent over 2006-16 under the old specifications to an
average annual decline of -2.1 per cent under the new output specifications.
Total outputs
The four main factors contributing to total outputs under the new specifications are end
user numbers (previously voltage–weighted connection points under the original
specifications), ratcheted maximum demand, circuit length and energy consumption
(Figure 4). The connections points output used in the original output specifications
(now replaced with end user numbers) is also shown.
Figure 4 Factors contributing to total outputs, with connection points
(old specification) and end-user numbers (new specification), 2006-2016
34
The rate of change in inputs is unchanged as no changes were made to input specification.
0.9
1.0
1.1
1.2
1.3
2006 2007 2008 2009 2010 2011 2012 2013 2014 2015 2016
Index
End-User Nos
Energy
Maximum Demand
Circuit Length
Ratcheted Maximum Demand
Total Output
Connection points (old specifications)

Annual benchmarking report | Electricity transmission network service providers | 2017 27
End user numbers have grown at a steady rate over the 2006-2016 period, up 14 per
cent. This contrasts with the connection points numbers used in the old specifications,
which grew very strongly from 2006 to 2014, with surges in growth in 2008-09 and
2012-13, but has levelled off since 2013. Overall, connection point numbers increased
by 27 per cent between 2006 and 2016, almost double the growth in end user
numbers.
Circuit length also increased over the period, with an overall increase of 9 per cent, but
growth was relatively flat between 2011-12 and 2014-16. While maximum demand
grew strongly from 2006 to 2009, it flattened off between 2009-11, then fell
substantially between 2011-15 before an increase in 2016. This resulted in a strong
initial growth in ratcheted maximum demand from 2006 to 2009 and then a levelling off
from 2011 to 2016. Overall, ratcheted maximum demand increased 12 per cent.
Energy supply fluctuated, but overall changed little between 2006 and 2010. It then fell
markedly between 2010 and 2014, down 9 per cent. This more or less offset the
growth in end user numbers and circuit length from 2010 to 2014, reflected in the flat
total output over this period. The increase in energy supply in 2014-15 coincided with a
levelling off of circuit length, keeping total output flat. However, total output was
dragged down in 2015-16, by energy supply again turning down but circuit length
remaining flat.
Energy not supplied (ENS - a measure of reliability), which is not shown in the figure
above, has a negative contribution to total output. The marked decline in total output in
2008-09 was the result of a very sharp (6-fold) increase in ENS that year, it then
settled back (explaining the strong recovery in total output in 2009-10) and remained
relatively stable to 2014 before increasing substantially in both 2015 and 2016.
There are two primary explanations for differences in output and TFP growth rates
between the original and the new specifications. The first is the substitution of end-user
numbers for voltage-weighted connection numbers in the new specification (figure 4).
The second is the updating of weights for outputs (other than ENS). The influence of
these changes on TFP and output growth can be observed in Figure 3.
The slower growth rate of total output can be explained by the replacement of one
output component with another that has increased at a slower rate from 2006 to 2016.
The voltage-weighted connection points under the original specification have increased
by 27 per cent over the period 2006 to 2016. This increase exceeds that of all other
outputs and is almost twice the increase in end-user numbers (14 per cent) under the
new specification. Therefore, the substitution of end-user numbers for voltage-
weighted connection numbers results in a decline in the growth rate of total output and
TFP.
The slower growth rate of total output can also be explained by the updated weights for
outputs (other than ENS). Energy and Ratcheted Maximum Demand receive largely
similar weights under the original and new specifications. However, there is more
weight on circuit length output compared to the original specification. The redistribution
of weight toward circuit length reduces total output's growth because the increase in

Annual benchmarking report | Electricity transmission network service providers | 2017 28
circuit length is less than the increase in end-user numbers and voltage-weighted
connection numbers. The overall result is that the rate of TFP decline is somewhat
greater under the new specification.
Total Inputs
The main factors contributing to total inputs are operational expenditure (opex),
transformers, overhead lines and underground cables (Figure 5). No changes have
been made to input specifications as a result of the TNSP Benchmarking Review.
Opex has fluctuated over the past 11 years, but overall has experienced only moderate
growth of 12 per cent. The strongest growth in opex was 2013-14, up 8 per cent, with
further modest growth (of 3 per cent) between 2014 and 2016. Transformers have had
the greatest influence over total input growth over the period, increasing by 45 per cent
between 2006 and 2016. Transformer inputs increased sharply between 2008-10, up
20 per cent, and have subsequently grown a further 14 per cent from 2010 to 2016.
Overhead lines increased at a relatively steady rate over the period, up 22 per cent.
Underground cables experienced the largest increase over the period, up over 80 per
cent, due to surges in growth in 2011-12 (up 26 per cent) and 2014-15 (up 39 per
cent). However, underground cables represent a very small proportion of the overall
network, so their influence on total inputs is relatively minor.
Figure 5 Factors contributing to total inputs, 2006-2016
3.1.2 MTFP results by TNSP
The MTFP index for each TNSP over the 2006 to 2016 period is shown in Figure 6.
Over 2016, four of the five networks experienced a decline in productivity, with the
0.9
1.0
1.1
1.2
1.3
1.4
1.5
1.6
1.7
1.8
1.9
2006 2007 2008 2009 2010 2011 2012 2013 2014 2015 2016
Index
Opex
Underground Cables
Transformers
Total Input
Overhead Lines

Annual benchmarking report | Electricity transmission network service providers | 2017 29
largest decreases by ElectraNet (9 per cent) and TransGrid (5 per cent). Powerlink
experienced an increase in productivity over 2016, up 2 per cent.
Despite some volatility, the productivity of TransGrid, ElectraNet and Powerlink have
steadily decreased over the 2006-2016 period, down 28 per cent, 25 per cent and 18
per cent respectively. In comparison, the productivity of AusNet Services has not
changed significantly between the start and the end of the eleven years, with
TasNetworks up 4 per cent and AusNet Services at about the same level.
Figure 6 MTFP index by TNSP, 2006-2016
Figure 7 shows the MTFP index for each TNSP over 2006 to 2016 under the original
output specifications to make transparent the impact of the changes.
Figure 7 MTFP index by TNSP, 2006-2016, original specifications
0.0
0.2
0.4
0.6
0.8
1.0
1.2
1.4
2006 2007 2008 2009 2010 2011 2012 2013 2014 2015 2016
ENT
TNT
ANT
TRG
PLK
Index
0.0
0.2
0.4
0.6
0.8
1.0
1.2
1.4
2006 2007 2008 2009 2010 2011 2012 2013 2014 2015 2016
TNT
ENT
TRG
PLK
ANT
Index

Annual benchmarking report | Electricity transmission network service providers | 2017 30
Figure 7 shows greater dispersion of MTFP levels across TNSPs compared with MTFP
results in Figure 6. In particular, the MTFP level of TNT appears to be that of an outlier
– its MTFP level is consistently well above that of other TNSPs from 2006 to 2016. The
large downward spike of ANT's MTFP level over 2009 is noteworthy under the original
output specification, reflecting the uncapped increase in ENS as a result of a
transformer failure that year at the South Morang Terminal Station.
3.1.3 Relative performance of TNSPs over 2016
The relative ranking of each TNSP according to its 2015 and 2016 MTFP scores is
shown Table 2. Overall, despite significant movement in some TNSP productivity
scores the rankings of the five networks are unchanged in 2016.
Powerlink was the only TNSP to record an increase in MTFP over 2016 of 2 per cent.
However, it continues to be the lowest ranked transmission network in terms of its
MTFP score. The other four TNSPs saw declines in their MTFP scores with Electranet
and TransGrid recording the largest falls of 9 per cent and 5 percent respectively.
The rankings in Table 2 are only indicative of relative performance. The benchmarking
of transmission networks is relatively new. As a result, and because our models cannot
directly incorporate all relevant operating environment factors, the comparison of
productivity levels between TNSPs should be treated with caution.
Table 2 TNSP MTFP scores and rankings and changes, 2015 and 2016
TNSP Rank
(2016)
Rank
(2015)
MTFP
Score
(2016)
MTFP
Score
(2015)
% change
between
2015-16
TasNetwork 1 1 0.92 0.95 -3%
AusNet Services 2 2 0.83 0.83 -1%
ElectraNet 3 3 0.75 0.83 -9%
TransGrid 4 4 0.72 0.75 -5%
Powerlink 5 5 0.71 0.70 +2%
Note: 1. All scores are calculated using the updated output specifications and are calibrated relative to the 2006
ElectraNet score which is set equal to one.
2. There may be small differences between MTFP and TFP rates of change for a given firm due to
difference between the two methodologies. Appendix A of the 2017 Economic Insights Report contains an
explanation for these differences.

Annual benchmarking report | Electricity transmission network service providers | 2017 31
3.2 Interpreting the productivity results
This section describes some of the key drivers of changes to TNSP productivity (as
measured by TFP). We do this by describing the contribution network inputs and
outputs make to observed changes in TFP at the industry and individual TNSP level
over 2006 to 2016.
Calculating input and output contributions to changes in TFP
To calculate the contribution each input and output makes to a given change in TFP
requires us to consider the quantity change in each of the five outputs and four inputs
used in our TNSP benchmarking as well as the weights placed on each in forming the
total output and total input indexes (box 2). Appendix A includes a link to the
methodology that allows us to decompose a given productivity change into its input
and output components.
This is the first time Economic Insights has calculated input and output contributions to
TFP changes for use in the benchmarking report. This type of analysis is valuable
because it allows us to identify productivity trends and see more clearly what is driving
these trends and breaks in trends over time. The analysis has been done for the
industry as a whole and at the individual TNSP level. The full set of analyses can be
found in the Economic Insights TNSP report and related spread sheets online. This
chapter presents only the key findings on the input and output changes driving TFP.
3.2.1 Input and output drivers of industry TFP
To understand the drivers of the decline in TFP over 2006 to 2016, we decomposed
the change in TFP over this period into its input and output contributions. The results
are summarised in figure 8 below.
Figure 8 TNSP output and input percentage point contributions to
average annual TFP change, 2006–2016
-2.4%
-2.0%
-1.6%
-1.2%
-0.8%
-0.4%
0.0%
0.4%
0.8%
Circuit
kms
End-User
Nos
RMD GWh U/G
Cables
ENS Opex O/H
Lines
Trf TFP

Annual benchmarking report | Electricity transmission network service providers | 2017 32
Figure 8 presents the percentage point contributions of each output and each input
(the red bars) to the average annual rate of TFP change over 2006-16 (the yellow bar).
Over the eleven year period, TFP declined at an average annual rate of –2.1 per cent.
The contributions of each output and input to this average annual change in TFP
appear from the most positive on the left to most negative on the right. If all the positive
and negative contributions in figure 8 are added together, the sum will equal the TFP
change of -2.1 percent.
The results show that between 2006 and 2016, the largest contributing factors to the
decline in TFP were:
growth in capital inputs (transformer inputs grew at an average annual rate of 3.7
per cent contributing -1.5 percentage points (ppts) to the negative TFP growth rate
while overhead lines grew at an average annual rate of 2.0 percent contributed -0.6
ppts to the annual change in TFP)
growth in opex spending (which increased at an average annual rate of 1.1 percent
over the 11 years contributing -0.3 ppts to the change in TFP)
a decrease in reliability as measured by energy not supplied (ENS) which
contributed -0.3 ppts to the average annual rate of decline in TFP.
Growth in some outputs between 2006 and 2016 partly offset these negative
contributions, including:
an average annual 0.8 per cent increase in circuit lengths (adding 0.3 ppts to the
TFP growth rate)
a steady average annual 1.3 percent increase in customer numbers (adding 0.3
ppts)
1.1 per cent average annual growth in ratcheted maximum demand (RMD) (adding
0.2 ppts) (although RMD growth flattened after 2011).
Energy throughput (GWh) peaked in 2010 and fell to 2015, rising again in the last
12 months. Over the whole 11 year period energy output decreased at an average
annual rate of -0.2 per cent (adding a marginal -0.04 ppts from the TFP rate of
decline).35
Over the most recent 12 month period of 2015-16, the decline in industry-wide TNSP productivity accelerated with TFP decreasing by 2.7 per cent (compared with the 11 year average rate of 2.1 percent). The input and output drivers of the 2.7 percent decrease in TFP are presented in Figure 9 below.
35
The complete analysis of the input and output drivers of TNSP productivity at the industry and individual level,
including breakdowns over 2006-12 and 2012-16 can be found discussion in the Economic Insights report and
associated spreadsheets online.

Annual benchmarking report | Electricity transmission network service providers | 2017 33
Figure 9 TNSP output and input percentage point contributions to
average annual TFP change, 2015–16
The primary driver of the accelerated decline over 2015-16 was lower reliability (growth
in the ENS output contributed -1.4 ppts to the TFP rate). In line with the long term
trend, growth in capital inputs (transformers and overhead lines) made negative
contributions of -0.5 ppts each and growth in opex contributed -0.4 ppts to the TFP
growth rate.
Compared with the long term trends growth in TNSP circuit length and RMD over the
last 12 months made marginal positive contributions to the TFP growth rate while
energy throughput (GWh) made a larger negative contribution (contributing -0.2 ppts
to the rate of decline in TFP).
3.2.2 Drivers of individual TNSP productivity
This report also undertook analysis of individual TNSP data to determine the key input
and output drivers of their productivity results.
Table 3 compares each TNSPs' average annual TFP growth rates over 2006-16 and
from 2015 to 2016 with industry-wide TFP growth rates over the same periods. It also
shows the contributions made by four inputs and outputs to these TFP growth rates.
We chose to focus on three inputs (transformer, overhead lines and opex) and one
output (reliability - energy not supplied) after a review of the complete results for all
TNSPs showed that these were the four largest negative contributors to the industry-
wide decline in TFP over 2006-16. The full set of input and output results can be found
in the Economics Insights report online.
A review of the data in table 3 shows that three TNSPs experienced greater than
industry-wide declines in their TFP over 2006-16, including TransGrid (a - 3.1 percent
average annual decrease), ElectraNet (-2.5 per cent) and PowerLink (-2.4 per cent).
-3.0%
-2.5%
-2.0%
-1.5%
-1.0%
-0.5%
0.0%
0.5%
End-UserNos
Circuitkms
U/GCables
RMD GWh Opex O/HLines
Trf ENS TFP

Annual benchmarking report | Electricity transmission network service providers | 2017 34
Table 3: Input and output contributions to TFP growth rates, by TNSP, 2006-2016
2006-2016 2015 to 2016
Av annual
change in
TFP
(%)
Transformer
contribution
to TFP
(ppts)
Overhead
lines
contribution
to TFP
(ppts)
Opex
contribution
to TFP
(ppts)
Energy not
supplied
(ENS)
contribution
(ppts)
Av annual
change in
TFP
(%)
Transformer
contribution
to TFP
(ppts)
Overhead
lines
contribution
to TFP
(ppts)
Opex
contribution
to TFP
(ppts)
Energy not
supplied
(ENS)
contribution
(ppts)
Industry -2.1 -1.5 -0.6 -0.3 -0.3 -2.7 -0.5 -0.5 -0.4 -1.4
AusNet
(Vic)
0.3 -0.5 0.0 -0.1 -1.0 -1.1 0.3 0.3 -0.8 -2.0
ElectraNet
(SA)
-2.5 -1.1 -0.1 -0.7 -0.8 -7.8 -1.1 0.0 -1.4 -8.3
PowerLink
(QLD)
-2.4 -2.1 -1.1 -0.8 0.3 -0.1 -1.4 0.4 -0.3 1.4
TasNetworks
(Tas)
-0.1 -1.2 -0.3 0.6 0.5 -3.6 -0.1 0.0 -1.4 0.4
TransGrid
(NSW)
-3.1 -1.8 -0.8 0.0 -0.6 -3.7 0.0 -1.6 0.3 -2.0
Notes: Results use the new benchmarking model specification adopted in this year's report. The three inputs and one output used in the table were chosen as they were the four largest negative
contributors to the average annual TFP growth rate of - 2.1 per cent over 2006-16. TFP results for an individual TNSP here can differ from MTFP results in table 1 as the two measures are based
on different statistical techniques. Appendix A of the 2017 Economic Insights Report contains an explanation for these differences. In this report MTFP results are primarily used to measure the
relative productivity performance of TNSPs while TFP results are primarily used to measure the change in productivity over time at the industry level or for a given TNSP and to decompose
changes in productivity into its constituent input and output drivers.
Annual benchmarking report | Electricity transmission network service providers | 2017 35
For TransGrid and PowerLink the largest negative contributor to their TFP decline was
growth in transformer inputs (contributing -1.8 ppts and -2.1 ppts respectively over the
11 years). The second largest negative contributors for both TNSPs were growth in
overhead powerlines (-0.8 and -1.1 ppts respectively). A decline in reliability (ENS) for
TransGrid over the period subtracted a further 0.6 ppts from its TFP growth rate, while
growth in PowerLink's opex subtracted a further 0.8 ppts from their TFP growth rate
over the period.
For ElectraNet, the primary drivers of its 2.5 per cent average annual decline in TFP
over 2006-16 were growth in transformers (subtracting 1.1 ppts from their TFP growth
rate), a decrease in the ENS reliability measure (subtracting 0.8 ppts) and growth in
opex (subtracting 0.7 ppts).
AusNet experienced the best TFP growth rate over 2006-16 of a 0.3 percent average
annual increase in TFP. While its ENS reliability output measure subtracted 1.0 ppts
from their TFP growth rate over the period (the largest negative ENS contribution of all
TNSPs over the period), growth in transformer, overhead lines and opex inputs were
all well below industry-wide results (subtracting -0.5, 0.0 and -0.1 ppts from AusNets
TFP growth rate over the period).
Between 2015 and 2016, all TNSPs (other than PowerLink) experienced higher rates
of decline in TFP compared to their long term averages. For ElectrNet, TransGrid and
AusNet the accelerated decline in TFP was primarily driven by negative contributions
from their ENS reliability outputs (of -8.3, -2.0 and -2.0 ppts respectively from 2015 to
2016). ElectraNet and TasNetworks also saw relatively large negative contributions to
TFP from growth in their opex from 2015 to 2016 (of -1.4 ppts each).
The full input-output analysis for each TNSPs is available in the Economic Insights
report and related spreadsheets on line.
Annual benchmarking report | Electricity transmission network service providers | 2017 36
A References and further reading
This benchmarking report is informed by several sources.
Economic Insights publications
The following publications explain in detail how Economic Insights developed and
applied the economic benchmarking techniques we used:
Economic Insights Report – Economic Benchmarking Results for the Australian
Energy Regulator’s 2017 TNSP Benchmarking Report, November 2017 (link)
Economic Insights, Memorandum – TNSP MTFP Results, November 2016 (link).
Economic Insights, Memorandum – TNSP MTFP Results, November 2015 (link).
Economic Insights, Economic Benchmarking Assessment of Operating Expenditure
for NSW and Tasmanian Electricity TNSPs, 10 November 2014 (link).
Economic Insights, AER Response to HoustonKemp for TransGrid determination, 4
March 2015 (link)
Economic Insights, Economic Benchmarking of Electricity Network Service
Providers, 25 June 2013 (link).
AER 2017 TNSP Benchmarking Review
All documents related to the AER's 2017 TNSP Benchmarking Review can be found
on line at: https://www.aer.gov.au/networks-pipelines/guidelines-schemes-models-
reviews/annual-benchmarking-report-2017/initiation.
ACCC/AER publications
These publications provide a comprehensive overview of the benchmarking
approaches used by overseas regulators:
ACCC/AER, Benchmarking Opex and Capex in Energy Networks – Working Paper
no. 6, May 2012 (link).
ACCC/AER, Regulatory Practices in Other Countries – Benchmarking opex and
capex in energy networks, May 2012 (link).
WIK Consult, Cost Benchmarking in Energy Regulation in European Countries,
December 2011 (link).
AER transmission determinations
The AER uses economic benchmarking to inform its regulatory determination
decisions. A full list of these decisions to date can be found on the AER's website:
https://www.aer.gov.au/networks-pipelines/determinations-access-arrangements
Annual benchmarking report | Electricity transmission network service providers | 2017 37
B Inputs and outputs
This appendix contains further information about the inputs and outputs used in the
benchmarking techniques. The November 2014 and 2017 Economic Insights reports
referenced in Appendix A explain and justify the input and output specifications used in
this report.
B.1 Outputs
Outputs are measures that represent the services the TNSPs provide. TNSPs exist to
provide customers with access to a safe and reliable supply of electricity. The outputs
we use are outlined in this section.
B.1.1 Line length
Line length reflects the distances over which TNSPs deliver electricity to downstream
users from generators, which are typically over thousands of kilometres. We measure
line length in terms of circuit line length. This is the length in kilometres of lines,
measured as the length of each circuit span between poles and/or towers and
underground. This represents the distance over which transmission networks are
required to transport electricity.
We use circuit length because, in addition to measuring network size, it also
approximates the line length dimension of system capacity. System capacity
represents the amount of network a TNSP must install and maintain to supply DNSPs
who in turn supply consumers with the quantity of electricity demanded at the places
where they are located. Figure B.1 shows each TNSP’s circuit length, on average, over
the five years from 2012 to 2016.
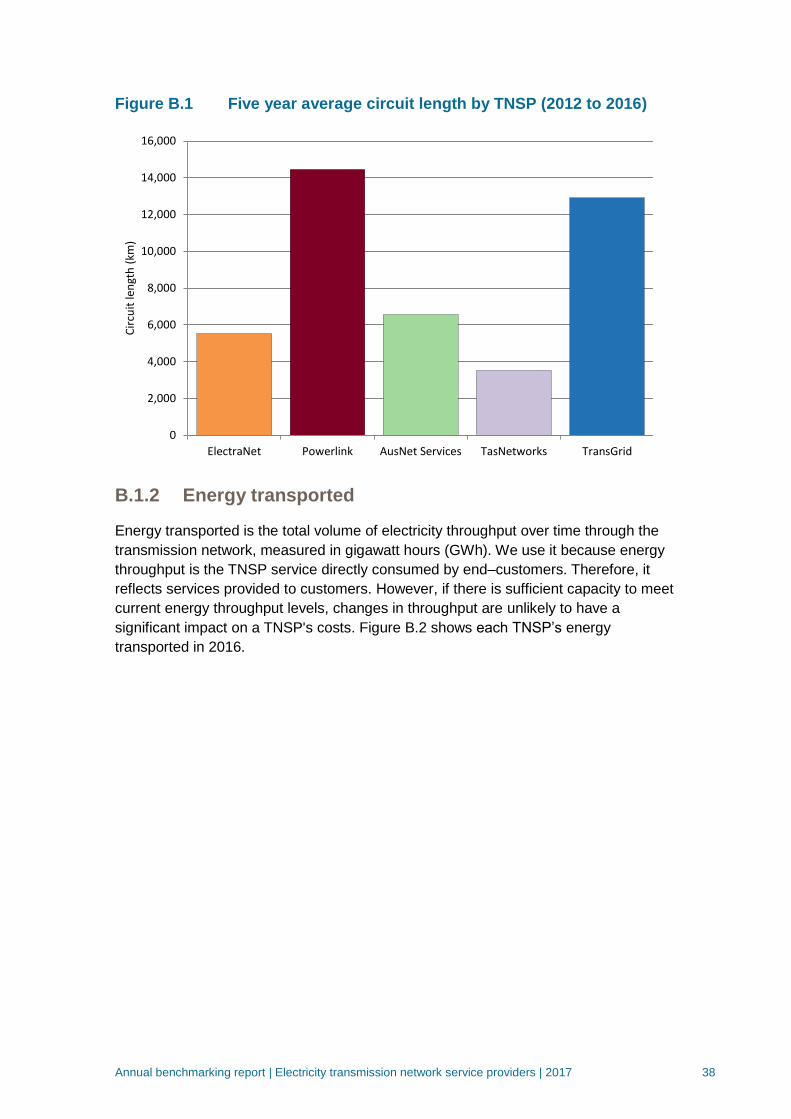
Annual benchmarking report | Electricity transmission network service providers | 2017 38
Figure B.1 Five year average circuit length by TNSP (2012 to 2016)
B.1.2 Energy transported
Energy transported is the total volume of electricity throughput over time through the
transmission network, measured in gigawatt hours (GWh). We use it because energy
throughput is the TNSP service directly consumed by end–customers. Therefore, it
reflects services provided to customers. However, if there is sufficient capacity to meet
current energy throughput levels, changes in throughput are unlikely to have a
significant impact on a TNSP's costs. Figure B.2 shows each TNSP’s energy
transported in 2016.
0
2,000
4,000
6,000
8,000
10,000
12,000
14,000
16,000
ElectraNet Powerlink AusNet Services TasNetworks TransGrid
Cir
cuit
len
gth
(km
)

Annual benchmarking report | Electricity transmission network service providers | 2017 39
Figure B.2 Energy transported in 2016 (GWh)
B.1.3 Maximum demand
TNSPs are required to meet and manage the demand of their customers. This means
they must build and operate their networks with sufficient capacity to meet the
expected peak demand for electricity. Maximum demand is a measure of the overall
peak in demand experienced by the network. The maximum demand measure we use
is non-coincident summated raw system annual maximum demand, at the transmission
connection point.
The economic benchmarking techniques use 'ratcheted' maximum demand as an
output rather than observed maximum demand. Ratcheted maximum demand is the
highest value of peak demand observed in the time period up to the year in question
for each TNSP. It recognises capacity that has been used to satisfy demand and gives
the TNSP credit for this capacity in subsequent years, even though annual maximum
demand may be lower in subsequent years. Figure B.3 shows each TNSP’s maximum
demand in 2016.
For the PPI analysis we used the annual maximum demand for each of the
transmission networks not the ratcheted maximum demand.
0
10,000
20,000
30,000
40,000
50,000
60,000
70,000
80,000
ElectraNet Powerlink AusNet Services TasNetworks TransGrid
En
erg
y tr
ansp
ort
ed
(G
Wh
)

Annual benchmarking report | Electricity transmission network service providers | 2017 40
Figure B.3 Maximum demand for 2016 (MVA)
B.1.4 Voltage of entry and exit points (original output)
The number of entry and exit points represents the number of points to which a
transmission network must connect. We use the summation of the total voltage of
transmission node identifiers (TNIs) as the measure of the entry and exit points of the
transmission networks.36 The summation of the voltages of the connection points is
required so that the aggregate measure reflects the differing sizes of TNIs across
transmission networks. Specifically, higher voltage TNIs will typically require more
assets as they will have a higher capacity. Where a single node services multiple
distributors or a distributor and a generator, and hence has multiple TNIs, we have only
counted this node once. B.4 shows each TNSP’s aggregate voltage of entry and exit
points in 2016.
36
AEMO uses transmission node identifiers to calculate transmission losses. See: AEMO, List of NEM regions and
marginal loss factors for the 2014-15 financial year, 5 June 2014, p. 7.
0
2,000
4,000
6,000
8,000
10,000
12,000
14,000
16,000
18,000
20,000
ElectraNet Powerlink AusNet Services TasNetworks TransGrid
Max
imu
m d
eman
d (
MV
A)

Annual benchmarking report | Electricity transmission network service providers | 2017 41
Figure B.4 Aggregate voltage of entry and exit points (kV) for 2016
B.1.5 End User Numbers (new output)
The end users numbers output measures the number of customers TNSPs are
required to service. This is used to represent the demand within the transmission
networks. Specifically, greater the number of end users, the more assets required to
service demand. Figure B.5 presents the number of end users serviced by each of the
TNSPs.
As expected, the size of the network aligns with the population in each state. NSW is
the largest network, with TransGrid servicing over 3.7 million end users in NSW,
followed by Victoria, with AusNet Services servicing over 2.8 million end users.
Tasmania has the smallest network, with TasNetworks servicing around 285,000 end
users.
0
2000
4000
6000
8000
10000
12000
14000
16000
18000
20000
ElectraNet Powerlink AusNet Services TasNetworks TransGrid
Vo
ltag
e o
f en
try/
exit
po
ints
(kV
)
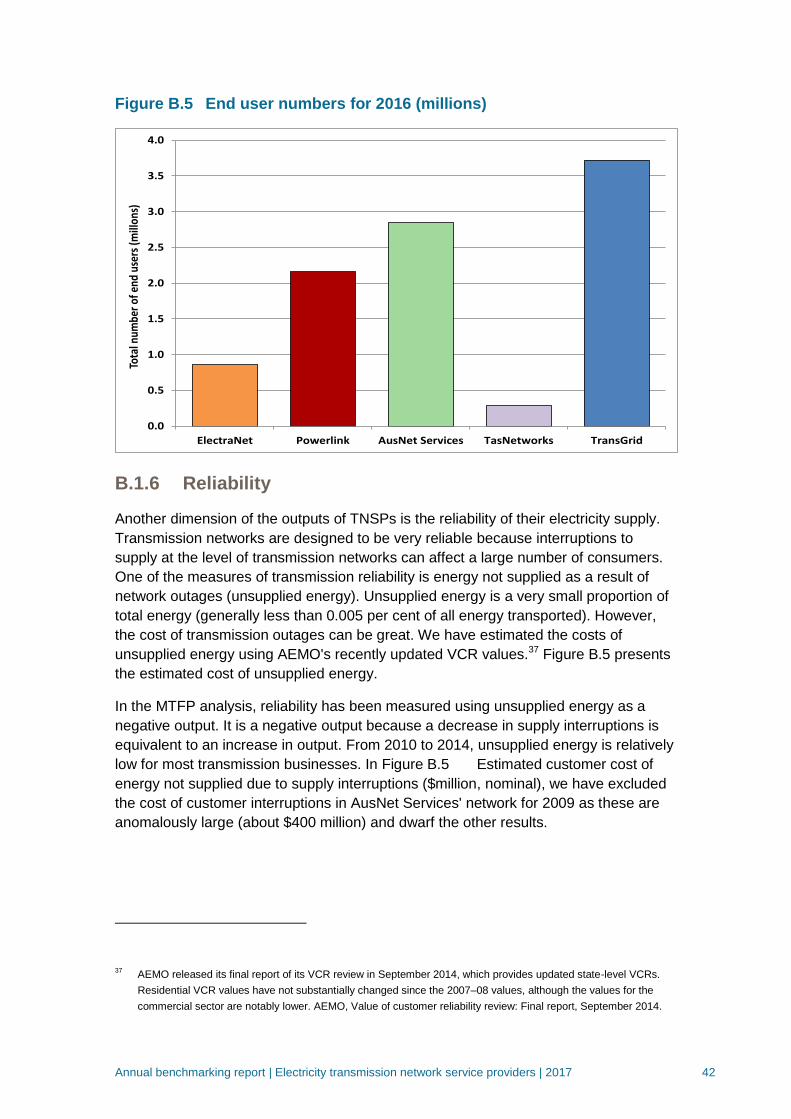
Annual benchmarking report | Electricity transmission network service providers | 2017 42
Figure B.5 End user numbers for 2016 (millions)
B.1.6 Reliability
Another dimension of the outputs of TNSPs is the reliability of their electricity supply.
Transmission networks are designed to be very reliable because interruptions to
supply at the level of transmission networks can affect a large number of consumers.
One of the measures of transmission reliability is energy not supplied as a result of
network outages (unsupplied energy). Unsupplied energy is a very small proportion of
total energy (generally less than 0.005 per cent of all energy transported). However,
the cost of transmission outages can be great. We have estimated the costs of
unsupplied energy using AEMO's recently updated VCR values.37 Figure B.5 presents
the estimated cost of unsupplied energy.
In the MTFP analysis, reliability has been measured using unsupplied energy as a
negative output. It is a negative output because a decrease in supply interruptions is
equivalent to an increase in output. From 2010 to 2014, unsupplied energy is relatively
low for most transmission businesses. In Figure B.5 Estimated customer cost of
energy not supplied due to supply interruptions ($million, nominal), we have excluded
the cost of customer interruptions in AusNet Services' network for 2009 as these are
anomalously large (about $400 million) and dwarf the other results.
37
AEMO released its final report of its VCR review in September 2014, which provides updated state-level VCRs.
Residential VCR values have not substantially changed since the 2007–08 values, although the values for the
commercial sector are notably lower. AEMO, Value of customer reliability review: Final report, September 2014.
0.0
0.5
1.0
1.5
2.0
2.5
3.0
3.5
4.0
ElectraNet Powerlink AusNet Services TasNetworks TransGrid
Tota
l num
ber
of e
nd u
sers
(mill
ons)

Annual benchmarking report | Electricity transmission network service providers | 2017 43
Figure B.5 Estimated customer cost of energy not supplied due to
supply interruptions ($million, nominal)
Note: We excluded the cost of customer interruptions in AusNet Services' network for 2009 as these are
anomalously large (about $400 million) and dwarf the other results.
B.1.7 Total outputs
Table B.1 presents the average network outputs from 2012 to 2016 for TNSPs, with
the exception of reliability.
Table B.1 TNSP outputs 2012-2016 average
Circuit line length
(km)
Energy transported
(GWh)
Maximum demand
(MVA)
Number of end
users
ElectraNet 5,526 14,001 3,702 851,254
Powerlink 14,460 50,757 11,736 2,099,608
AusNet
Services 6,570 48,305 9,507
2,765,085
TasNetworks 3,526 12,716 2,534 281,479
TransGrid 12,917 72,420 17,380 3,626,389
$0
$10
$20
$30
$40
$50
$60
2006 2007 2008 2009 2010 2011 2012 2013 2014 2015 2016
ElectraNet
Powerlink
AusNet Services
TasNetworks
TransGrid
Mil
lio
ns

Annual benchmarking report | Electricity transmission network service providers | 2017 44
B.2 Inputs
The inputs used in this report are assets and opex. TNSPs use a mix of assets and
opex to deliver services. Electricity assets can provide useful service over several
decades. However, benchmarking studies typically focus on a shorter period of time.
The two inputs we use in our MTFP technique are:
Operating expenditure (opex). This is the expenditure TNSPs spend on operating
and maintaining their assets. We use the observed opex spent on prescribed
services.
Capital stock (assets). The physical assets TNSPs use to provide services and
invest in to replace, upgrade or expand their network. We split capital into
overhead lines, underground cables and transformers.
o For our MTFP analysis we use physical measures of capital inputs. Using
physical values for capital inputs has the advantage of best reflecting the
physical depreciation profile of TNSP assets.38
o For the PPIs we use the real value of the regulatory asset base as the proxy
for assets as the starting point in deriving the real cost of using those assets.
Asset cost is the sum of annual depreciation and return on investment.39
This measure has the advantage of reflecting the total cost of assets for
which customers are billed on an annual basis, using the average return on
capital over the period. This accounts for variations in the return on capital
across TNSPs and over time.
Table B.2 presents measures of the cost of network inputs relevant to opex and assets
for all TNSPs. We have presented the average annual network costs over five years in
this table to moderate the effect of any one-off fluctuations in cost.
38
Economic Insights, Memorandum TNSP MTFP Results, July 2014, p. 5. 39
To calculate asset costs relevant to PPIs, MTFP and Capital MPFP, where possible we have applied annual
weighted average cost of capital values calculated in accordance with the AER's approach to setting rate of return
in the most recent determination. See Ausnet Services, Draft Decision Ausnet Services Transmission Decision,
Rate of return factsheet, July 2016. These include a market risk premium of 6.5 per cent, and a risk free rate
based on the yield of ten year CGS (noting we use a 365 day averaging period for each year in the benchmarking
report). For this benchmarking report, we choose to continue to use our the previous approach used in previous
benchmarking reports that use the Bloomberg BBB fair value curve (365 day averaging period) to calculate the
debt risk premium. The AER's present approach averages ten year maturity BBB yields from the RBA and
Bloomberg (appropriately extrapolated out to ten years where necessary). However, historical data going back to
2006 is not available for the RBA curve. Given this, we have continued to rely solely on estimates based on the
Bloomberg fair value curve data. Where relevant, the tax component uses gamma of 0.4.
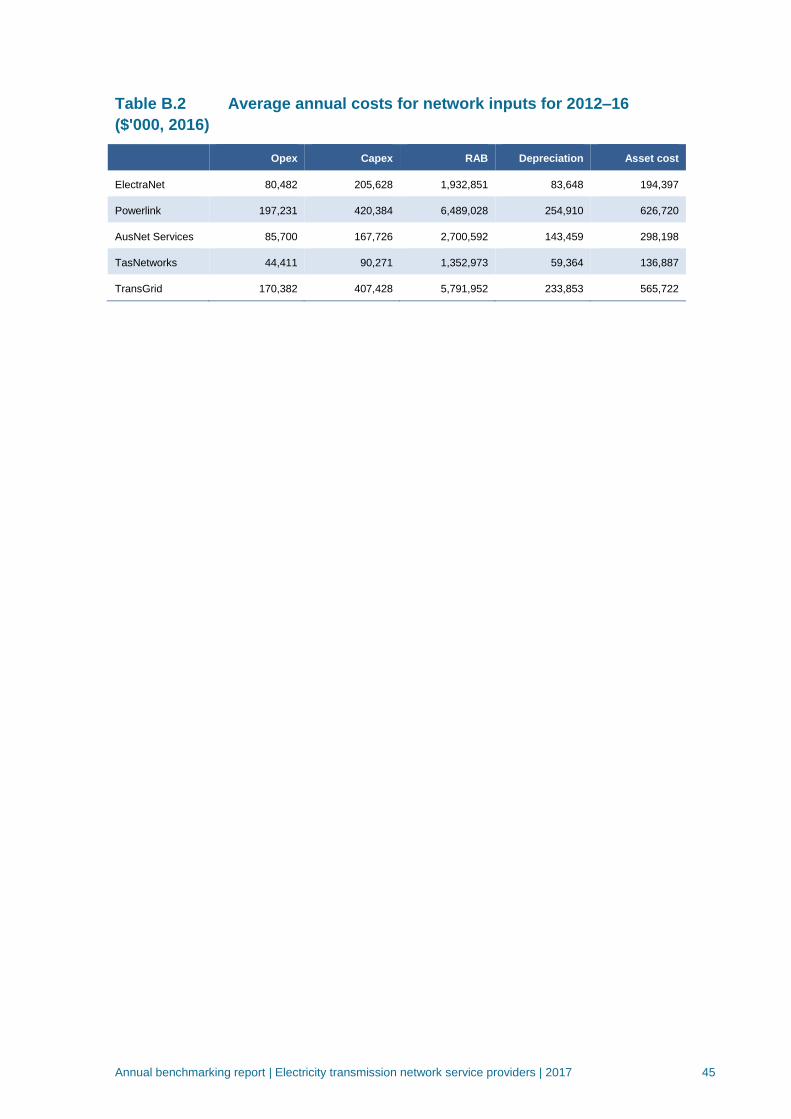
Annual benchmarking report | Electricity transmission network service providers | 2017 45
Table B.2 Average annual costs for network inputs for 2012–16
($'000, 2016)
Opex Capex RAB Depreciation Asset cost
ElectraNet 80,482 205,628 1,932,851 83,648 194,397
Powerlink 197,231 420,384 6,489,028 254,910 626,720
AusNet Services 85,700 167,726 2,700,592 143,459 298,198
TasNetworks 44,411 90,271 1,352,973 59,364 136,887
TransGrid 170,382 407,428 5,791,952 233,853 565,722

Annual benchmarking report | Electricity transmission network service providers | 2017 46
C Results from supporting benchmarking
techniques
A range of supplementary benchmarking techniques are used to assist in interpreting
the multi-lateral total factor productivity (MTFP) results reported in section three.
Supplementary measures reported here include capital and operational expenditure
multilateral partial factor productivity (capital and opex MPFP) and a range of partial
performance indicators (PPIs).
C.1 Multilateral partial factor productivity
The MPFP techniques assist in interpreting the MTFP results by examining the
contribution of capital and operational expenditure to overall productivity in isolation.
This 'partial' approach uses the same output specification as MTFP and provides more
detail on the contribution of the individual components of capital and opex to changes
in productivity.
Capital MPFP considers the productivity of the TNSP’s use of overhead lines,
underground cables and transformers at the same time.
The trend in capital productivity and ranking of the individual TNSPs follows a relatively
similar trend to that of the MTFP (figure C.1).
Figure C.1 Capital multilateral partial factor productivity index, 2006-
2016
0.0
0.2
0.4
0.6
0.8
1.0
1.2
1.4
1.6
2006 2007 2008 2009 2010 2011 2012 2013 2014 2015 2016
TNT
ENT
PLK
TRG
ANT
Index

Annual benchmarking report | Electricity transmission network service providers | 2017 47
Overall, despite some volatility, there has been a general declining trend in capital
productivity of each of the TNSP's since 2006. The exception is AusNet Services
where capital productivity remains around the same level in 2016 as it was in 2006.
Over the past year, capital productivity for Powerlink increased slightly, while AusNet
services remained relatively steady. The other three networks, TasNetworks,
TransGrid and ElectraNet, experienced a decline in capital productivity in 2015-16.
Figure C.2 shows that under the original output specification, there is also a decline in
capital MPFP for most TNSPs from 2006 to 2016. However, there is a considerably
greater divergence between capital MPFP levels across TNSPs. For example, under
the original specification the two smaller TNSPs, TNT and ENT, have capital MPFP
levels that are 72 per cent and 31 per cent, respectively, higher than PLK – which has
the third highest capital MPFP level over the period observed.
Figure C.2 Capital partial factor productivity index, original specification,
2006-2016
The trend in opex MPFP for all TNSPs is presented in Figure C.3.
0.0
0.2
0.4
0.6
0.8
1.0
1.2
1.4
1.6
2006 2007 2008 2009 2010 2011 2012 2013 2014 2015 2016
TNT
ENT
PLK
TRG
ANT
Index

Annual benchmarking report | Electricity transmission network service providers | 2017 48
Figure C.3 Opex multilateral partial factor productivity index, 2006-
2016
While there has been some volatility over the 2006-2016 period, the opex MPFP of
AusNet Services and TransGrid remains at a similar level in 2016 to that in 2006.
Powerlink, despite a solid improvement in opex productivity between 2007 and 2011, is
9 per cent below its 2006 level in 2016 following a marked decline in opex MPFP in
2013-14 and 2014-15. Notwithstanding a notable decline in opex MPFP in 2015-16
(down 8 per cent), TasNetworks improved its opex productivity over the period, up 47
per cent from its 2006 level in 2016. ElectraNet is the only TNSP to experience a
significant decline in opex MPFP over the period, down 11 per cent in 2015-16, with an
overall decline of 26 per cent over the 2006-2016 period.
Figure C.4 shows largely similar relativities in opex MPFP levels under the original
output specification from 2006 to 2016. Particularly noteworthy is TNT's opex MPFP
level which experiences a sharp increase from 2014 to 2015, attaining the highest
MPFP level in 2016. In contrast, under the new output specification, TNT's opex MPFP
level is placed in the middle by 2016. Under the original output specification the
downward spike of ANT's opex MPFP level in 2009 is also accentuated.
0.4
0.6
0.8
1.0
1.2
1.4
1.6
1.8
2006 2007 2008 2009 2010 2011 2012 2013 2014 2015 2016
ANT
TRG
PLK
ENT
TNT
Index

Annual benchmarking report | Electricity transmission network service providers | 2017 49
Figure C.4 Opex multilateral partial factor productivity index, original
specification, 2006-2016
C.2 Partial performance indicators
PPIs provide a simple visual representation of the input costs used to produce
particular outputs. The PPIs we use support the MTFP analysis, providing a general
indication of comparative performance in delivering one type of output. However, PPIs
do not take interrelationships between outputs into account. Therefore, PPIs are most
useful when used in conjunction with other benchmarking techniques (such as MTFP).
The inputs we use are the TNSPs’ total cost made up of opex and the user cost of
assets. The outputs we use are number of end users, circuit line length, maximum
demand served and energy transported. We examine each of these outputs below,
noting that the appropriate measurement of transmission outputs is a matter of ongoing
consideration.
Total cost per of end user
The total cost per end user is presented in Figure C.5. In 2016, AusNet Services
maintains the lowest cost per end user. Conversely, TasNetworks continues to have
the highest cost per end user of all the transmission networks at almost 5 times that of
AusNet Services. Total costs per end users have grown for all TNSPs over the past 11
years, with the strongest growth by Electranet (38 per cent) and Powerlink (37 per
cent).However, these costs changed little from their level in 2015 for all NSPs, except
ElectraNet, with total costs per end user continuing its increasing cost trend, up a
further 4 per cent in over 2016.
0.4
0.6
0.8
1.0
1.2
1.4
1.6
1.8
2006 2007 2008 2009 2010 2011 2012 2013 2014 2015 2016
TRG
ANT
TNT
PLK
ENT
Index

Annual benchmarking report | Electricity transmission network service providers | 2017 50
Figure C.5 Total cost per end user ($2016), 2006-2016
We note this measure potentially favours more dense transmission networks (where
density is measured in terms of end user per circuit km). The more dense transmission
networks tend to have more customers per km and hence are required to maintain
fewer lines per connection point. The average connection density of the transmission
networks over the years 2012 to 2016 is presented in Figure C.6. From this,
TasNetworks has the lowest connection density, whereas AusNet Services has the
highest connection density, which is consistent with their ranking in Figure C.5.
Figure C.6 Connection density (end user per circuit km, 2012–16
average)
$0
$100
$200
$300
$400
$500
$600
$700
$800
2006 2007 2008 2009 2010 2011 2012 2013 2014 2015 2016
Tota
l co
st p
er t
ota
l kV
of
entr
y/ex
it p
oin
ts
ElectraNet
Powerlink
AusNet Services
TasNetworks
TransGrid
0
50
100
150
200
250
300
350
400
450
ElectraNet Powerlink AusNet Services TasNetworks TransGrid
Co
nn
ecti
on
den
sity
(en
d u
ser
per
km
)

Annual benchmarking report | Electricity transmission network service providers | 2017 51
Total cost per km of transmission circuit length
The cost per kilometre of circuit length is shown Figure C.7. TasNetworks has the
lowest cost per kilometre of circuit length in 2016, whereas AusNet Services, Powerlink
and TransGrid have the highest cost per kilometre of circuit length. We note this
measure potentially favours transmission networks with lower connection densities
because they have to service fewer connections per km.
All TNSPs have experienced relatively strong growth in total costs per kilometre of
transmission circuit length between 2006 and 2016.The largest increase in cost per
kilometre of circuit length was by Electranet, followed by Transgrid (36 per cent). The
lowest growth was by TransGrid, but it was still a substantial 22 per cent.
The difference in costs (between the TNSPs with the highest and lowest cost per km)
narrowed over the intervening years, from a peak of $16,300 in 2009, to a low $8,950
in 2013. However, following a sharp decline in costs by TasNetworks in 2014-15 and a
levelling off in 2015-16 (when the costs of all other networks continued to increase),
the gap in total cost per kilometre of transmission circuit length has again widened to
13,450 in 2016.
Figure C.7 Total cost per km of transmission circuit length ($2016),
2006 to 2016
Total cost per MVA of non-coincident maximum demand
$0
$10,000
$20,000
$30,000
$40,000
$50,000
$60,000
$70,000
2006 2007 2008 2009 2010 2011 2012 2013 2014 2015 2016
Tota
l co
st p
er
km o
f ci
rcu
it li
ne
ElectraNet
Powerlink
AusNet Services
TasNetworks
TransGrid
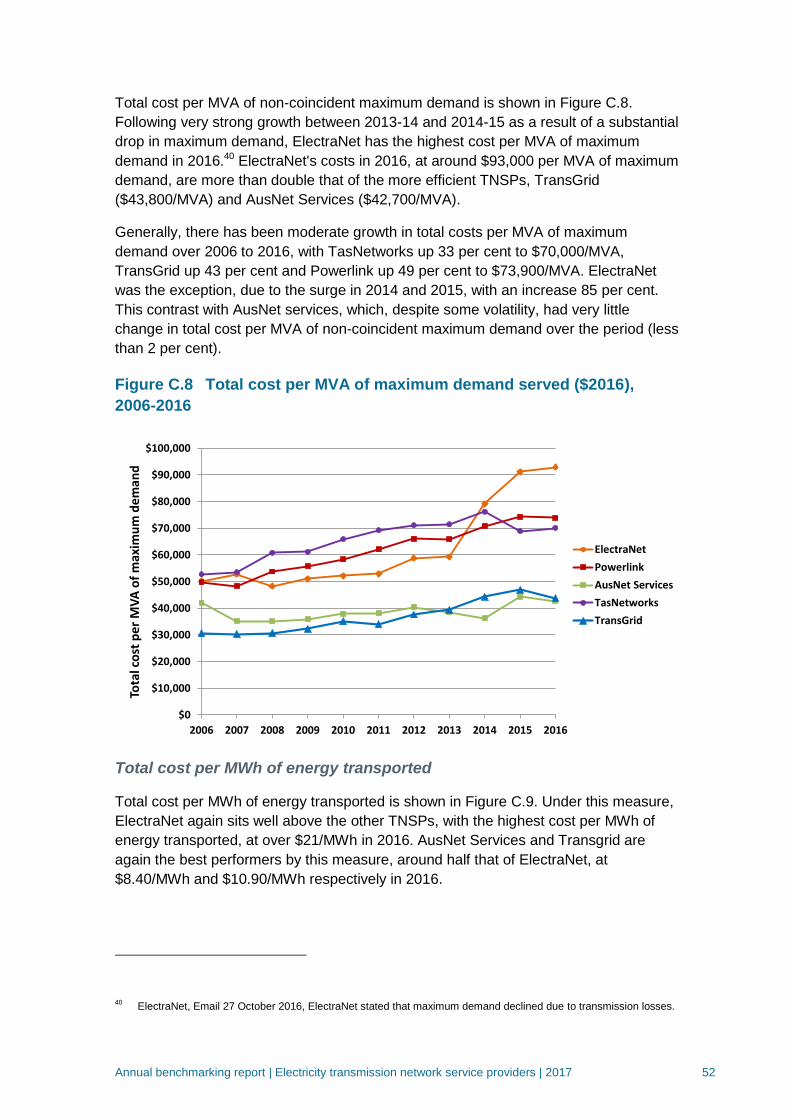
Annual benchmarking report | Electricity transmission network service providers | 2017 52
Total cost per MVA of non-coincident maximum demand is shown in Figure C.8.
Following very strong growth between 2013-14 and 2014-15 as a result of a substantial
drop in maximum demand, ElectraNet has the highest cost per MVA of maximum
demand in 2016.40 ElectraNet's costs in 2016, at around $93,000 per MVA of maximum
demand, are more than double that of the more efficient TNSPs, TransGrid
($43,800/MVA) and AusNet Services ($42,700/MVA).
Generally, there has been moderate growth in total costs per MVA of maximum
demand over 2006 to 2016, with TasNetworks up 33 per cent to $70,000/MVA,
TransGrid up 43 per cent and Powerlink up 49 per cent to $73,900/MVA. ElectraNet
was the exception, due to the surge in 2014 and 2015, with an increase 85 per cent.
This contrast with AusNet services, which, despite some volatility, had very little
change in total cost per MVA of non-coincident maximum demand over the period (less
than 2 per cent).
Figure C.8 Total cost per MVA of maximum demand served ($2016),
2006-2016
Total cost per MWh of energy transported
Total cost per MWh of energy transported is shown in Figure C.9. Under this measure,
ElectraNet again sits well above the other TNSPs, with the highest cost per MWh of
energy transported, at over $21/MWh in 2016. AusNet Services and Transgrid are
again the best performers by this measure, around half that of ElectraNet, at
$8.40/MWh and $10.90/MWh respectively in 2016.
40
ElectraNet, Email 27 October 2016, ElectraNet stated that maximum demand declined due to transmission losses.
$0
$10,000
$20,000
$30,000
$40,000
$50,000
$60,000
$70,000
$80,000
$90,000
$100,000
2006 2007 2008 2009 2010 2011 2012 2013 2014 2015 2016
Tota
l co
st p
er
MV
A o
f m
axim
um
de
man
d
ElectraNet
Powerlink
AusNet Services
TasNetworks
TransGrid
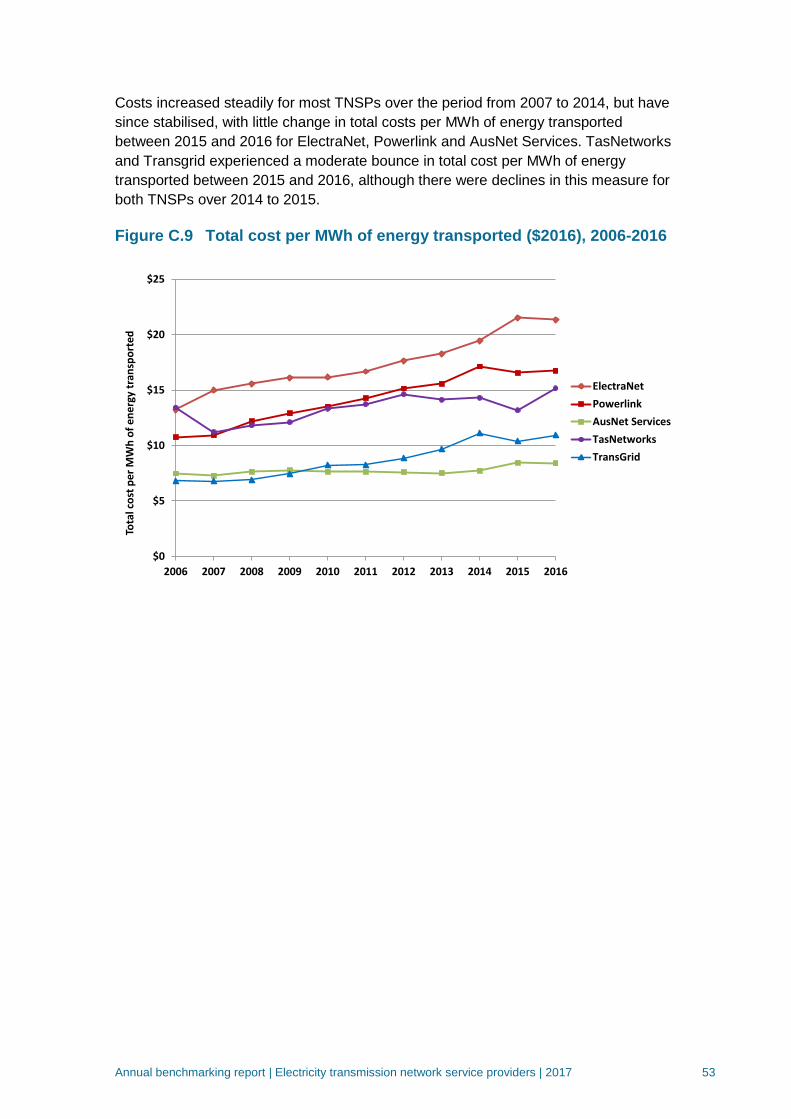
Annual benchmarking report | Electricity transmission network service providers | 2017 53
Costs increased steadily for most TNSPs over the period from 2007 to 2014, but have
since stabilised, with little change in total costs per MWh of energy transported
between 2015 and 2016 for ElectraNet, Powerlink and AusNet Services. TasNetworks
and Transgrid experienced a moderate bounce in total cost per MWh of energy
transported between 2015 and 2016, although there were declines in this measure for
both TNSPs over 2014 to 2015.
Figure C.9 Total cost per MWh of energy transported ($2016), 2006-2016
$0
$5
$10
$15
$20
$25
2006 2007 2008 2009 2010 2011 2012 2013 2014 2015 2016
Tota
l co
st p
er M
Wh
of
ener
gy t
ran
spo
rted
ElectraNet
Powerlink
AusNet Services
TasNetworks
TransGrid

Annual benchmarking report | Electricity transmission network service providers | 2017 54
D Map of the National Electricity Market
This benchmarking report examines the efficiency of the five TNSPs in the NEM. The
NEM connects electricity generators and customers from Queensland through to New
South Wales, the Australian Capital Territory, Victoria, South Australia and Tasmania.
Figure C.1 illustrates the network areas for which the TNSPs are responsible.
Figure C.1 Electricity transmission networks within the NEM

Annual benchmarking report | Electricity transmission network service providers | 2017 55
E List of submissions
We sought comment from TNSPs on a draft version of this report and received
submissions from:
AusNet Services transmission
Powerlink
TasNetworks.
All submissions are available on the AER's 2017 benchmarking website.
Where possible issues raised in the submissions have been addressed in the relevant
sections of this final report. Issues raised on the benchmarking modelling undertaken
by Economic Insights have been addressed in its report available on the AER's
benchmarking report website.