annual report 2005 · annual report 2005 statement of compliance .....2 chancellor’s introduction...
TRANSCRIPT

Annual Report 2005

Annual Report 2005
Statement of Compliance .....................................................2
Chancellor’s Introduction ......................................................3
Vice-Chancellor’s Overview..................................................4
Report on Operations
University Governance and Management .......................6
Mission, Vision and Objectives ......................................12
Risk Management .........................................................14
Research .......................................................................15
Teaching and Learning ..................................................16
Community Relations ....................................................17
Staffing and Related Matters .........................................18
Capital Works ................................................................19
Effects of Economic and Other Factors .........................20
The Impact of State Legislation .....................................21
Statistical Profile .................................................................23
Financial Statements and Performance Indicators
Auditor General’s Report to Parliament .........................32
Financial Statements .....................................................33
Performance Indicators..................................................83
Published by The University of Western Australia
Official correspondence should be addressed to the Executive Director (Academic Services) and Registrar, The University of Western Australia, 35 Stirling Highway, Crawley, Western Australia 6009 Telephone: (08) 6488 3002, email: [email protected], facsimile: (08) 6488 1075
Annual Report web site: http://annualreport.publishing.uwa.edu.au
CRICOS Provider Code: 00126G
1
2

Chancellor’s Introduction
It is my pleasure to present the annual report of The University of Western Australia for 2005, a year of outstanding achievement for the University underpinned by growing resources and a continued emphasis on excellence.
This tradition of excellence in teaching, learning and research now extends almost 95 years. In 2005 institutional performance combined with that of individual staff and students continued to build the University’s reputation for achieving international excellence.
The Vice-Chancellor’s overview highlights many of these individual achievements. In addition to these outstanding success stories from the campus, our emphasis on international partnerships and collaborations continued to develop the University in a very positive way—from collaboration with the Government of the People’s Republic of China to establish the first Confucius Institute in Australia to growing relationships with strategic partners in other parts of Asia, North America and Europe, and the recruitment of staff with world-standing.
Reflecting on the position of the University as I complete my appointment as Chancellor at the end of 2005, I believe that the work of my colleagues on the University’s governing body, the Senate, the strong strategic focus of the University Executive and the outstanding commitment of staff at all levels ensures the University an illustrious future. It has been a pleasure to work with such a dedicated and diverse group.
I would like to extend my personal thanks to all members of the Senate, the Vice-Chancellor and his Executive, the University Secretariat, the staff of the University and the Student Guild for making it such a pleasurable and rewarding experience to be Chancellor of my own University.
I offer my very best wishes to incoming Chancellor, Dr Michael Chaney AO CitWA, and to all who strive to ensure that the University remains a creative and intellectual resource to the communities which it serves.
Dr Ken Michael AM CitWA Chancellor
Dr Ken Michael retired as Chancellor on 12 December 2005 and was sworn in as Governor of Western Australia in January 2006.
Dr Michael Chaney commenced his term as Chancellor on 13 December 2005.
3

Vice-Chancellor’s Overview
The year 2005 will be remembered as a stellar year for the University, set against a difficult policy, regulatory and financial framework. Our staff, graduates and students have marked out their University as an institution of international excellence with achievements including:
• a Nobel Prize for Professor Barry Marshall and his research colleague Emeritus Professor Robin Warren;
• the Award of Australian Life Scientist of the Year to Professor Harvey Millar, with our graduate Associate Professor Cameron Kepert (University of Sydney) named Physical Scientist of the Year;
• a third prestigious Federation Fellowship, awarded to Professor Mark Randolph;
• two new Premier's Research Fellowships: Professor Klaus Regenauer-Lieb from Johannes Gutenberg University, and Dr Ian Small, Head of the Plant Genomics Research Unit at the National Institute of Agricultural Research in France;
• an ARC Centre of Excellence for Plant Energy Biology;
• a Western Australian Premier’s Award for Excellence to the Centre for Aboriginal Medical and Dental Health;
• two finalists in the institutional categories of the Australian Awards for Teaching;
• Professor Robert Stick awarded a Premier’s Prize for tertiary science teaching; and Adjunct Professor Graham Hall winning a Premier's Prize for Early Career Achievement in Science;
• accolades for our graduates, winning two (out of eight) General Sir John Monash Awards offered nationally, two Rhodes Scholarships, and the Cornforth Medal for the most outstanding PhD thesis in a branch of chemistry, chemical science or chemical technology;
• successful implementation of a new student record system;
• the official opening of the new University Club and new Molecular and Chemical Sciences building;
4
• the successful negotiation of the purchase of the Claremont Campus of Edith Cowan University and the exciting prospect of restoring the site of the former Sunset Hospital;
• continued growth in competitive grant income from both the ARC and the NHMRC; and
• excellent progress in fundraising, notably with the new Business School campaign.
Throughout the year there were many other accolades for staff and students across the full range of discipline areas for achievement at local, national and international levels. The work of outstanding academics and dedicated professional staff reflects the larger purpose of the University to serve the Australian and wider global communities.
Throughout the year we also have had to respond to major Federal Government policies, such as that concerning workplace reform and the levying of student amenities fees.
It is a credit to the staff of the University that they have faced the hurdles put before them while still contributing significantly to the growth and impact of our performance and reputation.
We believe that national policy settings are going to favour those universities that have a focus on quality, research intensity and impact, and who build strong relationships with other institutions as well as the government, business and community sectors.
This provides affirmation of the direction currently being pursued by our own University where quality is paramount, where building our research capacity provides direct and positive benefits for teaching and learning, and where our external relationships are bringing increasing benefits to the institution. This approach also recognises the importance of our strategic international links and collaborations—particularly in China, Southeast Asia, the UK, Europe and North America which support our University’s claims of international excellence.
The University welcomed Dr Michael Chaney at the end of 2005 as the new Chancellor of our University. Dr Chaney’s reputation and experience as a leader both in the private sector and through his contribution to community organisations will contribute significantly to the role of the University and its standing in the wider community.
Dr Chaney accepted the position following the appointment of Dr Ken Michael as Governor of Western Australia. Dr Michael brought dignity, constancy and supportive leadership to the University and Senate during his term as Chancellor, and we wish him well in his new role.
Alan Robson AM Vice-Chancellor
5

The University was established by the University of Western Australia Act 1911. The Act provides the legislative machinery for administering the University; it establishes the Governing Body (the Senate) which is empowered to ‘have the entire control and management of the affairs of
the University’. It gives the Senate powers to act in the interests of the University through the making of statutes, regulations and by-laws and through the management of income and expenditure. It provides powers of delegation for the Governing Body, so that day-to-day management of the University can be delegated to officers employed by the University. Membership of the Governing Body in 2005 is listed in Appendix A of this section.
Other State Acts which deal with aspects of the management of the University are the University Buildings Act 1952, the University Medical School Teaching Hospitals Act 1955 and the QEII Medical Centre Act 1966.
The University is responsible to the State Minister for Education for the proper conduct of its business under the legal framework established by State legislation. However, the University receives the majority of its funding from the Commonwealth and it is therefore responsible to the Commonwealth Minister for Education for the delivery of its teaching and research programmes and for the provision of adequate infrastructure to support those programmes.
In order to fulfil its responsibilities effectively the Senate appoints the Vice-Chancellor as its Chief Executive Officer and works in partnership with him to maximise the University’s capacity and
University Governance and Management
6
performance and to ensure its fiscal viability. The Senate delegates operational responsibility to the Vice-Chancellor and monitors, guides and supports the work of the Vice-Chancellor and Executive. It has identified its key activities as the setting of strategic directions, the oversight, audit and review of proper governance processes, the assessment and monitoring of performance against established targets, and the making and amending of University legislation. It has adopted a charter that provides for these roles.
The Vice-Chancellor is appointed by the Senate, following public advertising and standard recruitment procedures, for a period normally not exceeding seven years. Professor Alan Robson, the University’s 17th
Vice-Chancellor, commenced his duties in 2004.
The Vice-Chancellor appoints an Executive group to assist him with his responsibilities for the academic, financial, administrative and other business of the University. In 2005 the Executive comprised:
Deputy Vice-Chancellor—Professor Margaret Seares Responsible for broad line management of the deans of faculties, Dean of the School of Indigenous Studies and the University Librarian, for external relations and community activities, and deputising for the Vice-Chancellor in his absence
Pro Vice-Chancellor (Research and Innovation)—Professor Doug McEachern Responsible for research and research training, industry liaison and commercialisation, IT Policy
Pro Vice-Chancellor (Academic)—Professor Belinda Probert Responsible for teaching and learning, undergraduate students, staffing policy
Executive Director (Academic Services) and Registrar—Mr Peter Curtis Responsible for all matters relating to the academic administration of the University
Executive Director (Finance and Resources)—Ms Gaye McMath Responsible for all matters relating to finance and resources
A key feature of the University’s governance and management system is its strong collegial foundation. The University’s peak academic body is the Academic Board, established under Statute 19 and chaired in 2005 by Professor Graeme Martin. The Board is supported by the Academic Council and a range of standing committees which provide policy advice on academic matters. The committee system is replicated at the faculty and school levels.
Statute No. 8 establishes the faculties, which are responsible for the general administration of the courses under their governance. Each faculty is headed by a dean, who has dual responsibility: to the faculty for providing vision, academic leadership and effective management, and to the Vice-Chancellor for the effective leadership and management of the faculty’s human, physical and financial resources located in the schools resourced by the faculty.
In 2005, the faculties and their deans were as follows:
Architecture, Landscape and Visual Arts—Dr Clarissa Ball
Arts, Humanities and Social Sciences—Professor Anne Pauwels
Economics and Commerce (UWA Business School)—Ms Tracey Horton
Education—Associate Professor Marnie O’Neill
Engineering, Computing and Mathematics—Professor Mark Bush
Law—Professor Bill Ford
7

Life and Physical Sciences—Professor George Stewart
Medicine and Dentistry—Professor Ian Puddey
Natural and Agricultural Sciences—Professor Alistar Robertson
The University’s decision-making structures and processes combine a significant level of operational autonomy (both academic and budgetary) in the faculties with a cohesive institution-wide approach to policy in the collegial and executive governance systems.
The Vice-Chancellor may also appoint deans whose responsibilities extend across the University. In 2005 they were:
Dean of the Graduate Research School—Professor Robyn Owens
Dean of Undergraduate Studies—Associate Professor Jane Long
The Executive, the deans, and committees at all levels work with and are supported by the University’s professional staff, both technical and administrative.
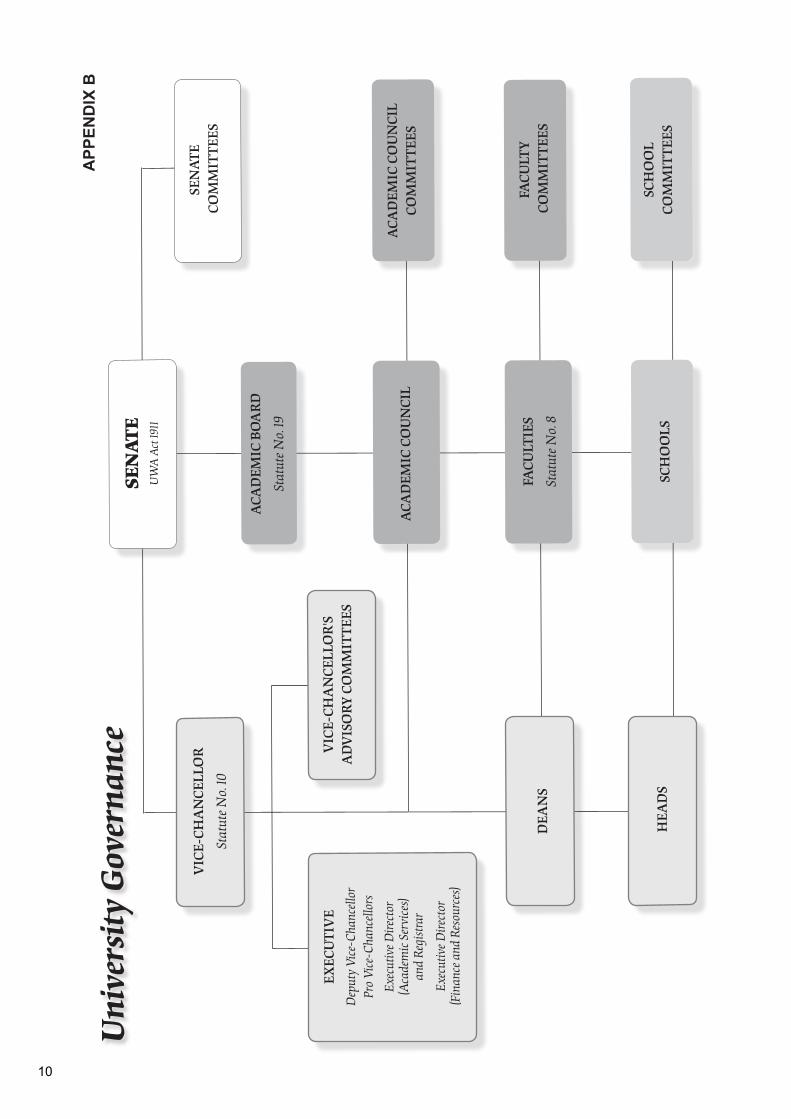
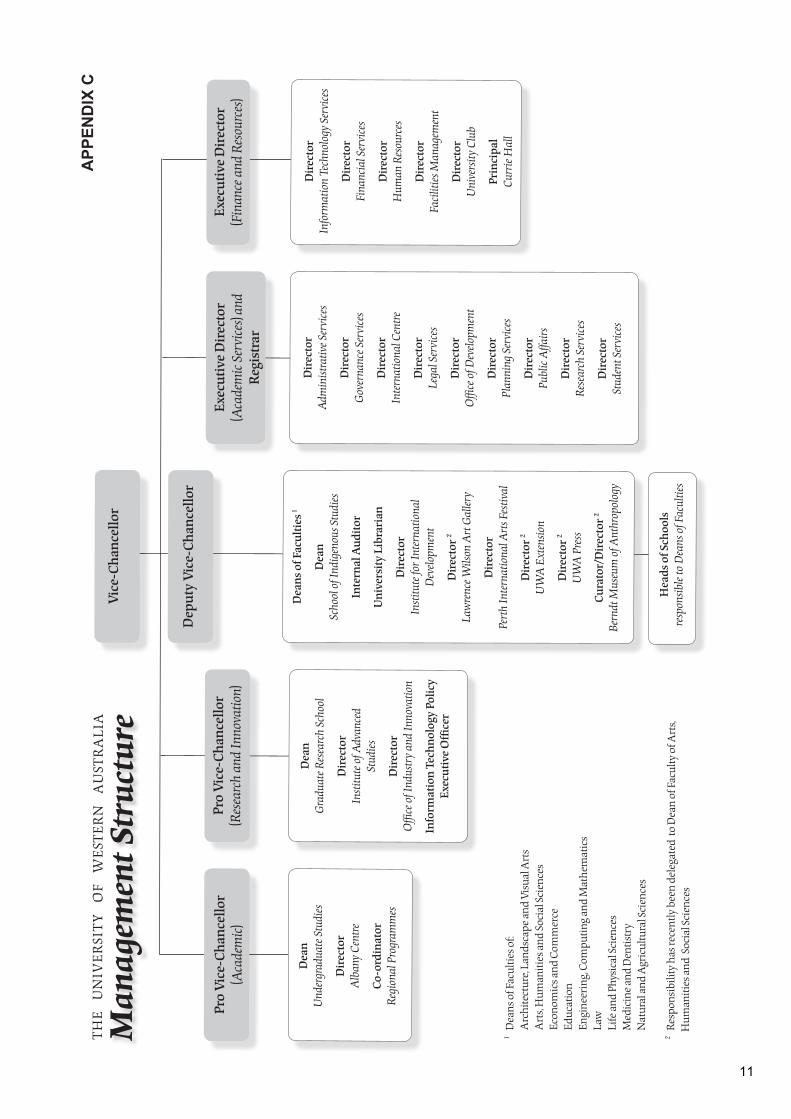
Diagrammatic representations of the University’s governance system and its executive management structure are set out in Appendix B and C respectively of this section (pages 10 and 11).
The major publications produced by the University are:
• Annual Report
• Calendar (of acts, statutes and constitutions)
• Undergraduate Handbook
• Postgraduate Handbook
• Research Expertise
• Scholarships, Prizes, Endowments
• Uniview
• Unistats
• UWA News
These publications can be accessed online at http://www.publishing.uwa.edu.au/.
8

The members of the University Senate in 2005 are listed below. The date in brackets at the end of each entry indicates the year a person first becomes a member of the Senate; a second date indicates the year of expiry of the current term of office.
CHANCELLOR
Kenneth Comninos Michael AM, BE W.Aust., PhD Lond., DIC Imperial Coll. (Lond.), FTSE, Hon.FIEAust, FCIT, FAIM (1998) 2005
APPOINTED BY THE GOVERNOR
David Charles Griffiths, BEc W.Aust., MEc A.N.U. (1996) 2008
Anthony John Howarth AO, Hon.LLD W.Aust., FAIBF, FAICD, FAIM, FSIA (2003) 2007
Gweneth June Jones AM, BA W.Aust., MAPS, FACE, FAIM, FACEL, FWAIEA (1993) 2006
Erica Lee Smyth, BSc W.Aust., MSc McG., FAICD (1996) 2006
ELECTED BY CONVOCATION
Suzanne Kay Baker, BSc(Agric) PhD W.Aust. (2003) 2007
Lesley Ann Cala, MD W.Aust., DMRD RCP(Lond.) & RCS(Eng.), FRCR, FRANZCR (2000) 2006
Catherine Luise Tang, BA DipEd W.Aust., GradDipBus WACAE (1996) 2006
ELECTED BY ACADEMIC STAFF
Stuart Malcolm Bunt, MA DPhil Oxon. (2000) 2008
Allan McKinley, BSc PhD Cantab., MNZIC (2005) 2007
Vera Morgan (2005) 2006
ELECTED BY GENERAL STAFF
Gabrielle Elisabeth Gooding, BSc MBA W.Aust. (2001) 2009
ELECTED BY STUDENTS
Susie Byers (2005) 2006
MEMBERS EX OFFICIO
The Vice-Chancellor, Professor Alan David Robson AM, BAgrSc Melb., PhD W.Aust., FTSE, FACE, FACEL, FAIAS
The Chair of the Academic Board, Professor Graeme Martin, BSc(Agric) PhD W.Aust. (2005) 2007
The Warden of Convocation, Matthew Howard Zilko, LLB MPhil W.Aust. (2004) 2006
The President of the Guild of Undergraduates, Natalie Hepburn (2004) 2005
The President of the Postgraduate Students’ Association, Natalie Mast (2003) 2005
CO-OPTED MEMBERS
John Leslie Langoulant, BEc(Hons) W.Aust. (2004) 2006
Lyndon Geoffrey Rowe, BEc Adel. (2000) 2008
The Hon. Justice Christine Ann Wheeler, BJuris LLB W.Aust., LLM Lond. (1996) 2006
SENATE MEMBERS APPENDIX A
9
VIC
E-C
HA
NC
ELLO
R
Stat
ute N
o. 10
EXEC
UT
IVE
Dep
uty
Vice
-Cha
ncel
lor
Pro
Vice
-Cha
ncel
lors
VIC
E-C
HA
NC
ELLO
R’S
A
DV
ISO
RY
CO
MM
ITT
EES
DEA
NS
HEA
DS
SEN
AT
EU
WA
Act
1911
ACA
DEM
IC B
OA
RD
Stat
ute N
o. 19
FAC
ULT
IES
Stat
ute N
o. 8
ACA
DEM
IC C
OU
NC
IL
SCH
OO
LS
ACA
DEM
IC C
OU
NC
IL
CO
MM
ITT
EES
FAC
ULT
Y
CO
MM
ITT
EES
SEN
AT
E C
OM
MIT
TEE
S
Uni
vers
ity
Gov
erna
nce
Exec
utiv
e Dire
ctor
(A
cade
mic
Ser
vice
s)
and
Reg
istr
ar
Exec
utiv
e Dire
ctor
(F
inan
ce a
nd R
esou
rces
)
SCH
OO
L C
OM
MIT
TEE
S
AP
PE
ND
IX B
10
Man
agem
ent S
tru
ctu
reV
ice-
Chan
cello
r
Dep
uty
Vic
e-Ch
ance
llor
Pro
Vic
e-Ch
ance
llor
(Res
earc
h an
d In
nova
tion)
Pro
Vic
e-Ch
ance
llor
(Aca
dem
ic)
Exec
utiv
e D
irec
tor
(Aca
dem
ic S
ervi
ces)
and
Reg
istr
ar
Exec
utiv
e D
irec
tor
(Fin
ance
and
Res
ourc
es)
Dea
nU
nder
grad
uate
Stu
dies
Dir
ecto
rA
lban
y C
entr
e
Co-o
rdin
ator
Reg
iona
l Pro
gram
mes
Dea
nG
radu
ate R
esea
rch
Scho
ol
Dir
ecto
rIn
stitu
te o
f Adv
ance
dSt
udie
s
Dir
ecto
rO
ffice
of I
ndus
try
and
Inno
vatio
n
Info
rmat
ion
Tech
nolo
gy P
olic
y Ex
ecut
ive
Offi
cer
Dea
ns o
f Fac
ulti
es 1
Dea
n Sc
hool
of I
ndig
enou
s Stu
dies
Inte
rnal
Aud
itor
Uni
vers
ity
Libr
aria
n
Dir
ecto
r In
stitu
te fo
r Int
erna
tiona
l D
evel
opm
ent
Dir
ecto
r 2 La
wre
nce W
ilson
Art
Gal
lery
Dir
ecto
r Pe
rth
Inte
rnat
iona
l Art
s Fes
tival
Dir
ecto
r 2
UW
A E
xten
sion
Dir
ecto
r 2 U
WA
Pre
ss
Cura
tor/
Dir
ecto
r 2 Be
rndt
Mus
eum
of A
nthr
opol
ogy
1 D
eans
of F
acul
ties o
f:
Arc
hite
ctur
e, L
ands
cape
and
Vis
ual A
rts
A
rts,
Hum
aniti
es a
nd S
ocia
l Sci
ence
s
Econ
omic
s and
Com
mer
ce
Educ
atio
n
Engi
neer
ing,
Com
putin
g an
d M
athe
mat
ics
La
w
Life
and
Phy
sica
l Sci
ence
s
Med
icin
e an
d D
entis
try
N
atur
al a
nd A
gric
ultu
ral S
cien
ces
2 Res
pons
ibili
ty h
as re
cent
ly b
een
dele
gate
d to
Dea
n of
Fac
ulty
of A
rts,
Hum
aniti
es a
nd S
ocia
l Sci
ence
s
Dir
ecto
r In
form
atio
n Te
chno
logy
Ser
vice
s
Dir
ecto
r Fi
nanc
ial S
ervi
ces
Dir
ecto
r H
uman
Res
ourc
es
Dir
ecto
r Fa
cilit
ies M
anag
emen
t
Dir
ecto
r U
nive
rsity
Clu
b
Prin
cipa
l C
urri
e Hal
l
Dir
ecto
r A
dmin
istr
ativ
e Ser
vice
s
Dir
ecto
r G
over
nanc
e Ser
vice
s
Dir
ecto
r In
tern
atio
nal C
entr
e
Dir
ecto
r Le
gal S
ervi
ces
Dir
ecto
r O
ffice
of D
evel
opm
ent
Dir
ecto
r Pl
anni
ng S
ervi
ces
Dir
ecto
r Pu
blic
Affa
irs
Dir
ecto
r R
esea
rch
Serv
ices
Dir
ecto
r St
uden
t Ser
vice
s
Hea
ds o
f Sch
ools
re
spon
sibl
e to
Dea
ns o
f Fac
ultie
s
TH
E
UN
IVE
RSI
TY
O
F W
EST
ER
N
AU
STR
ALI
AA
PP
EN
DIX
C
11
The University’s mission, desired outcomes and broad objectives are described in its Strategic Directions document and associated Operational Priorities Plan in the following terms.
Mission
To advance, transmit and sustain knowledge and understanding through the conduct of teaching, research and scholarship at the highest international standards, for the benefit of the international, Australian and Western Australian communities.
Vision
The University of Western Australia will be recognised internationally as an excellent, research-intensive university and a leading intellectual and creative resource to the communities it serves.
Values
The core values underpinning our activities are a commitment to:
• a high performance culture designed to achieve international excellence• academic freedom to encourage staff and students to engage in the open exchange of ideas and
thought• continuous improvement through self-examination and external review• fostering the values of openness, honesty, tolerance, fairness, trust and responsibility in social, moral
and academic matters• transparency in decision making and accountability• equity and merit as the fundamental principles for the achievement of the full potential of all staff
and students
Defining Characteristics
The University of Western Australia will be recognised by the following defining characteristics:
• high quality, as the pervading criterion for all our activities
Mission,Visionand Objectives
12

• comprehensive, with a broad teaching and research profile in the arts, sciences and professions• selective, within a comprehensive base, to develop particular areas of strength and emphasis• research-active, with a strong teaching and research nexus across all our disciplines• internationally focused, for both the content and standards of our activities• technologically innovative, to maximise our flexibility and responsiveness• flexible and responsive, to meet the needs of the community, our students and our graduates
Priority Strategic Objectives
The University has identified six priority strategic objectives of particular significance to achieving international excellence:
• to recruit, develop and retain the highest quality staff• to attract, develop and graduate the highest quality students• to increase and diversify the University’s funding base• to develop, and direct resources preferentially to, areas of particular strength, importance and
opportunity• to build strategic partnerships and alliances• to improve collaboration within the University
Operational Priorities
Operationally, the University has identified in its current Operational Priorities Plan for the 2003 to 2005 triennial period the following priorities:
Internationalisation
• extend the international experiences of UWA students• further develop international benchmarking and quality assurance processes• attract more high quality international students, particularly postgraduate students, from a diverse
range of countries
Teaching and Learning
• further improve the University’s practice of flexible teaching and learning• implement a University-wide outcomes-based approach to teaching, learning and assessment with
particular reference to:
• mastery of the discipline;• English competence and literacy;• information skills competence and literacy;• research skills; and• other generic skills.
• enhance the nexus between teaching and research
Research
• improve research outcomes and their impact• increase the number of higher degree by research students and the higher degree completion rate,
coupled with an increase in funding per capita• increase total research income from all sources
Resourcing and Management
• further expand and diversify the University’s funding base, with particular emphasis on unrestricted income
13

• further enhance quality and equity in staffing, particularly in enhancing and recognising performance and flexibility in staffing arrangements
• enhance the University’s use and management of information technology• build further effective strategic partnerships and alliances
Proposed Strategic Objectives
It is expected that the Operational Priorities Plan, which the University is developing for the 2006 to 2008 triennium, will replace the six priority strategic objectives listed above with the following:
• to improve the quality of the student learning experience• to improve the quality, impact and productivity of research and research training• to improve the University’s positioning, reputation and strategic relationships• to increase and diversify the University’s income, with particular emphasis on general purpose
income• to recruit, develop and retain the highest quality staff, and support the development of their full
potential, within a ‘one-staff, one-University’ philosophy• to improve the efficiency and effectiveness of the management of the University
Risk Management
The University recognises risk management as an integral part of good management and is committed to achieving best practice risk management. A primary objective of the UWA Risk Management Plan is to provide consistency to business risk management practices. The Plan
outlines the Corporate Risk Management Framework, including a Risk Appetite statement, which is designed to provide assurance that all key risks within the business are being identified and managed appropriately.
During 2005, 59 business risk management plans were either reviewed or created and signed off by the relevant responsible authority. A web-enabled database was developed to house and report against all of the UWA business risk management plans.
14

The University of Western Australia is one of Australia’s leading research- intensive universities and is the premier research institution in Western Australia. In 2005 the University received over $102 million of external research
income, expended over $165 million on research, and graduated over 265 higher degree by research students, mostly PhDs.
The University’s research and research training objectives are defined in its Research and Research Training Management Report at http://intranet.uwa.edu.au/planning/ planning/__data/page/37856/UWA_RRTMR_2005.pdf. Research is expected to be conducted by all teaching and research staff across the range of disciplines, although the University also encourages the development of research concentrations in areas of particular strength and opportunity. Notably these areas include: geomechanics and offshore engineering; earth sciences, particularly tectonics; materials science; water research; agricultural and natural system management, including dryland salinity; plant energy biology; classics and ancient history; anthropology, archaeology and linguistics; child health; asthma and allergy research; epidemiology and neurobiology; telecommunications; and atomic molecular and surface physics.
The University recognises the need to fully cost its research activities, particularly as funding from industry and non-government sources increases. The University has developed a detailed pricing policy for research contracts and consultancies which is available at http://www.research.uwa.edu.au/page/77585.
Research
15

In 2005 UWA focused particularly on new measures designed to improve teaching through staff development and on improving the ways in which the quality of learning can be measured.
In 2005 the Postgraduate Teaching Internship Scheme [commended by the Australian Universities Quality Agency (AUQA)] was significantly expanded and a complementary scheme for postgraduate students, Introduction to University Teaching, was introduced. In 2006 these schemes will be further expanded so that all postgraduate teachers have access to high quality staff development for teaching. In addition, a new Teaching Fellowship Scheme, open to all academic staff, was introduced in 2005.
Using international benchmarking as a tool to measure teaching and learning, excellence was further developed with the implementation in 2005 of the National Survey of Student Engagement which gathers data about staff and student practices. This will allow UWA to work closely with the University of New South Wales and Queen’s University, Canada, to compare data and develop appropriate improvement strategies. It also provides benchmarking possibilities with hundreds of North American universities.
The University’s strong performance on a number of measures of quality of teaching and learning was confirmed when it was one of 14 universities to receive extra funding from the Commonwealth’s Learning and Teaching Performance Fund in 2006.
The University’s pricing policy for its educational programmes is consistent with the Commonwealth Government’s policies on Australian domestic undergraduate and postgraduate coursework students and international fee-paying students. Details of the University’s prices are available both on the University web site and the Commonwealth web site at http://www.goingtouni.gov.au/.
Teaching and Learning
16

Beyond serving the State through its commitment to achieving international excellence in academic endeavours, the University continues to honour its mission as a leading intellectual and creative resource for the entire community.
Hundreds of thousands of people engaged with the University in 2005 through community activities including:
• The UWA Perth International Arts Festival (PIAF)
• School of Music public concerts
• UWA Expo 2005
and events conducted by—
• Institute for Advanced Studies
• UWA Extension
• Lawrence Wilson Art Gallery
• UWA Press
• University Theatres
• University Club of Western Australia
• Berndt Museum of Anthropology
• Edward Courcy Clarke Earth Science Museum
• UWA Sport and Recreation Association
In addition, the Office of Development maintained its focus on increasing and diversifying the University’s income stream through relationships and strategic partnerships with University alumni and others. A priority in 2005 was the capital campaign for a new facility to house the UWA Business School.
The Public Affairs division continued to promote the achievements of staff, students and alumni. Notably, the award of the Nobel Prize for Medicine to Professor Barry Marshall and Emeritus Professor Robin Warren generated extensive international, national and local attention, further enhancing the University’s reputation for achieving excellence. This exposure complemented a year-long national advertising campaign built around the international reputation and standing of the University’s staff.
Community Relations
17

On staffing matters The University of Western Australia remains committed to ‘the recruitment, development and retention of the highest quality staff’ to achieve its mission within a ‘one-staff, one-University’ policy. This is supported by an employment philosophy of providing job security
through ongoing employment where possible.
Policy and Staff Development
The University has a commitment to a high performance culture. In 2005 implementation of a new performance management process—the Professional Development Review (PDR)—began, supported by a training programme made available to all staff. The Academic Portfolio, now a requirement for academic tenure and promotion, will also be required for the review of academic staff in 2006. The highly successful Leadership Development for Women Programme celebrated its 10th anniversary. A new leadership programme for heads of school introduced in late 2004 was well received by participants. During 2005 more than 4000 people attended workshops, forums and orientations. Additionally, about 1200 people attended safety training courses and a further 900 participated in courses focusing on equity and diversity.
Industrial Relations
Enterprise Bargaining Agreements for Academic and General staff were approved by the Australian Industrial Relations Commission in January. English as a Second Language (ESL) and Child Care Agreements were finalised in September and March respectively. Key outcomes for the University included more rigorous performance management provisions, greater flexibility in superannuation and expanded parental leave arrangements. In line with the requirements of the Higher Education Workplace Report Requirements (HEWRRs), introduced following the Nelson Report, all new staff are now offered Australian Workplace Agreements (AWAs).
Workers’ Compensation
In 2005 there were 71 accepted workers’ compensation claims. Although there was a reduction in the number of workers’ compensation claims compared to previous years, there were a number of staff who required extended periods off work in order to fully recover from their injuries.
Equity and Diversity
Some 125 employees have been recruited under the University’s Workforce Diversity Strategy since 2001. The University again received an Employer of Choice Award and has been waived from reporting to the Equal Opportunity for Women in the Workplace Agency (EOWA) for a period of two years following submission of its statutory gender equity performance report. A Disability Services and Action Plan was completed following University-wide consultation.
Staffing and RelatedMatters
18

During 2005, in line with the University’s Capital Asset Management Plan, the University spent $49.6 million on capital projects and infrastructure, and $2.6 million on minor works projects, including refurbishments to accommodate new courses, research and collaborations with
industry.
A key acquisition by the University was a site at Claremont, previously owned by Edith Cowan University. The purpose of this acquisition was to accommodate the establishment of a foundation college and provide the University with an opportunity for future expansion.
A new Physical Sciences Library is planned which will provide an additional 5,723 m2 of space to consolidate a number of scattered collections into a single facility as well as enable faculty expansion.
Major projects completed during 2005
Project Estimated Actual total Date of total cost ($m) cost ($m) completion
The University Club of Western Australia 21.000 21.916 February 2005
Molecular and Chemical Sciences Building 61.000 61.759 January 2005
Water Sports Complex 1.750 2.170 1 May 2005
Third Swimming Pool 2.362 2.554 April 2005
Claremont site acquisition n/a 15.319 May 2005
Major projects that were in progress at 31 December 2005
Project Estimated Actual cost Expected total cost to complete year of ($m) ($m) completion
Biomedical Research Facilities 2 24.000 3 22.409 2006
Physical Sciences Library 32.000 31.992 2008
1 Additional main transformer was required2 Previously referred to as Small Animal Facilities3 Estimated cost increased due to extended timeline in getting planning approval by external agency
Capital Works
19

Economic and other related factors were generally favourable in 2005, supporting the University in exceeding its financial objectives for the year. The key areas affected by these factors were the University’s investment income,
Commonwealth government funding changes and student fees.
Continued good performance in financial markets generated investment returns in excess of expectations, delivering a strong overall financial result for the University.
Commonwealth government funding reforms resulted in additional direct funding flowing from workplace reforms and governance requirements, an increase in funded student load levels and also increases in student contributions compared to 2004. However, the government decision on indexation was unfavourable and will not be reviewed until 2008 during which time the cost adjustment factor will be less than the CPI.
The University’s full fee-paying student fees were overall generally in line with budget expectations for 2005. The growth in international onshore student enrolments has flattened off, while offshore enrolments have continued to grow, albeit at a slower rate. The stronger Australian dollar continues to dampen the attractiveness of Australian university education.
Effects of Economicand Other Factors
20

In August 2005, the WA State Government passed the Universities Legislation Amendment Act 2005 which amended certain sections relating to the University’s governing body and which was passed and implemented in response to Federal Government funding requirements.
In December 2005, the Federal Government passed the HESA (Abolition of Compulsory Up-Front Student Union Fees) Act 2005 which removes the ability of the University to set a fee for students for amenities and services. This will impact the range of non-tuition services available from the Guild of Undergraduates and the Sports Association and may result in the cost of providing some services to students being met from the University’s budget.
Public Interest Disclosure Act
The University has appointed a Public Interest Disclosure Officer in accordance with the Public Interest Disclosure Act 2003. There were no matters of Public Interest Disclosure reported to the University in 2005.
Record Keeping
The University is committed to records management practices which comply with the relevant legislation and are in line with good professional practice. Its Record Keeping Plan has been cleared by the State Records Commission and will be fully approved pending the submission of a revised Records Disposal Authority for Student Records which will occur in the first half of 2006. Information on record keeping is now included on the University’s staff induction web site and a statement regarding each staff member’s record-keeping responsibilities is available. Significant achievements include the redevelopment of the formal record keeping training programme and the successful implementation of electronic document management for research administration records as well as some general files.
Key Performance Indicators 2004 2005
Number of non-academic staff with active TRIM* accounts 486 533 (percentage) (30%) (32%)
Number of non-academic staff who underwent records management training 298 292 (percentage) (18%) (17%)
* TRIM is the official record-keeping and electronic document management system of the University.
Media and Advertising Expenditure
In accordance with Section 175ZE of the Electoral Act 1907 the University is required to report on expenditure incurred during the financial year in relation to advertising agencies, market research organisations, polling organisations, direct mail organisations and media advertising organisations.
Expenditure with advertising agencies $1,309,570
Adcorp Australia LtdBowtell Clark & YoleCooch Creative Pty Ltd
The Impact of State Legislation
21
Crossroads AdvertisingHogan Media ServicesHorizon PRMInsight Communication & Design Management Co.Linc Integrated Marketing & CommunicationLuminosityMarketforce ProductionsMedia Decisions WAThe Marketing Centre
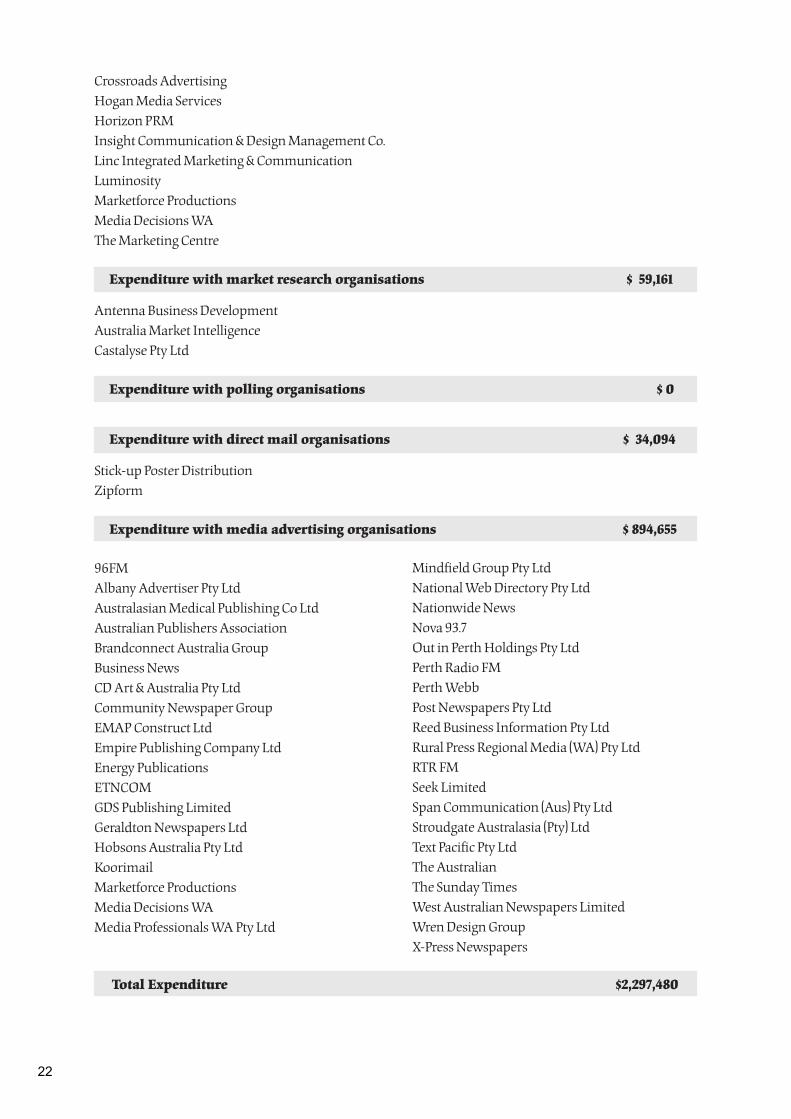
Expenditure with market research organisations $ 59,161
Antenna Business DevelopmentAustralia Market IntelligenceCastalyse Pty Ltd
Expenditure with polling organisations $ 0
Expenditure with direct mail organisations $ 34,094
Stick-up Poster DistributionZipform
Expenditure with media advertising organisations $ 894,655
96FMAlbany Advertiser Pty LtdAustralasian Medical Publishing Co LtdAustralian Publishers AssociationBrandconnect Australia GroupBusiness NewsCD Art & Australia Pty LtdCommunity Newspaper GroupEMAP Construct LtdEmpire Publishing Company LtdEnergy PublicationsETNCOMGDS Publishing LimitedGeraldton Newspapers LtdHobsons Australia Pty LtdKoorimailMarketforce ProductionsMedia Decisions WAMedia Professionals WA Pty Ltd
Mindfield Group Pty LtdNational Web Directory Pty LtdNationwide NewsNova 93.7Out in Perth Holdings Pty LtdPerth Radio FMPerth WebbPost Newspapers Pty LtdReed Business Information Pty LtdRural Press Regional Media (WA) Pty LtdRTR FMSeek LimitedSpan Communication (Aus) Pty LtdStroudgate Australasia (Pty) LtdText Pacific Pty LtdThe AustralianThe Sunday TimesWest Australian Newspapers LimitedWren Design GroupX-Press Newspapers
Total Expenditure $2,297,480
22

StatisticalProfile
23

Table 1:
Total Student Enrolments by Course Type, 1996–2005 ......................................................25
Table 2:
Student Enrolments and Load by Funding Source, 2001–2005 ..........................................26
Table 3:
Percentage of Student Enrolments and Load by Funding Source, 2001–2005 ..................26
Table 4:
Student Enrolments and Load by Course Type and Funding Source, 2005 .......................27
Table 5:
Student Load (EFTSL) by Faculty and Course Type Group, 2005 ......................................28
Table 6:
Faculty Load (EFTSL) as a Percentage of Course Type Group Total, 2005 .......................28
Table 7:
Degrees and Awards Conferred by Course Type, 1996–2005 ............................................29
Table 8:
Staff FTE by Major Organisational Unit, 2001–2005 ...........................................................30
24

TABLE 1: TOTAL STUDENT ENROLMENTS BY COURSE TYPE, 1996–2005
Course Type 1996 1997 1998 1999 2000 2001 2002 2003 2004 2005HIGHER DEGREE RESEARCHDoctorate 1,073 1,153 1,134 1,197 1,260 1,255 1,313 1,306 1,409 1,474Master's Research 401 470 480 490 424 406 364 381 343 342
Sub-total Higher Degree Research 1,474 1,623 1,614 1,687 1,684 1,661 1,677 1,687 1,752 1,816% Higher Degree Research 10.8% 11.5% 11.4% 11.6% 11.5% 11.0% 10.8% 10.3% 10.5% 10.6%
OTHER POSTGRADUATEMaster's Coursework 675 702 818 899 882 979 1,123 1,429 1,533 1,503Higher Degree Qualifying 69 51 45 44 42 33 46 38 27 29Graduate Diploma 468 498 422 386 387 413 454 546 524 546Graduate Certificate 41 36 46 150 154 201 247 284 268 188Postgraduate Cross-institutional 9 14 12 11 11 25 36
Sub-total Other Postgraduate 1,253 1,287 1,331 1,488 1,479 1,638 1,881 2,308 2,377 2,302% Other Postgraduate 9.2% 9.1% 9.4% 10.2% 10.1% 10.8% 12.1% 14.1% 14.3% 13.4%
UNDERGRADUATEGraduate Entry Bachelor's 309 323 331 321 305 342 328 370 364 397Bachelor's Honours 628 660 725 745 562 540 543 584 561 552Bachelor's Pass 9,800 9,941 9,848 10,036 10,343 10,614 10,737 11,004 11,279 11,741Diploma 23 41 63 75 87 70 70 72 69 62Miscellaneous Enrolments 166 239 188 184 227 301 293 333 257 311
Sub-total Undergraduate 10,926 11,204 11,155 11,361 11,524 11,867 11,971 12,363 12,530 13,063
% Undergraduate 80.0% 79.4% 79.1% 78.2% 78.5% 78.2% 77.1% 75.6% 75.2% 76.0%
GROSS ENROLMENTS 13,653 14,114 14,100 14,536 14,687 15,166 15,529 16,358 16,659 17,181
Less Dual Enrolments 28 59 101 154 148 131 133 224 210 270
NET ENROLMENTS 13,625 14,055 13,999 14,382 14,539 15,035 15,396 16,134 16,449 16,911
STUDENT ENROLMENTS BY COURSE TYPE GROUP, 1996–2005
0100020003000400050006000700080009000
10000110001200013000140001500016000170001800019000
1996 1997 1998 1999 2000 2001 2002 2003 2004 2005
Higher Degree Research Other Postgraduate Undergraduate
25

TABLE 2: STUDENT ENROLMENTS AND LOAD BY FUNDING SOURCE, 2001–2005
2001 2002 2003 2004 2005Funding Source Enrol EFTSL Enrol EFTSL Enrol EFTSL Enrol EFTSL Enrol EFTSL
Domestic Non-fee-paying Students 12,197 10,742 12,093 10,616 12,180 10,780 12,287 10,815 12,496 10,970Domestic Fee-paying Students 879 394 1,028 405 1,314 555 1,419 597 1,497 594International Fee-paying Students 2,020 1,664 2,348 1,894 2,793 2,205 2,882 2,270 3,076 2,383Time-limit and Non-award 70 46 60 44 71 51 71 47 112 81Total 15,166 12,846 15,529 12,959 16,358 13,592 16,659 13,729 17,181 14,028
TABLE 3: PERCENTAGE OF STUDENT ENROLMENTS AND LOAD BY FUNDING SOURCE, 2001–2005
2001 2002 2003 2004 2005Funding Source Enrol EFTSL Enrol EFTSL Enrol EFTSL Enrol EFTSL Enrol EFTSL
Domestic Non-fee-paying Students 80.4% 83.6% 77.9% 81.9% 74.5% 79.3% 73.8% 78.8% 72.7% 78.2%Domestic Fee-paying Students 5.8% 3.1% 6.6% 3.1% 8.0% 4.1% 8.5% 4.4% 8.7% 4.2%International Fee-paying Students 13.3% 13.0% 15.1% 14.6% 17.1% 16.2% 17.3% 16.5% 17.9% 17.0%Time-limit and Non-award 0.5% 0.4% 0.4% 0.3% 0.4% 0.4% 0.4% 0.3% 0.7% 0.6%
Total (a) 100.0% 100.0% 100.0% 100.0% 100.0% 100.0% 100.0% 100.0% 100.0% 100.0%(a) Discrepancies between the sums of component items and totals are due to rounding.
26

TAB
LE 4
: STU
DEN
T EN
RO
LMEN
TS A
ND
LO
AD
BY
CO
UR
SE T
YPE
AN
D F
UN
DIN
G S
OU
RC
E, 2
005
Dom
estic
Dom
estic
Ons
hore
Offs
hore
Tim
e-lim
it an
dTo
tal A
llN
on-fe
e-pa
ying
Fee-
payi
ng In
tern
atio
nal
Inte
rnat
iona
lN
on-a
war
dSt
uden
ts(in
clud
ed in
Tot
al)
Cou
rse
Type
Enro
lEF
TSL
Enro
lEF
TSL
Enro
lEF
TSL
Enro
lEF
TSL
Enro
lEF
TSL
Enro
lEF
TSL
Enro
lEF
TSL
HIG
HER
DEG
REE
RES
EAR
CH
Doc
tora
te1,
113
903
21
179
171
9654
8464
1,47
41,
193
745
594
Mas
ter's
Res
earc
h28
116
434
2927
1734
221
021
813
1S
ub-to
tal H
ighe
r Deg
ree
Res
earc
h1,
394
1,06
72
121
320
096
5411
181
1,81
61,
403
963
724
% H
ighe
r Deg
ree
Res
earc
h0
00
00
00
01
10
00
0
OTH
ER P
OST
GR
AD
UA
TEM
aste
r's C
ours
ewor
k16
1296
240
919
616
332
913
71,
503
722
655
318
Hig
her D
egre
e Q
ualif
ying
281,
438
11
2915
209
Gra
duat
e D
iplo
ma
194
213
320
121
2824
41
546
359
308
221
Gra
duat
e C
ertif
icat
e5
216
745
94
73
188
5471
22P
ostg
radu
ate
Cro
ss-in
stitu
tiona
l28
64
14
136
721
4S
ub-to
tal O
ther
Pos
tgra
duat
e24
324
21,
477
581
238
192
344
142
2,30
21,
157
1,07
557
4%
Oth
er P
ostg
radu
ate
00
11
00
00
00
00
UN
DER
GR
AD
UA
TEG
radu
ate
Ent
ry B
ache
lor's
358
276
43
3529
397
308
222
169
Bac
helo
r's H
onou
rs50
442
548
3955
246
434
428
7B
ache
lor's
Pas
s9,
822
8,89
37
71,
486
1,38
742
623
411
,741
10,5
215,
948
5,29
3D
iplo
ma
5917
31
6218
4112
Ena
blin
g43
3343
3326
21U
nder
grad
uate
Cro
ss-in
stitu
tiona
l73
184
118
310
43
126
312
416
976
Brid
ging
31
31
10
Non
-aw
ard
10
11
21
Sub
-tota
l Und
ergr
adua
te10
,859
9,66
118
121,
755
1,56
143
023
51
113
,063
11,4
696,
751
5,85
7%
Und
ergr
adua
te1
10
01
10
10
01
11
1
TOTA
L EN
RO
LMEN
TS12
,496
10,9
701,
497
594
2,20
61,
953
870
431
112
8117
,181
14,0
288,
789
7,15
5
Fem
ale
Stud
ents
27
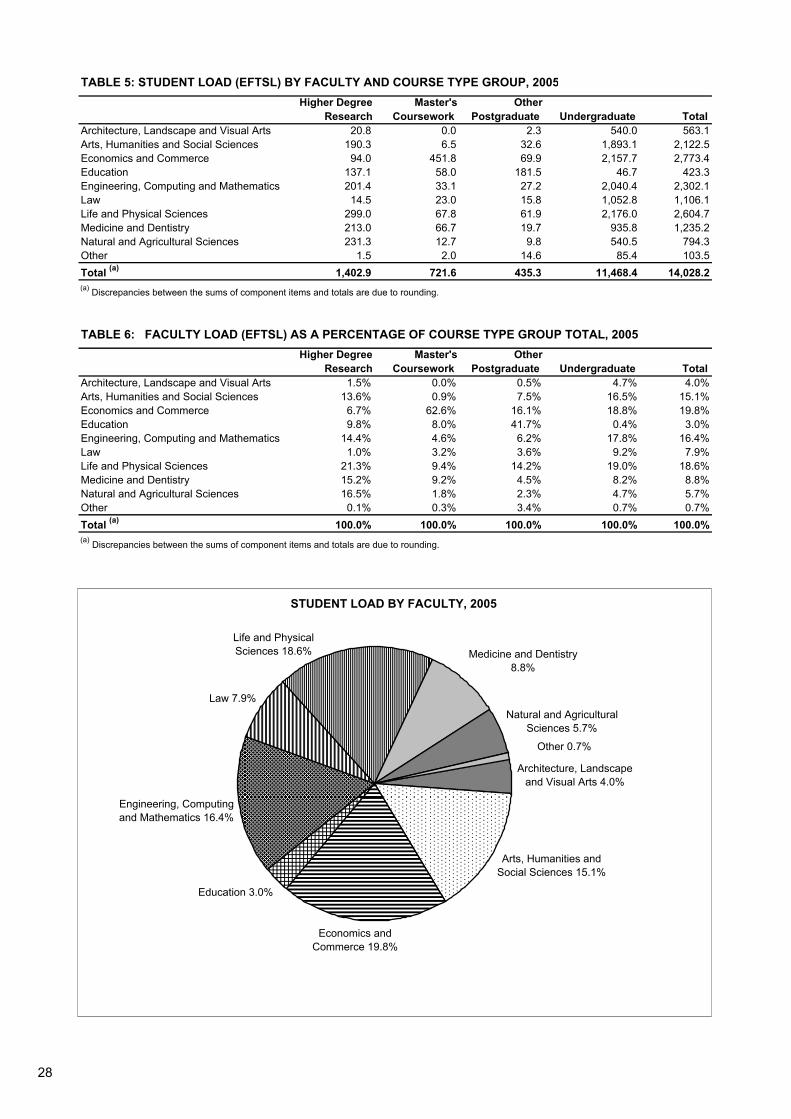
TABLE 5: STUDENT LOAD (EFTSL) BY FACULTY AND COURSE TYPE GROUP, 2005Higher Degree
ResearchMaster's
Coursework Other
Postgraduate Undergraduate Total Architecture, Landscape and Visual Arts 20.8 0.0 2.3 540.0 563.1Arts, Humanities and Social Sciences 190.3 6.5 32.6 1,893.1 2,122.5Economics and Commerce 94.0 451.8 69.9 2,157.7 2,773.4Education 137.1 58.0 181.5 46.7 423.3Engineering, Computing and Mathematics 201.4 33.1 27.2 2,040.4 2,302.1Law 14.5 23.0 15.8 1,052.8 1,106.1Life and Physical Sciences 299.0 67.8 61.9 2,176.0 2,604.7Medicine and Dentistry 213.0 66.7 19.7 935.8 1,235.2Natural and Agricultural Sciences 231.3 12.7 9.8 540.5 794.3Other 1.5 2.0 14.6 85.4 103.5Total (a) 1,402.9 721.6 435.3 11,468.4 14,028.2(a) Discrepancies between the sums of component items and totals are due to rounding.
TABLE 6: FACULTY LOAD (EFTSL) AS A PERCENTAGE OF COURSE TYPE GROUP TOTAL, 2005Higher Degree
ResearchMaster's
Coursework Other
Postgraduate Undergraduate Total Architecture, Landscape and Visual Arts 1.5% 0.0% 0.5% 4.7% 4.0%Arts, Humanities and Social Sciences 13.6% 0.9% 7.5% 16.5% 15.1%Economics and Commerce 6.7% 62.6% 16.1% 18.8% 19.8%Education 9.8% 8.0% 41.7% 0.4% 3.0%Engineering, Computing and Mathematics 14.4% 4.6% 6.2% 17.8% 16.4%Law 1.0% 3.2% 3.6% 9.2% 7.9%Life and Physical Sciences 21.3% 9.4% 14.2% 19.0% 18.6%Medicine and Dentistry 15.2% 9.2% 4.5% 8.2% 8.8%Natural and Agricultural Sciences 16.5% 1.8% 2.3% 4.7% 5.7%Other 0.1% 0.3% 3.4% 0.7% 0.7%Total (a) 100.0% 100.0% 100.0% 100.0% 100.0%(a) Discrepancies between the sums of component items and totals are due to rounding.
STUDENT LOAD BY FACULTY, 2005
Law 7.9%
Education 3.0%
Other 0.7%
Engineering, Computing and Mathematics 16.4%
Economics and Commerce 19.8%
Arts, Humanities and Social Sciences 15.1%
Architecture, Landscape and Visual Arts 4.0%
Natural and Agricultural Sciences 5.7%
Medicine and Dentistry 8.8%
Life and Physical Sciences 18.6%
28

TABLE 7: DEGREES AND AWARDS CONFERRED BY COURSE TYPE, 1996–2005
1996 1997 1998 1999 2000 2001 2002 2003 2004 2005
HIGHER DEGREE RESEARCHHigher Doctorate 4 1 2 3 3 2 0 4 4 0Doctorate 140 147 175 164 160 160 179 213 226 233Master's Research 64 73 58 75 56 61 85 52 73 73Sub-total Higher Degree Research 208 221 235 242 219 223 264 269 303 306
OTHER POSTGRADUATEMaster's Coursework 198 201 217 253 278 359 387 491 579 507Graduate Diploma 164 203 214 276 255 243 217 241 239 291Graduate Certificate 9 5 20 109 88 89 114 131 134 55Sub-total Other Postgraduate 371 409 451 638 621 691 718 863 952 853
UNDERGRADUATEGraduate Entry Bachelor's 66 84 100 92 93 88 130 100 128 146Bachelor's Honours 523 606 679 720 729 762 798 755 903 825Bachelor's Pass 1,589 1,491 1,604 1,650 1,563 1,555 1,708 1,673 1,781 2,212Diploma 2 4 8 15 16 18 22 19Sub-total Undergraduate 2,178 2,181 2,385 2,466 2,393 2,420 2,652 2,546 2,834 3,202
TOTAL 2,757 2,811 3,071 3,346 3,233 3,334 3,634 3,678 4,089 4,361
DEGREES AND AWARDS CONFERRED, 1996–2005
0
100
200
300
400
500
600
700
800
900
1000
1100
1200
1300
1400
1500
1600
1700
1800
1900
2000
2100
2200
2300
2400
1996 1997 1998 1999 2000 2001 2002 2003 2004 2005
Doctorates
Master's Degree
Graduate Diploma and Certificate
Graduate Entry Bachelor's
Bachelor's Honours
Bachelor's Pass
Diploma
29

TABLE 8: STAFF FTE (a) BY MAJOR ORGANISATIONAL UNIT, 2001–2005
2001 2002 2003 2004 2005ACADEMIC ORGANISATIONAL UNITS
ACADEMIC STAFFTeaching and Research Total 742.6 733.4 763.9 793.7 816.4% Female 25.3% 26.2% 27.8% 28.5% 30.5%
Research OnlyTotal 290.9 314.0 311.1 349.2 364.9% Female 43.2% 45.1% 47.3% 44.3% 43.1%
Total Academic StaffTotal 1,033.5 1,047.4 1,075.0 1142.9 1183.2% Female 30.3% 31.9% 33.5% 33.3% 34.5%
NON-ACADEMIC STAFFResearch OnlyTotal 208.4 197.8 216.4 223.5 198.7% Female 64.3% 65.8% 65.2% 66.0% 66.3%
OtherTotal 558.1 621.0 649.4 663.6 697.1% Female 57.6% 61.8% 62.9% 63.4% 64.1%
Total Non-academic StaffTotal 766.5 818.8 865.9 887.1 895.9% Female 59.4% 62.7% 63.5% 64.0% 64.6%
Total Academic Organisational UnitsTotal 1,800.0 1,866.2 1,940.8 2,030.0 2079.0% Female 42.7% 45.4% 46.9% 46.7% 47.4%
NON-ACADEMIC ORGANISATIONAL UNITSTotal 647.0 693.2 703.9 761.9 806.6% Female 55.3% 57.0% 57.3% 57.5% 58.6%
TOTAL UNIVERSITYTotal 2,447.0 2,559.4 2,644.7 2791.9 2885.6% Female 46.1% 48.6% 49.7% 49.7% 50.6%
(a) Full-time equivalence of full-time and fractional full-time staff. Excludes full-time equivalence of casual staff.
30

FinancialStatements
PerformanceIndicators
AND
31

4th Floor Dumas House 2 Havelock Street West Perth 6005 Western Australia Tel: 08 9222 7500 Fax: 08 9322 5664
INDEPENDENT AUDIT OPINION
To the Parliament of Western Australia
THE UNIVERSITY OF WESTERN AUSTRALIA
FINANCIAL STATEMENTS AND PERFORMANCE INDICATORS
FOR THE YEAR ENDED 31 DECEMBER 2005
Audit Opinion
In my opinion,
(i) the financial statements are based on proper accounts and present fairly the financial
position of The University of Western Australia and the consolidated entity at
31 December 2005 and their financial performance and cash flows for the year ended
on that date. They are in accordance with applicable Accounting Standards and other
mandatory professional reporting requirements in Australia and the Treasurer’s
Instructions;
(ii) the controls exercised by the University provide reasonable assurance that the receipt,
expenditure and investment of moneys, the acquisition and disposal of property, and
the incurring of liabilities have been in accordance with legislative provisions; and
(iii) the key effectiveness and efficiency performance indicators of the University are
relevant and appropriate to help users assess the University’s performance and fairly
represent the indicated performance for the year ended 31 December 2005.
Scope
The University Senate is responsible for keeping proper accounts and maintaining adequate
systems of internal control for preparing the financial statements and performance indicators,
and complying with the Financial Administration and Audit Act 1985 (the Act) and other
relevant written law.
The financial statements consist of the Income Statement, Balance Sheet, Statement of Changes
in Equity, Cash Flow Statement of the University and the consolidated entity, and the Notes to
the Financial Statements.
The performance indicators consist of key indicators of effectiveness and efficiency.
Summary of my Role As required by the Act, I have independently audited the accounts, financial statements and
performance indicators to express an opinion on the financial statements, controls and
performance indicators. This was done by testing selected samples of the evidence. Further
information on my audit approach is provided in my audit practice statement. Refer
"http://www.audit.wa.gov.au/pubs/Audit-Practice-Statement.pdf".
An audit does not guarantee that every amount and disclosure in the financial statements and
performance indicators is error free. The term “reasonable assurance” recognises that an audit
does not examine all evidence and every transaction. However, my audit procedures should
identify errors or omissions significant enough to adversely affect the decisions of users of the
financial statements and performance indicators.
D D R PEARSON
AUDITOR GENERAL
22 March 2006
32
AUDITOR GENERAL

FinancialStatementsCertifications........................................................................... 34
Income Statements................................................................ 35
Balance Sheets...................................................................... 36
Statements of Changes in Equity........................................... 37
Cash Flow Statements........................................................... 38
Notes to the Financial Statements......................................... 39
33
34

Consolidated University2005 2004 2005 2004
Notes $'000 $'000 $'000 $'000
Revenue from continuing operations
Australian Government financial assistance Australian Government grants 2 226,659 204,232 226,659 204,232 HECS-HELP Australian Government payments 2 42,441 38,161 42,441 38,161 FEE-HELP 2 4,195 3,721 4,195 3,721Western Australian and Local Government financial assistance 3 27,606 31,605 27,606 31,605HECS-HELP student payments 13,772 9,953 13,772 9,953Other research grants and contracts 4 21,989 18,895 21,989 18,859Investment income 5 56,032 66,863 55,944 65,259Fees and charges 6 57,347 53,520 57,062 53,520Salaries and other recoveries 7 18,355 16,253 18,358 16,263Other revenue 8 41,309 28,588 37,157 27,833Share of net results of associates accounted for using the equity method 42 (872) 30 - -
Total revenue from continuing operations 508,833 471,821 505,183 469,406
Expenses from continuing operations
Employee benefits and on-costs 9 276,797 258,494 273,807 258,056Student expenses 10 24,287 21,000 24,291 21,000Materials and supplies 11 22,584 19,437 21,318 19,316Depreciation, amortisation and impairment 12 24,673 25,305 24,670 25,003Repairs and maintenance 13 12,188 12,078 12,118 12,046Grants distributed 14 23,087 20,833 23,227 20,883Travel 15 14,756 14,275 14,732 14,203Professional fees 16 13,231 10,324 13,123 10,302Other expenses 17 56,196 63,929 55,933 62,936
Total expenses from continuing operations 467,799 445,675 463,219 443,745
Net operating result from continuing operations 41,034 26,146 41,964 25,661
Net operating result attributable to minority interest - 424 - -
Net operating result 41,034 26,570 41,964 25,661
The income statements should be read in conjunction with the accompanying notes.
THE UNIVERSITY OF WESTERN AUSTRALIAINCOME STATEMENTS
FOR THE YEAR ENDED 31 DECEMBER 2005
35

THE UNIVERSITY OF WESTERN AUSTRALIABALANCE SHEETS
AS AT 31 DECEMBER 2005
Consolidated University2005 2004 2005 2004
Notes $'000 $'000 $'000 $'000
ASSETSCurrent assets Cash and cash equivalents 21 35,969 31,354 35,324 31,147 Receivables 22 38,327 37,714 37,889 37,558 Inventories 23 669 627 554 627
74,965 69,695 73,767 69,332
Non-current assets classified as held for sale – restricted 24 - 10,000 - 10,000
Total current assets 74,965 79,695 73,767 79,332
Non-current assets Receivables 22 631 557 631 557 Investment properties – restricted 25 17,440 33,320 17,440 33,320 Other financial assets – restricted 26 327,696 285,195 327,696 285,195 Other financial assets – unrestricted 26 104,923 122,555 114,213 131,512 Investments accounted for using the equity method 27 4,491 3,913 - - Property, plant and equipment – restricted 28 188,453 171,599 188,453 171,599 Property, plant and equipment – unrestricted 28 726,213 703,020 726,203 703,020 Intangible assets 29 9,703 7,306 9,703 7,306
Total non-current assets 1,379,550 1,327,465 1,384,339 1,332,509
Total assets 1,454,515 1,407,160 1,458,106 1,411,841
LIABILITIESCurrent liabilities Payables 31 17,900 18,527 17,420 18,439 Other financial liabilities 32 10,622 9,737 10,622 9,737 Provisions 33 35,019 36,970 34,920 36,958 Deferred revenue 34 58,321 51,616 58,151 51,528
Total current liabilities 121,862 116,850 121,113 116,662
Non-current liabilities Provisions 33 29,679 29,853 29,669 29,853
Total non-current liabilities 29,679 29,853 29,669 29,853
Total liabilities 151,541 146,703 150,782 146,515
Net assets 1,302,974 1,260,457 1,307,324 1,265,326
EQUITY Reserves 35 68,008 69,277 68,008 69,277 Retained profits 36 1,234,966 1,191,180 1,239,316 1,196,049
Total equity 1,302,974 1,260,457 1,307,324 1,265,326
The balance sheets should be read in conjunction with the accompanying notes.
36

Consolidated University2005 2004 2005 2004
Notes $'000 $'000 $'000 $'000
Total equity at the beginning of the financial year 47 1,260,457 1,233,887 1,265,326 1,239,665
Reserves Opening balance 69,277 49,918 69,277 49,918 Transfer from/(to) accumulated funds (1,269) 19,359 (1,269) 19,359
35 68,008 69,277 68,008 69,277
Retained profits Opening balance 1,191,180 1,183,969 1,196,049 1,189,747 Net profit/(loss) from ordinary activities 41,034 26,570 41,964 25,661 Net adjustment from adoption of AASB 132 / 139 34 - 34 - Gain on dilution of holdings in associates recognised directly in equity 1,449 - - - Transfer from/(to) reserves 1,269 (19,359) 1,269 (19,359)
36 1,234,966 1,191,180 1,239,316 1,196,049
Total equity at the end of the financial year 1,302,974 1,260,457 1,307,324 1,265,326
Total recognised income and expense for the year attributable to: Members 41,034 26,146 41,964 25,661 Minority interest - 424 - -
41,034 26,570 41,964 25,661
THE UNIVERSITY OF WESTERN AUSTRALIASTATEMENTS OF CHANGES IN EQUITY
FOR THE YEAR ENDED 31 DECEMBER 2005
The statements of changes in equity should be read in conjunction with the accompanying notes.
37

Consolidated University2005 2004 2005 2004
Notes $'000 $'000 $'000 $'000
Cash flows from operating activitiesReceipts Australian Government Commonwealth Grant Scheme and other DEST grants 75,712 64,510 76,362 64,510 Higher Education Loan Programmes 48,309 38,918 48,309 38,918 Scholarships 7,051 5,849 6,659 6,241 DEST – Research 59,061 54,171 58,803 53,779 ARC grant – Discovery 12,628 10,942 12,645 10,942 ARC grant – Linkages 8,070 5,881 9,068 5,881 ARC grant – Networks and Centres 3,507 1,993 2,509 1,993 Other Australian Government grants 68,603 60,799 68,586 60,799 Western Australian and Local Government financial assistance 31,347 33,502 31,347 33,502 HECS-HELP student payments 12,382 9,952 12,382 9,952 OS-HELP (net) 240 - 240 - Other research grants and contracts 27,028 24,653 27,028 24,617 Other fees and charges 56,384 54,876 56,384 54,526 Consultancy and other grants 11,111 7,670 11,111 7,670 Dividends received 289 287 289 287 Interest received 2,762 2,714 2,742 2,714 Other investment income received 2,089 9,247 2,089 9,216 Salary and other recoveries 20,096 17,494 20,096 17,496 Other receipts 37,690 22,064 33,776 21,368
Payments Employee benefits and on-costs (276,033) (247,541) (274,150) (247,233) Suppliers (146,470) (124,346) (144,338) (123,932) Other miscellaneous payments (39,410) (46,548) (39,510) (45,783)
Net cash inflow for operating activities 45 22,446 7,087 22,427 7,463
Cash flows from investing activitiesReceipts Proceeds from sale of investment properties 26,359 36,397 26,359 36,397 Proceeds from sale of plant and equipment 1,588 1,778 1,588 1,778 Proceeds from sale or redemption of investments and shares 83,044 15,000 83,044 15,000 Proceeds from disposal of subsidiary - 30 - 30 Other 1,318 915 1,318 915
Payments Payments for property, plant and equipment (71,465) (83,020) (71,452) (82,867) Payments for investment property (563) (1,368) (563) (1,095) Payments for sale or redemption of investments and shares (58,000) - (58,000) - Other (172) (132) (605) (132)
Net cash inflow/(outflow) for investing activities (17,891) (30,400) (18,311) (29,974)
Cash flows from financing activitiesReceipts Proceeds from borrowings and advances - 2,942 - -
Payments Repayment of borrowings and advances - (10) - -
Net cash inflow for financing activities - 2,932 - -
Net increase/(decrease) in cash and cash equivalents 4,555 (20,381) 4,116 (22,511)Cash and cash equivalents at the beginning of the year 31,354 54,120 31,147 53,596Effects of exchange rate fluctuations on cash held in foreign currencies 60 62 61 62Adjustment to cash on deconsolidation - (2,447) - - Cash and cash equivalents at the end of the year 21 35,969 31,354 35,324 31,147
THE UNIVERSITY OF WESTERN AUSTRALIACASH FLOW STATEMENTS
FOR THE YEAR ENDED 31 DECEMBER 2005
The cash flow statements should be read in conjunction with the accompanying notes.
38

THE UNIVERSITY OF WESTERN AUSTRALIA NOTES TO THE FINANCIAL STATEMENTS
31 DECEMBER 2005
Contents of the notes to the financial statements Note
1. Summary of significant accounting policies Revenue
2. Australian Government financial assistance including HECS-HELP and other Australian Government Loan Programmes
3. Western Australian and Local Government financial assistance 4. Other research grants and contracts 5. Investment income 6. Fees and charges 7. Salaries and other recoveries 8. Other revenue Expenses
9. Employee benefits and on-costs 10. Student expenses 11. Materials and supplies 12. Depreciation, amortisation and impairment 13. Repairs and maintenance 14. Grants distributed 15. Travel 16. Professional fees 17. Other expenses 18. Remuneration of University’s Senate members and senior officers 19. Remuneration of auditors 20. Explanatory statement on significant variations for University funds
Assets
21. Cash and cash equivalents 22. Receivables 23. Inventories 24. Non-current assets classified as held for sale—restricted 25. Investment properties—restricted 26. Other financial assets 27. Investments accounted for using the equity method 28. Property, plant and equipment 29. Intangible assets 30. Restricted assets
Liabilities
31. Payables 32. Other financial liabilities 33. Provisions 34. Deferred revenue
Equity
35. Reserves 36. Retained profits
37. Commitments 38. Contingent liabilities and assets 39. Supplementary financial information 40. Related party transactions 41. Subsidiaries 42. Investments in associates 43. Events occurring after the balance sheet date 44. Segment information 45. Reconciliation of net operating results to net cash inflow from operating activities 46. Financial instruments 47. Explanation of transition to Australian equivalents to International Financial Reporting Standards 48. Acquittal of Australian Government financial assistance
39
THE UNIVERSITY OF WESTERN AUSTRALIA NOTES TO THE FINANCIAL STATEMENTS
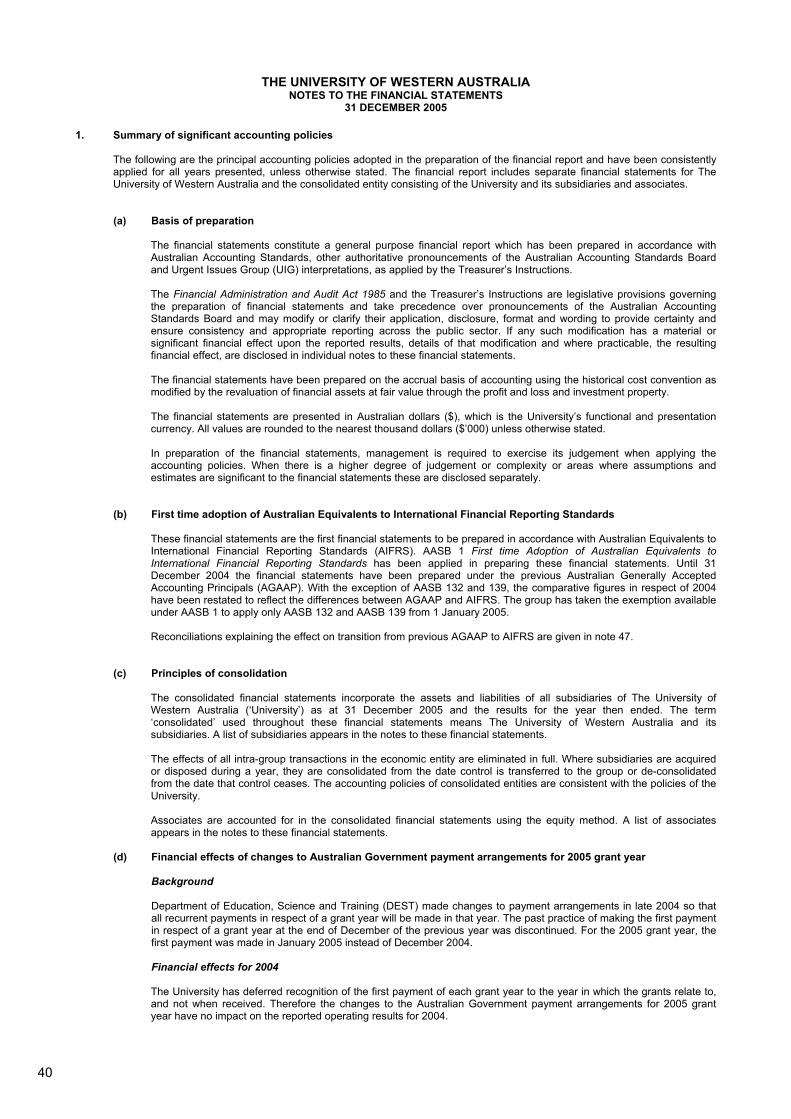
31 DECEMBER 2005 1. Summary of significant accounting policies The following are the principal accounting policies adopted in the preparation of the financial report and have been consistently
applied for all years presented, unless otherwise stated. The financial report includes separate financial statements for The University of Western Australia and the consolidated entity consisting of the University and its subsidiaries and associates.
(a) Basis of preparation
The financial statements constitute a general purpose financial report which has been prepared in accordance with Australian Accounting Standards, other authoritative pronouncements of the Australian Accounting Standards Board and Urgent Issues Group (UIG) interpretations, as applied by the Treasurer’s Instructions. The Financial Administration and Audit Act 1985 and the Treasurer’s Instructions are legislative provisions governing the preparation of financial statements and take precedence over pronouncements of the Australian Accounting Standards Board and may modify or clarify their application, disclosure, format and wording to provide certainty and ensure consistency and appropriate reporting across the public sector. If any such modification has a material or significant financial effect upon the reported results, details of that modification and where practicable, the resulting financial effect, are disclosed in individual notes to these financial statements. The financial statements have been prepared on the accrual basis of accounting using the historical cost convention as modified by the revaluation of financial assets at fair value through the profit and loss and investment property. The financial statements are presented in Australian dollars ($), which is the University’s functional and presentation currency. All values are rounded to the nearest thousand dollars ($’000) unless otherwise stated. In preparation of the financial statements, management is required to exercise its judgement when applying the accounting policies. When there is a higher degree of judgement or complexity or areas where assumptions and estimates are significant to the financial statements these are disclosed separately.
(b) First time adoption of Australian Equivalents to International Financial Reporting Standards
These financial statements are the first financial statements to be prepared in accordance with Australian Equivalents to International Financial Reporting Standards (AIFRS). AASB 1 First time Adoption of Australian Equivalents to International Financial Reporting Standards has been applied in preparing these financial statements. Until 31 December 2004 the financial statements have been prepared under the previous Australian Generally Accepted Accounting Principals (AGAAP). With the exception of AASB 132 and 139, the comparative figures in respect of 2004 have been restated to reflect the differences between AGAAP and AIFRS. The group has taken the exemption available under AASB 1 to apply only AASB 132 and AASB 139 from 1 January 2005. Reconciliations explaining the effect on transition from previous AGAAP to AIFRS are given in note 47.
(c) Principles of consolidation
The consolidated financial statements incorporate the assets and liabilities of all subsidiaries of The University of Western Australia (‘University’) as at 31 December 2005 and the results for the year then ended. The term ‘consolidated’ used throughout these financial statements means The University of Western Australia and its subsidiaries. A list of subsidiaries appears in the notes to these financial statements. The effects of all intra-group transactions in the economic entity are eliminated in full. Where subsidiaries are acquired or disposed during a year, they are consolidated from the date control is transferred to the group or de-consolidated from the date that control ceases. The accounting policies of consolidated entities are consistent with the policies of the University. Associates are accounted for in the consolidated financial statements using the equity method. A list of associates appears in the notes to these financial statements.
(d) Financial effects of changes to Australian Government payment arrangements for 2005 grant year
Background Department of Education, Science and Training (DEST) made changes to payment arrangements in late 2004 so that all recurrent payments in respect of a grant year will be made in that year. The past practice of making the first payment in respect of a grant year at the end of December of the previous year was discontinued. For the 2005 grant year, the first payment was made in January 2005 instead of December 2004.
Financial effects for 2004 The University has deferred recognition of the first payment of each grant year to the year in which the grants relate to, and not when received. Therefore the changes to the Australian Government payment arrangements for 2005 grant year have no impact on the reported operating results for 2004.
40
THE UNIVERSITY OF WESTERN AUSTRALIA NOTES TO THE FINANCIAL STATEMENTS
31 DECEMBER 2005 1. Summary of significant accounting policies (continued)
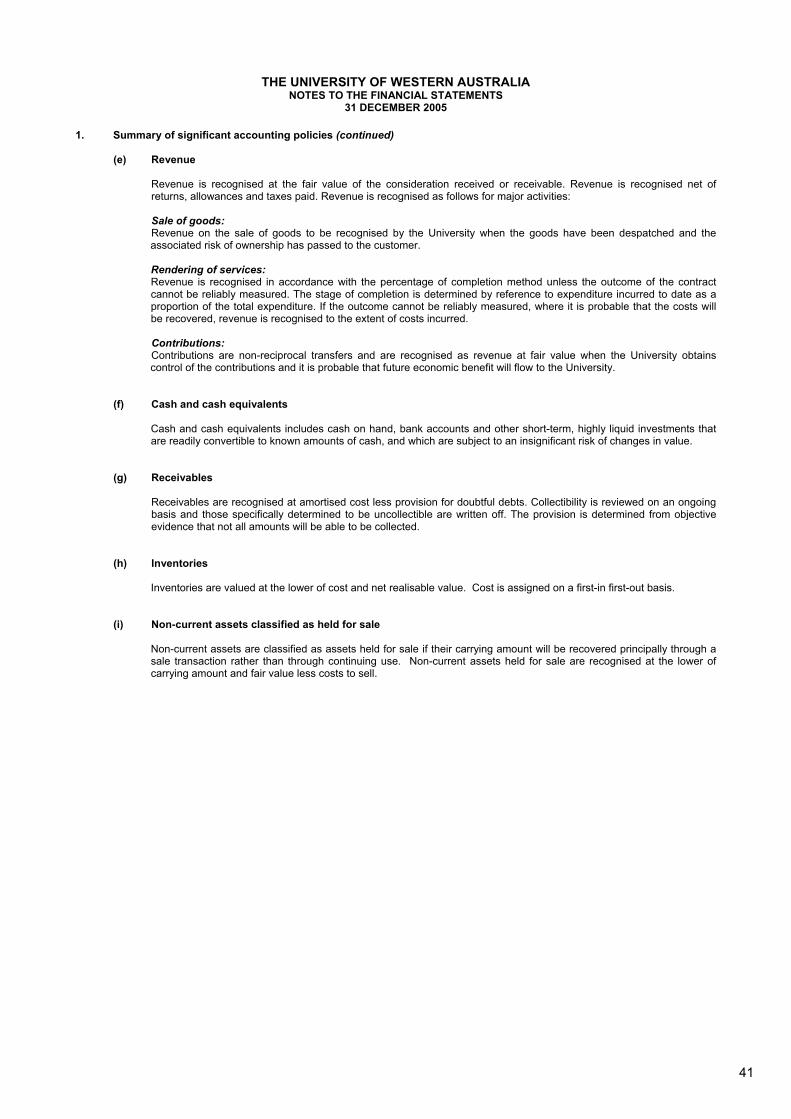
(e) Revenue
Revenue is recognised at the fair value of the consideration received or receivable. Revenue is recognised net of returns, allowances and taxes paid. Revenue is recognised as follows for major activities:
Sale of goods: Revenue on the sale of goods to be recognised by the University when the goods have been despatched and the associated risk of ownership has passed to the customer. Rendering of services: Revenue is recognised in accordance with the percentage of completion method unless the outcome of the contract cannot be reliably measured. The stage of completion is determined by reference to expenditure incurred to date as a proportion of the total expenditure. If the outcome cannot be reliably measured, where it is probable that the costs will be recovered, revenue is recognised to the extent of costs incurred. Contributions: Contributions are non-reciprocal transfers and are recognised as revenue at fair value when the University obtains control of the contributions and it is probable that future economic benefit will flow to the University.
(f) Cash and cash equivalents Cash and cash equivalents includes cash on hand, bank accounts and other short-term, highly liquid investments that are readily convertible to known amounts of cash, and which are subject to an insignificant risk of changes in value.
(g) Receivables
Receivables are recognised at amortised cost less provision for doubtful debts. Collectibility is reviewed on an ongoing basis and those specifically determined to be uncollectible are written off. The provision is determined from objective evidence that not all amounts will be able to be collected.
(h) Inventories
Inventories are valued at the lower of cost and net realisable value. Cost is assigned on a first-in first-out basis.
(i) Non-current assets classified as held for sale
Non-current assets are classified as assets held for sale if their carrying amount will be recovered principally through a sale transaction rather than through continuing use. Non-current assets held for sale are recognised at the lower of carrying amount and fair value less costs to sell.
41

THE UNIVERSITY OF WESTERN AUSTRALIA NOTES TO THE FINANCIAL STATEMENTS
31 DECEMBER 2005 1. Summary of significant accounting policies (continued)
(j) Investments and other financial assets
From 1 January 2004 to 31 December 2004 The University has taken the exemption available under AASB 1 to apply AASB 132 and AASB 139 only from 1 January 2005. Comparative information is determined using previous AGAAP requirements. Under previous requirements unlisted shares and loan advances were recorded at cost. From 1 January 2005 The University has classified its financial assets into the following categories: financial assets at fair value through the profit and loss; loans and receivables; held-to-maturity investments; and available-for-sale financial assets. The classification depends on the purpose for which the assets are acquired. Financial assets at fair value through the profit and loss This category has two sub-categories: financial assets held for trading; and assets designated as fair value upon initial recognition. Held-for-trading assets are principally for the purpose of generating a profit from short-term fluctuations in value. When derivatives are held they will be classified as held-for-trading unless they are accounted for as hedges. Assets within this category are recorded at fair value based on market prices and changes in fair value recognised in the income statement. Loans and receivables Loans and receivables are non-derivative financial assets with fixed or determinable payments that are not quoted in an active market. They typically arise when the group provides money, goods or services directly to a debtor with no intention of trading the receivable. Assets within this category are recorded at amortised cost. Held-to-maturity investments Held-to-maturity investments are financial assets with fixed or determinable payments and fixed maturity that the group has the positive intent and ability to hold to maturity. Assets within this category are recorded at amortised cost. Available-for-sale financial assets Available-for-sale assets are those designated as available for sale or not classified in another category. Assets within this category are recorded at fair value and changes in fair value recognised in equity. The University assesses at each balance sheet date whether there is objective evidence that a financial asset or group of financial assets is impaired.
(k) Investment properties Initially investment properties are measured at cost including transaction costs. Subsequent to initial recognition,
investment properties are stated at fair value determined annually by external valuers. Any gains or losses arising from changes in the fair values of investment properties are included in the income statements in the year in which they arise.
42

THE UNIVERSITY OF WESTERN AUSTRALIA NOTES TO THE FINANCIAL STATEMENTS
31 DECEMBER 2005 1. Summary of significant accounting policies (continued)
(l) Property, plant and equipment
Property, plant and equipment is measured at cost less accumulated depreciation less accumulated impairment losses. Where an asset is acquired at no cost or for a nominal cost, the cost recorded is the fair value of the asset at the acquisition date. Subsequent costs are included in the assets carrying value or recognised as a separate asset, where appropriate, when it is probable that future economic benefit associated with the asset will flow to the University. All other repairs and maintenance are charged to the income statement when incurred.
The depreciation rate policy is as follows:
Asset class Depreciation rate
Leasehold land Not depreciated Freehold land Not depreciated Buildings 2% reducing balance Computer hardware 25% straight line Equipment 12.5% straight line Motor vehicles 17.5% straight line if held more than one year Artworks Not depreciated Special collections Not depreciated Library books Depreciated 100% in fourth year after acquisition
Assets’ residual values and useful lives are reviewed at each balance sheet date. Profits and losses on disposal are recorded in the income statement for the year. Impairment testing is performed when an indicator of impairment is identified.
(m) Impairment
Assets that have an indefinite useful life are tested annually for impairment. Assets with a finite life are tested for impairment when events or changes in circumstances indicate the carrying value may not be recoverable. An impairment loss is recognised for the amount by which the asset’s carrying value exceeds the recoverable amount. The recoverable amount is the higher of its fair value less costs to sell and its value in use. As the University is a not-for-profit entity, if the future economic benefits of the asset are not primarily dependent on its ability to generate net cash flows, unless the asset has been identified as surplus, the value in use is its depreciated replacement cost.
(n) Intangible assets
Intangible assets are capitalised at cost and from a business combination are capitalised at fair value as at the date of acquisition. Following initial recognition, the cost model is applied to the class of intangible assets. Expenditure on research activities is recognised as an expense in the income statement when incurred. Expenditure on development activities is expensed unless the outcome is technically and commercially feasible, resources are available to complete the development and there is a commitment to complete the project. Amortisation is calculated on a straight line basis over the estimated useful life of the asset. The useful life of software is currently determined to be ten years. Impairment testing is performed when an indicator of impairment is identified.
(o) Leases
Leases where the lessor has substantially all the risks and rewards of ownership are classified as finance leases. Finance leases are capitalised at the lower of fair value and the present value of the minimum lease payments and the corresponding obligation is recorded in payables. Each lease payment is allocated between the finance charge and reducing the liability. Leases are classified as operating leases when the lessor retains substantially all the risks and rewards of ownership. Payments or income received under operating leases are recognised in the income statement on a straight line basis over the lease term. Where the University is the lessor, the asset subject to an operating lease is recognised in the balance sheet according to the nature of the asset.
43

THE UNIVERSITY OF WESTERN AUSTRALIA NOTES TO THE FINANCIAL STATEMENTS
31 DECEMBER 2005 1. Summary of significant accounting policies (continued)
(p) Payables
Payables represent liabilities for goods or services incurred on or before reporting date.
(q) Provisions
Provisions are recognised where there is a present obligation as a result of a past event, it is probable that an outflow of economic benefit will be required to settle the obligation and a reliable estimate can be made of the amount. If the effect of the time value of money is material the provision will be discounted.
(r) Employee benefits (i) Wages, salaries and annual leave Liabilities for wages, salaries and annual leave are recognised and measured as the amount unpaid at the
reporting date at expected value in respect of employees’ services up to that date. (ii) Long service leave A liability for long service leave is recognised and measured as the present value of expected future payments
to be made in respect of services provided by employees up to the reporting date. Consideration is given to expected future wage and salary levels, based on statistical data related to employee departures and periods of service.
(iii) Parental leave A liability for parental leave is recognised based on the University’s present obligation to make future parental
leave payments in respect of services provided by employees up to the reporting date. The value of these future payments incorporates expected future wage and salary levels, based on statistical data related to historical employee parental leave and periods of service.
(iv) Superannuation
The University contributes to a number of employee funds that exist to provide benefits for employees and their
dependants on retirement, disability or death. Three of these funds are defined benefit pension schemes. Expenses incurred in relation to schemes accounted for as defined benefit schemes are determined using the
projected unit credit actuarial valuation method. Actuarial gains and losses are recognised immediately as an income or expense in the income statement.
The University recognises amounts payable to defined contributions schemes as an expense in the income
statement in the period that the service has been rendered by the employee.
(v) Other employee benefits All other benefits are recognised when the benefit is received by the employee and measured at the rates paid or payable.
(s) Income tax The University is exempt from income tax in Australia.
The University is subject to foreign income tax for overseas operations, currently no income tax has been payable. Deferred tax assets are only recognised where it is probable that future taxable amounts will be available to utilise those temporary differences and unused tax losses.
(t) Foreign currency transactions
The functional currency of the University and its subsidiaries is the Australian dollar. Foreign currency transactions are initially translated into Australian currency at the rate of exchange at the date of the transaction. At the reporting date, amounts payable and receivable in foreign currencies are translated to Australian currency at rates of exchange at that date. Non-monetary items held at the reporting date are measured using the exchange rate at the date of the initial transaction. Resulting exchange differences are recognised in the income statements.
44

Consolidated University2005 2004 2005 2004
Notes $'000 $'000 $'000 $'000
2. Australian Government financial assistance includingHECS-HELP and other Australian Government loan programmes
(a) Commonwealth Grant Scheme and other grants Commonwealth Grant Scheme 48.1 77,273 60,765 77,273 60,765 Indigenous Support Fund 48.1 507 - 507 - Equity Programmes 48.1 364 143 364 143 Workplace Reform Programme 48.1 1,128 2,266 1,128 2,266 Capital Development Pool 48.1 1,570 1,049 1,570 1,049Total Commonwealth Grant Scheme and Other Grants 80,842 64,223 80,842 64,223
(b) Higher Education Loan Programmes (HELP) HECS-HELP 48.2 42,441 38,161 42,441 38,161 FEE-HELP 48.2 4,195 3,721 4,195 3,721Total Higher Education Loan Programmes 46,636 41,882 46,636 41,882
(c) Scholarships Australian Postgraduate Awards 48.3 4,705 4,680 4,705 4,680 International Postgraduate Research Scholarships 48.3 1,516 1,242 1,516 1,242 Commonwealth Education Costs Scholarships 48.3 292 98 292 98 Commonwealth Accommodation Scholarships 48.3 555 256 555 256Total Scholarships 7,068 6,276 7,068 6,276
(d) DEST – Research Institutional Grants Scheme 48.4 16,254 15,969 16,254 15,969 Research Training Scheme 48.4 28,904 28,412 28,904 28,412 Systemic Infrastructure Initiative 48.4 - 2,080 - 2,080 Research Infrastructure Block Grants 48.4 13,903 12,420 13,903 12,420Total DEST – Research Grants 59,061 58,881 59,061 58,881
(e) Australian Research Council(i) Discovery Projects 48.5 11,008 9,267 11,008 9,267 Fellowships 48.5 967 730 967 730Total Discovery 11,975 9,997 11,975 9,997
(ii) Linkages Infrastructure 48.5 2,767 1,498 2,767 1,498 International 48.5 360 76 360 76 Projects 48.5 4,916 3,606 4,916 3,606 Special Research Initiatives 48.5 32 47 32 47Total Linkages 8,075 5,227 8,075 5,227
(iii) Networks and Centres Research Networks 48.5 793 - 793 - Centres 48.5 1,553 1,806 1,553 1,806Total Networks and Centres 2,346 1,806 2,346 1,806
(f) Other Australian Government financial assistance National Health and Medical Research Council 25,436 23,313 25,436 23,313 Other Commonwealth research grants 16,725 21,487 16,725 21,487 Other Commonwealth grants 14,312 12,591 14,312 12,591 Building capital grants 819 431 819 431Total other Australian Government financial assistance 57,292 57,822 57,292 57,822
Total Australian Government financial assistance 273,295 246,114 273,295 246,114
ReconciliationAustralian Government grants 226,659 204,232 226,659 204,232HECS-HELP – Australian Government payments 42,441 38,161 42,441 38,161FEE-HELP 4,195 3,721 4,195 3,721Total Australian Government financial assistance 273,295 246,114 273,295 246,114
THE UNIVERSITY OF WESTERN AUSTRALIANOTES TO THE FINANCIAL STATEMENTS
31 DECEMBER 2005
45

Consolidated University2005 2004 2005 2004
Notes $'000 $'000 $'000 $'000
THE UNIVERSITY OF WESTERN AUSTRALIANOTES TO THE FINANCIAL STATEMENTS
31 DECEMBER 2005
3.
Research grants 10,492 12,732 10,492 12,732Other grants 17,114 18,873 17,114 18,873
27,606 31,605 27,606 31,605
4. Other research grants and contracts
International 6,201 6,358 6,201 6,358Bequests and donations 1,015 1,041 1,015 1,041Industry and others 14,773 11,496 14,773 11,460Total other research grants and contracts 21,989 18,895 21,989 18,859
5. Investment income
Fair value gain on investment assets 18,027 29,083 18,027 29,083Dividend income 4,469 7,153 4,469 7,153Interest income 7,819 6,244 7,803 6,244Trust distributions 23,266 13,782 23,266 13,782Rental income 2,584 6,499 2,584 6,499Fair value gain/(loss) on investment property (178) 1,347 (178) 1,347Other investment income 45 3,073 (27) 3,041Loss on disposal of shares in subsidiary - (318) - (1,890)Total investment income 56,032 66,863 55,944 65,259
6. Fees and charges
Course fees and chargesContinuing education and short courses 7,274 6,969 7,274 6,969Fee-paying domestic postgraduate students 3,218 2,994 3,230 2,994Fee-paying domestic undergraduate students 36 - 36 - Fee-paying overseas students – onshore courses 34,286 30,962 34,286 30,962Fee-paying overseas students – offshore courses 3,861 4,486 3,861 4,486Total-course fees and charges 48,675 45,411 48,687 45,411
Other fees and chargesAmenities and services fees 1,598 1,465 1,598 1,465Student accommodation 2,066 2,071 2,066 2,071Parking fees 1,553 1,504 1,557 1,504Registration fees 1,526 2,016 1,526 2,016Rental and hire charges 1,048 444 747 444Other 881 609 881 609Total other fees and charges 8,672 8,109 8,375 8,109Total fees and charges 57,347 53,520 57,062 53,520
7. Salaries and other recoveries
Salary recoveries 13,504 11,640 13,482 11,640Other recoveries 4,851 4,613 4,876 4,623Total salary and other recoveries 18,355 16,253 18,358 16,263
Total Western Australian and Local Government financial assistance
Western Australian and Local Government financial assistance
46

Consolidated University2005 2004 2005 2004
Notes $'000 $'000 $'000 $'000
THE UNIVERSITY OF WESTERN AUSTRALIANOTES TO THE FINANCIAL STATEMENTS
31 DECEMBER 2005
8. Other revenue
Sales of goods and services 8,806 6,213 6,119 5,843Donations, bequests and sponsorships 9,417 5,724 9,417 5,724Scholarships and prizes 1,108 632 1,108 632Rental property income 1,961 1,969 1,961 1,969Other general grants 5,753 2,903 5,753 2,903Consultancy 6,583 4,488 5,785 4,103Royalties and licences 579 885 579 885Performance and production 2,252 2,808 2,252 2,808Other 4,850 2,966 4,183 2,966Total other revenue 41,309 28,588 37,157 27,833
9. Employee benefits and on-costs
AcademicSalaries 113,272 107,077 113,272 107,077Superannuation – funded 17,438 16,157 17,438 16,157Annual leave provision (53) (31) (53) (31)Long service leave provision 1,104 1,340 1,104 1,340Employment on-costs Payroll tax 7,158 7,257 7,158 7,257 Workers' compensation 519 527 519 527Other 6,371 6,619 6,371 6,619Total academic 145,809 138,946 145,809 138,946
Non-academicSalaries 107,119 93,987 104,548 93,625Superannuation – funded 14,130 12,583 14,012 12,560Annual leave provision 529 953 404 929Long service leave provision 331 2,409 331 2,409Employment on-costs Payroll tax 6,197 6,202 6,197 6,176 Workers' compensation 474 457 474 457Other 2,208 2,957 2,032 2,954Total non-academic 130,988 119,548 127,998 119,110Total employee benefits and on costs 276,797 258,494 273,807 258,056
10. Student expenses
Scholarships and studentships 20,550 17,300 20,550 17,300Grants and prizes 2,271 2,320 2,275 2,320Amenities and services expenses 1,466 1,380 1,466 1,380Total student expenses 24,287 21,000 24,291 21,000
11. Materials and supplies
Laboratory, workshop and medical supplies 10,548 9,173 10,551 9,035General office expenses 7,257 6,347 7,183 6,347Other general consumables and supplies 4,779 3,917 3,584 3,934Total materials and supplies 22,584 19,437 21,318 19,316
12. Depreciation, amortisation and impairment
Buildings 8,975 8,940 8,975 8,940Computer hardware 3,204 2,596 3,204 2,584Equipment 8,052 8,110 8,049 8,033Motor vehicles 655 884 655 884Library books 3,166 4,268 3,166 4,268Intangible assets – amortisation 621 213 621 - Impairments - 294 - 294Total depreciation, amortisation and impairment 24,673 25,305 24,670 25,003
47
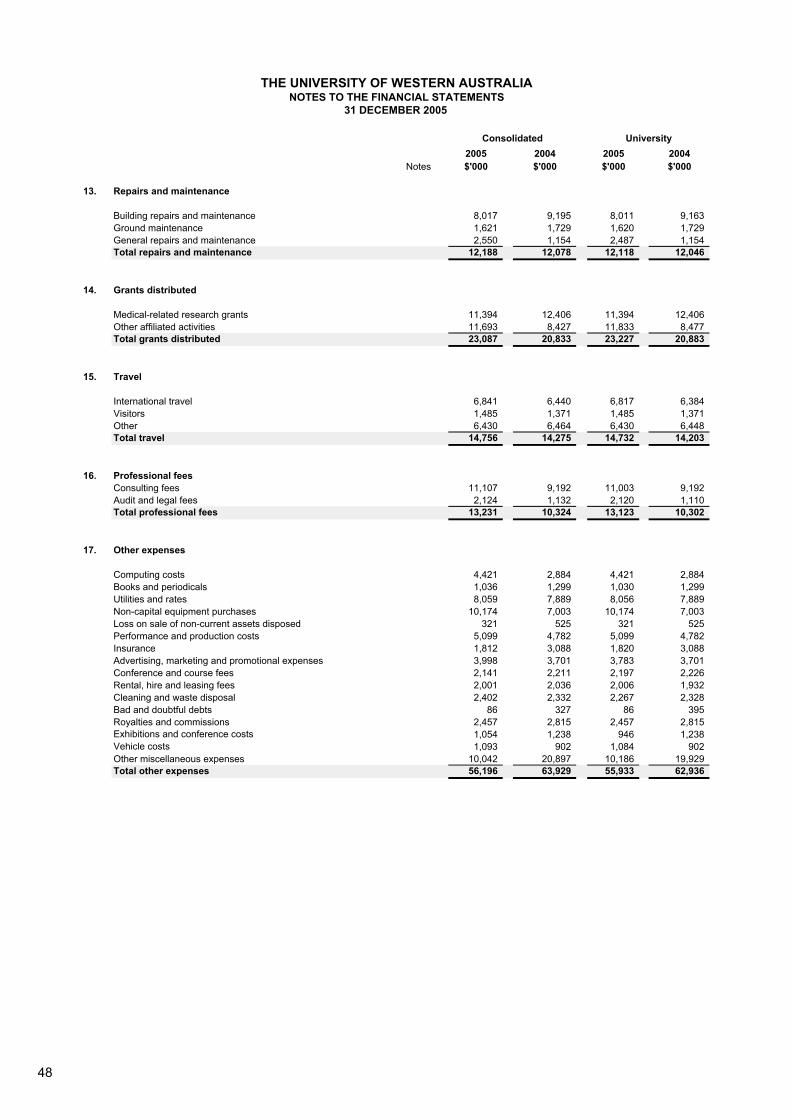
Consolidated University2005 2004 2005 2004
Notes $'000 $'000 $'000 $'000
THE UNIVERSITY OF WESTERN AUSTRALIANOTES TO THE FINANCIAL STATEMENTS
31 DECEMBER 2005
13. Repairs and maintenance
Building repairs and maintenance 8,017 9,195 8,011 9,163Ground maintenance 1,621 1,729 1,620 1,729General repairs and maintenance 2,550 1,154 2,487 1,154Total repairs and maintenance 12,188 12,078 12,118 12,046
14. Grants distributed
Medical-related research grants 11,394 12,406 11,394 12,406Other affiliated activities 11,693 8,427 11,833 8,477Total grants distributed 23,087 20,833 23,227 20,883
15. Travel
International travel 6,841 6,440 6,817 6,384Visitors 1,485 1,371 1,485 1,371Other 6,430 6,464 6,430 6,448Total travel 14,756 14,275 14,732 14,203
16. Professional feesConsulting fees 11,107 9,192 11,003 9,192Audit and legal fees 2,124 1,132 2,120 1,110Total professional fees 13,231 10,324 13,123 10,302
17. Other expenses
Computing costs 4,421 2,884 4,421 2,884Books and periodicals 1,036 1,299 1,030 1,299Utilities and rates 8,059 7,889 8,056 7,889Non-capital equipment purchases 10,174 7,003 10,174 7,003Loss on sale of non-current assets disposed 321 525 321 525Performance and production costs 5,099 4,782 5,099 4,782Insurance 1,812 3,088 1,820 3,088Advertising, marketing and promotional expenses 3,998 3,701 3,783 3,701Conference and course fees 2,141 2,211 2,197 2,226Rental, hire and leasing fees 2,001 2,036 2,006 1,932Cleaning and waste disposal 2,402 2,332 2,267 2,328Bad and doubtful debts 86 327 86 395Royalties and commissions 2,457 2,815 2,457 2,815Exhibitions and conference costs 1,054 1,238 946 1,238Vehicle costs 1,093 902 1,084 902Other miscellaneous expenses 10,042 20,897 10,186 19,929Total other expenses 56,196 63,929 55,933 62,936
48

Consolidated University2005 2004 2005 2004
$'000 $'000 $'000 $'000
THE UNIVERSITY OF WESTERN AUSTRALIANOTES TO THE FINANCIAL STATEMENTS
31 DECEMBER 2005
18. Remuneration of University's Senate members and senior officers
915 1,318 915 1,318
3,442 3,117 3,442 3,117
2005 2004 2005 2004$0,000–$9,999 - - - 1$10,000–$19,999 1 - - 1$20,000–$29,999 2 - - -$30,000–$39,999 1 1 - -$70,000–$79,999 1 - - -$90,000–$99,999 - - - 1$100,000–$109,999 - 2 - -$110,000–$119,999 - - - 1$120,000–$129,999 1 - - -$130,000–$139,999 - - 2 1$140,000–$149,999 1 1 - -$150,000–$159,999 - 1 - -$160,000–$169,999 - - - 1$180,000–$189,999 - - 2 3$190,000–$199,999 - - 2 -$200,000–$209,999 - - 2 2$210,000–$219,999 - - - 1$220,000–$229,999 - - - 1$240,000–$249,999 - - - 1$250,000–$259,999 - - - 1$260,000–$269,999 - - 2 1$270,000–$279,999 - - 2 -$290,000–$299,999 - - 1 1$300,000–$309,999 - - 1 -$320,000–$329,999 - 1 - -$330,000–$339,999 - - 1 -$450,000–$459,999 - 1 - -$480,000–$489,999 1 - - -
19. Remuneration of auditors
Office of the Auditor GeneralAudit fees – auditing the financial statements and performance indicators, and research grant certifications 140 135 140 135 Total audit fees 140 135 140 135
Senate membersSenior officers of the
University
All Senate members serve in an honorary capacity. Remuneration ofSenate members quoted only reflects remuneration (including salariesand other benefits) paid by the University to the Vice-Chancellor andthe five elected staff members.
The total fees, salaries, superannuation and other benefits received ordue and receivable by members of the Senate, the Governing Body, forthe financial year.
The total fees, salaries, superannuation and other benefits received ordue and receivable by senior officers of the University for the financialyear.
The number of Senate members and executive officers whose totalfees, salaries, superannuation and other benefits (includes leaveentitlement payout) received or due and receivable for the financialyear, falls within the following bands:
49

THE UNIVERSITY OF WESTERN AUSTRALIA NOTES TO THE FINANCIAL STATEMENTS
31 DECEMBER 2005 20. Explanatory statement on significant variations for University funds
This statement provides details of any significant variations between the University’s budget and the actual results for 2005 and between the actual results for 2005 and 2004. Significant variations are considered to be those greater than 10 per cent.
a) Significant variations between budget and actual results for the financial year The University Senate approves the budget and allocations for the operations of the University. Currently the University’s budget procedure results in the expenditure budget figures being based on the current year revenue allocations. This can result in substantial variations in expenditure patterns. Therefore, to increase comparability and provide a more meaningful analysis, the expenditure budgets have been adjusted for capitalised expenditure on plant and equipment and accrual items.
Variance REVENUE
Budget $’000
Actual $’000 $’000 %
Explanation
Australian Government grants 237,044 226,659 (10,385) (4.4) -
HECS-HELP 54,220 56,213 1,993 3.7 -
FEE-HELP 4,476 4,195 (281) (6.3) -
Western Australian and Local Government financial assistance 34,540 27,606 (6,934) (20.1)
Budget prepared under different basis of revenue recognition and does not incorporate IFRS adjustments
Other research grants and contracts 19,230 21,989 2,759 14.3 Obtained additional or
increased grant funding
Investment income 33,230 55,944 22,714 68.4
Strong market performance has resulted in higher returns than anticipated. In addition, disposals of commercial rental properties occurred earlier than planned
Fees and charges 51,699 57,062 5,363 10.4 Additional fees for short courses
Salary and other recoveries 13,227 18,358 5,131 38.8 Other recoveries not included in budget
Other revenue 33,701 37,157 3,456 10.3 Donations received for specific projects
Total revenue 481,367 505,183 23,816 4.9 -
Variance EXPENDITURE
Budget $’000
Actual $’000 $’000 %
Explanation
Teaching and research 360,561 333,608 (26,953) (7.5) -
Libraries 13,549 14,174 625 4.6 -
Student services, public services, building and grounds, and administration and general institutional services
88,044 115,437 27,393 31.1
Additional non-capital equipment purchases and a number of strategic projects approved subsequent to the budget
Total expenditure 462,154 463,219 1,065 0.2 -
50
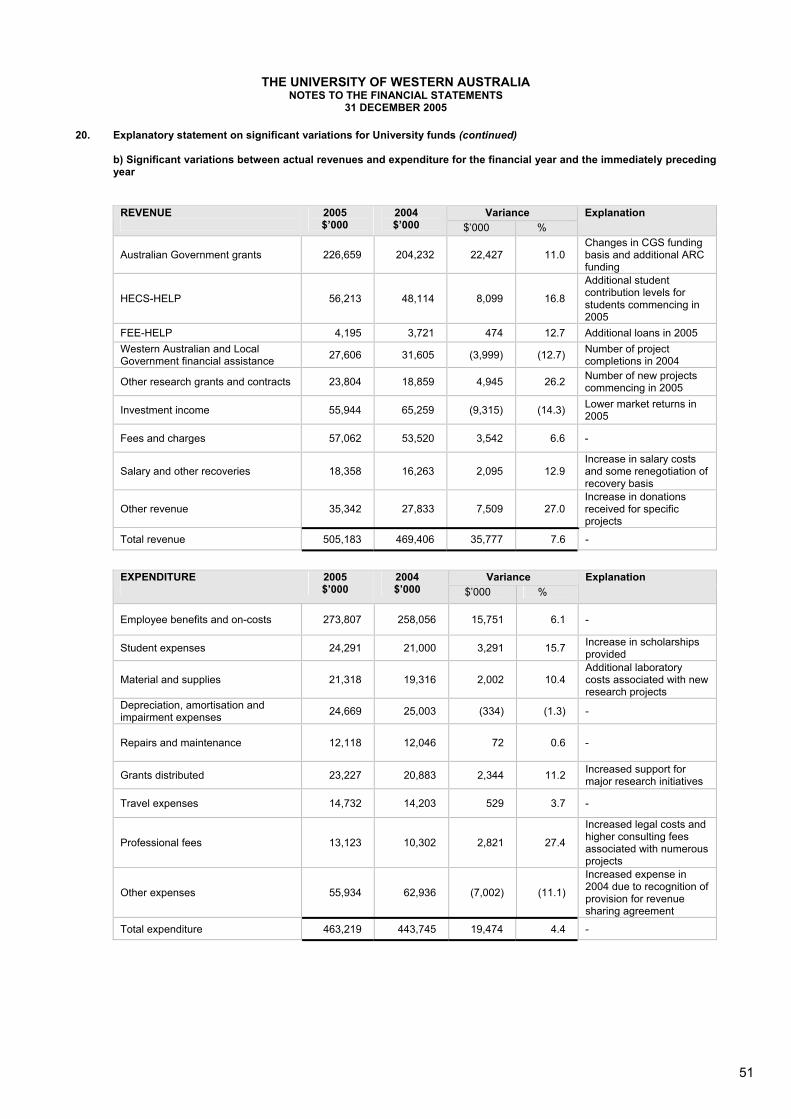
THE UNIVERSITY OF WESTERN AUSTRALIA NOTES TO THE FINANCIAL STATEMENTS
31 DECEMBER 2005 20. Explanatory statement on significant variations for University funds (continued)
b) Significant variations between actual revenues and expenditure for the financial year and the immediately preceding year
Variance REVENUE
2005 $’000
2004 $’000 $’000 %
Explanation
Australian Government grants 226,659 204,232 22,427 11.0 Changes in CGS funding basis and additional ARC funding
HECS-HELP 56,213 48,114 8,099 16.8
Additional student contribution levels for students commencing in 2005
FEE-HELP 4,195 3,721 474 12.7 Additional loans in 2005 Western Australian and Local Government financial assistance 27,606 31,605 (3,999) (12.7) Number of project
completions in 2004
Other research grants and contracts 23,804 18,859 4,945 26.2 Number of new projects commencing in 2005
Investment income 55,944 65,259 (9,315) (14.3) Lower market returns in 2005
Fees and charges 57,062 53,520 3,542 6.6 -
Salary and other recoveries 18,358 16,263 2,095 12.9 Increase in salary costs and some renegotiation of recovery basis
Other revenue 35,342 27,833 7,509 27.0 Increase in donations received for specific projects
Total revenue 505,183 469,406 35,777 7.6 -
Variance EXPENDITURE
2005 $’000
2004 $’000 $’000 %
Explanation
Employee benefits and on-costs 273,807 258,056 15,751 6.1 -
Student expenses 24,291 21,000 3,291 15.7 Increase in scholarships provided
Material and supplies 21,318 19,316 2,002 10.4 Additional laboratory costs associated with new research projects
Depreciation, amortisation and impairment expenses 24,669 25,003 (334) (1.3) -
Repairs and maintenance 12,118 12,046 72 0.6 -
Grants distributed 23,227 20,883 2,344 11.2 Increased support for major research initiatives
Travel expenses 14,732 14,203 529 3.7 -
Professional fees 13,123 10,302 2,821 27.4
Increased legal costs and higher consulting fees associated with numerous projects
Other expenses 55,934 62,936 (7,002) (11.1)
Increased expense in 2004 due to recognition of provision for revenue sharing agreement
Total expenditure 463,219 443,745 19,474 4.4 -
51
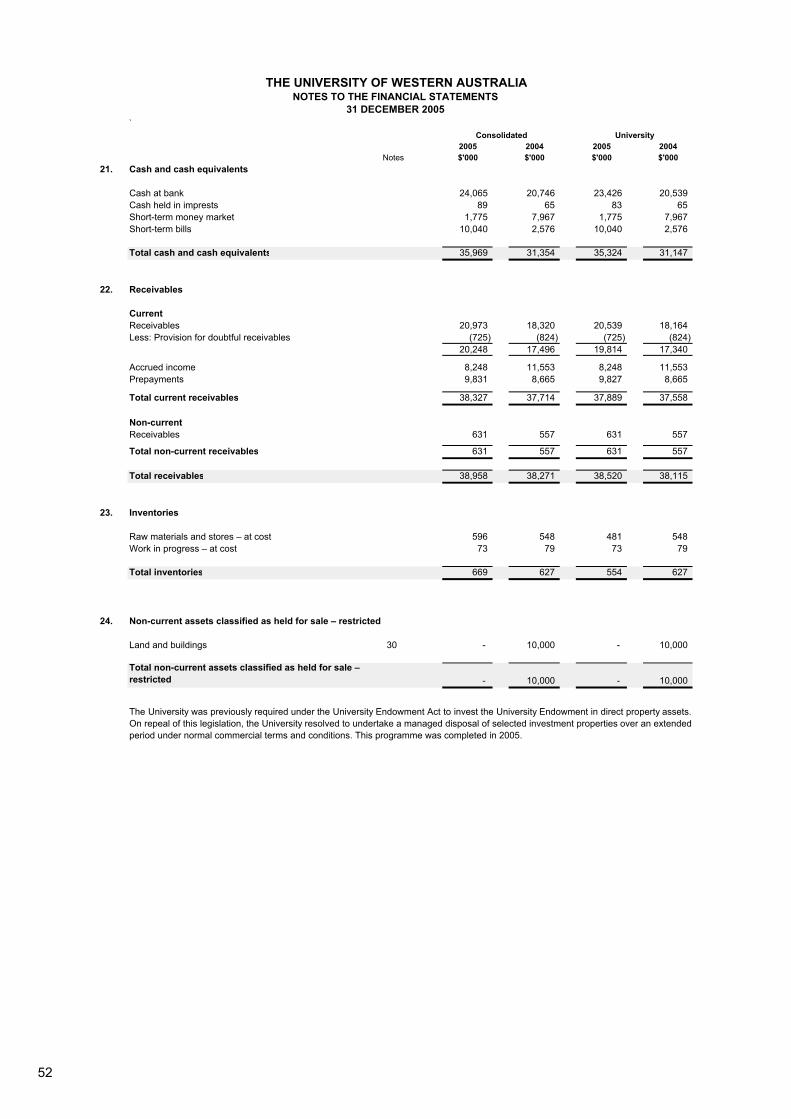
`Consolidated University
2005 2004 2005 2004Notes $'000 $'000 $'000 $'000
21. Cash and cash equivalents
Cash at bank 24,065 20,746 23,426 20,539Cash held in imprests 89 65 83 65Short-term money market 1,775 7,967 1,775 7,967Short-term bills 10,040 2,576 10,040 2,576
Total cash and cash equivalents 35,969 31,354 35,324 31,147
22. Receivables
CurrentReceivables 20,973 18,320 20,539 18,164Less: Provision for doubtful receivables (725) (824) (725) (824)
20,248 17,496 19,814 17,340
Accrued income 8,248 11,553 8,248 11,553Prepayments 9,831 8,665 9,827 8,665
Total current receivables 38,327 37,714 37,889 37,558
Non-currentReceivables 631 557 631 557
Total non-current receivables 631 557 631 557
Total receivables 38,958 38,271 38,520 38,115
23. Inventories
Raw materials and stores – at cost 596 548 481 548Work in progress – at cost 73 79 73 79
Total inventories 669 627 554 627
24. Non-current assets classified as held for sale – restricted
Land and buildings 30 - 10,000 - 10,000
Total non-current assets classified as held for sale – restricted - 10,000 - 10,000
The University was previously required under the University Endowment Act to invest the University Endowment in direct property assets.On repeal of this legislation, the University resolved to undertake a managed disposal of selected investment properties over an extendedperiod under normal commercial terms and conditions. This programme was completed in 2005.
THE UNIVERSITY OF WESTERN AUSTRALIANOTES TO THE FINANCIAL STATEMENTS
31 DECEMBER 2005
52

`Consolidated University
2005 2004 2005 2004Notes $'000 $'000 $'000 $'000
THE UNIVERSITY OF WESTERN AUSTRALIANOTES TO THE FINANCIAL STATEMENTS
31 DECEMBER 2005
25. Investment properties – restricted
At fair valueOpening balance 33,322 51,130 33,322 51,130Capitalised subsequent expenditure 563 1,093 563 1,093Classified as held for sale or disposals (16,510) (20,250) (16,510) (20,250)Net gain from fair value adjustment 65 1,347 65 1,347Closing balance 17,440 33,320 17,440 33,320
Total investment properties – restricted 30 17,440 33,320 17,440 33,320
(a) Amounts recognised in profit and loss for investment propertiesRental income 1,602 2,107 1,602 2,107Direct operating expenses from property that generated rental income (468) (984) (468) (984)Direct operating expenses from property that did not generate rental income (59) - (59) -
1,075 1,123 1,075 1,123
Properties that generated rental income were sold during the year.
(b) Valuation basis
26. Other financial assets
Managed investment portfolios 423,515 399,675 423,515 399,675Other shares and units 5,306 4,840 5,306 4,840Shares in associates - - 8,928 8,957Unsecured loan advances 3,798 3,235 4,160 3,235
Total other financial assets 432,619 407,750 441,909 416,707
Restricted 30 327,696 285,195 327,696 285,195Unrestricted 104,923 122,555 114,213 131,512
Total other financial assets 432,619 407,750 441,909 416,707
27. Investments accounted for using the equity method
Shares in associates 4,491 3,913 - -
4,491 3,913 - -
Shares in associates
Investment properties are stated at fair value, being the amounts for which properties could be exchanged between willing parties in anarm's length transaction, based on comparable market transactions. The valuation adjustments are based on independent assessmentsby a Certified Practising Valuer.
Total investments accounted for using the equity method
Investments in associates are accounted for in the consolidated financial statements using the equity method of accounting and arecarried at cost by the University (see note 26).
53

28Pr
oper
ty, p
lant
and
equ
ipm
ent
Free
hold
Le
aseh
old
Bui
dlin
gsB
uild
ings
Com
pute
rEq
uipm
ent
Mot
or
Art
wor
ksLi
brar
ySp
ecia
l TO
TAL
land
land
wor
k in
hard
war
e
vehi
cles
book
sco
llect
ions
prog
ress
$'00
0$'
000
$'00
0$'
000
$'00
0$'
000
$'00
0$'
000
$'00
0$'
000
$'00
0Ye
ar e
nded
31
Dec
embe
r 200
5C
onso
lidat
edA
t 1 J
anua
ry 2
005
Cos
t15
4,01
880
,000
447,
578
84,7
8016
,208
86,1
585,
377
21,2
8622
,192
37,6
7395
5,27
0A
ccum
ulat
ed d
epre
ciat
ion
- -
(8,9
40)
- (1
0,08
3)(5
0,66
9)(1
,289
)-
(9,3
76)
- (8
0,35
7)A
ccum
ulat
ed im
pairm
ent
- -
(294
)-
- -
- -
- -
(294
)N
et b
ook
valu
e15
4,01
880
,000
438,
344
84,7
806,
125
35,4
894,
088
21,2
8612
,816
37,6
7387
4,61
9
Add
ition
s9,
818
- 9,
424
25,7
755,
015
7,31
82,
176
46,
397
6165
,988
Dis
posa
ls-
- -
- (8
4)(3
15)
(1,4
90)
- -
- (1
,889
)D
epre
ciat
ion
- -
(8,9
75)
- (3
,204
)(8
,052
)(6
55)
- (3
,166
)-
(24,
052)
Impa
irmen
t-
- -
- -
- -
- -
- -
Tran
sfer
- -
87,6
80(8
7,68
0)28
(28)
- -
- -
-
9,81
8-
88,1
29(6
1,90
5)1,
755
(1,0
77)
314
3,23
161
40,0
47
At 3
1 D
ecem
ber 2
005
Cos
t16
3,83
680
,000
544,
380
22,8
7619
,313
91,0
055,
636
21,2
9028
,588
37,7
341,
014,
658
Acc
umul
ated
dep
reci
atio
n-
- (1
7,90
8)-
(11,
433)
(56,
593)
(1,5
17)
- (1
2,54
1)-
(99,
992)
Acc
umul
ated
impa
irmen
t-
- -
- -
- -
- -
- -
Net
boo
k va
lue
163,
836
80,0
0052
6,47
222
,876
7,88
034
,412
4,11
921
,290
16,0
4737
,734
914,
666
Res
trict
ed p
rope
rty, p
lant
and
equ
ipm
ent (
see
note
30)
188,
453
Unr
estri
cted
pro
perty
, pla
nt a
nd e
quip
men
t72
6,21
3
914,
666
THE
UN
IVER
SITY
OF
WES
TER
N A
UST
RA
LIA
NO
TES
TO T
HE
FIN
AN
CIA
L ST
ATE
MEN
TS31
DEC
EMB
ER 2
005
54

28Pr
oper
ty, p
lant
and
equ
ipm
ent (
cont
inue
d) Free
hold
Le
aseh
old
Bui
dlin
gsB
uild
ings
Com
pute
rEq
uipm
ent
Mot
or
Art
wor
ksLi
brar
ySp
ecia
l TO
TAL
land
land
wor
k in
hard
war
e
vehi
cles
book
sco
llect
ions
prog
ress
$'00
0$'
000
$'00
0$'
000
$'00
0$'
000
$'00
0$'
000
$'00
0$'
000
$'00
0
THE
UN
IVER
SITY
OF
WES
TER
N A
UST
RA
LIA
NO
TES
TO T
HE
FIN
AN
CIA
L ST
ATE
MEN
TS31
DEC
EMB
ER 2
005
Year
end
ed 3
1 D
ecem
ber 2
005
Uni
vers
ityA
t 1 J
anua
ry 2
005
Cos
t15
4,01
880
,000
447,
578
84,7
8016
,208
86,1
585,
377
21,2
8622
,192
37,6
7395
5,27
0A
ccum
ulat
ed d
epre
ciat
ion
- -
(8,9
40)
- (1
0,08
3)(5
0,66
9)(1
,289
)-
(9,3
76)
- (8
0,35
7)A
ccum
ulat
ed im
pairm
ent
- -
(294
)-
- -
- -
- -
(294
)N
et b
ook
valu
e15
4,01
880
,000
438,
344
84,7
806,
125
35,4
894,
088
21,2
8612
,816
37,6
7387
4,61
9
Add
ition
s9,
818
- 9,
424
25,7
755,
010
7,31
02,
176
46,
397
6165
,975
Dis
posa
ls-
- -
- (8
4)(3
15)
(1,4
90)
- -
- (1
,889
)D
epre
ciat
ion
- -
(8,9
75)
- (3
,204
)(8
,049
)(6
55)
- (3
,166
)-
(24,
049)
Impa
irmen
t-
- -
- -
- -
- -
- -
Tran
sfer
- -
87,6
80(8
7,68
0)28
(28)
- -
- -
-
9,81
8-
88,1
29(6
1,90
5)1,
750
(1,0
82)
314
3,23
161
40,0
37
At 3
1 D
ecem
ber 2
005
Cos
t16
3,83
680
,000
544,
380
22,8
7619
,308
90,9
975,
636
21,2
9028
,588
37,7
341,
014,
645
Acc
umul
ated
dep
reci
atio
n-
- (1
7,90
8)-
(11,
433)
(56,
590)
(1,5
17)
- (1
2,54
1)-
(99,
989)
Acc
umul
ated
impa
irmen
t-
- -
- -
- -
- -
- -
Net
boo
k va
lue
163,
836
80,0
0052
6,47
222
,876
7,87
534
,407
4,11
921
,290
16,0
4737
,734
914,
656
Res
trict
ed p
rope
rty, p
lant
and
equ
ipm
ent (
see
note
30)
188,
453
Unr
estri
cted
pro
perty
, pla
nt a
nd e
quip
men
t72
6,20
3
914,
656
55

28Pr
oper
ty, p
lant
and
equ
ipm
ent (
cont
inue
d) Free
hold
Le
aseh
old
Bui
dlin
gsB
uild
ings
Com
pute
rEq
uipm
ent
Mot
or
Art
wor
ksLi
brar
ySp
ecia
l TO
TAL
land
land
wor
k in
hard
war
e
vehi
cles
book
sco
llect
ions
prog
ress
$'00
0$'
000
$'00
0$'
000
$'00
0$'
000
$'00
0$'
000
$'00
0$'
000
$'00
0
THE
UN
IVER
SITY
OF
WES
TER
N A
UST
RA
LIA
NO
TES
TO T
HE
FIN
AN
CIA
L ST
ATE
MEN
TS31
DEC
EMB
ER 2
005
Year
end
ed 3
1 D
ecem
ber 2
004
Con
solid
ated
At 1
Jan
uary
200
4C
ost
152,
829
80,0
0044
3,44
128
,704
16,2
1682
,541
5,24
021
,118
16,6
3137
,504
884,
224
Acc
umul
ated
dep
reci
atio
n-
- -
- (1
0,15
4)(4
3,91
9)(7
52)
- (5
,108
)-
(59,
933)
Net
boo
k va
lue
152,
829
80,0
0044
3,44
128
,704
6,06
238
,622
4,48
821
,118
11,5
2337
,504
824,
291
Add
ition
s96
9-
1,83
558
,598
2,73
75,
771
2,51
316
85,
561
169
78,3
21D
ispo
sals
- -
- -
(54)
(386
)(1
,997
)-
- -
(2,4
37)
Dep
reci
atio
n-
- (8
,940
)-
(2,5
96)
(8,1
10)
(884
)-
(4,2
68)
- (2
4,79
8)Im
pairm
ent
- -
(294
)-
- -
- -
- -
(294
)Tr
ansf
er22
0-
2,30
2(2
,522
)-
- -
- -
- -
Adj
ustm
ent o
n di
lutio
n of
hol
ding
s in
sub
sidi
arie
s-
- -
- (2
4)(4
08)
(32)
- -
- (4
64)
1,
189
- (5
,097
)56
,076
63(3
,133
)(4
00)
168
1,29
316
950
,328
At 3
1 D
ecem
ber 2
004
Cos
t15
4,01
880
,000
447,
578
84,7
8016
,208
86,1
585,
377
21,2
8622
,192
37,6
7395
5,27
0A
ccum
ulat
ed d
epre
ciat
ion
- -
(8,9
40)
- (1
0,08
3)(5
0,66
9)(1
,289
)-
(9,3
76)
- (8
0,35
7)A
ccum
ulat
ed im
pairm
ent
- -
(294
)-
- -
- -
- -
(294
)N
et b
ook
valu
e15
4,01
880
,000
438,
344
84,7
806,
125
35,4
894,
088
21,2
8612
,816
37,6
7387
4,61
9
Res
trict
ed p
rope
rty, p
lant
and
equ
ipm
ent (
see
note
30)
171,
599
Unr
estri
cted
pro
perty
, pla
nt a
nd e
quip
men
t70
3,02
0
874,
619
56

28Pr
oper
ty, p
lant
and
equ
ipm
ent (
cont
inue
d) Free
hold
Le
aseh
old
Bui
dlin
gsB
uild
ings
Com
pute
rEq
uipm
ent
Mot
or
Art
wor
ksLi
brar
ySp
ecia
l TO
TAL
land
land
wor
k in
hard
war
e
vehi
cles
book
sco
llect
ions
prog
ress
$'00
0$'
000
$'00
0$'
000
$'00
0$'
000
$'00
0$'
000
$'00
0$'
000
$'00
0
THE
UN
IVER
SITY
OF
WES
TER
N A
UST
RA
LIA
NO
TES
TO T
HE
FIN
AN
CIA
L ST
ATE
MEN
TS31
DEC
EMB
ER 2
005
Year
end
ed 3
1 D
ecem
ber 2
004
Uni
vers
ityA
t 1 J
anua
ry 2
004
Cos
t15
2,82
980
,000
443,
441
28,7
0416
,154
81,9
745,
183
21,1
1816
,631
37,5
0488
3,53
8A
ccum
ulat
ed d
epre
ciat
ion
- -
- -
(10,
128)
(43,
836)
(727
)-
(5,1
08)
- (5
9,79
9)N
et b
ook
valu
e15
2,82
980
,000
443,
441
28,7
046,
026
38,1
384,
456
21,1
1811
,523
37,5
0482
3,73
9 A
dditi
ons
969
- 1,
835
58,5
982,
737
5,77
02,
513
168
5,56
116
978
,320
Dis
posa
ls-
- -
- (5
4)(3
86)
(1,9
97)
- -
- (2
,437
)D
epre
ciat
ion
- -
(8,9
40)
- (2
,584
)(8
,033
)(8
84)
- (4
,268
)-
(24,
709)
Impa
irmen
t-
- (2
94)
- -
- -
- -
- (2
94)
Tran
sfer
220
- 2,
302
(2,5
22)
- -
- -
- -
1,
189
- (5
,097
)56
,076
99(2
,649
)(3
68)
168
1,29
316
950
,880
At 3
1 D
ecem
ber 2
004
Cos
t15
4,01
880
,000
447,
578
84,7
8016
,208
86,1
585,
377
21,2
8622
,192
37,6
7395
5,27
0A
ccum
ulat
ed d
epre
ciat
ion
- -
(8,9
40)
- (1
0,08
3)(5
0,66
9)(1
,289
)-
(9,3
76)
- (8
0,35
7)A
ccum
ulat
ed im
pairm
ent
- -
(294
)-
- -
- -
- -
(294
)N
et b
ook
valu
e15
4,01
880
,000
438,
344
84,7
806,
125
35,4
894,
088
21,2
8612
,816
37,6
7387
4,61
9
Res
trict
ed p
rope
rty, p
lant
and
equ
ipm
ent (
see
note
30)
171,
599
Unr
estri
cted
pro
perty
, pla
nt a
nd e
quip
men
t70
3,02
0
874,
619
57

`Consolidated University
2005 2004 2005 2004Notes $'000 $'000 $'000 $'000
THE UNIVERSITY OF WESTERN AUSTRALIANOTES TO THE FINANCIAL STATEMENTS
31 DECEMBER 2005
29. Intangible assets
Software 9,703 7,306 9,703 7,306
Total intangible assets 9,703 7,306 9,703 7,306
Year ended 31 December 2005Consolidated and University Software Total
$'000 $'000At 1 January 2005Cost 7,306 7,306Accumulated amortisation and impairment - - Net book value 7,306 7,306
Additions 3,018 3,018Amortisation 12 (621) (621)
2,397 2,397At 31 December 2005Cost 10,324 10,324Accumulated amortisation and impairment (621) (621)Net book value 9,703 9,703
Year ended 31 December 2004Consolidated Licence, patents Intellectual
and other rights property Goodwill Software Total$'000 $'000 $'000 $'000 $'000
At 1 January 2004Cost 872 5,475 1,402 2,627 10,376Accumulated amortisation and impairment (48) (1,204) (1,402) - (2,654)Net book value 824 4,271 - 2,627 7,722
Additions - - - 5,024 5,024Amortisation (45) (168) - - (213)Disposal of controlled entity (779) (4,103) - (345) (5,227)
(824) (4,271) - 4,679 (416)At 31 December 2004Cost - - - 7,306 7,306Accumulated amortisation and impairment - - - - - Net book value - - - 7,306 7,306
University Software Total$'000 $'000
At 1 January 2004Cost 2,282 2,282Accumulated amortisation and impairment - - Net book value 2,282 2,282
Year ended 31 December 2004Additions 5,024 5,024
At 31 December 2004Cost 7,306 7,306Accumulated amortisation and impairment - - Net book value 7,306 7,306
During the year, there was no disposal of intangible assets (2004: $5,227,000).
During the year, research expenditure of $104,586,000 (2004: $97,749,000) has been recorded in the income statements.
58

`Consolidated University
2005 2004 2005 2004Notes $'000 $'000 $'000 $'000
THE UNIVERSITY OF WESTERN AUSTRALIANOTES TO THE FINANCIAL STATEMENTS
31 DECEMBER 2005
30. Restricted assets
Bequests 145,403 128,778 145,403 128,778Staff benefit funds 16,040 15,529 16,040 15,529Outside funds 9,528 8,667 9,528 8,667Endowment portfolio 121,426 109,399 121,426 109,399Research funds 34,666 22,293 34,666 22,293Other funds 633 529 633 529Endowment and bequest land and buildings 205,893 214,919 205,893 214,919Total restricted assets 533,589 500,114 533,589 500,114
Assets classified as held for sale 24 - 10,000 - 10,000Investment properties 25 17,440 33,320 17,440 33,320Other financial assets 26 327,696 285,195 327,696 285,195Property, plant and equipment 28 188,453 171,599 188,453 171,599Total restricted assets 533,589 500,114 533,589 500,114
31. Payables
CurrentTrade payables 4,125 2,977 3,873 2,889Other payables 13,775 15,550 13,547 15,550Total payables 17,900 18,527 17,420 18,439
32. Other financial liabilities
Advances 54 57 54 57Funds held for outside parties 10,568 9,680 10,568 9,680Total other financial liabilities 10,622 9,737 10,622 9,737
33. Provisions
CurrentAnnual, long service and other leave 29,233 28,635 29,134 28,623Employment on-costs provision 1,481 1,713 1,481 1,713Revenue sharing provision 4,305 4,553 4,305 4,553Legal claim provision - 2,069 - 2,069
35,019 36,970 34,920 36,958
Non-current Superannuation 12,372 13,984 12,372 13,984Long service leave 16,397 14,973 16,387 14,973Employment on-costs provision 910 896 910 896
29,679 29,853 29,669 29,853
Total provisions 64,698 66,823 64,589 66,811
(a) Revenue sharing
(b) Legal claimA provision was created in 2004 for a legal claim brought against the University. This claim was settled in February 2005.
This provision relates to amounts set aside for distribution to beneficial owners of certain investments arising from a revenue sharingarrangement.
A proportion of the University's assets is restricted in nature, in that the funds and/or assets are for a specific use or benefit.
59
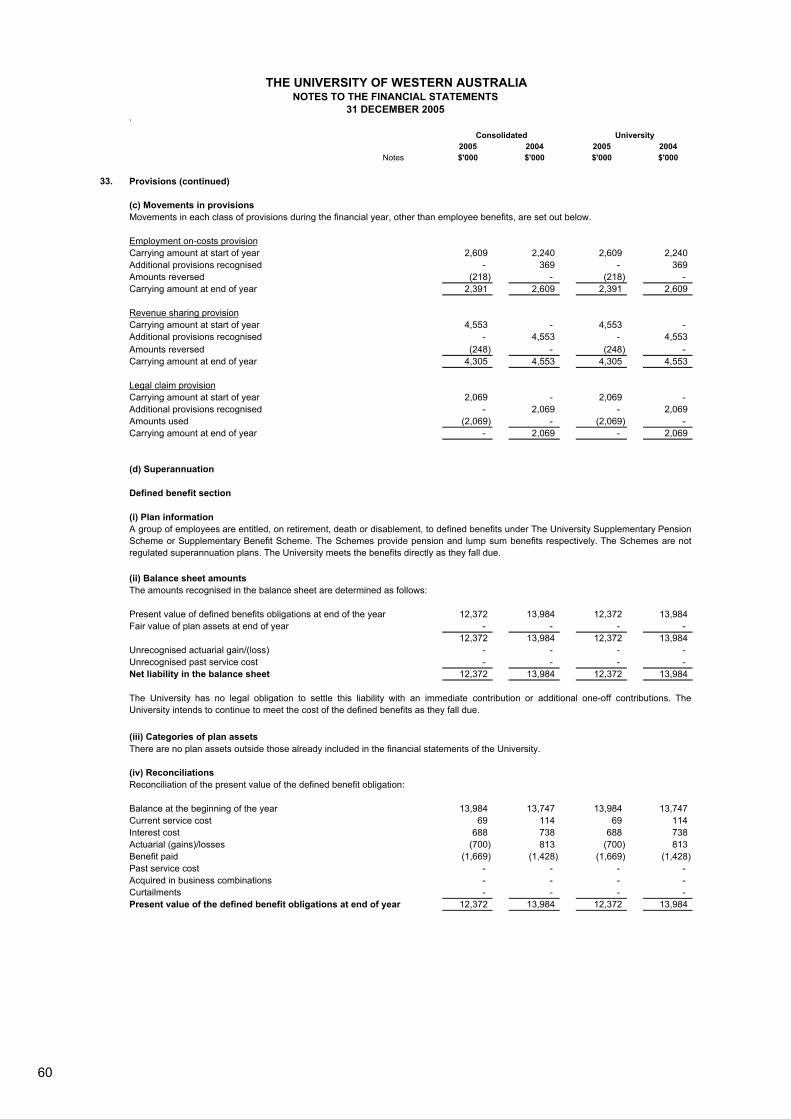
`Consolidated University
2005 2004 2005 2004Notes $'000 $'000 $'000 $'000
THE UNIVERSITY OF WESTERN AUSTRALIANOTES TO THE FINANCIAL STATEMENTS
31 DECEMBER 2005
33. Provisions (continued)
(c) Movements in provisionsMovements in each class of provisions during the financial year, other than employee benefits, are set out below.
Employment on-costs provisionCarrying amount at start of year 2,609 2,240 2,609 2,240Additional provisions recognised - 369 - 369Amounts reversed (218) - (218) - Carrying amount at end of year 2,391 2,609 2,391 2,609
Revenue sharing provisionCarrying amount at start of year 4,553 - 4,553 - Additional provisions recognised - 4,553 - 4,553Amounts reversed (248) - (248) - Carrying amount at end of year 4,305 4,553 4,305 4,553
Legal claim provisionCarrying amount at start of year 2,069 - 2,069 - Additional provisions recognised - 2,069 - 2,069Amounts used (2,069) - (2,069) - Carrying amount at end of year - 2,069 - 2,069
(d) Superannuation
Defined benefit section
(ii) Balance sheet amountsThe amounts recognised in the balance sheet are determined as follows:
Present value of defined benefits obligations at end of the year 12,372 13,984 12,372 13,984Fair value of plan assets at end of year - - - -
12,372 13,984 12,372 13,984Unrecognised actuarial gain/(loss) - - - - Unrecognised past service cost - - - - Net liability in the balance sheet 12,372 13,984 12,372 13,984
(iii) Categories of plan assets
(iv) ReconciliationsReconciliation of the present value of the defined benefit obligation:
Balance at the beginning of the year 13,984 13,747 13,984 13,747Current service cost 69 114 69 114Interest cost 688 738 688 738Actuarial (gains)/losses (700) 813 (700) 813Benefit paid (1,669) (1,428) (1,669) (1,428)Past service cost - - - - Acquired in business combinations - - - - Curtailments - - - - Present value of the defined benefit obligations at end of year 12,372 13,984 12,372 13,984
(i) Plan informationA group of employees are entitled, on retirement, death or disablement, to defined benefits under The University Supplementary PensionScheme or Supplementary Benefit Scheme. The Schemes provide pension and lump sum benefits respectively. The Schemes are notregulated superannuation plans. The University meets the benefits directly as they fall due.
The University has no legal obligation to settle this liability with an immediate contribution or additional one-off contributions. TheUniversity intends to continue to meet the cost of the defined benefits as they fall due.
There are no plan assets outside those already included in the financial statements of the University.
60
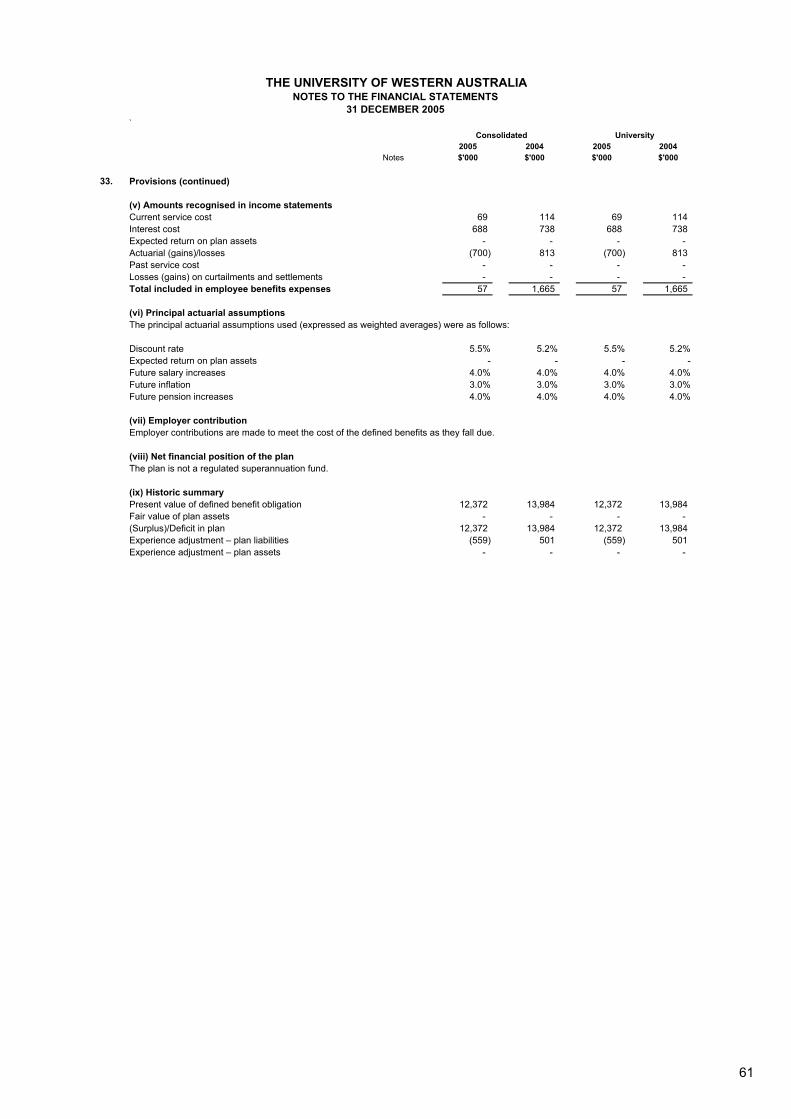
`Consolidated University
2005 2004 2005 2004Notes $'000 $'000 $'000 $'000
THE UNIVERSITY OF WESTERN AUSTRALIANOTES TO THE FINANCIAL STATEMENTS
31 DECEMBER 2005
33. Provisions (continued)
(v) Amounts recognised in income statementsCurrent service cost 69 114 69 114Interest cost 688 738 688 738Expected return on plan assets - - - - Actuarial (gains)/losses (700) 813 (700) 813Past service cost - - - - Losses (gains) on curtailments and settlements - - - - Total included in employee benefits expenses 57 1,665 57 1,665
(vi) Principal actuarial assumptionsThe principal actuarial assumptions used (expressed as weighted averages) were as follows:
Discount rate 5.5% 5.2% 5.5% 5.2%Expected return on plan assets - - - -Future salary increases 4.0% 4.0% 4.0% 4.0%Future inflation 3.0% 3.0% 3.0% 3.0%Future pension increases 4.0% 4.0% 4.0% 4.0%
(vii) Employer contributionEmployer contributions are made to meet the cost of the defined benefits as they fall due.
(viii) Net financial position of the planThe plan is not a regulated superannuation fund.
(ix) Historic summaryPresent value of defined benefit obligation 12,372 13,984 12,372 13,984Fair value of plan assets - - - - (Surplus)/Deficit in plan 12,372 13,984 12,372 13,984Experience adjustment – plan liabilities (559) 501 (559) 501Experience adjustment – plan assets - - - -
61
THE UNIVERSITY OF WESTERN AUSTRALIANOTES TO THE FINANCIAL STATEMENTS
31 DECEMBER 2005
33. Provisions (continued)
Defined contribution section
Vested AccruedBenefits Benefits
Gross of tax investment return 7.0% p.a. 9.1% p.a. Net of tax investment return 6.5% p.a. 8.6% p.a. Consumer Price Index 2.5% p.a. 2.5% p.a. Inflationary salary increases 3.5% p.a. 3.5% p.a.
(additional promotional salary increases are assumed to apply based on past experience)
The University contributes to superannuation schemes managed by Unisuper Ltd, and uses the defined contribution reporting approachavailable under the multi-employer fund provisions of AASB 119 for preparation of financial statements.
The multi-employer provisions allow employers with defined benefit obligations to report on a defined contribution basis. Additionalinformation required under the multi-employer reporting provisions for UniSuper as at 30 June 2005 are as follows:
The UniSuper Defined Benefit Plan (DBP) is a defined benefit plan.
Sufficient information is not available to account for the defined benefits provided by the DBP as a defined benefit plan. As set out underParagraph 32(b) of AASB 119, the DBP exposes the participating employers to actuarial risks associated with the current and formeremployees of other participating employers, with the result that there is no consistent and reliable basis for allocating the obligation, planassets and cost to participating employers.
As at 30 June 2005 there is no funding surplus or deficit which currently affects, or is expected to affect, the amount of futurecontributions payable by participating employers to the DBP.
Historically, surplus in the DBP has been used to improve members' benefit and has not affected the amount of participating employers'contributions.
As at 30 June 2005 the assets of the DBP in aggregate were estimated to be $230 million in excess of vested benefits. The vestedbenefits are benefits which are not conditional upon continued membership (or any factor other than leaving the service of theparticipating institution) and include the value of CPI indexed pensions being provided by the DBP.
As at 30 June 2005 the assets of the DBP in aggregate were estimated to be $1,543 million in excess of accrued benefits. The accruedbenefits have been calculated as the present value of expected future benefit payments to members and CPI indexed pensioners whicharise from membership of UniSuper up to the reporting date.
The vested benefit and accrued benefit liabilities were determined by the Fund's actuary Russell Employee Benefits using the actuarialdemographic assumptions outlined in their report dated 16 May 2003 on the actuarial investigation of the DBP as at 31 December 2002.The financial assumptions used were:
Assets have been included at their net market value, i.e. allowing for realisation costs.
Clause 34 of the UniSuper Trust Deed outlines the process UniSuper must undertake (including employer notifications and noticeperiods) in order to request additional contributions from employers if the UniSuper assets are considered by the Trustee to beinsufficient to provide benefits payable under the Deed. At least four years notice that such a request may be made is required. If such arequest was agreed to by employers then members must also contribute additional contributions equal to one-half of the rate at whichtheir employer is prepared to contribute. If the employers do not agree to increase contributions the Trustee must reduce benefits on afair and equitable basis. The Trustee notified employers during 2003 that such a request may be made in the future but it considered thiswas unlikely at that time.
62

`Consolidated University
2005 2004 2005 2004Notes $'000 $'000 $'000 $'000
THE UNIVERSITY OF WESTERN AUSTRALIANOTES TO THE FINANCIAL STATEMENTS
31 DECEMBER 2005
34. Deferred revenue
Australian Government financial assistance 24,918 26,396 24,918 26,396Student fees 4,565 3,490 4,565 3,490Research income 22,931 17,343 22,931 17,343Other 5,907 4,387 5,737 4,299
Total deferred revenue 58,321 51,616 58,151 51,528
35. Reserves
Capital reserve 39,677 40,652 39,677 40,652Short-term pool investment reserve 28,331 28,625 28,331 28,625Total reserves 68,008 69,277 68,008 69,277
(a) MovementsCapital reserveBalance 1 January 40,652 30,419 40,652 30,419 Transfer from/(to) accumulated funds (975) 10,233 (975) 10,233Balance 31 December 39,677 40,652 39,677 40,652
Short-term pool investment reserveBalance 1 January 28,625 19,499 28,625 19,499 Transfer from/(to) accumulated funds (294) 9,126 (294) 9,126Balance 31 December 28,331 28,625 28,331 28,625
Total reserves 68,008 69,277 68,008 69,277
(b) Nature and purpose of reserve
36. Retained profits
Opening balance 1,191,180 1,183,969 1,196,049 1,189,747Net profit/(loss) from ordinary activities 41,034 26,570 41,964 25,661Net adjustment from adoption of AASB 132/139 34 - 34 - Gain on dilution of holdings in associates 1,449 - - - Transfer from/(to) reserves 1,269 (19,359) 1,269 (19,359)Total retained profits 1,234,966 1,191,180 1,239,316 1,196,049
The capital reserve has been created to fund programmes identified as priority initiatives and other programmes which cannot be fundedfrom recurrent sources.
The short-term pool investment reserve has been created to provide a degree of smoothing of investment income from year to year andprovide increased predictability for planning and budgeting purposes. The University policy for the short-term investment pool is todistribute the income at a budgeted rate and to credit any excess or debit any shortfall to this investment fluctuation reserve.
63

THE UNIVERSITY OF WESTERN AUSTRALIA NOTES TO THE FINANCIAL STATEMENTS
31 DECEMBER 2005 37. Commitments
(a) Expenditure commitments
Outstanding commitments for general expenditure:
Consolidated University 2005 2004 2005 2004
$ ’000 $ ’000 $ ’000 $ ’000 No later than one year 5,126 4,388 5,126 4,388 Later than one year but no later than five years - - - - Later than five years - - - - 5,126 4,388 5,126 4,388
(b) Capital commitments Capital expenditure contracted for at the reporting date but not recognised as liabilities is as follows:
Consolidated University 2005 2004 2005 2004
$ ’000 $ ’000 $ ’000 $ ’000 Land and buildings Payables:
No later than one year 44,056 19,609 44,056 19,609 Later than one year but no later than five years 52,227 18,188 52,227 18,188 Later than five years - - - - 96,283 37,797 96,283 37,797
Other plant and equipment Payables:
No later than one year 2,674 1,243 2,673 1,243 Later than one year but no later than five years - - - - Later than five years - - - - 2,674 1,243 2,673 1,243
(c) Lease commitments Commitments in relation to non-cancellable operating leases are payable as follows:
Consolidated University 2005 2004 2005 2004
$ ’000 $ ’000 $ ’000 $ ’000 No later than one year 638 403 508 403 Later than one year but no later than five years 758 426 362 426 Later than five years 27 - - - 1,423 829 870 829
38. Contingent liabilities and assets
(a) Contingent liabilities As at 31 December 2005 or at the date of this report, there are no known contingent liabilities which are likely to materially affect the University’s financial position. (b) Contingent assets
A contingent asset exists in relation to funds bequeathed to the University by way of a Will. The timing of any future inflows of economic benefit cannot be reasonably determined. As at 31 December 2005 or at the date of this report, there are no other known contingent assets which are likely to materially affect the University’s financial position.
64

THE UNIVERSITY OF WESTERN AUSTRALIA NOTES TO THE FINANCIAL STATEMENTS
31 DECEMBER 2005 39. Supplementary financial information
(a) Write-offs Bad debts and other write-offs, written off by the Senate during the financial year:
Consolidated University 2005 2004 2005 2004
$ ’000 $ ’000 $ ’000 $ ’000 Receivables 136 383 136 383 Assets 296 - 296 - 432 383 432 383
(b) Losses through theft, default and other causes University 2005 2004
$ ’000 $ ’000 Losses through theft and default 51 101 Insurance recovery (39) (90) 12 11
40. Related party transactions
(a) Subsidiaries Interests in subsidiaries are set out in note 41. (b) Transactions with related parties The following transaction occurred with related parties:
Consolidated University 2005 2004 2005 2004 $ ’000 $ ’000 $ ’000 $ ’000
Sales of goods and services Subsidiaries - - 76 12 Associates 48 86 48 86 Purchase of goods and services Subsidiaries - - 646 25 Loan to subsidiaries - - 433 - Grants to subsidiaries - - 140 50 (c) Outstanding balances The following balances are outstanding at the reporting date in relation to transactions with related parties:
Consolidated University 2005 2004 2005 2004 $ ’000 $ ’000 $ ’000 $ ’000
Current receivables (sales of goods and services) Subsidiaries - - 95 1 Associates 1 11 1 11 Non-current receivables (loans) Subsidiaries - - 433 - Current payables (purchases of goods) Subsidiaries - - 73 -
No provisions for doubtful debts have been raised in relation to any outstanding balances, and no expense has been recognised in respect of bad or doubtful debts from related parties. (d) Terms and conditions All transactions were made on normal commercial terms and conditions and at market rates. Outstanding balances are unsecured and are repayable in cash.
65

THE UNIVERSITY OF WESTERN AUSTRALIA NOTES TO THE FINANCIAL STATEMENTS
31 DECEMBER 2005
41. Subsidiaries
The consolidated financial statements incorporate the assets, liabilities and results of the following subsidiaries in accordance with the accounting policy described in note 1(c).
Ownership interest Name of entity Country of incorporation
Class of shares 2005
% 2004
%
Principal activity
Integral Leadership Centre Ltd
Australia Ordinary 100 100 Provision of executive management programmes
The University Club of Western Australia Pty Ltd
Australia Ordinary 100 100 Events and function centre
All subsidiaries are formed in Western Australia. 42. Investments in associates
(a) Carrying amounts Information relating to associates is set out below.
Ownership interest Consolidated University Name of company Principal activity 2005
% 2004
% 2005 $’000
2004 $’000
2005 $’000
2004 $’000
Listed 28.8 40.1 4,491 3,913 8,928 8,928 Advanced
Nanotechnology Limited Production of nanomaterials
Unlisted Vitrostone Ltd Development of
powder technologies
29.4 29.4 - - - 30
Media Farm Pty Ltd Development of
multimedia technology
38.0 38.0 - - - -
- - - 30 4,491 3,913 8,928 8,958
Each of the above associates is incorporated in Australia. Advanced Nanotechnology Limited was listed in the Australian Stock Exchange on 24 February 2005. Vitrostone Ltd and Media Farm Pty Ltd will be deregistered in 2006. The University’s share of losses in Vitrostone Ltd has exceeded its interest in the company. The carrying amount has been reduced to nil in 2004, and subsequent losses will not be recognised as the University has no constructive or legal obligation to make payments on behalf of Vitrostone Ltd. Total losses not recognised amounted to $339,000.
66

THE UNIVERSITY OF WESTERN AUSTRALIA NOTES TO THE FINANCIAL STATEMENTS
31 DECEMBER 2005 42. Investments in associates (continued)
(b) Movements in carrying amounts Consolidated
2005 2004
$ ’000 $ ’000 Carrying amount at the beginning of the financial year 3,913 - Investment prior to change in status to associates - 5,930 Adjustment to reflect change in status to associates - (2,047) Share of profits/(loss) before income tax (872) 30 Gain on dilution of holdings 1,449 - Carrying amount at the end of the financial year 4,491 3,913 (c) Fair value of listed investments in associates Advanced Nanotechnology Limited 7,239 - (d) Share of associates’ profits or losses Profit/(loss) before income tax (872) 30 Income tax expense - - Profit/(loss) after income tax (872) 30 (e) Summarised financial information of associates
Group share of: Assets Liabilities Revenues Profit/(loss) $ ’000 $ ’000 $ ’000 $ ’000 2005 Advanced Nanotechnology Limited 4,834 343 795 (872) 2004 Advanced Nanotechnology Limited 4,209 296 334 30
(f) Share of associates’ expenditure commitments, other than for the supply of inventories
Consolidated 2005 2004
$ ’000 $ ’000 Capital commitments 1 - Lease commitments 509 -
(g) Contingent liabilities of associates Share of incurred jointly with other investors - - For which the company is severally liable - -
43. Events occurring after the balance sheet date
As at 31 December 2005 or at the date of this report, there are no known events occurring after the balance sheet date which are likely to materially affect the University’s financial position.
44. Segment information
The University operates within one industry segment, being education, and revenue is predominantly earned within Australia. Therefore, no segment information has been reported.
67

Consolidated University2005 2004 2005 2004$'000 $'000 $'000 $'000
45.
Net operating result 41,034 26,146 41,965 25,661
Adjustments: Non-cash items Depreciation, amortisation and impairment 24,673 25,305 24,670 25,003 Investment adjustments (48,626) (51,625) (48,561) (51,786) Unrealised foreign exchange gain (80) (110) (80) (110) (Profit)/Loss on sale of assets 581 (899) 581 (899) Donation of artworks and equipment (1,381) (136) (1,381) (136) Share of net result of associates 872 (30) - - Loss on change in interests in subsidiaries - 482 - 1,939 Other 201 95 201 95
Changes in assets and liabilities (Increase)/decrease in receivables (126) (7,246) 157 (7,449) (Increase)/decrease in inventories (125) (334) (10) (232) Increase/(decrease) in payables 2,532 3,599 2,269 3,563 Increase/(decrease) in grants and fees in advance 5,280 (1,536) 5,112 (1,536) Increase/(decrease) in provisions (2,389) 13,376 (2,496) 13,350
Net cash inflow from operating activities 22,446 7,087 22,427 7,463
THE UNIVERSITY OF WESTERN AUSTRALIANOTES TO THE FINANCIAL STATEMENTS
31 DECEMBER 2005
Reconciliation of net operating result to net cash inflow from operating activities
68

46. Financial instruments
(a) Financial risk management
Market risk
Interest rate risk
Credit risk
(b) Interest rate risk exposures
2005 Consolidated Floating Non -interest 1 year 1 to 2 2 to 3 3 to 4 4 to 5 more than interest 2005
rate or less years years years years 5 years bearing TotalNotes $'000 $'000 $'000 $'000 $'000 $'000 $'000 $'000 $'000
Financial assets
Cash and cash equivalents 21 25,840 10,040 - - - - - 89 35,969Receivables 22 - - - - - - - 38,959 38,959Other shares and units 26 - - - - - - - 5,306 5,306Unsecured loan advances 26 - 456 461 399 308 308 - 1,866 3,798Managed investment porfolios 26 45,316 1,360 3,339 2,756 2,278 2,887 2,260 363,319 423,515
Total financial assets 71,156 11,856 3,800 3,155 2,586 3,195 2,260 409,539 507,547
Weighted average interest rate 5.09% 5.60% 8.17% 7.41% 6.31% 4.67% 6.12%
The following table details the University's exposure to interest rate risk.
THE UNIVERSITY OF WESTERN AUSTRALIANOTES TO THE FINANCIAL STATEMENTS
31 DECEMBER 2005
Fixed interest maturing/repricing in
The University's principal financial instruments comprised cash, deposits, bonds, bank bills, shares and unit trusts which arepredominantly managed through the University's investment portfolios.
The University's governing body, the Senate, is responsible for the management of key risks and, through the StrategicResources Committee, reviews and approves financial policies. The Investment Policy Statement sets out investing guidelinessuch as performance objectives; investment restrictions; performance benchmarks and monitoring; and the strategic benchmarkfor each pool. The Investment Policy Statement is independently reviewed and updated by an external consultant on a regularbasis to ensure it is appropriate for the overall investment objectives of the University.
The activities of the University result in exposure to market risk, interest rate risk and credit risk.
Price risk
The University's investment pools are exposed to fluctuations in the prices of equity securities. The University's investmentpolicy provides strategies for the minimisation of price risk with the diversification of that risk through a number of investmentmanagers and ongoing monitoring to ensure there is no concentration of risk exposure in any one area.
Foreign exchange risk
Foreign exchange risk arises due to overseas sources of income from the University's international offshore teachingprogrammes, foreign donors, foreign customers and foreign sourced supplies. The University's main exposure is to the US andSingapore dollars, and the UK pound. Currently the level of exposure is not significant.
The University requires that, where possible, offshore transactions be contracted in Australian dollars and if this is not possible,that forward currency contracts be considered to manage the currency exposure. The University will only enter into a forwardcontract when there is an underlying actual exposure.
The interest rate risk arises from interest-bearing assets. The University's investment policy provides strategies for minimisingthe impact from interest rate risk including the use of investment fluctuation reserves to spread the impact of fluctuations on theUniversity's cash flow.
The University has no significant interest bearing liabilities.
The University's Credit Control Policy is designed to ensure that credit facilities are only provided to customers with anappropriate credit history.
The University's investment and cash transactions are restricted to high credit quality institutions.
69

THE UNIVERSITY OF WESTERN AUSTRALIANOTES TO THE FINANCIAL STATEMENTS
31 DECEMBER 2005
46.
2005 Consolidated Floating Non -interest 1 year 1 to 2 2 to 3 3 to 4 4 to 5 more than interest 2005
rate or less years years years years 5 years bearing TotalNotes $'000 $'000 $'000 $'000 $'000 $'000 $'000 $'000 $'000
Financial liabilitiesPayables 31 - - - - - - - 17,894 17,894Advances 32 - - - - - - - 54 54Funds held for outside parties 32 3,427 - - - - 7,141 - 10,568
Total financial liabilities - 3,427 - - - - 7,141 17,948 28,516
Weighted average interest rate - 7.10% - - - - 18.04%
Net financial assets 71,156 8,429 3,800 3,155 2,586 3,195 (4,881) 391,591 479,031
2004 Consolidated Floating Fixed interest maturing/repricing in Non -interest 1 year over 1 year more than interest 2004
rate or less to 5 years 5 years bearing Total$'000 $'000 $'000 $'000 $'000 $'000
Financial assetsCash and cash equivalents 21 28,713 2,576 - - 65 31,354Receivables 22 - - - - 38,271 38,271Other shares and units 26 203 - - - 4,637 4,840Unsecured loan advances 26 - 138 1,097 - 2,000 3,235Managed investment portfolios 26 44,801 3,855 7,804 4,515 338,700 399,675
Total financial assets 73,717 6,569 8,901 4,515 383,673 477,375
Weighted average interest rate 5.29% 6.05% 6.99% 5.10%
Financial liabilitiesPayables 31 - - - - 18,527 18,527Advances 32 - - - - 57 57Funds held for outside parties 32 - 5,689 - 3,991 - 9,680
Total financial liabilities - 5,689 - 3,991 18,584 28,264
Weighted average interest rate - 4.00% - 17.40%
Net financial assets 73,717 880 8,901 524 365,089 449,111
(c) Net fair value of financial assets and liabilities
The net fair value of financial assets and liabilities disclosed in the balance sheets are not materially different to the carrying valueof the financial assets and liabilities.
Fixed interest maturing/repricing in
Financial instruments (continued )
70
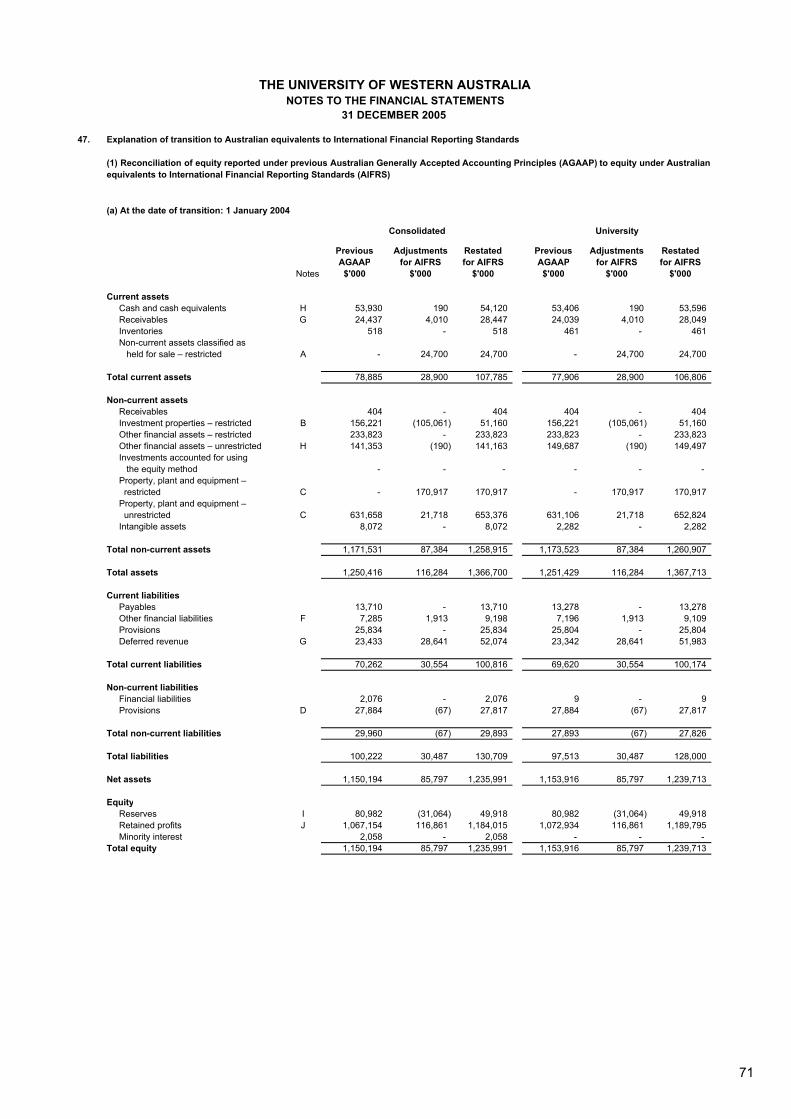
47. Explanation of transition to Australian equivalents to International Financial Reporting Standards
(a) At the date of transition: 1 January 2004
Consolidated University
Previous Adjustments Restated Previous Adjustments RestatedAGAAP for AIFRS for AIFRS AGAAP for AIFRS for AIFRS
Notes $'000 $'000 $'000 $'000 $'000 $'000
Current assets Cash and cash equivalents H 53,930 190 54,120 53,406 190 53,596 Receivables G 24,437 4,010 28,447 24,039 4,010 28,049 Inventories 518 - 518 461 - 461 Non-current assets classified as held for sale – restricted A - 24,700 24,700 - 24,700 24,700
Total current assets 78,885 28,900 107,785 77,906 28,900 106,806
Non-current assets Receivables 404 - 404 404 - 404 Investment properties – restricted B 156,221 (105,061) 51,160 156,221 (105,061) 51,160 Other financial assets – restricted 233,823 - 233,823 233,823 - 233,823 Other financial assets – unrestricted H 141,353 (190) 141,163 149,687 (190) 149,497 Investments accounted for using the equity method - - - - - - Property, plant and equipment – restricted C - 170,917 170,917 - 170,917 170,917 Property, plant and equipment – unrestricted C 631,658 21,718 653,376 631,106 21,718 652,824 Intangible assets 8,072 - 8,072 2,282 - 2,282
Total non-current assets 1,171,531 87,384 1,258,915 1,173,523 87,384 1,260,907
Total assets 1,250,416 116,284 1,366,700 1,251,429 116,284 1,367,713
Current liabilities Payables 13,710 - 13,710 13,278 - 13,278 Other financial liabilities F 7,285 1,913 9,198 7,196 1,913 9,109 Provisions 25,834 - 25,834 25,804 - 25,804 Deferred revenue G 23,433 28,641 52,074 23,342 28,641 51,983
Total current liabilities 70,262 30,554 100,816 69,620 30,554 100,174
Non-current liabilities Financial liabilities 2,076 - 2,076 9 - 9 Provisions D 27,884 (67) 27,817 27,884 (67) 27,817
Total non-current liabilities 29,960 (67) 29,893 27,893 (67) 27,826
Total liabilities 100,222 30,487 130,709 97,513 30,487 128,000
Net assets 1,150,194 85,797 1,235,991 1,153,916 85,797 1,239,713
Equity Reserves I 80,982 (31,064) 49,918 80,982 (31,064) 49,918 Retained profits J 1,067,154 116,861 1,184,015 1,072,934 116,861 1,189,795 Minority interest 2,058 - 2,058 - - - Total equity 1,150,194 85,797 1,235,991 1,153,916 85,797 1,239,713
THE UNIVERSITY OF WESTERN AUSTRALIANOTES TO THE FINANCIAL STATEMENTS
31 DECEMBER 2005
(1) Reconciliation of equity reported under previous Australian Generally Accepted Accounting Principles (AGAAP) to equity under Australianequivalents to International Financial Reporting Standards (AIFRS)
71

THE UNIVERSITY OF WESTERN AUSTRALIANOTES TO THE FINANCIAL STATEMENTS
31 DECEMBER 2005
47. Explanation of transition to Australian equivalents to International Financial Reporting Standards (continued)
(b) At the end of the last reporting period under previous AGAAP: 31 December 2004
Consolidated University
Previous Adjustments Restated Previous Adjustments RestatedAGAAP for AIFRS for AIFRS AGAAP for AIFRS for AIFRS
Notes $'000 $'000 $'000 $'000 $'000 $'000
Current assets Cash and cash equivalents H 31,154 200 31,354 30,947 200 31,147 Receivables G 31,701 6,013 37,714 31,545 6,013 37,558 Inventories 627 - 627 627 - 627 Non-current assets classified as held for sale – restricted A - 10,000 10,000 - 10,000 10,000
Total current assets 63,482 16,213 79,695 63,119 16,213 79,332
Non-current assets Receivables 557 - 557 557 - 557 Investment properties – restricted B 131,704 (98,384) 33,320 131,704 (98,384) 33,320 Other financial assets – restricted 285,195 - 285,195 285,195 - 285,195 Other financial assets – unrestricted H 122,755 (200) 122,555 131,712 (200) 131,512 Investments accounted for using the equity method 3,913 - 3,913 - - - Property, plant and equipment – restricted C - 171,599 171,599 - 171,599 171,599 Property, plant and equipment – unrestricted C 702,955 65 703,020 702,955 65 703,020 Intangible assets 7,306 - 7,306 7,306 - 7,306
Total non-current assets 1,254,385 73,080 1,327,465 1,259,429 73,080 1,332,509
Total assets 1,317,867 89,293 1,407,160 1,322,548 89,293 1,411,841
Current liabilities Payables D 18,444 83 18,527 18,356 83 18,439 Other financial liabilities 9,737 - 9,737 9,737 - 9,737 Provisions D 32,500 4,470 36,970 32,488 4,470 36,958 Deferred revenue G 18,724 32,892 51,616 18,636 32,892 51,528
Total current liabilities 79,405 37,445 116,850 79,217 37,445 116,662
Non-current liabilities Provisions D 29,654 199 29,853 29,654 199 29,853
Total non-current liabilities 29,654 199 29,853 29,654 199 29,853
Total liabilities 109,059 37,644 146,703 108,871 37,644 146,515
Net assets 1,208,808 51,649 1,260,457 1,213,677 51,649 1,265,326
Equity Reserves I 121,700 (52,423) 69,277 121,700 (52,423) 69,277 Retained profits J 1,087,108 104,072 1,191,180 1,091,977 104,072 1,196,049
Total equity 1,208,808 51,649 1,260,457 1,213,677 51,649 1,265,326
72

THE UNIVERSITY OF WESTERN AUSTRALIANOTES TO THE FINANCIAL STATEMENTS
31 DECEMBER 2005
47. Explanation of transition to Australian equivalents to International Financial Reporting Standards (continued)
(2) Reconciliation of profit for the year ended 31 December 2004
Consolidated University
Previous Adjustments Restated Previous Adjustments RestatedAGAAP for AIFRS for AIFRS AGAAP for AIFRS for AIFRS
Notes $'000 $'000 $'000 $'000 $'000 $'000Revenue from continuing operations
Australian Government financial assistance Australian Government grants 206,868 (2,686) 204,182 206,868 (2,686) 204,182 HECS-HELP Australian Government payments 38,161 - 38,161 38,161 - 38,161 FEE-HELP 3,721 - 3,721 3,721 - 3,721 Western Australian and Local Government financial assistance 29,317 2,288 31,605 29,317 2,288 31,605 HECS-HELP student payments 9,953 - 9,953 9,953 - 9,953 Other research grants and contracts 20,749 (1,854) 18,895 20,713 (1,854) 18,859 Investment income 69,415 (2,552) 66,863 67,811 (2,552) 65,259 Fees and charges 53,520 - 53,520 53,520 - 53,520 Salary and other recoveries 16,253 - 16,253 16,263 - 16,263 Other revenue 26,618 1,970 28,588 25,863 1,970 27,833 Share of net results of associates accounted for using the equity method 30 - 30 - - -
Total revenue from continuing operations 474,605 (2,834) 471,771 472,190 (2,834) 469,356
Expenses from continuing operations
Employee benefits and on-costs 258,301 193 258,494 257,863 193 258,056 Student expenses 21,000 - 21,000 21,000 - 21,000 Materials and supplies 19,434 3 19,437 19,313 3 19,316 Depreciation, amortisation and impairment 24,116 1,189 25,305 23,814 1,189 25,003 Repairs and maintenance 11,247 831 12,078 11,215 831 12,046 Grants distributed 20,833 - 20,833 20,883 - 20,883 Travel 14,275 - 14,275 14,203 - 14,203 Professional fees 8,474 1,850 10,324 8,452 1,850 10,302 Other expenses 58,036 5,893 63,929 57,043 5,893 62,936
Total expenses from continuing operations 435,716 9,959 445,675 433,786 9,959 443,745
Net operating result from continuing operations 38,889 (12,793) 26,096 38,404 (12,793) 25,611
Net operating result attributable tominority interest 424 - 424 - - -
Net operating result K 39,313 (12,793) 26,520 38,404 (12,793) 25,611
(3) Reconciliation of cash flow statement for the year ended 31 December 2004
The adoption of AIFRS has not resulted in any material adjustments to the cash flow statements.
(4) Notes to the reconciliations
A Non-current assets classified as held-for-sale
$'000 (i) At 1 January 2004One property reclassified (B) 24,700
(ii) At 31 December 2004One property reclassified (B) 10,000
(iii) For the year ended 31 December 2004Update profit on disposal of property recorded a fair value on transition (7,080)
The University had plans in place to dispose of a number of endowment properties. These properties were classified as investments, however underAIFRS are required to be re-classified and disclosed separately as held-for-sale.
73
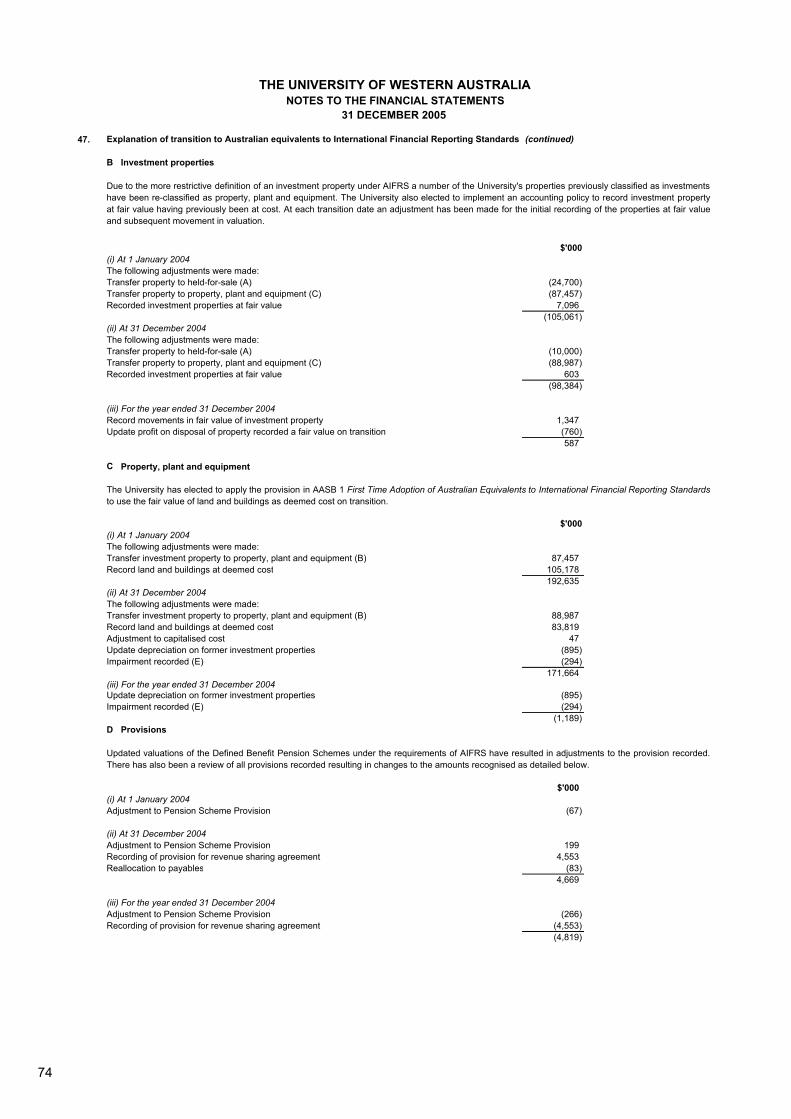
THE UNIVERSITY OF WESTERN AUSTRALIANOTES TO THE FINANCIAL STATEMENTS
31 DECEMBER 2005
47. Explanation of transition to Australian equivalents to International Financial Reporting Standards (continued)
B Investment properties
$'000(i) At 1 January 2004The following adjustments were made:Transfer property to held-for-sale (A) (24,700)Transfer property to property, plant and equipment (C) (87,457)Recorded investment properties at fair value 7,096
(105,061)(ii) At 31 December 2004The following adjustments were made:Transfer property to held-for-sale (A) (10,000)Transfer property to property, plant and equipment (C) (88,987)Recorded investment properties at fair value 603
(98,384)
(iii) For the year ended 31 December 2004Record movements in fair value of investment property 1,347 Update profit on disposal of property recorded a fair value on transition (760)
587
C Property, plant and equipment
$'000(i) At 1 January 2004The following adjustments were made:Transfer investment property to property, plant and equipment (B) 87,457 Record land and buildings at deemed cost 105,178
192,635 (ii) At 31 December 2004The following adjustments were made:Transfer investment property to property, plant and equipment (B) 88,987 Record land and buildings at deemed cost 83,819 Adjustment to capitalised cost 47 Update depreciation on former investment properties (895)Impairment recorded (E) (294)
171,664 (iii) For the year ended 31 December 2004Update depreciation on former investment properties (895)Impairment recorded (E) (294)
(1,189)D Provisions
$'000(i) At 1 January 2004Adjustment to Pension Scheme Provision (67)
(ii) At 31 December 2004Adjustment to Pension Scheme Provision 199 Recording of provision for revenue sharing agreement 4,553 Reallocation to payables (83)
4,669
(iii) For the year ended 31 December 2004Adjustment to Pension Scheme Provision (266)Recording of provision for revenue sharing agreement (4,553)
(4,819)
Due to the more restrictive definition of an investment property under AIFRS a number of the University's properties previously classified as investmentshave been re-classified as property, plant and equipment. The University also elected to implement an accounting policy to record investment propertyat fair value having previously been at cost. At each transition date an adjustment has been made for the initial recording of the properties at fair valueand subsequent movement in valuation.
The University has elected to apply the provision in AASB 1 First Time Adoption of Australian Equivalents to International Financial Reporting Standardsto use the fair value of land and buildings as deemed cost on transition.
Updated valuations of the Defined Benefit Pension Schemes under the requirements of AIFRS have resulted in adjustments to the provision recorded.There has also been a review of all provisions recorded resulting in changes to the amounts recognised as detailed below.
74

THE UNIVERSITY OF WESTERN AUSTRALIANOTES TO THE FINANCIAL STATEMENTS
31 DECEMBER 2005
47. Explanation of transition to Australian equivalents to International Financial Reporting Standards (continued)
E Impairment
The University has impaired a building which was planned to be demolished in 2005.$'000
(i) At 1 January 2004No adjustment as recorded at fair value -
(ii) At 31 December 2004Impairment (294)
(iii) For the year ended 31 December 2004Impairment (294)
F Retrospective application of prior period adjustments
$'000(i) At 1 January 2004Recording of fund held in trust 1,913
(ii) At 31 December 2004No adjustment -
(iii) For the year ended 31 December 2004Reversal of reduction in donation income 1,913
G Revenue recognition
$'000(i) At 1 January 2004Deferred revenue 28,641 Accrued revenue 4,010 Net adjustment 24,631
(ii) At 31 December 2004Deferred revenue 32,892 Accrued revenue 6,013 Net adjustment 26,879
(iii) For the year ended 31 December 2004Adjustment to Commonwealth Government Financial Assistance (2,686)Adjustment to Other research grants and contracts (1,854)Adjustment to Western Australian and Local Government Financial Assistance 2,288
(2,252)
H Classification of short term deposits
A short term deposit previously recorded in investments has been reclassified to cash under the definition of cash equivalents in AASB 107.
$'000(i) At 1 January 2004Short-term deposit 190
(ii) At 31 December 2004Short-term deposit 200
I Transfer of revaluation reserve
$'000(i) At 1 January 2004Transfer to retained profits (31,064)
(ii) At 31 December 2004Transfer to retained profits (52,423)
The University is required to classify revenue received as reciprocal or non-reciprocal. Reciprocal income is required to be recognised on a stage-of-completion basis which has resulted in an adjustment to the recognition of research income.
The University has elected to utilise deemed cost on transition to AIFRS (as discussed above). The previous revaluation reserve has been transferred to retained profits.
The University identified in 2004 funding that had been provided to the University had been recorded as income rather than held in trust. Thisadjustment was reflected in the 2004 financial statements.
75
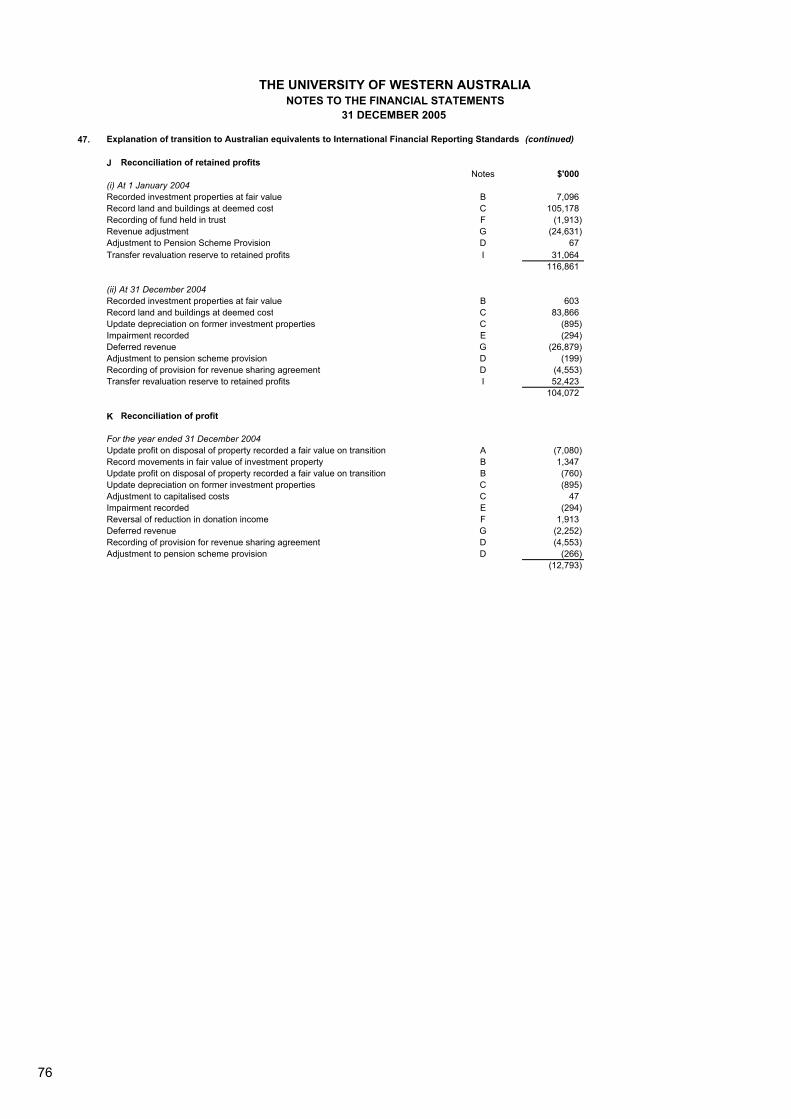
THE UNIVERSITY OF WESTERN AUSTRALIANOTES TO THE FINANCIAL STATEMENTS
31 DECEMBER 2005
47. Explanation of transition to Australian equivalents to International Financial Reporting Standards (continued)
J Reconciliation of retained profitsNotes $'000
(i) At 1 January 2004Recorded investment properties at fair value B 7,096 Record land and buildings at deemed cost C 105,178 Recording of fund held in trust F (1,913)Revenue adjustment G (24,631)Adjustment to Pension Scheme Provision D 67 Transfer revaluation reserve to retained profits I 31,064
116,861
(ii) At 31 December 2004Recorded investment properties at fair value B 603 Record land and buildings at deemed cost C 83,866 Update depreciation on former investment properties C (895)Impairment recorded E (294)Deferred revenue G (26,879)Adjustment to pension scheme provision D (199)Recording of provision for revenue sharing agreement D (4,553)Transfer revaluation reserve to retained profits I 52,423
104,072
K Reconciliation of profit
For the year ended 31 December 2004Update profit on disposal of property recorded a fair value on transition A (7,080)Record movements in fair value of investment property B 1,347 Update profit on disposal of property recorded a fair value on transition B (760)Update depreciation on former investment properties C (895)Adjustment to capitalised costs C 47 Impairment recorded E (294)Reversal of reduction in donation income F 1,913 Deferred revenue G (2,252)Recording of provision for revenue sharing agreement D (4,553)Adjustment to pension scheme provision D (266)
(12,793)
76

THE UNIVERSITY OF WESTERN AUSTRALIANOTES TO THE FINANCIAL STATEMENTS
31 DECEMBER 2005
47. Explanation of transition to Australian equivalents to International Financial Reporting Standards (continued)
(3)
Consolidated University
31 December Adjustments 1 January 31 December Adjustments 1 January2004 2005 2004 2005
Notes $'000 $'000 $'000 $'000 $'000 $'000
Current assets Cash and cash equivalents 31,354 - 31,354 31,147 - 31,147 Receivables 37,714 - 37,714 37,558 - 37,558 Inventories 627 - 627 627 - 627 Non-current assets classified as held-for-sale – restricted 10,000 - 10,000 10,000 - 10,000
Total current assets 79,695 - 79,695 79,332 - 79,332
Non-current assets Receivables 557 - 557 557 - 557 Investment properties – restricted 33,320 - 33,320 33,320 - 33,320 Other financial assets – restricted 285,195 - 285,195 285,195 - 285,195 Other financial assets – unrestricted 122,555 34,463 157,018 131,512 34,463 165,975 Investments accounted for using the equity method 3,913 - 3,913 - - - Property, plant and equipment – restricted 171,599 - 171,599 171,599 - 171,599 Property, plant and equipment – unrestricted 703,020 - 703,020 703,020 - 703,020 Intangible assets 7,306 - 7,306 7,306 - 7,306
Total non-current assets 1,327,465 34,463 1,361,928 1,332,509 34,463 1,366,972
Total assets 1,407,160 34,463 1,441,623 1,411,841 34,463 1,446,304
Current liabilities Payables 18,527 - 18,527 18,439 - 18,439 Other financial liabilities 9,737 - 9,737 9,737 - 9,737 Provisions 36,970 - 36,970 36,958 - 36,958 Deferred revenue 51,620 - 51,620 51,530 - 51,530
Total current liabilities 116,854 - 116,854 116,664 - 116,664
Non-current liabilities Provisions 29,853 - 29,853 29,853 - 29,853
Total non-current liabilities 29,853 - 29,853 29,853 - 29,853
Total liabilities 146,707 - 146,707 146,517 - 146,517
Net assets 1,260,453 34,463 1,294,916 1,265,324 34,463 1,299,787
Equity Reserves 69,277 - 69,277 69,277 - 69,277 Retained profits 1,191,176 34,463 1,225,639 1,196,047 34,463 1,230,510
Total equity 1,260,453 34,463 1,294,916 1,265,324 34,463 1,299,787
Refer to note 1(j) for further information on the transition to AASB 132 Financial Instruments: Disclosure and Presentation and AASB 139 Financial Instruments: Recognition and Measurement on 1 January 2005.
Adjustments on transition to AASB 132 Financial Instruments: Disclosure and Presentation and AASB 139 Financial Instruments: Recognition and Measurement: 1 January 2005
77

48. Acquittal of Australian Government financial assistance
48.1 DEST—teaching and learning
Notes 2005 2004 2005 2004$'000 $'000 $'000 $'000
Financial assistance received in cash during the reporting period 72,273 61,052 234 143Net accrual adjustments 5,000 (287) 130 - Revenue for the period 2(a) 77,273 60,765 364 143Surplus/(deficit) from the previous year 112 178 - - Total funds including accrued revenue 77,385 60,943 364 143Less expenses including accrued expenses (77,301) (60,831) (364) (143)Surplus/(deficit) for the reporting period 84 112 - -
2005 2004 2005 2004$'000 $'000 $'000 $'000
Financial assistance received in cash during the reporting period 1,128 2,266 1,570 1,049Net accrual adjustments - - - - Revenue for the period 2(a) 1,128 2,266 1,570 1,049Surplus/(deficit) from the previous year - - 505 - Total funds including accrued revenue 1,128 2,266 2,075 1,049Less expenses including accrued expenses (1,128) (2,266) (2,075) (544)Surplus/(deficit) for the reporting period - - - 505
2005 2004 2005 2004$'000 $'000 $'000 $'000
Financial assistance received in cash during the reporting period 507 - 75,712 64,510Net accrual adjustments - - 5,130 (287)Revenue for the period 2(a) 507 - 80,842 64,223Surplus/(deficit) from the previous year - - 617 178Total funds including accrued revenue 507 - 81,459 64,401Less expenses including accrued expenses (507) - (81,375) (63,784)Surplus/(deficit) for the reporting period - - 84 617
48.2 Higher Education Loan Programmes
2005 2004 2005 2004$'000 $'000 $'000 $'000
Financial assistance received in cash during the reporting period 42,441 35,108 5,858 3,721Net accrual adjustments - 3,053 (1,663) - Revenue for the period 2(b) 42,441 38,161 4,195 3,721Surplus/(deficit) from the previous year - - 11 (97)Total funds including accrued revenue 42,441 38,161 4,206 3,624Less expenses including accrued expenses (42,441) (38,161) (4,366) (3,613)Surplus/(deficit) for the reporting period - - (160) 11
THE UNIVERSITY OF WESTERN AUSTRALIANOTES TO THE FINANCIAL STATEMENTS
31 DECEMBER 2005
Indigenous Support Fund
Commonwealth Grant Scheme
Equity Programmes
University University
Workplace Reform Programme
University
University
University
Capital Development Pool
Total
University
University
HECS-HELP (Commonwealth
Payments)
FEE-HELP
University
78

THE UNIVERSITY OF WESTERN AUSTRALIANOTES TO THE FINANCIAL STATEMENTS
31 DECEMBER 2005
48.2 Higher Education Loan Programmes (continued)
Notes 2005 2004$'000 $'000
Financial assistance received in cash during the reporting period 48,299 38,829Net accrual adjustments (1,663) 3,053Revenue for the period 2(b) 46,636 41,882Surplus/(deficit) from the previous year 11 (97)Total funds including accrued revenue 46,647 41,785Less expenses including accrued expenses (46,807) (41,774)Surplus/(deficit) for the reporting period (160) 11
48.3 Scholarships
2005 2004 2005 2004$'000 $'000 $'000 $'000
Financial assistance received in cash during the reporting period 4,739 4,645 1,465 850Net accrual adjustments (34) 35 51 392Revenue for the period 2(c) 4,705 4,680 1,516 1,242Surplus/(deficit) from the previous year (16) 48 (338) (410)Total funds including accrued revenue 4,689 4,728 1,178 832Less expenses including accrued expenses (4,656) (4,744) (1,178) (1,170)Surplus/(deficit) for the reporting period 33 (16) - (338)
Scholarships
2005 2004 2005 2004$'000 $'000 $'000 $'000
Financial assistance received in cash during the reporting period 292 98 555 256Net accrual adjustments - - - - Revenue for the period 2(c) 292 98 555 256Surplus/(deficit) from the previous year 5 - 10 - Total funds including accrued revenue 297 98 565 256Less expenses including accrued expenses (282) (93) (504) (246)Surplus/(deficit) for the reporting period 15 5 61 10
Scholarships
2005 2004$'000 $'000
Financial assistance received in cash during the reporting period 7,051 5,849Net accrual adjustments 17 427Revenue for the period 2(c) 7,068 6,276Surplus/(deficit) from the previous year (339) (362)Total funds including accrued revenue 6,729 5,914Less expenses including accrued expenses (6,620) (6,253)Surplus/(deficit) for the reporting period 109 (339)
University
Total
University University
University
University
International Postgraduate Research
Scholarships
Australian Postgraduate Awards
Total
University
Commonwealth Accommodation
Scholarships
Commonwealth Education Costs
Scholarships
79

THE UNIVERSITY OF WESTERN AUSTRALIANOTES TO THE FINANCIAL STATEMENTS
31 DECEMBER 2005
48.4 DEST Research
Notes 2005 2004 2005 2004$'000 $'000 $'000 $'000
Financial assistance received in cash during the reporting period 16,254 14,692 28,904 26,139Net accrual adjustments - 1,277 - 2,273Revenue for the period 2(d) 16,254 15,969 28,904 28,412Surplus/(deficit) from the previous year - - - - Total funds including accrued revenue 16,254 15,969 28,904 28,412Less expenses including accrued expenses (16,254) (15,969) (28,904) (28,412)Surplus/(deficit) for the reporting period - - - -
DEST Research
2005 2004 2005 2004$'000 $'000 $'000 $'000
Financial assistance received in cash during the reporting period - 1,914 13,903 11,427Net accrual adjustments - 166 - 993Revenue for the period 2(d) - 2,080 13,903 12,420Surplus/(deficit) from the previous year (32) (443) - - Total funds including accrued revenue (32) 1,637 13,903 12,420Less expenses including accrued expenses - (1,669) (13,903) (12,420)Surplus/(deficit) for the reporting period (32) (32) - -
DEST Research
2005 2004$'000 $'000
Financial assistance received in cash during the reporting period 59,061 54,172Net accrual adjustments - 4,709Revenue for the period 2(d) 59,061 58,881Surplus/(deficit) from the previous year (32) (443)Total funds including accrued revenue 59,029 58,438Less expenses including accrued expenses (59,061) (58,470)Surplus/(deficit) for the reporting period (32) (32)
48.5 Australian Research Council Grants(a) Discovery
2005 2004 2005 2004$'000 $'000 $'000 $'000
Financial assistance received in cash during the reporting period 11,785 10,066 843 875Net accrual adjustments (777) (799) 124 (145)Revenue for the period 2(e) 11,008 9,267 967 730Surplus/(deficit) from the previous year (292) (36) (141) (38)Total funds including accrued revenue 10,716 9,231 826 692Less expenses including accrued expenses (11,368) (9,523) (878) (833)Surplus/(deficit) for the reporting period (652) (292) (52) (141)
Projects Fellowships
University University
Systemic Infrastructure Initiatives
Research Infrastructure Block Grants
University University
University
Total
Institutional Grants Scheme
Research Training Scheme
University University
80
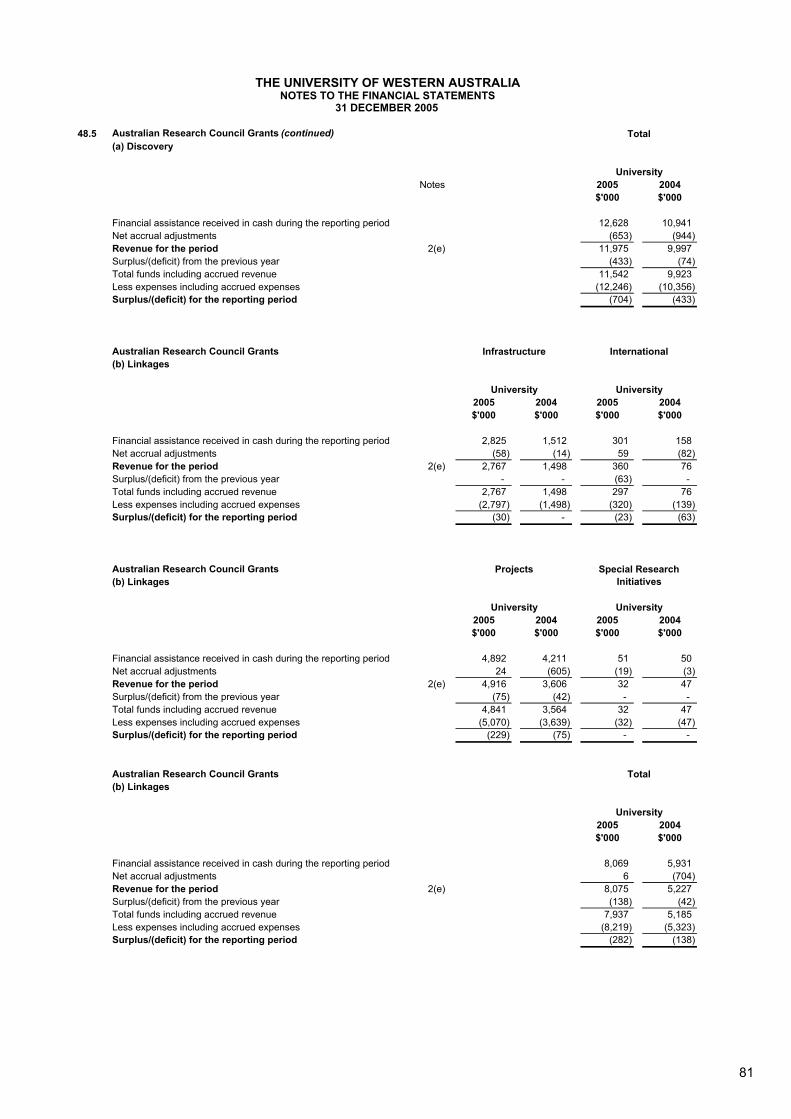
THE UNIVERSITY OF WESTERN AUSTRALIANOTES TO THE FINANCIAL STATEMENTS
31 DECEMBER 2005
48.5 Australian Research Council Grants (continued)(a) Discovery
Notes 2005 2004$'000 $'000
Financial assistance received in cash during the reporting period 12,628 10,941Net accrual adjustments (653) (944)Revenue for the period 2(e) 11,975 9,997Surplus/(deficit) from the previous year (433) (74)Total funds including accrued revenue 11,542 9,923Less expenses including accrued expenses (12,246) (10,356)Surplus/(deficit) for the reporting period (704) (433)
Australian Research Council Grants(b) Linkages
2005 2004 2005 2004$'000 $'000 $'000 $'000
Financial assistance received in cash during the reporting period 2,825 1,512 301 158Net accrual adjustments (58) (14) 59 (82)Revenue for the period 2(e) 2,767 1,498 360 76Surplus/(deficit) from the previous year - - (63) - Total funds including accrued revenue 2,767 1,498 297 76Less expenses including accrued expenses (2,797) (1,498) (320) (139)Surplus/(deficit) for the reporting period (30) - (23) (63)
Australian Research Council Grants(b) Linkages
2005 2004 2005 2004$'000 $'000 $'000 $'000
Financial assistance received in cash during the reporting period 4,892 4,211 51 50Net accrual adjustments 24 (605) (19) (3)Revenue for the period 2(e) 4,916 3,606 32 47Surplus/(deficit) from the previous year (75) (42) - - Total funds including accrued revenue 4,841 3,564 32 47Less expenses including accrued expenses (5,070) (3,639) (32) (47)Surplus/(deficit) for the reporting period (229) (75) - -
Australian Research Council Grants(b) Linkages
2005 2004$'000 $'000
Financial assistance received in cash during the reporting period 8,069 5,931Net accrual adjustments 6 (704)Revenue for the period 2(e) 8,075 5,227Surplus/(deficit) from the previous year (138) (42)Total funds including accrued revenue 7,937 5,185Less expenses including accrued expenses (8,219) (5,323)Surplus/(deficit) for the reporting period (282) (138)
Special Research Initiatives
University
Infrastructure
University
Projects
University
International
University
Total
University
Total
University
81

THE UNIVERSITY OF WESTERN AUSTRALIANOTES TO THE FINANCIAL STATEMENTS
31 DECEMBER 2005
48.5 Australian Research Council Grants (continued)(c) Networks and Centres
Notes 2005 2004 2005 2004$'000 $'000 $'000 $'000
Financial assistance received in cash during the reporting period 684 335 2,823 1,658Net accrual adjustments 109 (335) (1,270) 148Revenue for the period 2(e) 793 - 1,553 1,806Surplus/(deficit) from the previous year - - - - Total funds including accrued revenue 793 - 1,553 1,806Less expenses including accrued expenses (793) - (1,555) (1,806)Surplus/(deficit) for the reporting period - - (2) -
Australian Research Council Grants(c) Networks and Centres
2005 2004$'000 $'000
Financial assistance received in cash during the reporting period 3,507 1,993Net accrual adjustments (1,161) (187)Revenue for the period 2(e) 2,346 1,806Surplus/(deficit) from the previous year - - Total funds including accrued revenue 2,346 1,806Less expenses including accrued expenses (2,348) (1,806)Surplus/(deficit) for the reporting period (2) -
Total
University
Research Networks Centres
University University
82
PerformanceIndicatorsSummary of Performance Indicators 1.TeachingandLearning................................................ 84 2.ResearchandScholarship.......................................... 84
Certification of Performance Indicators................................. 85
1. Teaching and Learning 1.1 Proportion of Top School Leavers
Applying for Admission.............................................. 86 1.2 Proportion of Student Load Passed.......................... 87 1.3 Course Experience Questionnaire............................ 88 1.4 Graduate Destinations.............................................. 89 1.5 Expenditure Ratios.................................................... 90
2. Research and Scholarship 2.1 Higher Degree by Research International and Interstate Enrolments............................................... 91 2.2 Higher Degree by Research Completions per staff FTE............................................................. 92 2.3 Publication Rates...................................................... 93 2.4ResearchGrants...................................................... 94
83
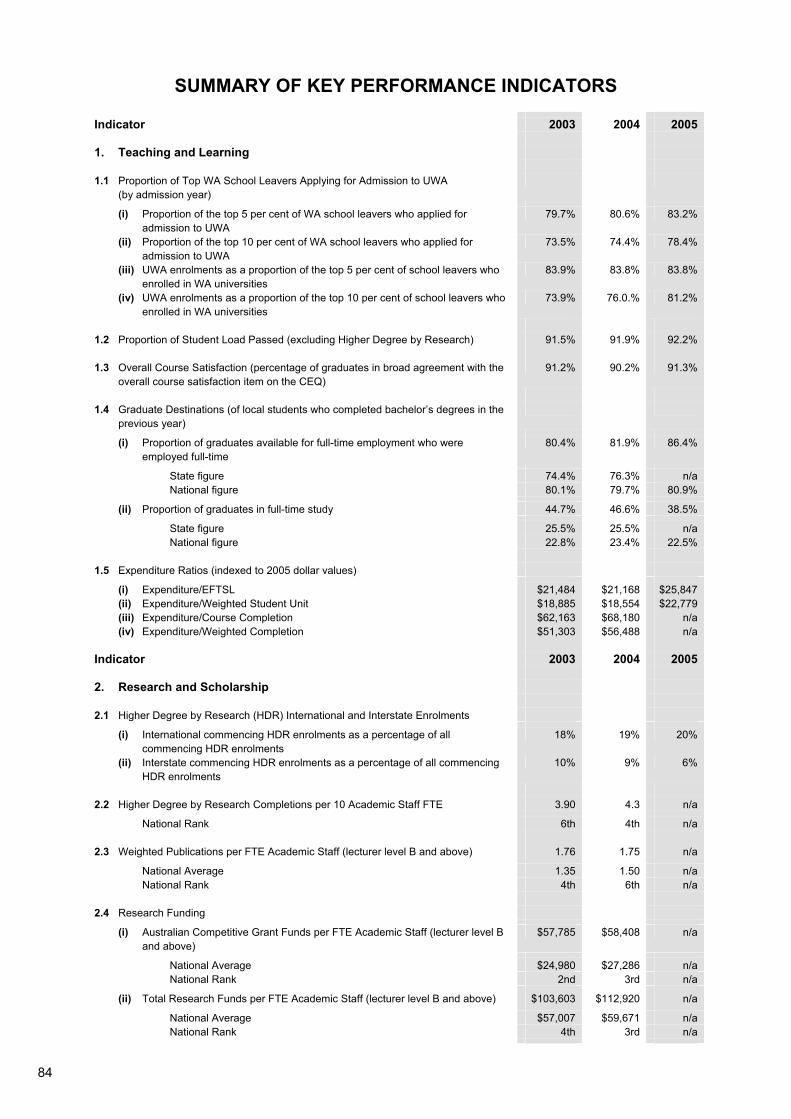
SUMMARY OF KEY PERFORMANCE INDICATORS Indicator 2003 2004 2005 1. Teaching and Learning 1.1 Proportion of Top WA School Leavers Applying for Admission to UWA
(by admission year)
(i) Proportion of the top 5 per cent of WA school leavers who applied for
admission to UWA 79.7% 80.6% 83.2%
(ii) Proportion of the top 10 per cent of WA school leavers who applied for admission to UWA
73.5% 74.4% 78.4%
(iii) UWA enrolments as a proportion of the top 5 per cent of school leavers who enrolled in WA universities
83.9% 83.8% 83.8%
(iv) UWA enrolments as a proportion of the top 10 per cent of school leavers who enrolled in WA universities
73.9% 76.0.% 81.2%
1.2 Proportion of Student Load Passed (excluding Higher Degree by Research) 91.5% 91.9% 92.2% 1.3 Overall Course Satisfaction (percentage of graduates in broad agreement with the
overall course satisfaction item on the CEQ) 91.2% 90.2% 91.3%
1.4 Graduate Destinations (of local students who completed bachelor’s degrees in the
previous year)
(i) Proportion of graduates available for full-time employment who were
employed full-time 80.4% 81.9% 86.4%
State figure 74.4% 76.3% n/a National figure 80.1% 79.7% 80.9% (ii) Proportion of graduates in full-time study 44.7% 46.6% 38.5% State figure 25.5% 25.5% n/a National figure 22.8% 23.4% 22.5%
1.5 Expenditure Ratios (indexed to 2005 dollar values)
(i) Expenditure/EFTSL $21,484 $21,168 $25,847 (ii) Expenditure/Weighted Student Unit $18,885 $18,554 $22,779 (iii) Expenditure/Course Completion $62,163 $68,180 n/a (iv) Expenditure/Weighted Completion $51,303 $56,488 n/a
Indicator 2003 2004 2005 2. Research and Scholarship 2.1 Higher Degree by Research (HDR) International and Interstate Enrolments
(i) International commencing HDR enrolments as a percentage of all commencing HDR enrolments
18% 19% 20%
(ii) Interstate commencing HDR enrolments as a percentage of all commencing HDR enrolments
10% 9% 6%
2.2 Higher Degree by Research Completions per 10 Academic Staff FTE 3.90 4.3 n/a
National Rank 6th 4th n/a 2.3 Weighted Publications per FTE Academic Staff (lecturer level B and above) 1.76 1.75 n/a
National Average 1.35 1.50 n/a National Rank 4th 6th n/a
2.4 Research Funding
(i) Australian Competitive Grant Funds per FTE Academic Staff (lecturer level B and above)
$57,785 $58,408 n/a
National Average $24,980 $27,286 n/a National Rank 2nd 3rd n/a (ii) Total Research Funds per FTE Academic Staff (lecturer level B and above) $103,603 $112,920 n/a National Average $57,007 $59,671 n/a National Rank 4th 3rd n/a
84
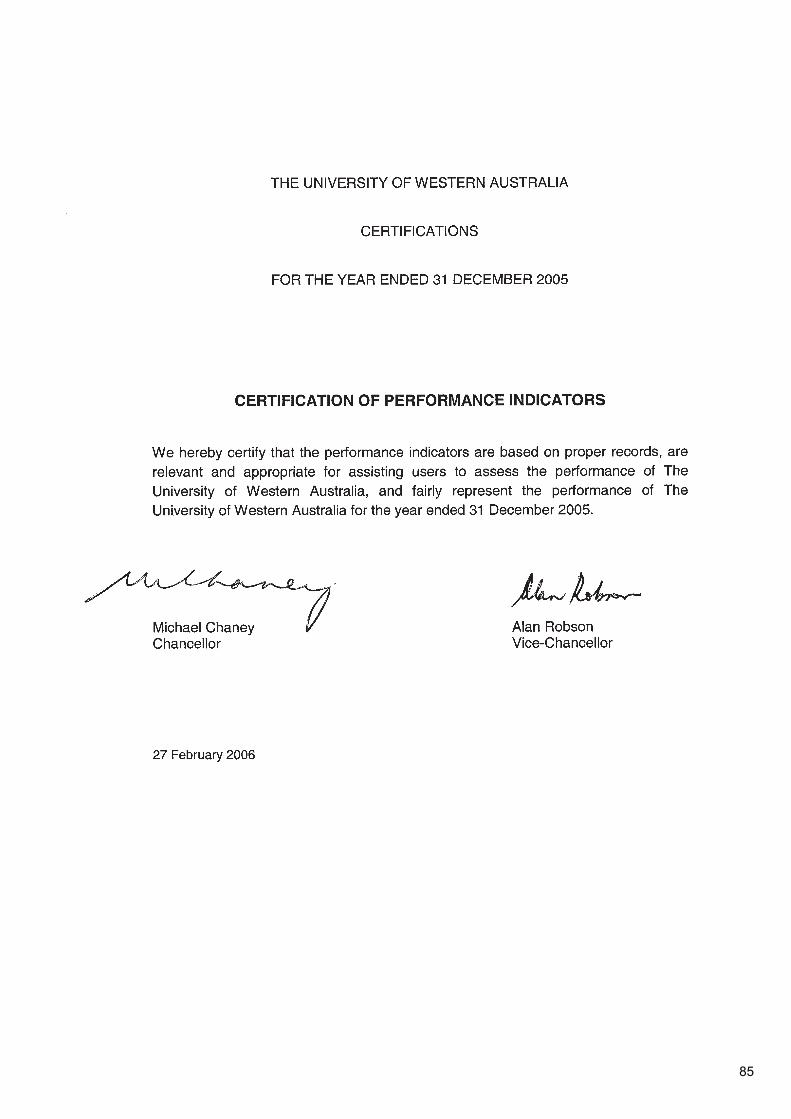
85
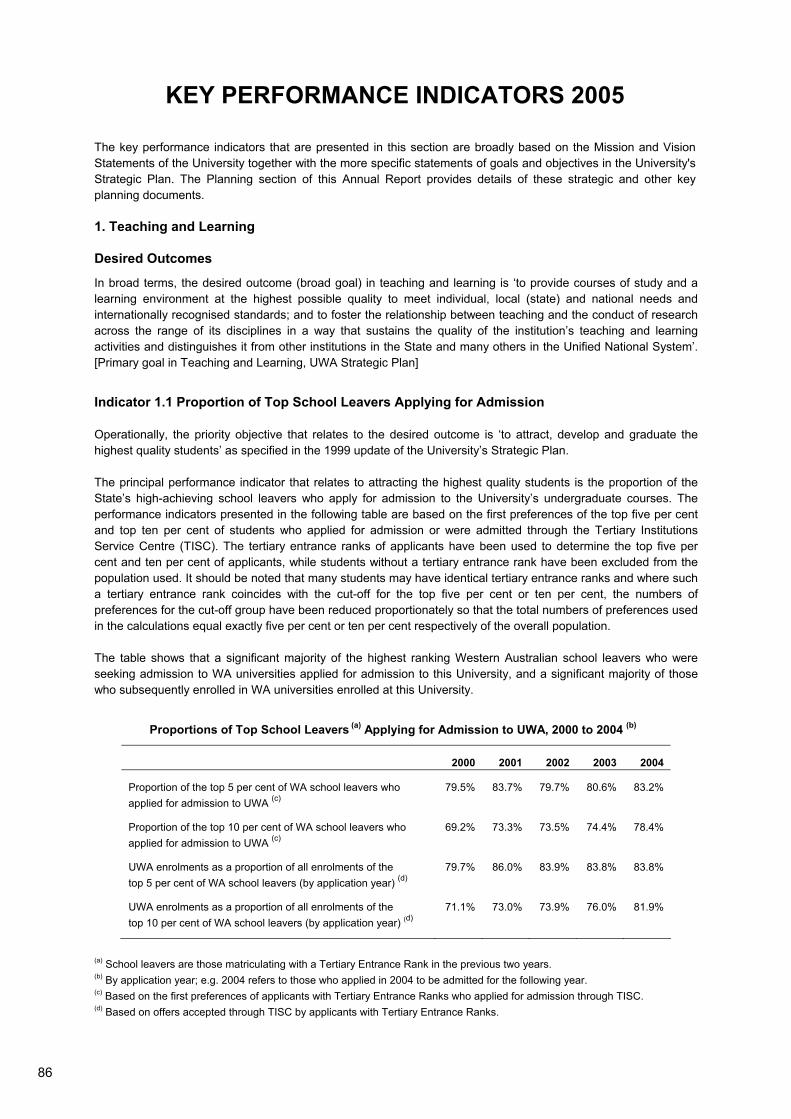
KEY PERFORMANCE INDICATORS 2005
The key performance indicators that are presented in this section are broadly based on the Mission and Vision Statements of the University together with the more specific statements of goals and objectives in the University's Strategic Plan. The Planning section of this Annual Report provides details of these strategic and other key planning documents.
1. Teaching and Learning
Desired Outcomes
In broad terms, the desired outcome (broad goal) in teaching and learning is ‘to provide courses of study and a learning environment at the highest possible quality to meet individual, local (state) and national needs and internationally recognised standards; and to foster the relationship between teaching and the conduct of research across the range of its disciplines in a way that sustains the quality of the institution’s teaching and learning activities and distinguishes it from other institutions in the State and many others in the Unified National System’. [Primary goal in Teaching and Learning, UWA Strategic Plan]
Indicator 1.1 Proportion of Top School Leavers Applying for Admission
Operationally, the priority objective that relates to the desired outcome is ‘to attract, develop and graduate the highest quality students’ as specified in the 1999 update of the University’s Strategic Plan.
The principal performance indicator that relates to attracting the highest quality students is the proportion of the State’s high-achieving school leavers who apply for admission to the University’s undergraduate courses. The performance indicators presented in the following table are based on the first preferences of the top five per cent and top ten per cent of students who applied for admission or were admitted through the Tertiary Institutions Service Centre (TISC). The tertiary entrance ranks of applicants have been used to determine the top five per cent and ten per cent of applicants, while students without a tertiary entrance rank have been excluded from the population used. It should be noted that many students may have identical tertiary entrance ranks and where such a tertiary entrance rank coincides with the cut-off for the top five per cent or ten per cent, the numbers of preferences for the cut-off group have been reduced proportionately so that the total numbers of preferences used in the calculations equal exactly five per cent or ten per cent respectively of the overall population.
The table shows that a significant majority of the highest ranking Western Australian school leavers who were seeking admission to WA universities applied for admission to this University, and a significant majority of those who subsequently enrolled in WA universities enrolled at this University.
Proportions of Top School Leavers (a) Applying for Admission to UWA, 2000 to 2004 (b)
2000 2001 2002 2003 2004
Proportion of the top 5 per cent of WA school leavers who applied for admission to UWA (c)
79.5% 83.7% 79.7% 80.6% 83.2%
Proportion of the top 10 per cent of WA school leavers who applied for admission to UWA (c)
69.2% 73.3% 73.5% 74.4% 78.4%
UWA enrolments as a proportion of all enrolments of the top 5 per cent of WA school leavers (by application year) (d)
79.7% 86.0% 83.9% 83.8% 83.8%
UWA enrolments as a proportion of all enrolments of the top 10 per cent of WA school leavers (by application year) (d)
71.1% 73.0% 73.9% 76.0% 81.9%
(a) School leavers are those matriculating with a Tertiary Entrance Rank in the previous two years. (b) By application year; e.g. 2004 refers to those who applied in 2004 to be admitted for the following year. (c) Based on the first preferences of applicants with Tertiary Entrance Ranks who applied for admission through TISC. (d) Based on offers accepted through TISC by applicants with Tertiary Entrance Ranks.
86
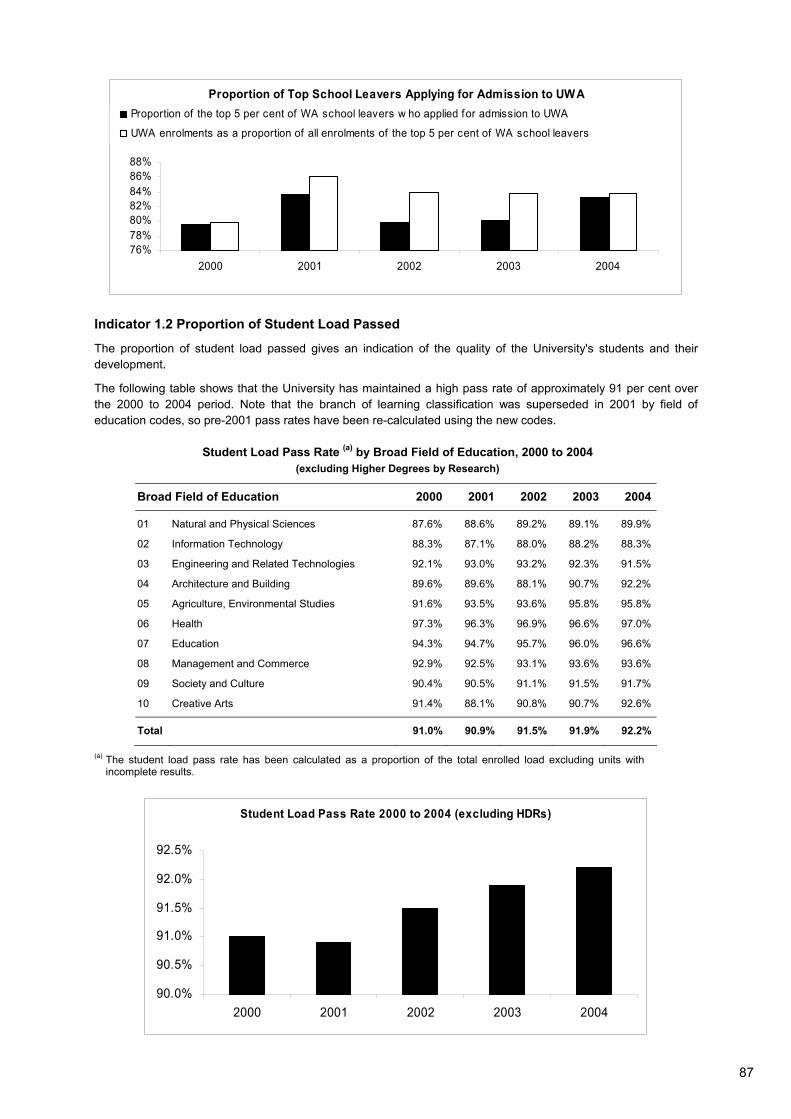
Proportion of Top School Leavers Applying for Admission to UWA
76%78%80%82%84%86%88%
2000 2001 2002 2003 2004
Proportion of the top 5 per cent of WA school leavers w ho applied for admission to UWA
UWA enrolments as a proportion of all enrolments of the top 5 per cent of WA school leavers
Indicator 1.2 Proportion of Student Load Passed
The proportion of student load passed gives an indication of the quality of the University's students and their development.
The following table shows that the University has maintained a high pass rate of approximately 91 per cent over the 2000 to 2004 period. Note that the branch of learning classification was superseded in 2001 by field of education codes, so pre-2001 pass rates have been re-calculated using the new codes.
Student Load Pass Rate (a) by Broad Field of Education, 2000 to 2004 (excluding Higher Degrees by Research)
Broad Field of Education 2000 2001 2002 2003 2004
01 Natural and Physical Sciences 87.6% 88.6% 89.2% 89.1% 89.9%
02 Information Technology 88.3% 87.1% 88.0% 88.2% 88.3%
03 Engineering and Related Technologies 92.1% 93.0% 93.2% 92.3% 91.5%
04 Architecture and Building 89.6% 89.6% 88.1% 90.7% 92.2%
05 Agriculture, Environmental Studies 91.6% 93.5% 93.6% 95.8% 95.8%
06 Health 97.3% 96.3% 96.9% 96.6% 97.0%
07 Education 94.3% 94.7% 95.7% 96.0% 96.6%
08 Management and Commerce 92.9% 92.5% 93.1% 93.6% 93.6%
09 Society and Culture 90.4% 90.5% 91.1% 91.5% 91.7%
10 Creative Arts 91.4% 88.1% 90.8% 90.7% 92.6%
Total 91.0% 90.9% 91.5% 91.9% 92.2%
(a) The student load pass rate has been calculated as a proportion of the total enrolled load excluding units with incomplete results.
Student Load Pass Rate 2000 to 2004 (excluding HDRs)
90.0%
90.5%
91.0%
91.5%
92.0%
92.5%
2000 2001 2002 2003 2004
87

Indicator 1.3 Course Experience Questionnaire
The quality of the University’s courses can be judged in part from graduates’ responses to the Course Experience Questionnaire (CEQ) and Postgraduate Research Experience Questionnaire (PREQ) which are conducted in conjunction with the annual Graduate Destinations Survey of the students who completed courses in the previous year.
Respondents to the CEQ and PREQ are asked to record their responses to 24 statements about various aspects of the courses completed. A five-point scale ranging from 1 labelled ‘strongly disagree’ to 5 labelled ‘strongly agree’ is used for this purpose (2, 3 and 4 are not labelled and it is assumed that 4 indicates agreement with the statement). Item 24 (‘Overall, I was satisfied with the quality of the course’) obtained students’ overall impressions of their courses. Each year approximately one half of the students who completed courses in the previous year at this University responds to this item. Their responses are summarised in the following table, and show an increase in the proportion of graduates with a positive response (responses 4 and 5 on the response scale) from 74 per cent of respondents in 2001 to 76 per cent in 2003, followed by a drop to 73 per cent in 2005.
Student Responses to the Course Experience Questionnaire Item 24: ‘Overall, I was satisfied with the quality of the course.’
Course Type Percentage of Respondents
Course Completions
Number of Respondents
Strongly Disagree
StronglyAgree
1 2 3 4 5 2005 Responses
Doctorate by Research 231 140 4% 1% 6% 48% 42% Master’s Research 71 34 3% 3% 9% 47% 38% Master’s Coursework 474 281 2% 5% 14% 54% 24% Other Postgraduate (a) 473 193 1% 8% 22% 45% 25% Bachelor’s Graduate Entry 126 74 3% 8% 24% 46% 19% Bachelor’s Honours 721 287 2% 8% 11% 46% 33% Bachelor’s Pass 1,940 1,912 3% 7% 21% 49% 21% Undergraduate Diploma 23 17 0% 6% 12% 65% 18%
2005 Total 4,059 2,938 2% 6% 19% 49% 24%
2004 Total 4,157 2,082 2% 7% 18% 50% 22% 2003 Total 3,935 1,658 2% 7% 16% 52% 24% 2002 Total 3,698 1,774 3% 6% 16% 49% 25% 2001 Total 3,490 2,000 2% 7% 17% 51% 23%
(a) Comprises graduate diplomas, graduate certificates and postgraduate qualifying/preliminary courses from 2005.
Responses to Course Experience Survey, Overall Satisfaction
0%20%40%60%80%
100%
2001 2002 2003 2004 2005
1 Strongly Disagree
2
3
4
5 Strongly Agree
88

Indicator 1.4 Graduate Destinations
Graduate destinations in the first year following completion of their course gives an indication of how well the University meets individual, local (state) and national needs.
Figures in the following tables are based on the responses of approximately two-thirds of the non-overseas graduates who responded to the Graduate Careers Australia Graduate Destinations Surveys conducted in 2002 to 2005. They show that 87.0 per cent of bachelor’s degree graduates from this University who were seeking employment had obtained their preferred mode of employment (i.e. full-time or part-time). This is 5 per cent higher than the national figure of 82.0 per cent. The figures also show that the proportion of graduates who pursued further full-time study was significantly higher than the national average (38.5 percent as compared with 22.5% per cent).
Destinations of Bachelor’s Degree Graduates (a), UWA 2002 to 2005 and Australia 2005
The University of Western Australia Australia 2002 2003 2004 2005 2005
In full-time study 43.4% 44.7% 46.6% 38.5% 22.5%
Available for employment 49.4% 52.0% 51.1% 58.7% 74.4%
Unavailable for full-time study or full-time employment
7.2% 3.3% 2.3% 2.8% 3.1%
Total percentage (b) 100.0% 100.0% 100.0% 100.0% 100.0%
Total respondents 1,373 1,315 1,286 1,495 65,738
Response rate (c) 59% 55% 53% 64% 62%
(a) Destinations (as of 30 April) of students who completed bachelor’s degrees (including bachelor’s graduate entry degrees) in the previous year excluding overseas residents.
(b) Discrepancies between the sums of component items and the totals are due to rounding. (c) Number of respondents as a percentage of those surveyed.
Destinations of Bachelor's Degree Graduates
0%20%40%60%80%
100%
2002 2003 2004 2005 2005
UWA Australia
Unavailable for full-time studyorfull-time employmentAvailable for employmentIn full-time study
89

Destinations of Bachelor’s Degree Graduates who were Seeking Employment (a), UWA 2002 to 2005 and Australia 2005
The University of Western Australia Australia 2002 2003 2004 2005 2005
In desired mode of employment 78.2% 81.1% 82.0% 87.0% 82.0%
In full-time employment 71.2% 71.5% 75.6% 78.1% 73.3%
In part-time or casual employment, not seeking full-time employment
6.9% 9.6% 6.4% 8.9%
8.6%
Seeking full-time employment, working part-time or casual 10.5% 9.8% 9.7% 7.3% 11.1%
Seeking full-time employment, not working 10.3% 7.6% 7.0% 5.0% 6.2%
Not working, seeking part-time or casual employment only 1.0% 1.5% 1.2% 0.7% 0.8%
Total percentage (b) 100.0% 100.0% 100.0% 100.0% 100.0%
Total respondents 678 684 657 877 48,949
(a) Destinations (as of 30 April) of students who completed bachelor’s degrees (including bachelor’s graduate entry degrees) in the previous year excluding overseas residents who were seeking employment.
(b) Discrepancies between the sums of component items and the totals are due to rounding.
In Desired Mode of Employment
72%74%76%78%80%82%84%86%88%
2002 2003 2004 2005 2005
UWA Australia
Indicator 1.5 Expenditure Ratios
Efficiency indicators are intended to show the relationship between the resources used and the outputs produced. In the higher education sector, one measure of the resources is the expenditure attributed to teaching, while the outputs may be defined in terms of the number of graduates or equivalent full-time students.
The major source of funds used for teaching is the Commonwealth operating grant that is primarily determined on the basis of a negotiated student load mix. Essentially the same rate of funding applies to each course type/discipline category in the load target negotiated by each institution in the Unified National System. As a consequence, figures on expenditure per equivalent full-time student load (EFTSL) reflect the student load mix.
The fees for overseas students are set in a competitive environment and therefore reflect the perception of the University’s courses; a premium is earned for courses with high demand and is usually used for teaching purposes. Thus high expenditure figures may reflect the perceived quality of courses.
The following table presents ratios of the total expenditure (excluding research only expenditure) to the equivalent full-time loads and weighted student units of all students at the University. It shows a 41.0 per cent increase in the expenditure per EFTSL and a 41.0 per cent increase in expenditure per weighted student unit at this University over the 2001 to 2005 period. Expenditure per course completion increased by 12.1 per cent from 2001 to 2004 while expenditure per weighted course completion increased by 11.7 per cent over the same period.
90

Expenditure Ratios, 2001 to 2005
2001 2002 2003 2004 2005
Expenditure (a) / EFTSL 18,337 19,113 21,484 21,168 25,847
Expenditure (a) / Weighted Student Units (b) 16,154 16,835 18,885 18,554 22,779
Expenditure (c) / Course Completion 60,837 59,539 62,163 68,180 – (e)
Expenditure (c) / Weighted Completion (d) 50,558 49,544 51,303 56,488 – (e)
(a) Total expenditure, excluding research-only expenditure and Perth International Arts Festival expenditure, indexed to 2005 dollar values. Note that expenditure figures from 2005 are calculated in accordance with AIFRS and hence are not strictly comparable with previous years’ figures.
(b) Weighted student units are calculated by multiplying student load in higher degree research by 2.0, other postgraduate and honours load by 1.3 and bachelor’s (including graduate entry) load by 1.0.
(c) Total expenditure (in 2005 dollar values) excluding research-only expenditure averaged over last three years. (d) Weighted by multiplying the number of completions in higher degree research by 2.0, other postgraduate and honours
completions by 1.3 and bachelor’s (including graduate entry) completions by 1.0. (e) The number of completions for 2005 is not available until May 2006.
2. Research and Scholarship
Desired Outcome
The desired outcome in Research and Scholarship is to enhance the University’s ‘standing as one of Australia’s leading research universities and the premier research institution in Western Australia. There are two dimensions to this goal: firstly, the University is committed to the achievement of high quality research and scholarship, by international standards, across the whole spectrum of its disciplines; and additionally, to the development of special research concentrations, of the very highest international standards, in selected areas of particular strength, importance and opportunity’. [Primary goal in Research and Scholarship, UWA Strategic Plan]
Indicator 2.1 Higher Degree by Research International and Interstate Enrolments
This University’s success in attracting higher degree by research students is a reflection of its reputation for excellence in research as measured by the proportion of higher degree research students whose undergraduate qualification is from an overseas or an interstate institution. The following table of commencing higher degree research enrolments by undergraduate institution of origin shows that in 2005, 59 per cent of the University’s commencing research students came from outside UWA, with 20 per cent from overseas institutions and 6 per cent from interstate.
91

Commencing Higher Degree by Research Enrolments by Undergraduate Institution Location, 2001 to 2005
Overseas Interstate Other WA
None(a) Sub Total (b)
UWA Total(b)
2005 Enrolments by Faculty Architecture, Landscape and Visual Arts 33% 0% 33% 0% 67% 33% 100%Arts, Humanities and Social Sciences 21% 12% 9% 0% 42% 58% 100%Economics and Commerce 38% 31% 8% 0% 77% 23% 100%Education 40% 2% 25% 0% 67% 33% 100%Engineering, Computing and Mathematics 34% 6% 11% 3% 54% 46% 100%Law 33% 22% 22% 0% 78% 22% 100%Life and Physical Sciences 19% 1% 14% 0% 34% 66% 100%Medicine and Dentistry 13% 9% 31% 0% 54% 46% 100%Natural and Agricultural Sciences 18% 16% 16% 5% 55% 45% 100%
2005 Total 24% 8% 18% 1% 51% 49% 100%
2004 Total 19% 9% 14% 5% 46% 54% 100%2003 Total 18% 10% 15% 1% 44% 56% 100%2002 Total 20% 10% 15% 1% 46% 54% 100%2001 Total 25% 10% 16% 5% 56% 44% 100%
(a) No undergraduate studies undertaken, or prior institution not recorded. (b) Discrepancies between the sums of component items and the totals are due to rounding.
With regard to fee-paying overseas doctoral students, a breakdown of their regional origin shows that over a five-year period, from 2001 to 2005, the University attracted 253 doctoral students from all regions of the world—Europe, Africa, Asia and the Middle East, the Americas and the Pacific Region.
Indicator 2.2 Higher Degree by Research Completions per Staff FTE
The numbers of higher degrees by research completed per staff member is a measure of the teaching-and-research staff productivity in research and scholarship. It should be noted that the University uses external examiners with international reputation to ensure that the degrees conferred are of the highest international standard.
The number of higher degree by research completions per 10 full-time equivalent (FTE) teaching-and-research staff members at lecturer or above status (excluding casual staff appointments) has increased from 3.64 in 2000 to 4.30 in 2004. It should be noted that the staffing level used for this ratio was the average staff FTE for the previous three years of teaching-and-research staff with a level B or above appointment, and excluded casual staff.
Weighted (a) Higher Degree by Research Completions (b) per 10 Academic Staff FTE (c)
2000 to 2004
2000 2001 2002 2003 2004 Doctorate by Research 2.72 2.54 2.75 3.08 3.29 Master's by Research 0.92 1.25 1.01 0.83 1.01
Total 3.64 3.79 3.76 3.91 4.30
Weighted Total 6.36 6.33 6.51 6.99 7.59 (a) Doctorates are weighted as 2 and master’s degrees by research as 1. (b) Excluding higher doctorate completions. (c) Average of past three years’ staff FTE for academic staff in academic organisational units with a teaching-and-research or
teaching-only appointment at level B or above (excluding casual staff FTE). Note that staff FTE from 2003 onwards is taken from DEST while earlier figures were taken from UWA reports. The value of the 2003 indicator has been revised with this change.
92

Weighted HDR Completions per 10 Academic Staff FTE
5.5
6.0
6.5
7.0
7.5
8.0
2000 2001 2002 2003 2004
Relative to other Universities, the University recorded the fourth highest number nationally (4.30) of higher degree by research completions per 10 academic staff FTE in 2004 (as shown in the following table). This figure is significantly higher than the national average of 2.95.
Higher Degree by Research Completions (a) per 10 Academic Staff FTE (b), Selected Universities (c), 2002 to 2004
2002 2003 2004 Institution Total Total/
10 FTE Rank Total Total/
10 FTERank Total Total/
10 FTE Rank
ANU 236 5.88 1 253 5.92 1 260 5.81 1Melbourne 663 5.04 2 694 5.18 2 724 5.27 2Queensland 484 4.50 3 548 5.04 3 514 4.67 3Western Australia 253 3.76 5 268 3.91 6 302 4.30 4Sydney 517 3.68 7 550 3.95 5 597 4.26 5New South Wales 381 3.23 10 319 2.44 18 513 4.01 6Adelaide 226 3.71 6 242 4.01 4 220 3.66 7Monash 454 3.53 8 445 3.45 9 445 3.39 8Southern Cross 75 4.04 4 71 3.79 7 62 3.27 9RMIT 225 3.03 11 241 3.20 10 253 3.27 10Tasmania 134 3.22 9 152 3.68 8 127 3.11 11Murdoch 92 2.74 13 95 2.77 15 104 3.02 12Curtin 129 1.85 24 217 2.98 12 204 2.75 14Edith Cowan 73 1.62 29 80 1.78 27 84 1.89 27AUSTRALIA 5822 2.73 6314 2.93 6468 2.95
(a) Excluding higher doctorate completions. (b) Average of past three years’ staff FTE for academic staff in academic organisational units with a teaching-and-research or
teaching only appointment at level B or above (excluding casual staff FTE). (c) The 12 highest ranked universities in 2004 plus WA institutions.
Indicator 2.3 Publication Rates
The numbers of refereed publications in reputable journals and other publications may be considered to be a reflection of the research output of a university and the numbers of weighted publications per academic staff FTE give an indication of research productivity. The figures in the following table show that the average number of weighted publications per staff FTE at this University has increased by 10.7% from 1.58 in 2000 to 1.75 in 2004, which is considerably higher than the national average of 1.50 that has been recorded for 2004. However, it should be noted that the figures relate to the publications reported on the 2000 to 2004 DEST Higher Education Research Data Collections and do not purport to cover the complete range of publications produced by the University’s staff during that period.
93
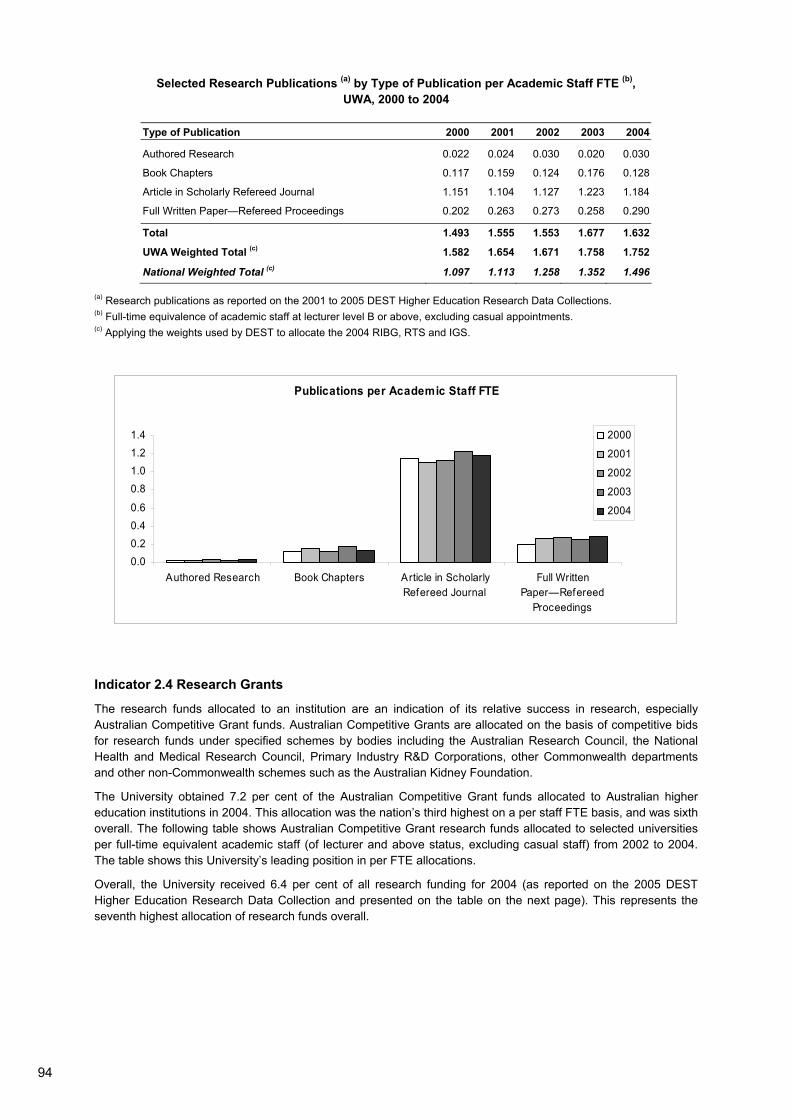
Selected Research Publications (a) by Type of Publication per Academic Staff FTE (b), UWA, 2000 to 2004
Type of Publication 2000 2001 2002 2003 2004
Authored Research 0.022 0.024 0.030 0.020 0.030
Book Chapters 0.117 0.159 0.124 0.176 0.128
Article in Scholarly Refereed Journal 1.151 1.104 1.127 1.223 1.184
Full Written Paper—Refereed Proceedings 0.202 0.263 0.273 0.258 0.290
Total 1.493 1.555 1.553 1.677 1.632
UWA Weighted Total (c) 1.582 1.654 1.671 1.758 1.752
National Weighted Total (c) 1.097 1.113 1.258 1.352 1.496
(a) Research publications as reported on the 2001 to 2005 DEST Higher Education Research Data Collections. (b) Full-time equivalence of academic staff at lecturer level B or above, excluding casual appointments. (c) Applying the weights used by DEST to allocate the 2004 RIBG, RTS and IGS.
Publications per Academic Staff FTE
0.00.20.40.6
0.81.01.21.4
Authored Research Book Chapters Article in ScholarlyRefereed Journal
Full WrittenPaper—Refereed
Proceedings
2000
2001
2002
2003
2004
Indicator 2.4 Research Grants
The research funds allocated to an institution are an indication of its relative success in research, especially Australian Competitive Grant funds. Australian Competitive Grants are allocated on the basis of competitive bids for research funds under specified schemes by bodies including the Australian Research Council, the National Health and Medical Research Council, Primary Industry R&D Corporations, other Commonwealth departments and other non-Commonwealth schemes such as the Australian Kidney Foundation.
The University obtained 7.2 per cent of the Australian Competitive Grant funds allocated to Australian higher education institutions in 2004. This allocation was the nation’s third highest on a per staff FTE basis, and was sixth overall. The following table shows Australian Competitive Grant research funds allocated to selected universities per full-time equivalent academic staff (of lecturer and above status, excluding casual staff) from 2002 to 2004. The table shows this University’s leading position in per FTE allocations.
Overall, the University received 6.4 per cent of all research funding for 2004 (as reported on the 2005 DEST Higher Education Research Data Collection and presented on the table on the next page). This represents the seventh highest allocation of research funds overall.
94

Australian Competitive Grant Funds (a) per Academic Staff FTE (b)
Allocated to Selected Universities (c), 2002 to 2004
2002 2003 2004 Institution Funds ($) $/FTE Rank Funds ($) $/FTE Rank Funds ($) $/FTE Rank
Adelaide 41,333,296 57,011 1 47,763,157 64,632 1 50,919,803 67,265 1
ANU 30,276,953 31,770 7 55,635,215 55,139 3 63,832,472 59,657 2
Western Australia 40,125,631 47,486 2 49,810,642 57,785 2 52,742,515 58,408 3
Melbourne 74,801,422 44,818 3 87,167,861 50,357 4 93,264,300 51,900 4
Sydney 60,944,523 37,924 4 75,874,497 44,764 5 88,466,013 50,293 5
Queensland 48,309,308 33,502 6 63,456,179 42,588 6 73,057,643 46,563 6
New South Wales 49,171,405 35,324 5 54,852,782 35,781 7 63,086,642 40,311 7
Tasmania 14,400,791 28,292 8 17,389,302 32,810 8 20,925,956 39,708 8
Charles Darwin 1,285,175 9,663 19 1,733,545 14,209 16 5,485,500 39,182 9
Monash 36,297,750 21,415 10 45,893,967 25,568 9 52,352,899 28,593 10
Newcastle 12,801,019 18,825 12 16,153,599 23,011 11 19,030,231 25,962 11
Murdoch 8,611,133 21,745 9 9,841,987 24,361 10 10,081,922 25,459 12
Curtin 4,566,179 5,096 28 6,276,579 7,239 26 7,721,298 8,666 24
Edith Cowan 1,547,363 3,477 34 1,505,540 3,353 36 2,271,027 5,115 32
AUSTRALIA 524,614,830 20,714 650,398,058 24,980 734,201,364 26,908
(a) Includes income of Co-operative Research Centres (from Commonwealth sources) and controlled entities. (b) Full-time equivalence of academic staff at lecturer level B and above, excluding casual appointments. (c) The 12 highest-ranked universities in 2004 plus WA institutions.
Australian Competitive Grants per Academic Staff FTE
0 10,000 20,000 30,000 40,000 50,000 60,000 70,000 80,000
Adelaide
ANU
Western Australia
Melbourne
Sydney
Queensland
New South Wales
Tasmania
Charles Darw in
Monash
New castle
Murdoch
Curtin
Edith Cow an
$/FTE
2004
2003
2002
95

Total Research Income (a) per Academic Staff FTE (b) Allocated to Selected Universities (c), 2002 to 2004
2002 2003 2004
Institution Funds ($) $/FTE Rank Funds ($) $/FTE Rank Funds ($) $/FTE Rank
Adelaide 78,473,945 108,240 1 86,877,954 117,562 1 93,983,868 124,153 1
Melbourne 158,782,596 95,136 2 198,739,216 114,812 2 208,281,603 115,905 2
Western Australia 74,462,191 88,121 5 89,305,843 103,603 4 101,967,135 112,920 3
Charles Darwin 3,701,236 27,829 21 5,150,786 42,220 13 15,134,654 108,105 4
Queensland 136,730,565 94,820 3 154,664,898 103,802 3 156,660,739 99,848 5
Sydney 145,244,167 90,382 4 156,584,239 92,380 6 175,023,327 99,502 6
ANU 70,898,294 74,395 7 99,095,654 98,212 5 103,439,146 96,672 7
Murdoch 24,944,331 62,991 8 29,177,222 72,221 8 35,971,709 90,838 8
New South Wales 110,217,999 79,180 6 121,662,093 79,362 7 125,703,317 80,322 9
Tasmania 32,006,328 62,881 9 33,044,483 62,348 9 38,159,663 72,409 10
Monash 96,677,014 57,037 10 111,595,568 62,170 10 120,635,509 65,885 11
Newcastle 28,019,412 41,205 12 33,518,172 47,747 12 42,799,285 58,389 12
Curtin 27,155,133 30,307 17 30,027,502 34,634 19 32,472,645 36,445 19
Edith Cowan 5,484,299 12,324 34 5,399,223 12,025 35 8,273,856 18,635 31
AUSTRALIA 1,280,723,275 50,570 1,175,867,610 57,007 1,605,743,487 59,671
(a) Includes income of controlled entities. Excludes CRC income from non-Commonwealth sources. (b) Full-time equivalence of academic staff at lecturer level B and above, excluding casual appointments. (c) The 12 highest-ranked universities in 2004 plus WA institutions.
Total Research Income per Academic Staff FTE
0 20,000 40,000 60,000 80,000 100,000 120,000
Adelaide
Melbourne
Western Australia
Charles Darwin
Queensland
Sydney
ANU
Murdoch
New South Wales
Tasmania
Monash
Newcastle
Curtin
Edith Cowan
$/FTE
20042003
2002
96