annual report 2005 project bp1 impact and policy …
TRANSCRIPT

ANNUAL REPORT 2005
PROJECT BP1
IMPACT AND POLICY ANALYSIS
Reporting Period September 2004-December 2005
ANNUAL REPORT 2005
PROJECT BP1
IMPACT AND POLICY ANALYSIS
i
Impact Assessment - Annual Report 2005
Table of Contents
CIAT: BP-1 PROJECT LOG FRAME (2005-2007)..................................................................................3 EXECUTIVE SUMMARY AND RESEARCH HIGHLIGHTS ...............................................................7 OUTPUT 1: EXPECTED IMPACT OF FUTURE RESEACH ................................................................9
1.1 EX ANTE ASSESSMENT OF THE IMPACT OF BIOFORTIFIED BEANS AND CASSAVA USING THE DISABILITY ADJUSTED LIFE YEARS (DALYS) FRAMEWORK ......................................................................9
1.1.1 Objective .......................................................................................................................................9 1.1.2 Methodology .................................................................................................................................9 1.1.3 Current Situation and progress made in 2005 ..............................................................................9 1.1.4 Goals for 2006 ..............................................................................................................................9 1.1.5 Outputs........................................................................................................................................10 1.1.6 Collaborators..............................................................................................................................10 1.1.7 References ...................................................................................................................................10
1.2 THE POTENTIAL IMPACT OF HARVESTPLUS IN CASSAVA BASED SYSTEMS IN NE BRAZIL: RESULTS OF A QUALITATIVE SURVEY ...........................................................................................................................11
1.2.1 Objetives .....................................................................................................................................11 1.2.2 Methodology ...............................................................................................................................12 1.2.3 Goals for 2006 ............................................................................................................................22 1.2.4 Outputs........................................................................................................................................22 1.2.5 Collaborators..............................................................................................................................22 1.2.6 References ...................................................................................................................................22
1.3 ASSESSING THE POLICY ENVIRONMENT IN KEY HARVESTPLUS COUNTRIES .......................................23 1.3.1 Objective .....................................................................................................................................23 1.3.2 Methodology ...............................................................................................................................23 1.3.3 Current Situation and progress in 2005......................................................................................23
1.3.3.1 UGANDA ............................................................................................................................................ 23 1.3.3.2 BRAZIL............................................................................................................................................... 29
1.3.4 Goals for 2006 ............................................................................................................................33 1.3.5 Collaborators..............................................................................................................................33
1.4 CONSUMER ATTITUDES TOWARD �SECOND GENERATION.� GENETICALLY MODIFIED (GM) FOODS IN DEVELOPING COUNTRIES ..........................................................................................................................34
1.4.1 Objectives....................................................................................................................................34 1.4.2 Methodology ...............................................................................................................................34 1.4.3 Current status and progress in 2005...........................................................................................34 1.4.4 Objectives, Questions and Hypothesis of Proposed Research ....................................................35 1.4.5 Methodology ...............................................................................................................................38 1.4.6 Outputs........................................................................................................................................39 1.4.7 Goal for 2006..............................................................................................................................39 1.4.8 Collaborators..............................................................................................................................39 1.4.9 References ...................................................................................................................................39
1.5 IDENTIFYING OPPORTUNITIES FOR REDUCING POVERTY VIA BETTER COLLECTIVE WATER MANAGEMENT ..........................................................................................................................................44
1.5.1 Objective .....................................................................................................................................44 1.5.2 Methodology ...............................................................................................................................44 1.5.3 Current situation and progress in 2005 ......................................................................................44 1.5.4 Objectives for 2006 .....................................................................................................................47 1.5.5 Outputs........................................................................................................................................47
ii
1.5.6 Collaborators..............................................................................................................................47 1.5.7 References ...................................................................................................................................47
1.6 NEW DIVERSIFIED LIVESTOCK PRODUCTION SYSTEMS INCLUDING AGRICULTURAL COMPONENTS AND ENVIRONMENTAL SERVICES: AN ECONOMIC EVALUATION IN THE COLOMBIAN ANTILLANURA .......48
1.6.1 Objective .....................................................................................................................................48 1.6.2 Methods.......................................................................................................................................48 1.6.3 Current situation and progress made in 2005.............................................................................48 1.6.4 Objectives for 2006 .....................................................................................................................52 1.6.5 Outputs........................................................................................................................................52 1.6.6 Collaborators..............................................................................................................................52
Brachiaria ....................................................................................................................................................... 53 1.7 DIAGNÓSTICO Y ANÁLISIS DE LA CADENA DE CARNE BOVINA EN CENTROAMÉRICA: IDENTIFICACIÓN DE PUNTOS PARA IMPULSAR EL CAMBIO TÉCNICO Y MEJORAR LA EFICIENCIA DEL SECTOR........................61
1.7.1 Introducción y objetivos..............................................................................................................61 1.7.2 Metodología ................................................................................................................................62 1.7.3 Situación y progresos en 2005 ....................................................................................................62 1.7.4 Planes para el 2006 ....................................................................................................................64 1.7.5 Productos ....................................................................................................................................65 1.7.6 Colaboradores ............................................................................................................................65 1.7.7 Referencias..................................................................................................................................65
1.8 FORRAJES MEJORADOS COMO PROMOTORES DEL CRECIMIENTO ECONÓMICO Y LA SOSTENIBILIDAD. EL CASO DE LOS PEQUEÑOS GANADEROS DE CENTROAMÉRICA .................................................................68
1.8.1 Introducción y objetivos..............................................................................................................68 1.8.2 Metodología ................................................................................................................................69 1.8.3 Progresos y resultados en el 2005 ..............................................................................................69 1.8.4 Productos ....................................................................................................................................71 1.8.5 Colaboradores ............................................................................................................................71 1.8.6 Referencias..................................................................................................................................71
OUTPUT 2: EX POST ................................................................................................................................72 2.1 INTEGRATING GERMPLASM, NATURAL RESOURCE MANAGEMENT, AND INSTITUTIONAL INNOVATIONS TO ENHANCE IMPACT: THE CASE OF CASSAVA-BASED CROPPING SYSTEMS RESEARCH IN ASIA ..........................................................................................................................................................72
2.1.1 Objective .....................................................................................................................................72 2.1.2 Methodology ...............................................................................................................................72 2.1.3 Current situation and progress in 2005 ......................................................................................73 2.1.4 Objectives for 2005 .....................................................................................................................74 2.1.5 Outputs........................................................................................................................................74 2.1.6 Collaborators..............................................................................................................................75
2.2 ADOPCIÓN DE NUEVAS TECNOLOGÍAS DE CONSERVACIÓN DE LOS SUELOS EN LOS LLANOS DE COLOMBIA: TECNOLOGÍAS DE CONSTRUCCIÓN DE CAPA ARABLE............................................................76
2.2.1 Introducción y objetivos..............................................................................................................76 2.2.2 Metodología ................................................................................................................................77 2.2.3 Resultados en 2005 .....................................................................................................................78 2.2.4 Planes para el 2006 ....................................................................................................................81 2.2.5 Productos ....................................................................................................................................81 2.2.6 Colaboradores ............................................................................................................................81 2.2.7 Referencias..................................................................................................................................81
OUTPUT 3: ..................................................................................................................................................83 3.1 THE CHALLENGES OF INCLUSIVE CROSS-SCALE COLLECTIVE ACTION IN WATERSHEDS: A CONCEPTUAL FRAMEWORK FOR RESEARCH AND DEVELOPMENT ............................................................83
3.1.1 Objective .....................................................................................................................................83 3.1.2 Methods......................................................................................................................................83 3.1.3 Current situation and Progress in 2005......................................................................................83 3.1.4 Plans for 2006.............................................................................................................................91
iii
3.1.5 Outputs........................................................................................................................................91 3.1.6 Collaborators..............................................................................................................................91 3.1.7 References ...................................................................................................................................92
3.2 DESARROLLO E IMPLEMENTACIÓN DE MODELOS PARA EVALUACIÓN DEL IMPACTO DE CULTIVOS BIOFORTIFICADOS......................................................................................................................................95
3.2.1 Objetivo.......................................................................................................................................95 3.2.2 Metodología ................................................................................................................................95 3.2.3 Situación actual ..........................................................................................................................97 3.2.4 Output .........................................................................................................................................97 3.2.5 Colaboradores ............................................................................................................................98
3.3 DESARROLLO E IMPLEMENTACIÓN DE MODELOS PARA LA EVALUACIÓN ECONÓMICA, SOCIAL Y AMBIENTAL DE ALTERNATIVAS DE USO DE TIERRA ....................................................................................99
3.3.1 Objetive .......................................................................................................................................99 3.2.2 Methodology ...............................................................................................................................99 3.3.3 Current situation and progress made in 2005...........................................................................103 3.3.4 Output .......................................................................................................................................104 3.3.5 Collaborators............................................................................................................................104
DONOR LIST ............................................................................................................................................105 COLLABORATING INSTITUTIONS ...................................................................................................106 STAFF LIST 2005 .....................................................................................................................................107 PUBLICATIONS AND PRESENTATION.............................................................................................108 REFERENCES ..........................................................................................................................................110

1
CIAT PROJECT BP-1: IMPACT AND POLICY ANALYSIS Project Description Goal To enhance performance of decision making about resource allocation in agricultural research and development (R&D). Objective To generate and disseminate information and tools to improve the capacity of CIAT and its partners to make efficient and effective use of resources in agricultural research and development. Important Assumptions 1) Adequate funding to agricultural research and extension. 2) Decision makers willing to use economic analysis in research priority setting. Target Ecoregión none Beneficiaries and End User Research planners in CIAT and partner organizations who make decisions on resource allocation. All stakeholders who need to evaluate the impacts of investment in agricultural and natural resource management research and development. Collaborators NARS and other public sector institutions: Ministry of Agriculture, Colombia; Ministry of the Environment; Colombia; Corporación Autonoma Regional (CAR); Colombia; Ministry of Water and Irrigation, Kenya; Ministry of Agriculture, Kenya; National Environment and Management Authority, Kenya; Ministry of Planning and National Development, Kenya; EMBRAPA, Brazil; NARO, Uganda. ARIs and universities: University of Hohenheim, Germany; Universidad de los Andes and Javeriana University, Colombia; Maseno University, Kenya; Institute for Development Studies, University of Sussex, UK; University of Maine, USA; University of Florida, USA. CGIAR Centers, CPs and SWPs: ICRAF, ILRI, IFPRI, IITA, CIP, Harvest Plus Challenge Program, Challenge Program on Water and Food; Systemwide Program on Collective Action and Property Rights (CAPRi), Systemwide Program on Participatory

2
Research and Gender Analysis (PRGA), Standing Panel on Impact Assessment (SPIA); Consorcio para el Desarollo Sostenible de los Andes (CONDESAN). NGOs: World Wildlife Fund-Colombia; Semillas de Agua, Colombia, Fundacion Humedales; Sustainable Aid in Africa (SANA), Kenya. Explanation of any Project changes (with respect to previous MTPs) The project name has been changed from �Impact Assessment� to �Impact and Policy Analysis for Institutional Innovation.� The change reflects an evolution in project strategy towards combining international public goods-oriented research with methods and capacity development to contribute to processes of learning and change within institutions. In addition, the new name and slightly re-phrased outputs more clearly locate the project within the research agenda defined in the new Science Council priorities, specifically Priority #5.

3
CIAT: BP-1 Project Log Frame (2005-2007)
Narrative Summary Measurable Indicators (milestones)
Means of Verification Important Assumptions
Goal To enhance performance of decision making about resource allocation in the agricultural research and development sectors.
Performance of investment in tropical agricultural research improved.
Research project portfolios in tropical agricultural research.
Purpose To improve the capacity of CIAT and partner organizations to allocate research resources efficiently by generating and disseminating appropriate information and tools.
Results of impact analysis used in decision-making and priority setting. Research resources allocated more efficiently (expected rate of return to CIAT research portfolios increased).
Scientific publications from BP-1 and other projects. Published planning documents of CIAT and partner organizations. Published minutes of planning meetings in CIAT (BOT, MT, Project Managers) and partner organizations. External reviews of CIAT. Data on use of tools developed at CIAT.
Adequate funding to agricultural research and extension. Decision makers willing to use economic analysis in research priority setting.
4
Narrative Summary Measurable Indicators (milestones)
Means of Verification Important Assumptions
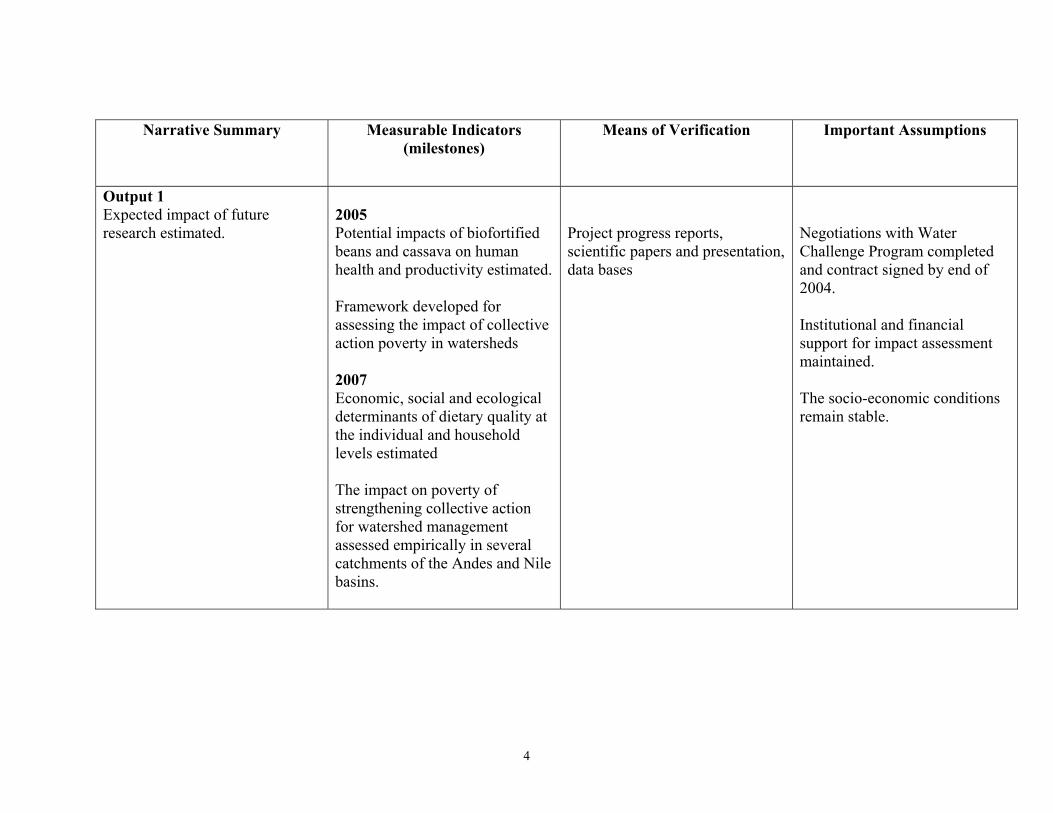
Output 1 Expected impact of future research estimated.
2005 Potential impacts of biofortified beans and cassava on human health and productivity estimated. Framework developed for assessing the impact of collective action poverty in watersheds 2007 Economic, social and ecological determinants of dietary quality at the individual and household levels estimated The impact on poverty of strengthening collective action for watershed management assessed empirically in several catchments of the Andes and Nile basins.
Project progress reports, scientific papers and presentation, data bases
Negotiations with Water Challenge Program completed and contract signed by end of 2004. Institutional and financial support for impact assessment maintained. The socio-economic conditions remain stable.

5
Narrative Summary Measurable Indicators (milestones)
Means of Verification Important Assumptions
Output 2 Impact of selected past CIAT research documented.
2005 The economic and institutional impact of cassava systems research in Asia documented.
Reports, scientific papers and publications
Institutional and financial support for impact assessment maintained.
Output 3 Tools developed to assess the impact of research, both ex ante and ex post.
2005 Data base on consumption of beans and cassava set by target populations for Harvest Plus 2006 Methodology developed to assess the equity impacts of different methods of PM&E developed by CIAT projects and partners Ongoing Maintenance and updating of impact assessment databases and information systems
Papers and publications, BP1 web site
Institutional and financial support for impact assessment maintained.
Output 4 Institutional capacity for estimating, monitoring, and evaluating research impacts improved.
2005 Presentation in CIAT on impact assessment conceptual framework
Copies of reports, papers and presentations made within and outside of CIAT.
Sufficient institutional and financial support for impact assessment is maintained.

6
Narrative Summary Measurable Indicators
(milestones) Means of Verification Important Assumptions
Finalize results of organizational culture diagnosis and its implications for center effectiveness 2006 Establishment of working paper series on social science, with special emphasis on IA/M&E Ongoing Support other CIAT projects in impact assessment, e.g. for 2005 Rural Innovation, IPRA, Africa Beans Technical support for users of past IA tools (e.g. Modexc)
Actions plans and progress reports based on the results of the organizational culture diagnosis Participation of BP1 staff in supporting role in impact assessments and evaluations carried out by other projects. Working paper series, in electronic and paper form
Willingness of CIAT staff and partners to use efficiency criteria when making research investments

7
EXECUTIVE SUMMARY AND RESEARCH HIGHLIGHTS BP1 is a cross-cutting project that works with all of CIAT�s research for development challenges (RDCs). With the Sharing the benefits of agrobiodiversity RDC, we participated in ex ante and ex post impact studies of improved crop varieties-especially beans, cassava and forages-in Asia, Africa and LAC. In the case of HarvestPlus, we looked not only at productivity impact, but also at nutritional and health impacts, and at the economic, cultural and policy factors that can enhance or inhibit impact in different countries. We are also working on better understanding the benefits and costs of GMOs in developing countries, looking at the economics of GMOs research, the benefits and costs from a policy perspective, and issues of consumer acceptance. In support of the Improving management of agro-ecosystems in the tropics (IMAT) RDC, BP1 contributed to several ex ante and ex post studies of the impact of plot-level soil management technologies and practices in Vietnam, Thailand and Colombia. At higher scales, the potential of compensation for environmental services mechanisms to contribute to resource conservation and poverty reduction is a topic of growing importance in BP1. An empirical model was developed this year for jointly estimating the profitability of agricultural and environmental service production, with an empirical application to carbon sequestration in the Colombian llanos. As part of joint work with the Challenge Program on Water and Food (CPWF), conceptual and empirical work was conducted on the potential impacts of cross-scale watershed management on poverty. The ex post study of the impact of cassava systems research in Asia, conducted jointly with researchers from the Rural Innovation RDC, looked specifically at the impact of user participation. The analysis of the beef industry in Central America uses the supply chain approach promoted by the RI�s agroenterprise project. Impact assessment and evaluation are important research areas within RI, especially the development of participatory and learning-oriented methods, and BP1 collaborates with methodological support on an ongoing basis. Specific research highlights from 2005 include * A study of the impact of a participatory research project on improving the sustainability of cassava systems in the uplands of SE Asia showed high adoption of and returns to improved cassava varieties. Adoption of soil conservation practices was lower but still significant, and in some cases it contributed to yield increases and expansion of cassava area. The relationship with area expansion suggests that the conservation practices are allowing farmers to cultivate steeper, more erosive land in a sustainable way. Perhaps the most significant finding of the study was that farmer participation had a large impact on yield that was independent of its impact via higher levels of technology adoption. Farmers who participated in the trials had higher yields, not only because they were more likely to have adopted the new technologies, but because they appear to have increased
8
their human capital though participation in a way that allowed them to manage their farms better . * A farm level model for analyzing joint production of agricultural products and environmental services was developed and tested for the case of agrosilvopastoral systems in the Colombian Llanos. The results indicate that the incorporation of forestry for both forest products and carbon sequestration is an economically viable option, however its success depends in large part on capital intensity of the operation. Disaggregating the results by initial capital investments shows that, under current conditions, environmental services will only be a viable option for larger, richer farmers. Policies such as the CIF (certificado incentivo forestal) that subsidize establishment and maintenance of forests, or the pre-payment of carbon credits would make environmental service options more pro-poor. * Estimates of the potential benefits of biofortified beans in Central America and cassava in Brazil were finalized and compared with those of other biofortified crops. Even under pessimistic assumptions beans and cassava generate positive returns, however compared to the results of crops such as rice or wheat, in populous countries such as India, they are less attractive from an economic point of view. These results suggest that the crop strategies, especially target countries, should be reevaluated.
9
OUTPUT 1: EXPECTED IMPACT OF FUTURE RESEACH 1.1 Ex Ante Assessment of the Impact of Biofortified Beans and Cassava Using the Disability Adjusted Life Years (DALYs) Framework
By: Nancy L. Johnson 1.1.1 Objective Estimate the potential impact of the biofortification of beans and cassava in key target countries, and use the information to improve the design and targeting of the breeding and dissemination components of the HarvestPlus Challenge Program. 1.1.2 Methodology The methodology used for this analysis is the disability adjusted life years (DALYs) framework that is now commonly used to evaluate health interventions. The advantage of the DALYs approach is that it captures mortality and morbidity (illness and/or disability) in a single index. Further information on the DALYs model and how it was estimated can be found in Section 3.3 of this report. To measure the economic impact of biofortified staple crops on public health, we first estimate the number of DALYs currently being lost each year as a consequence of micronutrient deficiency (Stein et al). We then estimate the number of DALYs that would be lost under a hypothetical scenario in which people consume biofortified crops. The difference between the two estimates are the DALYs saved annually due to biofortification. Calculating DALYs under the status quo requires data on deficiency levels for specific target groups as well as their respective prevalence rates for functional outcomes of deficiency. Developing a hypothetical scenario where people consume biofortified crops requires additional information such as current levels of consumption of the target crop (by target group), current and increased levels of micronutrients in the crop, processing losses, and expected adoption levels. 1.1.3 Current Situation and progress made in 2005 Preliminary estimates were obtained in 2004 and reported in the Annual Report for that year. In 2005, those estimates were reviewed and revised and the final results are presented here. 1.1.4 Goals for 2006 Publish the results as a HarvestPlus working paper and a journal article, togther with the results for other HarvestPlus crops.

10
1.1.5 Outputs Meenakshi, J.V. et al. (2006). "Analysing the Cost Effectiveness of Biofortification: A Synthesis of the Evidence." HarvestPlus technical report (draft). 1.1.6 Collaborators CIAT Steve Beebe - IP1 Hernan Ceballos - IP3 Partner organizations HarvestPlus Challenge Program 1.1.7 References Stein, A et al. (2004). Analyzing health benefits of biofortified staple crops by means of a DALYs approach�a handbook focusing on iron, zinc and vitamin A. HarvestPlus Technical Monograph 4, HarvestPlus, Washington DC and Cali, 2005.
11
1.2 The Potential Impact of HarvestPlus in Cassava based Systems in NE Brazil: Results of a Qualitative Survey
By: Carolina González1, Ilma Kruze2, Leopoldina Sequeira2, Chigeru Fukuda3, Rejane Olivera4 and Nancy Johnson1
1.2.1 Objetives To complement the quantitative analysis described in the previous sections, the HarvestPlus impact and policy component also includes a series of qualitative studies to be carried out in potential target regions. In 2004, such a study was undertaken for the maiz-bean system in Chiapas, Mexico, and in 2005, a qualitative study was carried out for cassava in NE Brazil. The qualitative studies are designed to characterize the food systems of target populations and answer the question �What would it take for HarvestPlus to have an impact here?� By �food system� we mean the interaction of production and consumption systems and their implications for nutrition and health outcomes. For each of these components, the specific objectives were defined as: Production: Identify conditions and practices that would support or constrain adoption of biofortified staple crops; and describe agronomic traits/economic characteristics valued by farmers. Consumption: Describe consumption patterns of target groups, especially complementary foods for infants; identify sources of food and acquisition patterns; obtain information on dietary quality and perceptions about �healthy� food; identify food preparation methods for the principal dishes; and attempt to identify characteristics of the diet that distinguish those who are nutritionally at risk. Nutrition and Health: Identify perceptions of ill-health and under-nutrition and the role of food intake and sanitation in ensuring healthy outcomes (with a focus on women and children). The findings from the qualitative surveys will inform the design of the quantitative dietary survey. This survey will provide data for analyzing the determinants of demand for dietary quality, and will also serve as a baseline against which future impact will be measured. In addition to their use in the impact studies, the qualitative and quantitative surveys will also be important for confirming the target breeding levels and designing both the human nutrition studies and the reaching end user component of HarvestPlus.
1 Economist, Impact and Policy Analysis Project, CIAT/HarvestPlus 2 Nutritionist, University of Pernambuco 3 Cassava breeder, EMBRAPA 4 Nutritionist, CIMICRON, University of Paraiba
12
1.2.2 Methodology Data were collected via questionnaire modules developed jointly among all HarvestPlus economists working on different crop economists. As in the case of the maize bean qualitative study, conducted in México in 2004, the number of modules was reduced and the questions were phrased in a more general and open-ended way to facilitate dialogue. The included modules were:
1. Production characteristic 2. Food consumption and health 3. Food preparation
Due to the preferences of the EMBRAPA breeders, the essentials of Module 1 were obtained from individual interviews conducted with representative producers of selected communities. For Module 2, the information was obtained through focus group discussions with women rural farmers using informal but structured interviews. The detailed information on how cassava and beans are used in food preparation was gathered via informal, in depth interviews with a small number of women. Site selection Table 1. Selected places
Municipalities Rural communities5 Juárez Tavora Sao Marcos
Caixeiro Independencia Viracao
Sao Miguel Taipu Amarela II
5 In each municipality one focal group was carried out in which representative people of different rural communities participated.
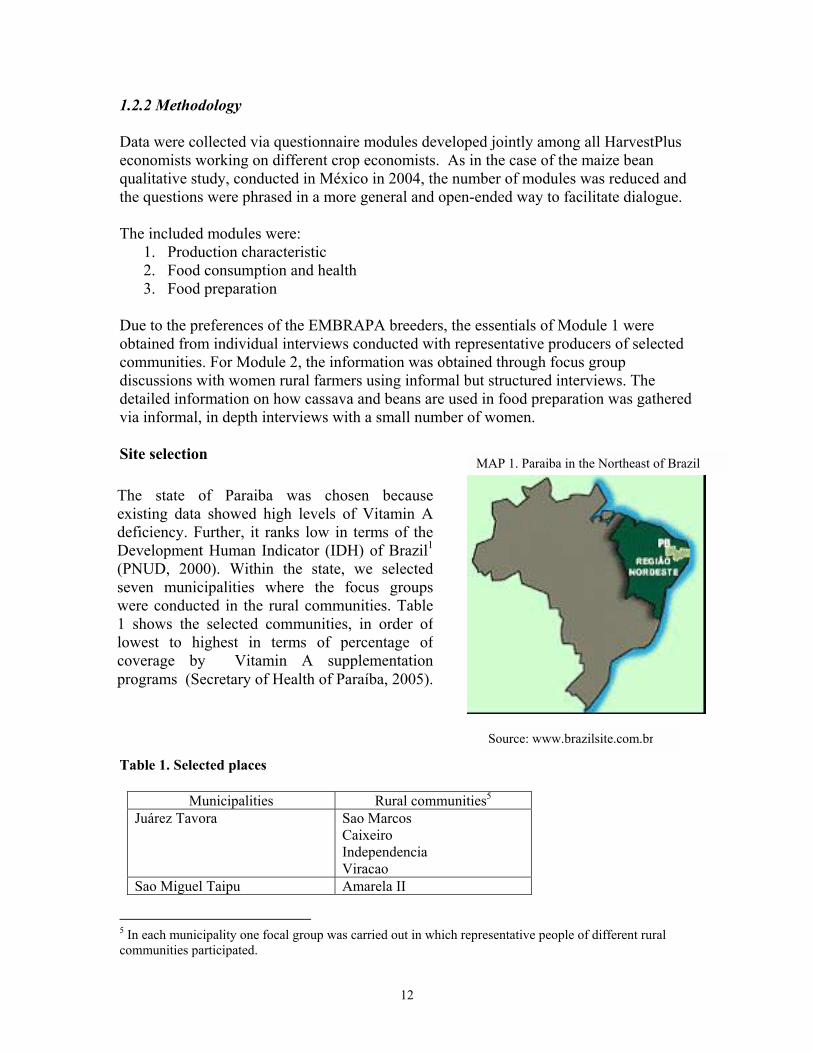
The state of Paraiba was chosen becauseexisting data showed high levels of Vitamin Adeficiency. Further, it ranks low in terms of theDevelopment Human Indicator (IDH) of Brazil1
(PNUD, 2000). Within the state, we selectedseven municipalities where the focus groupswere conducted in the rural communities. Table1 shows the selected communities, in order oflowest to highest in terms of percentage ofcoverage by Vitamin A supplementationprograms (Secretary of Health of Paraíba, 2005).
Source: www.brazilsite.com.br
MAP 1. Paraiba in the Northeast of Brazil
13
Agua Branca Novo Itapú
Mari - Taumatá Pitinbú - Passa (Agrovila) Sao José dos Ramos - Lagoa de Pedra
- Fazenda Sao Jose Caldas Brandao - Jatobá
- Mata Fresca - Tanque
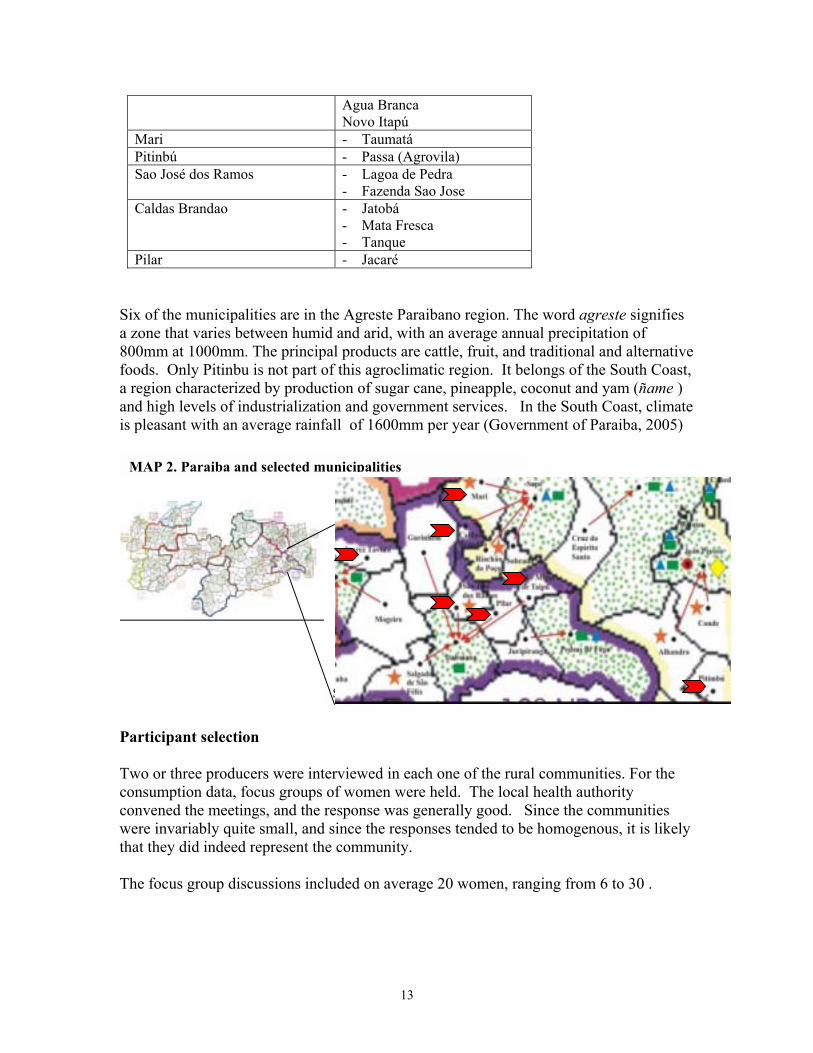
Pilar - Jacaré Six of the municipalities are in the Agreste Paraibano region. The word agreste signifies a zone that varies between humid and arid, with an average annual precipitation of 800mm at 1000mm. The principal products are cattle, fruit, and traditional and alternative foods. Only Pitinbu is not part of this agroclimatic region. It belongs of the South Coast, a region characterized by production of sugar cane, pineapple, coconut and yam (ñame ) and high levels of industrialization and government services. In the South Coast, climate is pleasant with an average rainfall of 1600mm per year (Government of Paraiba, 2005) Participant selection Two or three producers were interviewed in each one of the rural communities. For the consumption data, focus groups of women were held. The local health authority convened the meetings, and the response was generally good. Since the communities were invariably quite small, and since the responses tended to be homogenous, it is likely that they did indeed represent the community. The focus group discussions included on average 20 women, ranging from 6 to 30 .
Souce: Paraiba Goverment
MAP 2. Paraiba and selected municipalities

14
Findings There are two different types of cassava grown and consumed in NE Brazil. One is the sweet cassava, called macaxeira or aipim that is eaten fresh. The other is bitter cassava, known as mandioca, which is used for farinha production. Production Cassava � Mandioca This area has a high mandioca production6, which is used for farinha and goma (cassava starch) elaboration. These products can be used for human consumptions and animal food. There are not many different varieties; usually farmers largely grew traditional mandioca, the most popular being passarinha, rosinha, toninha, engana ladrao (white pulpa), zombi, pitangué, and bojarra. The only exception to this is the one community where EMBRAPA has some experiments, and as a result other varieties have been introduced such as alagoa, mandioca rainha, olho verde, and casca de peba. Generally, the selected communities do not have government financial or technical support for agriculture and producers are not organized formally. These circumstances in addition to lack of resources and availability of lands7, result in low yields, eg 10 tons/ha. In many occasions it is more profitable to work outside the community or to receive government subsidies than to plant mandioca. Much of mandioca production is sold to the farinha factories. Only a few mandioca producing households make their own farinha. Most feel it is not worth the effort and prefer to sell the mandioca and later buy farinha from the factories or in the market feira.
6 Only one within 7 select communities does not producer mandioca or macaxeira only beans. The reason for this seems to be that few rains caused the abandoned of these crops. 7 Field sizes planted to mandioca were approximately 2 � 5 ha per family.
Picture 1. Farinha�s producer Picture 2. Farinha factory

15
Desirable mandioca varietal characteristics. For the producers it is very important to obtain white and fine farinha with high starch (goma)8, so that they can prepare dishes such as tapioca, beijú, and mingau (See table 2 for description). They believe that white roots are easier to peel because the skin is softer. If exposed to too much heat in processing, farinha can take on a yellow color and sour flavor that is considered undesirable. The implications for the breeding of biofortified mandioca are: ! The lack of technical assistance, and low adoption of new varieties and other
technological innovations could present a challenge to dissemination of HarvestPlus varieties. According to breeders the problem of low adoption lies in lack of dissemination rather than unwillingness to adopt.
! Different varieties of mandioca are sown simultaneously, which is a problem because each variety has a different time of germination.
! If the project biofortifies mandioca varieties and they have yellow color, effort will be required to change people perceptions linking color and bad flavor.
Cassava - Macaxeira (aipim) Unlike mandioca, macaxeira is primarily for home consumption, but can in some cases can be used to make farinha o goma, usually when it is of low quality or no longer fresh. As with mandioca, farmers plant traditional varieties, such as boinha, roxa, pé de pombo and nao tem. Macaxeira is sown once per year and after six or eight month they harvest it. The production lasts approximately 6 months, usually between June and December. Desirable mandioca varietal characteristics. It is important that macaxeira be soft, without fibers and easy to cook. In some communities the color is not very important. People know the yellow varieties, but they do not plant for lack of planting materials. For communities, the yellow color is related with a different flavor, not very pleasant. The implications for the breeding of biofortified macaxeira be: ! Macaxeira is only sowed once a year and the harvest lasts only half the year, which
means that at present people don�t generally eat it year round.
8 The people know that is good farinha when they touch with their hands, and these stay white.
Picture 3. Macaxeria
16
! Careful attention must be paid to the relationship between color and other important characteristics such as taste.
Food Acquisition and Consumption Where do people get their mandioca and macaxeira? Women generally make decisions about food acquisition, however the money for these purchases comes from both men and women. Many women work outside the home, often in government jobs. Income from government programs and pensions are also common. The women�s responses are generally consistent with what the men said. In general people produce their own macaxeira. Only in one community did people report purchasing it. As mentioned earlier, farinha is generally purchased. The majority of women interviewed didn�t know where mandioca in the farinha they purchased actually came from, but they mentioned a few regions such as També e Feira Nova (Pernambuco) and Mari that are know to be major suppliers. Macaxeira is only consumed in the harvest period since people are not in the habit of purchasing it. This may be different in urban areas, where people purchase macaxeira year round. This could explain the unexpected observation in the LSMS consumption data that showed higher total cassava consumption among urban and wealthier households than poor, rural households (LSMS data). In the case of beans, households on average purchase beans during half the year and consume their own production (cowpea) during the other half. The purchased varieties are carioquinha and mulatinho, which has a lower price and a higher cooking yield. Some implications for these findings are: ! A high level of home consumption means that the project can simultaneously target farmers and consumers. ! Consumption preferences favor white varieties and effort will be required to convince consumers to accept yellow. In the case of mandioca, for example, white color is preferred and yellow farinha is associated with poor processing resulting in an acidic flavor. How are mandioca, macaxiera and bean stored, prepared and consumed? Storage. Macaxiera can�t be stored. Once it is harvested it must be consumed within 2 or 3 days. In the case of people who produce their own farinha, they do this 2-3 times a year and store the product in bags of 50 kgs that are place inside plastic or zinc drums that hold up to 3 bags. This production can last all year long, depending on household size.

17
Consumption. The principle dishes and beverages produced with cassava and beans are similar in all communities. The main ingredients, methods of preparation and when they are eaten are summarized in Table 2. Table 2. Main dishes prepared with mandioca, macaxeira and beans, in perceived order of importance Preparation When eaten Mandioca � farinha 1. Farinha Sub product of mandioca
prepared by: washing, peeling, cooking, spinning (centrifuging), toasting, cooling and conditioning.
At breakfast, lunch and dinner, either alone or as a part of other dishes.
2. Goma Sub product of mandioca, made by a process similar to farinha but is dried by the sun rather than by toasting. It is used to make tapioca, beiju and bolo (see below)
1.1. Cuscuz (farinha) Corn flour mixed with farinha, coconut, water and salt.
Breakfast and dinner
2.1 Tapioca (goma) Goma cooked with grated coconut
Morning and afternoon snacks
2.2 Beiju (goma) Cooked goma. Morning snacks 2.3 Bolo (goma) Dough baked in the oven. Breakfast and dinner Macaxeira 1. Boiled, but can also be cooked, friend or grilled.
Peeled and salt Morning and evening
Beans Boiled � Carioquinha Cooked with oil or margarine,
with water, tomato, carrot, vegetables and sometimes charque meat (salted meat). Can be served with rice.
Lunch
Average family size is 6, 2 adults and 4 children. Per capita daily consumption is about 95 grams of farinha, 120 grams of beans, and 200 grams of macaxeira (during the 6 months when it is available. Beans and farinha are basically eaten ever day, however macaxeira can be replaced by sweet potato or yam (ñame). What is the meal pattern There was little variation among communities in the meal pattern (Table 3).

18
Table 3. General pattern of meals and snacks by time of day 6-8 AM Cuscuz with coffee, milk, eggs, cuarenta (corn
dough mixed with water), bread, crackers, macaxeira (when available), fish (from rivers, Tilapia/ Traira))
11:00 �12:30 AM Beans with farinha, rice, macaroni, fava, occasionally salad with tomato, cabbage, onion and alfalfa. A few times week meat-charque, pork, chicken or fish. Fresh or packaged juice.
3 - 4PM (children) Fruit (babana, acerola, papaya, guava), milk, crackers, jaggery (panela).
Dinner (cena), after 6 PM Coffee, cuscuz, macaxeira (when available), sweet potato and yam (ñame) (occassionally), crackers, bread.
People consume fruit they produce themselves, though they say they have little space to produce and therefore consume little fruit. Few purchase fruit because of its high cost. The most common fruits are mango, papaya, guava, graviola and acerola. People prefer to eat them fresh, but they occasionally make juices. There is high consumption of artificial juices. Few vegetables are consumed, mainly tomato, pepper, cilantro, onion, alfalfa and chuchu. When she is present, the wife distributes the food among family members. When she isn�t home, food is left prepared for people to serve themselves. Most families eat together, except when men are in the field in which case lunch is taken to them. Children are served first and then adults. In half the communities, they said that everyone received the same quality of food but that children received smaller quantities. In the other half, men were said to receive better food since they had to do heavy work. Children are given the same foods as the adults in the sense that no additional foods are prepare for them. About half of the communities had school lunch programs. The menu consists of bean soup, �soy meat�, rice, tinned meat, Nescal milk (powdered), charque meat, artificial juices, cookies and bread. When there is no school lunch, kids have cuscus and milk in the house and take fruit or money (used for junk food) to school with them. Some implications for these findings are: ! High consumption of all three products during at significant part of the year. ! Low storage losses. ! Low processing losses in macaxeira and bean, but potentially high losses associated
with converting mandioca to farinha or goma. ! Low consumption of fruits and vegetables, which could act as promoters of iron
absorption.
19
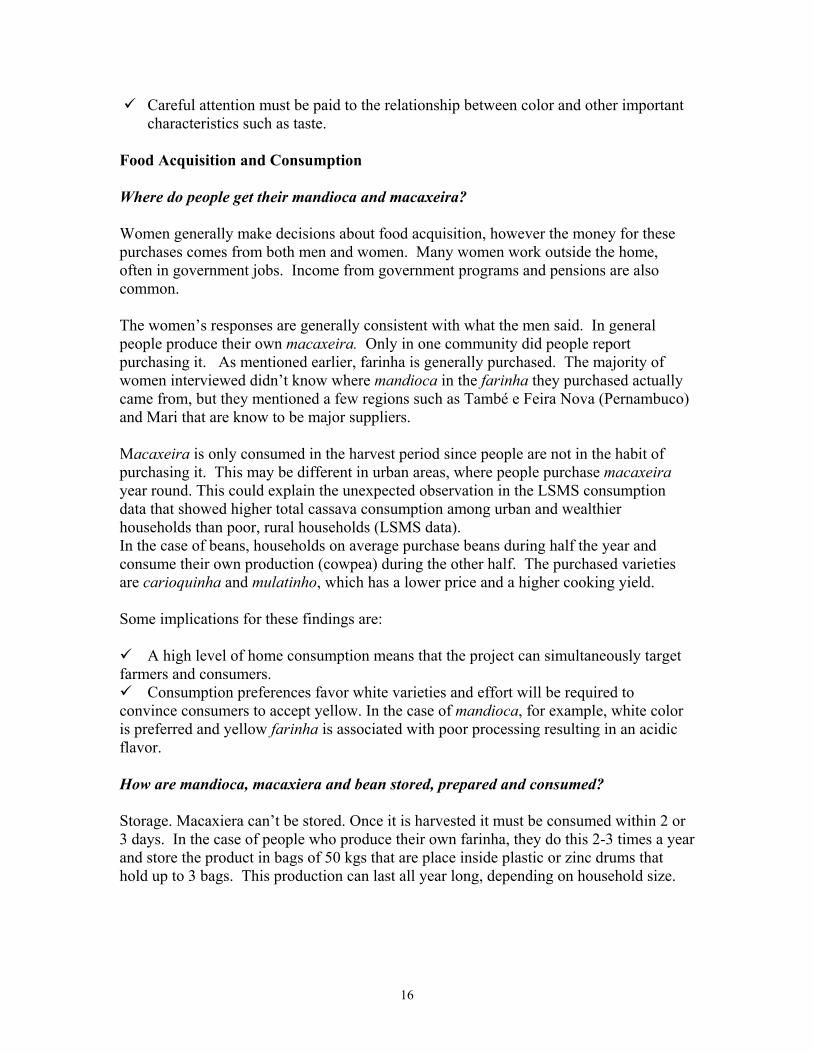
Many people mentioned the importance of breast milk, but the benefits of colostrums were unknown and some even referred to it as �dirty water.� In some communities children were exclusively breastfed for 6 months, in other only for 2-3 after which they were given complementary foods such as mingau, a thick beverage made with milk and corn starch, rice starch or farinha. The first foods given to children are bean broth, rice, juices (especially orange, acerola and caju), preserves (papillas) of fruit such as banana, mango or apple, vegetable soup (carrot, beterraba and jerimun). After a year they begin to eat the same diet as adults.
In terms of mixtures, fruit salads can be eaten but certain combinations of foods should be avoided, for example pineapple and then jaca. Eggs should not be mixed with milk or with sweetpotato, mango or charque meat. A child with diarrhea is given a slightly changed diet including tea (guava, capim santo), a homemade dehydration remedy (boil water with sugar and salt), and coconut water. Foods such as beans and milk and in one community macaxeria are not consumed.
Picture 6. Focus group in Sao Miguel de TaipuPicture 5. Focus group in Joarez Tavora
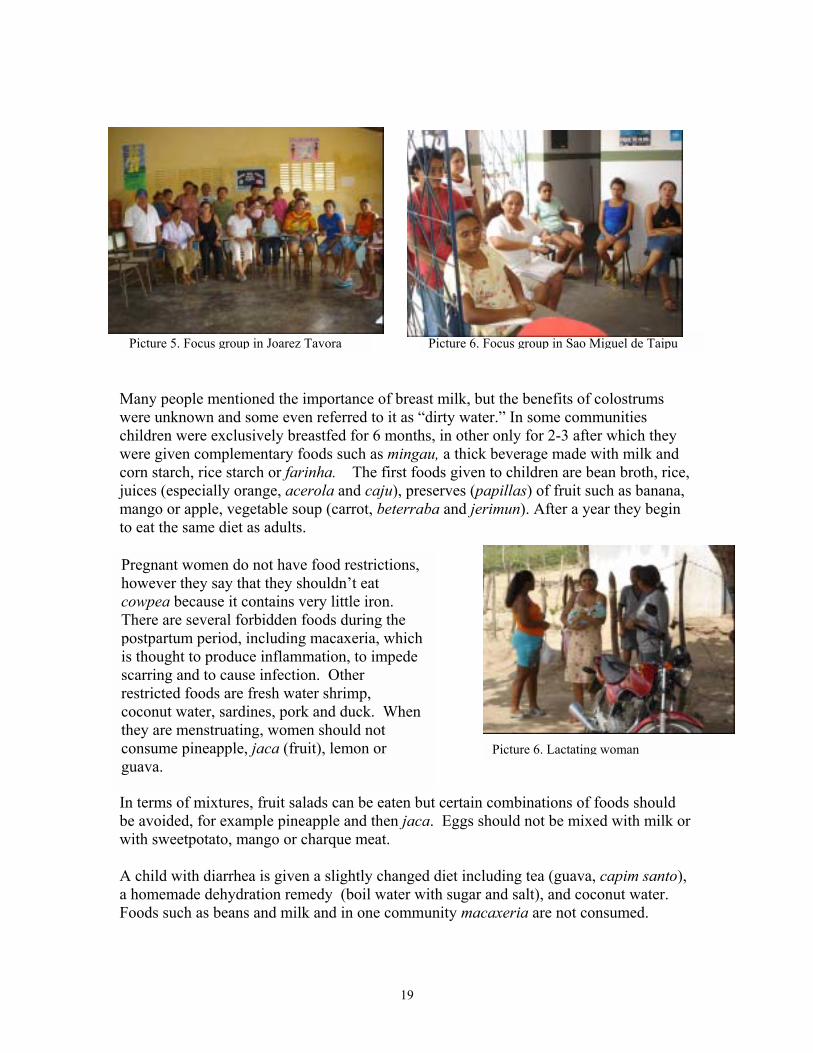
Pregnant women do not have food restrictions, however they say that they shouldn�t eat cowpea because it contains very little iron. There are several forbidden foods during the postpartum period, including macaxeria, which is thought to produce inflammation, to impede scarring and to cause infection. Other restricted foods are fresh water shrimp, coconut water, sardines, pork and duck. When they are menstruating, women should not consume pineapple, jaca (fruit), lemon or guava.
Picture 6. Lactating woman
20
White rice and meat are thought to be good for diarrhea. Sometimes people purchase medicines without gong to the doctor, for example Imosec. Some implications for these findings are: ! Many women do not breastfeed for 6 months. Farinha is a major component of an
important complementary food, el mingau. ! The fact that women post partum do not eat macaxeira means the biofortification of
this product would miss this important target population,. Further, children under one year also eat little macaxeira because it is though to be too heavy.
! Women believe that beans can be strong and prevent anemia, an attitude that would support acceptance of biofortified beans.
What do people perceive as healthy food? In rural areas, farinha is perceived as an important food to combat hunger and people do not worry about whether or not it is nutritious or healthy. In the case of macaxeira, although it is a preferred food people do consider it to be unhealthy in the sense that it is fattening and �offends� the body. This may explain why vulnerable populations such as postpartum women and children less than 1 year do not eat it. In the case of beans, the cowpea is considered to be less healthy than common bean. People understand that there is a relationship between consumption of certain foods and illness, for example salt with high blood pressure or sugar with diabetes. In 40% of communities people associated consumption of carrots with good vision, though they also think it is important to pray to Santa Lucia, the saint of eyes. Health and nutrition Each municipal capital has a health center., supported by the local health agent. People perceive the service to be good, however there are problem with continuity in policies and programs. Personnel and activities depend on the current political administration at the state level. The most common illnesses are flu, fever, cough, diarrhea, high blood pressure, cancer and diabetes. Generally when people get sick they stay home for 2-3 days and are treated with home remedies. If their symptoms fail to respond, they are taken to the doctor. Vitamin A deficiency isn�t recognized in the communities, except in one where 3 cases of night blindness were described. No cases of measles were detected. Health programs are focused on vaccination periods, during which in addition to vaccinations the health centers distribute Vitamin A capsules and Ferrous Sulfate (Sulfato Ferroso.) Women do not have a clear understanding of what these capsules are for, though they do understand the purpose of the iron supplements. They don�t know how they are currently being distributed.
21
Lectures on health and nutrition are given in the health centers, however most people say that their principal source of health-related information is television. Several things they learned on TV such as washing hands before eating or adding bleach to water are widely practiced in the communities. All communities reported receiving benefits of government programs, currently grouped under the title �Bolsa Alimentacao� (Food basket) in which they receive a monthly subsidy for each child in school. Several older programs still exist: �Bolsa Escola�, �Vale gas� y PETE (Program for eradication of child labor). In three communities, the religious program �Pastoral de la Crianca� worked with mothers on alternative feeding (alimentacao alternativa). Some implications for these findings are: ! Government programs reach all communities, however access to micronutrient
supplementation programs is inconsistent. ! The state of Paraiba is highly politicized which means that access to many programs
(health, agriculture) depends on the current government. If H+ works in this state, care would have to be taken to avoid falling victim to these political cycles.
Conclusions and discussion Perhaps the major finding of this study was to better understand the production and consumption differences between macaxeira and mandioca and their implications for H+ breeding and dissemination strategies. While from a technical perspective it may be possible to continue working with both crops in things like betacarotene screening, from a varietal development and dissemination perspective, the two are very different and might require different strategies. Mandioca is more widely consumed throughout the year, especially by the target populations of H+, but the processing losses appear to be significant. Further, the fact that it is processed centrally means that options like industrial fortification might be more viable than in the case of home processed products. Macaxeira appears to be more widely consumed than we thought based on the LSMS data. However its consumption is seasonal and several of the key target populations of H+ face food taboos related to its consumption. EMBRAPA currently works on macaxeira. In either case, it seems that color preferences and food taboos will require that community nutrition interventions accompany the introduction of new varieties.

22
1.2.3 Goals for 2006 Incorporate findings into the broader ex ante analysis of the potential impacts of HarvestPlus crops, to be published as HarvestPlus working paper and journal article 1.2.4 Outputs Carolina González, Ilma Kruze, Leopoldina Sequeira, Chigeru Fukuda, Rejane Olivera and Nancy Johnson (2005). Findings of the Qualitative Survey on Cassava (Mandioca and Macaxeira) and Beans in Paraiba, Brazil , CIAT/HarvestPlus working document 1.2.5 Collaborators University of Pernambuco; EMBRAPA; Center for Studies of Micronutrients (CIMICRON) , University of Paraiba; HarvestPlus 1.2.6 References Programa das Nacioes Unidas para o Desenvolvimento � Brasil (PNUD). 2005. http://www.pnud.org.br/atlas/ Living Standards Measurement Surveys (LSMS) for Brazil (http://www.worldbank.org/lsms/) Paraiba Government. 2005. www.paraiba.pb.gov.br
Picture 8. Typical countryside of Paraiba
23
1.3 Assessing the Policy Environment in Key HarvestPlus Countries
By: Carolina Gonzalez and Nancy Johnson 1.3.1 Objective The success of HarvestPlus will depend not only on the quality of the varieties produced, but also on the policy environments the countries where they are released. Policies and programs in ministries such as agriculture, health and nutrition, environment, or planning can either help or hinder the implementation of HarvestPlus. Therefore the objective of this study was to identify which policies would be likely to affect HarvestPlus and use the information to guide the design of implementation of HarvestPlus dissemination strategies in key countries. 1.3.2 Methodology Review of official documents and websites; key informant interviews 1.3.3 Current Situation and progress in 2005 Inventories of relevant policies were complied for Brazil and Uganda 1.3.3.1 UGANDA To ensure right to food for all Ugandans the Government developed a policy agenda with the following plans and strategies:
• Uganda Food and Nutrition Strategy (UFNS) • Plan for modernization of Agriculture (PMA) • Poverty Eradication Plan (PEAP) • Health Sector Policy and Strategic Plan (HSSP) • Decentralization Policy • Children Statute • The Food and Drug
The first three plans are closely linked to HarvestPlus objectives, and are described briefly in the following section. The main ministries that have responsibility for issues related to HarvestPlus are then described. Government Programs Uganda Food and Nutritional Strategy (UFNS). http://www.pma.go.ug/pdfs/UFNSIP%20Final%202005.pdf. (UFNC, Ministry of Agriculture, Animal Industry and Fisheries and Ministry of Health)

24
The vision is a hunger-free country without malnutrition in all segments of the population. The principal objective of the strategy is to improve and assure nutrition security for all Ugandans. The Uganda Food and Nutrition Policy (UFNP) is the guide for action approved in July 2003. Additionally, UFNS is complement, in part, the PMA whose component does not directly address food and nutrition security. The Uganda Nutrition and Food Council (UNFC) coordinate the implementation of the strategies. Its functions are incorporated in the Uganda Food Nutritional Strategy (UFNS), which includes cross-sectoral coordination, policy advocacy, and monitoring and evaluation. The UFNP, identifies twelve Interventions Focus Areas that must be addressed by an astute set of strategies and investment action plans: Food supply and accessibility, Food processing and preservations, Food storage, marketing and distribution, External food trade, Food aid, Food standards and quality control, Nutrition, Health, Information, education and communication, Gender, food and nutrition, Food, nutrition and surveillance, Research The UFNS Strategy identified issues and activities for specific target groups that are also the harvestPlus beneficiary groups. Some activities are described below. For child in the womb, children 0 �2 years, and pregnancy and lactating women
- � Educate pregnant and lactating women on the components of a balanced diet and on how locally available foods can be used to build balanced diets � Providing education about the kinds of foods that can increase the intake and absorption of vitamins and minerals. �Provide effective therapeutic feeding for sick and malnourished children. � Addressing micronutrient deficiencies through direct interventions and food-based approaches. These include preventing and treating anemia among women and children through iron supplementation, reducing iodine deficiency through advocating the consistent use of iodized salt in the household, and preventing and treating vitamin A deficiency through facilitating incorporating vitamin A-rich foods into the diet of Ugandans and through supplementation. �Undertaking interventions to prevent diseases and reduce parasite loads-such as malaria, hookworm, guinea worm, bilharzias (schistosomiasis), and intestinal parasites�that reduce the body�s ability to absorb and retain nutrients consumed. � Preventing low birth weight through prenatal food and micronutrient supplementation. � Improving child growth by encouraging exclusive breast feeding for the first six months of life, the appropriate use of fortified complementary foods as the child grows, and control of diarrhea and acute respiratory diseases.

25
� Institute measures that will enable mothers to continue breast-feeding during early post partum period and at places of work. The provision of facilities for breastfeeding and care of infants at places of work and in the community is an element of this. � Make legislation and enforcement for regulation and marketing of breast milk substitutes and iodised salt. � Promote the use of local produce in manufacturing appropriate complementary foods. � Increase coverage of safe water sources and proper sanitation. � Increase coverage of and accessibility to family planning services. - For children (3 �12), person affected by conflict, HIV/AIDS suffers, people with disabilities. The UFNS While the sources of vulnerability for these groups include food and nutrition insecurity, typically a much broader set of vulnerabilities are also significant factors. Consequently, assisting and supporting these groups are the principal responsibility of several line ministries .The major role for the UFNS will be that of advocacy analysis and monitoring to ensure that appropriate action is taken to ensure the access of members of these vulnerable groups to food, health care, and other components needed to ensure their nutrition security. Plan for modernization of Agriculture (PMA). http://www.pma.go.ug/pmauploads/evaluation%20RPT%20annex%20A.pdf The mission of PMA is �eradicating poverty by transforming subsistence agriculture to commercial agriculture�. The successful implementation of the PMA will depend on the actions of a wide range of stakeholders. These include Central Government Ministries and Parastatals, Local Governments, the private sector, the civil society, educational and research institutions, and Development Partners. The implementation of the PMA will be guided by a Steering Committee (PMASC) which will have executive powers with respect to the planning and financing of PMA programmes. The PMA Steering Committee (PMA SC) will be composed of representatives of key stakeholders. However, because the number will be limited to less than 30 people, it was agreed that a wider representation in form of a PMA Forum be created to allow for broader participation of stakeholders in PMA matters. So PMA has chosen to concentrate its efforts in eight key areas, called PMA pillars, that are expected to make a real difference to the lives of ordinary Ugandans. The PMA vision for agricultural research is �a farmer responsive research system that generates and disseminates problem-solving, profitable and environmentally sound technologies on a sustainable basis�. The mission for research is �generation, adoption and dissemination of appropriate and demand-driven technologies, knowledge and information through effective, efficient, sustainable, decentralized and well coordinated agricultural research system.�

26
A realigned research strategy for the period 2003-2010 was published in 2004. This identifies five research themes: (i) Understanding people, their livelihood systems, demands and impact of innovations (ii) Enhancing the innovation process and partnerships (iii) Enhancing integrated management of natural resources (iv) Technological options which respond to demands and market opportunities (v) Enabling policies and linking producers to markets PMA Policy, regulatory and institutional reform agenda
Intended reform Actual progress to date Nature of and reasons for impediments
Food Security, Food and Nutrition Standards Policies. i. The existing food and nutrition policy, food law and the Uganda National Plan of Action of Nutrition (UNPAN) need to be revised. Government will develop a comprehensive food security policy including food policy and nutrition standards for implementation during PMA.
Cabinet approved the national food and nutrition policy (July 2003). However, a draft Food and Nutrition Bill has not been finalised and submitted to Cabinet (Prog rep Oct-Dec 04)
Draft Bill cannot be finalized until strategy has been agreed.
ii. Government will promote food security through interventions geared towards increasing household incomes by increasing agricultural production and productivity and farm use storage to reduce post-harvest losses.
1. PMA Food and Nutrition sub-Committee completed a draft National Food and Nutrition Strategy and Investment Plan (2004/05). The final draft report was approved by the PMA sub-committee on Food and Nutrition in Jan 2005. This was approved by the Food and Nutrition Council in April 2005 and circulated to the PMA SC, MAAIF and MoH for final approval before submission to the Cabinet.
Process prolonged by delayed stakeholder buy-in and need for considerable dialogue. FNSIP awaits Government approval and implementation The finalization of the Bill and the undertaking of the food reserve study await the finalization of the Strategy and Investment Plan
iii. Shortfalls in domestic production will be handled increasingly through market mechanisms.
TORs have been developed for a study of the justification for and nature of a food reserve system for Uganda.
Poverty Eradication Plan (PEAP). http://www.finance.go.ug/peap_revision/downloads/PEAP2004/PEAP%202005.pdf.
27
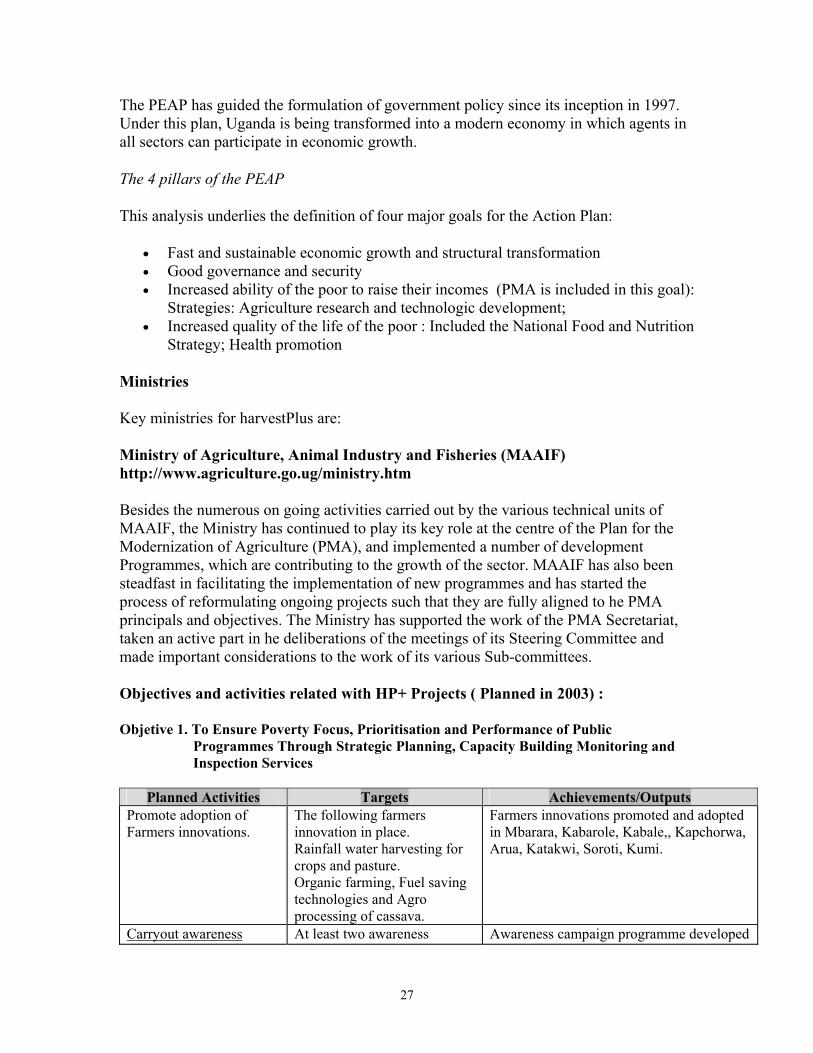
The PEAP has guided the formulation of government policy since its inception in 1997. Under this plan, Uganda is being transformed into a modern economy in which agents in all sectors can participate in economic growth.
The 4 pillars of the PEAP
This analysis underlies the definition of four major goals for the Action Plan:
• Fast and sustainable economic growth and structural transformation • Good governance and security • Increased ability of the poor to raise their incomes (PMA is included in this goal):
Strategies: Agriculture research and technologic development; • Increased quality of the life of the poor : Included the National Food and Nutrition
Strategy; Health promotion
Ministries Key ministries for harvestPlus are: Ministry of Agriculture, Animal Industry and Fisheries (MAAIF) http://www.agriculture.go.ug/ministry.htm Besides the numerous on going activities carried out by the various technical units of MAAIF, the Ministry has continued to play its key role at the centre of the Plan for the Modernization of Agriculture (PMA), and implemented a number of development Programmes, which are contributing to the growth of the sector. MAAIF has also been steadfast in facilitating the implementation of new programmes and has started the process of reformulating ongoing projects such that they are fully aligned to he PMA principals and objectives. The Ministry has supported the work of the PMA Secretariat, taken an active part in he deliberations of the meetings of its Steering Committee and made important considerations to the work of its various Sub-committees. Objectives and activities related with HP+ Projects ( Planned in 2003) : Objetive 1. To Ensure Poverty Focus, Prioritisation and Performance of Public
Programmes Through Strategic Planning, Capacity Building Monitoring and Inspection Services
Planned Activities Targets Achievements/Outputs Promote adoption of Farmers innovations.
The following farmers innovation in place. Rainfall water harvesting for crops and pasture. Organic farming, Fuel saving technologies and Agro processing of cassava.
Farmers innovations promoted and adopted in Mbarara, Kabarole, Kabale,, Kapchorwa, Arua, Katakwi, Soroti, Kumi.
Carryout awareness At least two awareness Awareness campaign programme developed

28
Planned Activities Targets Achievements/Outputs campaign for Food and Cash Crop production
campaign programmes carried out.
Promote and guide the production of nutritious crops and their proper utilization
Cover all the regions Staff trained in Central and Western regions.
Development of strategies and implementation plans for national early warning and food security.
Prepare plans for early warning monitoring and food security reporting.
Developed and submitted proposal for Food Insecurity and Vulnerability Information Mapping Systems (FIVIMS) for funding by FAO.
Production of status reports on early warning and food security.
Review early warning reports and conduct field assessments.
Post harvest assessment visits conducted in
all regions of the country.
Early warning reports and farmer�s messages on weather forecast disseminated. Study on cereals.
Objective 2. To Generate and Disseminate Problem � Solving, Profitable and Environmentally Sound Technologies on a Sustainable Basis
Planned Activities Targets Achievements/Outputs Adaptive and applied research to develop technologies in crops, livestock, fish and forests
At least 2 technologies / Varieties generated by each of the major NARO programmes.
Viable and marketable technologies developed include; Various vegetables and fruit; Maize,; Solanium potatoes varieties Millet and sorghum Oil seed crops; groundnuts; Cotton; Bananas; Kabana 1-5, Kisansa, Kibuzi Namaliga; Cassava; NASE 1-12 series. Sweet potatoes; high yielding varieties such as NASOPOT 1-6 and Wagabolige. Poultry; Fisheries Coffee; Beans; Bush type Climbing Pigeon peas;
Cooperation and coordination with other organisations involve in research and technology transfer
Identify research organisations for which cooperation is mutually beneficial Develop and sign MOUs with new organisations
MOU signed with ILRI for Decision Support to Trypanosomiasis Control in Uganda

29
b. Health Ministry http://www.health.go.ug/child_health.htm
- Management of Epidemics Measles epidemics occurred in the districts of Bundibugyo, Gulu, Lira and Kampala. The response included sub-national mass immunization days.
- Nutrition. The nutritional status of the population, particularly children and women is poor and a major health problem. To address the health sector perspective the following activities were undertaken;
• Guidelines for the management of severely malnourished children were developed and are being tested out in selected health facilities for further refinement.
• A review was conducted in Nutrition Education materials in schools for consideration in developing a strategy for school health activities
• The nutritional problems in the camps of internally displaced persons in the districts of Gulu, Kasese and Kitgum were assessed. A feeding programmed was initiated with special support from UNICEF and other partners.
• A review of nutrition plans was carried out in 22 districts of Apac, Bugiri, Busia, Gulu, Hoima, Jinja, Kamuli, Kapchorwa, Katakwi, Kiboga, Kotido, Kumi, Lira, Luwero, Masindi, Mbale, Moroto, Mpigi, Mukono, Nakasongola, Pallisa and Soroti.
• Information back-up documents in implementation of nutrition interventions in districts have included guidelines for planning, a guide for health workers, posters on Vitamin A deficiency, brochures on Iodine Deficiency Disorders and nutrition counselling guidelines.
- National Strategic Plan for the Prevention of Blindness in Uganda ( 5 Year Strategic Plan January 2000 � December 2004) http://www.health.go.ug/action_blindness.htm Vision 2020: The Right to Sight" is to raise awareness, mobilise resources and promote the development of national blindness prevention programmes with governments such that an additional 100 million people will be prevented from becoming blind by the year 2020. The mission of Vision 2020 is: to eliminate the main causes of blindness in order to give all persons of the world, particularly the millions of needlessly blind, the right to sight (IAPB News Newsletter 1999).
1.3.3.2 BRAZIL In Brazil, HarvestPlus related topics fall within the mandates of a range of ministries. Ministry of Agriculture, Livestock and Supply (Ministério da Agricultura, Pecuária e Abastecimento, MAPA) (http://www.agricultura.gov.br/) The 31 programs being developed by MAPA are described in the Multi-year Plan 2004-2007. The following programs and activities relevant to H+ are noteworthy:
30
- Agricultural Supply (MAPA - CONAB Compañía Nacional de Abastecimiento National Supply Company): Increase and maintain stocks of agricultural products for internal supply and food and nutritional security of the population. Relevant activities: Acquisition of products for commercialization (CONAB). In the case of this program line items are assigned in the budget. - Support for the development of the agriculture sector (MAPA - Executive Secretariat): Assists projects that improve competitivity and welfare at whatever stage in the production chain. It seeks to respond to the demands for socio-economic solutions such as: Value added, promotion of productive activities. Relevant activities: Support of development of the agricultural sector, agricultural mechanization. - Development of cropping of cereals, roots and other crop species (MAPA - Agricultural Policy Secretariat). Increase the productivity of cereals and forages through the control of pests and incorporation of new technologies. Relevant activities: a. Promote the use of improved genetic material in cereals, roots and other crop species. b. Technology transfer to develop cropping by cereals, roots and other crop species (rice, beans, cassava, maize, wheat and sorghum). c. Organization and training of extension agents for these crops. - Management and conservation of soils in agricultural lands (MAPA - Secretariat of Rural Support and Cooperatives): Safeguard the use and management of soil and promote recuperation of degraded areas with the objective of ensuring sustainability and quality of food and water for human and animal consumption. Relevant activities: Organization and training of extension agents in the use and management of natural resources. Risk Minimization in Agribusiness (MAPA -Secretariat of Agricultural Policy): - Minimize the risks of agricultural production caused by biological agents and climate. Relevant activities: Resources to cope with natural disasters, agricultural zoning (?) Agricultural and agro-industrial research and development for social insertion (MAPA-EMBRAPA): Construct a scientific and technological knowledge base of agricultural and agro-industrial activities of national or regional importance relevant to small-scale initiatives. Relevant activities: Research and development of integrated production systems applicable to small-scale production. Research and development for community sustainability. - Pro-environment (Ministry of the Environment): Promote integrated rural development through social interventions, participatory management, land-use planning, qualitative changes in land use and provision of environmental services. Relevant activities: Scientific evaluation and validation of innovative initiatives for rural production. Budget line items are assigned to this program. - Quality of agricultural goods and services (MAPA- Secretariat of Rural Support and Cooperatives): Safeguard agricultural production and productivity through guarantees of the quality of basic supplies available to farmers. Relevant activities: Oversight of
31
agricultural services, agrochemicals, fertilizers , etc., cultivar protection, oversight of seeds, vegetative planting material, genetic material. - Security and quality of food and drink: Assure the quality and safety of food and drink available to users. Relevant activities: Oversee activities with genetically modified organisms, quality control in the security and safety of products derived from plants. Budget line items are assigned to this program. Ministry of Social Development and Combating Hunger (Ministério do Desenvolvimento Social e Combate à Fome) The Ministry is responsible for the coordination of Program "Zero Hunger." In addition, the mission of MDS is to collaborate in and complement the following programs: 1) National Policy of Food and Nutritional Security 2) Income transfer programs of the Federal government: Family Grants, Food Card, School Grants, Gas Allowance and the Program to Eliminate Child Work. The objective is to guarantee the human right to food in the whole the national territory. The Ministry is responsible for promoting and spelling out the policy to introduce the program, combining the Federal, State and municipal governments with civil society to address issues of food production, feeding and nutrition in the country. A broad range of activities are contemplated within the program "Zero Hunger" including: 1) Incentive to family agriculture 2) Access to food 3) Program of social inclusion 4) Food and nutrition education. The first two of these programs has line item budgets assigned. EMBRAPA (http://www22.sede.embrapa.br/fomezero/). Activities of EMBRAPA in Program "Zero Hunger" are divided geographically. For the Semi-arid (North East, the most relevant projects are: - Support for the development of productive activities in family farms in the municipality of Piauí, in such a way that it serves as a point of reference. The activities that will be developed include technology transfer and participative research, amongst others. - Organization of networks of commercialisation of produce of family farms in Piauí - EMBRAPA Mid-North. The objective of this project is the organization of a marketing information system and support for the production and commercialization of produce from family farms integrated with the municipalities that comprise "Zero Hunger". - Improve the commercialization process as a strategy to combat poverty and hunger in the rural environment - (EMBRAPA Cassava and Fruits). Cassava production is important to rural populations in the Northeast and the process of commercialization is one of its principal roadblocks. The project seeks to develop activities to overcome this bottleneck.
32
- Training extension agents to respond to the demands for technical information for produce of family farms in the Program "Zero Hunger". - Use technology to combat want and poverty in Pernambuco � IPA. The project seeks to make available technologies in the areas of certified seed, legume inoculants, fish culture and artificial insemination of goats and sheep seeking to increase productivity and improve the performance of activities on family farms.
Indigenous communities: Food security and conservation of genetic resources in the Kraho community.
Rural Consolidation. Carried out jointly with the Ministry of Agricultural Development and Agrarian Reform. The objective is to mobilize depressed regions and realize the potential of their resources, although specific activities to achieve this objective do not yet exist.
Ministry of Health (Ministério da Saúde http://portal.saude.gov.br/saude/). Within the national policy of food and nutrition, there are various programmatic themes related directly to this project: -Stimulate intersectoral activities that promote universal access to foodstuffs. -Guarantee the security and quality of products and provision of services in the area of food supply. -Monitor the food supply and nutritional situation, bmeans of information systems. Budget line items approved for this activity. -Promote food supply practices and healthy lifestyles. The objectives are: implement obligatory labeling; encourage businesses at the point of sale to provide nutritional information of unprocessed products, encourage understanding of the population about natural products, create educational materials for distribution through the communication media. -Prevention and control of nutritional imbalances and diseases associated with feeding and nutrition: This programmatic theme in turn is made up of various programs�Food grants, microutrient supplementation, and development of protocols for treatment of severely malnourished children�the majority of which already have budget line items assigned.) Ministry of Agrarian Development (Ministério do Desenvolvimento Agrário): the objective is the creation of opportunities for the rural population. The programs basically focus on the provision of credit and agrarian reform.
33
Ministry of the Environment (Ministério do Meio Ambiente) http://www.mma.gov.br/). Legislation on the use of transgenic organisms. Works with the Ministry of Agrarian Development in some credit programs to strengthen family farming. Ministry of Science and Technology (Ministério da Ciência e Tecnologia http://www.mct.gov.br/). The program of science and technology for social inclusion has its objective to broaden local and regional capacity to generate and disseminate technology. Relevant activities: -Promote socio-economic development of mini and small rural and semirural undertakings through the generation, utilization, and dissemination of appropriate technologies. -Support research projects, studies and programs directed to the development of food security, support ethnographical studies of the cultures of food and understanding regional feeding habits in accordance with social reality and the rural and urban environments. The previous programs have budget assignments. Special policies for women (Especial de Políticas para as Mulheres). This Secretariat works in many programs, in conjunction with the respective Ministry. In the case that interests us, it shares activities with the Program "Zero Hunger" and with the Ministry of Health. Ministry of Planning, Budget and Management (Ministério do Planejamento, Orçamento e Gestão http://www.planejamento.gov.br/). List of programs that are developed and their budget lines (the budget line items already committed are highlighted) are specified in the projects described in this document http://www.planejamento.gov.br/orcamento/conteudo/orcamento_2005/orcamento_2005.htm# 1.3.4 Goals for 2006 Together with other HarvestPlus partners, conduct a comparative analysis of the information obtained for Uganda, Brazil and other key countries. 1.3.5 Collaborators HarvestPlus, CIP.

34
1.4 Consumer Attitudes Toward �Second Generation.� Genetically Modified (Gm) Foods in Developing Countries
By: Carolina González 1.4.1 Objectives According to the Cartagena protocol, the decision about whether or not a country should approve use of a genetically modified organizam (GMO) should depend on an assessment not only of the biological risks involved but also of the potential socio-economic benefits associated with its use. This implies that countries need the methods and capacity to make cost-benefits analyses of GMOs. The objective of this work, which is part of a broder effort in BP1 and CIAT. To support countries in the implementation of the Cartagena Protocol, is to look at issues of consumer acceptance of so-called Second Generation GMOs, which are GMOs whose benefits are oriented toward consumer characteristics such taste, texture, micro-nutrient content. These are different from the first generation GMOs of GMOs that offered benefits to producers in the form of eg herbicide tolerance or pest resistance but were, from the point of view of the consumer, exactly the same as non-GMO crops. There is a need to develop methods for assessing consumer attitudes to these second generation crops, as well as to look at how attitudes may vary by income level, for example between developed and developing countries. 1.4.2 Methodology Review of liteture on consumer acceptance of GMOs, especially in developing countries. 1.4.3 Current status and progress in 2005 A literature review was conducted and a proposal for empirical research was developed, This work will be conducted as part of a doctoral thesis at University of Hohenheim, Germany. Governments and civil society recognize that modern biotechnology has enormous potential, for human health as well as environmental and economic development. Genetically modified crops allow farmers to increase yields and reduce use of harmful agricultural chemicals. Nutritionally enhanced crops have the potential to reduce hidden hunger of micronutrient malnutrition. At the same time, however, there is global concern about the rapid progress of GM food development given the newness of the underlying science. Because much is unknown about how these products will affect humans and other species in the long term (CBD and UNEP, 2003). These scientific uncertainties, as well as political concerns about the motivations of those developing biotechnology, mainly multinationals, have influenced the attitudes of consumers toward Genetically Modified Organisms (GMOs) (Ministry for the Environment of New Zealand, 2003).

35
The ability of the new technologies depends critically on the willingness of consumer to accept the products. The vast majority of studies of consumer attitudes and acceptance of GMOs have been conducted in developed countries, where most controversy over GMOs originated, where results at the national level are decidedly mixed. Support for GMOs is much higher in the US than in Europe or Japan. Because they continue to struggle to achieve food security, developing countries may stand to benefit most from agricultural biotechnology. Even so, little is known about how developing country consumers would respond to GM foods. What the few studies that have been conducted in developing countries mainly show are low levels of awareness and understanding of issues related to GMO debate. Developing country consumers appear not to have been affected by the often-ideological debates about GMOs currently raging in developing countries, which could be considered positive. However the lack of awareness of the issues regarding GMOs also suggests that much work will need to be done in order for consumers to be able to make informed decisions about whether or not they want to consume GM products. A better understanding of the consumer attitudes towards GMOs in developing countries, especially among specific target populations such as the food insecure or the micro-nutrient deficient, is essential in order to be able to determine whether investments by agricultural biotechnology will actually generate benefits for these populations. Significant investments are being made in assessing the scientific possibilities of GMOs for developed countries, however without adequate legal and regulatory frameworks and without consumer demand for and confidence in the products, it will be difficult for these investments to have a significant impact on the welfare among the world�s poor. 1.4.4 Objectives, Questions and Hypothesis of Proposed Research The main objective of this thesis is to understand the factors that determine consumer attitudes towards GM food and to use that information to improve the design of research and development (R&D) strategies that rely on GM products. The main hypothesis is that consumers can weigh the benefits and costs of different aspects of a product, including whether or not it is GM, in order to make a decision about whether or not the product satisfies their needs. The implication of this hypothesis is that attitudes towards GMOs would be expected to vary significantly among different groups, and that achieving consumer acceptance requires targeting products and dissemination strategies to the appropriate consumer groups. The main research questions include: 1. What is the level of consumer acceptance of GM products in developing countries, disaggregated by target population? 2. What are the major factors that determine consumer acceptance? 3. What kinds of tradeoffs do consumers make between GM and other food attributes? 4. What are the implications of the findings for researchers, donors and policymakers?
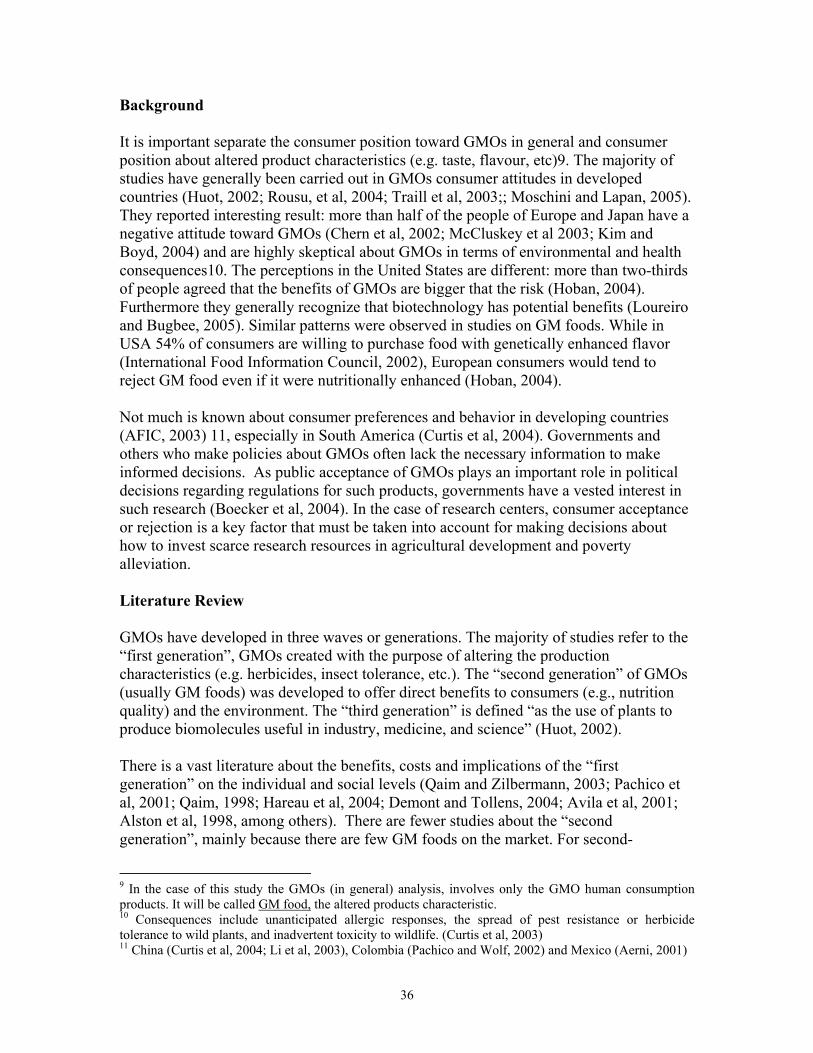
36
Background It is important separate the consumer position toward GMOs in general and consumer position about altered product characteristics (e.g. taste, flavour, etc)9. The majority of studies have generally been carried out in GMOs consumer attitudes in developed countries (Huot, 2002; Rousu, et al, 2004; Traill et al, 2003;; Moschini and Lapan, 2005). They reported interesting result: more than half of the people of Europe and Japan have a negative attitude toward GMOs (Chern et al, 2002; McCluskey et al 2003; Kim and Boyd, 2004) and are highly skeptical about GMOs in terms of environmental and health consequences10. The perceptions in the United States are different: more than two-thirds of people agreed that the benefits of GMOs are bigger that the risk (Hoban, 2004). Furthermore they generally recognize that biotechnology has potential benefits (Loureiro and Bugbee, 2005). Similar patterns were observed in studies on GM foods. While in USA 54% of consumers are willing to purchase food with genetically enhanced flavor (International Food Information Council, 2002), European consumers would tend to reject GM food even if it were nutritionally enhanced (Hoban, 2004). Not much is known about consumer preferences and behavior in developing countries (AFIC, 2003) 11, especially in South America (Curtis et al, 2004). Governments and others who make policies about GMOs often lack the necessary information to make informed decisions. As public acceptance of GMOs plays an important role in political decisions regarding regulations for such products, governments have a vested interest in such research (Boecker et al, 2004). In the case of research centers, consumer acceptance or rejection is a key factor that must be taken into account for making decisions about how to invest scarce research resources in agricultural development and poverty alleviation. Literature Review GMOs have developed in three waves or generations. The majority of studies refer to the �first generation�, GMOs created with the purpose of altering the production characteristics (e.g. herbicides, insect tolerance, etc.). The �second generation� of GMOs (usually GM foods) was developed to offer direct benefits to consumers (e.g., nutrition quality) and the environment. The �third generation� is defined �as the use of plants to produce biomolecules useful in industry, medicine, and science� (Huot, 2002). There is a vast literature about the benefits, costs and implications of the �first generation� on the individual and social levels (Qaim and Zilbermann, 2003; Pachico et al, 2001; Qaim, 1998; Hareau et al, 2004; Demont and Tollens, 2004; Avila et al, 2001; Alston et al, 1998, among others). There are fewer studies about the �second generation�, mainly because there are few GM foods on the market. For second-
9 In the case of this study the GMOs (in general) analysis, involves only the GMO human consumption products. It will be called GM food, the altered products characteristic. 10 Consequences include unanticipated allergic responses, the spread of pest resistance or herbicide tolerance to wild plants, and inadvertent toxicity to wildlife. (Curtis et al, 2003) 11 China (Curtis et al, 2004; Li et al, 2003), Colombia (Pachico and Wolf, 2002) and Mexico (Aerni, 2001)
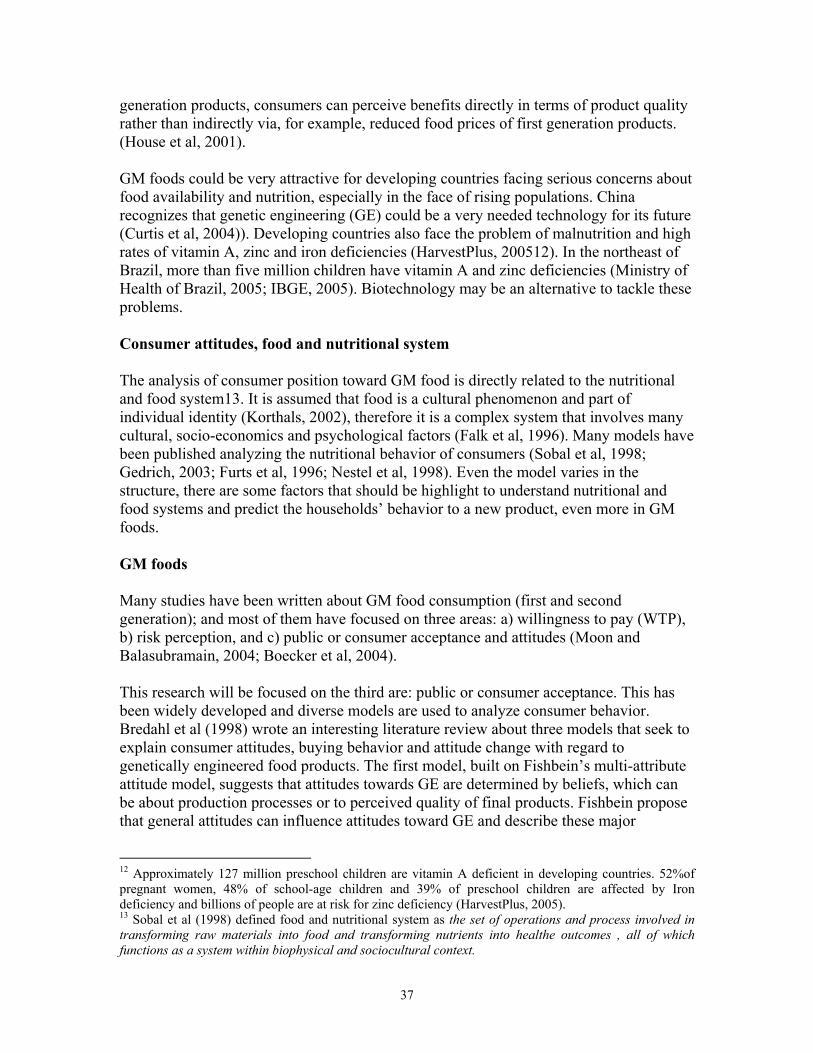
37
generation products, consumers can perceive benefits directly in terms of product quality rather than indirectly via, for example, reduced food prices of first generation products. (House et al, 2001). GM foods could be very attractive for developing countries facing serious concerns about food availability and nutrition, especially in the face of rising populations. China recognizes that genetic engineering (GE) could be a very needed technology for its future (Curtis et al, 2004)). Developing countries also face the problem of malnutrition and high rates of vitamin A, zinc and iron deficiencies (HarvestPlus, 200512). In the northeast of Brazil, more than five million children have vitamin A and zinc deficiencies (Ministry of Health of Brazil, 2005; IBGE, 2005). Biotechnology may be an alternative to tackle these problems. Consumer attitudes, food and nutritional system The analysis of consumer position toward GM food is directly related to the nutritional and food system13. It is assumed that food is a cultural phenomenon and part of individual identity (Korthals, 2002), therefore it is a complex system that involves many cultural, socio-economics and psychological factors (Falk et al, 1996). Many models have been published analyzing the nutritional behavior of consumers (Sobal et al, 1998; Gedrich, 2003; Furts et al, 1996; Nestel et al, 1998). Even the model varies in the structure, there are some factors that should be highlight to understand nutritional and food systems and predict the households� behavior to a new product, even more in GM foods. GM foods Many studies have been written about GM food consumption (first and second generation); and most of them have focused on three areas: a) willingness to pay (WTP), b) risk perception, and c) public or consumer acceptance and attitudes (Moon and Balasubramain, 2004; Boecker et al, 2004). This research will be focused on the third are: public or consumer acceptance. This has been widely developed and diverse models are used to analyze consumer behavior. Bredahl et al (1998) wrote an interesting literature review about three models that seek to explain consumer attitudes, buying behavior and attitude change with regard to genetically engineered food products. The first model, built on Fishbein�s multi-attribute attitude model, suggests that attitudes towards GE are determined by beliefs, which can be about production processes or to perceived quality of final products. Fishbein propose that general attitudes can influence attitudes toward GE and describe these major
12 Approximately 127 million preschool children are vitamin A deficient in developing countries. 52%of pregnant women, 48% of school-age children and 39% of preschool children are affected by Iron deficiency and billions of people are at risk for zinc deficiency (HarvestPlus, 2005). 13 Sobal et al (1998) defined food and nutritional system as the set of operations and process involved in transforming raw materials into food and transforming nutrients into healthe outcomes , all of which functions as a system within biophysical and sociocultural context.

38
attitudes. The demographic characteristics and other factors are assumed to influence attitudes only indirectly. Bredahl (et al, 1998) explained the Buying behavior model with the behavioral intention model using Ajzen�s Theory of Planned Behavior14. The authors proposed that a person�s behavioral intention is basically determined by three factors: attitudes, degree of social pressure and degree of control that the person feels about performing the behavior. This last one is very useful for studying food choice, but should be limited for individual crops, because for consumers not familiar with the GM foods could find it difficult to discuss purchase intentions with imagined products. Finally, the Attitude Change Model is used to investigate the impact of factors such as information and source credibility on the behavioral intentions toward genetically modified products. Many studies based on the models described above, have been developed, with some variations depending on the new characteristics, not only in term of GM food innovations but also new circumstance in the countries and consumer preferences. Some points relevant to these models: Some studies conclude that trust is a decisive factor (Barling et al, 1999; House, et al, 2001). The application of risk and benefit perceptions is another important point in the consumer attitude studies (Bredahl et al, 1998; Boecker et al, 2004). In some research, benefit perception is the principal determining factor in consumer attitude (House et al, 2001; Hamstra, 1995) while for others risk perception is the key factor (Barling et al, 1999). Finally, in some studies socio-economic variables have significant influence on consumers (Li et al, 2002; Hoosain et al, 2003), while others they are irrelevant (McClusky et al, 2003). In the case of GM foods, economic variables might be more important in a developing country context where expenditure on food constitutes a larger share of household�s budget than in developed countries. The problem of these models is that they have been developed according to the characteristics, needs, and data in developed countries and very significant variations may be found in the context of developing countries. For these reasons it is important to analyzed this (country/region) with empirical data in order to make the necessary adjustment to the models. 1.4.5 Methodology Specific conceptual and empirical methods will be identified via planned course work and interactions with students and staff at Hohenheim. Primary data collection is envisioned, most likely using a combination of questionnaires, interviews, and focus groups. 14 According to many behavioral research, the best predictor of human behavior is a person�s conscious decision to perform the behavior (Bradahl et al, 1998)

39
1.4.6 Outputs Gonzalez, C. (2005). Consumer Attitudes Toward �Second Generation� Genetically Modified (Gm) Foods in Developing Countries: The Case of Biofortified Cassava in Ne Brazil, Pre-proposal for a doctoral thesis in the Department of Agricultural Economics and Social Sciences University of Hohenheim. Gonzalez, C. and N. Johnson (2005). The Impact of GMOs, presentation made at the workshop on Socio Economic Aspects of Use of GMOs, GEF-World Bank project, Bogota Colombia , November 2005. 1.4.7 Goal for 2006 Finalize and begin implementation of the empirical work on consumer attitudes towards GMOs, as part of a broader analysis of regional needs ensuring the ability of countries to conduct appropriate analyses of GMOs. 1.4.8 Collaborators CIAT�s Agrobiodoiversity project (SB1); University of Hohenheim, HarvestPlus, Instituto Von Humboldt, Observatorio. 1.4.9 References Aerni, P. (2001). Public Attitudes towards Agricultural Biotechnology in Developing Countries: A Comparison between Mexico and the Philippines. Cambridge, Center for International Development. 2002: 47. A.F.I. (2002 � 2003). Consumer perceptions of Food Biotechnology in Asia - Public Report on the Asian Food Information Centre 2002 Consumer Survey: 1 - 17: Asian Food Information Centre. Alston, J. M., Norton, G. and Pardey, P.G. (1995). Science under scarcity: Principles and Practice for agriculture research evaluation of priority setting. Ithaca, New York: Cornell University Press. Avila, A.F.D., Quirino, T.R., Contini, E. and Rech Filho, E.L. (2001). Social and economic impact ex ante evaluation of Embrapa's biotechnology research products. Paper presented at the 5th International Consortium on Agricultural Biotechnology Research (ICABR) on "Biotechnology, Science and Modern. Boecker, A., Nocella, G., Bertazzoli, A. and Lucchi, M. (2004). GM foods purchase intentions - Linking the theory of planned behavior with consumer trust and stated choice models. Paper presented at the 8th International Consortium on Agricultural Biotechnology Research (ICABR) on "Agricultural Biotechnology: International Trade and Domestic Production", Ravello (Italy).

40
Bonny, S. (2003). Why are most Europeans apposed to GMOs? Factors explaning rejection in France and Europe. Electronic Journal of Biotechnology, 6 (1): 50-71. Bredahl, L., Grunert, K. and Frewer, L. (1998). Consumer Attitudes and Decision-Making with regard to Genetically Engineered Food Products - A review of the Literature and Presentation of Models for Future Research. Journal of Consumer Policy, 21(3): 251-277. Burton, M. and Pearse, D. (2002). Consumer Attitudes Towards Genetic Modification, Functional Foods, and Microorganisms: A Choice Modeling Experiment for Beer. AgBioForum, 5(2): 51-58. Burton, M., D. Rigby, T. Young, and S. James. (2001). Consumer Attitudes to Genetically Modified Organisms in Food in the UK. European Review of Agricultural Economics, 28 (4): 479-498. Byerlee, D. and Fischer, K. (2002). Accessing Modern Science: Policy and Institutional Options for Agricultural Biotechnology in Developing Countries. World Development, 30(6): 931�948. CBD (The Secretariat of the Convention on Biological Diversity) and UNEP (United Nations Environment Programmed). An introduction to the Cartagena Protocol on Biosafety (on line). June. 2003. France. Available in: http://www.biodiv.org/doc/press/presskits/bs/cpbs-unep-cbd-en.pdf Chern, W.S., Rickertsen, K., Tsuboi, N. and Fu T. (2003). Consumer acceptance and willingness to pay for genetically modified vegetable oil and salmon: a multiple country assessment. AgBio Forum 5 (3): 105-112. Curtis, K., McCluskey, J. and Wahl T. (2003). Consumer Acceptance of Genetically Modified Food Products in the Developing World. AgBioForum, 7(1 &2): 1-11. Available in http://www.agbioforum.org/v7n12/v7n12a13-mccluskey.htm Curtis, K. and Moeltner, K. (2004). Do Attitudes toward Genetically Modified Foods Influence Consumers in Primary Trading Countries? The Case for China and Romania. Paper presented at the 8th International Consortium on Agricultural Biotechnology Research (ICABR) on "Agricultural Biotechnology: International Trade and Domestic Production", Ravello (Italy). Demont, M. and Tollens, E. (2004). First impact of biotechnology in the EU: Bt maize adoption in Spain. Annals of Applied Biology, 2004(195): 197-207. Eaton, D., Achterbosch, T. and Maagd, R. (2003). Assessing the benefits & potential of genetically modified non-food crops in developing countries: the case of Bt-cotton. North-South Policy Brief, 4. Available in http://www.north-south.nl/files/policy/policy_brief_2003_4.pdf

41
Falck-Zepeda, J., Falconi, C., Cohen, J., and Komen, J. (2002). Agricultural Biotechnology In Developing Countries: Investments And Human Resources From Six Selected National Agricultural Research Systems. Paper presented at the 6th International Consortium on Agricultural Biotechnology Research (ICABR) on "Agricultural Biotechnologies: New Avenues for Production, Consumption and Technology Transfer", Ravello (Italy). Frewer, L.J. ans Shepherd, R. (1994). Attributing information to different sources: Effects on the perceived qualities of information, on the perceived relevance of information, and on attitude information. Public Understanding Science, 3: 385-401. Furst, M., Conners, M., Bisogni, C.A., Sobal, J. and L.W. Falk. (1996). Food Choice: A Conceptual Model of the Process. Appetite, 26(3): 247-266. Gedrich, K. (2003). Determinants of nutritional behavior: a multitude of levers for successful intervention? Appetite, 41(3): 231-238. Hareu, G., Norton, G., Bradford, M. and Peterson, E. (2004). Biotechnology for rice ecosystem of Asia: public sector R&D options and welfare impacts under imperfect competition. Paper presented at the 8th International Consortium on Agricultural Biotechnology Research (ICABR) on "Agricultural Biotechnology: International Trade and Domestic Production", Ravello (Italy). Hoban, T. (2004). Public Attitudes towards Agricultural Biotechnology. The Food and Agriculture Organization of the United Nations - FAO. Available in http://www.fao.org/documents/show_cdr.asp?url_file=/docrep/007/ae064e/ae064e00.htm Homstra A.M. (1995). Consumer acceptance model for food biotechnology � Final report. The Hague: The SWOKA Institute. HarvestPlus. (2005). Available in: http://www.harvestplus.org/ Hoosain, F., B. Onyango, A. Adelaja, B. Schilling, and W. Hallman (2003). �Nutritional Benefits and Consumer Willingness to Buy Genetically Modified Foods�, Journal of Food Distribution Research, 34 (1):24-29. House, L., Morrow, B., Lusk, J. and Moore, M. (2001). Modeling Consumer Acceptance of and Willingness to Pay for Genetically-Modified Foods in the United States and the European Union. Paper presented at the International Food and Agribusiness Management Association Annual Meeting � The World Food and Agribusiness Symposium., Sydney, Australia. Available in http://www.ifama.org/conferences/2001Conference/Papers/Area%20II/House_Lisa.PDF Hout, M. (2002). The benefits and risk related to consumer access to second generation genetically modified foods. Montreal, Canada: Option consummateurs - Office of

42
Consumer Affairs. Available in http://www.option-consommateurs.org/dc_pdf/pdf/foods_2ndgen_oc0402.pdf IBOPE and Greenpeace (2001). Available in: http://www.greenpeace.com.br/transgenicos/pdf/pesquisaIBOPE_agosto2001.pdf Insituto Brasileiro de Geografia e Estadistica � IBGE. 2005. Available in: http://www.ibge.gov.br/ Kim, R. and Boyd, M. (2004). Japanese Consumer Attitudes and Decision-Making with regard to GM Food Products: Analysis using Structural Equation Modeling (SEM). Paper presented at the 8th International Consortium on Agricultural Biotechnology Research (ICABR) on "Agricultural Biotechnology: International Trade and Domestic Production", Ravello, (Italy). Korthals, M. (2002). The struggle over functional foods: Justice and the social meaning of functional food. Journal of Agricultural and Environmental Ethics, 15(3): 315-324. Li, Q., Curtis, K., McCluskey, J. and Wahl, T. (2002). Consumer Attitudes Toward Genetically Modified Foods in Beijing China. AgBioForum, 5(4): 145 - 152. Loureiro, M. and Bugbee, M.. (2005). Enhanced GM Foods: Are Consumer Ready to Pay for the Potential Benefits of Biotechnology. The Journal of Consumer Affairs, 39(1): 52-70. Ministry for the Environment of New Zealand and Business and Economic Research Limited (BERL).2003. Economic Risks and Opportunities from the Release of Genetically Modified Organisms in New Zealand. New Zealand: Ministry for the Environment. Available in: http://www.mfe.govt.nz/publications/organisms/economic-impact-apr03 Ministry of Health of Brazil. (2005). Available in: http://www.datasus.gov.br/ McClusky J., Ouchi, H., Crimsrud K.M. and Wahl T.I. 2001.Consumer response ti genetically modified food products in Japan. Agricultural and Resource Ecnomics Review 32/2.October 2003: 222-231. Moon; W. and S.K. Balasubramaniam. (2004). Public Attitudes toward Agrobiotechnology: The Mediating Role of Risk Perceptions on the Impact of Trust, Awareness, and Outrage. Review of Agricultural Economics, 26 (2); 186-208. Moschini, G. and Lapan, H. (2005). Labeling Regulations and Segregation of First -and Second- Generation Genetically Modified Products: Innovation Incentives and Welfare Effects. Agricultural Marketing Resource Center, Working Paper 05-WP 391. Nestle, M., Wing, R., Birch, L., DiSogra, L. (1998). Behavioral and social influences on food choice / Discussion. Nutrition Reviews, 56(5).

43
Pachico, D. and Wolf, M. (2002). Attitudes toward genetically modified food in Colombia. Paper presented at the 6th International Consortium on Agricultural Biotechnology Research (ICABR) on "Agricultural Biotechnologies: New Avenues for Production, Consumption and Technology Transfer", Ravello (Italy). Pachico, D., Escobar, Z., Rivas, L., Gottret, M.V. and Perez, S. (2001). Income and Employment Effects of Transgenic Herbicide-resistant Cassava in Colombia: A Preliminary Simulation . Impact Assessment. Annual Report 2001. CIAT: 61 - 71 Qaim, M., and Zilberman, D. (2003). Yield Effects of Genetically Modified Crops in Developing Countries. Sciences, 299: 900-902. Qaim, M. (1998). Transgenic Virus Resistant Potatoes in Mexico: Potential Socio-economic Implications of North -South Biotechnology Transfer. The International Service for the Acquisition of Agri-biotech Aplications (ISAAA) and Center for Development Research (ZEF): 1-48. Rousu, M., Monchuk, D., Shogren, J. F. and Kosa, K. M. (2004). Consumer Willingness to Pay for �Second-Generation� Genetically Engineered Products and the Role of Marketing Information. Paper presented at the Seminar of NC State University and RTI International, Selinsgrove, PA. Available in http://www.susqu.edu/facstaff/r/rousu/research/LabelingandGMcigs.pdf Scatasta, S., Wesseler, J. and Hobbs, J. (2004). The impact of labelling practices on perceived quality of GM food products: a revealed preferences approach. Paper presented at the 8 th ICABR International Conference on Agricultural Biotechnology: International Trade and Domestic Production, Ravello (Italy). Shaper, M. a. P., S. (2001). Organismos genéticamente modificados: su impacto socioeconómico en la agricultura de los países de la Comunidad Andina, Mercosur y Chile. CEPAL, Vol. 43: 1-81. Sobal, J., Khan, L.K. and Bisogni, C. (1998). A conceptual model of the food and nutrition system. Social Science & Medicine, 47(7): 853-863. Traill, B., Jaeger, S., Yee, W., Valli, C., House, L., Lusk, J., Moore, M. and Morrow, ML. (2004). Categories of GM Risk-Benefit Perceptions and Their Antecedents. Agrobiotechnology Management and Economics, 7(4). Trigo, E., Traxler, G., Pray, C., and Echeverria, R. (2002). Agricultural Biotechnology and Rural Development in Latin America and the Caribbean. Sustainable Development Department.

44
1.5 Identifying Opportunities for Reducing Poverty Via Better Collective Water Management
By: Sara Granados, Luis Felipe Botero, Adriana Moreno, Jorge Rubiano, Marcela Quintero, Anna Knox, Nancy Johnson
1.5.1 Objective The purpose of this study is to better understand the relationships between water and poverty in watersheds, and to identify opportunities for reducing poverty via better collective management of watershed resources. The analysis will be conducted in 3 catchments, Fuquene and Coello in the Colombian Andes and Nyando in the Kenyan part of the Nile basin. The research is part of the project �Sustaining Collective Action across Ecological and Economic Scales in Watersheds� funded in part by the CGIAR Challenge Program on Water and Food (www.waterforfood.org). 1.5.2 Methodology The main hypothesis underlying this work is that understanding and alleviating poverty in watersheds requires analysis and action at multiple socio-spatial scales, and a definition of poverty that goes beyond financial and physical assets to include ability to participate effectively in collective decision making fora (see section 3.1 for more information on the conceptual framework). The empirical analysis of poverty was conducted using an adapted version of the �Stages of Poverty� methodology ( Krishna 2005 ) that looks at poverty dynamics from a local perspective. This methodology elicits shared local perceptions of poverty and prosperity, and then categorizes families according to where they were on a poverty-prosperity scale at some defined point in the past and where they are today. Reasons for movements are also identified collectively. The advantages of the SOP methodology are that it provides good local insights into the reasons why households move into and out of poverty. The disadvantages are that , as with all local poverty indicators, the results relative and therefore difficult to compare across communities, and can be prone to misrepresentation if the method is not applied carefully by trained fieldworkers. 1.5.3 Current situation and progress in 2005 Data have been collected in all three sites and analysis is underway. Criteria for sample selection were 1) level of poverty 2) expected importance of water and 3) location within the watershed (upper, middle, lower). Table 1 lists the communities where the data were collected in the two Colombian catchments.
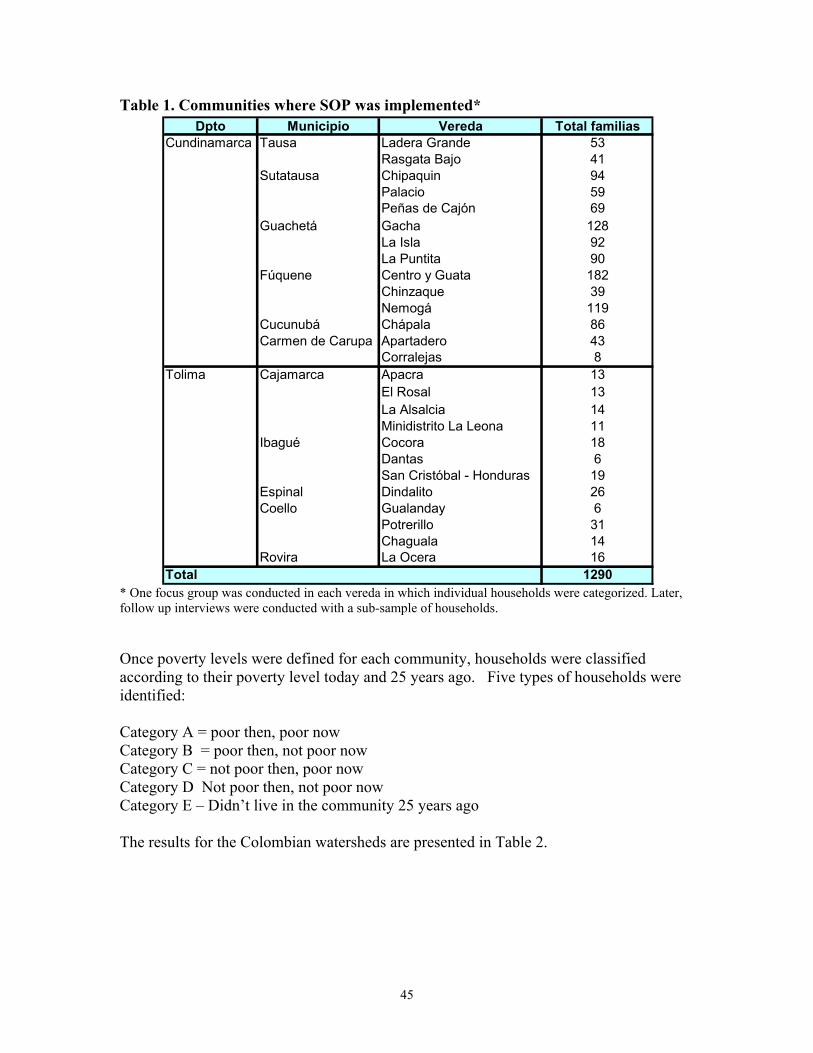
45
Table 1. Communities where SOP was implemented*
* One focus group was conducted in each vereda in which individual households were categorized. Later, follow up interviews were conducted with a sub-sample of households. Once poverty levels were defined for each community, households were classified according to their poverty level today and 25 years ago. Five types of households were identified: Category A = poor then, poor now Category B = poor then, not poor now Category C = not poor then, poor now Category D Not poor then, not poor now Category E � Didn�t live in the community 25 years ago The results for the Colombian watersheds are presented in Table 2.
Dpto Municipio Vereda Total familiasCundinamarca Tausa Ladera Grande 53
Rasgata Bajo 41Sutatausa Chipaquin 94
Palacio 59Peñas de Cajón 69
Guachetá Gacha 128La Isla 92La Puntita 90
Fúquene Centro y Guata 182Chinzaque 39Nemogá 119
Cucunubá Chápala 86Carmen de Carupa Apartadero 43
Corralejas 8Tolima Cajamarca Apacra 13
El Rosal 13La Alsalcia 14Minidistrito La Leona 11
Ibagué Cocora 18Dantas 6San Cristóbal - Honduras 19
Espinal Dindalito 26Coello Gualanday 6
Potrerillo 31Chaguala 14
Rovira La Ocera 161290Total

46
Table X Changes in poverty level from between 1980 and 1005, by municipio
Cat A = poor then, poor now; Cat B = poor then, not poor now Cat C = not poor then, poor now; Cat D Not poor then, not poor now; Cat E � Didn�t live in the community 25 years ago According to the results, poverty has declined in both communities (category B is much greater than C), however the improvement has been greater in Tolima than in Cundinamarca. In Fuquene, more than a third of households remain poor while in Tolima only 14% were poor in 2005. Analysis of the causes for the movements in and out of poverty is still underway, however a few preliminary observations can be made. In terms of methodology, the basic concepts of the conceptual framework (Swallow et al; see section 3.1)�collective action, scale, water transitions, reverse flows, action resources�do seem to be useful in explaining and analyzing water management within and across communities. The link between water and poverty is not as obvious as we expected. In some communities improved access to water via better local organization and management or more equitable negotiation with neighboring communities could have a significant impact on poverty, however in the majority of communities improvement in water quality or quantity, in
Dpto Municipio Vereda CatA CatB CatC CatD CatE TotalCundinamarca Tausa Ladera Grande 35 4 9 2 3 53
Rasgata Bajo 10 9 1 2 19 41Sutatausa Chipaquin 11 13 4 4 0 94
Palacio 22 28 0 1 8 59Peñas de Cajón 12 42 0 0 15 69
Guachetá Gacha 31 21 5 23 1 128La Isla 37 28 3 23 1 92La Puntita 35 29 0 4 22 90
Fúquene Centro y Guata 74 1 0 1 6 182Chinzaque 9 18 1 11 0 39Nemogá 15 34 5 55 10 119
Cucunubá Chápala 71 11 0 0 4 86Carmen de Carupa Apartadero 13 30 0 0 0 43
375 268 28 126 89 109534 24 3 12 8 100
Tolima Cajamarca Apacra 0 4 0 9 0 13El Rosal 0 10 1 2 0 13La Alsalcia 3 8 0 3 0 14Minidistrito La Leona 5 6 0 0 0 11
Ibagué Cocora 1 4 0 8 5 18Dantas 1 3 0 2 0 6San Cristóbal - Honduras 1 9 1 8 0 19
Espinal Dindalito 4 12 2 8 0 26Coello Gualanday 0 3 0 3 0 6
Potrerillo 0 31 0 0 0 31Chaguala 4 8 1 1 0 14
Rovira La Ocera 1 12 0 3 0 1620 110 5 47 5 18711 59 3 25 3 100Porcentaje
TotalPorcentaje
Total

47
magnitudes that are realistic given the agro-ecological characteristics of the regions, may not have significant impacts on livelihoods. Other changes such as restoration of degraded land or improving access via roads, seem to be more urgent. There are significant water upstream-down stream water problems in these watersheds�low-land irrigation in one and a lake that provides drinking water to cities in the other�yet they do not emerge as significant in this analysis. This is likely because the analysis was done at the household and community scale. This result demonstrates how the scale at which analysis is conducted can influence the results. The message for policy is that watershed management strategies need to be based on a detailed understanding of the problems at different scales so that they can provide relevant and appropriate incentives that address needs at specific scales, and at the same time contribute to outcomes that are effective and sustainable for the watershed as a whole. 1.5.4 Objectives for 2006 Complete and publish the analysis. Also, use the results for implementation of action research interventions in selected sites. 1.5.5 Outputs Data base for Fuquene and Coello watersheds (in Access) 1.5.6 Collaborators ICRAF; IFPRI/CAPRI; CONDESAN Maseno University; World Wildlife Fund (WWF)-Colombia; Universidad de los Andes; Institute for Development Studies (IDS), University of Sussex 1.5.7 References Krishna, A. (2002-2005). Stages of Progress: disaggregating poverty for better policy impact. http://www.pubpol.duke.edu/krishna Swallow, B., N. Johnson, R Meinzen-Dick and A Knox. (2005). The Challenges of Cross-Scale Collective Action in Watersheds, In review for special issue of Water International and as CAPRi working paper.

48
1.6 New Diversified Livestock Production Systems Including Agricultural Components and Environmental Services: An Economic Evaluation in the Colombian Antillanura
By: L. Rivas, F. Holmann, J. García 1.6.1 Objective The objective of this study is to evaluate from the economic, social, and environmental optics, new farm models include various livestock, agricultural, and forest components for the production of food and raw materials, and in addition, generation of environmental services such as carbon sequestration. 1.6.2 Methods To meet the objective, a multi-period linear programming model was used to optimize different production systems and to evaluate environmental externalities. 1.6.3 Current situation and progress made in 2005 For this analysis, the progressive incorporation of new technological components into the current livestock production systems is simulated, constructing various sequential technological scenarios. The starting point is a livestock farm with an extensive production system based on native savannas in monoculture. In the next phase, a component of pasture rotations and crops will be added, in a process oriented to improve the soil conditions through the construction of arable layers. The incorporation of forests and the sale of environmental services, in the form of carbon sequestration represent the following stage in the path of transformation of the productive systems. For the animal feeding component the forage sources considered are: 1) Pastures in monoculture: a) native savanna, b) improved Brachiaria brizantha (cv. Toledo) and c) a mixed pasture of grass and legume (B. decumbens + D. Ovalifolium); and 2) Forage from the rotations of grasses and crops. It is assumed that the improved pastures in addition to providing forage also fix carbon into the soil. The evaluation period is 19 years. The semiannual crops that enter in the rotation scenarios are rice, corn, and soybeans. Three pasture rotations are considered. Rotation 1 is composed of three segments. The initial segment is a native pasture that remains in production during 7 years, followed by a cycle of 4 years of semiannual crops: rice�soybeans and corn�soybeans. This rotation culminates in the seeding of a mixed pasture, of grass and legume, with a productive life of 8 years. Rotations 2 and 3 are very similar. Both begin and end with crop cycles of 6 years each. They differ in that in rotation 2, in the intermediate segment an improved Brachiaria is established, remaining in production during 7 years. In rotation 3, in the same segment, a mixed grass-legume pasture is established.
49
Planting Caribbean pine�a species with a high degree of adaptation that produces wood sequesters carbon�represents the forest alternative. Given that the plantation is to be established in native savanna pastures, and because the soil conditions are not appropriate, the strategy is to plant first an improved grass during 4 years, after which the pine is introduced for the remaining 15 years. It was decided to simulate a typical farm of 500 hectares which operates with regional cost averages and has working capital that ranges from US$ 5,000 to US$300,000. For simplicity, the results presented in this report are for the dual-purpose production system (DP). Dual purpose extensive system At all levels of starting capital, the DP is more attractive economically than the cow-calf (ie., specialized beef) system. When the initial working capital is US$ 300,000 the value of the objective function of the DP is almost 6 times higher than in the specialized beef system. If producers with limited working capital were to switch from specialized beef to DP, their net income would grow 2.5 times. The greatest economic incentive of the DP is reflected in better shadow prices of land. The maximum price that a producer with a specialized beef system would be willing to pay per additional hectare would be US$ 135 on average. If the farm were dual purpose, the amount would be US$ 449/ha. The optimal strategy for farms with high starting capital would be to establish a very high proportion of area with improved forages, 89% (Table 1). On the other hand, farms with low initial capital would be better off using native savannas as the main source of livestock feeding. Under these conditions, the DP can only generate employment when the starting capital is above US$ 200,000. Dual purpose system including rotations of grass�crops and conservationist practices of land use. The adoption of rotations between improved forages and crops in the DP system displaces the native savannas. When high levels of operating capital are available, the improved grass (ie., B. brizantha cv Toledo) is highly competitive, occupying a fraction that ranges between 64 and 79% of the available farm area. The rest of the farm is allocated to rotation 2 (Table 2). As the availability of operating capital decreases, the area cultivated with rotation 1 increases. The association B. decumbens + D. ovalifolium does not appear in the optimal solution per se, but is part of rotation 1. The introduction of rotations of grasses�crops increases significantly the employment generation capacity of the mixed crop-livestock systems. As the area under grasses in monoculture decreases, the net generation of employment tends to rise. In farms with the highest levels of starting capital, the introduction of rotations and of conservationist

50
practices of land use increase net income by 13%. Likewise, in the specialized beef system the increase in net income is about 44%. In situations of low availability of starting capital the economic impact of technological adoption is substantially greater. The jump in productivity generated by the adoption of rotations of grasses�crops represents an increase of almost 7 times the net income (Tables 1 and 2). Dual purpose system with grass�crop rotations, conservationist techniques of land use and forest activities. The addition of the forestry option in the mixed crop-livestock system influences land use in situations where the availability of starting capital is over US 10,000. As the level of starting capital begins to increase above $10,000 the area under forestry plantations comes to occupy a high fraction of the total available land (81%, Table 5). The presence of forestry plantations reduces the competitiveness, within the system, of the pastures in monoculture. The improved pastures, that at high levels of starting capital and in a scenario without the option of forestry occupy 79% of available land, now reduce their participation to only 12% when the option of forestry is included. As in the case of the specialized beef system, the option of carbon sale, given its low current prices, would have limited importance as revenue-producing in dual purpose livestock farms (Table 3). Changes in the price of the carbon, in the range of US$ 5 to 100/mt, would have little incidence on land use changes (Table 4). Due to the greatest initial productivity of the dual-purpose system compared to specialized beef, the introduction of trees in the first one has a smaller economic incidence. The introduction of trees in DP would not lead to substantial changes in the value of the objective function, which means that the shadow prices of land would remain stable. An economic and social externality, resulting from the expansion of areas allocated to forestry, is the reduction of the capacity to generate employment since this activity is less intensive in labor compared to the crop-livestock options. Forest incentive policies The application of a forest incentive, equivalent to a CIF of 50%, would stimulate the forestry option among producers with high levels of starting capital, but with a poor effect on the weakest economic groups of producers (Table 6). However, the combination of a forest incentive such as the CIF and an agreement of prepayment of the carbon sequestered would have a great impact in terms of expansion of the forest areas within producers with availability of starting capital under US$ 200,000 (Table 7).
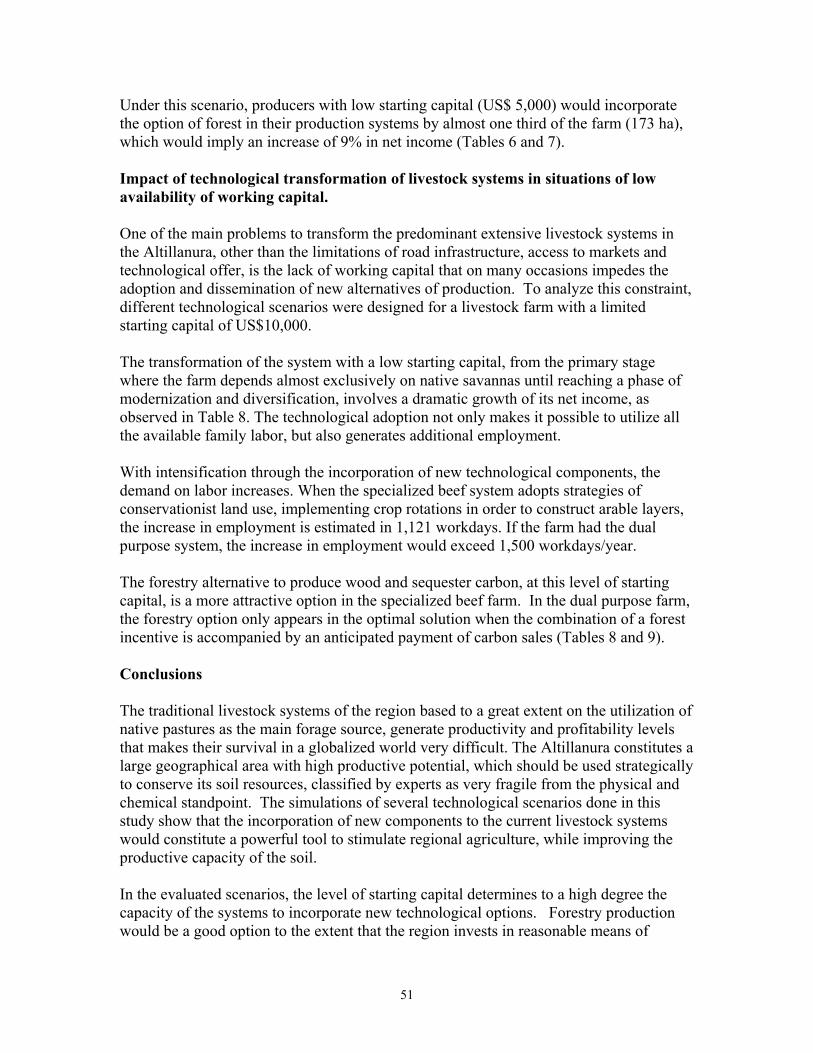
51
Under this scenario, producers with low starting capital (US$ 5,000) would incorporate the option of forest in their production systems by almost one third of the farm (173 ha), which would imply an increase of 9% in net income (Tables 6 and 7). Impact of technological transformation of livestock systems in situations of low availability of working capital. One of the main problems to transform the predominant extensive livestock systems in the Altillanura, other than the limitations of road infrastructure, access to markets and technological offer, is the lack of working capital that on many occasions impedes the adoption and dissemination of new alternatives of production. To analyze this constraint, different technological scenarios were designed for a livestock farm with a limited starting capital of US$10,000. The transformation of the system with a low starting capital, from the primary stage where the farm depends almost exclusively on native savannas until reaching a phase of modernization and diversification, involves a dramatic growth of its net income, as observed in Table 8. The technological adoption not only makes it possible to utilize all the available family labor, but also generates additional employment. With intensification through the incorporation of new technological components, the demand on labor increases. When the specialized beef system adopts strategies of conservationist land use, implementing crop rotations in order to construct arable layers, the increase in employment is estimated in 1,121 workdays. If the farm had the dual purpose system, the increase in employment would exceed 1,500 workdays/year. The forestry alternative to produce wood and sequester carbon, at this level of starting capital, is a more attractive option in the specialized beef farm. In the dual purpose farm, the forestry option only appears in the optimal solution when the combination of a forest incentive is accompanied by an anticipated payment of carbon sales (Tables 8 and 9). Conclusions The traditional livestock systems of the region based to a great extent on the utilization of native pastures as the main forage source, generate productivity and profitability levels that makes their survival in a globalized world very difficult. The Altillanura constitutes a large geographical area with high productive potential, which should be used strategically to conserve its soil resources, classified by experts as very fragile from the physical and chemical standpoint. The simulations of several technological scenarios done in this study show that the incorporation of new components to the current livestock systems would constitute a powerful tool to stimulate regional agriculture, while improving the productive capacity of the soil. In the evaluated scenarios, the level of starting capital determines to a high degree the capacity of the systems to incorporate new technological options. Forestry production would be a good option to the extent that the region invests in reasonable means of

52
transportation and adequate infrastructure for the management and processing of forest products. The current prices in the international carbon market are low and this trend is expected to continue in the next 5�6 years. This circumstance determines that the sale of carbon sequestered by trees and pastures does not represent a significant income in the farm economy and has a low impact on land use. 1.6.4 Objectives for 2006 Producir versión definitiva del estudio, incluyendo un análisis de las implicaciones del TLC (Tratado de Libre Comercio) sobre los nuevos sistemas de producción en la Antillanura. Editar y publicar como documentos de trabajo. 1.6.5 Outputs Rivas, L., F. Holmann, y J.A. García. (2005). Nuevos Sistemas de Producción Agropecuaria y Servicios Ambientales: Una evaluación económica en la Altillanura colombian. Documento de trabajo # 204. CIAT (Centro Internacional de Agricultura Tropical) . Cali, Colombia. 1.6.6 Collaborators Rubén Darío Estrada y Marcela Quintero. Proyecto Cuencas Andinas Condesan - CIAT Edgar Amézquita y Marco Rondón. Proyecto de Suelos, CIAT (PE2) Luís Horacio Franco y Patricia Avila. Proyecto de Forrajes, CIAT.(IP5) Guido Gasca y Mauricio Rivas. Reforestasora de la Costa S. A. REFOCOSTA.
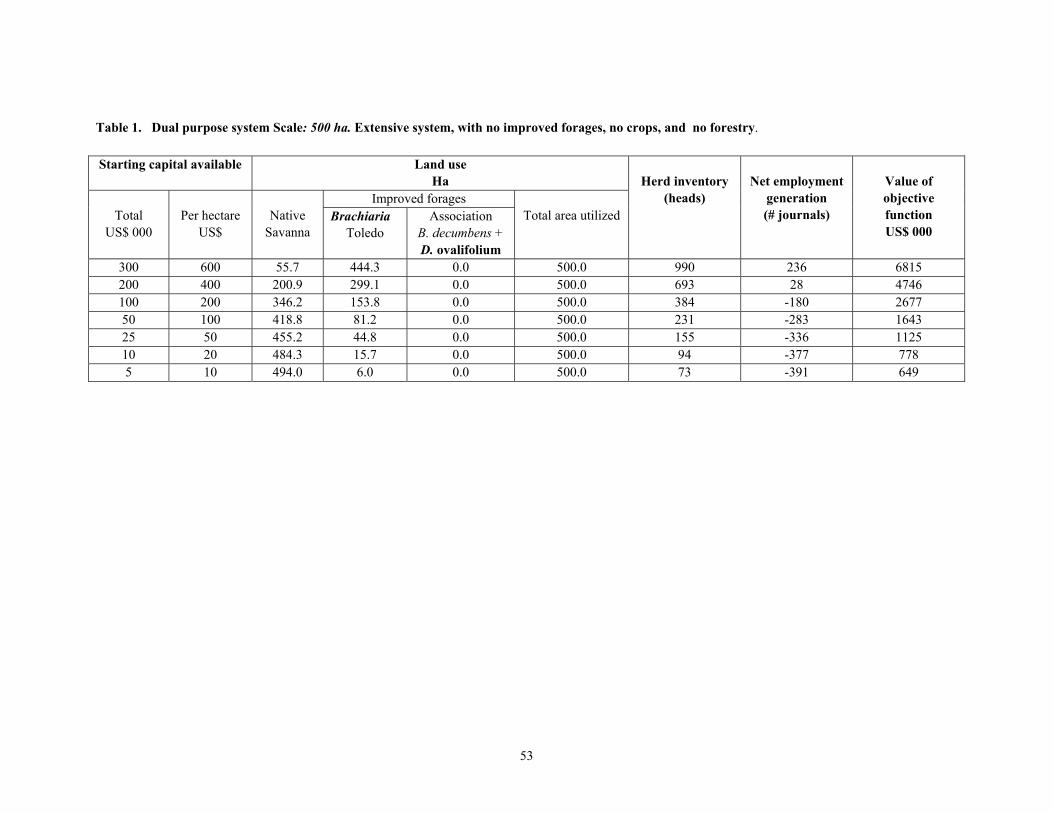
53
Table 1. Dual purpose system Scale: 500 ha. Extensive system, with no improved forages, no crops, and no forestry. Starting capital available Land use
Ha Improved forages
Total US$ 000
Per hectare
US$
Native
Savanna Brachiaria
Toledo Association
B. decumbens + D. ovalifolium
Total area utilized
Herd inventory
(heads)
Net employment
generation (# journals)
Value of objective function US$ 000
300 600 55.7 444.3 0.0 500.0 990 236 6815 200 400 200.9 299.1 0.0 500.0 693 28 4746 100 200 346.2 153.8 0.0 500.0 384 -180 2677 50 100 418.8 81.2 0.0 500.0 231 -283 1643 25 50 455.2 44.8 0.0 500.0 155 -336 1125 10 20 484.3 15.7 0.0 500.0 94 -377 778 5 10 494.0 6.0 0.0 500.0 73 -391 649

54
Table 2. Dual purpose system Scale: 500 ha. Dual purpose system with improved forages in rotation with crops and conservationist soil practices.
Starting capital available
Land use Ha
Rotations crop-grass Improved grass Total US$ 000
Per
hectare US$
Native
savanna Rotation 1 Rotation 2 Rotation 3 Brachiaria
cv. Toledo Association B. decumbens + D. ovalifolium
Total area utilized
Herd
inventory (Heads)
Net employment generation (# journals)
Value of objective function US$ 000
300 600 0.0 0.0 106.5 0.0 393.5 0.0 500.0 871 780 7684 200 400 0.0 0.0 179.7 0.0 320.3 0.0 500.0 709 1099 6889 100 200 0.0 69.4 235.0 0.0 195.6 0.0 500.0 567 1400 5995 50 100 0.0 205.0 174.7 0.0 120.3 0.0 500.0 661 1253 5535 25 50 0.0 272.8 144.5 0.0 82.7 0.0 500.0 709 1180 5305 10 20 0.0 312.0 128.2 0.0 59.8 0.0 500.0 734 1142 5163 5 10 0.0 319.0 130.2 0.0 50.8 0.0 500.0 727 1157 5102
Rotation 1: Native savanna � rice/corn ~ soybean �. B. decumbens + D. Ovalifolium. Rotation 2: = rice/corn ~ soybean - Brachiaria cv. Toledo - rice/corn ~ soybean Rotation 3: rice/corn ~ soybean - B. decumbens +D. Ovalifolium � rice/corn ~ soybean
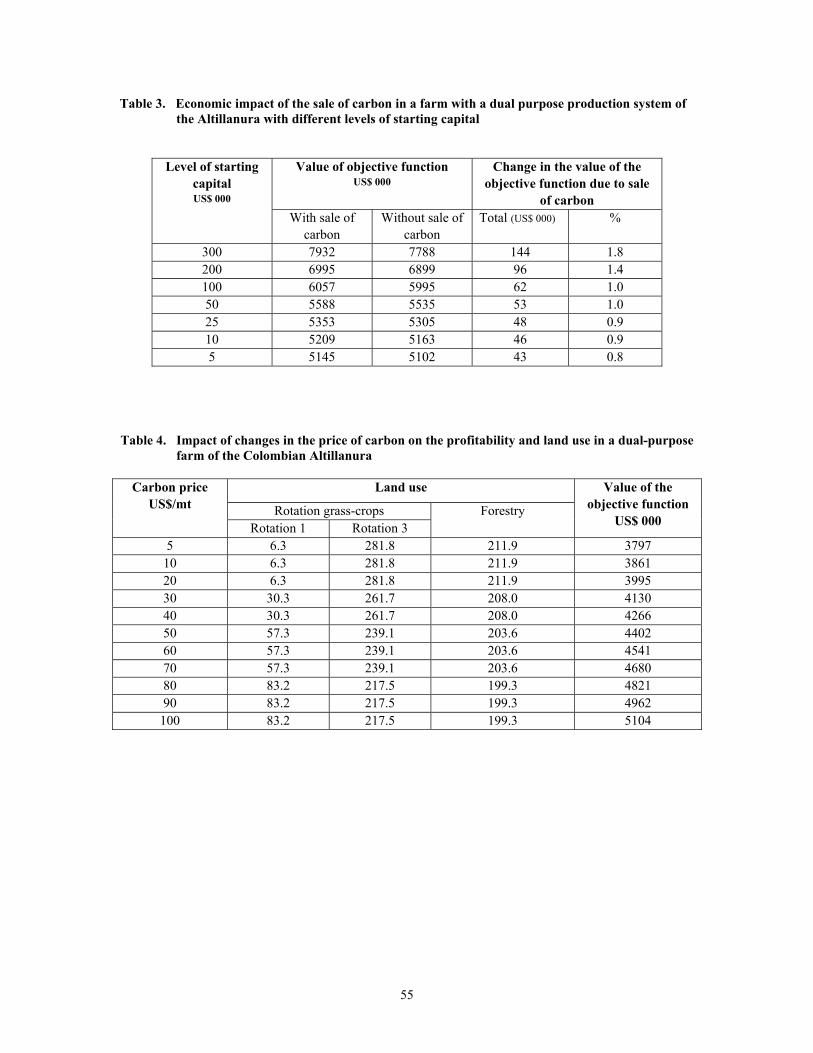
55
Table 3. Economic impact of the sale of carbon in a farm with a dual purpose production system of the Altillanura with different levels of starting capital
Table 4. Impact of changes in the price of carbon on the profitability and land use in a dual-purpose farm of the Colombian Altillanura
Value of objective function US$ 000
Change in the value of the objective function due to sale
of carbon
Level of starting capital US$ 000
With sale of carbon
Without sale of carbon
Total (US$ 000) %
300 7932 7788 144 1.8 200 6995 6899 96 1.4 100 6057 5995 62 1.0 50 5588 5535 53 1.0 25 5353 5305 48 0.9 10 5209 5163 46 0.9 5 5145 5102 43 0.8
Land use
Rotation grass-crops
Carbon price US$/mt
Rotation 1 Rotation 3 Forestry
Value of the objective function
US$ 000
5 6.3 281.8 211.9 3797 10 6.3 281.8 211.9 3861 20 6.3 281.8 211.9 3995 30 30.3 261.7 208.0 4130 40 30.3 261.7 208.0 4266 50 57.3 239.1 203.6 4402 60 57.3 239.1 203.6 4541 70 57.3 239.1 203.6 4680 80 83.2 217.5 199.3 4821 90 83.2 217.5 199.3 4962
100 83.2 217.5 199.3 5104

56
Table 5. Dual-purpose system. Scale: 500 hectares. Livestock, with improved forages rotation with crops, conservationist soil practices, forestry options and payment for environmental services (sale of carbon)
Availability of starting capital
Land use Ha
Rotations grass-crops Improved grasses Total
US$ 000
Per ha
US$
Forestry Caribbean Pine
Native
savanna Rot 1 Rot 2 Rot 3 Brachiaria
cv. Toledo Association B. decumbens+ D. ovalifolium
Total area
utilized ha
Herd
inventory (Heads)
Net
employment generation (Journals)
Value of objective function US$ 000
300 600 405.3 0.0 28.1 8.7 0.0 57.9 0.0 500.0 182 729 7932 200 400 275.8 0.0 139.1 37.5 0.0 47.6 0.0 500.0 374 837 6995 100 200 134.3 0.0 235.4 80.0 0.0 50.3 0.0 500.0 565 983 6057 50 100 63.6 0.0 283.6 101.3 0.0 51.5 0.0 500.0 661 1055 5588 25 50 28.3 0.0 307.7 111.9 0.0 52.1 0.0 500.0 708 1092 5353 10 20 0.0 0.0 312.0 128.2 0.0 59.8 0.0 500.0 734 1142 5209 5 10 0.0 0.0 319.0 130.2 0.0 50.8 0.0 500.0 727 1157 5145
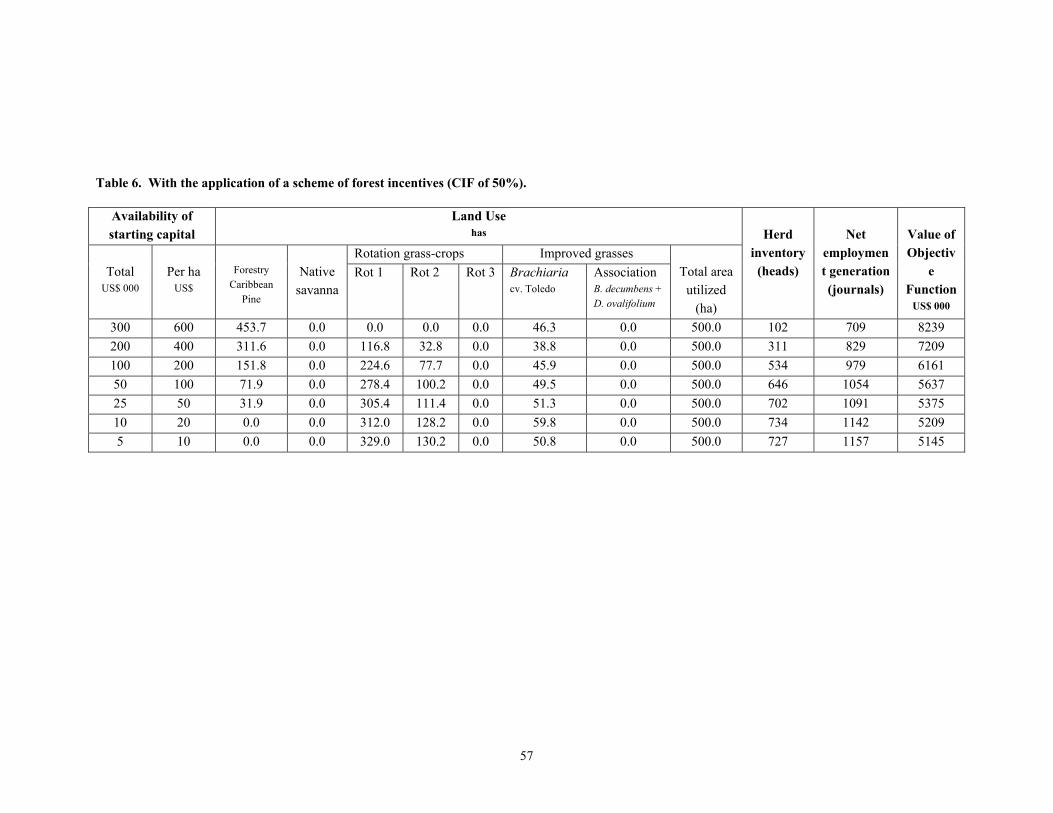
57
Table 6. With the application of a scheme of forest incentives (CIF of 50%).
Availability of starting capital
Land Use has
Rotation grass-crops Improved grasses Total
US$ 000
Per ha
US$
Forestry
Caribbean Pine
Native
savanna Rot 1 Rot 2 Rot 3 Brachiaria
cv. Toledo Association B. decumbens + D. ovalifolium
Total area
utilized (ha)
Herd
inventory (heads)
Net
employment generation (journals)
Value of Objectiv
e Function
US$ 000
300 600 453.7 0.0 0.0 0.0 0.0 46.3 0.0 500.0 102 709 8239 200 400 311.6 0.0 116.8 32.8 0.0 38.8 0.0 500.0 311 829 7209 100 200 151.8 0.0 224.6 77.7 0.0 45.9 0.0 500.0 534 979 6161 50 100 71.9 0.0 278.4 100.2 0.0 49.5 0.0 500.0 646 1054 5637 25 50 31.9 0.0 305.4 111.4 0.0 51.3 0.0 500.0 702 1091 5375 10 20 0.0 0.0 312.0 128.2 0.0 59.8 0.0 500.0 734 1142 5209 5 10 0.0 0.0 329.0 130.2 0.0 50.8 0.0 500.0 727 1157 5145
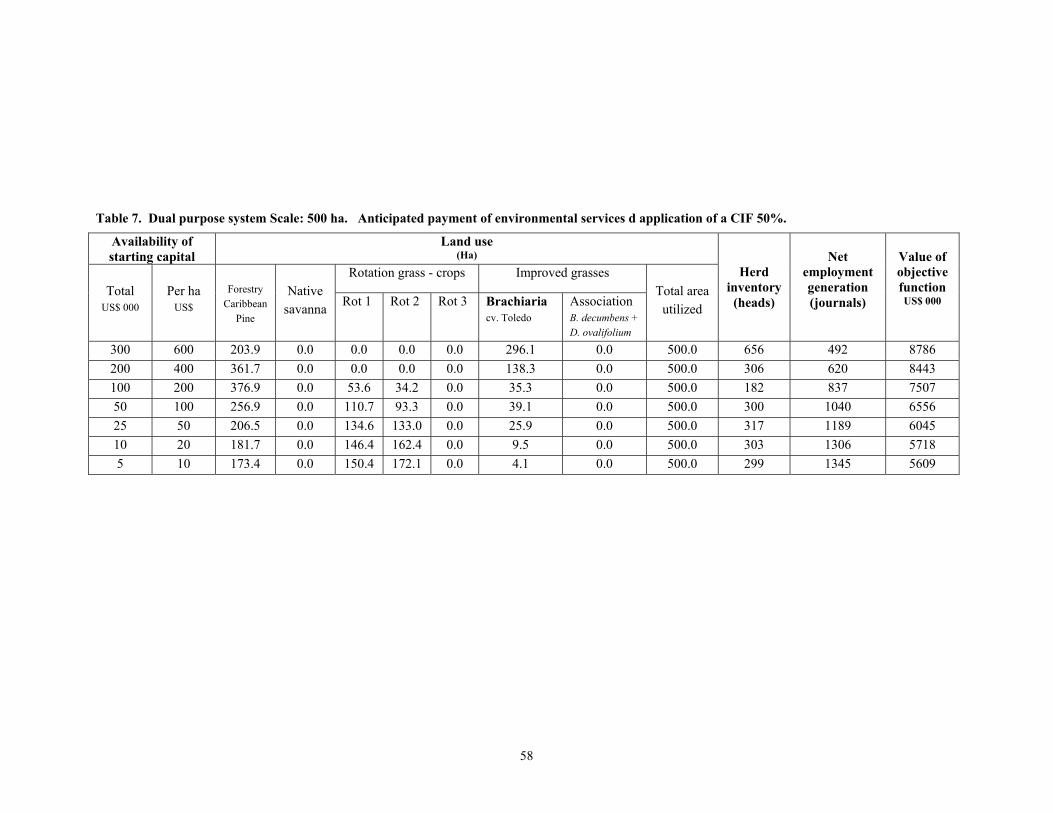
58
Table 7. Dual purpose system Scale: 500 ha. Anticipated payment of environmental services d application of a CIF 50%.
Availability of starting capital
Land use (Ha)
Rotation grass - crops Improved grasses Total
US$ 000
Per ha
US$
Forestry
Caribbean Pine
Native
savanna Rot 1 Rot 2 Rot 3 Brachiaria cv. Toledo
Association B. decumbens + D. ovalifolium
Total area
utilized
Herd inventory (heads)
Net
employment generation (journals)
Value of objective function US$ 000
300 600 203.9 0.0 0.0 0.0 0.0 296.1 0.0 500.0 656 492 8786 200 400 361.7 0.0 0.0 0.0 0.0 138.3 0.0 500.0 306 620 8443 100 200 376.9 0.0 53.6 34.2 0.0 35.3 0.0 500.0 182 837 7507 50 100 256.9 0.0 110.7 93.3 0.0 39.1 0.0 500.0 300 1040 6556 25 50 206.5 0.0 134.6 133.0 0.0 25.9 0.0 500.0 317 1189 6045 10 20 181.7 0.0 146.4 162.4 0.0 9.5 0.0 500.0 303 1306 5718 5 10 173.4 0.0 150.4 172.1 0.0 4.1 0.0 500.0 299 1345 5609
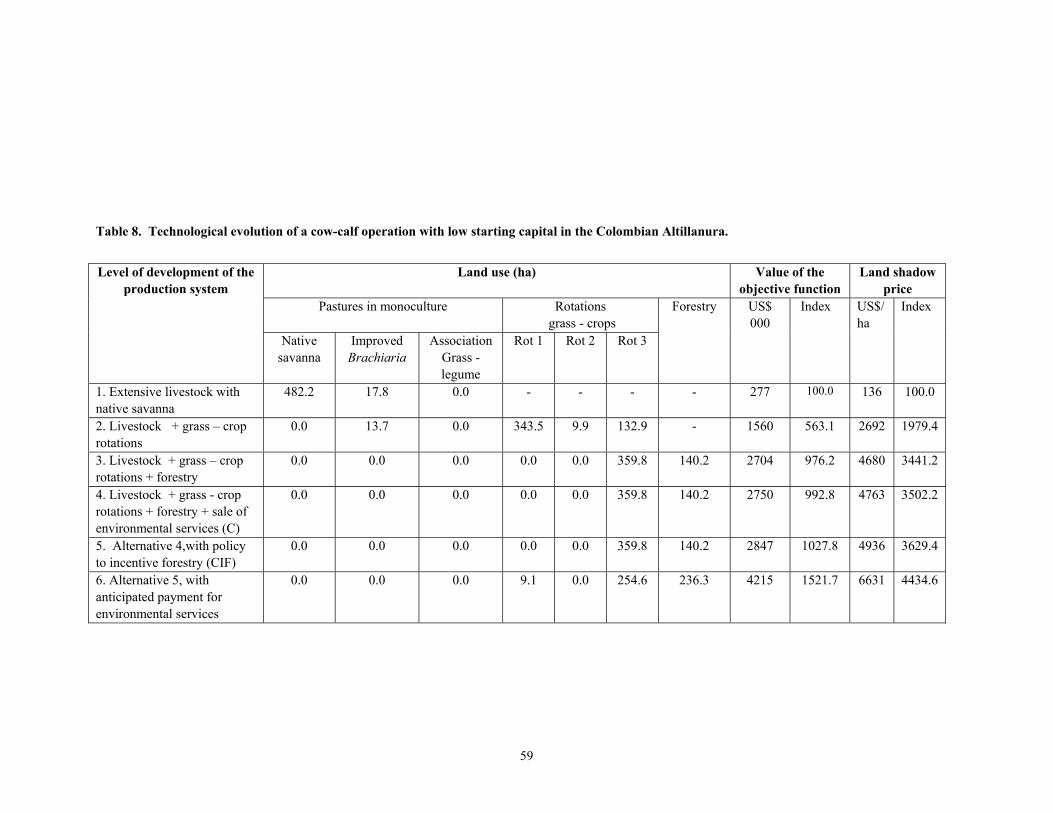
59
Table 8. Technological evolution of a cow-calf operation with low starting capital in the Colombian Altillanura.
Land use (ha) Value of the objective function
Land shadow price
Pastures in monoculture Rotations grass - crops
Level of development of the production system
Native savanna
Improved Brachiaria
Association Grass - legume
Rot 1 Rot 2 Rot 3
Forestry US$ 000
Index US$/ ha
Index
1. Extensive livestock with native savanna
482.2 17.8 0.0 - - - - 277 100.0 136 100.0
2. Livestock + grass � crop rotations
0.0 13.7 0.0 343.5 9.9 132.9 - 1560 563.1 2692 1979.4
3. Livestock + grass � crop rotations + forestry
0.0 0.0 0.0 0.0 0.0 359.8 140.2 2704 976.2 4680 3441.2
4. Livestock + grass - crop rotations + forestry + sale of environmental services (C)
0.0 0.0 0.0 0.0 0.0 359.8 140.2 2750 992.8 4763 3502.2
5. Alternative 4,with policy to incentive forestry (CIF)
0.0 0.0 0.0 0.0 0.0 359.8 140.2 2847 1027.8 4936 3629.4
6. Alternative 5, with anticipated payment for environmental services
0.0 0.0 0.0 9.1 0.0 254.6 236.3 4215 1521.7 6631 4434.6

60
Table 9. Technological evolution of a dual-purpose livestock system with low starting capital in the Colombian Altillanura
Land use (ha)
Value of the objective function
Land shadow price
Pastures in monoculture
Rotations Grass - crops
Level of development of the production system
Native savanna
Improved Brachiaria
Association Grass - legume
Rot 1 Rot 2 Rot 3
Forestry
US$ 000
Index
US$/
ha Index
1. Extensive livestock with native savanna
484.3 15.7 0.0 - - - - 778 100.0 546 100.0
2. Livestock + grass � crop rotations
0.0 59.8 0.0 312.0 128.2 0.0 - 5163 663.6 9736 1783.1
3. Livestock + grass � crop rotations + forestry
0.0 59.8 0.0 312.0 128.2 0.0 0.0 5163 663.6 9736 1783.1
4. Livestock + grass - crop rotations + forestry + sale of environmental services (C)
0.0 59.8 0.0 312.0 128.2 0.0 0.0 5209 669.5 9829
1800.2
5. Alternative 4,with policy to incentive forestry (CIF)
0.0 59.8 0.0 312.0 128.2 0.0 0.0 5209 669.5 9829 1800.2
6. Alternative 5, with anticipated payment for environmental services
0.0 9.5 0.0 146.4 162.4 0.0 181.7 5718 735.0 10317 1889.6

61
1.7 Diagnóstico y Análisis de la Cadena de Carne Bovina en Centroamérica: Identificación de puntos para impulsar el cambio técnico y mejorar la eficiencia del sector By: F. Holmann, L. Rivas, E. Pérez 1.7.1 Introducción y objetivos En 2005 conjuntamente con el Proyecto de Forrajes del CIAT (IP5), el Instituto Internacional de Investigación en ganadería (ILRI, por sus siglas en inglés) y la Corporación ganadera de Costa Rica (CORFOGA) se inició un estudio de caracterización y análisis de las cadenas agroindustriales de carne vacuna, como una actividad dentro del Proyecto financiado por CFC, Mejoramiento de la productividad, calidad y comercio de carne bovina en Centroamérica. El estudio plantea que el desarrollo de tecnologías mejoradas que incrementan la productividad ganadera, es necesario pero no suficiente, para promover la modernización, la conservación de los recursos naturales, la competitividad y el mejoramiento de las condiciones de vida de los pequeños y medianos productores ganaderos de la región. Por la importancia económica, social y ambiental de la pecuaria bovina en Centroamérica, su pobre desempeño productivo de las últimas décadas, es motivo de especial preocupación para varios estamentos sociales: productores, técnicos, investigadores, planificadores y políticos. Para diseñar y aplicar estrategias efectivas que permitan revertir la situación, se precisa efectuar un análisis y evaluación críticos, desde una perspectiva amplia, que incluya todos los eslabones de la cadena cárnica desde la finca ganadera, hasta el consumidor final. Se considera que mucha de la problemática y de las limitaciones para la adopción tecnológica en el sector primario de producción, nacen en imperfecciones e ineficiencias en otros eslabones de la cadena cárnica, en particular en las asimetrías, en cuanto a poder de negociación, que se observan entre los diferentes actores de la misma y que resultan en inequidades en la distribución de los beneficios de la modernización y del cambio técnico. El objetivo general del estudio es caracterizar y analizar la cadena de carne vacuna en Centroamérica, para identificar y sugerir líneas de acción que permitan optimizar su funcionamiento y propiciar una mayor participación, particularmente de los actores de pequeña escala, en procesos diferentes a los de la simple producción primaria, como una estrategia que contribuya a mejorar la adopción tecnológica, la productividad y la rentabilidad de la ganadería. Se busca generar información estratégica, que ayude a fijar prioridades y a la implementación de líneas de acción, en los sectores público y privado, que impulsen el cambio técnico y la competitividad de la agroindustria ganadera regional. Los objetivos específicos son: (1) Identificación de las articulaciones entre eslabones de la cadena, niveles tecnológicos, indicadores de eficiencia, capacidad instalada (escala) y grados de ocupación; (2) Descripción de los agentes económicos de la cadena y sus
62
relaciones comerciales y legales; (3) Caracterización y estimación de las estructuras de costos y de precios, y de generación de valor agregado en los eslabones de la cadena; (4) Identificación de los costos críticos, susceptibles de modificar a través de intervenciones tecnológicas, de política o de otro tipo; y (5) Determinación de los factores de riesgo, biológicos y económicos, a lo largo de la cadena. 1.7.2 Metodología La fase inicial del trabajo incluye el estudio de caso de Costa Rica, el cual permitirá desarrollar las metodologías y procedimientos que se aplicarán en los otros países considerados: Honduras, Nicaragua, y Guatemala. Para describir, caracterizar y analizar los eslabones de la cadena agroindustrial, se empleará información de diversas fuentes. Inicialmente se recopilará información secundaria referente al desarrollo y tendencias de la ganadería regional y posteriormente información primaria provenientes de muestreos dirigidos, grupos focales y de interlocutores calificados, en los diferentes eslabones de la cadena. Tal información se refiere a niveles de operación, capacidad instalada, volúmenes de producción (productos y subproductos) costos, precios de compra y de venta, características de los clientes y número de intermediarios. Se efectuarán muestreos y sondeos en los diferentes segmentos: 1) Mataderos 2) Plantas de procesamiento. 3) Carnicerías y supermercados, en tanto que se buscará el máximo aprovechamiento de la información secundaria ya disponible. 1.7.3 Situación y progresos en 2005 En el presente año se efectuaron dos reuniones de trabajo en la sede de Corfoga en Costa Rica para desarrollar las bases metodológicas generales del estudio y discutir el avance del estudio de caso en ese país. Estudio de caso en Costa Rica Se registraron progresos en el análisis del eslabón primario de producción vacuna y la comercialización del ganado y la carne. Se analizaron las principales macro tendencias del sector: producción, productividad, precios, comercio y consumo. Se concluye que la ganadería en Costa Rica, atraviesa una fase de crisis, con tasas anuales de crecimiento de largo plazo de la producción vacuna muy por debajo de las de la población humana, -0.1% frente a 2.5%, en promedio por año, en el período 1980 �2004. Para el análisis del eslabón primario de la cadena cárnica en Costa Rica, se contó con el muestreo en fincas ganaderas realizado en 2005 CORFOGA. Este incluyó un total de 1074 fincas en todo el territorio nacional y tres sistemas de producción: 1) Cría, 2) Doble propósito y 3) Desarrollo y Engorde. La actividad predominante es la cría de vacunos (56% de las fincas), seguida por el doble propósito, producción conjunta de carne y leche, (27.6%) y por el sistema de desarrollo y engorde, (16.4%) Cuadro 1.
63
Estos sistemas presentan baja capacidad de absorción de mano de obra, utilizando en promedio dos trabajadores de tiempo completo por año. Es necesario anotar que el costo de la mano de obra, valorado al precio del salario mínimo legal, representa una elevada fracción del ingreso bruto de las explotaciones ganaderas, en promedio 77.5%. (Cuadro 1) La cría de ganado, por su baja productividad, retribuye a la mano de obra familiar con salarios por debajo del mínimo legal. Bajo el supuesto que el único costo en efectivo es la mano de obra, las fincas de cría estarían pagando al trabajo familiar, un salario equivalente al 60% del mínimo legal. Si bien es una situación preocupante, también representa una oportunidad de lograr impactos en reducción de la pobreza mediante adopción de tecnologías ganaderas de mayor productividad, que permitan una mejor retribución al trabajo familiar. En los sistemas de producción considerados predominan las explotaciones de pequeña y mediana escala, con un tamaño promedio de 67 has y 92 cabezas de ganado. (Cuadro 1) A escala global, se observa una marcada concentración geográfica de las tierras ganaderas y de los inventarios vacunos. Las regiones de Hueatar Norte y Chorotega, consideradas en conjunto, contabilizan el 53% del ganado y el 54% de los pastos del país.(Censo ganadero 2002). El hato se concentra en las fincas más grandes. El 41% de ellas está en el estrato de menos de 10 hectáreas y posee el 11% del rebaño nacional. En el otro extremo las fincas más grande, de más de 80 hectáreas, constituyen el 10% del total de explotaciones ganaderas y controlan el 43% del hato nacional (Pérez, 2005). Los indicadores de productividad muestran la pobre dinámica de la ganadería en Costa Rica. La tasa de natalidad promedia se sitúa en 54%, fluctuando entre 49-63%, según el sistema productivo. Las cifras de la encuesta de CORFOGA 2005, muestran que la natalidad tiende a ser mayor en las explotaciones pequeñas, con menos de 30 cabezas, en las que la natalidad promedia se estimó en 55%. En las unidades de producción de mayor tamaño, con más de 300 cabezas, este coeficiente solo llega a 51%. El incremento de la natalidad es crítico para expandir el rebaño y lograr altas tasas de extracción. En Costa Rica la natalidad promedia resulta muy modesta y es imperativo mejorarla, dada la necesidad de reconstruir los inventarios, luego de un extenso período de liquidación. Es importante identificar estrategias orientadas a mejorar los índices de natalidad: pastos mejorados, suplementos nutricionales, mejor manejo, mejoramiento genético etc. Las tasas de mortalidad no cambian significativamente de un sistema a otro, estimándose en 2% para el grupo de terneros y en 1% para los adultos. Según Pérez (2005) entre los principales problemas que afronta la ganadería de carne en Costa Rica están:

64
1) Marcada estacionalidad de la producción forrajera, que genera faltantes alimenticios en las fincas ganaderas, en determinadas épocas del año.
2) Elevada edad de sacrificio de los vacunos, más de 3 años, que resulta en bajas
tasas de extracción. Es probable que este problema esté asociado con limitaciones de la base genéticas de la ganadería y con una pobre disponibilidad de forrajes de alto valor nutritivo. Adicionalmente, la ausencia de un sistema de clasificación de canales, con base en la calidad, desincentiva la producción de animales más jóvenes y de mejor calidad.
3) Altas tasas de extracción de hembras en edad reproductiva. Si bien es normal que
durante la fase de liquidación del ciclo ganadero, los porcentajes de extracción de hembras se incrementen, si esa proporción sobrepasa cierto límite, el resultado es una caída abrupta del inventario, tal como lo muestran las cifras en Costa Rica. La excesiva extracción de hembras aptas para producción y reproducción, sugiere una baja rentabilidad del negocio ganadero, que obliga a la liquidación de vacas, maquinas de producir carne y leche.
4) 4) Acentuado déficit en suplementación mineral, lo cual ligado a problemas de
disponibilidad forrajera, podría explicar los bajos índices de productividad, en particular las modestas tasas de natalidad.
5) 5) Problemas de parasitismo, que se acentúan particularmente en el sistema de
doble propósito. En términos de ingreso bruto por unidad de factor de producción (tierra, ganado o mano de obra) la operación de levante y ceba de vacunos resulta ser la opción más atractiva, en contraste con la cría, que exhibe los indicadores más pobres. Lo anterior permite especular acerca de los riesgos, la rentabilidad y los márgenes de comercialización a través de la cadena de productos cárnicos. Dentro del eslabón primario la cría, base de la actividad productiva, presenta los menores márgenes brutos por unidad de factor de producción, lo cual parece sugerir que puede ser el sistema menos rentable en el sector primario y dentro de toda la cadena cárnica. El levante y ceba de vacunos, una actividad menos riesgosa y más intensiva en el uso de capital, presenta los mejores indicadores de ingreso bruto. 1.7.4 Planes para el 2006 En las fases siguientes se elaborarán muestreos y sondeos en los diferentes eslabones de la cadena cárnica para completar el estudio piloto de Costa Rica y posteriormente aplicar las metodologías desarrolladas en los otros países considerados.
65
1.7.5 Productos Rivas L. y F. Holmann. (2005). Metodología y Marco Conceptual para el Estudio de las cadenas agroalimentarias de carne vacuna en Centroamérica. Proyecto ILRI - CFC � CIAT. San José, Costa Rica. Junio 8. 1.7.6 Colaboradores Cristina Castro. Economista, Corfoga, San José Costa Rica Edwin Pérez. Nutricionista, ILRI, San José. Costa Rica 1.7.7 Referencias - Pérez E., (2005). La situación del sector cárnico bovino Centroamericano. Proyecto ILRI - CFC, San José, Costa Rica.

66
Cuadro 1. Indicadores seleccionados del desempeño productivo de la ganadería. Costa Rica, 2005
1/ Incluye mano de obra familiar y contratada. Fuente: Cálculos basados en cifras de la encuesta ganadera de Corfoga, 2005.
Sistema de producción Variables Cría Doble propósito Desarrollo &
engorde
Total (promedio) del sector
No de fincas 602 296 176 1074 Área (has) 68.4 54.7 80.5 66.5 Inventario (cabezas) 93 82 105 92 Producción Carne Cabezas (No) Kg Leche (litros)
10 3018
0
7 2261
23493
25 10138
0
12 3976 6475
Ingreso bruto ($) Carne Leche Total
2789
0 2789
2053
4699* 6752
10088
0 10088
3782 1295 5077
Empleo Total (No de hombres/año) 1/ Costo total ($) Costo de mano de obra/ ingreso bruto (%)
1.7
3346
119.9
2.1
4133
61.2
2.2
4330
42.9
2.0
3936
77.5
Productividad Tasa de parición (%) Tasa de mortalidad (%) Terneros Adultos Tasa de extracción (%) Tasa de reemplazo (%) Carga animal (cabezas/ha) Ingreso bruto/ha ($) Ingreso bruto/cabeza ($) Ingreso bruto/trabajador ($)
51.0
2.0 1.0
11.0 4.7 1.4
40.8 30.0
1640.6
63.0
2.0 1.0 8.3 5.1 1.5
123.4 82.8
3215.0
49.0
3.0 0.0
24.0 3.9 1.3
125.3 95.9
4585.5
54.0
2.0 1.0
12.6 4.7 1.4
76.3 55.3
2538.5
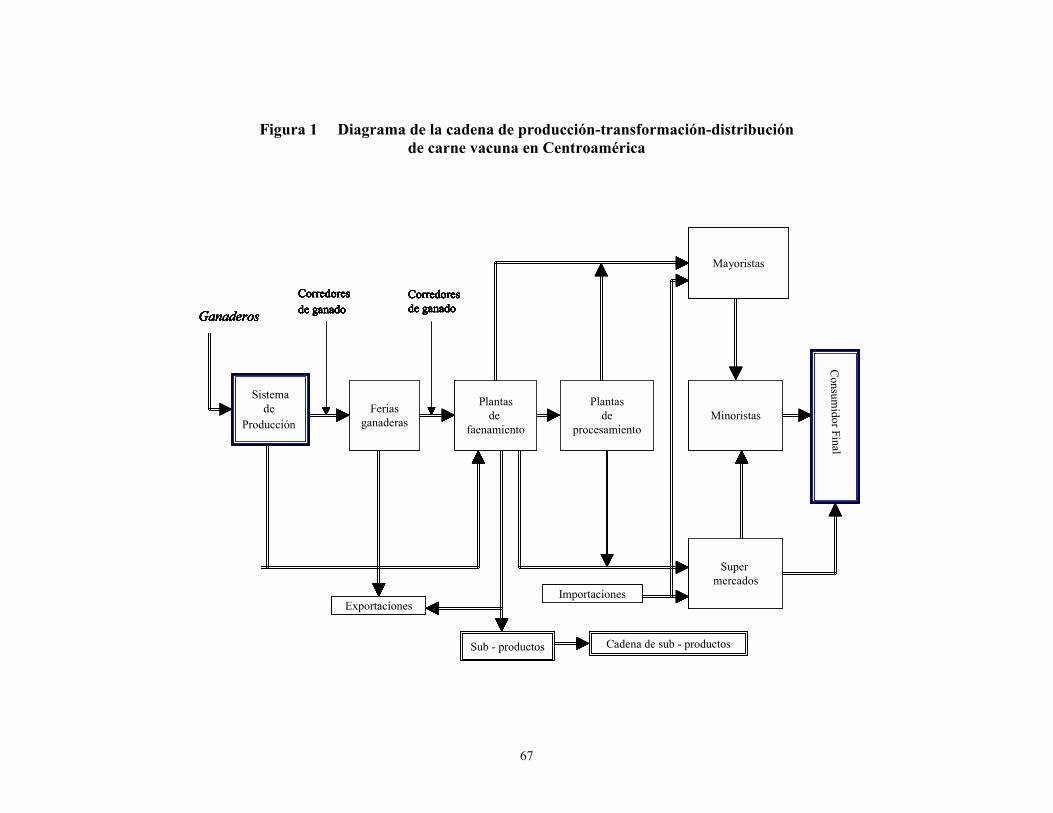
67
Figura 1 Diagrama de la cadena de producción-transformación-distribución de carne vacuna en Centroamérica
Plantasde
procesamiento
Sub - productos Cadena de sub - productos
Mayoristas
Minoristas
Consum
idor Fina l
Sistemade
Producción
Ganaderos
Feriasganaderas
Corredoresde ganado
Plantasde
faenamiento
Corredoresde ganado
Super mercados
ImportacionesExportaciones
Plantasde
procesamiento
Sub - productos Cadena de sub - productos
Mayoristas
Minoristas
Consum
idor Fina l
Sistemade
Producción
Ganaderos
Feriasganaderas
Corredoresde ganado
Plantasde
faenamiento
Corredoresde ganado
Super mercados
ImportacionesExportaciones
Plantasde
procesamiento
Sub - productos Cadena de sub - productos
Mayoristas
Minoristas
Consum
idor Fina l
Sistemade
Producción
Ganaderos
Feriasganaderas
Corredoresde ganado
Plantasde
faenamiento
Corredoresde ganado
Super mercados
ImportacionesExportaciones
Plantasde
procesamiento
Sub - productos Cadena de sub - productosSub - productos Cadena de sub - productos
Mayoristas
Minoristas
Consum
idor Fina l
Sistemade
Producción
Ganaderos
Feriasganaderas
Corredoresde ganado
Plantasde
faenamiento
Corredoresde ganado
Super mercados
ImportacionesExportaciones
Mayoristas
Minoristas
Consum
idor Fina l
Sistemade
Producción
Ganaderos
Feriasganaderas
Corredoresde ganado
Plantasde
faenamiento
Corredoresde ganado
Super mercados
ImportacionesExportaciones
Mayoristas
Minoristas
Consum
idor Fina l
Sistemade
Producción
Ganaderos
Feriasganaderas
Corredoresde ganado
Plantasde
faenamiento
Corredoresde ganado
Super mercados
ImportacionesExportaciones
Mayoristas
Minoristas
Consum
idor Fina l
Sistemade
Producción
Ganaderos
Feriasganaderas
Corredoresde ganado
Plantasde
faenamiento
Corredoresde ganado
Super mercados
ImportacionesExportaciones
Mayoristas
Minoristas
Consum
idor Fina lC
onsumidor Fina l
Sistemade
Producción
Ganaderos
Feriasganaderas
Corredoresde ganado
Plantasde
faenamiento
Corredoresde ganado
Super mercados
ImportacionesExportaciones

68
1.8 Forrajes mejorados como promotores del crecimiento económico y la Sostenibilidad. El caso de los pequeños ganaderos de Centroamérica
By: F. Holmann y L. Rivas 1.8.1 Introducción y objetivos El pastoreo extensivo en las zonas tropicales degradadas y de baja productividad, es el sistema de producción más común en América Latina Tropical, esta condición unida a los frecuentes períodos de sequías prolongadas, deriva en bajos coeficientes técnicos y pobre desempeño económico. En Centroamérica la ganadería vacuna en pastoreo es una de las principales alternativas de uso de los suelos. Casi dos terceras partes de las tierras con aptitud agrícola se destinan a pasturas, en una proporción que varía entre países, desde 51% en Honduras hasta 69.1% en Costa Rica (FAOSTAT, 2005) La magnitud de las cifras explica la alta incidencia que el uso y manejo de las pasturas tienen sobre la conservación y el empleo productivo de los recursos de tierra en la región. Este hecho es más relevante si se considera que actualmente una alta proporción de estas pasturas, estimada en el 60%, presenta problemas de degradación y de baja productividad. Para aportar elementos de solución a ésta problemática, el trabajo conjunto de los sistemas nacional e internacional de investigación, ha generado nuevos materiales forrajeros adaptados y de alta productividad. Sin embargo, se requiere acelerar la dinámica de la adopción de los nuevos materiales, para que la sociedad en conjunto reciba rápidamente los beneficios económicos, sociales y ambientales resultantes de la modernización ganadera. La falta de información sobre la utilización de los nuevos materiales forrajeros, así como su inserción y rol en los sistemas de producción existentes al igual que su viabilidad económica, han sido las principales barreras para su adopción generalizada. Esta situación es más grave muchas veces, para los pequeños productores quienes frecuentemente adoptan sistemas mixtos de ganadería y cultivos, lo cual hace más difícil la toma de decisiones acerca del uso de los recursos. Los propósitos de éste estudio son: (1) Evaluar la viabilidad económica de los materiales forrajeros mejorados, en diferentes escalas de finca y sistemas de producción en Centroamérica; (2) Poner a disposición de productores y políticos, información económica relevante, que permite mejorar el uso de los recursos productivos y las políticas tecnológicas y económicas para el cambio técnico y la innovación en la ganadería regional, dentro de una estrategia global de crecimiento económico, reducción de la pobreza y conservación de la base de recursos naturales; (3) Analizar el retorno y la viabilidad económica de la inversión en pasturas mejoradas y su potencial en diversas escalas de producción, en particular en los grupos de pequeños productores que representan una fracción significativa en el total regional. En Honduras el 95% de las fincas que poseen ganado tienen menos de 50 ha, en Nicaragua el 67% está en el rango de
69
menos 35 ha y en Costa Rica tres cuartas partes de las fincas son menores de 40 ha (ILRI, 2004). 1.8.2 Metodología La información básica utilizada proviene de un muestreo de fincas en el ámbito regional que alimenta un modelo de programación lineal multi-periódica, que evalúa, en diferentes contextos físicos y económicos, el potencial del híbrido de Brachiaria cv Mulato y de la gramínea arbustiva Cratylia argentea, un material desarrollado para su empleo en las fases críticas de sequía fuerte y prolongada. 1.8.3 Progresos y resultados en el 2005 Se efectuó un muestreo aleatorio en 123 fincas distribuidas así: Honduras 35, Nicaragua 32, Costa Rica 30, Guatemala 26. Las entrevistas se efectuaron en las principales cuencas ganaderas, por los técnicos nacionales responsables de la investigación y transferencia tecnológica en ganadería. La información recolectada se refiere a: patrones de uso de la tierra, estructura del hato, niveles de producción y productividad, uso de insumos y de mano de obra. Con base en la encuesta se definieron tres tamaños de finca: (1) Subsistencia, con un área promedia total de 9.6 hectáreas y constituye el 26.8% del total de productores. (2) Pequeño, que emplea 32 hectáreas en promedio y representa casi la mitad de fincas (48%) y (3) Mediana, con una extensión promedio de 77 hectáreas e incluye al 34% de las fincas. Para calcular el retorno económico a la inversión en pasturas mejoradas se utilizó un modelo de simulación desarrollado inicialmente por el Centro Agronómico Tropical de Investigación y Enseñanza (CATIE) y la Red Internacional de Sistemas de Producción Animal en América Latina (RISPAL), el cual fue luego expandido por el Centro Internacional de Agricultura Tropical (CIAT). Este modelo, que utiliza técnicas de optimización mediante programación lineal, fue implementado en una hoja electrónica con el objetivo de evaluar ex ante los costos y beneficios de diferentes alternativas de uso de la tierra y las interacciones entre componentes tecnológicos y la productividad biológica. (Holmann y Estrada, 1997) El modelo asume que la función objetivo de los productores es maximizar el ingreso neto anual y genera la información necesaria para estimar el retorno económico a la inversión en nuevas tecnologías ganaderas basadas en germoplasma forrajero mejorado. Su estructura flexible permite al usuario construir diversos escenarios alternativos en función de sus intereses particulares y capacidad analítica. A efectos de resumir los resultados del estudio, en ésta sección solamente se incluyen las simulaciones efectuadas en los escenarios correspondientes a fincas de subsistencia y fincas pequeñas, que adelantan actividades de doble propósito. En el primero, la inversión en pasturas mejoradas, híbrido de Brachiaria cv Mulato y la leguminosa C. argentea, para reemplazar las áreas degradadas que se encuentran actualmente en pasturas nativas, permitiría incrementar sustancialmente el inventario de vacas, el uso de mano de

70
obra y los ingresos totales de la finca. La magnitud de éstos efectos varía entre países, dependiendo de la situación inicial y de las condiciones técnicas y económicas prevalecientes en cada uno de ellos. El Cuadro1 ilustra la situación. Cuadro 1. Impacto del uso de forrajes mejorados en fincas ganaderas de subsistencia, orientadas al doble propósito en Centroamérica
Guatemala Honduras Nicaragua Costa Rica
Variables Línea base
Objetivo Línea base
Objetivo Línea base
Objetivo Línea base
Objetivo
Número de vacas 2.0 7.0 2.0 7.0 2.0 7.0 2.0 5.0 Producción Leche (kg/finca/día) Carne (kg/finca/mes)
4.4
21.0
11.9 72.0
4.4
21.0
11.9 72.0
4.4
21.0
11.9 72.0
3.4
21.0
7.9
47.0 Pastos mejorados (has) Brachiaria híbrido Cratylia argentea
0 0 0
4.0 2.5 1.5
0 0 0
4.0 2.5 1.5
0 0 0
4.0 2.5 1.5
0 0 0
4.0 3.7 0.3
Empleo (jornales/año) 0.1 0.4 0.1 0.4 0.1 0.4 0.1 0.2 Ingreso neto/finca US$/mes
12.0
69.0
16.0
61.0
12.0
55.0
8.0
51.0
Tiempo para alcanzar el objetivo (años)
na
11.0
na
11.0
na
11.0
na
9.0
Tiempo de apoyo crediticio (años)
na
4.0
na
2.0
na
2.0
na
3.0
na: no aplica En Centroamérica el costo de la mano de obra resulta ser un factor crítico para determinar la composición de las áreas en pasturas. En Costa Rica, el costo de mano de obra es superior al de los países restantes (US$ 6.4/día frente a US$ 2.3 en Nicaragua) y dado que la leguminosa arbustiva es más intensiva en el uso de mano de obra - 50 jornales/año para corte y acarreo frente a 8 jornales/año de la gramínea - en ese país una elevada proporción de las pasturas mejoradas se sembraría en gramínea (92% del área en pasto mejorado) En los otros países, con menores costos de mano de obra, la leguminosa arbustiva que permite mejorar significativamente la carga animal, tendría más chance de adopción en mayor escala. En las fincas de subsistencia de Centroamérica, el empleo de pasturas mejoradas permitiría multiplicar el ingreso neto por un factor que está en el rango 3.8 � 6.4 veces según el país. Los modelos de simulación muestra claramente que los procesos de adopción de tecnologías forrajeras son de mediano y largo plazo y que el desarrollo de la finca tomaría un lapso de 9 a 11 años, por lo cual aparte de la disponibilidad de tecnologías forrajeras, se requiere un marco de políticas crediticias que apuntale las finanzas de la explotación ganadera, hasta alcanzar el punto de autosuficiencia financiera. Los resultados de las simulaciones para el estrato de fincas pequeñas, están en la misma línea de los observados en las explotaciones de subsistencia y se presentan en el Cuadro 2.

71
Cuadro 2. Impacto del uso de forrajes mejorados en fincas ganaderas pequeñas, orientadas al doble propósito en Centroamérica
Guatemala Honduras Nicaragua Costa Rica Variables Línea
base Objetivo Línea
base Objetivo Línea
base Objetivo Línea
base Objetivo
Número de vacas 14.0 30.0 14.0 30.0 14.0 30.0 14.0 26.0 Producción Leche (kg/finca/día) Carne (kg/finca/mes)
31.0 167.0
66.0
352.0
31.0
167.0
66.0
352.0
31.0 167.0
66.0
352.0
31.0
167.0
56.0
305.0 Pastos mejorados (has) Brachiaria híbrido Cratylia argentea
0 0 0
13.0 6.9 6.1
0 0 0
13.0 6.9 6.1
0 0 0
13.0 6.9 6.1
0 0 0
13.0 10.2 2.8
Empleo (jornales/año) 0.9 1.9 0.9 1.9 0.9 1.9 0.9 1.4 Ingreso neto/finca US$/mes
126.0
378.0
94.0
336.0
70.0
305.0
90.0
271.0
Tiempo para alcanzar el objetivo (años)
na
9.0
na
9.0
na
9.0
na
7.0
Tiempo de apoyo crediticio (años)
na
4.0
na
2.0
na
2.0
na
3.0
1.8.4 Productos Holmann, F. y L. Rivas. 2005. Los forrajes mejorados como promotores del crecimiento económico y la sostenibilidad: El caso de los pequeños ganaderos de Centroamérica. Documento de trabajo #202. CIAT (Centro Internacional de Agricultura Tropical), Cali, Colombia 1.8.5 Colaboradores ILRI. International Livestock Research Institute. Donantes: CFC BMZ GTZ 1.8.6 Referencias Holmann F. y Estrada R. D. (1997). Alternativas agropecuarias en la región Pacífico Central de Costa Rica. Un modelo de simulación aplicable a sistemas de doble propósito. En: Lascano C. E. y Holmann F. (edit) Conceptos y Metodologías de Investigación en fincas con sistemas de producción animal de doble propósito. Centro Internacional de Agricultura Tropical � Consorcio Tropileche, Publicación CIAT No 296, 285 p.

72
OUTPUT 2: EX POST 2.1 Integrating Germplasm, Natural Resource Management, and Institutional Innovations to Enhance Impact: The Case of Cassava-Based Cropping Systems Research in Asia
By: Nina Lilja and Nancy Johnson 2.1.1 Objective The purpose of this study was to document the impacts of CIAT�s cassava systems research in Asia. The study, which was conducted as part of a series of studies on ex post impact of natural resource management (NRM) research funded by SPIA, also looked specifically at the impacts of farmer participation in the research project. The objective of CIAT�s cassava systems project was to use farmer participatory research (FPR) methodology to test and develop a series of best practices for controlling erosion and maintaining soil fertility in cassava-based systems in Asia, and to enhance the adoption of these selected technologies. The soil conservation practices were developed and promoted in conjunction with dissemination of improved cassava varieties. The project also researched and promoted intercropping. 2.1.2 Methodology The impact study was conducted in 2003 in Vietnam and Thailand. Data were collected from a total of 800 farm households. In both countries 8 villages were selected, i.e. four project and four control villages. In the project villages, CIAT together with the respective NARS partner implemented FPR activities. As a control, near-by villages were chosen that were thought to have similar natural resource and socio-economic conditions but no experience with the project. Also, relative to the FPR activities of the project villages, in the control villages the national extension services were engaged in promoting technology and advising farmers according to their standard operating procedure thus providing a counterfactual for the FPR component of the project. Data on general conditions and trends were collected via focus groups. In addition , focus group participants filled out survey forms that contained household level questions on wealth, socio-economic status and details of cassava production inputs and outputs and technologies. Cassava area and cassava yields were elicited through recall questions where farmers estimated performance before and after the project. Household theory served as the general conceptual framework to measure impacts of technology adoption and knowledge. A household utility function with a multi-product production function including commodity and non-commodity outputs was formulated. Knowledge was included as a stock resource to be enhanced by project participation.

73
Model estimation was only possible in a reduced form as the parameters of the equations are not directly observable. As a proxy for knowledge, a participation dummy was used. In the first equation of the 3 stage model, factors that determine participation are estimated. Second, the impact of participation and other factors on adoption of project technologies was estimated. Finally, the impact of participation and technology adoption on cassava areas and yields was estimated. 2.1.3 Current situation and progress in 2005 During 2005, the analysis was finalized. Following is a summary of results. Adoption and outcome Analysis of adoption showed that the overall level of adoption is high for varieties and fertilizer but is lower for soil conservation practices including intercropping. For conservation practices, differences between participants and non-participants are more pronounced than for varieties and fertilizer. Adoption levels differ between Thailand and Vietnam with the latter having lower levels of adoption. For example only about half of the project participants in Vietnam adopt improved varieties while virtually all project participants in Thailand planted improved varieties. Results of the impact analysis using simultaneous equations systems showed that the cassava technologies themselves and knowledge as measured by project participation significantly affected behavioral (management) and productivity variables. In short the following outcomes can be summarized:
• Adoption of improved cassava varieties significantly contributed to expansion of cassava area and increased cassava yields
• Adoption of hedgerows positively affected cassava yields, though adoption of other soil conservation practices did not.
• Project participation had a significant effect on yield indicating that participation in technology development and testing may improve managerial capacity and knowledge can lead to more effective use of cassava technology although the true relationship remains in a black box.
• Yield gains were significantly higher in Vietnam as compared to Thailand • Farmers with larger cassava areas tended to expand less than farmers with smaller
areas • Adoption of the contour ridging technology led to lower areas expansions both for
cassava and total farm land area • Female household heads tended to expand area more than male • There were significant positive spill over effects from participants to non
participants in project villages
74
Welfare Analysis and Rate of return Costs included R&D costs of CIAT and the NARS as well as farmers� costs of technology adoption including investment, variable material costs and labor. The total R&D and adoption costs of over the ten-year period from 1994 to 2003 were $ 3.96 million. Costs were spread equally over the ten-year life span of the project. The project benefits were derived from the total yield effects as estimated in the simultaneous equation system aggregating the technology and knowledge effects and weighted with adoption rates at village level. The resulting shift in cassava output was then valued at domestic market prices for the year 2003. To estimate the cumulative benefits over the ten-year project period the usual logistic adoption curve was used assuming that annual benefits are a fraction of the 2003 figure equivalent to the number of farmers trained by year. Based on these data the internal rate of return (IRR) was calculated at 41.2 %. Various scenario analyses revealed that the rate of return of the R&D investment was indeed a safe bet considering that the most conservative scenarios still yielded an IRR of 20 %. Since the IRR does not include the environmental benefits from the abatement of soil degradation, which is attributable to the project, the calculated IRR is most likely an underestimate. 2.1.4 Objectives for 2005 Publication as journal article or book chapter. 2.1.5 Outputs Working documents Dalton T; Lilja N; Johnson N; Howeler R. (2005). Impact of Participatory Natural Resource Management Researhc in Cassava-Based Cropping Systems in Vietnam and Thailand. Cali, Colombia, 27p. (Working Document # 23, revised). Presentations Dalton T; Lilja N; Johnson N; Howeler R. Human Capital Accumulation and Productivity Improvements in Asian Cassava Systems: Are Participatory Research Approaches Beneficial? 24p. A selected paper presented at the American Agricultural Economics Association meeting in Providence, Rhode Island, USA, July 24-27, 2005. Dalton T; Lilja N; Johnson N; Howeler R. (2005). Impact of Participatory Natural Resource Management Researhc in Cassava-Based Cropping Systems in Vietnam and Thailand. A paper presented at the joint meeting of the Integrated Natural Resource Mangement Group (INRM) and CGIAR Standing Panel on Impact Assessment (SPIA) at the International Rice Research Institute (IIRI) in Los Banos, Philippines, June 13-19, 2005.
75
Dalton T; Lilja N; Johnson N; Howeler R. (2005). Impacto de la Investigación sobre el Manejo de los Recursos Naturales para Sistemas de Cultivo Basados en Yuca, Utilizando un Enfoque Participativo en Vietnam y Tailandia" CIAT Seminar Series, 16 Noviembre 2005 2.1.6 Collaborators Reinhardt Howeler, CIAT Asia Nina Lilja, PRGA Timothy Dalton, University of Maine Tim Purcell, consultant, Agrifood Consulting International This research was financed in part by PRGA, the Nippon Foundation and the CGIAR Standing Panel on Impact Assessment
76
2.2 Adopción de Nuevas Tecnologías de Conservación de los Suelos en los Llanos de Colombia: Tecnologías de Construcción de Capa Arable
By: L. Rivas y D. L. Molina 2.2.1 Introducción y objetivos El Proyecto de Suelos del CIAT en colaboración con Corpoica y otras instituciones nacionales y contando con el apoyo financiero del gobierno nacional a través del Convenio de Cooperación Técnica MADR � CIAT, ha trabajado durante varios años en el diseño de nuevas tecnologías de uso y manejo de los suelos en la Altillanura colombiana, con el propósito de impulsar en esa región de Colombia, un desarrollo productivo eficiente y con alto impacto económico, social y ambiental. Dada la pobreza de los suelos de la Altillanura y su susceptibilidad a la degradación, el trabajo científico realizado muestra que para cumplir con el objetivo propuesto, es necesario aplicar una estrategia integral de uso y manejo del suelo, que permita un mejoramiento físico, químico y biológico del mismo. La construcción de capas arables a partir de prácticas de labranza vertical con cinceles, aplicación de cal y uso de germoplasma de pastos y de cultivos, adaptado y con amplio desarrollo radicular, permite la implementación, de sistemas agropecuarios más intensivos y diversificados, al tiempo que se conserva y mejora la base de recursos de tierras. La investigación en fincas y los estudios de impacto económico ex � ante, a escala micro y de región, documentan el alto potencial productivo y económico de nuevos paradigmas de producción, basados en componentes agrícolas, ganaderos y forestales, ya que propician un mejoramiento progresivo del suelo, de la productividad y de la rentabilidad. (Rivas L., 2004; Rivas et. al, 2004; Rivas, et al, 2005) Luego de una fase de divulgación, entre técnicos y productores, de las nuevas prácticas agrícolas desarrolladas, se observa un incipiente proceso de adopción a escala de finca comercial de esas tecnologías, por lo cual en 2004 se inició el monitoreo de su adopción en la zona de Puerto López � Puerto Gaitán, labor que se continuó durante 2005. Se espera que a medida que se consolide este proceso de adopción, se llegue a la utilización en gran escala de prácticas de labranza aún más conservacionistas, como la labranza reducida o la labranza cero, previa una fase de construcción de capas arables en los suelos de la Altillanura. Como se anotó, la adopción de estas tecnologías, se encuentran aún en su etapa primaria, o adopción temprana, en la cual los productores ensayan las técnicas, para conocer su manejo y resultados y efectuar los ajustes necesarios, para adaptarlas a sus condiciones particulares.

77
Este estudio busca conocer y entender la dinámica de la adopción de las tecnologías propuestas, identificar las condiciones que facilitan su adopción y los factores limitantes que frenan su empleo. Se considera que ésta información crítica, es de particular relevancia para investigadores y diseñadores de políticas, ya que ayuda a la implementación de planes y acciones efectivas, que impulsen el uso en mayor escala de los nuevos desarrollos tecnológicos. 2.2.2 Metodología El trabajo se basa en sondeos rápidos en las fincas de la región, a través de entrevistas semi-estructuradas con productores, investigadores, extensionistas e interlocutores calificados involucrados en los procesos de desarrollo de la Altillanura. En 2005 se visitaron nuevamente las fincas monitoreadas el año pasado, incluyendo agricultores adoptadores y no adoptadores de las tecnologías propuestas. Se pretende conocer las tendencias generales del desarrollo de la región de interés (Puerto López � Puerto Gaitán) y la evolución y perspectivas del empleo de las nuevas tecnologías que, como ya se anotó, están basadas en rotaciones de pastos y de cultivos. Este estudio es un esfuerzo conjunto de los Proyectos de Evaluación de Impacto y de Suelos del CIAT. El sondeo del presente año incluyó 15 entrevistas en el área de referencia. El uso de gran cantidad de tiempo en movilización por las grandes distancias entre fincas, el mal estado de las vías, las lluvias y en oportunidades la ausencia de los productores, limitaron el número de entrevistas. Los sondeos incluyen entrevistas a los productores en las fincas, observación de los lotes, las labores de siembra y en algunos casos las de cosecha. Adicionalmente, se efectuaron entrevistas informales con interlocutores calificados que trabajan en la zona, como investigadores, asistentes técnicos, proveedores de insumos y de servicios técnicos. También se revisó información secundaria, para complementar la obtenida en el campo. Dado que el proceso de adopción y difusión de éstas tecnologías es incipiente, se considera que aún no es conveniente ni necesario, efectuar grandes muestreos al azar en una zona muy extensa, con más de un millón de hectáreas, ya que resultaría costoso en tiempo y esfuerzo. El propósito es observar y entender comportamientos e identificar ventajas y cuellos de botella en el proceso de cambio técnico. En esta fase no se pretende calcular ni hacer inferencia estadística sobre los parámetros de la adopción. Cuando el proceso se encuentre en fases más avanzadas, es necesaria la estimación con mayor rigor estadístico de los parámetros de la adopción: � tasas de adopción, cambios en productividad, área total afectada � que son los datos básicos para la posterior evaluación del impacto socio económico ex � post.
78
2.2.3 Resultados en 2005 El Cuadro 1 consolida los resultados del sondeo en los años 2004 y 2005, los que confirman que el proceso de adopción se encuentra en su fase temprana. La mayoría de los entrevistados poseen tierra propia (80%) y son quienes más interés muestran por mejorar la calidad de los suelos. Unos pocos productores alquilan tierras para cultivos, con contratos a 2 �3 años, sin embargo aún bajo éstas condiciones, ellos también tienen interés en el mejoramiento de los suelos, a través de rotaciones de cultivos y efectuando prácticas de labranza conservacionista, ya que de no hacerlo, los rendimientos agrícolas y su rentabilidad resultarían muy bajos. El grupo de productores entrevistado incluye a todos los estratos de tamaño: grandes pequeños y medianos. La finca promedio se sitúa alrededor de 800-1200 has, con valores extremos de 100 y 5000 hectáreas. En general, se trata de explotaciones con tradición ganadera, que utilizan parte de la tierra disponible para establecer rotaciones de cultivos, mejorar los suelos y finalmente establecer pasturas de mejor calidad forrajera que las tradicionales. Las superficies cultivadas representan una fracción que está alrededor del 25 �27% del área total de la finca. En 2004 la expectativa de los productores era la ampliación de las áreas bajo cultivo a mediano y largo plazo. En 2005 el optimismo decayó notoriamente y piensan mantener estables o reducir las áreas cultivadas. En casos puntuales, se inclinan por eliminar por completo la agricultura de sus planes de producción, argumentando problemas de comercialización, escasez de maquinaria y dificultades de transporte y de vías. Los factores que determinan esta situación, en su mayoría son independientes a la tecnología y están fuera del control de los productores. La Figura 1 representa un árbol de los problemas que limitan seriamente el uso de tecnologías conservacionistas en los Llanos colombianos. Las causas de la lenta dinámica de la adopción se pueden categorizar en cuatro grupos: 1) Factores de mercado. 2) Aspectos de infraestructura vial y de transporte. 3) Maquinaria, equipos y 4) Asistencia técnica. (Figura 1) Los factores de mercado se relacionan con imperfecciones y falta de transparencia en los mercados de granos (arroz, soya, maíz) La existencia de estructuras monosonísticas, conformadas por unos cuantos compradores con muy alto poder de negociación, que les permite establecer condiciones de calidad y de compra, de acuerdo con las fluctuaciones de la oferta de granos. Esta situación genera gran variabilidad de los precios al productor, lo cual dificulta la implementación de las rotaciones de cultivos más apropiadas, desde el punto de vista técnico. Aparte de las fluctuaciones de precios, eventualmente se presentan dificultades para comercializar los productos. Este tema es especialmente crítico en el caso del denominado �arroz de sabana�, que corresponde a los cultivos de la Altillanura, que son castigados en precio y eventualmente enfrentan dificultades para su venta, argumentando supuesta calidad inferior, en relación con el cereal producido en el Piedemonte.
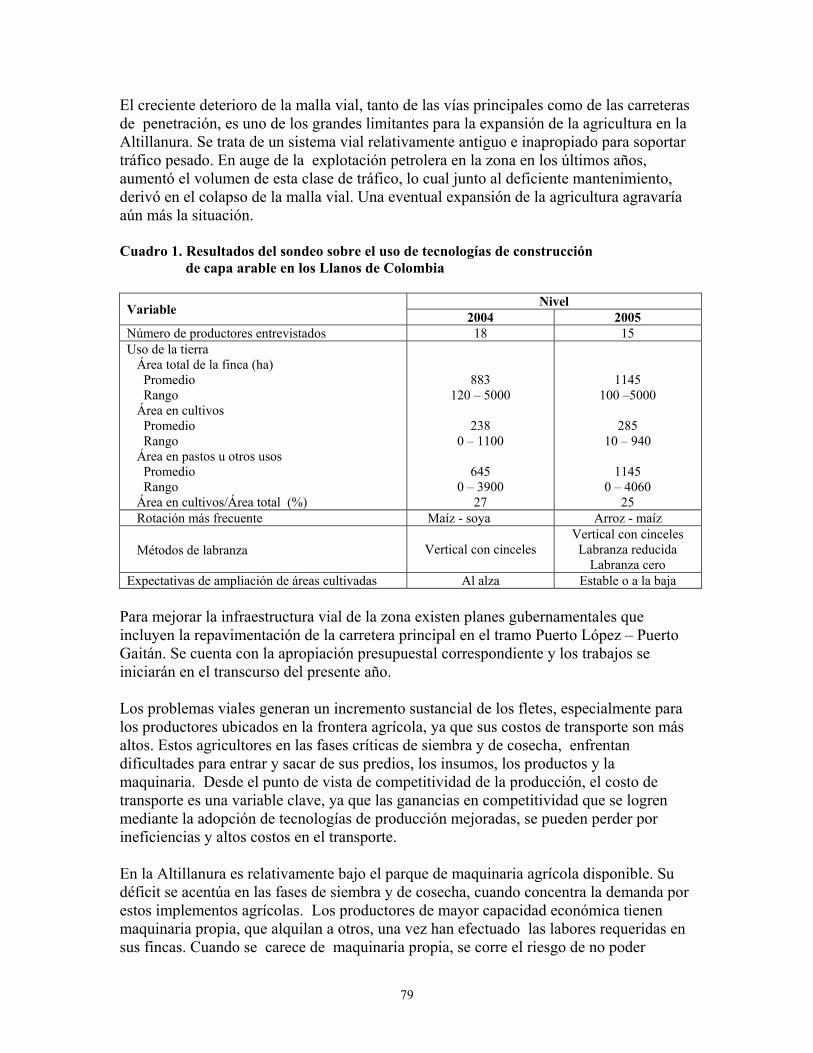
79
El creciente deterioro de la malla vial, tanto de las vías principales como de las carreteras de penetración, es uno de los grandes limitantes para la expansión de la agricultura en la Altillanura. Se trata de un sistema vial relativamente antiguo e inapropiado para soportar tráfico pesado. En auge de la explotación petrolera en la zona en los últimos años, aumentó el volumen de esta clase de tráfico, lo cual junto al deficiente mantenimiento, derivó en el colapso de la malla vial. Una eventual expansión de la agricultura agravaría aún más la situación. Cuadro 1. Resultados del sondeo sobre el uso de tecnologías de construcción de capa arable en los Llanos de Colombia
Para mejorar la infraestructura vial de la zona existen planes gubernamentales que incluyen la repavimentación de la carretera principal en el tramo Puerto López � Puerto Gaitán. Se cuenta con la apropiación presupuestal correspondiente y los trabajos se iniciarán en el transcurso del presente año. Los problemas viales generan un incremento sustancial de los fletes, especialmente para los productores ubicados en la frontera agrícola, ya que sus costos de transporte son más altos. Estos agricultores en las fases críticas de siembra y de cosecha, enfrentan dificultades para entrar y sacar de sus predios, los insumos, los productos y la maquinaria. Desde el punto de vista de competitividad de la producción, el costo de transporte es una variable clave, ya que las ganancias en competitividad que se logren mediante la adopción de tecnologías de producción mejoradas, se pueden perder por ineficiencias y altos costos en el transporte. En la Altillanura es relativamente bajo el parque de maquinaria agrícola disponible. Su déficit se acentúa en las fases de siembra y de cosecha, cuando concentra la demanda por estos implementos agrícolas. Los productores de mayor capacidad económica tienen maquinaria propia, que alquilan a otros, una vez han efectuado las labores requeridas en sus fincas. Cuando se carece de maquinaria propia, se corre el riesgo de no poder
Nivel Variable 2004 2005 Número de productores entrevistados 18 15 Uso de la tierra Área total de la finca (ha) Promedio Rango Área en cultivos Promedio Rango Área en pastos u otros usos Promedio Rango Área en cultivos/Área total (%)
883 120 � 5000
238
0 � 1100
645 0 � 3900
27
1145 100 �5000
285
10 � 940
1145 0 � 4060
25 Rotación más frecuente Maíz - soya Arroz - maíz
Métodos de labranza
Vertical con cinceles Vertical con cinceles Labranza reducida
Labranza cero Expectativas de ampliación de áreas cultivadas Al alza Estable o a la baja

80
obtenerla alquilada, dentro de los períodos de siembra o de cosecha, lo cual reduce los rendimientos e incrementa el riesgo de la agricultura. Se observan casos en los cuales se preparan los lotes y no se puede sembrar en los períodos adecuados por falta de equipos de siembra. En otros casos se cosecha a destiempo por falta de combinadas. El tema de la maquinaria es de particular importancia para agricultores de pequeña y mediana escala, ubicados en las áreas más marginales y/o con problemas de acceso, por las malas condiciones viales. Algunos productores plantearon también dificultades para el abastecimiento de insumos críticos tales como la cal dolomítica, que no se produce dentro de la región, y de semillas de variedades mejoradas de pastos y de cultivos. En la Altillanura se está empleando masivamente el arroz Línea 30, desarrollado por el CIAT, que aún no ha sido liberado como variedad. Dado que no se cuenta con semilla básica, se emplea semilla de costal y se puede apreciar que ya están apareciendo enfermedades en algunos lotes. Los técnicos no han identificado plenamente estos problemas fitosanitarios. Uno de los síntomas más generalizados es la elevada proporción de granos no llenados (vanos), lo que reduce significativamente los rendimientos. La expansión de las áreas cultivadas comienza a generar problemas sanitarios nuevos en la región. En soya apareció la roya, que puede reducir dramáticamente su productividad. El rendimiento esperado, 2.5 tm/ha, puede caer a 0.6 �1.5 tm/ha. Dado que es un problema nuevo, los productores han tenido dificultades para su diagnóstico y control y algunos de ellos han incrementado considerablemente sus gastos en defensivos químicos. No se sabe si ésta última estrategia sea costo-efectiva, dado que no se basa en criterios técnicos que determinen los productos a utilizar y el número óptimo de aplicaciones. Los problemas de la agricultura en la Altillanura tienen múltiples manifestaciones. Primero, la elevada inestabilidad de los precios de productos e insumos, que junto con un marco de políticas de desarrollo de la región, que a juicio de los productores es ambiguo e inestable, genera incertidumbres que dificultan la planificación de largo plazo y la implementación de estrategias de conservación y mejoramiento de los suelos. En el momento, las negociaciones del tratado de libre comercio (TLC) con los Estados Unidos, han acentuado las dudas, ya que los productores temen posibles impactos negativos sobre el agro nacional. Segundo, las siembras y cosechas fuera de la época apropiada, resultan en cuantiosas pérdidas en productividad, competitividad y rentabilidad. Tercero, los altos fletes de precios e insumos, elevan considerablemente los costos de producción, deteriorando la competitividad y el atractivo económico de hacer agricultura en esta región del país. Cuarto, es necesario un apoyo técnico efectivo, que ayude a controlar los problemas nuevos de plagas y enfermedades, que aporte germoplasma mejorado de pastos y de cultivos para elevar la productividad y competitividad de la producción.
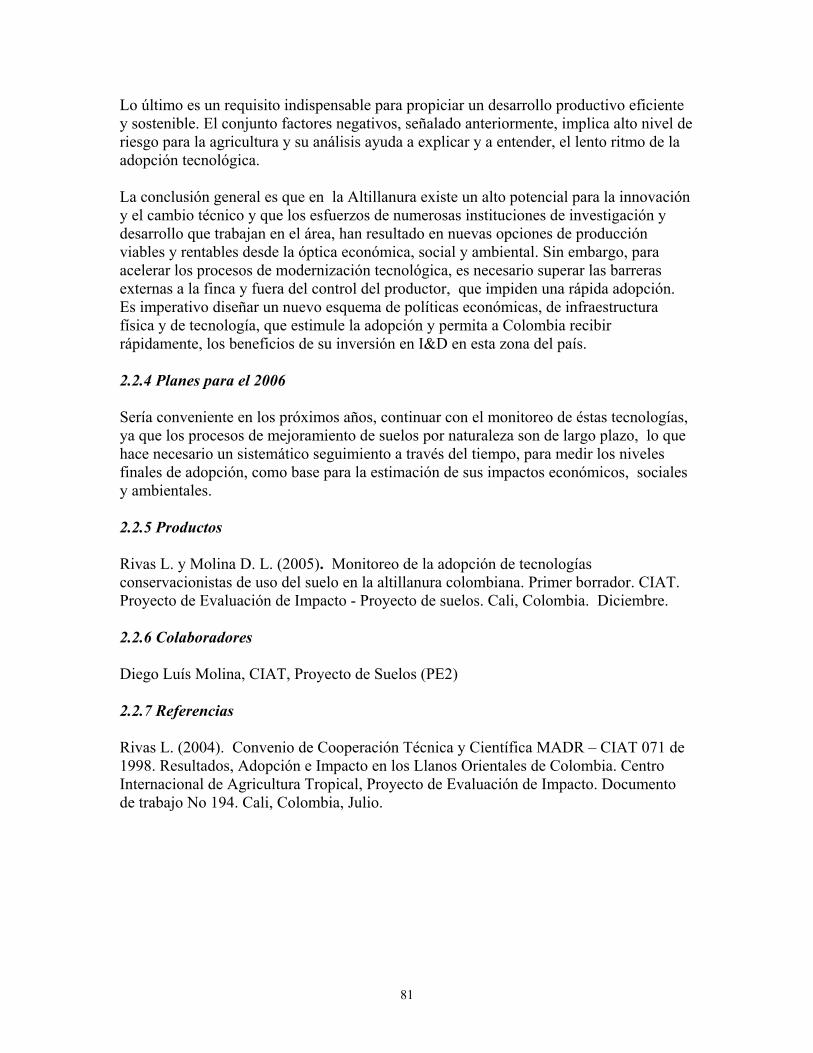
81
Lo último es un requisito indispensable para propiciar un desarrollo productivo eficiente y sostenible. El conjunto factores negativos, señalado anteriormente, implica alto nivel de riesgo para la agricultura y su análisis ayuda a explicar y a entender, el lento ritmo de la adopción tecnológica. La conclusión general es que en la Altillanura existe un alto potencial para la innovación y el cambio técnico y que los esfuerzos de numerosas instituciones de investigación y desarrollo que trabajan en el área, han resultado en nuevas opciones de producción viables y rentables desde la óptica económica, social y ambiental. Sin embargo, para acelerar los procesos de modernización tecnológica, es necesario superar las barreras externas a la finca y fuera del control del productor, que impiden una rápida adopción. Es imperativo diseñar un nuevo esquema de políticas económicas, de infraestructura física y de tecnología, que estimule la adopción y permita a Colombia recibir rápidamente, los beneficios de su inversión en I&D en esta zona del país. 2.2.4 Planes para el 2006 Sería conveniente en los próximos años, continuar con el monitoreo de éstas tecnologías, ya que los procesos de mejoramiento de suelos por naturaleza son de largo plazo, lo que hace necesario un sistemático seguimiento a través del tiempo, para medir los niveles finales de adopción, como base para la estimación de sus impactos económicos, sociales y ambientales. 2.2.5 Productos Rivas L. y Molina D. L. (2005). Monitoreo de la adopción de tecnologías conservacionistas de uso del suelo en la altillanura colombiana. Primer borrador. CIAT. Proyecto de Evaluación de Impacto - Proyecto de suelos. Cali, Colombia. Diciembre. 2.2.6 Colaboradores Diego Luís Molina, CIAT, Proyecto de Suelos (PE2) 2.2.7 Referencias Rivas L. (2004). Convenio de Cooperación Técnica y Científica MADR � CIAT 071 de 1998. Resultados, Adopción e Impacto en los Llanos Orientales de Colombia. Centro Internacional de Agricultura Tropical, Proyecto de Evaluación de Impacto. Documento de trabajo No 194. Cali, Colombia, Julio.
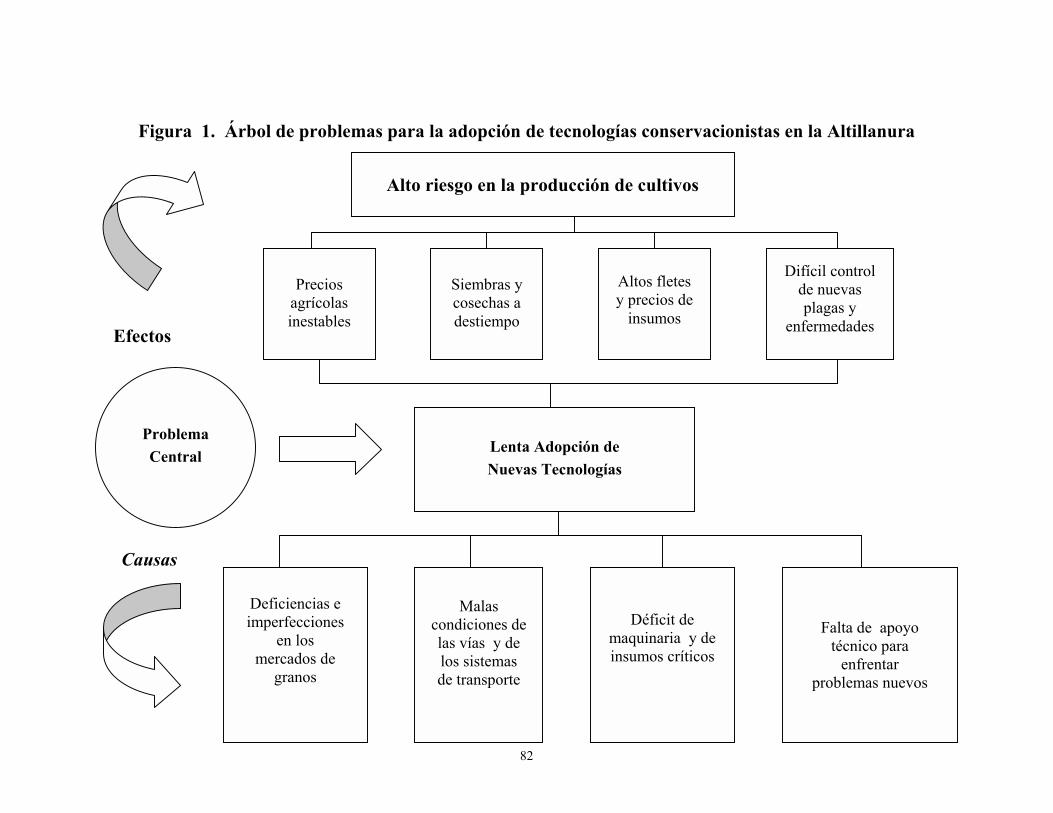
82
Figura 1. Árbol de problemas para la adopción de tecnologías conservacionistas en la Altillanura
Deficiencias e imperfecciones
en los mercados de
granos
Causas
Malas condiciones delas vías y de los sistemas de transporte
Déficit de maquinaria y de insumos críticos
Falta de apoyo técnico para
enfrentar problemas nuevos
Lenta Adopción de Nuevas Tecnologías
Problema Central
Efectos
Altos fletes y precios de
insumos
Difícil control de nuevas plagas y
enfermedades
Alto riesgo en la producción de cultivos
Precios
agrícolas inestables
Siembras y cosechas a destiempo
83
OUTPUT 3: 3.1 The Challenges of Inclusive Cross-Scale Collective Action In Watersheds: A Conceptual Framework For Research And Development
By: Brent Swallow, Nancy Johnson, Ruth Meinzen-Dick, and Anna Knox 3.1.1 Objective The objective of this work is to lay out a framework for understanding the relationships between water and poverty at multiples scales in watersheds. The existence of hydrological externalities in watersheds implies that people may be better off if they coordinate their land and water management decisions to minimize unintended negative impacts. Since opportunities for collective action around water occur at multiple scales simultaneously, coordination at a higher scale may also be necessary. The ability of the poor to participate effectively in collective processes is likely to vary depending on the scale. At different scales, the rules of engagement and the resources (human, financial, natural, social) that confer power are likely to be different. The conceptual framework was developed to help clarify how water, collective action, poverty and scale interact in watershed, and help researchers and practitioners design watershed interventions that are effective, sustainable, and pro-poor. 3.1.2 Methods The framework draws mainly on economic and political theory, and incorporates some basic concepts from hydrology. 3.1.3 Current situation and Progress in 2005 Work on this framework began in 2002 as part of the development of the conceptual framework for the Water and People in Catchments� research theme of the CGIAR Challenge Program for Water and Food, and was expanded under one of the CPWF-funded research projects (Sustaining Collective Action across Ecological and Economic Scales in Watersheds, PN20). Figure 1 presents a conceptual model of multiscale interactions in upper watersheds. Loosely following Molden et al. (2001), the watershed is divided into five hydronomic zones: headwater ecosystems, uplands, midlands, lowlands and lowland ecosystem. It is assumed that people live, interact and earn livelihoods in three of the zones� the upland, midland and lowland. The other two zones are ecosystems that affect and are affected by water use in the other zones. Each of the human-dominated zones is described as a primary node, and each node is a locus of individual and collective actions that produces outcomes defined in terms of human welfare and modifications to water resources flowing to lower zones. Within each node, the interaction of technologies (including water storage), water, action resources (defined below) and institutions determines the combination of livelihood strategies pursued by individuals and households. An
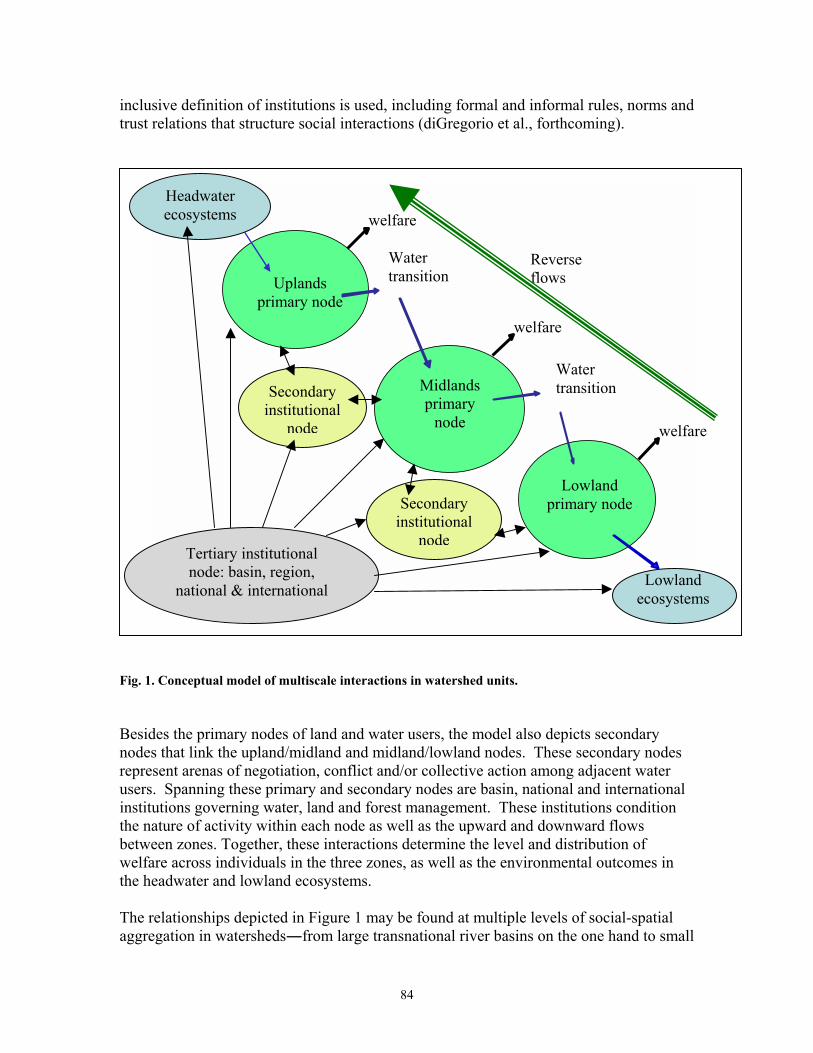
84
inclusive definition of institutions is used, including formal and informal rules, norms and trust relations that structure social interactions (diGregorio et al., forthcoming).
Fig. 1. Conceptual model of multiscale interactions in watershed units. Besides the primary nodes of land and water users, the model also depicts secondary nodes that link the upland/midland and midland/lowland nodes. These secondary nodes represent arenas of negotiation, conflict and/or collective action among adjacent water users. Spanning these primary and secondary nodes are basin, national and international institutions governing water, land and forest management. These institutions condition the nature of activity within each node as well as the upward and downward flows between zones. Together, these interactions determine the level and distribution of welfare across individuals in the three zones, as well as the environmental outcomes in the headwater and lowland ecosystems. The relationships depicted in Figure 1 may be found at multiple levels of social-spatial aggregation in watersheds―from large transnational river basins on the one hand to small
Uplands
primary node
Midlands primary
node
Water transition
welfare
Lowland primary node
Headwater ecosystems
welfare
welfare
Lowland ecosystems
Reverse flows
Secondary institutional
node
Secondaryinstitutional
node
Tertiary institutional node: basin, region,
national & international
Water transition

85
subcatchments on the other. Direct interactions are likely to be more important in the catchments of first order streams and smaller basins, while secondary and tertiary nodes are likely to be more important in the basins of higher order streams. Larger watersheds are likely to be comprised of a nested hierarchy of overland flow areas, first order stream catchments and higher order stream catchments. Through the lens of this conceptual framework, basins for higher order streams can also be thought of as comprising multiple watershed units that overlap in midland and/or lowland primary nodes. The way that water is managed by individuals and groups in a given zone�defined as the deliberate manipulation of quantity, quality and timing of water�directly affects welfare in that zone. Water management within a zone also influences livelihood options in lower zones indirectly through its affect on water �transitions,� defined as changes in the quantity, quality or timing of water flows between hydronomic zones/nodes. Water transitions depend on water use and the biophysical characteristics of the catchments, as well as on technology and management practices of people in upland nodes. Sources, sinks, lateral flows and filters are watershed components that may be small in terms of area but that have a disproportionate impact on water transitions (Van Noordwijk et al., 1998; Swallow et al., 2001). The water transition from an upper to a lower node may have impacts on downstream water users, which may be considered positive (positive externalities) or negative (negative externalities) by downstream users. Individuals, groups and public agencies representing the interests of downstream residents may then take action to try to reduce or mitigate some types of water transitions or increase others. For example, downstream residents can negotiate directly with upstream residents to change their actions or make investments in upstream areas that affect the way land and water are used. Alternatively they can pressure the government to change land or water use regulations, or to invest in water-management infrastructure upstream. These actions on the part of downstream residents in response to water transitions can, in a sense, reverse some of the impacts of flows back upstream. These reverse flows can take a variety of forms, involving economic, social or political resources. Direct flows can range from cooperation and negotiation among upstream and downstream stakeholders to conflict and use of force. Reverse flows can also be mediated by some public agency as in the case of regulations, subsidies, taxes or public investments in water infrastructure. Analyzing individual and collective action in a watershed context Water transitions and reverse flows reflect the outcomes, intentional or not, of individual and collective decisions. Therefore, understanding the factors that shape those decisions is fundamental for watershed management. Any decision takes place in an action arena�a socially defined space composed of actors, action resources, institutions and actions (diGregorio et al., forthcoming; Ostrom, forthcoming). A hydronomic zone may constitute an action arena, but there are many other action arenas in which decisions are made that are relevant to the water transitions and reverse flows in the watershed, ranging from a farmer�s field to a government ministry. Action arenas may correspond loosely to hydrological scales, but are likely to overlap. Figure 2 presents a graphic depiction of the
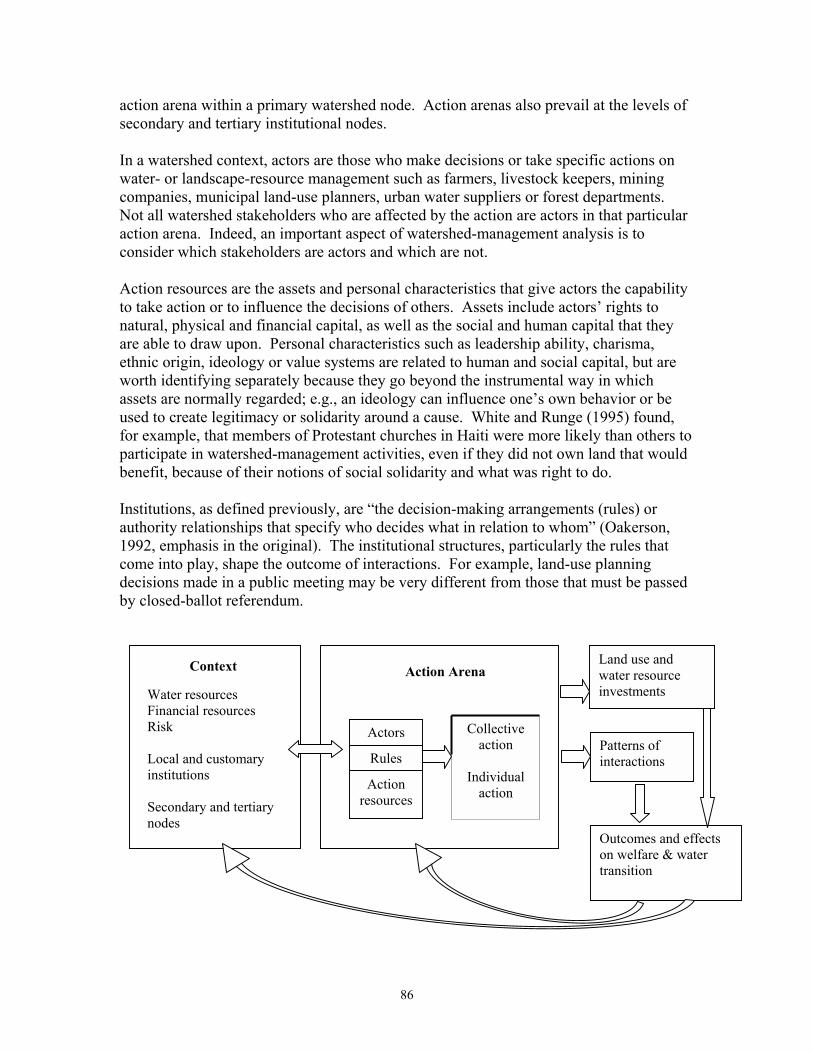
86
action arena within a primary watershed node. Action arenas also prevail at the levels of secondary and tertiary institutional nodes. In a watershed context, actors are those who make decisions or take specific actions on water- or landscape-resource management such as farmers, livestock keepers, mining companies, municipal land-use planners, urban water suppliers or forest departments. Not all watershed stakeholders who are affected by the action are actors in that particular action arena. Indeed, an important aspect of watershed-management analysis is to consider which stakeholders are actors and which are not. Action resources are the assets and personal characteristics that give actors the capability to take action or to influence the decisions of others. Assets include actors� rights to natural, physical and financial capital, as well as the social and human capital that they are able to draw upon. Personal characteristics such as leadership ability, charisma, ethnic origin, ideology or value systems are related to human and social capital, but are worth identifying separately because they go beyond the instrumental way in which assets are normally regarded; e.g., an ideology can influence one�s own behavior or be used to create legitimacy or solidarity around a cause. White and Runge (1995) found, for example, that members of Protestant churches in Haiti were more likely than others to participate in watershed-management activities, even if they did not own land that would benefit, because of their notions of social solidarity and what was right to do. Institutions, as defined previously, are �the decision-making arrangements (rules) or authority relationships that specify who decides what in relation to whom� (Oakerson, 1992, emphasis in the original). The institutional structures, particularly the rules that come into play, shape the outcome of interactions. For example, land-use planning decisions made in a public meeting may be very different from those that must be passed by closed-ballot referendum.
Collective action
Individual
action
Action Arena Context
Patterns of interactions Rules
Outcomes and effects on welfare & water transition
Action resources
Actors
Water resources Financial resources Risk Local and customary institutions Secondary and tertiary nodes
Land use and water resource investments
87
Fig. 2. Actors, action resources, collective action and outcomes in a watershed unit. Poverty and inclusion in a watershed context While not directly addressing poverty, the framework described above has implications for what it means to be poor. One aspect of poverty is clearly the lack of action resources, not only the tangible resources such as land and other physical assets but also the less tangible human or social capacities that are particularly important for effective engagement with other actors in collective action. Exclusion from a particular action arena may also limit one�s ability to exert influence over one�s own destiny and hence would constitute the powerlessness dimension of poverty. The institutional arrangements that govern interactions within action arenas also favor certain action resources over others. In examining the institutional framework governing watershed interactions within each node, it is essential to consider what kinds of action resources are likely to be valuable at each scale, who has or does not have those resources, and the likely consequences for the outcomes of the decision-making and implementation. In particular, do poor people, women or other marginalized groups have those resources? We may hypothesize that at local levels, experiential knowledge of hydrologic processes and customary or local law will be more important as an action resource than for higher level interaction, in which scientific knowledge and statutory law hold greater influence. The latter is likely to favor those with more formal education and knowledge of outside systems, including government processes. We might hypothesize that within a community, negotiations over rules governing land and water use or other forms of collective action could draw upon a wide range of local knowledge and custom, as well as shared religious principles, organizational rules or bylaws that are developed, and any state regulations of which local people are aware. This provides a wide institutional repertoire. As negotiations move to higher levels, spanning communities that do not share common customs, there is likely to be less scope for reference to customary rules and more reliance on those established by the state or even by international bodies in the case of international negotiations. The overlapping nature of different action arenas means that well-connected actors have the opportunity to �forum-shop�; that is, to select the arena that they feel is mostly likely to provide them with a favorable outcome. Which resources are valuable in which arenas are likely to be historically mediated, depending on the extent of common ethnic or religious identity across sites. For example, in the Bhavani basin of South India, common caste identity was appealed to by upstream farmers when a farmers� organization downstream filed a legal petition to have more water released at the expense of upstream farmers� water rights. By contrast, even within a village, there may be little common identity in settlement schemes. Thus people in settlement schemes in Western Kenya would be more likely to default to the use of state rules, compared to people in former native reserves, who are more ethnically homogeneous.

88
IWRM approaches call for all stakeholders to participate and for their interests to be negotiated. In practice, however, there may be many obstacles constraining participation by poor and marginalized actors. For example, those who do the �inviting� in multistakeholder negotiations and other policy spaces have a considerable advantage in shaping their content and outcomes because they are able to set the agenda and rules (Brock et al., 2001). Locations and technology are equally important. The voices of poor interests are much more likely to emerge strongly in forums relying on facilitated discussion held in the community school as opposed to PowerPoint presentations in a conference room at the regional environmental authority. Whether intentional or not, plush office or hotel spaces, sophisticated communication technology and technical jargon are instruments that usually silence and exclude those with less education and exposure to the comforts of higher classes. Moreover, they embody a particular set of rules of engagement that are likely to be alien to those who do not live by them day in and day out (Brock et al., 2001). Makurira and Mugumo (forthcoming) describe how difficult it was for poor farmers to participate effectively in new participatory water-management institutions in Zimbabwe. The external resources that might have helped to redress historical imbalances in power have not been as freely available as hoped earlier. Mainstream participatory practices in development circles, including most participatory watershed-management initiatives, adopt a community-structured approach; but the notion of community as a grouping of shared common interests neatly circumscribed by geographic and administrative boundaries is deeply flawed. The different interests that clusters of people share, as well as their relative power to assert those interests, are critical to consider. This includes scrutinizing who is speaking on behalf of whom to assess whether these groups� interests are truly being represented. Efforts to promote greater equity will have to identify and prioritize the interests of those most marginalized by stronger interest groups in order to avoid inadvertently sidelining them further. Knowledge and information are important resources that shape people�s participation in watershed institutions and negotiation processes. Information about the laws and rights that govern them, even about those designed to benefit them, usually fails to reach the poor. True equality is not feasible if poor people lack knowledge about their rights and legal avenues for defending them, as well as their rights and procedures for demanding public accountability. Furthermore, in confronting issues embedded in a biophysically and socially complex environment like a watershed, poor people will also need to possess sound knowledge of environmental change and cause-and-effect relations. Assuming poor people choose to participate in negotiation forums, they will have to comprehend the interests and perspectives of other social and political actors, as well as the underlying factors that motivate such interests. In addition, they will need to become practiced communicators and negotiators and possess savvy about the rules and ruses of the political game, including those that perpetuate their exclusion. Edmunds and Wollenberg (2001) stress that the formation of strategic approaches and alliances are critical for poor people to contest the status quo effectively in multistakeholder platforms, arguing that consensus-seeking approaches are likely to disadvantage poor people further. Negotiation also requires a high degree of participation and collaboration among interest

89
groups, as well as trust in one�s representatives. Moreover, if platforms are to be pro-poor, other participants must acknowledge the legitimacy of the (typically experiential) knowledge of poor watershed residents, rather than only admitting that which is claimed to be scientifically proven or knowledge that comes from the mouths and pens of the educated. Balancing out knowledge and information differences in the watershed context is complicated by the fact that knowledge about watershed function often differs significantly among stakeholders. Farmers and other land and water users who reside in a watershed tend to have knowledge of cause-effect processes at the local level; these differ across the various resource users who reside in the watershed. Policymakers tend to have more categorical knowledge systems compatible with the enforcement of laws and rules. An example of categorical knowledge is that forests preserve watershed function, while agriculture disturbs watershed function. In reality, however, much of the categorical knowledge that underlies watershed policy is more myth than reality. Several authors have recently written about the persistence and misuse of watershed myths�stylized facts about water, land and forestry relations that have been repeatedly used to justify all kinds of discrimination and misguided investments. In fact, the relationships among water, trees and land use tend to rely upon highly variable soil and climatic conditions (van Noordwijk et al., forthcoming). Cross-scale linkages among water, watershed management and poverty According to Grey and Sadoff (2002), water management in Africa is a classic case of a dynamic poverty trap; while Barrett and Swallow (2005; forthcoming) propose that water management in a watershed context may be a prime example of what they call a �fractal poverty trap.� The conceptual framework presented in Section 2 clarifies the way that this may occur and the approaches that can be taken to avoid the constraints associated with this situation. Grey and Sadoff (2002) lay out the general case for the existence of water-poverty traps in Africa. The challenges begin with the nature of water resources. Africa�s water resources are high risk: They are highly variable in time and space, and most of the important river basins cut across national boundaries, thus being subject to numerous political and institutional risks. This variability and difficult institutional environment reduce returns and increase costs associated with water investment. Poor credit facilities and low self-financing capacity further constrain investments in water. Low investment then translates into low water-storage capacity and poor water-supply infrastructure. Overall, the result is water supplies that are high cost, poor quality and variable in time and space. Poor water supplies in turn translate into limited production and ill health. Barrett and Swallow (2005; forthcoming) argue that poverty traps may result from key thresholds or �tipping points� in the relationships between effort, assets and returns. While investments below the threshold point perpetuate the vicious cycle described by Grey and Sadoff (2002), investments that surmount those thresholds may stimulate a virtuous cycle of higher water storage, higher returns to water use, lower environmental

90
risk and again higher investment. In other words, there may be a bifurcation in water-development pathways under relatively similar circumstances, with some areas caught in a trap of low water use, investment and return, while other areas escape that trap. Grey and Sadoff (2002) note, for example, the very different circumstances of water storage, agricultural production and investment risk that prevail in South Africa and Ethiopia. Poverty traps may be manifest at multiple scales, from individuals to communities to nations. Regarding water-poverty traps, there are thresholds associated with water-management infrastructure at the household level (e.g. the cost of metal roofs, eave troughs and storage tanks for rooftop catchment), at the community level (e.g. spring protection and pipes), subbasin and basin level (e.g. construction of dams, water-treatment facilities and irrigation canals). In terms of the conceptual framework presented above, there may be water-poverty traps within primary nodes in the lowlands, midlands and uplands. There may also be water-poverty traps at higher levels of social-spatial aggregation; e.g. at secondary or tertiary nodes. Water-poverty traps in secondary or tertiary nodes may, for example, hold when neighboring communities or basin-level watershed institutions are unable to resolve upstream-downstream conflicts, leading to investments with high risk of failure and thus under-investment. Poverty traps may also be fractal in nature. In other words, failure to surmount thresholds at one scale reduces returns to investments at other scales, while success at one scale increases return to investment at other scales. The conceptual framework illustrates how this occurs in a watershed context. Effective collective action in community-level water management can help individuals and households meet thresholds constraining individual production (e.g. household water taps used to irrigate tea seedlings) and at the subbasin level where communities interact (e.g. elected officials negotiating with up- and downstream communities to improve water quality). There is no single best approach to breaking out of these water-poverty traps. Investments in physical infrastructure and profitable water-use technologies can help to generate greater returns that can improve smallholder livelihoods and be reinvested in further capacity. Such investments could be subsidized by public resources or supported through favorable credit arrangements. Greater social and political stability can enhance returns, reduce risks and foster more effective and inclusive collective action. Collective action can thus be a solution to poverty traps. Conclusions and implications for supporting trans-scale collective action in watersheds The framework highlights the importance of fostering collective action at multiple scales, recognizing that there may be important negative or positive spillovers between scales. Different types of collective action emerge as important in a watershed context: collective investment in community water management, joint agreements to terrace on steep hillsides to reduce soil erosion, and mutual respect for and enforcement of rules for protecting riverine and wetland areas. Development efforts need to evaluate who is

91
included and excluded from different types of local collective action, as well as who appropriates the benefits and who bears the costs. In addition, it is important to consider how collective action within a particular node or action arena may facilitate or hamper collective action between that node and adjacent up- or downstream nodes. Some types of local water storage, for example, may be largely beneficial to downstream neighbors, while others may be largely detrimental. Similarly, local collective action may be a boost or bane to the goals of basin-level collective action. Most obviously, the leaders of local water-users� associations may be good local representatives for basin-scale dialogs and decision-making. Less obviously, groups able to mobilize effective local collective action and attend basin-scale meetings are likely to be relatively wealthy, already well-endowed with water resources and unrepresentative of the interests of the poor. Watershed development efforts and basin authorities need to go out of their way to identify, reach and empower the poor, including those without effective local organizations. This framework highlights the importance of lateral flows of water, soil and pollutants, as well as flows of political influence, economic power and conflict. In watersheds with the prototypical distribution of poor people in upland areas and more wealthy people in downstream areas, the flows of economic and political power may well balance the flows of water. Pro-poor, inclusive watershed development will generally need to give attention to empowering the upland poor and countering watershed myths that discriminate against them. In other watersheds, such as those around the water towers of East Africa, the lowland poor may have little recourse against wealthy upstream water users: Water and power flow in the same direction. Pro-poor-inclusive watershed development needs to enhance reverse flows, at least those of communication. Basin-level dialog that includes and empowers all relevant stakeholders may forestall or prevent more violent conflict. 3.1.4 Plans for 2006 Publish the conceptual framework, and test its usefulness empirically in the context of the Scales project. 3.1.5 Outputs Swallow, B., N. Johnson, R Meinzen-Dick and A Knox. (2005). The Challenges of Cross-Scale Collective Action in Watersheds, In review for special issue of Water International and as CAPRi working paper 3.1.6 Collaborators ICRAF, IFPRI/CAPRI, IDS Sussex, Theme 2 of the Challenge Program on Water and Food
92
3.1.7 References Ahluwalia, M. (1997). Representing communities: The case of a community-based watershed-management project in Rajasthan, India. IDS Bulletin, Institute of Development Studies, Sussex University, Brighton, UK, 28, 23-35. Barrett, C., Swallow, B. (2005). Dynamic poverty traps and rural livelihoods. In: Ellis, F., Ade Freeman, H. (Eds.), Rural Livelihoods and Poverty Reduction Policies. Routledge, London, pp. 16-28. Barrett, C., Swallow, B., forthcoming. Fractal poverty traps. World Dev. Biggs, S.V. (2001). Linking ecological scales and ecological frameworks for landscape rehabilitation. Ecol. Manage. Restor. 2(1), 28-35. Brock, K., Cornwall, A., Gaventa, J. (2001). Power, knowledge and political spaces in the framing of poverty policy. IDS Working Paper 143. Institute of Development Studies, Brighton, UK. Di Gregorio, M., Hagedorn, K., Kirk, M., Korf, B., McCarthy, N., Meinzen-Dick, R., Swallow, B., (forthcoming), The role of property rights and collective action for poverty reduction. In: Guha-Khasnobis, B., Kanbur, R., Ostrom, E. (Eds.), Policies for Linking the Informal and Formal Sectors. Oxford University Press, Oxford, UK. Edmunds, D., Wollenberg, E. (2003). Local forest management: The impacts of devolution policies. Earthscan Publications, London. Farrington, J., Turton, C., James, A.J. (2000). Participatory watershed development: Challenges for the Twenty-First century. Oxford India Paperbacks, New Delhi. Fox, P., Rockstrom, J., Barron, J. (2005). Risk analysis and economic viability of water harvesting for supplemental irrigation in semi-arid Burkina Faso and Kenya. Agric. Syst. 83, 231-250. Global Water Partnership (2000). Integrated water resources management. Global Water Partnership, Stockholm, Sweden. Grey, D., Sadoff, C. (2002). Water resources and poverty in Africa: Breaking the vicious circle. Paper presented at Inaugural Meeting of Africa Ministers Committee on Water, Abuja, Nigeria, 30 April 2002. url: www.thewaterpage.com/Documents/amcow_wb_speech.pdf. Hinchcliffe, F., Thompson, J., Pretty, J.N., Guijt, I., Shah, P. (Eds.). (1999). Fertile ground: The impacts of participatory watershed management. Intermediate Technology Publications Ltd., London.

93
Jodha, N.S. (1986). Common property resources and rural poor in dry regions of India. Economic and Political Weekly 21 (23), 1169-1181. Kerr, J.M. (2002). Watershed development, environmental services, and poverty alleviation in India. World Dev. 30(8), 1387-1400. Lam, W.F. (1998). Governing Irrigation Systems in Nepal: Institutions, Infrastructure, and Collective Action. ICS Press, Oakland, CA. Lant, C.L. (1999). Introduction: Human dimensions of watershed management. J. Am. Water Resour. Assoc. 35(3), 483-486. Makurira, H., Mugumo, M., forthcoming. Water sector reforms in Zimbabwe: The importance of policy and institutional coordination on implementation. In Swallow, B., Achouri, M., Tennyson, L., Okono, N. (Eds.), Proceedings Africa Regional Workshop on Preparing the Next Generation of Watershed Management Programmes, FAO Forestry Paper. Rome. Millenium Project and Swedish Water House (2005). Health, Dignity and Development: What will it Take? UN Millennium Project Task Force on Water and Sanitation, Final Report, abridged ed. Stockholm International Water Institute, Stockholm, Sweden and the United Nations Millenium Project, New York. Molden, D.J., Keller, J., Sakthivadivel, R. (2001). Hydronomic Zones for Developing Basin Water Conservation Strategies. Research Report 56. International Water Management Institute, Columbo, Sri Lanka. Moriarty, P., Butterworth J., van Koppen, B. (Eds.), (2004). Beyond Domestic: Case Studies on Poverty and Productive Uses of Water at The Household Level. Technical Paper Series 41. IRC (International Water and Sanitation Centre), Delft, the Netherlands. Oakerson, R.J. (1992). Analyzing the commons: A framework. In: Bromley, D.W. (Ed.), Making the Commons Work. Theory, Practice and Policy. ICS Press, San Francisco, CA, USA, pp. 41-59. Ostrom, E., forthcoming. Understanding Institutional Diversity. Princeton University Press New Haven, CT, USA. Pagiola, S., Arcenas, A., Platais, G. (2005). Can payments for environmental services help reduce poverty? An exploration of the issues and the evidence to date from Latin America. World Dev. 33(2), 237-254. Pretty, J., Ward, H. (2001). Social capital and the environment. World Dev. 29(2), 209-227.
94
Rocheleau, D., Edmunds, D. (1997). Women, men and trees: Gender, power and property in forest and agrarian landscapes. World Dev. 25, 1351�1371. Swallow, B.M., Garrity, D.P., van Noordwijk, M. (2001). The effects of scales, flows and filters on property rights and collective action in catchment management. Water Policy 3(6), 449-455. Van Noordwijk, M., van Roode, M., McCallie, E.L., Lusiana, B. (1998). Erosion and sedimentation as multi-scale, fractal processes: Implications for models, experiments and the real world. In: Penning de Vries, F.W.T., Agus, F., Kerr, J. (Eds.), Soil Erosion at Multiple Scales. CAB International, Wallingford, UK, pp. 223-253. Van Noordwijk, M., Joshi, L., Agus, F., Hairiah, K., Suprayogo, D., Verbist, B., forthcoming. Managing agricultural landscapes so that they maintain watershed functions as well as are productive. Proceedings 25th Anniversary Conference of the World Agroforestry Centre, Nairobi, Kenya. VeneKlasen, L., Miller, V., 2002. A New Weave of Power, People and Politics. The Action Guide for Advocacy and Citizen Participation. World Neighbours, Oklahoma City, Oklahoma, USA. Wester, P., Merrey, D.J., de Lange, M. (2003). Boundaries of consent: Stakeholder representation in river basin management in Mexico and South Africa. World Dev. 31(5), 797-812. White, T.A., Runge,C.F. (1995). The emergence and evolution of collective action: Lessons from watershed management in Haiti. World Dev. 23, 1683-1698.
95
teCAt βα ++
=1
3.2 Desarrollo e implementación de modelos para evaluación del Impacto de cultivos biofortificados
By: James A. García 3.2.1 Objetivo Continuar el desarrollo del modelo implementado durante 2004 que permite evaluar el beneficio potencial sobre la salud humana al consumir cultivos biofortificados. 3.2.2 Metodología: Nuevos conceptos metodológicos incorporados al modelo: a- Tasa de Adopción: Teniendo en cuenta que durante el proceso de liberación y
adopción de una nueva tecnología ésta empieza lenta y progresivamente a ser aceptada por los usuarios potenciales hasta llegar a un punto de máxima adopción, se utilizó la función logística con el objeto de simular dicho proceso. La tasa de adopción de la nueva tecnología se denomina A y se asume que obedece a una función logística del tipo
donde: At = tasa de adopción en el período t C = tasa de cobertura de la tecnología (Asíntota) α y β = parámetros
t = tiempo
Para estimar el valor de la tasa de adopción en cada período de tiempo t, utilizando la función logística anterior, es indispensable conocer: i- cuanto la nueva tecnología se usará en agricultura y qué tanto estará disponible
en los mercados para el consumo en los hogares. Este valor constituye la asíntota de la función y representa la tasa de cobertura o valor de adopción máxima posible.
ii- El valor porcentual de la tasa de adopción A1 y A2 correspondientes a los
períodos de tiempo t1 y t2 situados en cualquier lugar sobre la curva.
Con la información anterior, se pueden estimar los parámetros α y β de la función logística mediante las siguientes fórmulas:

96
12
12 )(logit)(logittt
AA−−
=β
βα −= )(logit 1A
−
=100/1
100/ln)logit(i
ii A
AA
Conociendo los valores para C, α y β la función logística queda plenamente definida.
b- Desadopción: Teniendo en cuenta que así como una nueva tecnología es adoptada
por los consumidores, de igual manera ésta puede ser abandonada o reemplazada por otras nuevas tecnologías que entren a participar en el mercado. Este comportamiento de eliminación constituye el proceso de desadopción. La figura 1 muestra el diagrama esquematizado de un proceso hipotético de 20 años de duración en sus diferentes etapas de investigación & desarrollo, adopción, estabilización y desadopción.
Figura 1. Esquematización del proceso de adopción que sigue una nueva tecnología.
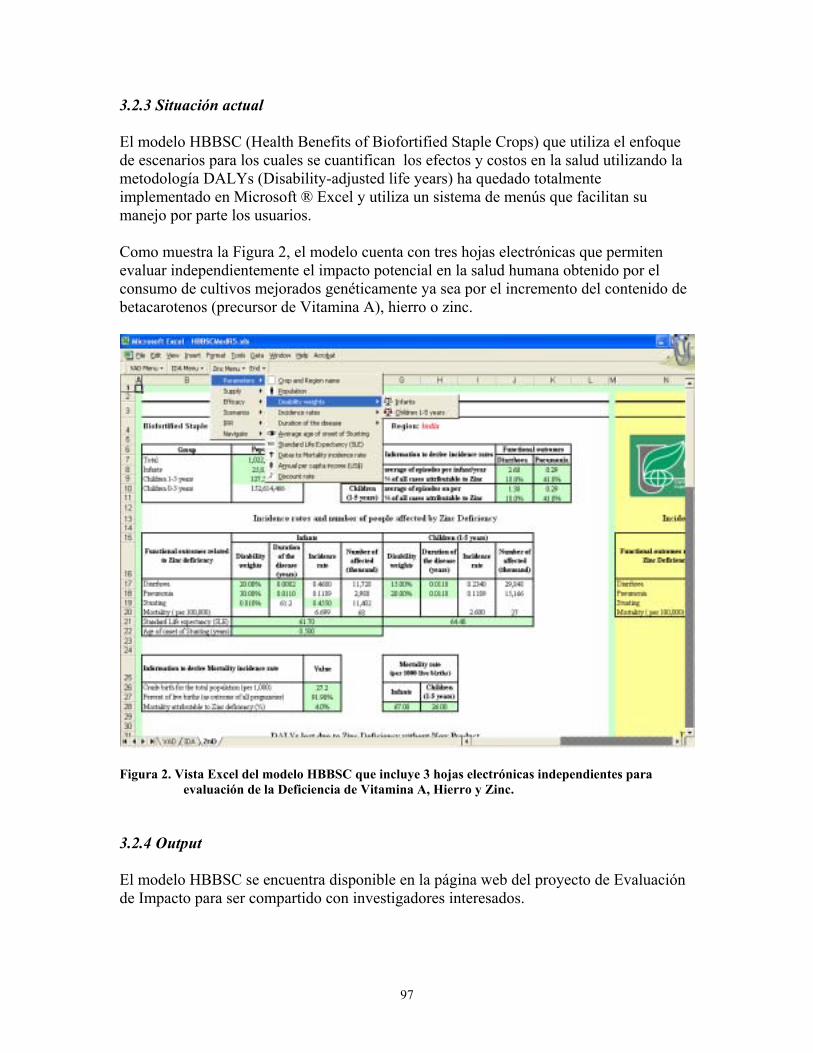
97
3.2.3 Situación actual
El modelo HBBSC (Health Benefits of Biofortified Staple Crops) que utiliza el enfoque de escenarios para los cuales se cuantifican los efectos y costos en la salud utilizando la metodología DALYs (Disability-adjusted life years) ha quedado totalmente implementado en Microsoft ® Excel y utiliza un sistema de menús que facilitan su manejo por parte los usuarios. Como muestra la Figura 2, el modelo cuenta con tres hojas electrónicas que permiten evaluar independientemente el impacto potencial en la salud humana obtenido por el consumo de cultivos mejorados genéticamente ya sea por el incremento del contenido de betacarotenos (precursor de Vitamina A), hierro o zinc.
Figura 2. Vista Excel del modelo HBBSC que incluye 3 hojas electrónicas independientes para
evaluación de la Deficiencia de Vitamina A, Hierro y Zinc. 3.2.4 Output El modelo HBBSC se encuentra disponible en la página web del proyecto de Evaluación de Impacto para ser compartido con investigadores interesados.

98
3.2.5 Colaboradores Nancy Jonson and Carolina Gonzalez , CIAT-Evaluación de Impacto. Alexander Steim, University of Hohenheim. Penny Nestel and JV Meenakshi, HarvestPlus.
99
3.3 Desarrollo e implementación de modelos para la evaluación económica, social y ambiental de alternativas de uso de tierra
by: Marcela Quintero, Rubén Dario, Estrada y James A. García 3.3.1 Objetive Desarrollar un modelo que permita, a un nivel macro (cuenca, región, etc.), identificar y diseñar estrategias de manejo de los recursos naturales que minimicen los posibles impactos ambientales y socioeconómicos que puedan generar las actividades antrópicas. 3.2.2 Methodology Consiste fundamentalmente en la elaboración de un modelo matemático lineal del problema, en la utilización de un algoritmo para la búsqueda de su solución óptima y finalmente en la interpretación y análisis de ésta.
El modelo se implementa utilizando la técnica matemática de la programación lineal (PL) como herramienta cuantitativa adecuada para el análisis de problemas de optimización.
Las técnicas basadas en PL se utilizan en infinidad de aplicaciones de la industria, la economía, la estrategia militar, etc., donde se presentan situaciones en las que se exige maximizar (o minimizar) algunas funciones que se encuentran sujetas a determinadas limitaciones o restricciones.
La aplicación de la programación lineal busca solucionar el problema de asignar recursos limitados entre actividades competitivas, de la mejor manera posible, es decir, en forma óptima. Con más precisión, el problema incluye elegir el nivel de las actividades que compiten por los recursos escasos necesarios para realizarlas y determinar la cantidad de cada recurso que consumirá cada una de ellas en los niveles de actividad elegidos.
El modelo busca determinar el nivel de las actividades X1, X2,....,Xn para:
Optimizar (Maximizar) Z = c1X1 + c2X2 +....+ cnXn, (Z = CX)
sujeta a las restricciones:
a11X1 + a12X2 +....+ a1nXn <= b1 (AX <= b) a21X1 + a22X2 +....+ a2nXn <= b2 . . . am1X1 + am2X2 +....+ amnXn <= bm
X1 >= 0, X2 >= 0, ..., Xn >=0.
100
donde :
bi (i=1,2,..m) cantidad del recurso � i � disponible para asignar a las actividades.
cj (j=1,2,..,n) incremento en Z que resulta al aumentar una unidad en el nivel de la actividad � j �.
aij (i=1...m , j=1...n) cantidad del recurso � i � consumido por cada unidad de la
actividad � j �. Las condiciones de no negatividad garantizan que las actividades y alternativas de decisión que entran en la solución óptima, tomen valores numéricos positivos El modelo está orientado a evaluar, para un período máximo de hasta 10 años, cuál es la inversión mínima necesaria de la sociedad para mejorar las condiciones de vida de la población más pobre, estimando a su vez los trade offs entre criterios de ingresos, productividad, sostenibilidad y riesgos, que permitan comprender mejor la naturaleza de las acciones promisorias. Para tal fin, el modelo se alimenta con la información biofísica básica generada en los análisis de cuencas, la información socioeconómica y la estimación del impacto de los fenómenos climáticos (heladas y sequías) sobre la productividad. De esta manera, es posible integrar el análisis de externalidades ambientales con la gestión y mitigación de riesgos, y evaluar estos componentes, bajo diferentes opciones de mercados y precios relativos de la mano de obra. El modelo de optimización ayuda a calcular el costo de cambiar el uso de la tierra y las tecnologías bajo diferentes escenarios en el espacio y en el tiempo. Soluciones óptimas son el producto del trade off entre los intereses de los actores y la satisfacción de múltiples restricciones. En otras palabras, la optimización evalúa de manera ex-ante el potencial económico y social de alternativas para mejorar las condiciones de vida y estimular la inversión privada y oficial para financiarlas. El modelo esta construido con base en la relación entre variables y alternativas de decisión. Las variables corresponden a las restricciones dadas por las capacidades biológicas y económicas del sistema o por las consideraciones del productor o las políticas de una región. Las alternativas de decisión se refieren a las actividades que se realizan en el sistema para mantener su funcionamiento. La selección de las variables y alternativas de decisión corresponde al entendimiento de las interdependencias que suceden en una cuenca. Algunos de los ejemplos de interdependencias son: los flujos hidrológicos unidireccionales que ocasionan que las actividades aguas arriba tengan unos impactos aguas abajo (aporte de sedimentos, disminución en agua disponible, etc.); mayores ingresos a medida que se adoptan ciertos sistemas de producción, cultivos con mayor requerimiento de mano de obra y capital, coberturas que tienen un mayor efecto positivo sobre los caudales, etc.
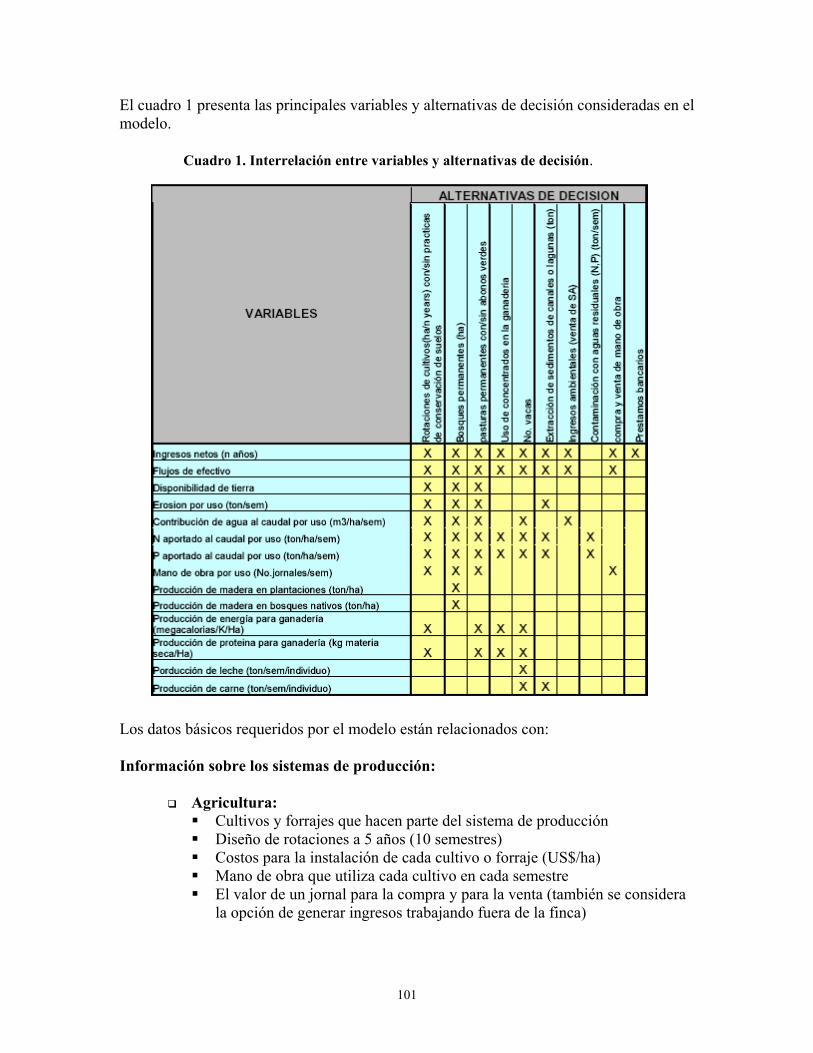
101
El cuadro 1 presenta las principales variables y alternativas de decisión consideradas en el modelo. Cuadro 1. Interrelación entre variables y alternativas de decisión.
Los datos básicos requeridos por el modelo están relacionados con: Información sobre los sistemas de producción:
# Agricultura: $ Cultivos y forrajes que hacen parte del sistema de producción $ Diseño de rotaciones a 5 años (10 semestres) $ Costos para la instalación de cada cultivo o forraje (US$/ha) $ Mano de obra que utiliza cada cultivo en cada semestre $ El valor de un jornal para la compra y para la venta (también se considera
la opción de generar ingresos trabajando fuera de la finca)
102
$ Productividad por cada cultivo seleccionado en cada semestre o cosecha (ton/ha)
$ Valor de venta de cada cultivo (US $ / ton) $ Prácticas de manejo (p.e. zanjas de infiltración, barreras vivas, etc.)
o Área utilizada por cada práctica de manejo (ha) o Costo de implementación de cada práctica de manejo (US $/ha) o Momento en la rotación en que se implementan las prácticas de
manejo # Ganadería:
$ Peso por unidad animal (Kg) $ Consumo de agua por el ganado (L. /día /animal) $ Producción de leche (L. /día /animal) $ Producción de carne (Kg. /semestre/animal) $ Valor de concentrados (US $ /ton) $ Composición de concentrados para ganadería:
o Energía metabolizable (ton Mg cal /ton concentrado) o Proteína digestible (ton /ton concentrado)
$ Aportes de N y P al caudal provenientes de la ingesta de concentrados (ton /ton)
$ Proteína y energía generada por forrajes (pastos, forrajes verdes, residuos de cultivos):
o Porcentaje de residuos de cada cultivo destinados para alimentación de ganado (%/100)
o Porcentaje de materia seca por forraje (%) o Contenido de energía por cada forraje (Mg cal /K) o Contenido de proteína por cada forraje (k proteína /K de
material seca) o Digestibilidad de la proteína (%)
Información relacionada con las externalidades por15:
# Procesos de Sedimentación16:
$ Aporte de sedimentos por cultivo o forraje en cada semestre (ton/ha) $ Aporte de sedimentos por cultivo o forraje en cada semestre con la
implementación de las prácticas de manejo (ton/ha) $ Disponibilidad de agua en el caudal:
o Aporte de agua al caudal por cultivo o forraje en cada semestre (ton/ha)
o Aporte de agua al caudal por cultivo o forraje en cada semestre con la implementación de las prácticas de manejo (ton/ha)
o Valor de venta de agua en cada semestre (US $/m3) 15 Según la problemática de la cuenca es posible que no todas las externalidades aquí consideradas sean motivo de estudio. 16 El modelo utiliza información hidrológica generada por SWAT (Soil & Water Assesment Tool) a partir de información climática diaria.

103
$ Sumideros de carbono: o Captura semestral de CO2 por cada cultivo o forraje (ton /Ha) o Valor de venta de CO2 (US $ /ton)
$ Contaminación de agua: o Aporte de nitrógeno y fósforo (lixiviado) proveniente de
fertilizantes por cultivo o forraje (ton/ha/semestre) o Aporte de nitrógeno y fósforo proveniente de erosión por
cultivo o forraje (ton/ha/semestre) o Aporte de nitrógeno y fósforo proveniente de la ingesta de
forrajes del ganado (ton/ha/semestre) o Aporte de nitrógeno y fósforo proveniente de la ingesta de
concentrados (tonelada N y P/ tonelada concentrado) Información relacionada con riesgos climáticos.
# Impacto de las heladas sobre la producción semestral de cada cultivo o forraje (% de disminución en producción)
# Impacto de las sequías sobre la producción de cada cultivo o forraje (% de disminución en producción)
3.3.3 Current situation and progress made in 2005 La metodología de análisis se implementó utilizando VBA (Visual Basic for Application) en Microsoft ® Excel 2000. El modelo ECOSAUT (Evaluación Económica, Social y Ambiental de Alternativas de Uso de Tierra) cuenta con cuatro hojas electrónicas y un conjunto de menús y submenús, que permiten al usuario el manejo fácil y sencillo de los diferentes procesos (Gráfica 1). La primera hoja de cálculo (Datos Básicos) está habilitada para el ingreso de los diferentes parámetros o datos básicos requeridos por el modelo. La segunda hoja de cálculo (Datos Calculados) soporta información que se genera automáticamente, mediante la utilización de opciones de menú, a partir de los datos básicos previamente suministrados al modelo. Una tercera hoja de cálculo (Optimización) contiene la matriz �planteada de acuerdo a la relación entre actividades (variables de decisión) y restricciones� sobre la cual la capacidad de excel de optimizar con técnicas de programación lineal encuentra la solución óptima al problema en estudio. La cuarta hoja de cálculo (Resultados) presenta datos resumen y algunas gráficas generadas automáticamente que permiten interpretar y analizar el comportamiento de las soluciones óptimas.

104
Figura 1. Vista Excel del modelo ECOSAUT
3.3.4 Output
# Un archivo excel con el modelo ECOSAUT está disponible para investigadores que deseen evaluar, de manera ex-ante, el impacto de cambios en el uso de la tierra sobre las externalidades hidrológicas y las condiciones socioeconómicas de los pobladores de un sector macro (cuenca, región, etc.)
# Se encuentra también disponible una versión ajustada del modelo básico
ECOSAUT, que permite la evaluación económica, social y ambiental, a largo plazo (hasta 19 años), de prototipos de finca que incluyen diversos componentes ganaderos, agrícolas y forestales, para la producción de alimentos y materias primas, y adicionalmente, productos ambientales como el secuestro de carbono.
3.3.5 Collaborators Marcela Quintero, CIAT - Proyecto Cuencas Andinas Rubén Dario Estrada, CONDESAN � Proyecto Cuencas Andinas

105
DONOR LIST
The work presented in this report was funded in part by the following institutions:
BMZ � Der Bundesminister fur Wirstschafliceh Zusammennarbeit (Germany)
CFC � Common Fund for Commodities
CGIAR - Challenge Programs HarvestPlus and Water and Food
CGIAR - Standing Panel on Impact Assessment
GTZ - Dutsche Gesellschaft fur Technische Zusammenarbeit (German Agency for
Techical Cooperation) (Germany)
Ministerio de Agricultura de Colombia
Nippon Foundation

106
COLLABORATING INSTITUTIONS ARIs and Universities: $ Institute for Development Studies, University of Sussex, UK. $ Maseno University, Kenya. $ Universidad de los Andes, Colombia. $ University of Florida, USA. $ University of Hohenheim, Germany. $ University of Maine, USA. CGIAR Centers, CPS, SWPs and Ecoregional Programs: $ Centro Internacional de la Papa (CIP). $ Consorcio para el Desarrollo Sostenible de los Andes (CODESAN). $ Challenge Program on Water and Food. $ HarvestPlus Challenge Program $ International Center for Research in Agroforestry (ICRAF). $ International Food Policy Research Institute (IFPRI) $ International Institute of Tropical Agriculture (IITA). $ International Livestock Research Institute (ILRI), San José, Costa Rica. $ Standing Panel on Impact Assessment (SPIA). $ Systemwide Program on Collective Action and Property Rights (CAPRi). $ Systemwide Program on Participatory Research and Gender Analysis (PRGA). NARS and other Public Institutions: $ Corporación Autónoma Regional (CAR) Colombia. $ Empresa Brasileira de Pesquisa Agropecuaria (EMBRAPA), Brazil. $ Instituto Alejandro von Humboldt, Colombia $ Instituto for Development Studies, University of Sussex, UK. $ Ministry of Agriculture, Colombia. $ Ministry of the Environment; Colombia. $ Ministry of Water and Irrigation, Kenya. $ Ministry of Agriculture, Kenya. $ Ministry of Planning and National Development, Kenya. $ National Environment and Management Authority, Kenya. $ Ugandan National Agricultural Research Organization (NARO), Uganda. NGOs: $ Fundación Humedades, Colombia. $ Semillas de Agua, Colombia. $ World Wildlife Fund-Colombia. $ Sustainable Aid in Africa (SANA), Kenya. Other Collaborating Institutions: $ Corporación Ganadera (CORFOGA), San José, Costá Rica. $ Reforestadora de la Costa S. A. (REFOCOSTA), Colombia.

107
STAFF LIST 2005 Impact Assessment James A. García, M.Sc. Statistician/Data Base Specialist María Carolina González, M.Sc. Lawyer and Economist, Research Assistant Nancy Johnson, Ph.D. Economist and Project Leader (80%) Gloria Posada Bilingual Secretary and Lawyer (50%) Libardo Rivas, M.Sc. Economist, Research Associate Rubiano, Jorge, Ph.D. Geographer (25%) Douglas White, Ph.D. Economist (50%) Students Ana Lucia Herrán, BS Economics, Universidad Javeriana Diana Ximena Marin, BS Economics, Universidad Javeriana Anna Knox, Ph.D. Institute of Development Studies, University of
Sussex

108
PUBLICATIONS AND PRESENTATION Referred Journal Articles and Monographs Holmann F.; L. Rivas; P. J. Argel and E. Pérez (2004). Impact of Adoption Brachiaria grasses: Central America and Mexico. In: Livestock Research for Rural Development (16) 12 2004 (http://www.cipav.org.co/lrrd/). Holmann F.; L. Rivas; N. Urbina; B. Rivera; L. A. Giraldo; S. Guzmán; M. Martínez; A. Medina; and G. Ramírez. (2005). The role of livestock in poverty alleviation: An analysis of Colombia. In: Livestock Research for Rural Development (17) 02 2005. (http://www.cipav.org.co/lrrd/lrrd17/1/holm17011.htm Rivas L. y F. Holmann. (2004). Impacto Económico de la adopción de cultivares de Brachiaria resistentes a cercópidos, en: Pasturas Tropicales. Vol. 26 No 3, Diciembre, pp. 39 �55. Rivas L. and F. Holmann (2005). Potential Economic Impact from the adoption of Brachiaria hybrids resistant to spittlebugs in livestock systems of Colombia, Mexico an Central America. In: Livestock Research for Rural Development (17) 5,2005 (http://www.utafoundation.org/lrrd1705/holm17054.htm Unpublished Working Papers Dalton T; Lilja N; Johnson N; Howeler R. 2005. Impact of Participatory Natural Resource Management Researhc in Cassava-Based Cropping Systems in Vietnam and Thailand. Cali, Colombia, 27p. (Working Document Nro 23, revised). González, Carolina and Nancy Johnson (2005). Inventory of Policies in Brazil Related to Harvestplus, Working paper. González, Carolina; Ilma Kruze; Leopoldina Sequeira; Chigeru Fukuda; Rejane Olivera and Nancy Johnson (2005). Findings of the Qualitative Survey on Cassava (Mandioca and Macaxeira) and Beans in Paraiba, Brazil , CIAT/HarvestPlus working document. Holmann, F. y L. Rivas. 2005. Los forrajes mejorados como promotores del crecimiento económico y la sostenibilidad: El caso de los pequeños ganaderos de Centroamérica. Documento de trabajo #202. CIAT (Centro Internacional de Agricultura Tropical), Cali, Colombia Rivas L. F. Holmann y J. García (2005). Nuevos Sistemas de Producción Agropecuaria y Servicios Ambientales: Una evaluación económica en la Altillanura colombiana. Primer borrador. Centro Internacional de Agricultura Tropical. Proyecto de Evaluación de Impacto. Cali, Colombia. Octubre. Rivas L., P. Hoyos, E. Amézquita, D. L. Molina. (2004). Manejo y uso de los suelos de la Altillanura colombiana. Análisis económico de un estrategia para su conservación y mejoramiento: Construcción de capa arable. Centro Internacional de Agricultura Tropical. Proyecto de Evaluación de Impacto � Programa de suelos. Cali, Colombia. Junio.
109
Rivas L. y Molina D. L. (2005). Monitoreo de la adopción de tecnologías conservacionistas de uso del suelo en la altillanura colombiana. Primer borrador. CIAT. Proyecto de Evaluación de Impacto - Proyecto de suelos. Cali, Colombia. Diciembre. Swallow, B., N. Johnson, R Meinzen-Dick and A Knox. (2005). The Challenges of Cross-Scale Collective Action in Watersheds, In review for special issue of Water International and as CAPRi working paper. Workshop and Conference Papers, Presentation and Powers Proceedings Dalton T; Lilja N; Johnson N; Howeler R. Human Capital Accumulation and Productivity Improvements in Asian Cassava Systems: Are Participatory Research Approaches Beneficial? 24p. A selected paper presented at the American Agricultural Economics Association meeting in Providence, Rhode Island, USA, July 24-27, 2005. Dalton T; Lilja N; Johnson N; Howeler R. (2005). Impacto de la Investigación sobre el Manejo de los Recursos Naturales para Sistemas de Cultivo Basados en Yuca, Utilizando un Enfoque Participativo en Vietnam y Tailandia" CIAT Seminar Series, 16 Noviembre 2005. Dalton T; Lilja N; Johnson N; Howeler R. (2005). Impact of Participatory Natural Resource Management Researhc in Cassava-Based Cropping Systems in Vietnam and Thailand. A paper presented at the joint meeting of the Integrated Natural Resource Management Group (INRM) and CGIAR Standing Panel on Impact Assessment (SPIA) at the International Rice Research Institute (IIRI) in Los Banos, Philippines, June 13-19, 2005. García, J.A. Tamaño de Muestra y Diseño Muestral. Capacitación a personal técnico de la Fundación Kellogg en la II Reunión técnica para la Evaluación de la línea de base. Cali, Colombia, 15-18 Febrero, 2005. González, C, and N. Johnson (2005). The Impact of GMOs, presentation made at the workshop on Socio Economic Aspects of Use of GMOs, GEF-World Bank project, Bogota Colombia , November 2005. Pachico, D. (2005) �Analysis of the Socio-economic Impacts of Transgenic Crops.� Presented at Socio-economic Aspects of the Use of Genetically Modified Organisms, Humboldt Institute, Bogota, Colombia, November 15. Pachico, D. (2005) �Towards a Conceptual Model of Optimal Investment in the Conservation of Agricultural Genetic Resources.� D. Pachico. Presented at the International Conference on Agricultural Biotechnology Research, Ravello, Italy, July 6-10. Rivas L. (2005). Marco Conceptual y Metodologías en procesos de Seguimiento y Evaluación del Impacto Tecnológico. Estación La Libertad, CORPOICA, Villavicencio, Colombia. Julio 29. Asesoría a estudiantes. Rivas L. y F. Holmann. (2005). Metodología y Marco Conceptual para el Estudio de las cadenas agroalimentarias de carne vacuna en Centroamérica. Proyecto ILRI - CFC � CIAT. San José, Costa Rica. Junio 8.

110
REFERENCES Ahluwalia, M. (1997). Representing communities: The case of a community-based watershed-management project in Rajasthan, India. IDS Bulletin, Institute of Development Studies, Sussex University, Brighton, UK, 28, 23-35. A.F.I. (2002-2003). Consumer perceptions of Food Biotechnology in Asia - Public Report on the Asian Food Information Centre 2002 Consumer Survey: 1-17: Asian Food Information Centre. Aerni, P. (2001). Public Attitudes towards Agricultural Biotechnology in Developing Countries: A Comparison between Mexico and the Philippines. Cambridge, Center for International Development. 2002: 47. Alston, J. M.; Norton, G. and Pardey, P.G. (1995). Science under scarcity: Principles and Practice for agriculture research evaluation of priority setting. Ithaca, New York: Cornell University Press. Avila, A.F.D.; Quirino, T.R.; Contini, E. and Rech Filho, E.L. (2001). Social and economic impact ex ante evaluation of Embrapa's biotechnology research products. Paper presented at the 5th International Consortium on Agricultural Biotechnology Research (ICABR) on Biotechnology, Science and Modern. Barrett, C.; Swallow, B. (2005). Dynamic poverty traps and rural livelihoods. In: Ellis, F., Ade Freeman, H. (Eds.), Rural Livelihoods and Poverty Reduction Policies. Routledge, London, pp. 16-28. Barrett, C.; Swallow, B., forthcoming. Fractal poverty traps. World Dev. Biggs, S.V., (2001). Linking ecological scales and ecological frameworks for landscape rehabilitation. Ecol. Manage. Restor. 2(1), 28-35. Biggs, S.V. (2001). Linking ecological scales and ecological frameworks for landscape rehabilitation. Ecol. Manage. Restor. 2(1), 28-35. Boecker, A.; Nocella, G.; Bertazzoli, A. and Lucchi, M. (2004). GM foods purchase intentions - Linking the theory of planned behavior with consumer trust and stated choice models. Paper presented at the 8th International Consortium on Agricultural Biotechnology Research (ICABR) on "Agricultural Biotechnology: International Trade and Domestic Production", Ravello (Italy). Bonny, S. (2003). Why are most Europeans apposed to GMOs? Factors explaning rejection in France and Europe. Electronic Journal of Biotechnology, 6 (1): 50-71. Bredahl, L.; Grunert, K. and Frewer, L. (1998). Consumer Attitudes and Decision-Making with regard to Genetically Engineered Food Products - A review of the Literature and Presentation of Models for Future Research. Journal of Consumer Policy, 21(3): 251-277. Brock, K.; Cornwall, A.; Gaventa, J. (2001). Power, knowledge and political spaces in the framing of poverty policy. IDS Working Paper 143. Institute of Development Studies, Brighton, UK. Burton, M. and Pearse, D. (2002). Consumer Attitudes Towards Genetic Modification,

111
Functional Foods, and Microorganisms: A Choice Modeling Experiment for Beer. AgBioForum, 5(2): 51-58. Burton, M., D. Rigby, T. Young, and S. James. (2001). Consumer Attitudes to Genetically Modified Organisms in Food in the UK. European Review of Agricultural Economics, 28 (4): 479-498. Byerlee, D. and Fischer, K. (2002). Accessing Modern Science: Policy and Institutional Options for Agricultural Biotechnology in Developing Countries. World Development, 30(6): 931�948. CBD (The Secretariat of the Convention on Biological Diversity) and UNEP (United Nations Environment Programmed). An introduction to the Cartagena Protocol on Biosafety (on line). June. 2003. France. Available in: http://www.biodiv.org/doc/press/presskits/bs/cpbs-unep-cbd-en.pdf Curtis, K. and Moeltner, K. (2004). Do Attitudes toward Genetically Modified Foods Influence Consumers in Primary Trading Countries? The Case for China and Romania. Paper presented at the 8th International Consortium on Agricultural Biotechnology Research (ICABR) on "Agricultural Biotechnology: International Trade and Domestic Production", Ravello (Italy). Curtis, K., McCluskey, J. and Wahl T. (2003). Consumer Acceptance of Genetically Modified Food Products in the Developing World. AgBioForum, 7(1 &2): 1-11. Available in http://www.agbioforum.org/v7n12/v7n12a13-mccluskey.htm CFC, San José, Costa Rica. Chavarriaga, P.; Pachico, D. and J. Tohme (2005). �Addressing Challenges of Tropical Agriculture: Colombia�s Cassava Case,�. In Trading in Genes: Development Perspectives on Biotechnology, Trade and Sustainability, R. Melendez-Ortiz and V. Sanchez, Earthscan, London. Chern, W.S.; Rickertsen, K.; Tsuboi, N. and Fu T. (2003). Consumer acceptance and willingness to pay for genetically modified vegetable oil and salmon: a multiple country assessment. AgBio Forum 5 (3): 105-112. Demont, M. and Tollens, E. (2004). First impact of biotechnology in the EU: Bt maize adoption in Spain. Annals of Applied Biology, 2004(195): 197-207. Di Gregorio, M.; Hagedorn, K.; Kirk, M.; Korf, B.; McCarthy, N.; Meinzen-Dick, R.; Swallow, B. (forthcoming). The role of property rights and collective action for poverty reduction. In: Guha-Khasnobis, B., Kanbur, R., Ostrom, E. (Eds.), Policies for Linking the Informal and Formal Sectors. Oxford University Press, Oxford, UK. Eaton, D.; Achterbosch, T. and Maagd, R. (2003). Assessing the benefits & potential of genetically modified non-food crops in developing countries: the case of Bt-cotton. North-South Policy Brief, 4. Available in http://www.north-south.nl/files/policy/policy_brief_2003_4.pdf Edmunds, D.; Wollenberg, E. (2003). Local forest management: The impacts of devolution policies. Earthscan Publications, London. Falck-Zepeda, J.; Falconi, C.; Cohen, J.; and Komen, J. (2002). Agricultural Biotechnology

112
In Developing Countries: Investments And Human Resources From Six Selected National Agricultural Research Systems. Paper presented at the 6th International Consortium on Agricultural Biotechnology Research (ICABR) on "Agricultural Biotechnologies: New Avenues for Production, Consumption and Technology Transfer", Ravello (Italy). Farrington, J.; Turton, C.; James, A.J. (2000). Participatory watershed development: Challenges for the Twenty-First century. Oxford India Paperbacks, New Delhi. Fox, P.; Rockstrom, J.; Barron, J. (2005). Risk analysis and economic viability of water harvesting for supplemental irrigation in semi-arid Burkina Faso and Kenya. Agric. Syst. 83, 231-250. Frewer, L.J. and Shepherd, R. (1994). Attributing information to different sources: Effects on the perceived qualities of information, on the perceived relevance of information, and on attitude information. Public Understanding Science, 3: 385-401. Furst, M.; Conners, M.; Bisogni, C.A.; Sobal, J. and L.W. Falk. (1996). Food Choice: A Conceptual Model of the Process. Appetite, 26(3): 247-266. Gedrich, K. (2003). Determinants of nutritional behavior: a multitude of levers for successful intervention? Appetite, 41(3): 231-238. Global Water Partnership, (2000). Integrated water resources management. Global Water Partnership, Stockholm, Sweden. Grey, D.; Sadoff, C. (2002). Water resources and poverty in Africa: Breaking the vicious circle. Paper presented at Inaugural Meeting of Africa Ministers Committee on Water, Abuja, Nigeria, 30 April 2002. url: www.thewaterpage.com/Documents/amcow_wb_speech.pdf. Hareu, G.; Norton, G.; Bradford, M.and Peterson, E. (2004). Biotechnology for rice ecosystem of Asia: public sector R&D options and welfare impacts under imperfect competition. Paper presented at the 8th International Consortium on Agricultural Biotechnology Research (ICABR) on "Agricultural Biotechnology: International Trade and Domestic Production", Ravello (Italy). HarvestPlus. (2005). Available in: http://www.harvestplus.org/ Hinchcliffe, F.; Thompson, J.; Pretty, J.N.; Guijt, I., Shah, P. (Eds.). (1999). Fertile ground: The impacts of participatory watershed management. Intermediate Technology Publications Ltd., London. Hoban, T. (2004). Public Attitudes towards Agricultural Biotechnology. The Food and Agriculture Organization of the United Nations - FAO. Available in http://www.fao.org/documents/show_cdr.asp?url_file=/docrep/007/ae064e/ae064e00.htm Holmann F. y Estrada R. D. (1997). Alternativas agropecuarias en la región Pacífico Central de Costa Rica. Un modelo de simulación aplicable a sistemas de doble propósito. En: Lascano C. E. y Holmann F. (edit) Conceptos y Metodologías de Investigación en fincas con sistemas de producción animal de doble propósito. Centro Internacional de Agricultura Tropical � Consorcio Tropileche, Publicación CIAT No 296, 285 p. Homstra A.M. (1995). Consumer acceptance model for food biotechnology � Final report.
113
The Hague: The SWOKA Institute. Hoosain, F.; B. Onyango; A. Adelaja; B. Schilling and W. Hallman (2003). �Nutritional Benefits and Consumer Willingness to Buy Genetically Modified Foods�, Journal of Food Distribution Research, 34 (1):24-29. House, L.; Morrow, B.; Lusk, J. and Moore, M. (2001). Modeling Consumer Acceptance of and Willingness to Pay for Genetically-Modified Foods in the United States and the European Union. Paper presented at the International Food and Agribusiness Management Association Annual Meeting � The World Food and Agribusiness Symposium., Sydney, Australia. Available in http://www.ifama.org/conferences/2001Conference/Papers/Area%20II/House_Lisa.PDF Hout, M. (2002). The benefits and risk related to consumer access to second generation genetically modified foods. Montreal, Canada: Option consummateurs - Office of Consumer Affairs. Available in: http://www.option-consommateurs.org/dc_pdf/pdf/foods_2ndgen_oc0402.pdf IBOPE and Greenpeace, (2001). Available in: http://www.greenpeace.com.br/transgenicos/pdf/pesquisaIBOPE_agosto2001.pdf Instituto Brasileiro de Gografia e Estadistica � IBGE. 2005. Available in: http://www.ibge.gov.br/ ILRI (International Livestock Research Institute). (2004). ILRI-CFC Project Progress Report. Enhancing Beef Productivity, Quality, Safety and Trade in Central America. Report no. 3. January - December 2004. Managua, Nicaragua. Insituto Brasileiro de Geografia e Estadistica � IBGE. 2005. Available in: http://www.ibge.gov.br/ Jodha, N.S., (1986). Common property resources and rural poor in dry regions of India. Economic and Political Weekly 21 (23), 1169-1181. Kerr, J.M. (2002). Watershed development, environmental services, and poverty alleviation in India. World Dev. 30(8), 1387-1400. Kim, R. and Boyd, M. (2004). Japanese Consumer Attitudes and Decision-Making with regard to GM Food Products: Analysis using Structural Equation Modeling (SEM). Paper presented at the 8th International Consortium on Agricultural Biotechnology Research (ICABR) on "Agricultural Biotechnology: International Trade and Domestic Production", Ravello, (Italy). Korthals, M. (2002). The struggle over functional foods: Justice and the social meaning of functional food. Journal of Agricultural and Environmental Ethics, 15(3): 315-324. Krishna, Anirudh, (2002-2005). Stages of Progress: disaggregating poverty for better policy impact. http://www.pubpol.duke.edu/krishna Lam, W.F. (1998). Governing Irrigation Systems in Nepal: Institutions, Infrastructure, and Collective Action. ICS Press, Oakland, CA. Lant, C.L., 1999. Introduction: Human dimensions of watershed management. J. Am. Water Resour. Assoc.35(3), 483-486.
114
Li, Q.; Curtis, K.; McCluskey, J. and Wahl, T. (2002). Consumer Attitudes Toward Genetically Modified Foods in Beijing China. AgBioForum, 5(4): 145-152. Loureiro, M. and Bugbee, M. (2005). Enhanced GM Foods: Are Consumer Ready to Pay for the Potential Benefits of Biotechnology. The Journal of Consumer Affairs, 39(1): 52-70. Makurira, H., Mugumo, M., forthcoming. Water sector reforms in Zimbabwe: The importance of policy and institutional coordination on implementation. In Swallow, B., Achouri, M., Tennyson, L., Okono, N. (Eds.), Proceedings Africa Regional Workshop on Preparing the Next Generation of Watershed Management Programmes, FAO Forestry Paper. Rome. McClusky J., Ouchi, H., Crimsrud K.M. and Wahl T.I. (2001).Consumer response genetically modified food products in Japan. Agricultural and Resource Ecnomics Review 32/2.October 2003: 222-231. Meenakshi, J.V. et al. (2006). "Analysing the Cost Effectiveness of Biofortification: A Synthesis of the Evidence." HarvestPlus technical report (draft). Millenium Project and Swedish Water House (2005). Health, Dignity and Development: What will it Take? UN Millennium Project Task Force on Water and Sanitation, Final Report, abridged ed. Stockholm International Water Institute, Stockholm, Sweden and the United Nations Millenium Project, New York. Ministry for the Environment of New Zealand and Business and Economic Research Limited (BERL). (2003). Economic Risks and Opportunities from the Release of Genetically Modified Organisms in New Zealand. New Zealand: Ministry for the Environment. Available in: http://www.mfe.govt.nz/publications/organisms/economic-impact-apr03 Ministry of Health of Brazil. 2005 Available in: http://www.datasus.gov.br/ Molden, D.J.; Keller, J.; Sakthivadivel, R., (2001). Hydronomic Zones for Developing Basin Water Conservation Strategies. Research Report 56. International Water Management Institute, Columbo, Sri Lanka. Moon; W. and S.K. Balasubramaniam.(2004). Public Attitudes toward Agrobiotechnology: The Mediating Role of Risk Perceptions on the Impact of Trust, Awareness, and Outrage. Review of Agricultural Economics, 26 (2); 186-208. Moriarty, P.; Butterworth J.; van Koppen, B. (Eds.). (2004). Beyond Domestic: Case Studies on Poverty and Productive Uses of Water at The Household Level. Technical Paper Series 41. IRC (International Water and Sanitation Centre), Delft, the Netherlands. Moschini, G. and Lapan, H. (2005). Labeling Regulations and Segregation of First -and Second- Generation Genetically Modified Products: Innovation Incentives and Welfare Effects. Agricultural Marketing Resource Center, Working Paper 05-WP 391. Nestle, M.; Wing, R.; Birch, L..; DiSogra, L. (1998). Behavioral and social influences on food choice / Discussion. Nutrition Reviews, 56(5). Oakerson, R.J. (1992). Analyzing the commons: A framework. In: Bromley, D.W. (Ed.), Making the Commons Work. Theory, Practice and Policy. ICS Press, San Francisco, CA, USA, pp. 41-59.
115
Ostrom, E., forthcoming. Understanding Institutional Diversity. Princeton University Press New Haven, CT, USA. Pachico, D. and Wolf, M. (2002). Attitudes toward genetically modified food in Colombia. Paper presented at the 6th International Consortium on Agricultural Biotechnology Research (ICABR) on "Agricultural Biotechnologies: New Avenues for Production, Consumption and Technology Transfer", Ravello (Italy). Pachico, D., Escobar, Z., Rivas, L., Gottret, M.V. and Perez, S. (2001). Income and Employment Effects of Transgenic Herbicide-resistant Cassava in Colombia: A Preliminary Simulation . Impact Assessment. Annual Report 2001. CIAT: 61-71. Pagiola, S.; Arcenas, A.; Platais, G. (2005). Can payments for environmental services help reduce poverty? An exploration of the issues and the evidence to date from Latin America. World Dev. 33(2), 237-254. Pérez E. (2005). La situación del sector cárnico bovino Centroamericano. Proyecto ILRI. Pretty, J.; Ward, H. (2001). Social capital and the environment. World Dev. 29(2), 209-227. Programa das Nacioes Unidas para o Desenvolvimento � Brasil (PNUD). 2005. http://www.pnud.org.br/atlas/Living Standards Measurement Surveys (LSMS) for Brazil (http://www.worldbank.org/lsms/) Paraiba Government. 2005. www.paraiba.pb.gov.br Qaim, M. (1998). Transgenic Virus Resistant Potatoes in Mexico: Potential Socio-economic Implications of North -South Biotechnology Transfer. The International Service for the Acquisition of Agri-biotech Aplications (ISAAA) and Center for Development Research (ZEF): 1-48. Qaim, M.; and Zilberman, D. (2003). Yield Effects of Genetically Modified Crops in Developing Countries. Sciences, 299: 900-902. Rincón, Andrés. Tesis de pregrado en economía. Evaluación ex�ante del Impacto Económico y Financiero del Programa de Manejo Integrado de Suelos, Plagas y Enfermedades en el cultivo de la yuca para las regiones del Cauca y los Llanos Orientales. Universidad del Valle, Facultad de Economía � CIAT, Clayuca. Evaluación y análisis económico con el Modelo de Excedentes Económicos (MODEXC). Rocheleau, D.; Edmunds, D. (1997). Women, men and trees: Gender, power and property in forest and agrarian landscapes. World Dev. 25, 1351�1371. Rousu, M.; Monchuk, D.; Shogren, J. F. and Kosa, K. M. (2004). Consumer Willingness to Pay for �Second-Generation� Genetically Engineered Products and the Role of Marketing Information. Paper presented at the Seminar of NC State University and RTI International, Selinsgrove, PA. Available in http://www.susqu.edu/facstaff/r/rousu/research/LabelingandGMcigs.pdf Scatasta, S.; Wesseler, J. and Hobbs, J. (2004). The impact of labelling practices on perceived quality of GM food products: a revealed preferences approach. Paper presented at the 8 th ICABR International Conference on Agricultural Biotechnology: International Trade and Domestic Production, Ravello (Italy).
116
Shaper, M. a. P., S. (2001). Organismos genéticamente modificados: su impacto socioeconómico en la agricultura de los países de la Comunidad Andina, Mercosur y Chile. CEPAL, Vol. 43: 1-81. Sobal, J.; Khan, L.K. and Bisogni, C. (1998). A conceptual model of the food and nutrition system. Social Science & Medicine, 47(7): 853-863. Stein, A et al. (2004). Analyzing health benefits of biofortified staple crops by means of a DALYs approach�a handbook focusing on iron, zinc and vitamin A. HarvestPlus Technical Monograph 4, HarvestPlus, Washington DC and Cali, 2005. Swallow, B.M.; Garrity, D.P.; van Noordwijk, M. (2001). The effects of scales, flows and filters on property rights and collective action in catchment management. Water Policy 3(6), 449-455. Traill, B.; Jaeger, S.; Yee, W.; Valli, C.; House, L.; Lusk, J.; Moore, M. and Morrow, M.L. (2004). Categories of GM Risk-Benefit Perceptions and Their Antecedents. Agrobiotechnology Management and Economics, 7(4). Trigo, E.; Traxler, G.; Pray, C.; and Echeverria, R. (2002). Agricultural Biotechnology and Rural Development in Latin America and the Caribbean. Sustainable Development Department. Van Noordwijk, M.; Joshi, L.; Agus, F.; Hairiah, K.; Suprayogo, D.; Verbist, B.; forthcoming. Managing agricultural landscapes so that they maintain watershed functions as well as are productive. Proceedings 25th Anniversary Conference of the World Agroforestry Centre, Nairobi, Kenya. Van Noordwijk, M.; van Roode, M.; McCallie, E.L.; Lusiana, B. (1998). Erosion and sedimentation as multi-scale, fractal processes: Implications for models, experiments and the real world. In: Penning de Vries, F.W.T., Agus, F., Kerr, J. (Eds.), Soil Erosion at Multiple Scales. CAB International, Wallingford, UK, pp. 223-253. VeneKlasen, L.; Miller, V. (2002). A New Weave of Power, People and Politics. The Action Guide for Advocacy and Citizen Participation. World Neighbours, Oklahoma City, Oklahoma, USA. Wester, P. ; Merrey, D.J. ; de Lange, M. (2003). Boundaries of consent: Stakeholder representation in river basin management in Mexico and South Africa. World Dev. 31(5), 797-812. White, T.A., Runge,C.F. (1995). The emergence and evolution of collective action: Lessons from watershed management in Haiti. World Dev. 23, 1683-1698.