annual report 2012-13 dalmia bharat sugar and ......your company entered the state of maharashtra by...
TRANSCRIPT
ANNuAl RepoRt 2012-13 Dalmia Bharat Sugar anD inDuStrieS limiteD
Business Overview
About Dalmia Bharat Sugar............................... 10
practicing Values............................................... 12
Achievements.................................................... 13
2012-13 at a Glance.......................................... 14
Financial Highlights........................................... 16
letter to Shareholders....................................... 18
Management Reports
Management Discussion and Analysis.............. 20
Directors’ Report............................................... 38
Corporate Governance Report.......................... 44
Financial Statements
Standalone Financial Statements...................... 58
Consolidated Financial Statements................... 91
Cont
ent
Forward-looking statements
In this annual report we have disclosed forward-looking information to offer investors a perspective on our planned growth trajectory, intrinsic value creation and broader prospects. This should help take informed investment decisions. The forward-looking statements contained in this report set out anticipated results based on the management’s plans and informed assumptions. We have tried wherever possible to identify such statements by using words such as ‘anticipate’, ‘estimate’, ‘expect’, ‘project’, ‘intend’, ‘plan’, ‘believe’ and words of similar import, in context of any discussion on future performance. While we have exercised the greatest caution and responsibility, have satisfied ourselves on due diligence, we cannot guarantee that these forward-looking statements will be realized in part or in full measure.
Creating and enhancing sustainable value has
been our focus.
We have concentrated on building integrated
capacities and achieving economies of scale
through optimal resource utilisation. Our focus is
centered on adding scale through geographical
diversification, strengthening the bond with growers
and furthering our policy of truly inclusive growth.
Sustained Value Creation
Growth Efficiency Scale Inclusion
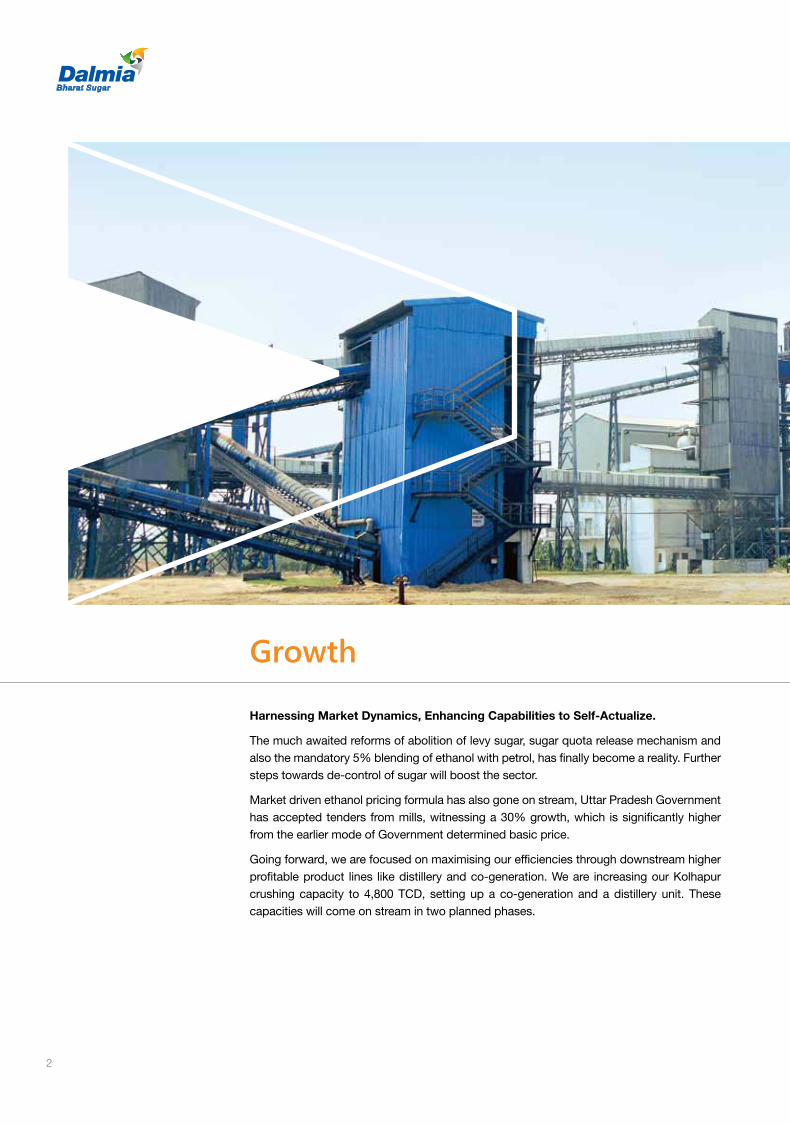
Harnessing Market Dynamics, Enhancing Capabilities to Self-Actualize.
The much awaited reforms of abolition of levy sugar, sugar quota release mechanism and also the mandatory 5% blending of ethanol with petrol, has finally become a reality. Further steps towards de-control of sugar will boost the sector.
Market driven ethanol pricing formula has also gone on stream, Uttar Pradesh Government has accepted tenders from mills, witnessing a 30% growth, which is significantly higher from the earlier mode of Government determined basic price.
Going forward, we are focused on maximising our efficiencies through downstream higher profitable product lines like distillery and co-generation. We are increasing our Kolhapur crushing capacity to 4,800 TCD, setting up a co-generation and a distillery unit. These capacities will come on stream in two planned phases.
Growth
2

Business Overview Management Reports Financial Statements
We are expanding our Kolhapur crushing capacity to 4,800 TCD and also setting up a co-generation and a distillery unit.
Power Plant, Jawaharpur, U.P.
3
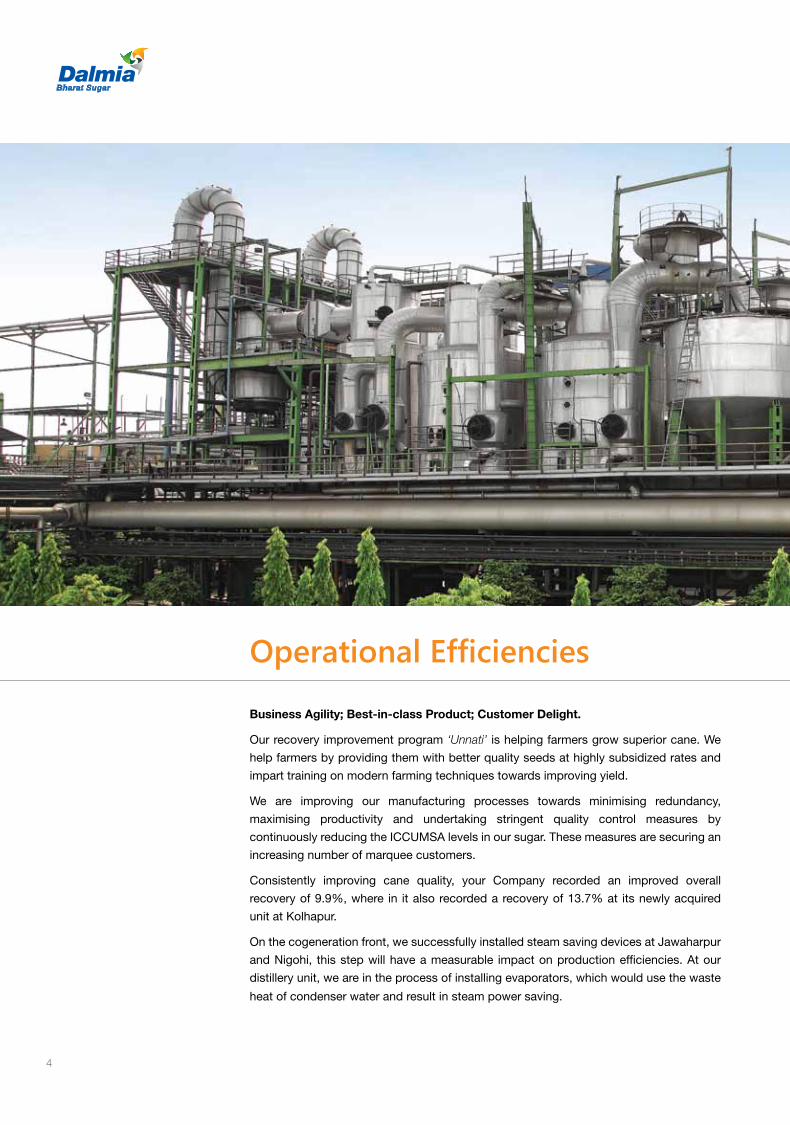
Business Agility; Best-in-class Product; Customer Delight.
Our recovery improvement program ‘Unnati’ is helping farmers grow superior cane. We
help farmers by providing them with better quality seeds at highly subsidized rates and
impart training on modern farming techniques towards improving yield.
We are improving our manufacturing processes towards minimising redundancy,
maximising productivity and undertaking stringent quality control measures by
continuously reducing the ICCUMSA levels in our sugar. These measures are securing an
increasing number of marquee customers.
Consistently improving cane quality, your Company recorded an improved overall
recovery of 9.9%, where in it also recorded a recovery of 13.7% at its newly acquired
unit at Kolhapur.
On the cogeneration front, we successfully installed steam saving devices at Jawaharpur
and Nigohi, this step will have a measurable impact on production efficiencies. At our
distillery unit, we are in the process of installing evaporators, which would use the waste
heat of condenser water and result in steam power saving.
Operational Efficiencies
4
Business Overview Management Reports Financial Statements
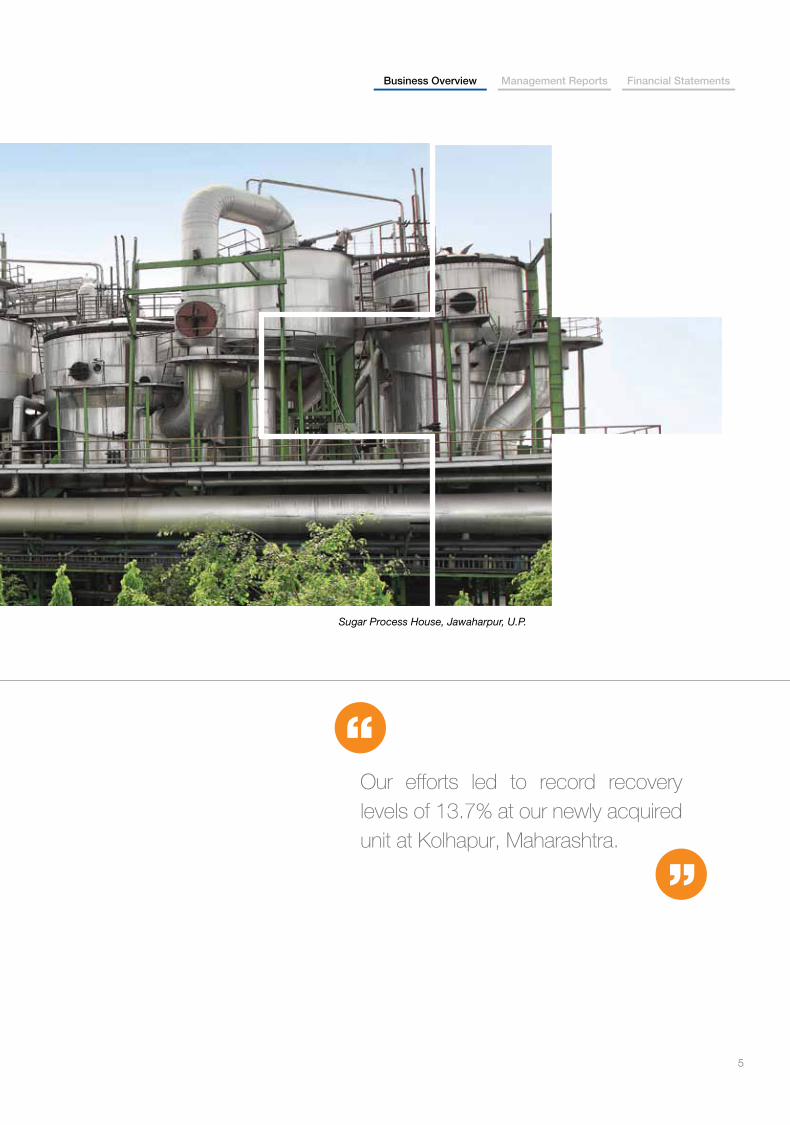
Sugar Process House, Jawaharpur, U.P.
Our efforts led to record recovery levels of 13.7% at our newly acquired unit at Kolhapur, Maharashtra.
5
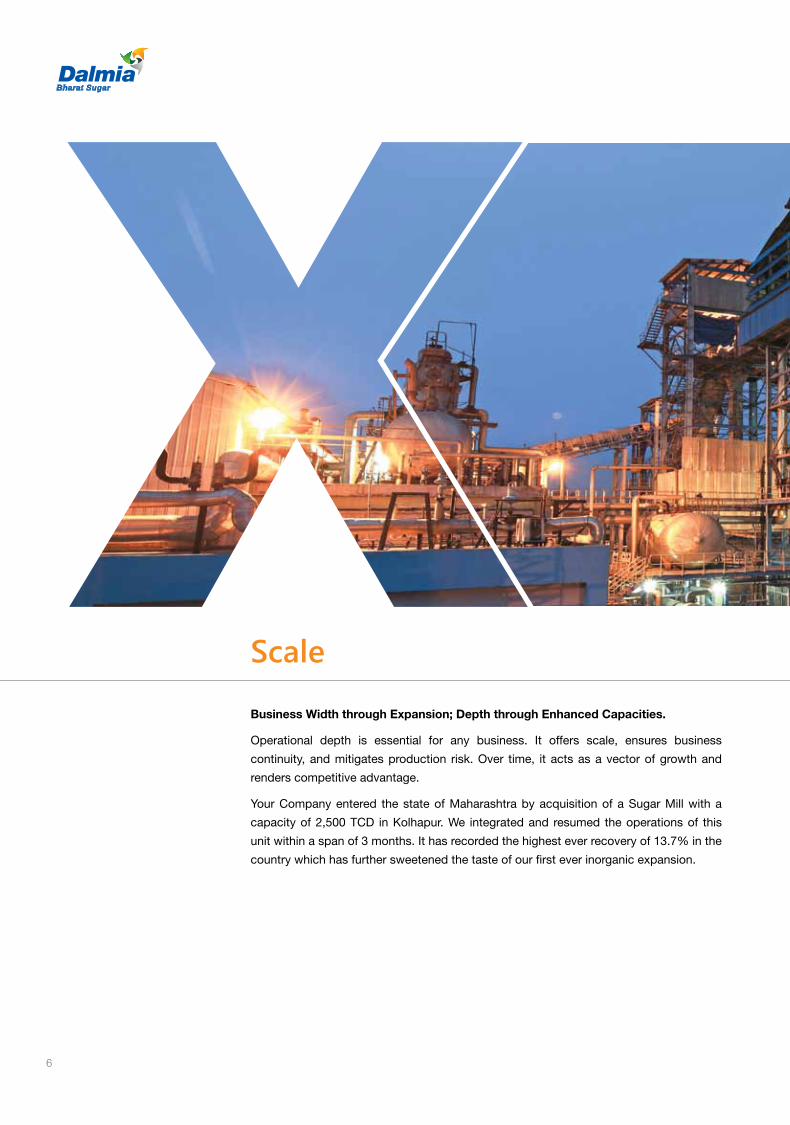
Scale
Business Width through Expansion; Depth through Enhanced Capacities.
Operational depth is essential for any business. It offers scale, ensures business
continuity, and mitigates production risk. Over time, it acts as a vector of growth and
renders competitive advantage.
Your Company entered the state of Maharashtra by acquisition of a Sugar Mill with a
capacity of 2,500 TCD in Kolhapur. We integrated and resumed the operations of this
unit within a span of 3 months. It has recorded the highest ever recovery of 13.7% in the
country which has further sweetened the taste of our first ever inorganic expansion.
6
Business Overview Management Reports Financial Statements
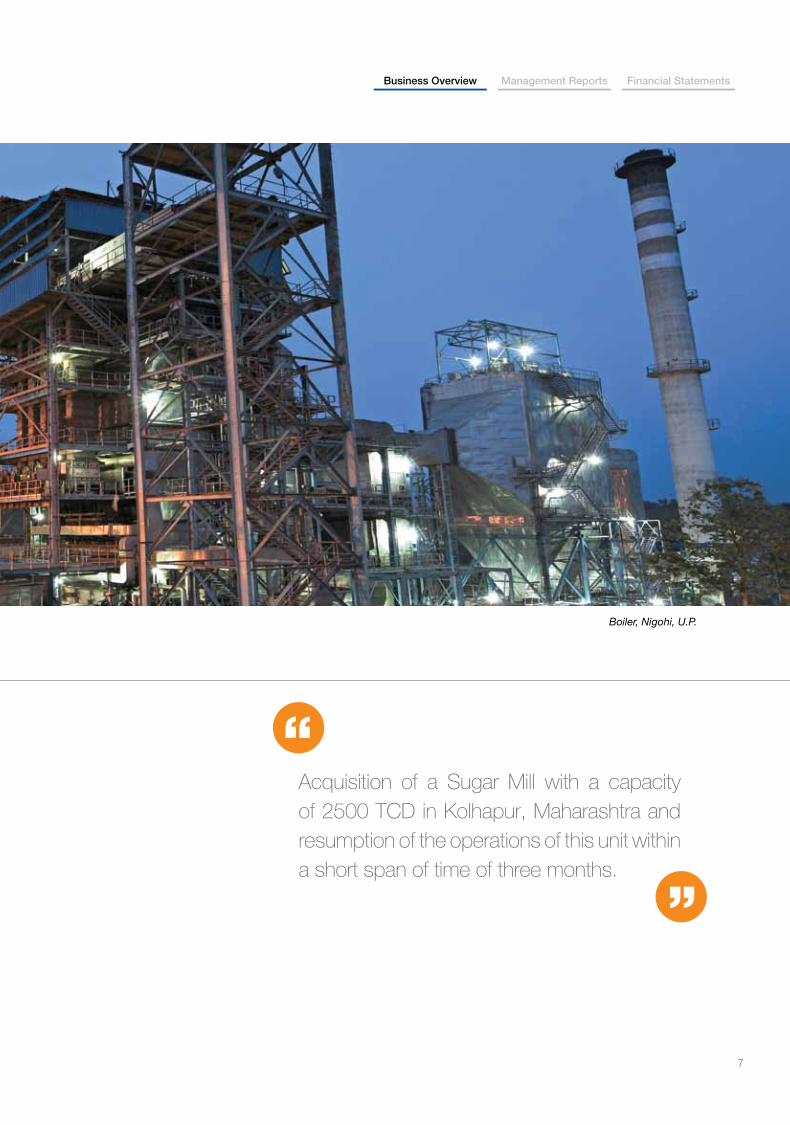
Boiler, Nigohi, U.P.
Acquisition of a Sugar Mill with a capacity of 2500 TCD in Kolhapur, Maharashtra and resumption of the operations of this unit within a short span of time of three months.
7

Inclusion
Creating Value for each Stakeholder.
At Dalmia we believe that an enterprise becomes a sustainable success in the true sense
of the word only when it cares to address the interest of all its stakeholders including the
community, farmers, employees, lenders, environment and investors among others.
As a responsible corporate citizen, Dalmia respects the interest of the community, in
which it operates and is constantly seeking out opportunities to reach out to them and
contribute to their well-being. Our effort is to make quality of life a right for everyone
living in vicinity of the plants, by providing them with healthcare services, education and
livelihood opportunities. Farmers are an integral part of our community and we have been
working closely with them to help improve their farming techniques and productivity.
We provide them with practical solutions for achieving high yield crop by teaching them
methods related to soil testing, plantation of the crop, timely cultivation etc.
We firmly believe that engaged employees are the growth and progress propellers of the
organisation.
8
Business Overview Management Reports Financial Statements
As an environmentally committed organisation, we invest to
protect, preserve and enhance green covers in the vicinity
of our plants. To further strengthen our green initiatives, we
have completed the Clean Development Mechanism (CDM)
registration under the Renewable Energy Certification (REC)
mechanism.
Through incisive and detailed planning, robust operations,
cost efficiencies and sustainable business practices we
constantly enhance stakeholders value.
Through incisive and detailed planning, robust operations, cost efficiencies and sustainable business practices we constantly enhance stakeholders value.
9
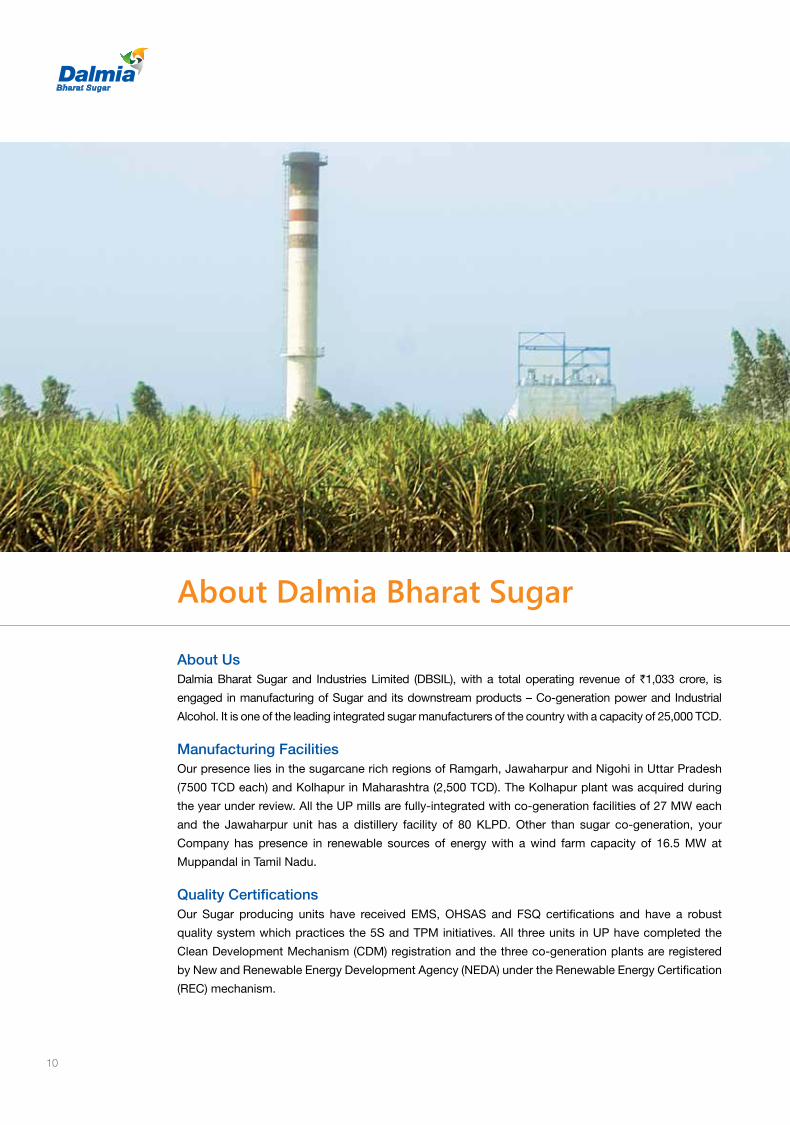
About Dalmia Bharat Sugar
About UsDalmia Bharat Sugar and Industries Limited (DBSIL), with a total operating revenue of `1,033 crore, is
engaged in manufacturing of Sugar and its downstream products – Co-generation power and Industrial
Alcohol. It is one of the leading integrated sugar manufacturers of the country with a capacity of 25,000 TCD.
Manufacturing FacilitiesOur presence lies in the sugarcane rich regions of Ramgarh, Jawaharpur and Nigohi in Uttar Pradesh
(7500 TCD each) and Kolhapur in Maharashtra (2,500 TCD). The Kolhapur plant was acquired during
the year under review. All the UP mills are fully-integrated with co-generation facilities of 27 MW each
and the Jawaharpur unit has a distillery facility of 80 KLPD. Other than sugar co-generation, your
Company has presence in renewable sources of energy with a wind farm capacity of 16.5 MW at
Muppandal in Tamil Nadu.
Quality CertificationsOur Sugar producing units have received EMS, OHSAS and FSQ certifications and have a robust
quality system which practices the 5S and TPM initiatives. All three units in UP have completed the
Clean Development Mechanism (CDM) registration and the three co-generation plants are registered
by New and Renewable Energy Development Agency (NEDA) under the Renewable Energy Certification
(REC) mechanism.
10
Business Overview Management Reports Financial Statements
Ramgarh
Jawaharpur
Nigohi
Delhi
Wind Farm
Sugar Plants
Magnesite Mines
Corporate Office
Kolhapur
Salem
Muppandal
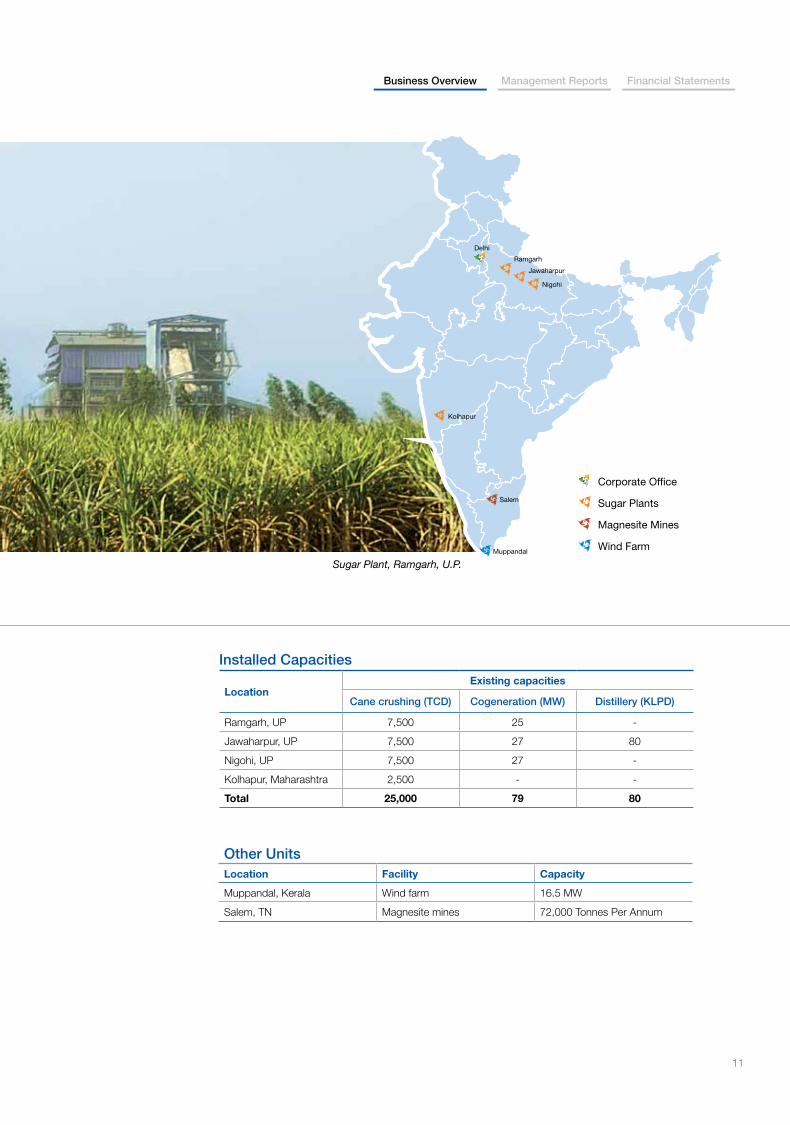
Installed Capacities
LocationExisting capacities
Cane crushing (TCD) Cogeneration (MW) Distillery (KLPD)
Ramgarh, UP 7,500 25 -
Jawaharpur, UP 7,500 27 80
Nigohi, UP 7,500 27 -
Kolhapur, Maharashtra 2,500 - -
Total 25,000 79 80
Other UnitsLocation Facility Capacity
Muppandal, Kerala Wind farm 16.5 MW
Salem, TN Magnesite mines 72,000 Tonnes Per Annum
Sugar Plant, Ramgarh, U.P.
11

Practicing Values
enduring valuesnew think
ExcellenceEarth represents Excellence. Its
ability to withstand extreme heat
and pressure is essential for taking
on big challenges.
SpeedAir denotes Speed. It empowers
and evokes passion, nurtures
growth.
Water is representative of Teamwork.
As a natural, free flowing, pleasant
solvent, water embodies the
qualities of trust, mutual respect
and collaboration.
TeamworkLearning
Fire represents Learning. Fire
within, is the source of curiosity,
which spurs learning. The creative
application of learning in turn,
fosters innovation.
12
Business Overview Management Reports Financial Statements
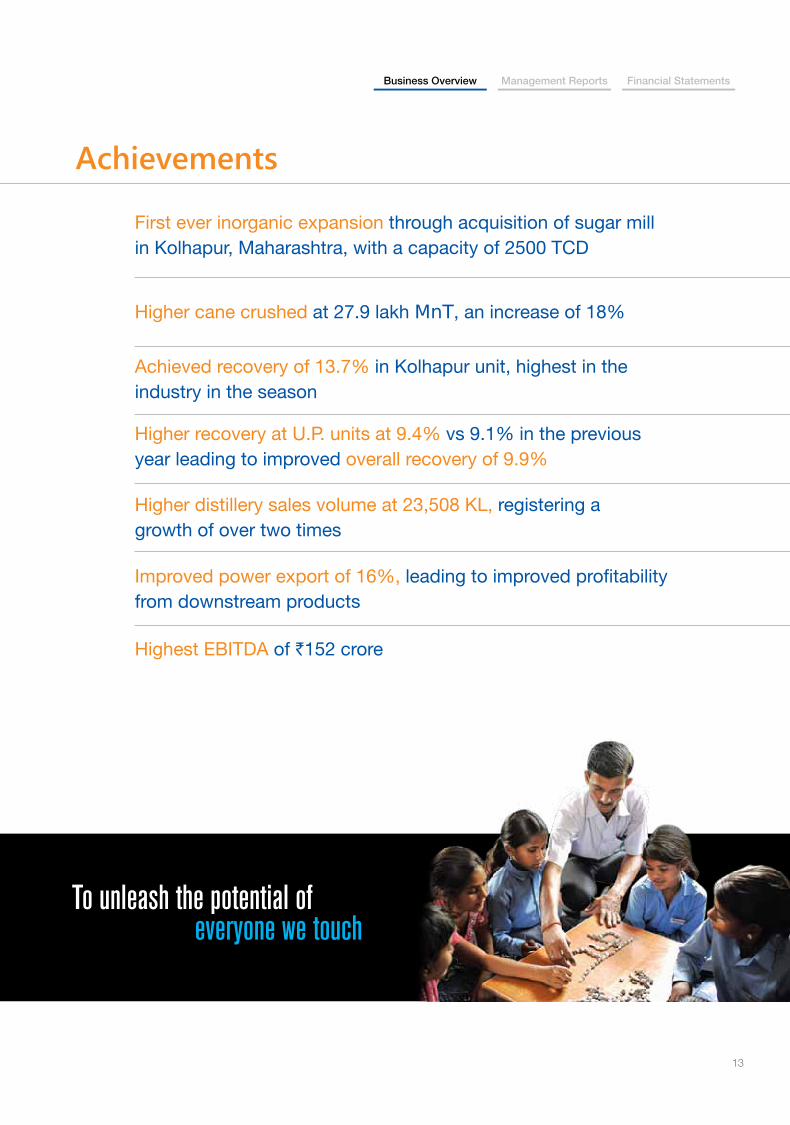
Achievements
To unleash the potential of everyone we touch
First ever inorganic expansion through acquisition of sugar mill in Kolhapur, Maharashtra, with a capacity of 2500 TCD
Higher cane crushed at 27.9 lakh MnT, an increase of 18%
Achieved recovery of 13.7% in Kolhapur unit, highest in the industry in the season
Higher distillery sales volume at 23,508 KL, registering a growth of over two times
Higher recovery at U.P. units at 9.4% vs 9.1% in the previous year leading to improved overall recovery of 9.9%
Improved power export of 16%, leading to improved profitability from downstream products
Highest EBITDA of `152 crore
13
Operations
• Improved cane crushing by 18% from 23.6 lakh tonnes, to 27.9 lakh tonnes in FY13
• Registered a growth of 33% in sugar production, 15% in power generation and 94% in
distillery production
• Entitled to receive REC benefits from National Load Dispatch Center (NLDC), which is the
designated central agency for REC mechanism
• Completed the installation of steam saving devices at Jawaharpur and Nigohi
• Received QMS (Quality Management System), FSMS (Food Safety Management System),
EMS (Environmental Management System) and OHSAS (Occupational Health and Safety
Assessment Series) certification for all the three units of U.P.
2012-13 at a Glance
Expansion
• Expanding the Kolhapur capacity by 2,300 TCD, along with a co-generation plant and a
distillery unit for manufacturing industrial alcohol
14
Business Overview Management Reports Financial Statements
Integration
• Acquired, integrated and turned around the non-operational Kolhapur plant in a record
time of three months
• Implemented ERP and integrated the HR team at Kolhapur within demanding timelines
Outcome
• Achieved sales volume growth of 22% in sugar, 16% in power and 249% in ethanol
• Improved revenues from operations by 36% from `762 crore to `1,033 crore
• Reported the highest ever EBITDA at `152 crore as compared to `85 crore in the previous
year, an increase of 79%
Recognition
• Bagged the Global PRCI Award for “Khushaal Kissan Ganna Abhiyaan”, a documentary film
on improving sugarcane yield
• Received the Best Annual Report award in the Global PRCI award
• Placed in the top 25 rankings in the Great Place to Work survey.
15

Particulars 2012-13 2011-12 2010-11
Total Operating Revenue ` Crore 1,033 762 694
Operating Profit (EBITDA) ` Crore 152 85 65
Cash Profits ` Crore 92 42 41
Profits Before Tax (PBT) ` Crore 19 1 1
Profit After Tax (PAT) ` Crore 18 1 4
Share Capital ` Crore 16 16 16
Reserves & Surplus ` Crore 443 425 425
Loan Funds ` Crore 786 710 659
Net Block ` Crore 652 579 606
Net Current Assets ` Crore 92 193 188
Operating Profit Margin % 15 12 12
EPS (fully diluted) ` 2.3 0.1 0.5
Cash EPS (fully diluted) ` 11.3 5.5 4.9
Net Debt Equity Ratio x 1.6 1.4 1.3
Interest Coverage x 1.3 1.0 1.0
Current Ratio x 1.1 1.3 1.4
Dividend Rate % 11 - 13
Dividend Payout Ratio % 13 - 53
Share Price ` 14 14 24
Market Capitalization ` Crore 114 112 197
Segmental Overview 2012-13 2011-12 2010-11
Sugar
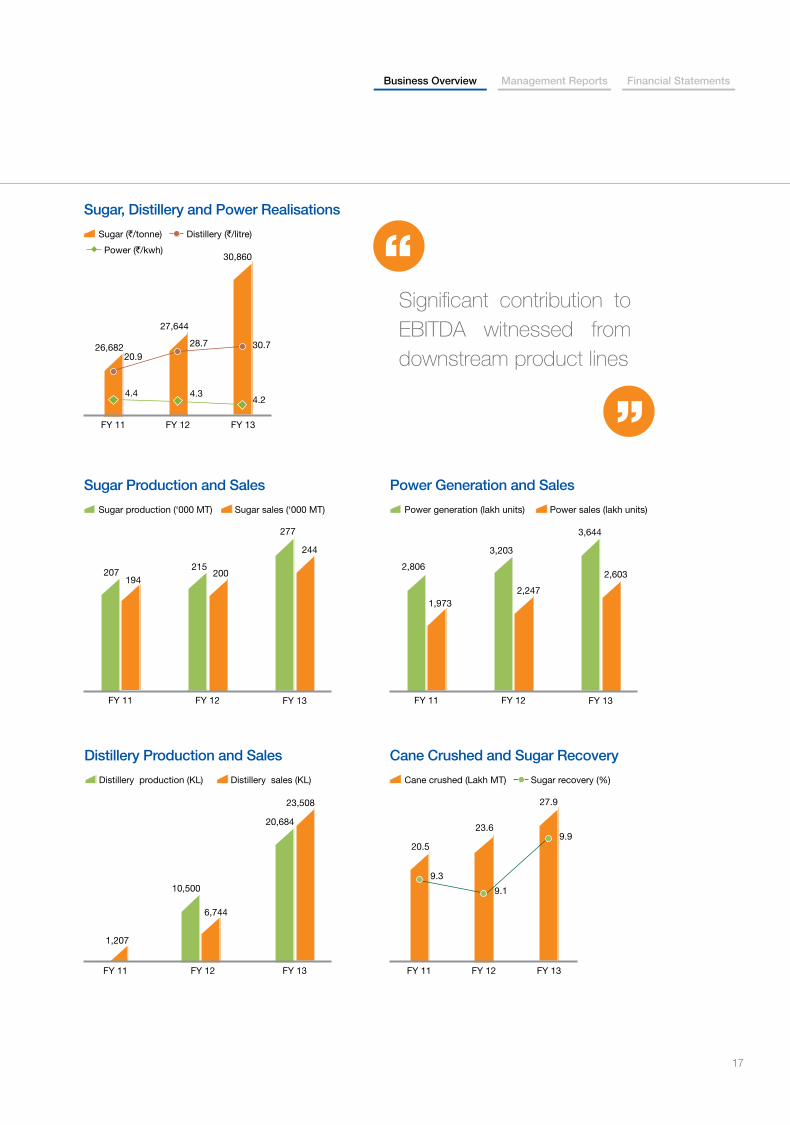
Sales Realisations `/MnT 30,860 27,644 26,682
Production '000 MnT 277 215 207
Sales ‘000 MnT 244 200 194
Co-generation
Power Realisation `/MnT 4.18 4.27 4.36
Power Generation lakh Kwh units 3,644 3,203 2,806
Power Export lac units 2,603 2,247 1,973
Distillery
Sales Realisations `/Litre 30.68 28.65 20.89
Ethanol Production Kilo litres 20,684 10,500 -
Ethanol Sales (Kilo litres) Kilo litres 23,508 6,744 1,207
Financial Highlights
16
Business Overview Management Reports Financial Statements
FY 11 FY 12 FY 13
244
277
200215
194207
Sugar Production and Sales
Sugar production (‘000 MT) Sugar sales (‘000 MT)
FY 11 FY 12 FY 13
2,603
3,644
2,247
3,203
1,973
2,806
Power Generation and Sales
Power generation (lakh units) Power sales (lakh units)
FY 11 FY 12 FY 13
27.9
23.6
20.5
Cane Crushed and Sugar Recovery
Cane crushed (Lakh MT) Sugar recovery (%)
9.3
9.1
9.9
FY 11 FY 12 FY 13
30,860
27,644
26,682
Sugar, Distillery and Power Realisations
Sugar (`/tonne) Distillery (`/litre)
Power (`/kwh)
4.4 4.34.2
20.928.7 30.7
Distillery Production and Sales
Distillery production (KL) Distillery sales (KL)
FY 11 FY 12 FY 13
10,500
6,744
20,684
23,508
1,207
Significant contribution to EBITDA witnessed from downstream product lines
17
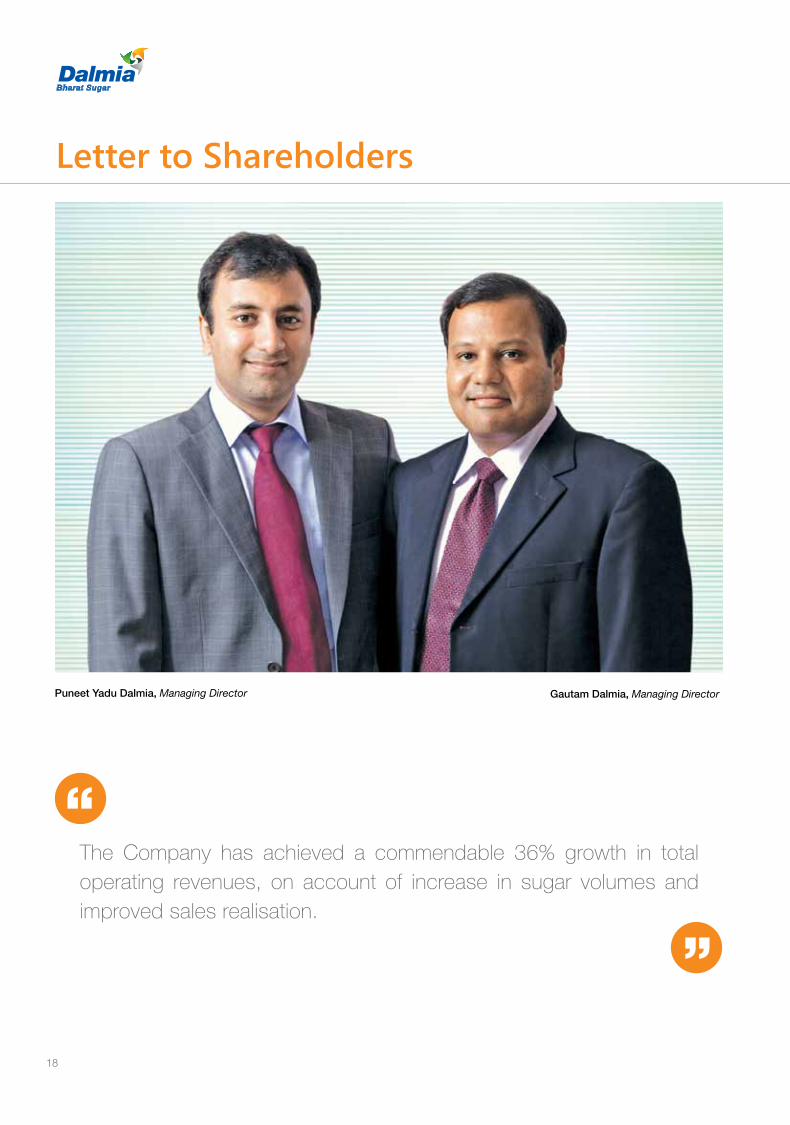
Letter to Shareholders
Puneet Yadu Dalmia, Managing Director Gautam Dalmia, Managing Director
The Company has achieved a commendable 36% growth in total operating revenues, on account of increase in sugar volumes and improved sales realisation.
18
Business Overview Management Reports Financial Statements
With an intent to reduce the business risk through geographical diversification, your company successfully established its footprint in western India by acquiring a sugar mill, with a cane crushing capacity of 2,500 TCD, in Kolhapur, Maharashtra.
After scaling up its operations over the last five years, your company has decided to grow inorganically, which has led to increased cane crushing capacity to 25,000 TCD. The strategy also involves comprehensive integrated operations supported by co-generation power plant and coupled with a distillery unit. Building scale with self-sustained integrated model would continue to remain an integral part of our strategy going forward.
The Company is also expanding its cane crushing capacity in its Kolhapur Unit to 4,800 TCD from existing 2,500 TCD, along with a co-generation and a distillery unit. With the completion of all the capacity expansions, your company will have a total cane crushing capacity of 27,300 TCD.
A continuous commitment of timely delivery and quality as per the specifications to the end users has enabled us to become the preferred quality sugar supplier to various multinational food and beverages companies across the country.
The Company has achieved a commendable 36% growth in total operating revenue at `1,033 crore. This was driven by increase in sugar volumes by 22% and improved average sales realisation by 12%. The company earned an operating profit of `152 crore, as against `85 crore, an increase of 79%, due to all round efficiencies. Similarly the net profit was also higher at `18 crore as against `1 crore. We would continue to work towards achieving higher operational efficiencies.
We would like to thank each and every one of our employees, our prime asset, for their continuous dedication and commitment. We would also like to thank all our vendors, business associates, partners, lenders and stakeholders for their continued faith and support.
Dear Shareholders,
We are pleased to address you in a year where your company has been able to deliver significant growth and performance despite numerous macro-economic and industry challenges.
Puneet Yadu DalmiaGautam Dalmia
19
Management Discussion and Analysis
EconomyDuring the year in review, India’s macroeconomics stood at the crossroads. Slowing GDP growth at 5%
and a huge fiscal deficit at 5.75% of GDP were major worries. The average annual inflation rate was at
7.8%, while industrial growth was a mere 3.1%. Industrial growth has declined significantly in the last
two years owing to monetary tightening. This has caused borrowing costs to rise and investments to
fall. The capital expenditure growth for FY13 as per the revised estimates is at 7% while the projected
capex growth as per budgeted estimates for FY14, is at 36.6%, forecasting robust economic growth.
Trade deficit during FY13 was at $188 billion, a slight 0.7% lower than FY12. Current Account Deficit
for FY13 is estimated at $70 billion, 3.7% of GDP. There was a slump in exports by 6% and in import by
4%. The decline of growth in exports in the last few months of the previous year had continued through
FY13 mainly due to global slowdown.
The overall growth rate of GDP is expected to be over 6% in 2013-14. The Union Budget has targeted
a lower fiscal deficit of 4.8% of GDP for FY14 based on certain assumptions made in the budget:
20
high GDP growth rate, receipts from disinvestment and
telecom spectrum sale. Demand compression and easing
of supply-side constraints are likely to lower inflation, which
might result in lowering of interest rates by Central Bank,
to boost investments and growth. The central bank has
already eased the policy rates with a 125-bps cut in the repo
rate and a 200-bps cut in the CRR since January’12. WPI
inflation in April’13 eased to a 41-month low of 4.9% led by
a sharp softening in manufactured products inflation. Core
inflation slipped to 2.8%.
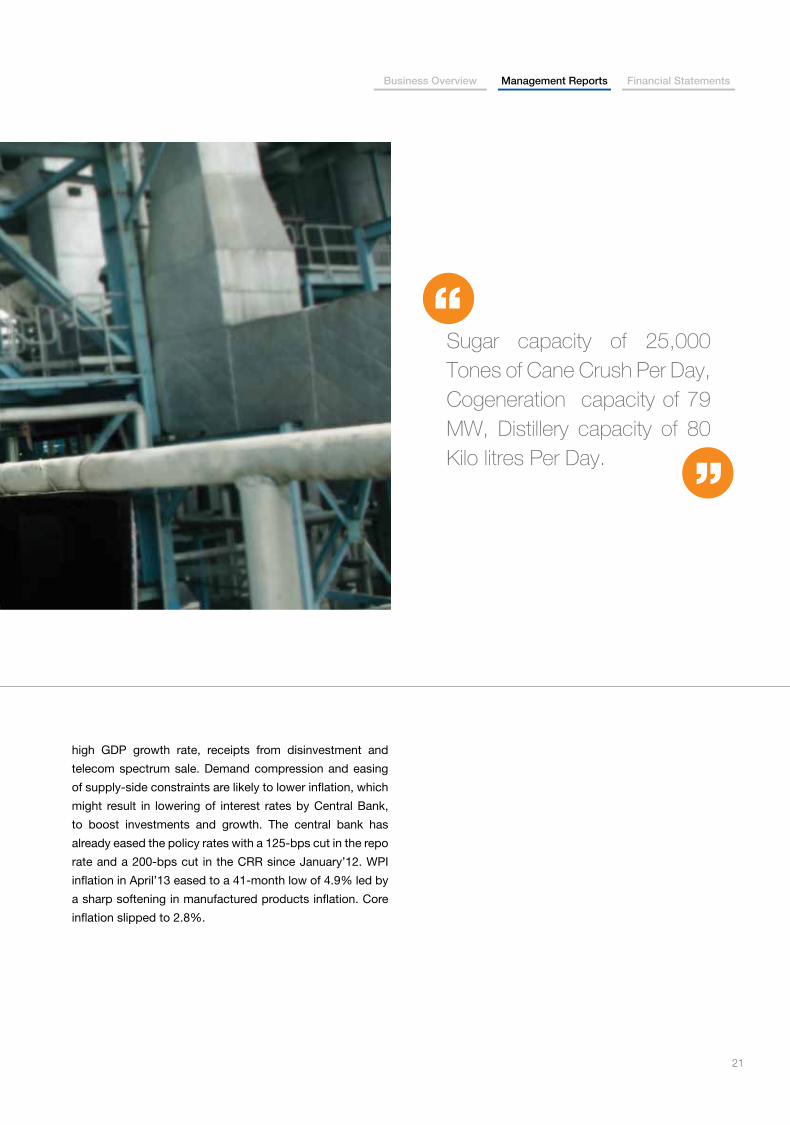
Sugar capacity of 25,000 Tones of Cane Crush Per Day, Cogeneration capacity of 79 MW, Distillery capacity of 80 Kilo litres Per Day.
21
Business Overview Management Reports Financial Statements
Sugar Industry OverviewGlobal Sugar Scenario
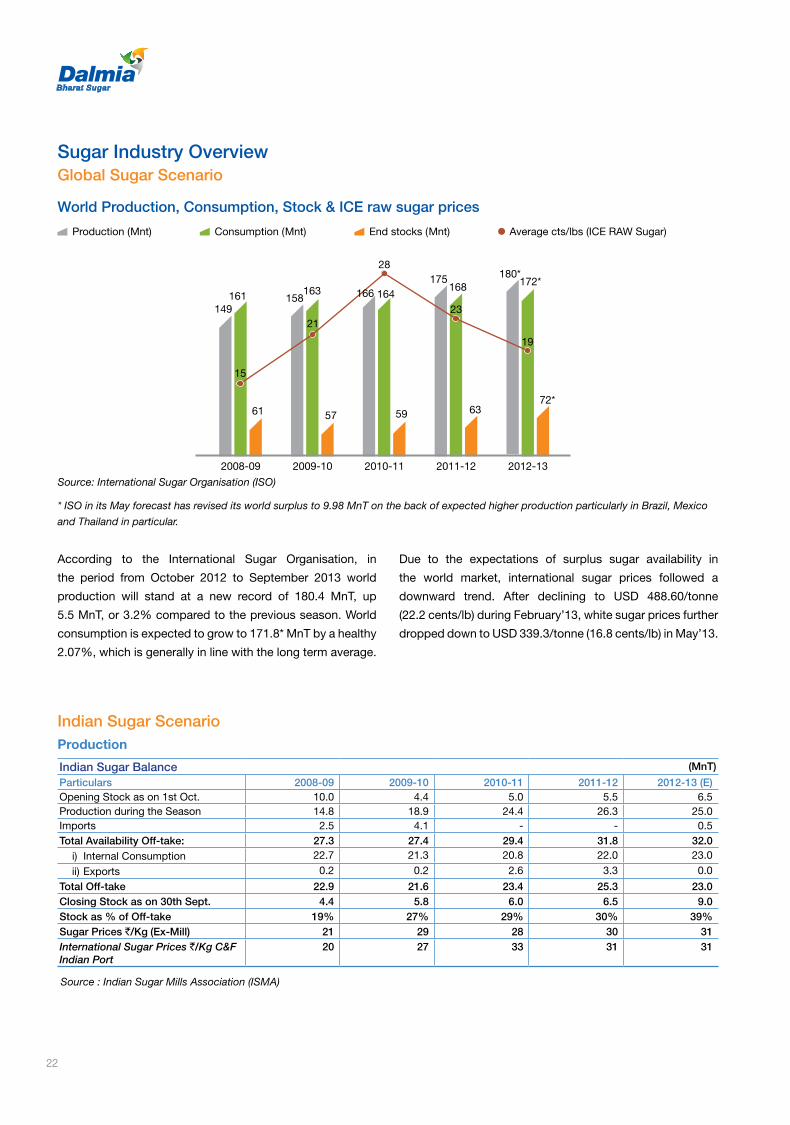
According to the International Sugar Organisation, in
the period from October 2012 to September 2013 world
production will stand at a new record of 180.4 MnT, up
5.5 MnT, or 3.2% compared to the previous season. World
consumption is expected to grow to 171.8* MnT by a healthy
2.07%, which is generally in line with the long term average.
Due to the expectations of surplus sugar availability in
the world market, international sugar prices followed a
downward trend. After declining to USD 488.60/tonne
(22.2 cents/lb) during February’13, white sugar prices further
dropped down to USD 339.3/tonne (16.8 cents/lb) in May’13.
Indian Sugar ScenarioProduction
Indian Sugar Balance (MnT)
Particulars 2008-09 2009-10 2010-11 2011-12 2012-13 (E)Opening Stock as on 1st Oct. 10.0 4.4 5.0 5.5 6.5Production during the Season 14.8 18.9 24.4 26.3 25.0Imports 2.5 4.1 - - 0.5Total Availability Off-take: 27.3 27.4 29.4 31.8 32.0
i) Internal Consumption 22.7 21.3 20.8 22.0 23.0
ii) Exports 0.2 0.2 2.6 3.3 0.0
Total Off-take 22.9 21.6 23.4 25.3 23.0Closing Stock as on 30th Sept. 4.4 5.8 6.0 6.5 9.0Stock as % of Off-take 19% 27% 29% 30% 39%Sugar Prices `/Kg (Ex-Mill) 21 29 28 30 31International Sugar Prices `/Kg C&F Indian Port
20 27 33 31 31
Source : Indian Sugar Mills Association (ISMA)
Source: International Sugar Organisation (ISO)
* ISO in its May forecast has revised its world surplus to 9.98 MnT on the back of expected higher production particularly in Brazil, Mexico
and Thailand in particular.
Average cts/lbs (ICE RAW Sugar)
22

The country’s total sugar production is expected to decrease
by 5% in SY13 to 25 MnT compared to 26.3 MnT in SY12.
The key sugar producing state of Uttar Pradesh exhibited
a growth of 7.6% from 6.97 MnT to 7.5 MnT in SY13, other
states like Karnataka and Tamil Nadu recorded lower sugar
production due to insufficient rainfall. Karnataka recorded
3.2 MnT in SY13 against 3.72 MnT in SY12 and Tamil Nadu
witnessed 1.45 MnT in SY13 against 1.65 MnT in SY12.
With an average recovery of 12% in Maharashtra (one of
the major sugar producing states) contributed 7.95 MnT in
SY13, a decrease of 12% from 8.95 MnT in SY12.
ConsumptionAccording to Indian Sugar Mills Association the total sugar
consumption for SY13 is estimated to be 23 MnT, which is
up by 4.5% from the total consumption of 22 MnT in SY12.
Considering lower global sugar prices, sugar exports from
India are expected to be marginal.
PricesDue to the concern of lower production in Maharashtra and
Karnataka, the financial year started with extreme buoyancy
in the sugar prices, in April’12 prices of M grade sugar in
Kanpur Market traded at `30,400/tonne and touched the
high of `38,900/tonne during September’12. However,
with the start of crushing season and carry forward
of surplus sugar stock of 1 MnT from the last season,
coupled with the anticipation of dispensing of sugar release
mechanism, due to which the sugar prices further retracted
with a downward trend and ended the financial year at
`34,000/tonne.
Juice Heater
40,000
35,000
30,000
25,000
20,000
15,000
10,000
5,000
0
Apr’12
May
’12
Jun’
12
Jul’1
2
Aug’1
2
Sep’1
2
Oct’1
2
Nov’1
2
Dec’1
2
Jan’
13
Feb’1
3
Mar
’13
34,070
M-Grade Sugar, Spot Prices Kanpur Market (`/Tonne)
23
Business Overview Management Reports Financial Statements
Regulatory EnvironmentThere were some positive signs from the Government as
The Prime Minister formed the Rangarajan Committee
to give recommendations on decontrol of sugar industry.
Recommendations of the committee were as follows:
1. Abolition of levy on sugar.
2. Abolition of release mechanism.
3. Stable trade policy with appropriate tariff on imports and
exports.
4. Discontinuation of compulsory jute packaging guidelines.
5. Market determined pricing of by-products. Revenue
sharing model under which 70% of sugar value and each
of its three major by-products would be paid to farmers.
6. Condition for minimum distance between two sugar mills
at 15 kms/25 kms to be dispensed with.
7. Freedom to farmers to sell cane to any mill irrespective of
distance in some states.
8. Determination of sugarcane price by linking it to the
revenue realised by sugar mills from sale of sugar and first
stage by-products.
Complete abolition of release mechanism has increased
expectations of positive hopes towards the sector being
deregulated.
On the recommendation of Cabinet Committee of Economic
Affairs (CCEA), the Government has abolished the levy quota
mechanism where sugar mills were obligated to sell 10% of
their total sugar production at fixed price to the government
for Public Distribution System (PDS). This has been made
applicable for sugar production from SY13 onwards. Hence,
with this the Central Government has directed states to buy
sugar at market prices for fulfilling their PDS requirements.
The Centre, in turn, would compensate states for the
difference between the market price and the regulated price.
However, the Government has fixed a ceiling of two years for
such payments. The dropping of levy obligation will boost
the profit margins of sugar mills marginally.
The CCEA decided the mandatory limit of compulsory
packing of sugar in jute bags to be 40%, effective from
Sugar Season 2012-13.
The Central Government has also directed various State
Governments to take further decisions on cane pricing
mechanism and distance criteria for further progress.
Higher Cane Costs Impacted Profitability
Yet again higher cane prices in U.P. during SY13 impacted
the earnings adversely for U.P. sugar mill owners.
In SY13, the U.P. Government announced state advisory
price (SAP) for Sugarcane at `275-290 per quintal, which
were substantially higher by over 20% from the previous
season price of `240 per quintal. Whereas, `290 per quintal
was fixed for early variety crop, while `280 per quintal was
for the normal variety. For rejected variety, the farmers were
entitled for `275 a quintal.
The effective sugarcane prices in Maharashtra were at par
with U.P. as the prevalent market determined prices paid by
the sugar mills were `250/quintal, wherein, harvesting and
transportation charges of approximately `47.5-50.0/quintal
were levied over and above this.
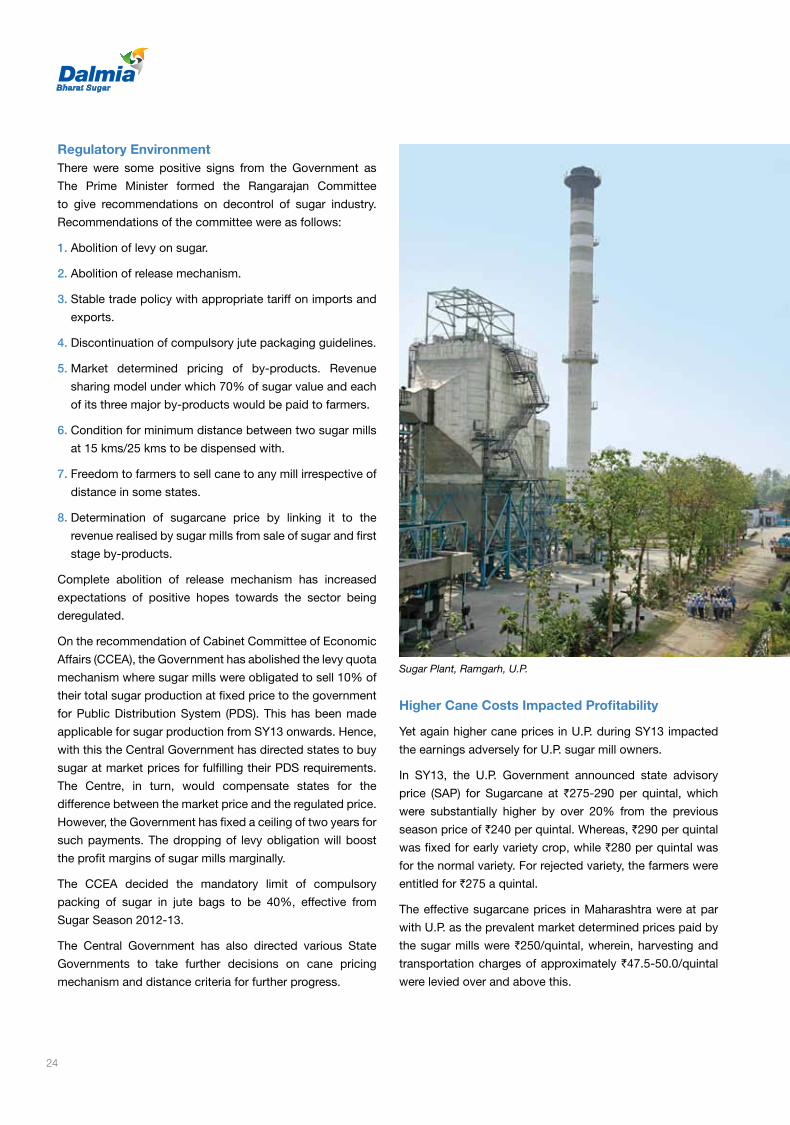
Sugar Plant, Ramgarh, U.P.
24
Outlook- Sugar Season 2013-14Sugar production is expected to drop due to drought
conditions in Karnataka, Maharashtra and up to a certain
extent in Tamil Nadu. A marginal increase in sugar production
is expected in Uttar Pradesh and other northern states. With
a carry forward stock surplus of 1 MnT in SY12-13, sugar
availability in India will be healthy.
Sugar prices are expected to be subdued and remain range
bound for the coming season also, unless increase of import
duty from existing 10% to 30% is not mandated by the
Government.
As foreseen last year we have seen increased cane
production this sugar year. Considering farmers being paid
high remuneration for cane this season year also, we again
expect better cane crop going forward in the next sugar
season, especially in U.P. and other northern states.
Business OverviewYour Company is one of the leading producers of sugar in
Uttar Pradesh, the second largest sugar producing state in
the country. It has four integrated sugar plants, with a total
cane crushing capacity of 25,000 TCD (tonnes crushed
per day), located at Ramgarh, Jawaharpur, Nigohi in U.P.
and Kolhapur in Maharashtra. The Company has distillery
capacity of 80 KLPD at Jawaharpur. The Company also have
a co-generation capacity of 79 MW, out of which two third
is exportable.
All the three units in U.P. are certified under Environmental
Management System (EMS), Quality Management System
(QMS), Food Safety Management System (FSMS) and
Occupational Health and Safety Assessment Series
(OHSAS).
The Company also has a wind farm capacity of 16.5 MW,
located at Muppandal, Tamil Nadu, taking the total renewable
energy capacity to 96 MW.
Sugar - Business OverviewBreakthrough Acquisition
During FY13, your Company acquired a sugar mill, Shree
Datta SSK Co-Operative, located in the district of Kolhapur,
Maharashtra with a cane crushing capacity of 2,500 TCD.
The geographical location of Maharashtra is extremely
favorable for cane production and higher sugar recovery.
This acquisition has enabled your company to mark its entry
into a newer geography. This acquisition also reinforces the
aspiration of your Company to become a pan-India sugar
producer.
The operations of this sugar mill were re-commenced in a
very short period of time after its acquisition; we crushed
3.45 lakh tonnes of sugar cane during the year and produced
47,160 tonnes with an above industry average recovery of
13.7%, which is recorded as highest in the industry during
the current sugar season.
Your Company is also planning to expand the newly acquired
unit, by increasing its sugar crushing capacity to 4,800 TCD,
installing a co-generation unit and an industrial Alcohol
distillery unit. This expansion is expected to be operational
in two phases.
Engineering consultants for the expansion have been
appointed and preliminary site activities have commenced.
Pollution clearances are under progress. Orders for major
equipment have already been placed. Civil work for the
project has commenced in December 2012.
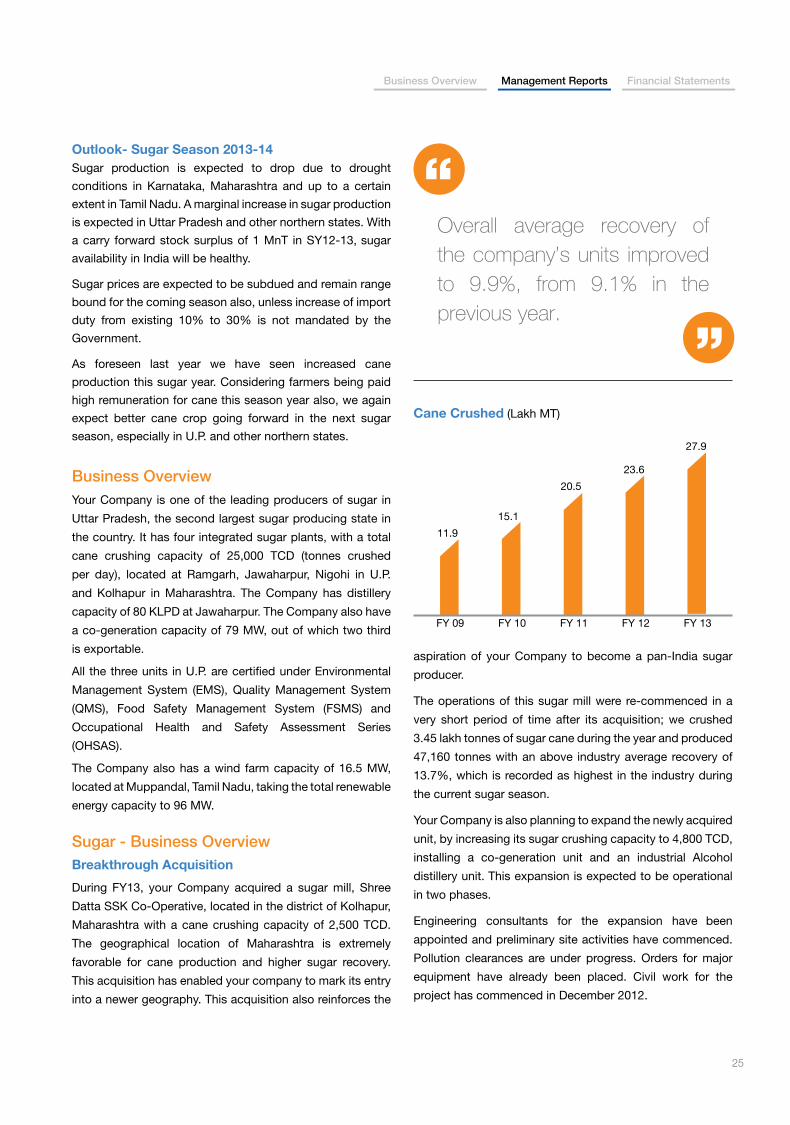
Overall average recovery of the company’s units improved to 9.9%, from 9.1% in the previous year.
Cane Crushed (Lakh MT)
25
Business Overview Management Reports Financial Statements
Operational Highlights• Achieved our highest ever cane crush of 27.9 lakh MnT in
FY13, increase of 18% from 23.6 lakh MnT in FY12.
• Overall average recovery of the Company’s units improved
to 9.9 %, as compared to 9.1% in the previous year.
• UP Mills recovery stood at 9.4% in FY13 from 9.1% in
FY12.
• Maharashtra Mill recovery stood at 13.7% in FY13.
• Sugar production increased by 29% to 2.78 lakh MT
compared to 2.15 lakh MT in the previous year, owing
to higher cane crushing due to acquisition and improved
recoveries
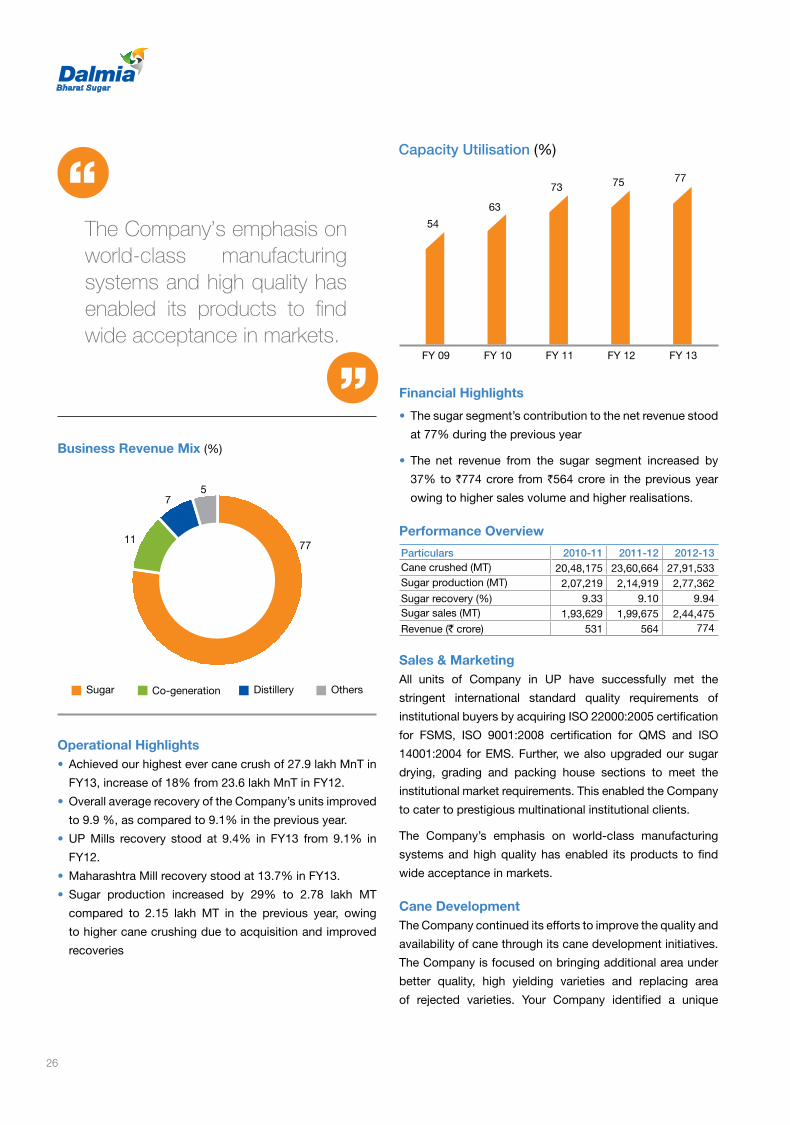
The Company’s emphasis on world-class manufacturing systems and high quality has enabled its products to find wide acceptance in markets.
Financial Highlights
• The sugar segment’s contribution to the net revenue stood
at 77% during the previous year
• The net revenue from the sugar segment increased by
37% to `774 crore from `564 crore in the previous year
owing to higher sales volume and higher realisations.
Performance Overview
Particulars 2010-11 2011-12 2012-13Cane crushed (MT) 20,48,175 23,60,664 27,91,533Sugar production (MT) 2,07,219 2,14,919 2,77,362Sugar recovery (%) 9.33 9.10 9.94Sugar sales (MT) 1,93,629 1,99,675 2,44,475Revenue (` crore) 531 564 774
Sales & MarketingAll units of Company in UP have successfully met the
stringent international standard quality requirements of
institutional buyers by acquiring ISO 22000:2005 certification
for FSMS, ISO 9001:2008 certification for QMS and ISO
14001:2004 for EMS. Further, we also upgraded our sugar
drying, grading and packing house sections to meet the
institutional market requirements. This enabled the Company
to cater to prestigious multinational institutional clients.
The Company’s emphasis on world-class manufacturing
systems and high quality has enabled its products to find
wide acceptance in markets.
Cane DevelopmentThe Company continued its efforts to improve the quality and
availability of cane through its cane development initiatives.
The Company is focused on bringing additional area under
better quality, high yielding varieties and replacing area
of rejected varieties. Your Company identified a unique
Co-generation
Business Revenue Mix (%)
Capacity Utilisation (%)
26

strategy and targeted growers with rejected variety and the
area under general variety. Having identified the number of
growers and the area, the Company distributed around 1.4
lakh quintals of better quality cane seed to around 5,425
growers covering an area of 2,092 hectares.
With the objective of providing practical solutions of
achieving high crop yield to the farmers, your Company
organised a road show for educating farmers. This initiative
helped us overcome issues like rising sugarcane cost and
low sugar recovery, due to which many sugar companies
were relocating to other states. The road show also assisted
farmers with knowledge of new ploughing techniques,
judicious use of fertilizers, importance of soil testing, timely
cultivation and better management of crop through new
technologies for improving productivity.
The initiative on the best farming practices and techniques
to farmers has helped them to improve the crop yield from
150-200 quintal per acre to 350-450 quintals per acre. This
directly increased the income of the farmers substantially.
This also led to the development and improvement in their
living standard.
Through this initiative your company reached out to one
lakh farmers covering 330 villages in Uttar Pradesh around
the three sugar plants in Ramgarh, Jawaharpur (Dist.
Sitapur) and Nigohi (Dist. Shahjahanpur). Your Company
also had Kisan Sewa Kendra located near its sugar mills to
address the farmer queries and provide incremental inputs
and assistance. The Kisan Sewa Kendras also distributed
fertilizers, pesticides, helped source seeds and farm
equipments, at subsidized prices to farmers.
Clearance of Farmer Arrears in Uttar PradeshHonouring the decision of Honorable Supreme Court of
India to release the cane arrears of farmers, your Company
immediately cleared all its dues totalling `25 crore. With
prudent strategy and conservative approach, your Company
had already made provisions for such a contingency in its
book of accounts.
Information Technology for Cane DevelopersYour Company has the vision and the spirit to adopt
new technologies available and their innovative use for
improvement in operational efficiencies and service delivery
to farmers. The Company has also invested in GPS (Global
Positioning System) technology and automated complete
field survey process to bring in efficiency, accuracy and
transparency in the system.
Business Overview Management Reports Financial Statements
27

It has successfully completed 100 % survey using about 200
HHT (hand held terminals) and recorded online data for plot
area, crop type and variety. The information is linked with
Google Maps and can be accessed from anywhere. This
initiative has resulted in accurate cane availability forecast,
better crushing planning, quality assurance, drawl and
recovery.
Information Technology for EmployeesThe Company launched its Intranet “SPARSH” last year which
is a single platform for employee engagement, collaboration
and knowledge management leading to excellence in all
endeavours. Multiple functional and collaborative features
have been added to increase its reach and to make it the
preferred gateway for employee interaction. Specialised
applications for performance management system, Safety
and Audit functions have enhanced the collaborative
capabilities.
Energy ConservationYour Company’s constant endeavour to conserve energy
and infuse even higher energy efficiency in its operations
has resulted in receiving recognition in the field of Energy
Conservation from various Government organisations in the
past. Your Company invested in a special energy and steam
saving project at Ramgarh sugar mill to reduce process
steam consumption. As a result of our continued efforts,
steam consumption at all our units has decreased, Steam
consumption percentage of per tonne of cane crushed in
our U.P. mills, which was around 54.91% in FY07 is currently
at 41.2%.
Distillery Boilers, Jawaharpur, U.P.
Steam Consumption (% of cane crushed)
41
28

OutlookGoing ahead, the Company is expecting to increase the
crushing capacity of its Kolhapur sugar plant from 2500
TCD to 4,800 TCD. The Company is also planning to further
integrate the unit by installing a co-generation plant and a
distillery unit.
The food and beverage industry continues to remain our
focus customer. We strive to increase our institutional sales
mix further, as this industry has been growing at 30% CAGR
in India and correspondingly the sugar requirement from this
segment has been growing at 15-20% compared to only 2%
for general consumption. Price realisation from this segment
is also better and fetches premium, but requires significant
quality control mechanism also.
Another focus area would be to increase the quantity of cane
crushed and continuing to improving its capacity utilisation.
Your company is also geared up to pursue every possibility
to reduce its costs.
Co-generation - Business OverviewOverviewThe Company has an integrated business model with
co-generation plants at all its units in UP, to de-risk itself
from the cyclical nature of the sugar industry and become
self-sufficient in power. The Company operates three
co-generation plants having a total capacity of 79 MW.
All the co-generation plants are certified as CDM (Clean
Development Mechanism) projects, enabling the Company
to earn tradable CER credits.
The Central Electricity Regulatory Commission (CERC)
had notified Regulations on Renewable Energy Certificate
(REC) aimed at promoting power generation from renewable
sources for which the Company’s co-generation units are
entitled and eligible for benefits.
Operational Highlights• The Company generated 364.4 million units of power
in 2012-13 compared to 320.3 million units in 2011-12,
an increase of 14%, owing to increased availability of
bagasse
• Higher power production enabled the Company to
increase its power exports by 16% to 260.3 million units
from 224.7 million units in the previous year.
Financial Highlights• Despite the same co-generation capacity and stagnant
grid realisation, the net sales revenue from the
co-generation segment increased by 14% to `109
crore from `96 crore in the previous year, due to higher
cane crushed volumes, which led to abundant bagasse
availability.
• Operating profit of the segment increased to `100 crore
during the year under review, from `70 crore in FY12,
an increase of 43%, on account of better cost control
measures and increased sales volumes.
Performance Overview
Particulars 2010-11 2011-12 2012-13Average operating days (No. of days)
180 185 210
Gross power generation (million units)
280.6 320.3 364.4
Power export to grid (million units)
197.3 224.7 260.3
Sales realisation (`/unit) 4.4 4.3 4.2
Revenue (` crore) 87 96 109
OutlookThe Company will continue to align its operations
towards maximising operational efficiencies. It will explore
opportunities to procure bio-mass for generation of electricity,
thereby expanding the scale and increasing the running time
for plants. On account of expected increase in bagasse
availability in the coming year, the capacity utilisation of
co-generation plants is also expected to be high, which will
improve revenue and profitability of the segment.
Power Exported (Lakh kwh)
29
Business Overview Management Reports Financial Statements
Distillery - Business OverviewOverviewThe Company’s Jawaharpur plant has a distillery capacity of
80 KLPD (kilo litres per day). It produces different grades of
industrial alcohol. During the year under review, the Company
benefitted on account of the fully integrated model, with the
distillery working at optimum capacity utilisation.
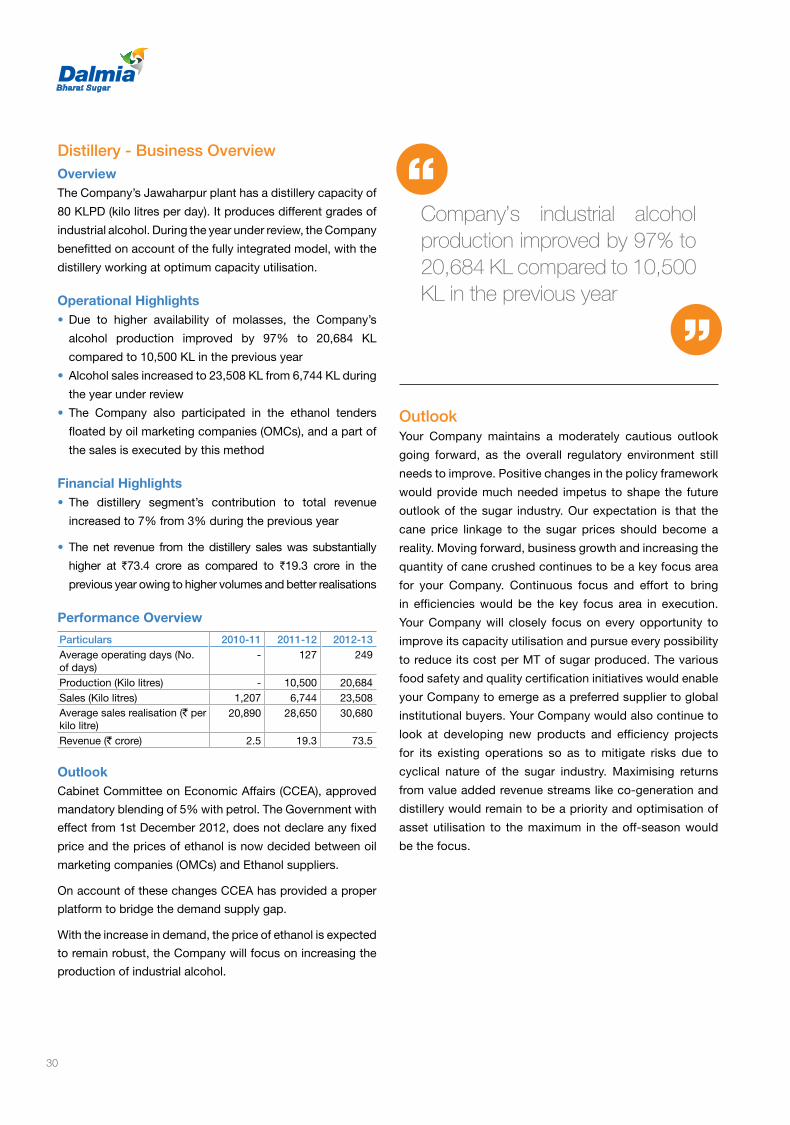
Operational Highlights• Due to higher availability of molasses, the Company’s
alcohol production improved by 97% to 20,684 KL
compared to 10,500 KL in the previous year
• Alcohol sales increased to 23,508 KL from 6,744 KL during
the year under review
• The Company also participated in the ethanol tenders
floated by oil marketing companies (OMCs), and a part of
the sales is executed by this method
Financial Highlights• The distillery segment’s contribution to total revenue
increased to 7% from 3% during the previous year
• The net revenue from the distillery sales was substantially
higher at `73.4 crore as compared to `19.3 crore in the
previous year owing to higher volumes and better realisations
Performance Overview
Particulars 2010-11 2011-12 2012-13Average operating days (No. of days)
- 127 249
Production (Kilo litres) - 10,500 20,684Sales (Kilo litres) 1,207 6,744 23,508Average sales realisation (` per kilo litre)
20,890 28,650 30,680
Revenue (` crore) 2.5 19.3 73.5
OutlookCabinet Committee on Economic Affairs (CCEA), approved
mandatory blending of 5% with petrol. The Government with
effect from 1st December 2012, does not declare any fixed
price and the prices of ethanol is now decided between oil
marketing companies (OMCs) and Ethanol suppliers.
On account of these changes CCEA has provided a proper
platform to bridge the demand supply gap.
With the increase in demand, the price of ethanol is expected
to remain robust, the Company will focus on increasing the
production of industrial alcohol.
OutlookYour Company maintains a moderately cautious outlook
going forward, as the overall regulatory environment still
needs to improve. Positive changes in the policy framework
would provide much needed impetus to shape the future
outlook of the sugar industry. Our expectation is that the
cane price linkage to the sugar prices should become a
reality. Moving forward, business growth and increasing the
quantity of cane crushed continues to be a key focus area
for your Company. Continuous focus and effort to bring
in efficiencies would be the key focus area in execution.
Your Company will closely focus on every opportunity to
improve its capacity utilisation and pursue every possibility
to reduce its cost per MT of sugar produced. The various
food safety and quality certification initiatives would enable
your Company to emerge as a preferred supplier to global
institutional buyers. Your Company would also continue to
look at developing new products and efficiency projects
for its existing operations so as to mitigate risks due to
cyclical nature of the sugar industry. Maximising returns
from value added revenue streams like co-generation and
distillery would remain to be a priority and optimisation of
asset utilisation to the maximum in the off-season would
be the focus.
Company’s industrial alcohol production improved by 97% to 20,684 KL compared to 10,500 KL in the previous year
30
Consolidated Profit and Loss AnalysisNet operating revenue were `1,000 crore for the period
under review as against `735 crore for the previous year
ended March 2012; an increase of 36%. This was mainly
on account of increase in sugar sales volumes by 22%
(2.44 lakh tonnes vs. 2.00 lakh tonnes) and improvement
in average price realisations by 12% (`30,860/tonne vs.
`27,644/tonne).
EBITDA grew by 79% from ̀ 85 crore in FY12 to ̀ 152 crore in
FY13. EBITDA margin was higher on account of full utilisation
of the integrated business model of the Company, whereby
downstream product lines like co-generation power and
alcohol contributed significantly to the EBITDA.
Co-generation contributed 59% and distillery contributed
18% to the overall EBITDA of the Company.
Operating ExpenditureTotal operating expenditure of the Company in FY13 stood
at `848 crore
• Due to incremental crushing volumes and higher cane
cost being paid, there has been an increase in raw
material cost in FY13, which stood at `818 crore.
• Stock adjustment is ` (131) crore.
• Acquisition of new mill has led to increase in the employee
costs to `53 crore in FY13.
• Power and fuel costs stood low at `15 crore. Cost
incurred was lower for the year on account of higher
amount of bagasse being available due to higher cane
crushed during the year.
• Other expenses stood at `93 crore.
Operating EBITDADue to better volumes and realisations of downstream
product lines, operating EBITDA stood at `152 crore for
the year under review, which was higher by 79% from the
FY12 EBITDA of `85 crore.
DepreciationOn account of addition of another sugar unit in our group,
the depreciation cost stood at `73 crore in FY13.
Financial & Interest ExpensesInterest cost stood higher at `66 crore, because of extra
debt being raised to fund the acquisition in Maharashtra.
Other IncomeOther income stood at `14 crore for the year under review.
Provision for TaxCurrent tax for FY13 stood at 3.79 crore, whereas MAT
credit available was redeemed and the deferred tax liability
was created for `0.62 crore
Net ProfitSignificant improvement in Net Profit was witnessed during
the year at `18.37 crore against `0.92 crore in FY12.
DividendThe Board of Directors has recommended a dividend of
`0.25/- per share, on the face value of `2.00/- per share,
subject to the approval of shareholders. Total Dividend Payout
Ratio stands at 13% (including Dividend Distribution Tax).
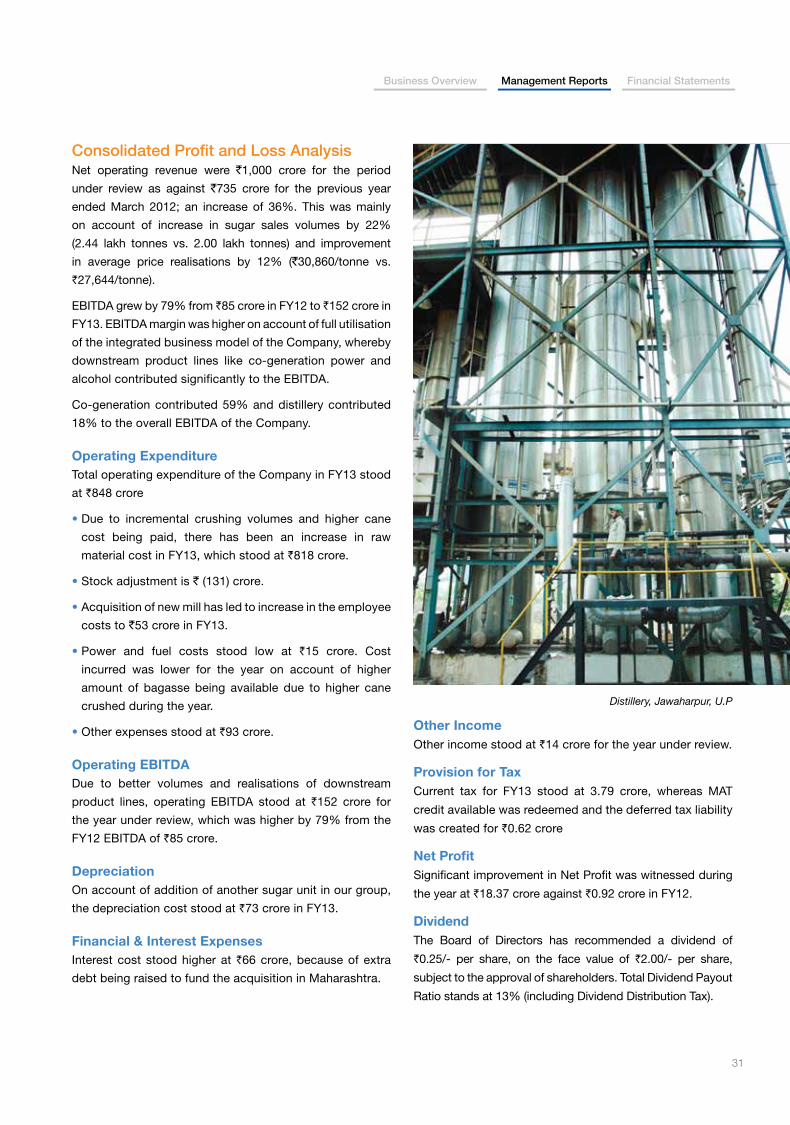
Distillery, Jawaharpur, U.P
31
Business Overview Management Reports Financial Statements

Consolidated Balance Sheet Analysis
Net WorthThe Company’s total Net Worth stood at `459 crore in FY13.
Of this, during the year under review, surplus in profit & loss
account amounted to `443 crore. Debenture Redemption
Reserve at `22 crore and Revaluation Reserve at `4.5 crore.
The Company’s paid-up equity capital remained constant at
`16.19 crore as on March 31, 2013, comprising 8,09,39,303
equity shares (8,09,39,303 shares) of `2 each (fully paid up).
Loan ProfileThe total borrowed funds of the Company stood at `786
crore in FY13. Long term loans at `343 crore, Short term
loans at ̀ 412 crore and current maturities of long term loans
stood at `31 crore.
However the Company holds inventory of finished goods
worth `720 crore as on 31st March 2013 in its godowns.
Net Debt to equity ratio for the company stood at 1.6x.
Total AssetsTotal assets of the Company were `1670 crore in FY13. The
Company’s net fixed assets as proportion of total assets
were at 39% at the end of the year.
Net Fixed AssetsNet fixed assets mainly comprise of the plants and machinery
and land and buildings valued at `635 crore. It also includes
a small portion of capital work-in-progress amounting to
`16.9 crore.
InvestmentsThe total non-current investments stood at `18 crore, the
Company had a current investment of `44 crore in fixed
income money market mutual funds.
InventoriesTotal inventories were higher at `720 crore in FY13, majorly
on account of increase in sugar inventory in hand, amounting
to `685 crore at the closing of the year.
Sundry DebtorsDebtors of the Company stood at `70 crore in FY13, of
which only 10% are more than six months old.
Loans and AdvancesLoans and advances comprised 8% of the Company’s total
assets. Loans and advances made by the company were to
the tune of `138 crore in FY13, primarily on account of MAT
credit entitlements of `48 crore and advances income tax of
`33 crore.
Cash & Bank BalanceThe Company had cash and bank balance of `27 crore in
FY13, with `11 crore in current accounts.
Other Current Liabilities & ProvisionsCurrent liabilities and provisions stood at `372 crore,
primarily on account of sundry creditors worth `250 crore.
Corporate Social ResponsibilityYour company is committed to creating exceptional value
for its customers, employees, shareholders, vendors and the
communities it operates in, through core values of Learning,
Excellence, Teamwork and Speed.
Dalmia has three integrated sugar mills in Uttar Pradesh with
well developed CSR programmes centred around Nigohi,
Jawaharpur and Ramgarh. Covering a total of 22 villages
making a difference in the lives of approximately 30,000 people.
HealthAiming to maintain zero and infant mortality at our villages,
and to ensure maximum health for every child between 0
to 5 years, we have taken up special efforts through CSR
programs. Every pregnant mother is enrolled in our Ante
Natal Care program for regular check up by doctors, regular
visit to the nearby primary health centres, and provision of
protein and iron supplements and a special health camp
exclusively for them.
Basic health services are available on all health camps
to benefit the elderly. Emphasis is placed on maternal and
Our CSR efforts address environmental, social and economic challenges
32
child health interventions targeting 100% immunization and
pre and post-natal care, aiming to bring down infant and
maternal mortality rates. Approximately 800 children have
been immunized during the health camps. Expectant mothers
are enrolled for routine check-ups and institutional delivery
after we emphasized on the need for periodic prenatal care
to ensure safety of both mother and child. Approximately 600
women were provided with pre and post natal care.
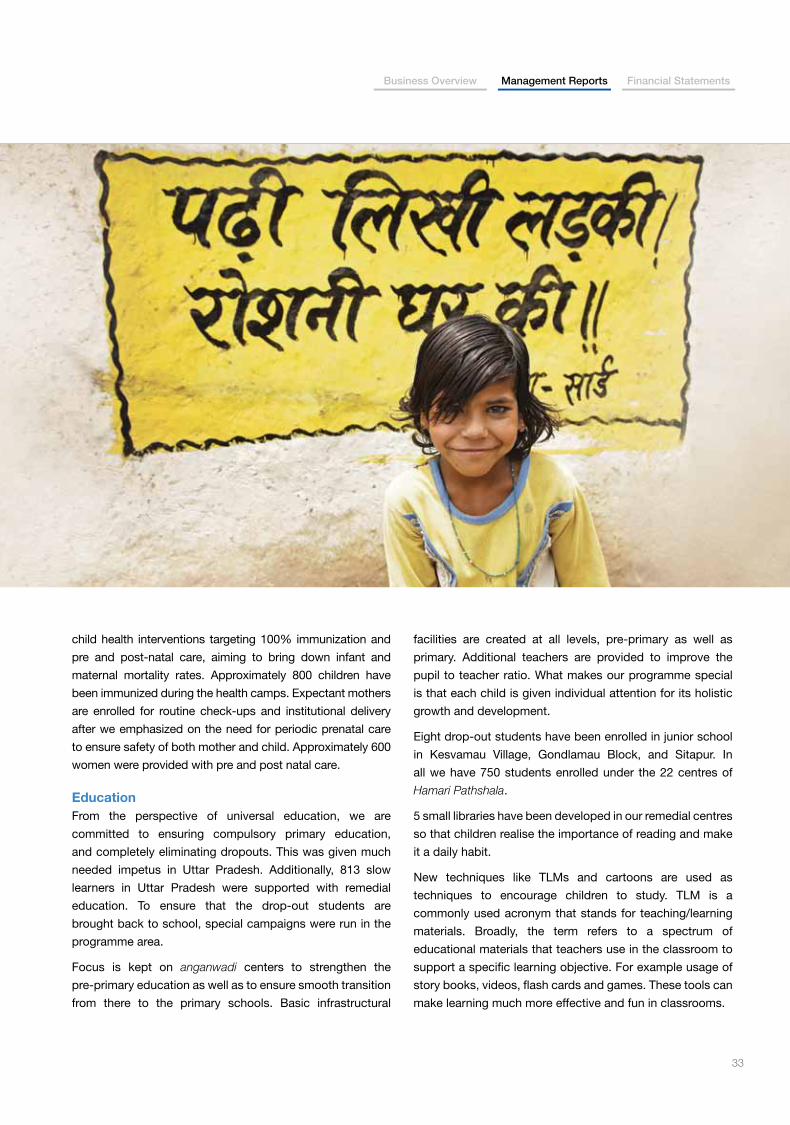
EducationFrom the perspective of universal education, we are
committed to ensuring compulsory primary education,
and completely eliminating dropouts. This was given much
needed impetus in Uttar Pradesh. Additionally, 813 slow
learners in Uttar Pradesh were supported with remedial
education. To ensure that the drop-out students are
brought back to school, special campaigns were run in the
programme area.
Focus is kept on anganwadi centers to strengthen the
pre-primary education as well as to ensure smooth transition
from there to the primary schools. Basic infrastructural
facilities are created at all levels, pre-primary as well as
primary. Additional teachers are provided to improve the
pupil to teacher ratio. What makes our programme special
is that each child is given individual attention for its holistic
growth and development.
Eight drop-out students have been enrolled in junior school
in Kesvamau Village, Gondlamau Block, and Sitapur. In
all we have 750 students enrolled under the 22 centres of
Hamari Pathshala.
5 small libraries have been developed in our remedial centres
so that children realise the importance of reading and make
it a daily habit.
New techniques like TLMs and cartoons are used as
techniques to encourage children to study. TLM is a
commonly used acronym that stands for teaching/learning
materials. Broadly, the term refers to a spectrum of
educational materials that teachers use in the classroom to
support a specific learning objective. For example usage of
story books, videos, flash cards and games. These tools can
make learning much more effective and fun in classrooms.
33
Business Overview Management Reports Financial Statements
Latest DevelopmentsA model village programme was launched in January 2013
in the sugar belt of Jawaharpur and Ramgarh. With focus
on alternate cooking systems (bio-gas and smokeless
chullas), low cost toilets, solar street lights, improved
school infrastructure and a “Jan Suvidha Kendra”
(information Centre). Participatory rural appraisal was
conducted in villages to get an in-depth understanding of
the village resulting in better programme implementation.
It helped us identify the needs of the people on the basis
of which our model village programme stands.
NGO PartnersSARD - Society of All Round Development partners with
us in Ramgarh and Jawaharpur. SARD is a non-profit
organisation aimed at increasing the participation of
minorities and disadvantaged communities in mainstream
development processes. SARD’s goal is to empower
these groups, particularly women and adolescent girls,
by improving their access to quality education and
health services; providing vocational training; introducing
micro-credit schemes; and promoting environmentally
sustainable income generating activities.
VSA - Vinoba Seva Ashram partners with us in Nigohi. It
works for underprivileged sections of society in the field
of health, education and livelihood.
Human ResourcesThe acquisition of Kolhapur unit was seamlessly
integrated in a short span of time. This involved setting
up an organisational structure, large scale executive and
non -executive recruitments, induction, orientation towards
the Dalmia way of working, values, policy implementation,
introducing PMS, setting up performance metrics,
trainings, shifting people from existing operations at UP
to Kolhapur on short and long term basis to help ready
the plant for operations, managing facilities, managing
local issues etc; all this was seamlessly completed in four
months.
The sugar business enjoys a high level of employee
engagement. Last GPTW (Great Place To Work) survey in
2012-13 positions the business amongst top 25 companies
in the country. Attrition has been among the lowest in the
industry at 7.48%. Likewise in other businesses, on line
PMS system has been introduced in Sugar business in
2012-13.
Towards the end of the year 2012-13, three Centers of
Excellence has been created in the Sugar Business viz.,
Training and Development, Safety, Welfare & Statutory
Compliances. All these centers have commenced their
activities and are expected to contribute significantly in
the coming year.
Total workforce for the company currently stand at 1,701.
On the Safety front, all three units in UP are certified under
Occupational Health and Safety Assessment.
Internal Control SystemsYour Company has proper and adequate systems of internal
controls to ensure that all its assets are safeguarded. Your
Company has established an internal audit department,
which ensures adequate review of the entire Company’s
internal control systems, through its audit partners
M/s. Axis Risk Consulting, for Sugar. The effectiveness of
the internal control systems is continuously monitored by
the Corporate Audit Department of your Company.
Acquisition of Kolhapur unit was seamlessly integrated in a short span of time. This involved setting up an organisational structure, large scale executive and non-executive recruitments & induction
34
Threats / Key ChallengesRegulatory FrameworkEven after removal of levy mechanism, sugar industries in
India bear controls like sugar cane price, cane areas, export
licensing etc. Apex sugar industry bodies have been seeking
complete de-control of the sector. This has led to freedom to
sell sugar in the open market and dropping of levy obligation
for the Public Distribution System. Under the levy obligation,
sugar mills were required to sell 10% of their output to the
Government at below-cost rates for supply to ration shops.
Regulations required the industry to follow a monthly release
system, which has now been abolished.
The Government had set up a seven member expert
committee (headed by the chairman of Economic Advisory
Council, C. Rangarajan) to examine all issues related to
de-regulation of the sugar sector. The report has submitted its
recommendations to CCEA in January’13.
The next big issue facing the sugar industry is the fixing
of cane price by the State Governments to be paid to the
farmers, which is always higher than the Fair Remunerative
Price (FRP) being set by the central Government. The industry
body expects cane prices to be linked with the sugar prices
in the market.
FRP vs High SAPThe issue of State Advised Price (SAP) versus the Central
Government’s Fair and Remunerative Price continues to
remain a challenge for sugar mills. The sugar industry had
challenged the legality of state governments fixing cane price.
Fair and Remunerative Price (FRP) of sugarcane is the price
to be paid by the sugar mills instead of statutory minimum
support price earlier. FRP is fixed after taking into consideration
the margins for sugarcane farmers on account of risk as well
as profit on the cost of production of sugarcane, including the
cost of transportation. This price is linked to a basic sugar
recovery rate (from the sugarcane) of 9.5%, subject to a
premium of `1.53 per quintal for every 0.1% point increase in
recovery above 9.5%, the state government worked out the
State Advised Price (SAP), without considering any economic
criteria. The Supreme Court had referred the issue of whether
the state government has the right to fix SAP to a seven judge
bench. The ruling of this is awaited, if the ruling is in favour of
FRP, we expect UP mills to recover financially.
35
Business Overview Management Reports Financial Statements
Extreme Cyclical Swings, Costs and Cane AvailabilityIndia’s sugar industry is prone to extreme cyclical swings.
The most important reason responsible for the cyclical
nature of sugarcane production is the demand supply
imbalance. Excess production in a particular season leads
to lower realisation in the market, this impacts the paying
capacity of the Mills to the farmers. Sensing a likely lower
sugarcane price realisation next year, farmers tend to switch
over to the crops resulting into short supply of sugarcane in
next sugarcane season.
Challenges in Renewable PowerState Electricity Boards (SEBs) across India have huge
losses on account of inefficiencies in transmission and
distribution, billing and more importantly, the need to often
buy expensive power to tide over short-term deficits. Some
SEBs have also failed to revise tariffs for many years, adding
to the losses and also not able to raise money at high rates of
interest. The poor financial health is also on account of non-
payment of subsidy amounts by state governments. This
can also be a serious threat to the co-generation business if
the SEBs are unable to make prompt payment consistently.
Sectors like solar power need higher government support to
invest in the latest and modern technology to propel growth
in the sector.
Challenges in EthanolOil Marketing Companies (OMCs) used to procure ethanol
on an ad hoc uniform ex-factory price of 27 per litre
throughout the country. A tender was floated and the sugar
mills competed with each other. At the earlier price of `27
per litre price that oil companies were offering earlier, it
was economically unviable for mills to divert any cane juice
molasses for ethanol. The Cabinet Committee on Economic
Affairs in its meeting held on 22nd November 2012 approved
the mandatory 5% ethanol blending with petrol. The
Government with effect from 1st December, 2012, will not
declare any fixed price, henceforth the price of ethanol will
be decided between OMCs and ethanol suppliers.
In the month of January’13 OMC’s have floated tender for
supply of 1,000 million litres of ethanol, OMC’s have started
finalising on the suppliers who have quoted ethanol prices
of `45/litre and below. This translates to `34-35/Litre to the
distilleries.
The only challenge the industry could face could be
difficulties in successful taking off the ethanol blending
program and its long term sustenance, which could ensure
long term demand of ethanol by OMC’s from the industry.
Risks & ConcernsRaw Material Risk.Any shortage of sugarcane can adversely impact the operations of a sugar mill. Shortage of sugarcane can be a result of migration from cane production to other cash crops and also adverse weather conditions or crop diseases or drop in drawl rate. It can also result from non-remunerative cane procurement price declared by the State Government and/or Central Government. While your Company is not immune to industry dynamics, its strategic locations and excellent relationship with farmers enable it to mitigate this risk effectively. Your company has recently diversified into Maharashtra, which has enabled it to mitigate this risk and the thrust for further risk mitigation by scale building in Maharashtra. Your Company actively engages with farmers and has also initiated several measures to facilitate better communication systems and promote modern farming techniques for higher productivity. Farmers are treated as partners in progress by your Company.
OMC’s have started finalising suppliers who have quoted ethanol prices of `45/litre and below. This translates to `34-35/litre to distilleries.
36
Business Overview Management Reports Financial Statements
37
Raw Material Price RiskPrices of sugarcane crop is fixed by the state governments and SAP is fixed keeping in mind various factors and political considerations. This increase in raw material price cannot be easily factored in the finished product as the sugar price is controlled by various market forces and government policies. This can affect the profitability of the Company
Sugar Price RiskOpen market price of sugar is a determined by free market forces of demand and supply, as also the international demand / supply and availability of substitutes for the sugar products. The wholesale price of sugar has a significant impact on the profits of sugar companies. Hence, any decrease in the sugar prices may have an adverse impact on your Company. India is ranked amongst the world’s largest consumers of sugar and the risk of any significant and sharp drop in demand leading to sharp drop of prices is not foreseen. The sugar industry also generates revenues from by-products, which have reduced the industry’s pure dependence on sugar.
Regulatory RiskThe Indian sugar industry is highly regulated by the Government. These regulations are a challenge and also a risk to the growth and long-term sustainability of a profitable sugar industry. Unfavorable policies are a risk to the Indian sugar industry. Any significant unfavourable change in the existing policies (which already are not conducive to the growth of the industry) by the Central Government and/or State Government may adversely impact the revenues of your Company.
Cyclicality & Dependence RisksIndia’s sugar industry is prone to extreme cyclical swings. To mitigate and minimise the risk from the sugar business, your Company has incorporated an integrated business model as a de-risking measure. This places your Company on a stronger footing and enables it to stabilise its topline, and will also strengthen its bottom line in future. The co-generation and distillery businesses of your Company helps to minimise this risk.
Cautionary StatementCertain statements in this Management Discussion and Analysis describing the Company’s objectives, projections, estimates and expectations may be ‘forward looking statements’ within the meaning of applicable laws and regulations. Forward looking statements are identified in this report, by using the words ‘anticipates’, ‘believes’, ‘expects’, ‘intends’ and similar expressions in such statements. Although we believe our expectations are based on reasonable assumptions, these forward looking statements may be influenced by numerous risks and uncertainties that could cause actual outcomes and results to be materially different from those expressed or implied. Some of these risks and uncertainties have been discussed in the section on ‘risks and concerns’. The Company takes no responsibility for any consequence of decisions made based on such statements and holds no obligation to update these in the future.
38
Directors’ Reportfor the year ended March 31, 2013
The Directors have pleasure in submitting the Annual Report and Audited Statements of Account of the Company for the year ended 31st March, 2013.
Financial Results
(` Crore)
FY 13 FY 12
Net Sales Turnover 993.54 715.15
Profit before interest, depreciation and tax (EBITDA)
157.32 92.68
Less: Interest and Financial Charges 65.55 50.25
Profit before depreciation and tax (PBDT)
91.77 42.43
Less: Depreciation 72.80 41.82
Profit/(Loss) before tax (PBT) 18.97 0.61Provision for current tax - 1.16
Provision for tax – earlier years - -3.41
Provision for deferred tax 0.62 1.96
Profit after tax (PAT) 18.35 0.90Add: Surplus brought forward 399.90 402.13
Balance available for appropriation 418.25 403.03
Appropriations:General Reserve 0.46 -Debenture Redemption Reserve (net) 3.12 3.13Proposed Dividend 2.02 -Dividend Distribution tax thereon 0.34 -Balance carried forward 412.31 399.90
418.25 403.03
DividendKeeping in view the performance of the Company your Directors have decided to recommend payment of dividend calculated at ` 0.25 per share as against nil dividend in the immediately preceding previous year.
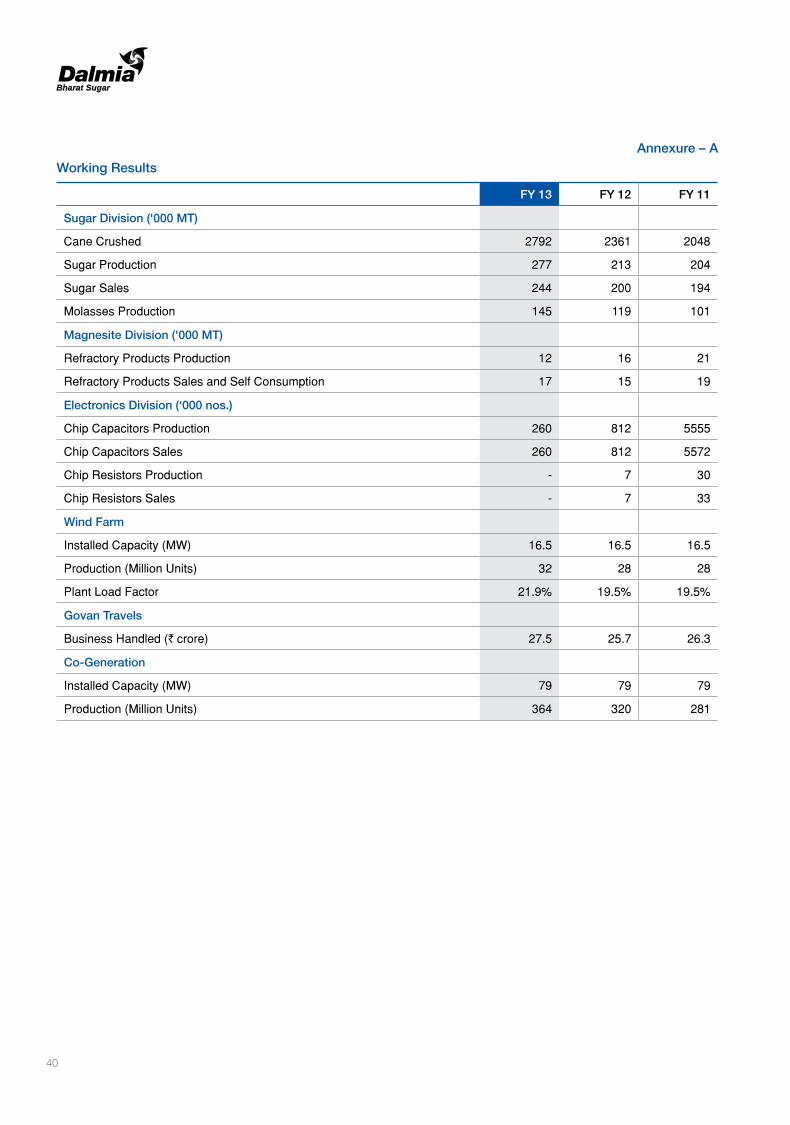
Operations and Business PerformancePlease refer to the chapter on Management Discussion and Analysis for a detailed analysis of the performance of the Company during 2012-13. In addition, working results for key businesses have been provided as an annexure to this report (Annexure - A).
Corporate GovernanceThe Company’s Corporate Governance practices have been detailed in a separate chapter and is annexed to and forms part of this Report. The Auditors certificate on the compliance of Corporate Governance Code embodied in Clause 49 of the Listing Agreement is also attached as annexure and forms part of this Report.
Listing of Shares
The Company’s shares continue to be listed on the Madras Stock Exchange, National Stock Exchange and Bombay Stock Exchange and the listing fees for the year 2013-14 has been paid.
Industrial Relations
The industrial relations during the year under review remained harmonious and cordial. The Directors wish to place on record their appreciation for the excellent cooperation received from all employees at various units of the Company.
Employees’ Particulars
There was no employee in receipt of remuneration in excess of the limits prescribed under Section 217(2A) of the Companies Act, 1956 read with the Rules and Notifications made thereunder.
Energy Conservation, Technology Absorption and Foreign Exchange Transactions
A statement giving details of Conservation of Energy, Technology Absorption and Foreign Exchange transactions, in accordance with the Companies (Disclosure of particulars in the Report of the Board of Directors) Rules, 1988, forms a part of this report as Annexure – B.
Subsidiaries
The Central Government vide Notification No. 5/12/2007 – CL III, dated 8-2-2011 has given a general exemption to all Companies in terms of Section 212(8) of the Companies Act, 1956 from attaching the Annual Reports of its Subsidiaries. Accordingly, the Directors’ Report and audited accounts of the Company’s Subsidiaries, Himshikhar Investment Limited, Dalmia Solar Power Limited and Dalmia Sugar Ventures Limited, for the year ended 31st March 2013 are not being enclosed with this Annual Report. Any Member desiring to inspect the detailed Annual Reports of any of the aforementioned subsidiaries may inspect the same at the Head Office of the Company and that of the subsidiaries concerned. In event a Member desires to obtain a copy of the Annual Report of any of the aforementioned subsidiaries, he may write to the Registered Office of the Company specifying the name of the subsidiary whose Annual Report is required. The Company shall supply a copy of such Annual Report to such Member. The Annual Report of the aforementioned Subsidiaries are available at the Company’s website www.dalmiasugar.com.
Business Overview Management Reports Financial Statements
39
A statement of the Company’s interest in its subsidiaries mentioned above is attached as required under section 212 of the Companies Act, 1956.
Fixed Deposits
The Company has not accepted any Public Deposits.
Directors
The following Directors retire by rotation at the ensuing Annual General Meeting: 1. Shri J. S. Baijal and 2. Shri B.B. Mehta.
Shareholdings in the Company by its Directors as at 31-3-2013, are as under:
Name of the Director No. of Shares of ` 2/- each held
Shri Jai H. Dalmia 16,35,010Shri Y.H. Dalmia 45,41,880Shri Gautam Dalmia 7,51,990Shri Puneet Yadu Dalmia 39,28,055Shri P. Kannan 2,730Shri J.S. Baijal NilShri M. Raghupathy NilShri T. Venkatesan NilShri B.B. Mehta Nil
Consolidated Financial Statements
As required under clause 41 of the listing agreement, this Annual Report also includes Consolidated Financial Statements for the financial year 2012-13 prepared in accordance with Accounting Standard - 21.
CEO/CFO Report on Accounts
As required under clause 49 of the Listing Agreement, the CEO/CFO’s Report on the Accounts is attached.
Directors Responsibility Statement
In terms of the provisions of Section 217(2AA) of the Companies Act, 1956 your Directors declare that:
(a) in the preparation of the annual accounts, the applicable Accounting Standards have been followed and no departures have been made there from;
(b) the Directors had selected such accounting policies and applied them consistently and made judgments and estimates that are reasonable and prudent so as to give a true and fair view of the state of affairs of the Company at the end of the financial year and of the profit of the Company for that period;
(c) the Directors had taken proper and sufficient care for the maintenance of adequate accounting records in accordance with the provisions of the Act for safeguarding the assets of the Company and for preventing and detecting frauds and other irregularities; and
(d) the Directors had prepared the annual accounts on a going concern basis.
Auditors
M/s. S.S. Kothari Mehta & Co., Chartered Accountants the Auditors of the Company retire at the conclusion of the ensuing Annual General Meeting and are eligible for re-appointment. As required under Section 224 of the Companies Act, 1956, the Company has obtained from them a certificate to the effect that their re-appointment, if made, would be in conformity with the limits prescribed in the said Section.
Cost Auditors
M/s. R.J. Goel & Co., Cost Accountants, were appointed as the Cost Auditors of the Company to conduct cost audit of the sugar manufacturing, power co-generation and wind farm units for the year ended 31-3-2012, and they have submitted the Cost Audit Reports for the said year on 1-1-2013 . The said firm has been appointed as Cost Auditors to conduct cost audit of the sugar manufacturing units, power co-generation units and wind farm unit for the year ended 31-3-2013.
For and on behalf of the Board
New Delhi (J.S. Baijal)Dated: 27th May, 2013 Chairman
40
Annexure – A
Working Results
FY 13 FY 12 FY 11
Sugar Division ('000 MT)
Cane Crushed 2792 2361 2048
Sugar Production 277 213 204
Sugar Sales 244 200 194
Molasses Production 145 119 101
Magnesite Division ('000 MT)
Refractory Products Production 12 16 21
Refractory Products Sales and Self Consumption 17 15 19
Electronics Division (‘000 nos.)
Chip Capacitors Production 260 812 5555
Chip Capacitors Sales 260 812 5572
Chip Resistors Production - 7 30
Chip Resistors Sales - 7 33
Wind Farm
Installed Capacity (MW) 16.5 16.5 16.5
Production (Million Units) 32 28 28
Plant Load Factor 21.9% 19.5% 19.5%
Govan Travels
Business Handled (` crore) 27.5 25.7 26.3
Co-Generation
Installed Capacity (MW) 79 79 79
Production (Million Units) 364 320 281
Business Overview Management Reports Financial Statements
41
Annexure – B
Particulars with respect to Conservation of Energy, Technology Absorption and Foreign Exchange Outgo and Earnings
A. Conservation Of Energy
(a) Energy Conservation measures taken:
(i) Installation of low temperature evaporator modules for further reduction in steam consumption.
(ii) Installation of evaporative condenser in distillery to reduce steam and power consumption.
(iii) Replacement of GRPF drives with high efficiency ACVF drives.
(b) Additional investments and proposals, if any, being implemented for reduction of consumption of energy:
Several small efficiency improvement projects have been planned for saving energy and steam consumption in the Sugar plant.
(c) Impact of measures taken already and proposed vide (a) and (b) above are aimed at:
Enabling the Company to save electrical energy and reduction in steam consumption by about 5% as compared to previous levels.
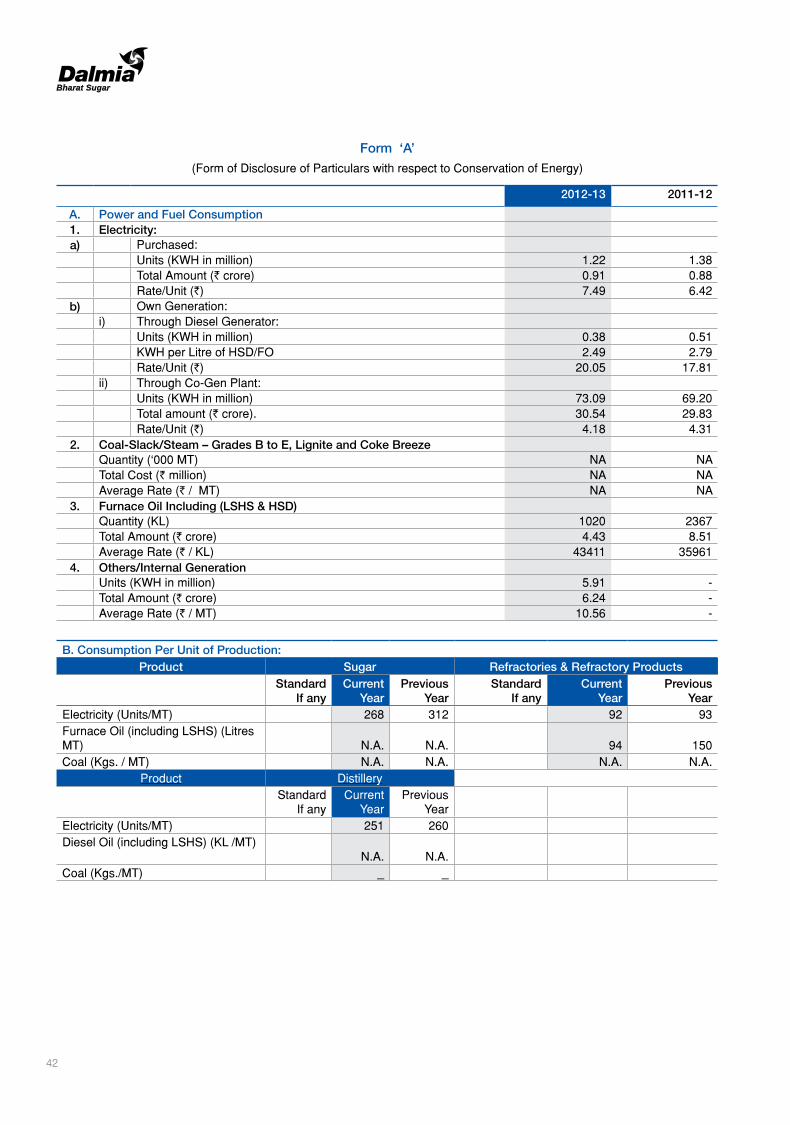
(d) Total energy consumption and consumption per unit of production as per Form “A” attached.
B. Technology Absorption
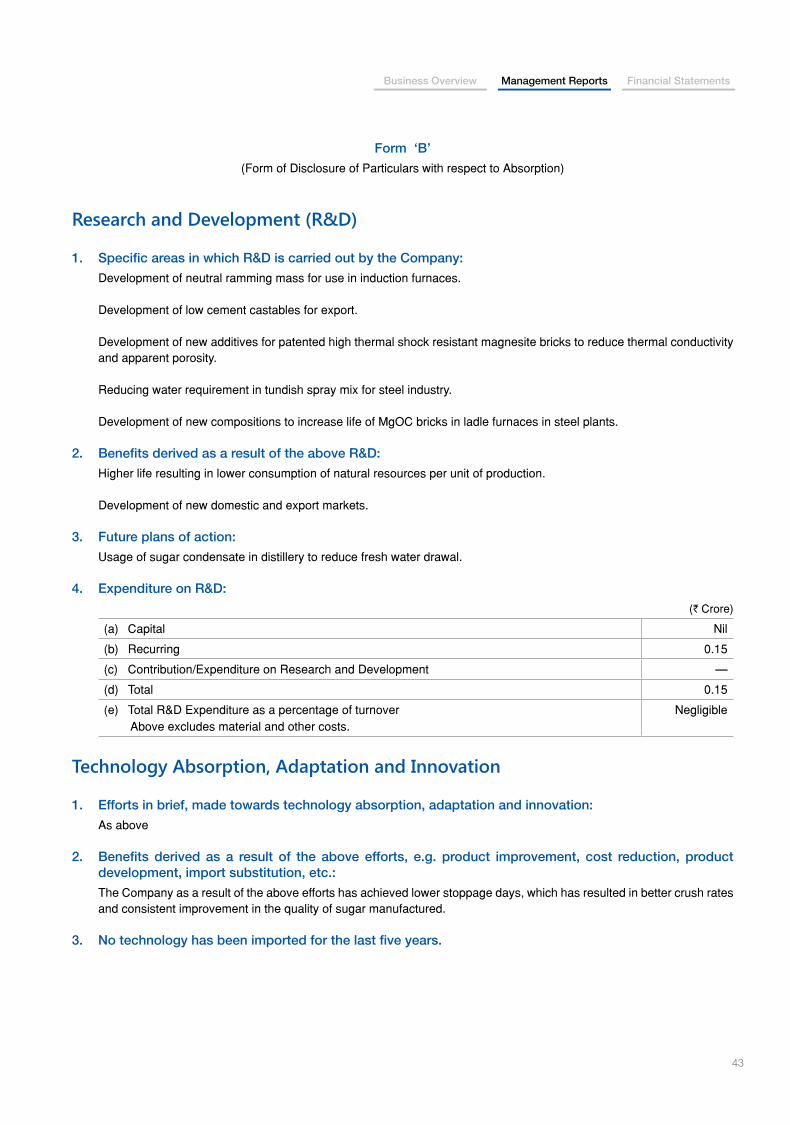
Efforts made in technology absorption as per Form “B” attached.
C. Foreign Exchange Earnings and Outgo
(a) Activities relating to exports; initiatives taken to increase exports; development of new export markets for products and services, and export plans:
(i) Refractory products were exported during the year.
(b) Total foreign exchange used and earned during the year:
(i) Used: ` 0.15 crore (ii) Earned: ` 0.84 crore.
42
Form ‘A’
(Form of Disclosure of Particulars with respect to Conservation of Energy)
2012-13 2011-12
A. Power and Fuel Consumption1. Electricity:a) Purchased:
Units (KWH in million) 1.22 1.38Total Amount (` crore) 0.91 0.88Rate/Unit (`) 7.49 6.42
b) Own Generation:i) Through Diesel Generator:
Units (KWH in million) 0.38 0.51KWH per Litre of HSD/FO 2.49 2.79Rate/Unit (`) 20.05 17.81
ii) Through Co-Gen Plant:Units (KWH in million) 73.09 69.20Total amount (` crore). 30.54 29.83Rate/Unit (`) 4.18 4.31
2. Coal-Slack/Steam – Grades B to E, Lignite and Coke BreezeQuantity (‘000 MT) NA NATotal Cost (` million) NA NAAverage Rate (` / MT) NA NA
3. Furnace Oil Including (LSHS & HSD)Quantity (KL) 1020 2367Total Amount (` crore) 4.43 8.51Average Rate (` / KL) 43411 35961
4. Others/Internal GenerationUnits (KWH in million) 5.91 -Total Amount (` crore) 6.24 -Average Rate (` / MT) 10.56 -
B. Consumption Per Unit of Production:Product Sugar Refractories & Refractory Products
StandardIf any
CurrentYear
PreviousYear
StandardIf any
CurrentYear
PreviousYear
Electricity (Units/MT) 268 312 92 93Furnace Oil (including LSHS) (Litres MT) N.A. N.A. 94 150Coal (Kgs. / MT) N.A. N.A. N.A. N.A.
Product DistilleryStandard
If anyCurrent
YearPrevious
YearElectricity (Units/MT) 251 260Diesel Oil (including LSHS) (KL /MT)
N.A. N.A.Coal (Kgs./MT) _ _
Business Overview Management Reports Financial Statements
43
Form ‘B’
(Form of Disclosure of Particulars with respect to Absorption)
Research and Development (R&D)
1. Specific areas in which R&D is carried out by the Company:
Development of neutral ramming mass for use in induction furnaces.
Development of low cement castables for export.
Development of new additives for patented high thermal shock resistant magnesite bricks to reduce thermal conductivity and apparent porosity.
Reducing water requirement in tundish spray mix for steel industry.
Development of new compositions to increase life of MgOC bricks in ladle furnaces in steel plants.
2. Benefits derived as a result of the above R&D:
Higher life resulting in lower consumption of natural resources per unit of production.
Development of new domestic and export markets.
3. Future plans of action:
Usage of sugar condensate in distillery to reduce fresh water drawal.
4. Expenditure on R&D:
(` Crore)
(a) Capital Nil
(b) Recurring 0.15
(c) Contribution/Expenditure on Research and Development —
(d) Total 0.15
(e) Total R&D Expenditure as a percentage of turnover Above excludes material and other costs.
Negligible
Technology Absorption, Adaptation and Innovation
1. Efforts in brief, made towards technology absorption, adaptation and innovation:
As above
2. Benefits derived as a result of the above efforts, e.g. product improvement, cost reduction, product development, import substitution, etc.:
The Company as a result of the above efforts has achieved lower stoppage days, which has resulted in better crush rates and consistent improvement in the quality of sugar manufactured.
3. No technology has been imported for the last five years.
44
Report on Corporate Governance
Company’s Philosophy on Corporate GovernanceDBSIL (Dalmia Bharat Sugar and Industries Limited) believes in and remains committed to good Corporate Governance. The spirit of corporate governance has remained imbibed in the Company’s business philosophy since its inception. This philosophy is shaped by the values of transparency, professionalism and accountability. Today, your Company’s corporate governance practices are driven by strong Board oversight, timely disclosures, transparent accounting policies and high levels of integrity in decision-making.
In India, corporate governance standards for listed companies are regulated by the Securities and Exchange Board of India (SEBI) through Clause 49 of the Listing Agreement of the Stock Exchanges. The stipulations mandated by Clause 49 of the Listing Agreement became applicable to your Company in March 2001 and have been fully complied with since then. SEBI, through circulars dated 29th October 2004, 29th March 2005 and 8th April 2008, has revised Clause 49 of the Listing Agreement and mandated listed companies to comply with the revised Clause 49 of the Listing Agreement.
This chapter, along with the chapters on Management Discussion and Analysis and Additional Shareholders Information, reports on DBSIL’s compliance with the Clause 49 of the Listing Agreement.
Board of Directors Composition of the Board
As on 31st March 2013 the Company’s Board comprised nine members — four Executive Directors and five Non-executive Directors, of which three are independent. Mr. J.S. Baijal, a Non-executive Independent Director, is appointed as the Chairman of the Board. The composition of the Board is in conformity with Clause 49 of the Listing Agreement, which stipulates that if the Chairman is a Non-executive, and is not related to the promoters or persons occupying management positions at the Board level or at one level below the Board, one-third of the Board should be independent, or else, 50 per cent of the Board should comprise independent Directors.
Number of Board Meetings
The Board of Directors met five times during the year on 11-5-2012, 7-8-2012, 21-8-2012, 9-11-2012 and 7-2-2013. The maximum gap between any two meetings was less than 4 months.
Directors’ Attendance Record and Directorships Held
As mandated by the Clause 49 of the Listing Agreement, none of the Directors are members of more than ten Board level Committees nor are they Chairman of more than five Committees in which they are members. Table 1 gives the details of the composition of the Board, attendance and details of Committee Membership and Committee Chairmanship.
Table 1: Composition of the Board of Directors
Name of the Directors Category Attendance Particulars No. of other Directorships and Committee Memberships/Chairmanships
Number of Board Meetings
Last AGM
Other Directorships@
Committee Member-ships #
Committee Chairman-
ships #
Held Attended Mr. J.S. BaijalChairman
Independent – Chairman
5 4 No 2 4 -
Mr. M. Raghupathy Independent and Non-Executive
5 4 Yes 1 -- -
Mr. J. H. DalmiaVice-Chairman
Executive 5 5 No 6 - -
Mr. Y.H. DalmiaVice-Chairman
Executive 5 5 No 3 1 -
Mr. Gautam DalmiaManaging Director
Executive 5 3 No 4 2 -
Mr. Puneet Yadu DalmiaManaging Director
Executive 5 3 No 7 2 -
Mr. T. Venkatesan Non-Executive 5 5 No 5 2 -Mr. P. Kannan Independent
and Non-Executive
5 5 No - - -
Mr. B.B. Mehta Non-Executive 5 5 No 13 - -
@ The Directorships held by the Directors do not include Directorship of foreign companies and private limited companies.
# As required under Clause 49 of the Listing Agreement, the disclosure includes membership/chairmanship of audit committee and investor grievance committee of Indian public companies (listed and unlisted)
Business Overview Management Reports Financial Statements
45
Mr. J. H. Dalmia and Mr. Y.H. Dalmia are brothers; Mr. Gautam Dalmia is the son of Mr. J. H. Dalmia and Mr. Puneet Yadu Dalmia is the son of Mr. Y.H. Dalmia.
As mandated by the revised Clause 49 of the Listing Agreement, the independent Directors on DBSIL’s Board are not less than 21 years in age, and:
Apart from receiving Director’s remuneration, do not have any material pecuniary relationships or transactions with the Company, its promoters, its Directors, its senior management or its holding Company, its subsidiaries and associates which may affect independence of the Director.
Are not related to promoters or persons occupying management positions at the Board level or at one level below the Board.
Have not been an executive of the Company in the immediately preceding three financial years.
Are not partners or executives or were not partners or executives during the preceding three financial years of the:
Statutory audit firm or the internal audit firm that is associated with the Company.
Legal firm(s) and consulting firm(s) that have a material association with the Company.
Are not material suppliers, service providers or customers or lessors or lessees of the Company, which may affect independence of the Director.
Are not substantial shareholders of the Company i.e. do not own two percent or more of the block of voting shares.
Information Supplied to the Board
The Board has complete access to all information with the Company. The agenda and papers for consideration of the Board are circulated at least three days prior to the date of the Board meeting. Adequate information is circulated as part of the agenda papers and also placed at the meeting to enable the Board to take an informed decision. Inter-alia, the following information is regularly provided to the Board as a part of the agenda papers well in advance of the Board meetings or is tabled in the course of the Board meeting.
Annual operating plans & budgets and any update thereof.
Capital budgets and any updates thereof.
Quarterly results of the Company and operating divisions and business segments.
Minutes of the meetings of the Audit Committee and other Committees of the Board.
Information on recruitment and remuneration of senior officers just below the level of Board, including the appointment or removal of Chief Financial Officer and Company Secretary.
Materially important show cause, demand, prosecution notices and penalty notices.
Fatal or serious accidents, dangerous occurrences, any material effluent or pollution problems.
Any material default in financial obligations to and by the Company, or substantial non-payment for goods sold by the Company.
Any issue, which involves possible public or product liability claims of substantial nature, including any judgment or order which, may have passed strictures on the conduct of the Company or taken an adverse view regarding another enterprise that can have negative implications on the Company.
Details of any joint venture or collaboration agreement.
Transactions that involve substantial payment towards goodwill, brand equity or intellectual property.
Significant labour problems and their proposed solutions. Any significant development in human resources / industrial relations front like signing of wage agreement, implementation of voluntary retirement scheme, etc.
Sale of material nature of investments, subsidiaries, assets, which is not in the normal course of business.
Quarterly details of foreign exchange exposures and the steps taken by management to limit the risks of adverse exchange rate movement, if material.
Non-compliance of any regulatory, statutory nature or listing requirements and shareholders service such as non-payment of dividend, delay in share transfer, etc.
The Board periodically reviews compliance reports of all laws applicable to the Company, prepared by the Company as well as steps taken by the Company to rectify instances of non-compliances.
46
Remuneration paid to Directors
The compensation payable to the Executive Directors is decided by the Remuneration Committee constituted by the Board of Directors. The details of remuneration paid, during the year, to the Executive Directors and the Non-Executive Directors is presented in Table 2.
Table 2: Details of remuneration paid to Directors for 2012-13 (` Lakhs)
Name of the Director Category Sitting Fees
Salary and Perquisites
Retirement Benefits
Commission@ Total
Mr. J.S. BaijalChairman
Independent, Non-Executive
1.70 — — 4.34 6.04
Mr. M. Raghupathy Independent, Non-Executive
1.60 — — 4.34 5.94
Mr. J. H. Dalmia Vice-Chairman
Executive — 37.20 4.60 — 41.80
Mr. Y.H. DalmiaVice-Chairman
Executive — 36.57 4.60 —
41.17
Mr. Gautam Dalmia Managing Director
Executive — 4.97 0.14 —
5.11
Mr. Puneet Yadu DalmiaManaging Director
Executive — 7.27 0.14 —
7.41
Mr. T. Venkatesan Non-Executive 1.00 — — — 1.00
Mr. P. Kannan Independent, Non-Executive
1.00 — —
4.34 5.34
Mr. B.B. Mehta Non-Executive 1.00 — — — 1.00
@ Commission paid on net profit only.
Retirement benefits to the Executive Directors comprise the Company’s contribution to provident fund and superannuation fund. The payment of retirement benefits is being made by the respective fund(s). In addition to the above the Company also contributes, on actuarial valuation basis, amounts to the Gratuity Fund towards gratuity of its employees including the Vice Chairmen and Managing Directors. The Company has not provided any stock options to its employees including those at the Board level. The appointments of Mr. Y.H. Dalmia, Vice Chairman, Mr. Gautam Dalmia, Managing Director and Mr. Puneet Yadu Dalmia, Managing Director were made for a period of five years effective 16th January 2012. The appointment of Mr. J. H. Dalmia, Vice Chairman, has been made for a period of five years with effect from 1st April 2012. No severance fees is payable to any of aforementioned persons in respect of their cessation. Code of Conduct
DBSIL’s Board has laid down a code of conduct for all Board members and designated senior management of the
Company. The code of conduct is available on the website of the Company www.dalmiasugar.com. All Board members and senior management personnel have affirmed compliance with the Code of Conduct. A declaration signed by the Chief Executive Officer (CEO) to this effect is enclosed at the end of this report.
Risk Management
DBSIL has a risk management framework in place. Under this framework the management identifies and monitors business risks on a continuous basis, and initiates appropriate risk mitigation steps as and when deemed necessary. DBSIL has established procedures to periodically place before the Board the risk assessment and minimisation procedures being followed by the Company and steps taken by it to mitigate those risks through a properly defined framework. Committees of the Board
As on 31st March 2013, the Company has five Board-level Committees – Audit Committee, Remuneration Committee, Finance Committee, Shareholders Grievance Committee and Investment Committee.

Business Overview Management Reports Financial Statements
47
All decisions pertaining to the constitution of Committees, appointment of members and fixing of terms of service for Committee members is taken by the Board of Directors. Details on the role and composition of these Committees, including the number of meetings held during the financial year and the related attendance, are provided below:
a) Audit Committee
As on 31st March 2013, the Audit Committee comprises
three members Mr. P. Kannan, Mr. M. Raghupathy, and Mr. J.S. Baijal, all of whom are independent Directors. Mr. P. Kannan, is the Chairman of the Audit Committee. The Audit Committee met four times during the year on 11-5-2012, 7-8-2012, 9-11-2012 and 7-2-2013. The particulars of attendance of the members in the Meetings of this Committee is set out in Table 3 hereunder
Table 3: Attendance record of DBSIL’s Audit Committee during 2012-13
Name of Members Category Status No. of Meetings Held Attended
Mr. P. Kannan Independent Chairman 4 4Mr. M. Raghupathy Independent Member 4 3Mr. J. S. Baijal Independent Member 4 3
The Officer responsible for the finance function, the head of internal audit and the representative of the statutory auditors, internal auditors and cost auditors are regularly invited by the Audit Committee to its meetings. Mr. K.V. Mohan, Company Secretary, is the Secretary to the Committee.
All members of the Audit Committee have requisite accounting and financial management expertise. Mr. P. Kannan, the Chairman of the Audit Committee attended the Annual General Meeting (AGM) held on 18th August, 2012 to answer shareholders queries.
The functions of the Audit Committee of the Company include the following:
Oversight of the Company’s financial reporting process and the disclosure of its financial information to ensure that the financial statement is correct, sufficient and credible.
Recommending to the Board, the appointment, re-appointment and, if required, the replacement or removal of the statutory auditor and the fixation of audit fees.
Approval of payment to statutory auditors for any other services rendered by the statutory auditors.
Reviewing, with the management, the annual financial statements before submission to the Board for approval, with particular reference to:
Matters required to be included in the Director’s Responsibility Statement to be included in the
Board’s report in terms of clause (2AA) of section 217 of the Companies Act, 1956.
Changes, if any, in accounting policies and practices and reasons for the same.
Major accounting entries involving estimates based on the exercise of judgment by management.
Significant adjustments made, if any, in the financial statements arising out of audit findings.
Compliance with listing and other legal requirements relating to financial statements.
Disclosure of any related party transactions.
Qualifications, if any, in the draft audit report.
Reviewing, with the management, the quarterly financial statements before submission to the Board for approval.
Reviewing, with the management, performance of statutory and internal auditors, adequacy of the internal control systems.
Reviewing the adequacy of internal audit function, if any, including the structure of the internal audit department, staffing and seniority of the official heading the department, reporting structure coverage and frequency of internal audit.
Discussion with internal auditors on any significant findings and follow up there on.
48
Reviewing the findings of any internal investigations by the internal auditors into matters where there is suspected fraud or irregularity or a failure of internal control systems of a material nature and reporting the matter to the Board.
Discussion with statutory auditors before the audit commences, about the nature and scope of audit as well as post-audit discussion to ascertain any area of concern.
To look into the reasons for substantial defaults, if any, in the payment to the depositors, debenture holders, shareholders (in case of non payment of declared dividends) and creditors.
Carrying out any other function as is mentioned in the terms of reference of the Audit Committee.
The Audit Committee is empowered, pursuant to its terms of reference, to:
Investigate any activity within its terms of reference and to seek any information it requires from any employee.
Obtain legal or other independent professional advice and to secure the attendance of outsiders with relevant experience and expertise, when considered necessary.
The Company has systems and procedures in place to ensure that the Audit Committee mandatorily reviews:
Management discussion and analysis of financial condition and results of operations.
Statement of significant related party transactions (as defined by the Audit Committee), submitted by management.
Management letters / letters of internal control weaknesses issued by the statutory auditors.
Internal audit reports relating to internal control weaknesses.
The appointment, removal and terms of remuneration of the Chief Internal Auditor.
Whenever applicable, the uses/applications of funds raised through public issues, rights issues, preferential issues by major category (capital expenditure, sales and marketing, working capital, etc), as part of the quarterly declaration of financial results.
If applicable, on an annual basis, statement certified by the statutory auditors, detailing the use of funds raised through public issues, rights issues, preferential issues for purposes other than those stated in the offer document/prospectus/notice.
The Audit Committee is also apprised on information with regard to related party transactions by being presented:
A statement in summary form of transactions with related parties in the ordinary course of business.
Details of material individual transactions with related parties which are not in the normal course of business.
Details of material individual transactions with related parties or others, which are not on an arm’s length basis along with management’s justification for the same.
b) Remuneration Committee
As on 31st March 2013, the Remuneration Committee comprised, Mr. J.S. Baijal and Mr. M. Raghupathy and Mr. P. Kannan, all independent Directors. The Remuneration Committee met once during the year on 11-5-2012. The particulars of attendance of the members in the Meetings of this Committee is set out in Table 4 hereunder:
Table 4 - Attendance record of DBSIL’s Remuneration Committee during 2012-13
Name of Members Category Status No. of Meetings Held AttendedMr. J. S. Baijal Independent Chairman 1 1Mr. P. Kannan Independent Member 1 1Mr. M. Raghupathy Independent Member 1 -
c) Shareholders Grievance Committee
The Shareholders Grievance Committee comprised Mr. M. Raghupathy, (Independent Director) as its Chairman, and Mr. P. Kannan (Independent Director) as its member. The terms of reference to this Committee is to look into and redress
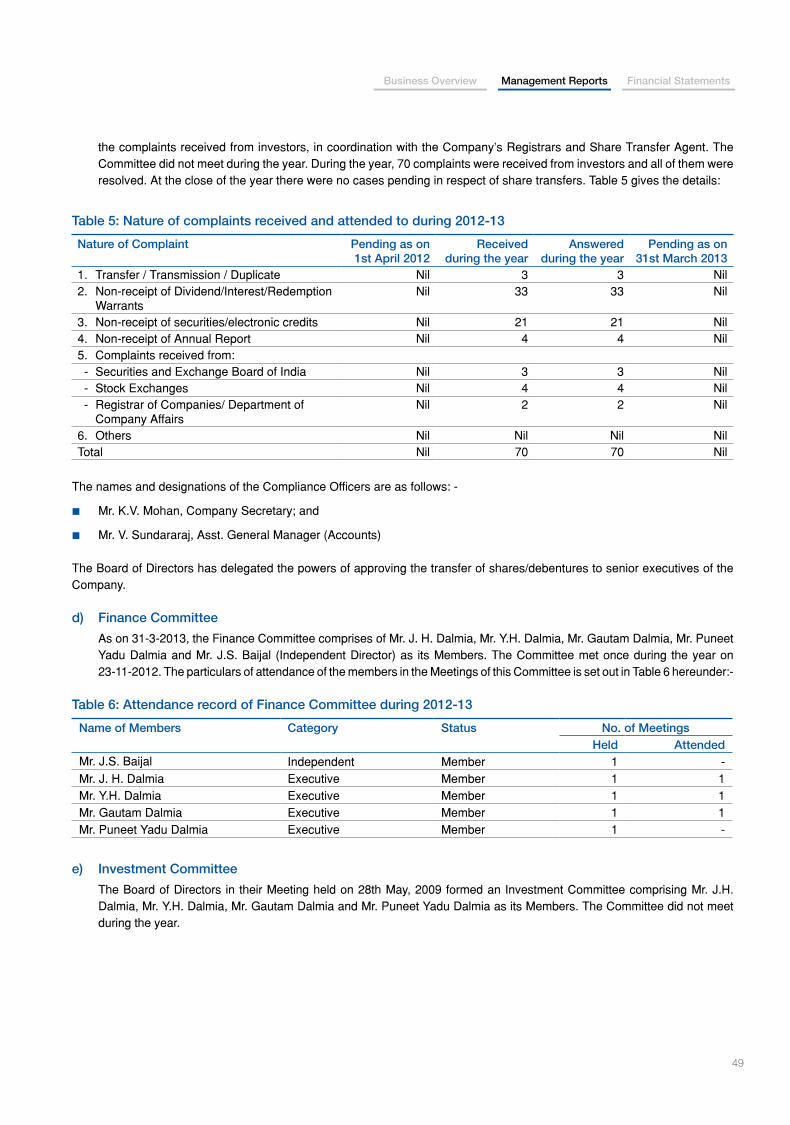
Business Overview Management Reports Financial Statements
49
the complaints received from investors, in coordination with the Company’s Registrars and Share Transfer Agent. The Committee did not meet during the year. During the year, 70 complaints were received from investors and all of them were resolved. At the close of the year there were no cases pending in respect of share transfers. Table 5 gives the details:
Table 5: Nature of complaints received and attended to during 2012-13
Nature of Complaint Pending as on 1st April 2012
Received during the year
Answered during the year
Pending as on 31st March 2013
1. Transfer / Transmission / Duplicate Nil 3 3 Nil2. Non-receipt of Dividend/Interest/Redemption
WarrantsNil 33 33 Nil
3. Non-receipt of securities/electronic credits Nil 21 21 Nil4. Non-receipt of Annual Report Nil 4 4 Nil5. Complaints received from: - Securities and Exchange Board of India Nil 3 3 Nil - Stock Exchanges Nil 4 4 Nil - Registrar of Companies/ Department of
Company AffairsNil 2 2 Nil
6. Others Nil Nil Nil NilTotal Nil 70 70 Nil
The names and designations of the Compliance Officers are as follows: -
Mr. K.V. Mohan, Company Secretary; and
Mr. V. Sundararaj, Asst. General Manager (Accounts)
The Board of Directors has delegated the powers of approving the transfer of shares/debentures to senior executives of the Company.
d) Finance Committee
As on 31-3-2013, the Finance Committee comprises of Mr. J. H. Dalmia, Mr. Y.H. Dalmia, Mr. Gautam Dalmia, Mr. Puneet Yadu Dalmia and Mr. J.S. Baijal (Independent Director) as its Members. The Committee met once during the year on 23-11-2012. The particulars of attendance of the members in the Meetings of this Committee is set out in Table 6 hereunder:-
Table 6: Attendance record of Finance Committee during 2012-13
Name of Members Category Status No. of Meetings Held AttendedMr. J.S. Baijal Independent Member 1 -Mr. J. H. Dalmia Executive Member 1 1Mr. Y.H. Dalmia Executive Member 1 1Mr. Gautam Dalmia Executive Member 1 1Mr. Puneet Yadu Dalmia Executive Member 1 -
e) Investment Committee
The Board of Directors in their Meeting held on 28th May, 2009 formed an Investment Committee comprising Mr. J.H. Dalmia, Mr. Y.H. Dalmia, Mr. Gautam Dalmia and Mr. Puneet Yadu Dalmia as its Members. The Committee did not meet during the year.
50
e) Committee of Independent Directors
During the year, pursuant to an Open Offer made to the Shareholders of the Company by Dalmia Bharat Limited, a Committee of Independent Directors was constituted to provide its recommendations on the offer price stated in the Public Announcement dated 5th September, 2012, in compliance with Regulation 26(3) of the SEBI (Substantial Acquisition of Shares and Takeovers) Regulations, 2011. This Committee comprised of Mr. J.S. Baijal, Mr. P. Kannan and Mr. M. Raghupathy, all Independent Directors. The Committee met once during the year on 8-1-2013 to give its recommendations of the
offer price. All Directors constituting the Committee were present at the Meeting.
Subsidiary Companies
Clause 49 of the Listing Agreement defines a “material non-listed Indian subsidiary” as an unlisted subsidiary, incorporated in India, whose turnover or net worth (i.e. paid up capital and free reserves) exceeds 20% of the consolidated turnover or net worth respectively, of the listed holding Company and its subsidiaries in the immediately preceding accounting year.
As on 31st March 2013, under this definition, DBSIL does not have a ‘material non-listed Indian subsidiary’.
Shares and Convertible Instruments held by Non-Executive Directors
Table 7: Details of the shares and convertible instruments held by the Non-Executive Directors as on 31st March, 2013
Name of the Director Category Number of shares held Number of convertible instruments held
Mr. J.S. Baijal Independent, Non-Executive Nil NilMr. M. Raghupathy Independent, Non-Executive Nil NilMr. T. Venkatesan Non-Executive Nil NilMr. P. Kannan Independent, Non-Executive 2,730 NilMr. B.B. Mehta Non-Executive Nil Nil
Management
Management Discussion and Analysis
The Annual Report has a detailed report on Management Discussion and Analysis.
Disclosures
Related party transactions in the ordinary course of business have been disclosed at Note No. 46 to the financial statements in the Annual Report. No transactions were made that had the possibility of injuring the Company’s interests. The Company complied with the regulatory requirements on capital markets. No penalties/strictures have been imposed against it.
The Company has complied with the requirements of Section 205C of the Companies Act, 1956 and all amounts due to be credited to the Investor Education & Protection Fund have been duly credited within the time specified under the said section.
Disclosure of Accounting Treatment in Preparation of Financial Statements
DBSIL has followed the guidelines of Accounting Standards
laid down by the Central Government under the provisions of section 211(3) of the Companies Act, 1956 in the preparation of its financial statements.
Details of Non-Compliance by the Company
DBSIL has complied with all the requirements of regulatory authorities. No penalties/strictures were imposed on the Company by the Stock Exchanges or SEBI or any statutory authority on any matter related to capital market during the last three years.
Code for Prevention of Insider-Trading Practices
In compliance with the SEBI regulations on prevention of insider trading, the Company has instituted a comprehensive code of conduct for its management and staff. The code lays down guidelines, which advises them on procedures to be followed and disclosures to be made, while dealing with shares of Company, and cautioning them of the consequences of violations.
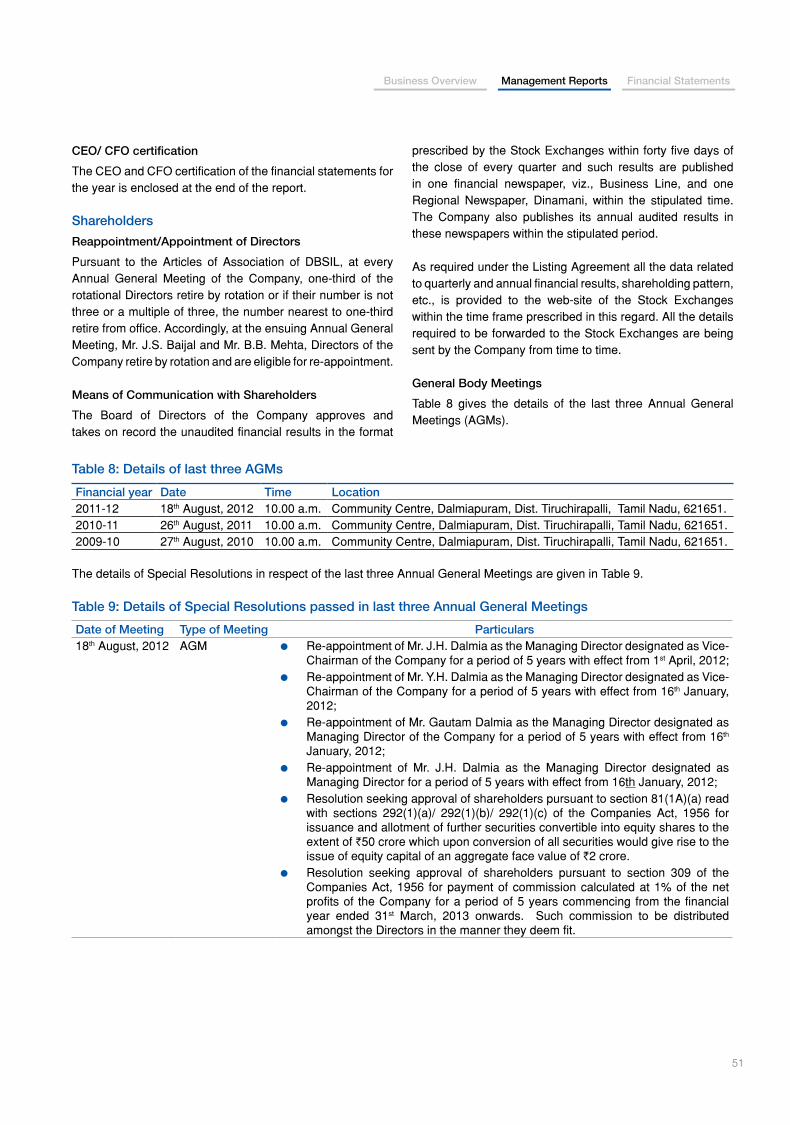
Business Overview Management Reports Financial Statements
51
CEO/ CFO certification
The CEO and CFO certification of the financial statements for the year is enclosed at the end of the report.
Shareholders
Reappointment/Appointment of Directors
Pursuant to the Articles of Association of DBSIL, at every Annual General Meeting of the Company, one-third of the rotational Directors retire by rotation or if their number is not three or a multiple of three, the number nearest to one-third retire from office. Accordingly, at the ensuing Annual General Meeting, Mr. J.S. Baijal and Mr. B.B. Mehta, Directors of the Company retire by rotation and are eligible for re-appointment.
Means of Communication with Shareholders
The Board of Directors of the Company approves and takes on record the unaudited financial results in the format
prescribed by the Stock Exchanges within forty five days of the close of every quarter and such results are published in one financial newspaper, viz., Business Line, and one Regional Newspaper, Dinamani, within the stipulated time. The Company also publishes its annual audited results in these newspapers within the stipulated period.
As required under the Listing Agreement all the data related to quarterly and annual financial results, shareholding pattern, etc., is provided to the web-site of the Stock Exchanges within the time frame prescribed in this regard. All the details required to be forwarded to the Stock Exchanges are being sent by the Company from time to time.
General Body Meetings
Table 8 gives the details of the last three Annual General Meetings (AGMs).
Table 8: Details of last three AGMs
Financial year Date Time Location2011-12 18th August, 2012 10.00 a.m. Community Centre, Dalmiapuram, Dist. Tiruchirapalli, Tamil Nadu, 621651. 2010-11 26th August, 2011 10.00 a.m. Community Centre, Dalmiapuram, Dist. Tiruchirapalli, Tamil Nadu, 621651. 2009-10 27th August, 2010 10.00 a.m. Community Centre, Dalmiapuram, Dist. Tiruchirapalli, Tamil Nadu, 621651.
The details of Special Resolutions in respect of the last three Annual General Meetings are given in Table 9.
Table 9: Details of Special Resolutions passed in last three Annual General Meetings
Date of Meeting Type of Meeting Particulars18th August, 2012 AGM Re-appointment of Mr. J.H. Dalmia as the Managing Director designated as Vice-
Chairman of the Company for a period of 5 years with effect from 1st April, 2012; Re-appointment of Mr. Y.H. Dalmia as the Managing Director designated as Vice-
Chairman of the Company for a period of 5 years with effect from 16th January, 2012;
Re-appointment of Mr. Gautam Dalmia as the Managing Director designated as Managing Director of the Company for a period of 5 years with effect from 16th January, 2012;
Re-appointment of Mr. J.H. Dalmia as the Managing Director designated as Managing Director for a period of 5 years with effect from 16th January, 2012;
Resolution seeking approval of shareholders pursuant to section 81(1A)(a) read with sections 292(1)(a)/ 292(1)(b)/ 292(1)(c) of the Companies Act, 1956 for issuance and allotment of further securities convertible into equity shares to the extent of `50 crore which upon conversion of all securities would give rise to the issue of equity capital of an aggregate face value of `2 crore.
Resolution seeking approval of shareholders pursuant to section 309 of the Companies Act, 1956 for payment of commission calculated at 1% of the net profits of the Company for a period of 5 years commencing from the financial year ended 31st March, 2013 onwards. Such commission to be distributed amongst the Directors in the manner they deem fit.
52
Date of Meeting Type of Meeting Particulars26th August, 2011 AGM Resolution seeking approval of shareholders pursuant to section 81(1A)(a) read
with sections 292(1)(a)/ 292(1)(b)/ 292(1)(c) of the Companies Act, 1956 for is-suance and allotment of further securities convertible into equity shares to the extent of ` 1500 crore which upon conversion of all securities would give rise to the issue of equity capital of an aggregate face value of ` 4 crore.
To approve the minimum remuneration of upto an amount of ` 48 lakhs per annum to each of the Vice-Chairmen and Managing Directors of the Company for the financial year 2010-11 and 2011-12 in the event of loss or inadequacy of profits.
27th August, 2010 AGM Reaffirmation of insertion of new Article 138 in the Articles of Association of the Company.
Change in name of the Company from Dalmia Cement (Bharat) Limited to Dalmia Bharat Sugar and Industries Limited.
Postal Ballot
During the year ended 31st March 2013, the Company did not propose any Resolution through Postal Ballot.
Compliance
Mandatory Requirements
DBSIL is fully compliant with the applicable mandatory requirements of Clause 49 of the Listing Agreement.
Adoption of Non-Mandatory Requirements
Although it is not mandatory, a Remuneration Committee, Finance Committee and Investment Committee of the Board are in place. Details of the aforementioned Committees have been provided under the head “Committees of the Board” above.
Additional Shareholder Information
Annual General Meeting
Date: 24th August, 2013Time: 10.30 a.m.Venue: Community Centre Premises, Dalmiapuram-621651, Dist. Tiruchirapalli, Tamil Nadu
Financial Calendar
Financial year: 1st April, 2013 to 31st March, 2014
For the year ended 31st March 2014, results will be announced on:
First quarter: By mid-August, 2013
Second quarter: By mid-November, 2013
Third quarter: By mid-February, 2014
Fourth quarter: By end May, 2014
Book Closure
The dates of book closure are from 17th August, 2013 to 24th August 2013 inclusive of both days.
Dividend Payment
The Directors have recommended payment of final dividend calculated at `0.25 per equity share of `2/- each. Such dividend shall be paid to those share holders whose names appear on the Company’s Register of Members as on 17th August, 2013. The dividend pay-out will be effected on 3rd September, 2013.
Listing
Listing on Stock Exchanges in respect of the Equity Shares is as under:
a) The Madras Stock Exchange Association Limited, Exchange Building, Post Box No. 183, 11, Second Line Beach, Chennai - 600001.
b) Bombay Stock Exchange Limited, Phiroze Jeejeebhoy Towers, Dalal Street, Mumbai - 400001. c) The National Stock Exchange of India Limited, Exchange Plaza, 5th Floor, Plot No. C/1, G - Block, Bandra Kurla Complex, Bandra (East), Mumbai - 400051
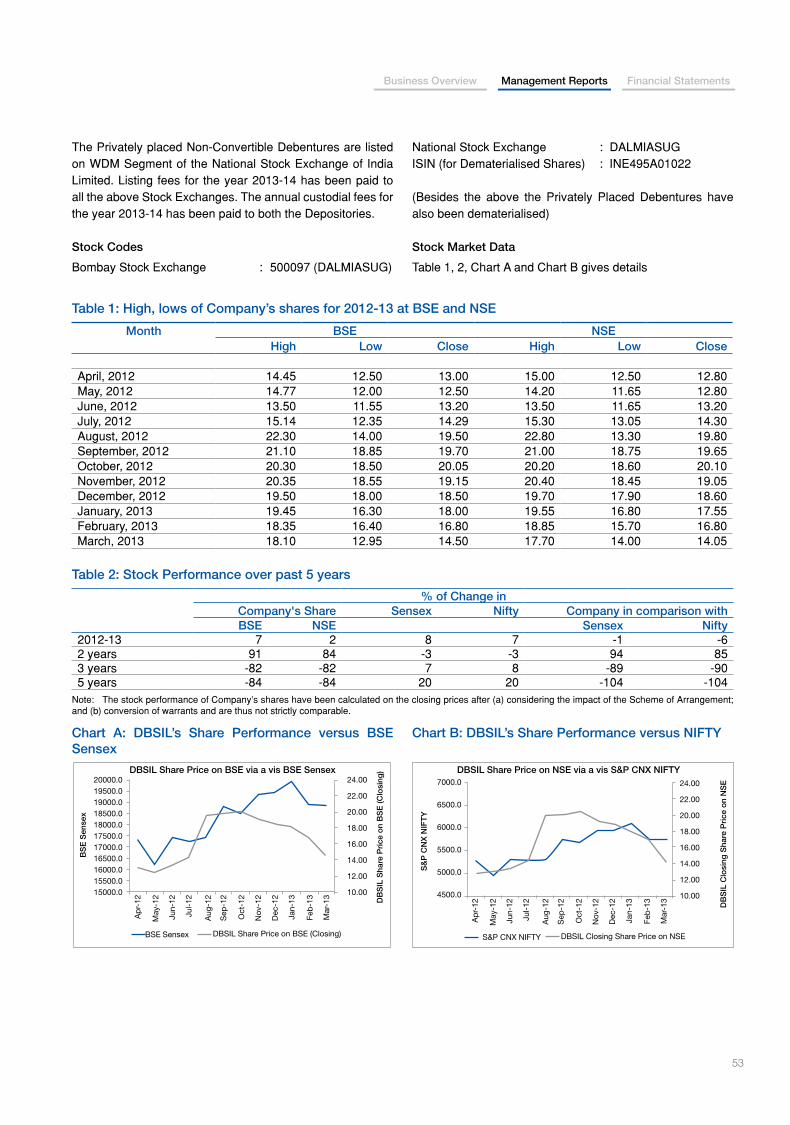
Business Overview Management Reports Financial Statements
53
The Privately placed Non-Convertible Debentures are listed on WDM Segment of the National Stock Exchange of India Limited. Listing fees for the year 2013-14 has been paid to all the above Stock Exchanges. The annual custodial fees for the year 2013-14 has been paid to both the Depositories.
Stock Codes
Bombay Stock Exchange : 500097 (DALMIASUG)
National Stock Exchange : DALMIASUGISIN (for Dematerialised Shares) : INE495A01022
(Besides the above the Privately Placed Debentures have also been dematerialised)
Stock Market Data
Table 1, 2, Chart A and Chart B gives details
Table 1: High, lows of Company’s shares for 2012-13 at BSE and NSE
Month BSE NSEHigh Low Close High Low Close
April, 2012 14.45 12.50 13.00 15.00 12.50 12.80May, 2012 14.77 12.00 12.50 14.20 11.65 12.80June, 2012 13.50 11.55 13.20 13.50 11.65 13.20July, 2012 15.14 12.35 14.29 15.30 13.05 14.30August, 2012 22.30 14.00 19.50 22.80 13.30 19.80September, 2012 21.10 18.85 19.70 21.00 18.75 19.65October, 2012 20.30 18.50 20.05 20.20 18.60 20.10November, 2012 20.35 18.55 19.15 20.40 18.45 19.05December, 2012 19.50 18.00 18.50 19.70 17.90 18.60January, 2013 19.45 16.30 18.00 19.55 16.80 17.55February, 2013 18.35 16.40 16.80 18.85 15.70 16.80March, 2013 18.10 12.95 14.50 17.70 14.00 14.05
Table 2: Stock Performance over past 5 years
% of Change inCompany's Share Sensex Nifty Company in comparison withBSE NSE Sensex Nifty
2012-13 7 2 8 7 -1 -62 years 91 84 -3 -3 94 853 years -82 -82 7 8 -89 -905 years -84 -84 20 20 -104 -104
Note: The stock performance of Company’s shares have been calculated on the closing prices after (a) considering the impact of the Scheme of Arrangement; and (b) conversion of warrants and are thus not strictly comparable.
Chart A: DBSIL’s Share Performance versus BSE Sensex
Chart B: DBSIL’s Share Performance versus NIFTY
DBSIL Share Price on BSE via a vis BSE Sensex20000.019500.019000.018500.018000.017500.017000.016500.016000.015500.015000.0
24.00
22.00
20.00
18.00
16.00
14.00
12.00
10.00
BS
E S
ense
x
DB
SIL
Sha
re P
rice
on
BS
E (C
losi
ng)
BSE Sensex DBSIL Share Price on BSE (Closing)
Ap
r-12
May
-12
Jun-
12
Jul-
12
Aug
-12
Sep
-12
Oct
-12
Nov
-12
Dec
-12
Jan-
13
Feb
-13
Mar
-13
7000.0
6500.0
6000.0
5500.0
5000.0
4500.0
Ap
r-12
May
-12
Jun-
12
Jul-
12
Aug
-12
Sep
-12
Oct
-12
Nov
-12
Dec
-12
Jan-
13
Feb
-13
Mar
-13
DBSIL Share Price on NSE via a vis S&P CNX NIFTY24.00
22.00
20.00
18.00
16.00
14.00
12.00
10.00
S&
P C
NX
NIF
TY
DB
SIL
Clo
sing
Sha
re P
rice
on
NS
E
S&P CNX NIFTY DBSIL Closing Share Price on NSE

54
Distribution of Shareholding
Table 3 and 4 lists the distribution of the shareholding of the equity shares of the Company by size and by ownership class as on 31st March 2013.
Table 3: Shareholding pattern by size
No. of Equity Shares held No. of Shareholders % of Shareholders No. of Shares held % of Shareholding1-500 11293 74.21 1664280 2.06501-1000 1625 10.68 1265549 1.561001-2000 1158 7.61 1729355 2.142001-3000 392 2.58 987052 1.223001-4000 205 1.35 741064 0.924001-5000 137 0.90 628442 0.785001-10000 226 1.49 1572781 1.9410001 and above 181 1.19 72350780 89.39Total 15217 100.00 80939303 100.00
Table 4: Shareholding Pattern by ownership
Particulars No. of Shareholders % of Shareholders No. of Shares held
% of Shareholding
Promoters @ 20 0.13 13176820 16.28Promoter Bodies Corporate @ 27 0.18 50458302 62.34Central/State Governments 4 0.03 128155 0.16Financial Institutions 2 0.01 1601246 1.98Mutual Funds 1 0.01 2500 0.00Foreign Institutional Investors - - - -Insurance Companies 1 0.01 574036 0.71Bodies Corporate 357 2.35 1686571 2.08Overseas Body Corporate - - - -Foreign Corporate Bodies - - - -NRI/Foreign Nationals 125 0.82 162214 0.20Individuals/Others 14680 96.47 13149459 16.25Total 15217 100.00 80939303 100.00
Note: @ The Promoters have not pledged the shares of the Company against any loan drawn by them. This disclosure may be treated as a disclosure as required under Clause 35 of the Listing Agreement and under Regulation 31 of the SEBI (Substantial Acquisition of Shares and Takeovers) Regulation, 2011.
Dematerialisation of Shares
As on 31st March 2013, over 95.98% shares of the Company were held in the dematerialised form. As on 31-3-2013, except for 32,36,564 shares held by the Promoters in physical form, the balance shares held by them stand dematerialised. The said shares held in physical form were in the process of dematerialisation on the said date.
Outstanding GDRs/ADRs/Warrants/Options
Nil
Details of Public Funding Obtained in the last three years
Nil
Registrar and Transfer Agent
For Equity Shares & Privately Placed Debentures:
Karvy Computershare Private Limited,Plot Nos. 17 to 24, Vittal Rao Nagar,Madhapur,Hyderabad - 500081.
Share Transfer System
The share transfers in the physical form are presently processed by the Registrars and Transfer Agents and returned within a period of 15 days. The Company’s Equity Shares are tradable in dematerialised form since August, 2000. Under the dematerialised system, the Shareholder can approach a Depository Participant (DP) for getting his shares
Business Overview Management Reports Financial Statements
55
converted from physical form to dematerialised form. The DP will generate a request for the dematerialisation, which will be sent by him to the Company’s Registrars and Share Transfer Agents. On receipt of the same the shares will be dematerialised.
Registered Office Address:
Dalmia Bharat Sugar and Industries LimitedDalmiapuram -621651, Dist. Tiruchirapalli, Tamil NaduPhone: 04329 - 235131Fax: 04329 235111
Address for Correspondence:
Dalmia Bharat Sugar and Industries LimitedShares DepartmentDalmiapuram – 621651 Dist. TiruchirapalliTamil NaduPhone: 04329 - 235131Fax: 04329 235111
Plant Locations:
Magnesite Refractory Products:
Dalmia Magnesite CorporationSalem (Tamil Nadu) Vellakkalpatti,P.O. Karuppur,Salem – 636012.
Wind Farm Unit:
Dalmia Wind FarmMuppandal (Tamil Nadu) Aralvaimozhy –629301District Kanyakumari (Tamil Nadu)
Sugar Plants:
Dalmia Chini Mills(Unit: Ramgarh) Village Ramgarh - 261403,Tehsil Misrikh, District Sitapur(Uttar Pradesh)
Dalmia Chini Mills(Unit : Jawaharpur) Village Jawaharpur - 261403,Tehsil Sitapur Sadar, District Sitapur(Uttar Pradesh) Dalmia Chini Mills(Unit : Nigohi)Village Kuiyan,Post Areli – 242407,Tehsil Tilhar, District Shahjahanpur(Uttar Pradesh) Shri Dutta Sakhar KarkhanaVillage Asurle Porle,Panhala Taluka,District Kolhapur(Maharashtra State)
Electronics Division:Dalmia Bharat Sugar and Industries LimitedPlot No. 53, 54A, Keonics Electronics City, Phase - 1Hosur Road,Bangalore - 560100Karnataka

56
To
The Members,
Dalmia Bharat Sugar and Industries Limited
We have reviewed the implementation of Corporate Governance procedures by Dalmia Bharat Sugar and Industries Limited (‘the Company’) during the year ended March 31, 2013 as stipulated in clause 49 of the listing agreement of the said company with the Stock Exchanges, with the relevant records and documents maintained by the company, furnished to us for our review and the report on Corporate Governance as approved by the Board of Directors.
The compliance of conditions of Corporate Governance is the responsibility of the management. Our examination was limited to a review of procedures and implementation thereof, adopted by the Company for ensuring the compliance of the conditions of Corporate Governance. It is neither an audit nor an expression of opinion on the financial statements of the Company.
In our opinion and to the best of our information and according to the explanations given to us and the representations made by the directors and the management, we certify that the Company has complied with the conditions of Corporate Governance as stipulated in the above mentioned clause in listing agreement.
We further state that such compliance in neither an assurance as to the future viability of the Company nor the efficiency or effectiveness with which the management has conducted the affairs of the Company.
For S.S. Kothari Mehta & Co.Chartered Accountants
Firm Registration No. 000756N
(ArunK.Tulsian)Place: New Delhi PartnerDated: 27, May 2013 Membership No. 089907
To The Board of Directors,Dalmia Bharat Sugar and Industries LimitedRegistered Office: Dalmiapuram – 621651District TiruchirapalliTamil Nadu
Dear Sirs,
I do hereby certify that the all the Members of the Board of Directors of the Company and the Senior Management Personnel have affirmed their compliance with the Code of Conduct laid down by the Board of Directors of the Company in their Meeting held on 26-07-2005.
This certificate is being given in compliance with the requirements of Clause 49 (I) (D) (ii) of the Listing Agreement entered into with the Stock Exchanges.
Dated: 27-5-2013 Gautam Dalmia Place: New Delhi Managing Director & CEO
Auditor’s Certificate on Corporate Governance
Business Overview Management Reports Financial Statements
57
To The Board of Directors,Dalmia Bharat Sugar and Industries LimitedRegistered Office: Dalmiapuram – 621651District TiruchirapalliTamil Nadu
Dear Sirs,
1. We have reviewed the Balance Sheet, Profit and Loss account and all its Schedules and Notes on Accounts, as well as the Cash Flow Statements as at 31st March, 2013 and certify that to the best of our knowledge and belief:
1) These Statements do not contain any materially untrue statement or omit any material fact or contain Statements that might be misleading;
2) These Statements read together present a true and fair view of the Company’s Affairs and are in compliance with existing Accounting Standards, applicable laws and regulations.
2. We further certify that, to the best of our knowledge and belief, no transactions have been entered into by the Company during the year which are fraudulent, illegal or violative of the Company’s Code of Conduct;
3. We accept responsibility for establishing and maintaining internal controls and that we have evaluated the effectiveness of the internal control systems of the Company and we have disclosed to the Auditors and the Audit Committee, deficiencies in the design or operation of internal controls, if any, of which we are aware and the steps we have taken or propose to take to rectify these deficiencies;
4. We have indicated to the Auditors and the Audit Committee:
(i) Significant changes in internal control during the year;
(ii) Significant changes in accounting policies during the year and that the same have been disclosed in the notes to the financial statements; and
(iii) Instances of significant fraud of which we have become aware and the involvement therein, if any, of the management or an employee having a significant role in the company’s internal control systems.
Dated: 27-5-2013 Anil Kataria Gautam Dalmia Place: New Delhi Chief Financial Officer Managing Director & CEO
58
Independent Auditors’ Report
To the Members of Dalmia Bharat Sugar and Industries Limited
Report on the Financial Statements
We have audited the accompanying Financial Statements of Dalmia Bharat Sugar and Industries Limited (‘the Company’), which comprise the Balance Sheet as at March 31, 2013, and the Statement of Profit and Loss and Cash Flow Statement for the year then ended, and Notes to Financial Statements comprising of a summary of significant accounting policies and other explanatory information.
Management’s Responsibility for the Financial Statements
Management is responsible for the preparation of these financial statements that give a true and fair view of the financial position, financial performance and cash flows of the Company in accordance with the Accounting Standards referred to in sub-section (3C) of section 211 of the Companies Act, 1956. This responsibility includes the design, implementation and maintenance of internal controls relevant to the preparation and presentation of the financial statements that give a true and fair view and are free from material misstatement, whether due to fraud or error.
Auditors’ Responsibility
Our responsibility is to express an opinion on these financial statements based on our audit. We conducted our audit in accordance with the Standards on Auditing issued by the Institute of Chartered Accountants of India. Those Standards require that we comply with ethical requirements and plan and perform the audit to obtain reasonable assurance about whether the financial statements are free from material misstatement.
An audit involves performing procedures to obtain audit evidence about the amounts and disclosures in the financial statements. The procedures selected depend on the auditor’s judgment, including the assessment of the risks of material misstatement of the financial statements, whether due to fraud or error. In making those risk assessments, the auditor considers internal controls relevant to the Company’s preparation and fair presentation of the financial statements in order to design audit procedures that are appropriate in the circumstances. An audit also includes evaluating the appropriateness of accounting policies used and reasonableness of the accounting estimates made by management, as well as evaluating the overall presentation of the financial statements.
We believe that the audit evidence we have obtained is sufficient and appropriate to provide a basis for our audit opinion.
Opinion
In our opinion and to the best of our information and according
to the explanations given to us, the financial statements give the information required by the Companies Act, 1956 in the manner so required and give a true and fair view in conformity with the accounting principles generally accepted in India:
a) In case of Balance Sheet, of the state of affairs of the Company as at March 31, 2013;
b) In case of Statement of Profit and Loss, of the profit for the year ended on that date; and
c) In case of Cash Flow Statement, of the cash flows for the year ended on that date.
Report on Other Legal and Regulatory Requirements
1) As required by the Companies (Auditors’ Report) Order, 2003 (‘the Order’) issued by the Central Government of India in terms of sub – section (4A) of section 227 of the Companies Act 1956, we give in the Annexure a statement on the matters specified in paragraphs 4 and 5 of the said Order.
2) As required by section 227(3) of the Companies Act 1956, we report that:
a) We have obtained all the information and explanations which to the best of our knowledge and belief were necessary for the purpose of our audit;
b) In our opinion, proper books of account as required by law have been kept by the Company so far as appears from our examination of those books;
c) The Balance Sheet, Statement of Profit and Loss and Cash Flow Statement dealt with by this Report are in agreement with the books of account;
d) In our opinion, the Balance Sheet, Statement of Profit and Loss and Cash Flow Statement comply with the Accounting Standards referred to in sub-section (3C) of section 211 of the Companies Act 1956; and
e) On the basis of written representations received from the directors as on March 31, 2013, and taken on record by the Board of Directors, none of the directors is disqualified as on March 31, 2013, from being appointed as a director in terms of clause (g) of sub-section (1) of section 274 of the Companies Act 1956.
For S. S. Kothari Mehta & Co.Chartered Accountants
FRN – 000756N
Arun K.TulsianDate: May 27, 2013 PartnerPlace: New Delhi Membership No. 89907

Business Overview Management Reports Financial Statements
59
Annexure Referred to in our Report of even date
Re: Dalmia Bharat Sugar and Industries Limited
(i) (a) The Company has maintained proper records showing full particulars, including quantitative details and situation of fixed assets.
(b) All fixed assets have not been physically verified by the management during the year but there is a regular programme of verification which, in our opinion, is reasonable having regard to the size of the Company and the nature of its assets. No material discrepancies were noticed on such verification as compared to book records.
(c) Fixed assets disposed off during the year were not substantial.
(ii) (a) The management has conducted physical verification of inventory at reasonable intervals during the year, except stocks lying with third parties which have been verified with reference to correspondence of third parties. In our opinion, the frequency of such verification is reasonable.
(b) The procedures of physical verification of inventory followed by the management are reasonable and adequate in relation to the size of the Company and the nature of its business.
(c) The Company is maintaining proper records of inventory. The discrepancies noticed on physical verification of inventory as compared to book records were not material and have been properly dealt with in the books of account.
(iii) (a) As informed, the Company has not granted any loans, secured or unsecured, to companies, firms or other parties covered in the register maintained under section 301 of the Companies Act, 1956. Accordingly, the provisions of clause 4 (iii) (b), (c) & (d) of the Order are not applicable to the Company.
(b) According to the information and explanations given to us, the Company has taken unsecured loan from one company covered in the register maintained under section 301 of the Companies Act, 1956. The maximum amount outstanding during the year is `68 crore and the year end balance of such loan is `45 crore.
(c) In our opinion and according to the information and explanations given to us, the rate of interest and other terms and conditions for such loans are not, prima facie, prejudicial to the interest of the Company.
(d) In respect of loans taken, repayment of the principal
amount is as stipulated and payments of interest have been regular. There are no overdue amounts at the year-end as the loan is repayable on demand.
(iv) In our opinion and according to the information and explanations given to us, there are adequate internal control systems commensurate with the size of the Company and the nature of its business, for the purchase of inventory and fixed assets and for the sale of goods and services. During the course of our audit carried out in accordance with the generally accepted auditing practices in India, we have not observed any major weakness or continuing failure to correct any major weakness in the internal control system of the Company in respect of these areas.
(v) (a) According to the information and explanations provided by the management, we are of the opinion that the particulars of contracts or arrangements referred to in section 301 of the Companies Act, 1956 that need to be entered into the register maintained under section 301 have been so entered.
(b) In our opinion and according to the information and explanations given to us, the transactions made in pursuance of such contracts or arrangements exceeding value of Rupees five lakh in respect of each party have been entered into during the financial year at prices which are reasonable having regard to the prevailing market prices at the relevant time.
(vi) In our opinion and according to the information and explanations given to us, the Company has not accepted any deposits from the public, within the meaning of Sections 58A and 58AA or any other relevant provisions of the Companies Act, 1956 and Companies (Acceptance of Deposits) Rules, 1975.
(vii) In our opinion, the Company has an internal audit system commensurate with the size and nature of its business.
(viii) We have broadly reviewed the cost accounting records maintained by the Company pursuant to the Rules made by the Central Government under section 209(1)(d) of the Companies Act, 1956, and are of the opinion that, prima facie, the prescribed accounts and records have been made and maintained. However, we are not required to make a detailed examination of such records.
(ix) (a) Undisputed statutory dues including Provident Fund, Investor Education and Protection Fund, Employees’ State Insurance, Income-tax, Sales-tax, Wealth-tax, Service tax, Customs Duty, Excise Duty, Cess have generally been regularly deposited during the year with the appropriate authorities.

60
(b) According to the information and explanations given to us, no undisputed amounts payable in respect of Provident Fund, Investor Education and Protection Fund, Employees’ State Insurance, Income-tax,
Wealth-tax, Service-tax, Sales-tax, Customs Duty, Excise Duty, Cess and other undisputed statutory dues were outstanding, at the year end, for a period of more than six months from the date they became payable.
(c) According to the records of the Company, the dues outstanding of Income-tax, Sales-tax, Wealth-tax, Service-tax, Customs Duty, Excise Duty and Cess on account of any dispute and the forum where the dispute is pending, are as follows:
Name of the Statue Period to which the amount relates
Nature of Dues Forum Where dispute is pending.
(` Crore)
Central Excise Act, 1944 Year 2002-03 & 2003-04 Loss on Reprocessing CESTAT, New Delhi 0.02Central Excise Act, 1944 2006-07 to till date Demand on duty on
Multilayer Ceramic Chip capacitors
CESTAT, Bangalore 0.04
Central Excise Act, 1944 2009-10 Demand on Storage Loss of finished goods
Dy. Commissioner LTU, New Delhi
0.07
Central Excise Act, 1944 April 10 to June 12 Disallowance of Cenvat Credit
Commissioner, LTU, New Delhi
13.24
Central Excise Act, 1944 April 10 to September 12 Disallowance of Cenvat Credit
Dy. Commissioner LTU, New Delhi
0.38
Central Excise Act, 1944 April 10 to September 12 Disallowance of Cenvat Credit
Suptd, LTU New Delhi
0.05
Central Excise Act, 1944 April 10 to June 10 Demand on duty on Bagasse & electricity sale
Dy. Commissioner LTU, New Delhi
0.05
Central Excise Act, 1944 April 2007 to November 2008
Demand on Storage Loss of finished goods
Commissioner (A) LTU, New Delhi
0.13
Central Excise Act, 1944 July 2002 to June 2010 Demand on duty on Bagasse & electricity sale
CESTAT, New Delhi 29.30
Central Excise Act, 1944 July 2007 to March 2010 Demand on Storage Loss of finished goods
CESTAT, New Delhi 0.05
Central Excise Act, 1944 June 2005 to September 2005
Cenvat Credit on Cement & Steel
Allahabad High Court 0.04
Central Excise Act, 1944 March 2006 to March 2010
Cenvat Credit on Cement & Steel
CESTAT, New Delhi 5.86
Central Excise Act, 1944 March 2006 to Sept. 2012
Cenvat Credit on Cement & Steel
Dy. Commissioner LTU, New Delhi
0.15
Central Excise Act, 1944 March 2006 to March 2010
Disallowance of Cenvat Credit
CESTAT, New Delhi 0.26
Central Excise Act, 1944 September 2004 to March 2011
Disallowance of Cenvat Credit
Commissioner (A) LTU, New Delhi
0.32
Central Excise Act, 1944 September 2007 to March 2011
Cenvat Credit on Cement & Steel
Commissioner (A) LTU, New Delhi
0.42
Central Sales Tax 2001-02 Entry Tax Allahabad High Court 0.03Central Sales Tax 2006-07 Entry Tax Dy. Comm
(Assessment)-II Sitapur, U.P.
0.06
Central Sales Tax 2007-08 Sales Tax Assessment Dy. Commissioner (Assessment)-II Sitapur, U.P.
1.13
Central Sales Tax 2007-08 Entry Tax Dy.Commissioner (Assessment)- II Sitapur, U.P.
0.28
Central Sales Tax 2007-2012 Entry Tax Add. Commissioner (Appeal) Sitapur, U.P.
0.53
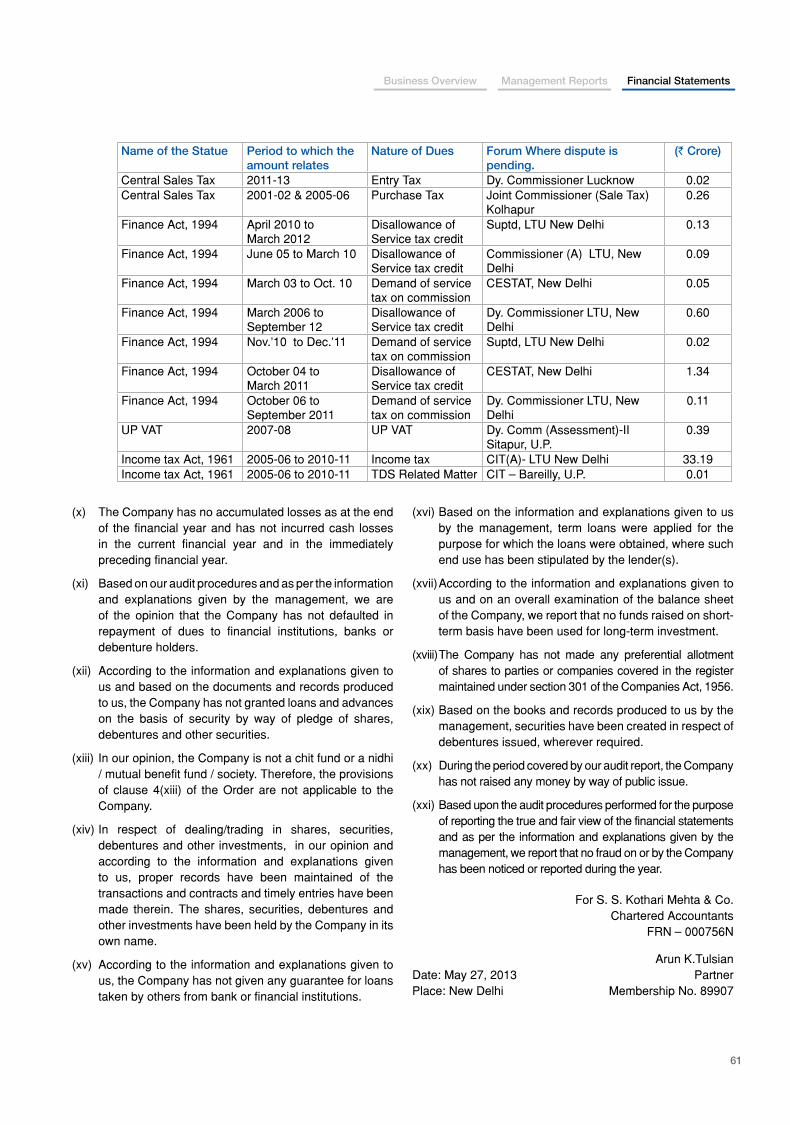
Business Overview Management Reports Financial Statements
61
Name of the Statue Period to which the amount relates
Nature of Dues Forum Where dispute is pending.
(` Crore)
Central Sales Tax 2011-13 Entry Tax Dy. Commissioner Lucknow 0.02Central Sales Tax 2001-02 & 2005-06 Purchase Tax Joint Commissioner (Sale Tax)
Kolhapur0.26
Finance Act, 1994 April 2010 to March 2012
Disallowance of Service tax credit
Suptd, LTU New Delhi 0.13
Finance Act, 1994 June 05 to March 10 Disallowance of Service tax credit
Commissioner (A) LTU, New Delhi
0.09
Finance Act, 1994 March 03 to Oct. 10 Demand of service tax on commission
CESTAT, New Delhi 0.05
Finance Act, 1994 March 2006 to September 12
Disallowance of Service tax credit
Dy. Commissioner LTU, New Delhi
0.60
Finance Act, 1994 Nov.’10 to Dec.’11 Demand of service tax on commission
Suptd, LTU New Delhi 0.02
Finance Act, 1994 October 04 to March 2011
Disallowance of Service tax credit
CESTAT, New Delhi 1.34
Finance Act, 1994 October 06 to September 2011
Demand of service tax on commission
Dy. Commissioner LTU, New Delhi
0.11
UP VAT 2007-08 UP VAT Dy. Comm (Assessment)-II Sitapur, U.P.
0.39
Income tax Act, 1961 2005-06 to 2010-11 Income tax CIT(A)- LTU New Delhi 33.19Income tax Act, 1961 2005-06 to 2010-11 TDS Related Matter CIT – Bareilly, U.P. 0.01
(x) The Company has no accumulated losses as at the end of the financial year and has not incurred cash losses in the current financial year and in the immediately preceding financial year.
(xi) Based on our audit procedures and as per the information and explanations given by the management, we are of the opinion that the Company has not defaulted in repayment of dues to financial institutions, banks or debenture holders.
(xii) According to the information and explanations given to us and based on the documents and records produced to us, the Company has not granted loans and advances on the basis of security by way of pledge of shares, debentures and other securities.
(xiii) In our opinion, the Company is not a chit fund or a nidhi / mutual benefit fund / society. Therefore, the provisions of clause 4(xiii) of the Order are not applicable to the Company.
(xiv) In respect of dealing/trading in shares, securities, debentures and other investments, in our opinion and according to the information and explanations given to us, proper records have been maintained of the transactions and contracts and timely entries have been made therein. The shares, securities, debentures and other investments have been held by the Company in its own name.
(xv) According to the information and explanations given to us, the Company has not given any guarantee for loans taken by others from bank or financial institutions.
(xvi) Based on the information and explanations given to us by the management, term loans were applied for the purpose for which the loans were obtained, where such end use has been stipulated by the lender(s).
(xvii) According to the information and explanations given to us and on an overall examination of the balance sheet of the Company, we report that no funds raised on short-term basis have been used for long-term investment.
(xviii) The Company has not made any preferential allotment of shares to parties or companies covered in the register maintained under section 301 of the Companies Act, 1956.
(xix) Based on the books and records produced to us by the management, securities have been created in respect of debentures issued, wherever required.
(xx) During the period covered by our audit report, the Company has not raised any money by way of public issue.
(xxi) Based upon the audit procedures performed for the purpose of reporting the true and fair view of the financial statements and as per the information and explanations given by the management, we report that no fraud on or by the Company has been noticed or reported during the year.
For S. S. Kothari Mehta & Co.Chartered Accountants
FRN – 000756N
Arun K.TulsianDate: May 27, 2013 PartnerPlace: New Delhi Membership No. 89907
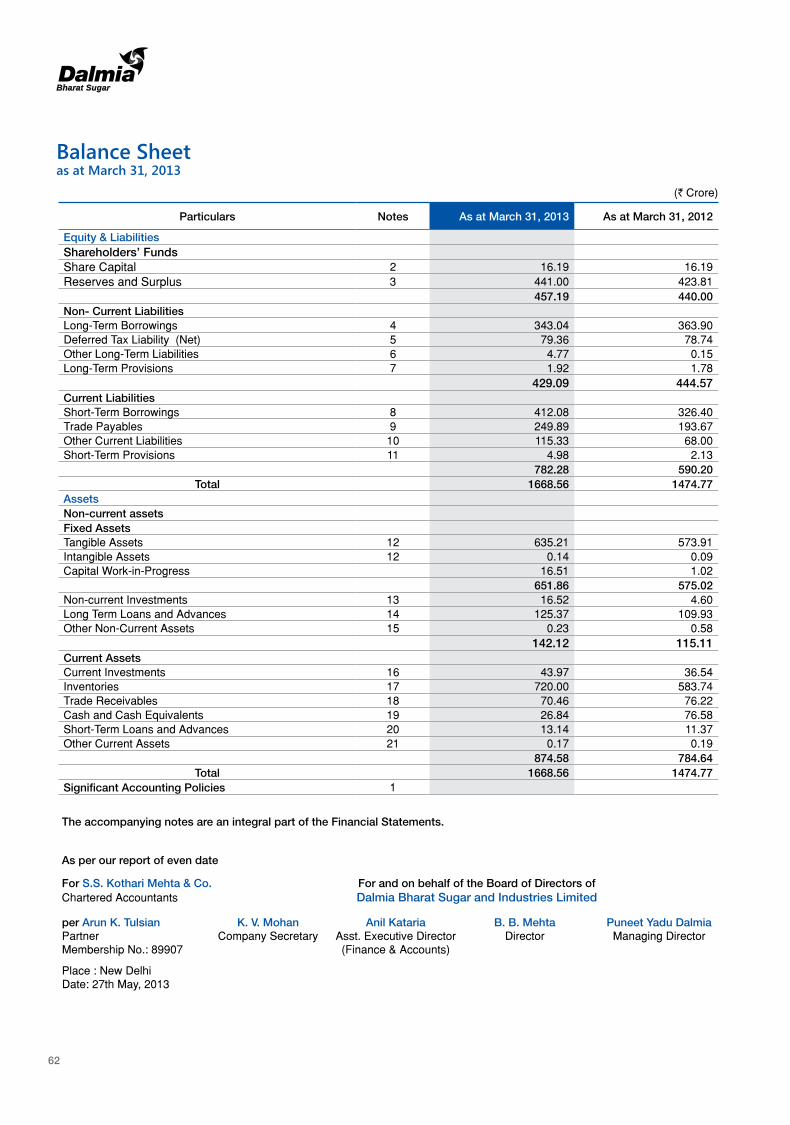
62
Balance Sheet as at March 31, 2013
(` Crore)
Particulars Notes As at March 31, 2013 As at March 31, 2012
Equity & LiabilitiesShareholders’ FundsShare Capital 2 16.19 16.19 Reserves and Surplus 3 441.00 423.81
457.19 440.00 Non- Current LiabilitiesLong-Term Borrowings 4 343.04 363.90 Deferred Tax Liability (Net) 5 79.36 78.74 Other Long-Term Liabilities 6 4.77 0.15 Long-Term Provisions 7 1.92 1.78
429.09 444.57 Current Liabilities Short-Term Borrowings 8 412.08 326.40 Trade Payables 9 249.89 193.67 Other Current Liabilities 10 115.33 68.00 Short-Term Provisions 11 4.98 2.13
782.28 590.20 Total 1668.56 1474.77
AssetsNon-current assets Fixed Assets Tangible Assets 12 635.21 573.91 Intangible Assets 12 0.14 0.09 Capital Work-in-Progress 16.51 1.02
651.86 575.02 Non-current Investments 13 16.52 4.60 Long Term Loans and Advances 14 125.37 109.93 Other Non-Current Assets 15 0.23 0.58
142.12 115.11 Current AssetsCurrent Investments 16 43.97 36.54 Inventories 17 720.00 583.74 Trade Receivables 18 70.46 76.22 Cash and Cash Equivalents 19 26.84 76.58 Short-Term Loans and Advances 20 13.14 11.37 Other Current Assets 21 0.17 0.19
874.58 784.64 Total 1668.56 1474.77
Significant Accounting Policies 1
The accompanying notes are an integral part of the Financial Statements.
As per our report of even date
For S.S. Kothari Mehta & Co. For and on behalf of the Board of Directors ofChartered Accountants Dalmia Bharat Sugar and Industries Limited
per Arun K. Tulsian K. V. Mohan Anil Kataria B. B. Mehta Puneet Yadu DalmiaPartner Company Secretary Asst. Executive Director Director Managing DirectorMembership No.: 89907 (Finance & Accounts)
Place : New DelhiDate: 27th May, 2013
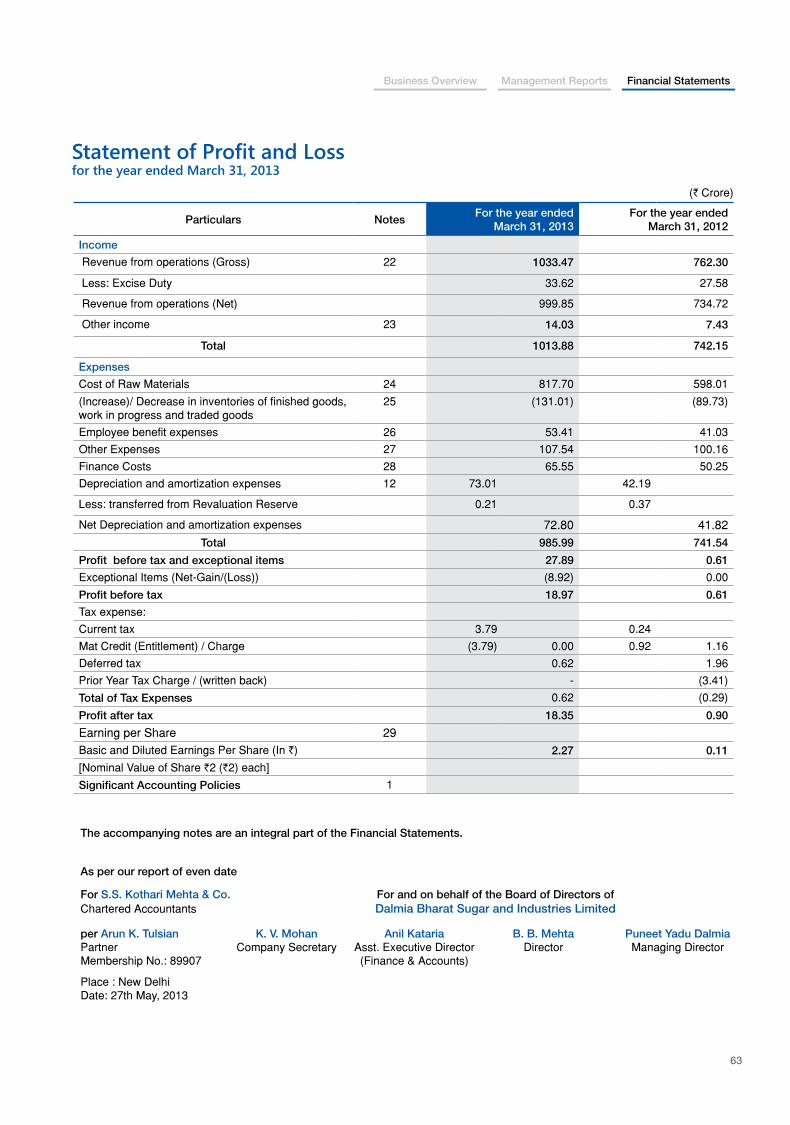
Business Overview Management Reports Financial Statements
63
Statement of Profit and Lossfor the year ended March 31, 2013
(` Crore)
Particulars NotesFor the year ended
March 31, 2013For the year ended
March 31, 2012
Income
Revenue from operations (Gross) 22 1033.47 762.30
Less: Excise Duty 33.62 27.58
Revenue from operations (Net) 999.85 734.72
Other income 23 14.03 7.43
Total 1013.88 742.15
Expenses
Cost of Raw Materials 24 817.70 598.01
(Increase)/ Decrease in inventories of finished goods, work in progress and traded goods
25 (131.01) (89.73)
Employee benefit expenses 26 53.41 41.03
Other Expenses 27 107.54 100.16
Finance Costs 28 65.55 50.25
Depreciation and amortization expenses 12 73.01 42.19
Less: transferred from Revaluation Reserve 0.21 0.37
Net Depreciation and amortization expenses 72.80 41.82 Total 985.99 741.54
Profit before tax and exceptional items 27.89 0.61
Exceptional Items (Net-Gain/(Loss)) (8.92) 0.00
Profit before tax 18.97 0.61
Tax expense:
Current tax 3.79 0.24
Mat Credit (Entitlement) / Charge (3.79) 0.00 0.92 1.16
Deferred tax 0.62 1.96
Prior Year Tax Charge / (written back) - (3.41)
Total of Tax Expenses 0.62 (0.29)
Profit after tax 18.35 0.90
Earning per Share 29Basic and Diluted Earnings Per Share (In `) 2.27 0.11
[Nominal Value of Share `2 (`2) each]
Significant Accounting Policies 1
The accompanying notes are an integral part of the Financial Statements.
As per our report of even date
For S.S. Kothari Mehta & Co. For and on behalf of the Board of Directors ofChartered Accountants Dalmia Bharat Sugar and Industries Limited
per Arun K. Tulsian K. V. Mohan Anil Kataria B. B. Mehta Puneet Yadu DalmiaPartner Company Secretary Asst. Executive Director Director Managing DirectorMembership No.: 89907 (Finance & Accounts)
Place : New DelhiDate: 27th May, 2013
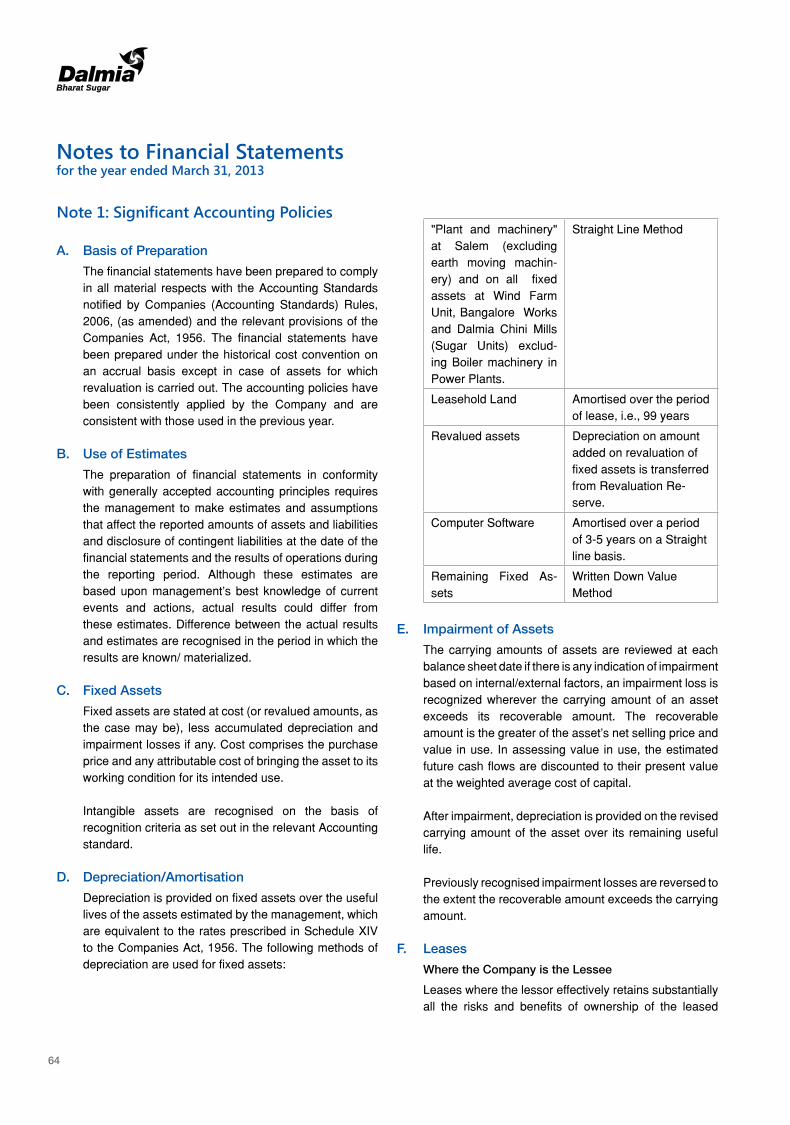
64
Notes to Financial Statementsfor the year ended March 31, 2013
Note 1: Significant Accounting Policies
A. Basis of Preparation
The financial statements have been prepared to comply in all material respects with the Accounting Standards notified by Companies (Accounting Standards) Rules, 2006, (as amended) and the relevant provisions of the Companies Act, 1956. The financial statements have been prepared under the historical cost convention on an accrual basis except in case of assets for which revaluation is carried out. The accounting policies have been consistently applied by the Company and are consistent with those used in the previous year.
B. Use of Estimates
The preparation of financial statements in conformity with generally accepted accounting principles requires the management to make estimates and assumptions that affect the reported amounts of assets and liabilities and disclosure of contingent liabilities at the date of the financial statements and the results of operations during the reporting period. Although these estimates are based upon management’s best knowledge of current events and actions, actual results could differ from these estimates. Difference between the actual results and estimates are recognised in the period in which the results are known/ materialized.
C. Fixed Assets
Fixed assets are stated at cost (or revalued amounts, as the case may be), less accumulated depreciation and impairment losses if any. Cost comprises the purchase price and any attributable cost of bringing the asset to its working condition for its intended use.
Intangible assets are recognised on the basis of
recognition criteria as set out in the relevant Accounting standard.
D. Depreciation/Amortisation
Depreciation is provided on fixed assets over the useful lives of the assets estimated by the management, which are equivalent to the rates prescribed in Schedule XIV to the Companies Act, 1956. The following methods of depreciation are used for fixed assets:
"Plant and machinery" at Salem (excluding earth moving machin-ery) and on all fixed assets at Wind Farm Unit, Bangalore Works and Dalmia Chini Mills (Sugar Units) exclud-ing Boiler machinery in Power Plants.
Straight Line Method
Leasehold Land Amortised over the period of lease, i.e., 99 years
Revalued assets Depreciation on amount added on revaluation of fixed assets is transferred from Revaluation Re-serve.
Computer Software Amortised over a period of 3-5 years on a Straight line basis.
Remaining Fixed As-sets
Written Down Value Method
E. Impairment of Assets
The carrying amounts of assets are reviewed at each balance sheet date if there is any indication of impairment based on internal/external factors, an impairment loss is recognized wherever the carrying amount of an asset exceeds its recoverable amount. The recoverable amount is the greater of the asset’s net selling price and value in use. In assessing value in use, the estimated future cash flows are discounted to their present value at the weighted average cost of capital.
After impairment, depreciation is provided on the revised carrying amount of the asset over its remaining useful life.
Previously recognised impairment losses are reversed to the extent the recoverable amount exceeds the carrying amount.
F. Leases
Where the Company is the Lessee
Leases where the lessor effectively retains substantially all the risks and benefits of ownership of the leased
Business Overview Management Reports Financial Statements
65
Notes to Financial Statementsfor the year ended March 31, 2013
item, are classified as operating leases. Operating lease payments are recognized as an expense in the Statement of Profit and Loss on a straight-line basis over the lease term.
Where the Company is the Lessor
Assets subject to operating leases are included in fixed assets. Lease income is recognised in the Statement of Profit and Loss on a straight-line basis over the lease term. Costs, including depreciation are recognised as an expense in the Statement of Profit and Loss. Initial direct costs such as legal costs, brokerage costs, etc. are recognised immediately in the Statement of Profit and Loss.
G. Government Grants and Subsidies
Grants and subsidies from the government are recognized when there is reasonable assurance that the grant/subsidy will be received and all attaching conditions will be complied with.
When the grant or subsidy relates to an expense item, it is recognized as income over the periods necessary to match them on a systematic basis to the costs, which it is intended to compensate.
Where the grant or subsidy relates to an asset, its value is deducted from the gross value of the asset concerned in arriving at the carrying amount of the related asset.
H. Borrowing Costs
Borrowing costs directly attributable to the acquisition, construction or production of an asset that necessarily takes a substantial period of time to get ready for its intended use or sale are capitalized as part of the cost of the respective asset. All other borrowing costs are expensed in the period they occur. Borrowing costs consist of interest and other costs that an entity incurs in connection with the borrowing of funds.
I. Segment Reporting
Identification of Segments
The Company’s operating businesses are organized and managed separately according to the nature of products manufactured and services provided, with each segment representing a strategic business unit that offers different products. The analysis of geographical segments is
based on the areas in which major operating divisions of the Company operate.
Inter Segment Transfers
The Company accounts for intersegment sales and transfers as if the sales or transfers were to third parties at current market prices.
Allocation of Common Costs
Common allocable costs are allocated to each segment on reasonable basis.
Unallocated Items
Includes general corporate income and expense items which are not allocable to any business segment.
Segment Policies
The company prepares its segment information in conformity with the accounting policies adopted for preparing and presenting the financial statements of the company as a whole.
J. Employee Benefits
a. Employee benefits in the form of the Company’s contribution to provident fund, pension fund, superannuation fund and ESI are considered as defined contribution plan and charged to the Statement of Profit and Loss of the year when the contributions to the respective funds are due. There are no other obligations other than the contributions payable to the respective funds.
b. Retirement benefits in the form of gratuity and provident fund contribution to Dalmia Cement Provident Fund Trust are defined benefit plans. Gratuity is provided for on the basis of an actuarial valuation on projected unit credit method made at the end of each financial year. Contributions to Dalmia Cement Provident Fund Trust are charged to the Statement of Profit and Loss of the year when the contributions to the fund is due. Shortfall in the funds, if any, is adequately provided for by the Company.
c. Leave encashment including compensated absences are provided for based on actuarial valuation at the year end. The actuarial valuation is done as per projected unit credit method.
66
d. Actuarial gains/losses are immediately taken to Statement of Profit and Loss and are not deferred.
e. Payments made under the Voluntary Retirement Scheme are charged to the Statement of Profit and Loss in the year in which the same are incurred.
K. Inventories
a. Finished goods are valued at lower of cost or net realisable value. In case of Dead Burnt Magnesite Dust Stocks to the extent these are considered saleable, valuation is done at raw materials cost plus packing charges or net realizable value, whichever is lower. By-products are valued at net realisable value. Cost includes direct materials and labour and a proportion of manufacturing overheads based on normal operating capacity. Cost of finished goods includes excise duty. Cost is determined on a weighted average basis.
b. Work in progress is valued at lower of cost or net realisable value. Cost is determined on a weighted average basis.
c. Stores, Spares and Raw Materials are valued at lower of cost or net realisable value. However materials & other items of inventories held for use in the production are not written below cost if the finished products in which they will be incorporated are expected to be sold at or above cost. Cost is determined on a weighted average basis
Net realizable value is the estimated selling price in the ordinary course of business, less estimated costs of completion and estimated costs necessary to make the sale.
L. Investments
Investments that are readily realisable and intended to be held for not more than a year are classified as current investments. All other investments are classified as long-term investments. Current investments are carried at lower of cost and fair value determined for each category separately. Long-term investments are carried at cost on individual investment basis. However, provision for diminution in value is made to recognise a decline other than temporary in the value of the investments in case of long term investments.
Notes to Financial Statementsfor the year ended March 31, 2013
M. Revenue Recognition
Revenue is recognized to the extent that it is probable that the economic benefits will flow to the Company and the revenue can be reliably measured.
Sale of Goods
Revenue is recognised when the significant risks and rewards of ownership of the goods have passed to the buyer. Excise Duty deducted from turnover (gross) are the amount that is included in the amount of turnover (gross) and not the entire amount of liability that arose during the year. Sale is net of trade discount and sales tax.
Dividends
Revenue is recognised when the shareholders’ right to receive payment is established by the balance sheet date.
Insurance Claim
Claims lodged with the insurance companies are accounted on accrual basis to the extent these are measurable and ultimate collection is reasonably certain.
N. Foreign Currency Transactions
(i) Initial Recognition
Foreign currency transactions are recorded in the reporting currency, by applying to the foreign currency amount the exchange rate between the reporting currency and the foreign currency at the date of the transaction.
(ii) Conversion
Foreign currency monetary items are reported using the closing rate. Non-monetary items which are carried in terms of historical cost denominated in a foreign currency are reported using the exchange rate at the date of the transaction; and non-monetary items which are carried at fair value or other similar valuation denominated in a foreign currency are reported using the exchange rates that existed when the values were determined.
(iii) Exchange Differences
Exchange differences arising on a monetary item
Business Overview Management Reports Financial Statements
67
Notes to Financial Statementsfor the year ended March 31, 2013
that, in substance, form part of the company’s net investment in a non-integral foreign operation is accumulated in a foreign currency translation reserve in the financial statements until the disposal of the net investment, at which time they are recognised as income or as expenses.
Exchange differences arising on the settlement of monetary items not covered above, or on reporting such monetary items of company at rates different from those at which they were initially recorded during the year, or reported in previous financial statements, are recognized as income or as expenses in the year in which they arise.
(iv) Forward Exchange Contracts not Intended for Trading or Speculation Purposes
The premium or discount arising at the inception of forward exchange contracts is amortised as expense or income over the life of the contract. Exchange differences on such contracts are recognised in the Statement of Profit and Loss in the year in which the exchange rates change. Any profit or loss arising on cancellation or renewal of forward exchange contract is recognised as income or as expense for the year.
O. Income Taxes
Tax expense comprises of current and deferred. Current income tax is measured at the amount expected to be paid to the tax authorities in accordance with the Income Tax Act,1961. Deferred income tax reflects the impact of current year timing differences between taxable income and accounting income for the year and reversal of timing differences of earlier years.
Deferred tax is measured based on the tax rates and the tax laws enacted or substantively enacted at the balance sheet date. Deferred tax assets and deferred tax liabilities are offset, if a legally enforceable right exists to set off current tax assets against current tax liabilities and the deferred tax assets and deferred tax liabilities relate to the taxes on income levied by same governing taxation laws. Deferred tax assets are recognised only to the extent that there is reasonable certainty that sufficient future taxable income will be available against which such deferred tax assets can be realised. In situations where the company has unabsorbed depreciation or
carry forward tax losses, all deferred tax assets are recognised only if there is virtual certainty supported by convincing evidence that they can be realised against future taxable profits.
At each balance sheet date the Company re-assesses unrecognised deferred tax assets. It recognises unrecognised deferred tax assets to the extent that it has become reasonably certain or virtually certain, as the case may be, that sufficient future taxable income will be available against which such deferred tax assets can be realised.
The carrying amount of deferred tax assets are reviewed at each balance sheet date. The Company writes-down the carrying amount of a deferred tax asset to the extent that it is no longer reasonably certain or virtually certain, as the case may be, that sufficient future taxable income will be available against which deferred tax asset can be realised. Any such write-down is reversed to the extent that it becomes reasonably certain or virtually certain, as the case may be, that sufficient future taxable income will be available.
MAT credit is recognised as an asset only when and to the extent there is convincing evidence that the company will pay normal income tax during the specified period. In the year in which the Minimum Alternative tax (MAT) credit becomes eligible to be recognized as an asset in accordance with the recommendations contained in Guidance Note issued by the Institute of Chartered Accountants of India, the said asset is created by way of a credit to the Statement of Profit and Loss and shown as MAT Credit Entitlement. The Company reviews the same at each balance sheet date and writes down the carrying amount of MAT Credit Entitlement to the extent there is no longer convincing evidence to the effect that Company will pay normal Income Tax during the specified period.
P. Earnings Per Share
Basic earnings per share are calculated by dividing the net profit or loss for the period attributable to equity shareholders (after deducting preference dividends and attributable taxes) by the weighted average number of equity shares outstanding during the period. Partly paid equity shares are treated as a fraction of an equity share to the extent that they were entitled to participate
68
in dividends relative to a fully paid equity share during the reporting period. The weighted average number of equity shares outstanding during the period is adjusted for events of bonus issue, bonus element in a rights issue to existing shareholders, share split, and reverse share split (consolidation of shares).
For the purpose of calculating diluted earnings per share, the net profit or loss for the period attributable to equity shareholders and the weighted average number of shares outstanding during the period are adjusted for the effects of all dilutive potential equity shares.
Q. Provisions
A provision is recognised when an enterprise has a present obligation as a result of past event and it is probable that an outflow of resources will be required
Notes to Financial Statementsfor the year ended March 31, 2013
to settle the obligation, in respect of which a reliable estimate can be made. Provisions are not discounted to its present value and are determined based on best estimate required to settle the obligation at the balance sheet date. These are reviewed at each balance sheet date and adjusted to reflect the current best estimates.
Contingent liabilities are shown by way of note in the
Notes to Accounts in respect of obligations where based on the evidence available, their existence at the Balance Sheet date is considered not probable. Contingent assets are neither recognized in the accounts nor disclosed.
R. Cash and Cash Equivalents
Cash and cash equivalents comprise cash at bank and in hand and short term investments with an original maturity of three months or less.
2. Share Capital(` Crore)
As at March 31, 2013
As at March 31, 2012
Authorised : 11,47,26,820 (11,47,26,820) ordinary shares of `2 /- each 22.95 22.95 8,52,73,180 (8,52,73,180) Unclassified Shares of `2/- each 17.05 17.05 40.00 40.00 Issued, Subscribed and Fully Paid Up : 8,09,39,303 (8,09,39,303) ordinary shares of `2/- each 16.19 16.19 16.19 16.19
(a) Reconciliation of Ordinary Shares outstanding at the beginning and at the end of the reporting period
2012-13 2011-12
No. of Shares ` Cr. No. of Shares ` Cr.
At the beginning of the period 80,939,303 16.19 80,939,303 16.19 Issued during the period - - - -At the end of the period 80,939,303 16.19 80,939,303 16.19
(b) Terms/ rights attached to Ordinary shares
The Company has only one class of ordinary shares having a face value of `2 per share. Each ordinary shareholder is entitled to one vote per share.
The dividend proposed by the Board of Directors is subject to the approval of the shareholders in the ensuing Annual General Meeting. During the year ended March 31, 2013 the amount of dividend per share recognised as distribution to ordinary shareholders was `0.25 (` Nil).
In the event of winding-up of the company, the ordinary shareholders shall be entitled to be repaid remaining assets of the company, in the ratio of the amount of capital paid up on such ordinary shares.
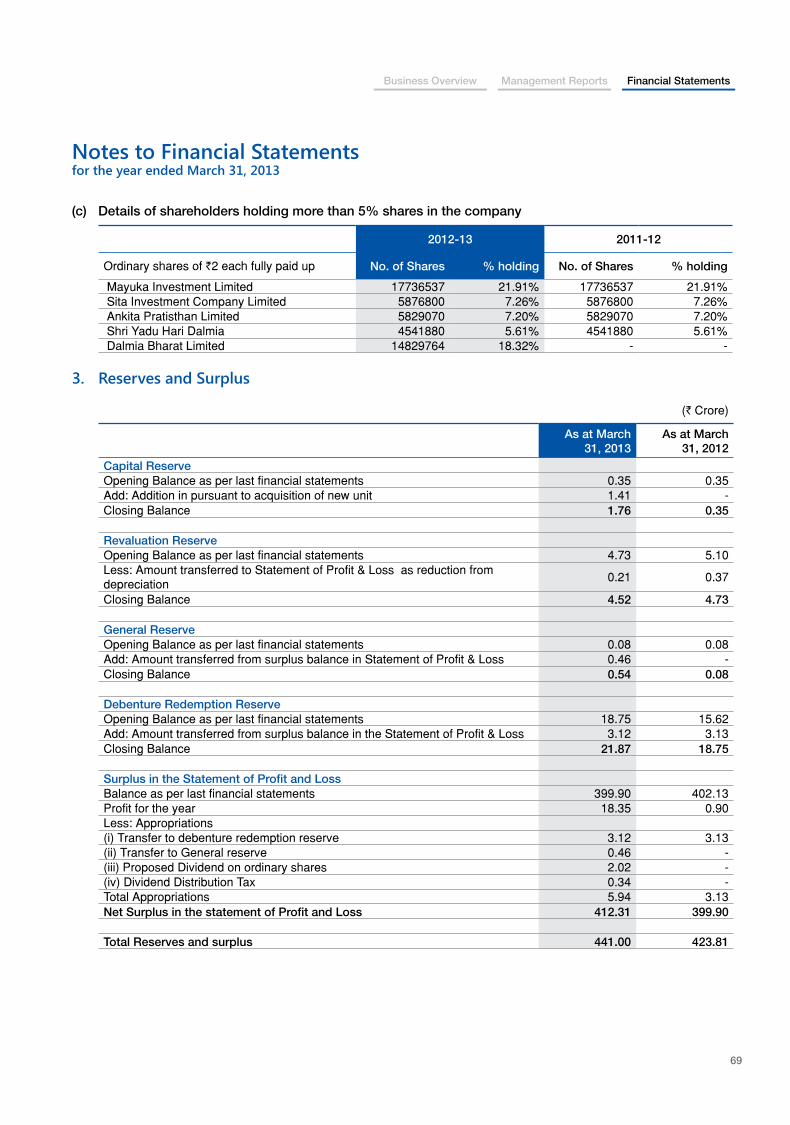
Business Overview Management Reports Financial Statements
69
Notes to Financial Statementsfor the year ended March 31, 2013
(c) Details of shareholders holding more than 5% shares in the company
2012-13 2011-12
Ordinary shares of `2 each fully paid up No. of Shares % holding No. of Shares % holding
Mayuka Investment Limited 17736537 21.91% 17736537 21.91% Sita Investment Company Limited 5876800 7.26% 5876800 7.26% Ankita Pratisthan Limited 5829070 7.20% 5829070 7.20% Shri Yadu Hari Dalmia 4541880 5.61% 4541880 5.61% Dalmia Bharat Limited 14829764 18.32% - -
3. Reserves and Surplus
(` Crore)
As at March 31, 2013
As at March 31, 2012
Capital ReserveOpening Balance as per last financial statements 0.35 0.35 Add: Addition in pursuant to acquisition of new unit 1.41 - Closing Balance 1.76 0.35
Revaluation ReserveOpening Balance as per last financial statements 4.73 5.10 Less: Amount transferred to Statement of Profit & Loss as reduction from depreciation
0.21 0.37
Closing Balance 4.52 4.73
General ReserveOpening Balance as per last financial statements 0.08 0.08 Add: Amount transferred from surplus balance in Statement of Profit & Loss 0.46 - Closing Balance 0.54 0.08
Debenture Redemption ReserveOpening Balance as per last financial statements 18.75 15.62 Add: Amount transferred from surplus balance in the Statement of Profit & Loss 3.12 3.13 Closing Balance 21.87 18.75
Surplus in the Statement of Profit and LossBalance as per last financial statements 399.90 402.13 Profit for the year 18.35 0.90 Less: Appropriations(i) Transfer to debenture redemption reserve 3.12 3.13 (ii) Transfer to General reserve 0.46 - (iii) Proposed Dividend on ordinary shares 2.02 - (iv) Dividend Distribution Tax 0.34 - Total Appropriations 5.94 3.13 Net Surplus in the statement of Profit and Loss 412.31 399.90
Total Reserves and surplus 441.00 423.81
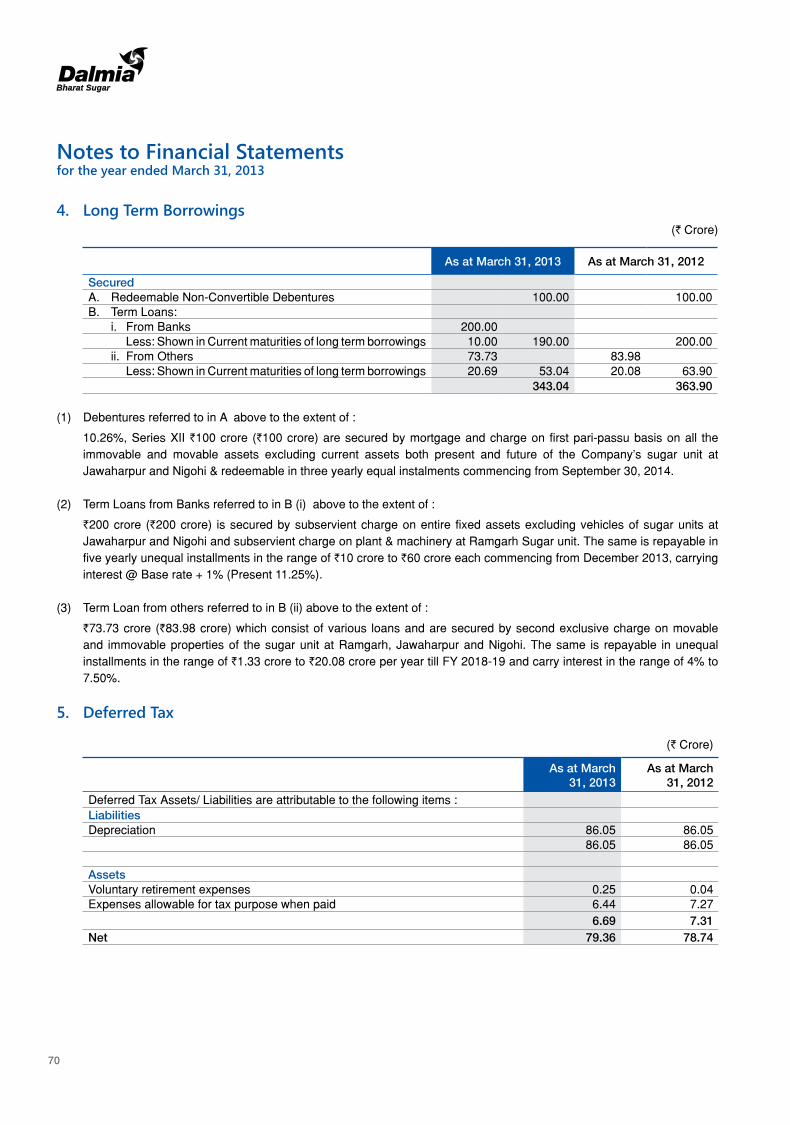
70
Notes to Financial Statementsfor the year ended March 31, 2013
4. Long Term Borrowings(` Crore)
As at March 31, 2013 As at March 31, 2012
Secured A. Redeemable Non-Convertible Debentures 100.00 100.00B. Term Loans: i. From Banks 200.00 Less: Shown in Current maturities of long term borrowings 10.00 190.00 200.00 ii. From Others 73.73 83.98 Less: Shown in Current maturities of long term borrowings 20.69 53.04 20.08 63.90
343.04 363.90
(1) Debentures referred to in A above to the extent of :
10.26%, Series XII `100 crore (`100 crore) are secured by mortgage and charge on first pari-passu basis on all the immovable and movable assets excluding current assets both present and future of the Company’s sugar unit at Jawaharpur and Nigohi & redeemable in three yearly equal instalments commencing from September 30, 2014.
(2) Term Loans from Banks referred to in B (i) above to the extent of :
`200 crore (`200 crore) is secured by subservient charge on entire fixed assets excluding vehicles of sugar units at Jawaharpur and Nigohi and subservient charge on plant & machinery at Ramgarh Sugar unit. The same is repayable in five yearly unequal installments in the range of `10 crore to `60 crore each commencing from December 2013, carrying interest @ Base rate + 1% (Present 11.25%).
(3) Term Loan from others referred to in B (ii) above to the extent of :
`73.73 crore (`83.98 crore) which consist of various loans and are secured by second exclusive charge on movable and immovable properties of the sugar unit at Ramgarh, Jawaharpur and Nigohi. The same is repayable in unequal installments in the range of `1.33 crore to `20.08 crore per year till FY 2018-19 and carry interest in the range of 4% to 7.50%.
5. Deferred Tax
(` Crore)
As at March 31, 2013
As at March 31, 2012
Deferred Tax Assets/ Liabilities are attributable to the following items :LiabilitiesDepreciation 86.05 86.05
86.05 86.05
AssetsVoluntary retirement expenses 0.25 0.04 Expenses allowable for tax purpose when paid 6.44 7.27
6.69 7.31 Net 79.36 78.74
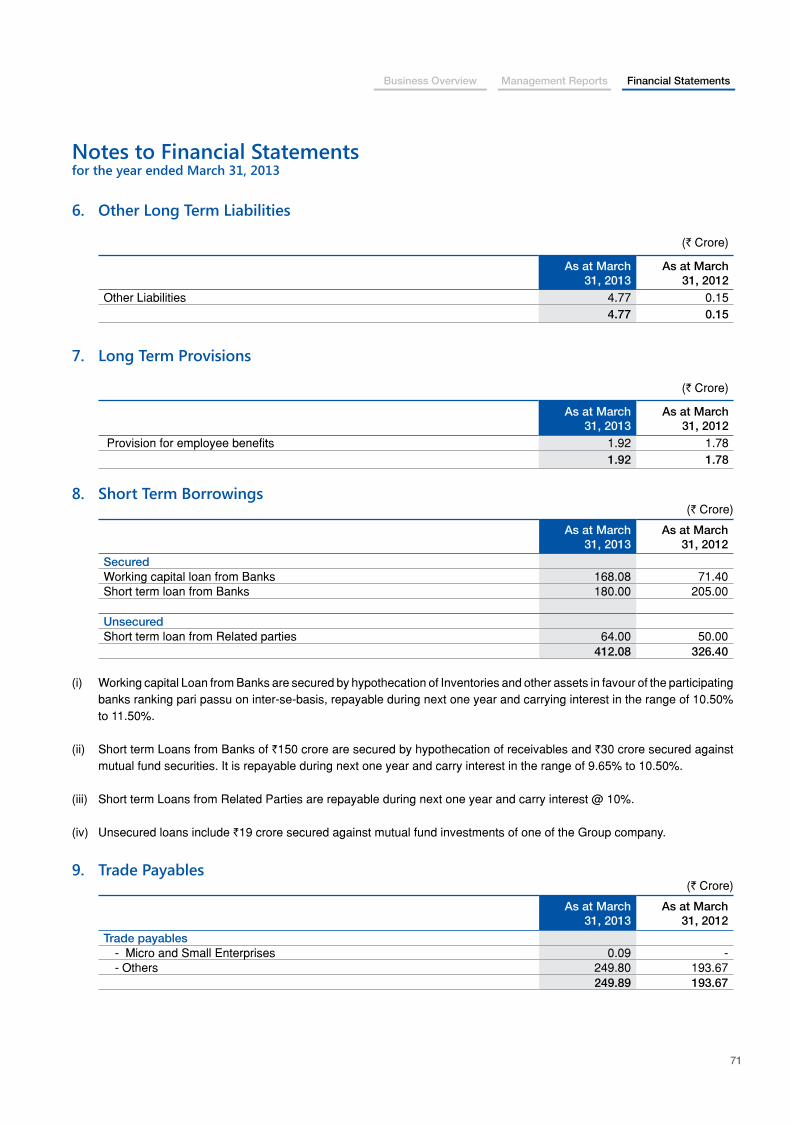
Business Overview Management Reports Financial Statements
71
Notes to Financial Statementsfor the year ended March 31, 2013
6. Other Long Term Liabilities
(` Crore)
As at March 31, 2013
As at March 31, 2012
Other Liabilities 4.77 0.15 4.77 0.15
7. Long Term Provisions
(` Crore)
As at March 31, 2013
As at March 31, 2012
Provision for employee benefits 1.92 1.78 1.92 1.78
8. Short Term Borrowings(` Crore)
As at March 31, 2013
As at March 31, 2012
SecuredWorking capital loan from Banks 168.08 71.40 Short term loan from Banks 180.00 205.00 UnsecuredShort term loan from Related parties 64.00 50.00 412.08 326.40
(i) Working capital Loan from Banks are secured by hypothecation of Inventories and other assets in favour of the participating banks ranking pari passu on inter-se-basis, repayable during next one year and carrying interest in the range of 10.50% to 11.50%.
(ii) Short term Loans from Banks of `150 crore are secured by hypothecation of receivables and `30 crore secured against mutual fund securities. It is repayable during next one year and carry interest in the range of 9.65% to 10.50%.
(iii) Short term Loans from Related Parties are repayable during next one year and carry interest @ 10%.
(iv) Unsecured loans include `19 crore secured against mutual fund investments of one of the Group company.
9. Trade Payables (` Crore)
As at March 31, 2013
As at March 31, 2012
Trade payables - Micro and Small Enterprises 0.09 - - Others 249.80 193.67 249.89 193.67

72
Notes to Financial Statementsfor the year ended March 31, 2013
10. Other Current Liabilities (` Crore)
As at March 31, 2013
As at March 31, 2012
Current maturities of long term borrowings 30.69 20.08 Interest accrued but not due on borrowings 5.04 5.00 Interest accrued and due on borrowings 1.89 - Advances from customers 3.58 3.22 Security deposit received 0.90 0.99 Unclaimed Dividend * 1.98 2.14 Other liabilities Excise Duty Payable on Closing Stock 24.31 20.38 Statutory Dues 9.97 7.17 Others 36.97 9.02
115.33 68.00
* Amount payable to Investor Education and Protection Fund is ` Nil (` Nil).
11. Short Term Provisions (` Crore)
As at March 31, 2013
As at March 31, 2012
Provision for Employee benefits 2.60 2.13 Proposed dividend 2.02 - Dividend distribution tax 0.34 - Other 0.02 -
4.98 2.13
12. Fixed Assets(` Crore)
Particulars
Tangible Assets Intangible Assets
Total
Land (Freehold)
Land (Leasehold)
BuildingsPlant and
Equipment
Furniture and
FixturesVehicles
Office Equipment
Computer Software
Costas at March 31,2011 20.98 0.58 115.43 787.32 3.91 1.54 2.76 0.03 932.55 Additions 0.09 - 0.50 19.32 0.09 0.15 0.36 0.10 20.61Disposals - - 0.03 0.62 - 0.03 0.10 - 0.78as at March 31,2012 21.07 0.58 115.90 806.02 4.00 1.66 3.02 0.13 952.38 Additions 34.58 - 14.51 83.62 1.23 0.58 1.02 0.09 135.63 Disposals - - - 11.43 0.02 0.07 0.61 - 12.13 as at March 31,2013 55.65 0.58 130.41 878.21 5.21 2.17 3.43 0.22 1,075.88 Depreciation / Amortisationas at March 31,2011 - 0.10 24.11 306.57 2.28 0.89 2.63 0.02 336.60 Charge for the year @ - 0.01 2.75 38.87 0.17 0.05 0.42 0.02 42.29 Disposals - - - 0.44 - 0.03 0.04 - 0.51 as at March 31,2012 - 0.11 26.86 345.00 2.45 0.91 3.01 0.04 378.38 Charge for the year @ - 0.01 3.02 69.06 0.46 0.10 0.37 0.04 73.06
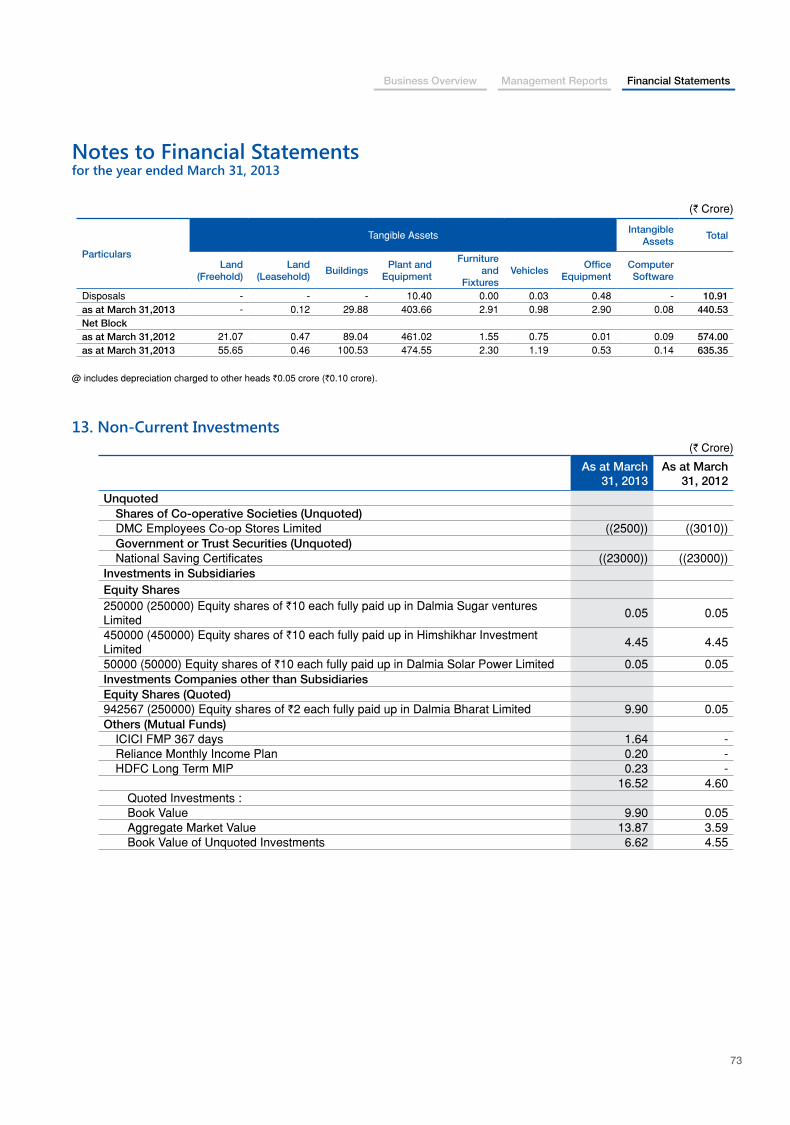
Business Overview Management Reports Financial Statements
73
Notes to Financial Statementsfor the year ended March 31, 2013
(` Crore)
Particulars
Tangible Assets Intangible Assets
Total
Land (Freehold)
Land (Leasehold)
BuildingsPlant and
Equipment
Furniture and
FixturesVehicles
Office Equipment
Computer Software
Disposals - - - 10.40 0.00 0.03 0.48 - 10.91 as at March 31,2013 - 0.12 29.88 403.66 2.91 0.98 2.90 0.08 440.53 Net Blockas at March 31,2012 21.07 0.47 89.04 461.02 1.55 0.75 0.01 0.09 574.00 as at March 31,2013 55.65 0.46 100.53 474.55 2.30 1.19 0.53 0.14 635.35
@ includes depreciation charged to other heads `0.05 crore (`0.10 crore).
13. Non-Current Investments(` Crore)
As at March 31, 2013
As at March 31, 2012
Unquoted Shares of Co-operative Societies (Unquoted) DMC Employees Co-op Stores Limited ((2500)) ((3010)) Government or Trust Securities (Unquoted) National Saving Certificates ((23000)) ((23000))Investments in Subsidiaries Equity Shares 250000 (250000) Equity shares of `10 each fully paid up in Dalmia Sugar ventures Limited
0.05 0.05
450000 (450000) Equity shares of `10 each fully paid up in Himshikhar Investment Limited
4.45 4.45
50000 (50000) Equity shares of `10 each fully paid up in Dalmia Solar Power Limited 0.05 0.05 Investments Companies other than Subsidiaries Equity Shares (Quoted) 942567 (250000) Equity shares of `2 each fully paid up in Dalmia Bharat Limited 9.90 0.05 Others (Mutual Funds) ICICI FMP 367 days 1.64 - Reliance Monthly Income Plan 0.20 - HDFC Long Term MIP 0.23 -
16.52 4.60 Quoted Investments : Book Value 9.90 0.05 Aggregate Market Value 13.87 3.59 Book Value of Unquoted Investments 6.62 4.55
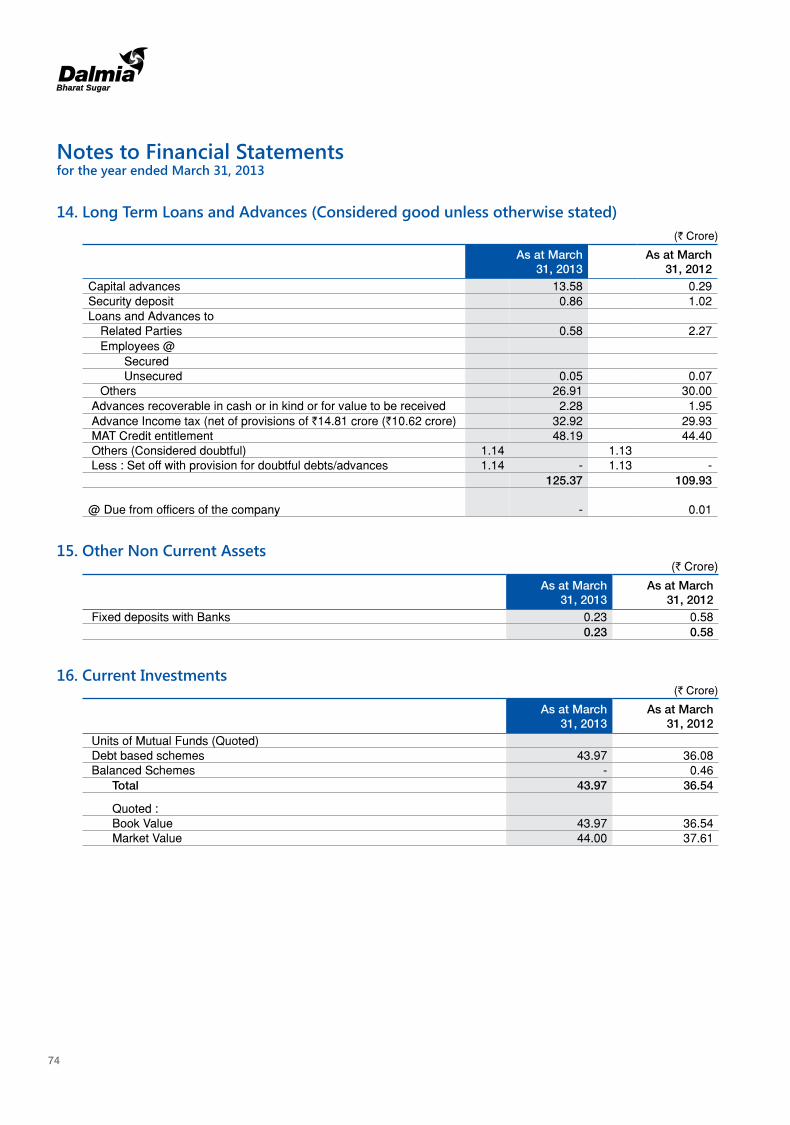
74
14. Long Term Loans and Advances (Considered good unless otherwise stated)
(` Crore)
As at March 31, 2013
As at March 31, 2012
Capital advances 13.58 0.29 Security deposit 0.86 1.02 Loans and Advances to Related Parties 0.58 2.27 Employees @ Secured Unsecured 0.05 0.07 Others 26.91 30.00 Advances recoverable in cash or in kind or for value to be received 2.28 1.95 Advance Income tax (net of provisions of `14.81 crore (`10.62 crore) 32.92 29.93 MAT Credit entitlement 48.19 44.40 Others (Considered doubtful) 1.14 1.13 Less : Set off with provision for doubtful debts/advances 1.14 - 1.13 -
125.37 109.93
@ Due from officers of the company - 0.01
15. Other Non Current Assets (` Crore)
As at March 31, 2013
As at March 31, 2012
Fixed deposits with Banks 0.23 0.58 0.23 0.58
16. Current Investments(` Crore)
As at March 31, 2013
As at March 31, 2012
Units of Mutual Funds (Quoted) Debt based schemes 43.97 36.08 Balanced Schemes - 0.46 Total 43.97 36.54
Quoted : Book Value 43.97 36.54 Market Value 44.00 37.61
Notes to Financial Statementsfor the year ended March 31, 2013
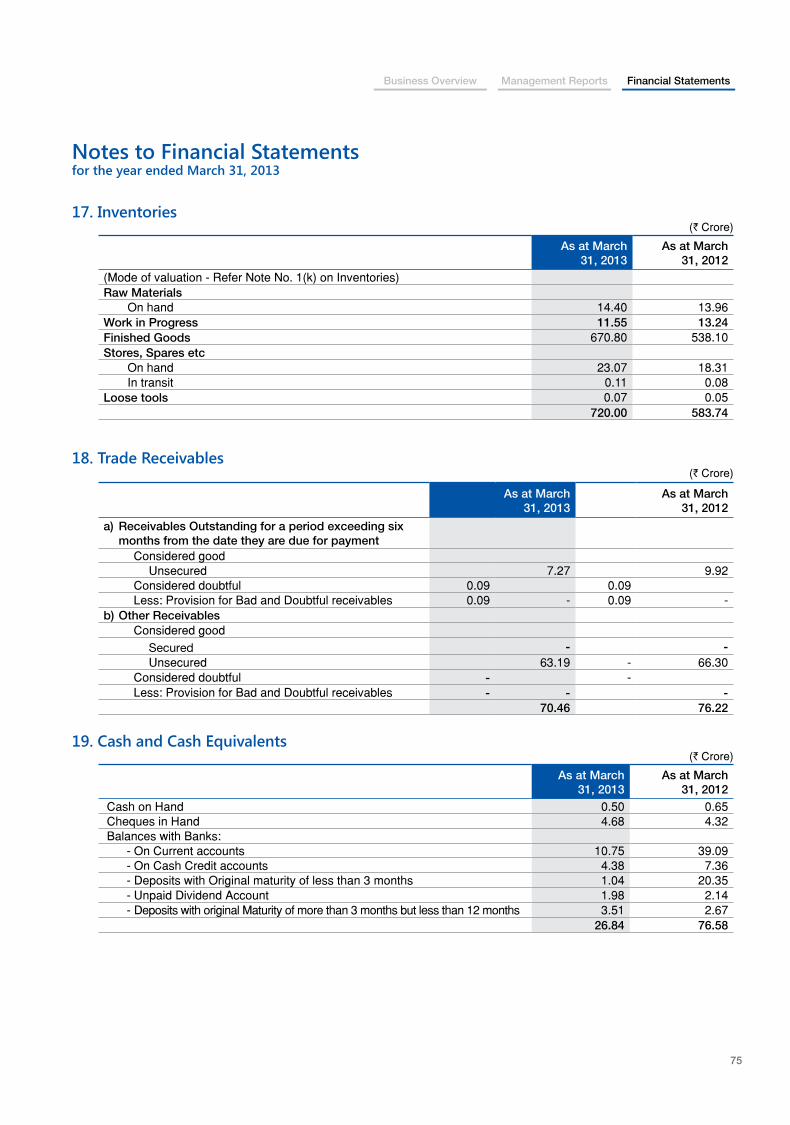
Business Overview Management Reports Financial Statements
75
Notes to Financial Statementsfor the year ended March 31, 2013
17. Inventories (` Crore)
As at March 31, 2013
As at March 31, 2012
(Mode of valuation - Refer Note No. 1(k) on Inventories) Raw Materials On hand 14.40 13.96 Work in Progress 11.55 13.24 Finished Goods 670.80 538.10 Stores, Spares etc On hand 23.07 18.31 In transit 0.11 0.08 Loose tools 0.07 0.05
720.00 583.74
18. Trade Receivables(` Crore)
As at March 31, 2013
As at March 31, 2012
a) Receivables Outstanding for a period exceeding six months from the date they are due for payment
Considered good Unsecured 7.27 9.92 Considered doubtful 0.09 0.09 Less: Provision for Bad and Doubtful receivables 0.09 - 0.09 - b) Other Receivables Considered good Secured - - Unsecured 63.19 - 66.30 Considered doubtful - - Less: Provision for Bad and Doubtful receivables - - -
70.46 76.22
19. Cash and Cash Equivalents(` Crore)
As at March 31, 2013
As at March 31, 2012
Cash on Hand 0.50 0.65 Cheques in Hand 4.68 4.32 Balances with Banks: - On Current accounts 10.75 39.09 - On Cash Credit accounts 4.38 7.36 - Deposits with Original maturity of less than 3 months 1.04 20.35 - Unpaid Dividend Account 1.98 2.14 - Deposits with original Maturity of more than 3 months but less than 12 months 3.51 2.67
26.84 76.58
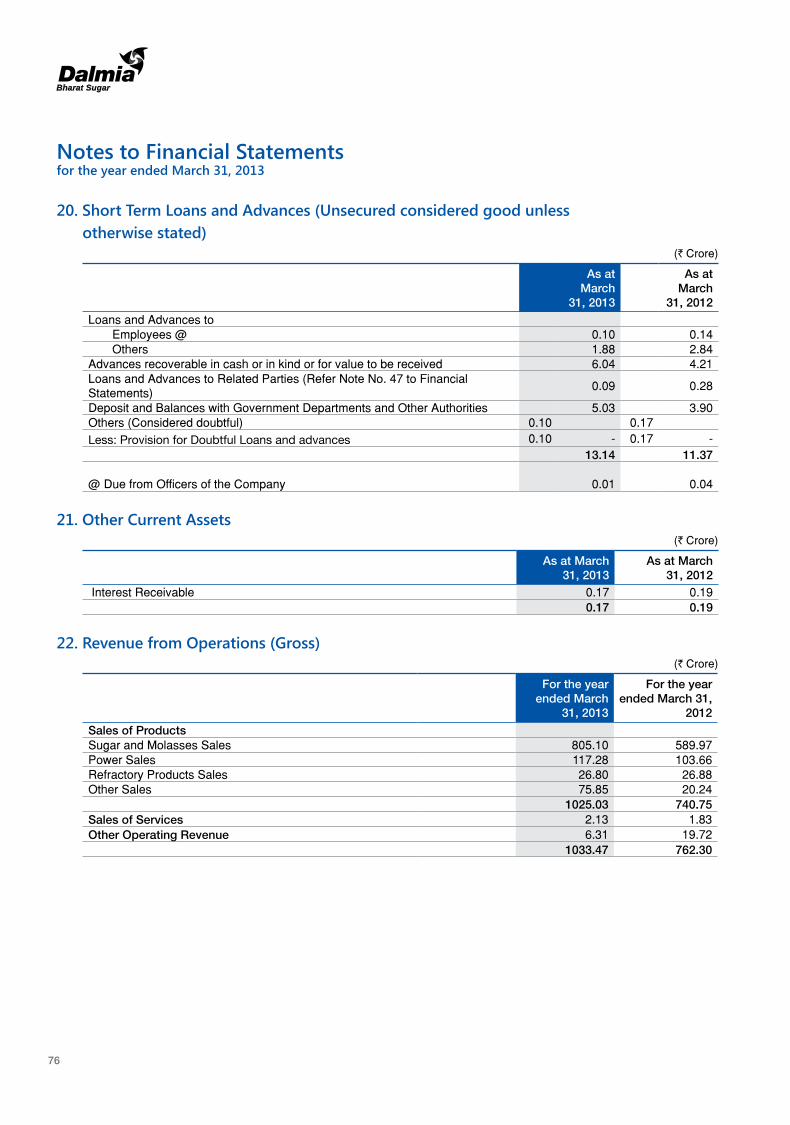
76
Notes to Financial Statementsfor the year ended March 31, 2013
20. Short Term Loans and Advances (Unsecured considered good unless otherwise stated)
(` Crore)
As at March
31, 2013
As at March
31, 2012Loans and Advances to Employees @ 0.10 0.14 Others 1.88 2.84 Advances recoverable in cash or in kind or for value to be received 6.04 4.21 Loans and Advances to Related Parties (Refer Note No. 47 to Financial Statements)
0.09 0.28
Deposit and Balances with Government Departments and Other Authorities 5.03 3.90 Others (Considered doubtful) 0.10 0.17 Less: Provision for Doubtful Loans and advances 0.10 - 0.17 -
13.14 11.37
@ Due from Officers of the Company
0.01 0.04
21. Other Current Assets(` Crore)
As at March 31, 2013
As at March 31, 2012
Interest Receivable 0.17 0.19 0.17 0.19
22. Revenue from Operations (Gross)(` Crore)
For the year ended March
31, 2013
For the year ended March 31,
2012Sales of ProductsSugar and Molasses Sales 805.10 589.97 Power Sales 117.28 103.66 Refractory Products Sales 26.80 26.88 Other Sales 75.85 20.24
1025.03 740.75 Sales of Services 2.13 1.83 Other Operating Revenue 6.31 19.72
1033.47 762.30
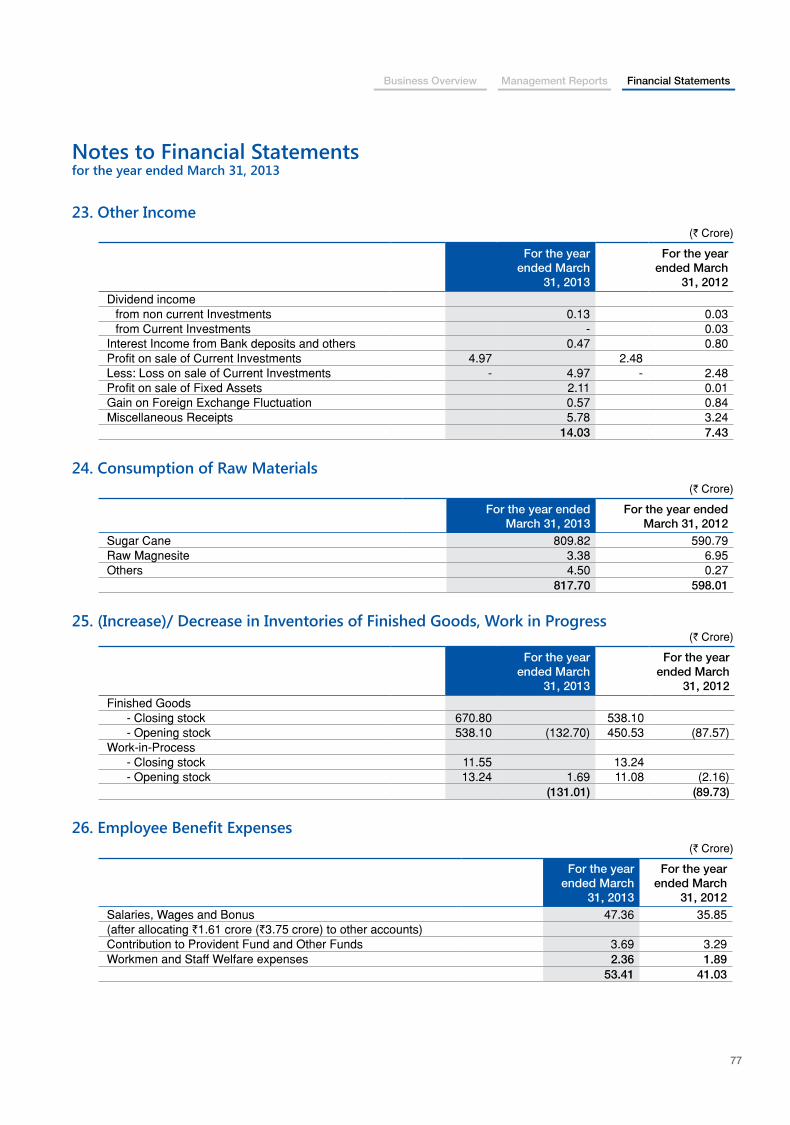
Business Overview Management Reports Financial Statements
77
Notes to Financial Statementsfor the year ended March 31, 2013
23. Other Income(` Crore)
For the year ended March
31, 2013
For the year ended March
31, 2012 Dividend income from non current Investments 0.13 0.03 from Current Investments - 0.03 Interest Income from Bank deposits and others 0.47 0.80 Profit on sale of Current Investments 4.97 2.48 Less: Loss on sale of Current Investments - 4.97 - 2.48 Profit on sale of Fixed Assets 2.11 0.01 Gain on Foreign Exchange Fluctuation 0.57 0.84 Miscellaneous Receipts 5.78 3.24
14.03 7.43
24. Consumption of Raw Materials(` Crore)
For the year ended March 31, 2013
For the year ended March 31, 2012
Sugar Cane 809.82 590.79 Raw Magnesite 3.38 6.95 Others 4.50 0.27
817.70 598.01
25. (Increase)/ Decrease in Inventories of Finished Goods, Work in Progress(` Crore)
For the year ended March
31, 2013
For the year ended March
31, 2012 Finished Goods - Closing stock 670.80 538.10 - Opening stock 538.10 (132.70) 450.53 (87.57) Work-in-Process - Closing stock 11.55 13.24 - Opening stock 13.24 1.69 11.08 (2.16)
(131.01) (89.73)
26. Employee Benefit Expenses(` Crore)
For the year ended March
31, 2013
For the year ended March
31, 2012 Salaries, Wages and Bonus 47.36 35.85 (after allocating `1.61 crore (`3.75 crore) to other accounts) Contribution to Provident Fund and Other Funds 3.69 3.29 Workmen and Staff Welfare expenses 2.36 1.89
53.41 41.03
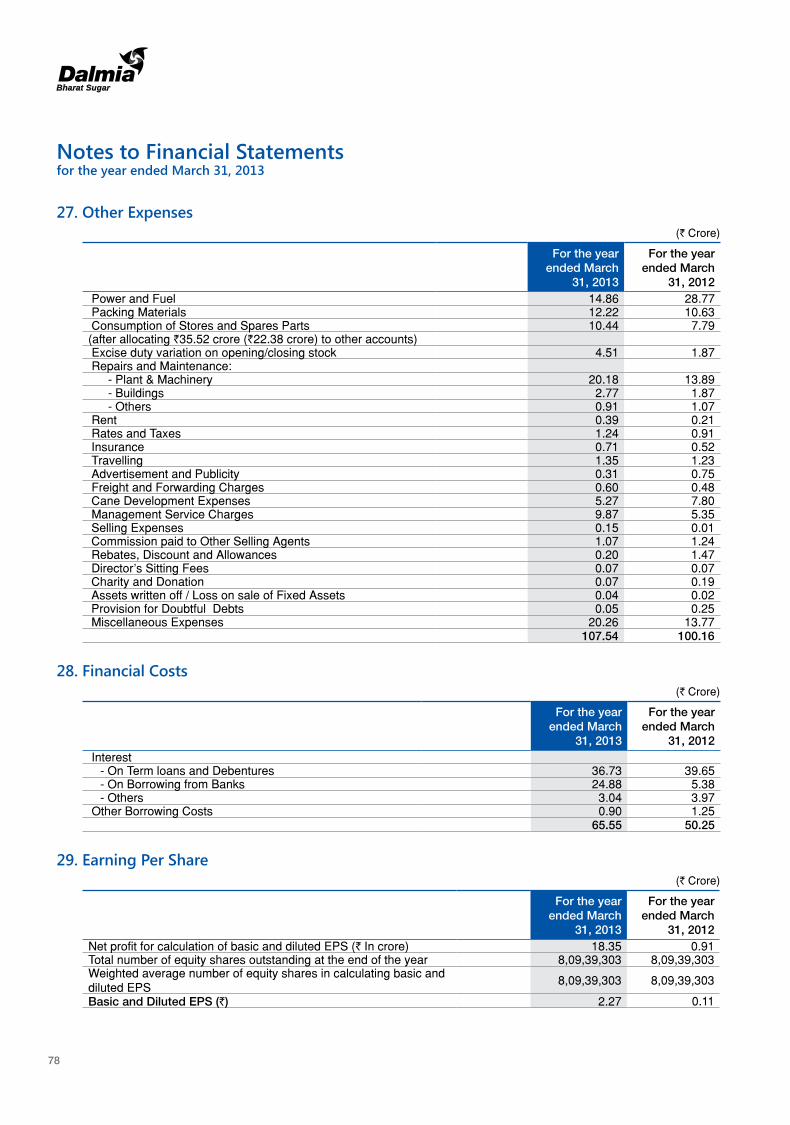
78
Notes to Financial Statementsfor the year ended March 31, 2013
27. Other Expenses(` Crore)
For the year ended March
31, 2013
For the year ended March
31, 2012 Power and Fuel 14.86 28.77 Packing Materials 12.22 10.63 Consumption of Stores and Spares Parts 10.44 7.79 (after allocating `35.52 crore (`22.38 crore) to other accounts) Excise duty variation on opening/closing stock 4.51 1.87 Repairs and Maintenance: - Plant & Machinery 20.18 13.89 - Buildings 2.77 1.87 - Others 0.91 1.07 Rent 0.39 0.21 Rates and Taxes 1.24 0.91 Insurance 0.71 0.52 Travelling 1.35 1.23 Advertisement and Publicity 0.31 0.75 Freight and Forwarding Charges 0.60 0.48 Cane Development Expenses 5.27 7.80 Management Service Charges 9.87 5.35 Selling Expenses 0.15 0.01 Commission paid to Other Selling Agents 1.07 1.24 Rebates, Discount and Allowances 0.20 1.47 Director's Sitting Fees 0.07 0.07 Charity and Donation 0.07 0.19 Assets written off / Loss on sale of Fixed Assets 0.04 0.02 Provision for Doubtful Debts 0.05 0.25 Miscellaneous Expenses 20.26 13.77
107.54 100.16
28. Financial Costs(` Crore)
For the year ended March
31, 2013
For the year ended March
31, 2012 Interest - On Term loans and Debentures 36.73 39.65 - On Borrowing from Banks 24.88 5.38 - Others 3.04 3.97 Other Borrowing Costs 0.90 1.25
65.55 50.25
29. Earning Per Share(` Crore)
For the year ended March
31, 2013
For the year ended March
31, 2012Net profit for calculation of basic and diluted EPS (` In crore) 18.35 0.91 Total number of equity shares outstanding at the end of the year 8,09,39,303 8,09,39,303 Weighted average number of equity shares in calculating basic and diluted EPS
8,09,39,303 8,09,39,303
Basic and Diluted EPS (`) 2.27 0.11
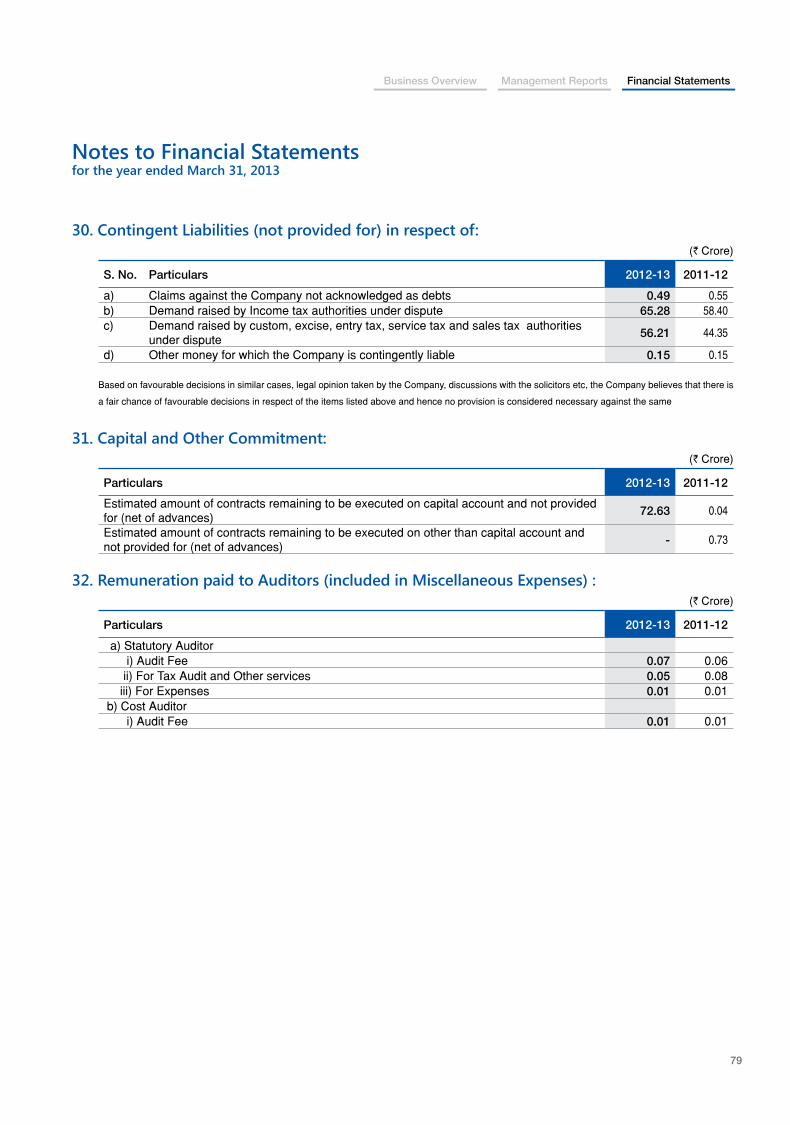
Business Overview Management Reports Financial Statements
79
Notes to Financial Statementsfor the year ended March 31, 2013
30. Contingent Liabilities (not provided for) in respect of: (` Crore)
S. No. Particulars 2012-13 2011-12
a) Claims against the Company not acknowledged as debts 0.49 0.55b) Demand raised by Income tax authorities under dispute 65.28 58.40c) Demand raised by custom, excise, entry tax, service tax and sales tax authorities
under dispute 56.21 44.35
d) Other money for which the Company is contingently liable 0.15 0.15
Based on favourable decisions in similar cases, legal opinion taken by the Company, discussions with the solicitors etc, the Company believes that there is
a fair chance of favourable decisions in respect of the items listed above and hence no provision is considered necessary against the same
31. Capital and Other Commitment:(` Crore)
Particulars 2012-13 2011-12
Estimated amount of contracts remaining to be executed on capital account and not provided for (net of advances) 72.63 0.04
Estimated amount of contracts remaining to be executed on other than capital account and not provided for (net of advances) - 0.73
32. Remuneration paid to Auditors (included in Miscellaneous Expenses) :(` Crore)
Particulars 2012-13 2011-12
a) Statutory Auditor i) Audit Fee 0.07 0.06 ii) For Tax Audit and Other services 0.05 0.08 iii) For Expenses 0.01 0.01 b) Cost Auditor i) Audit Fee 0.01 0.01
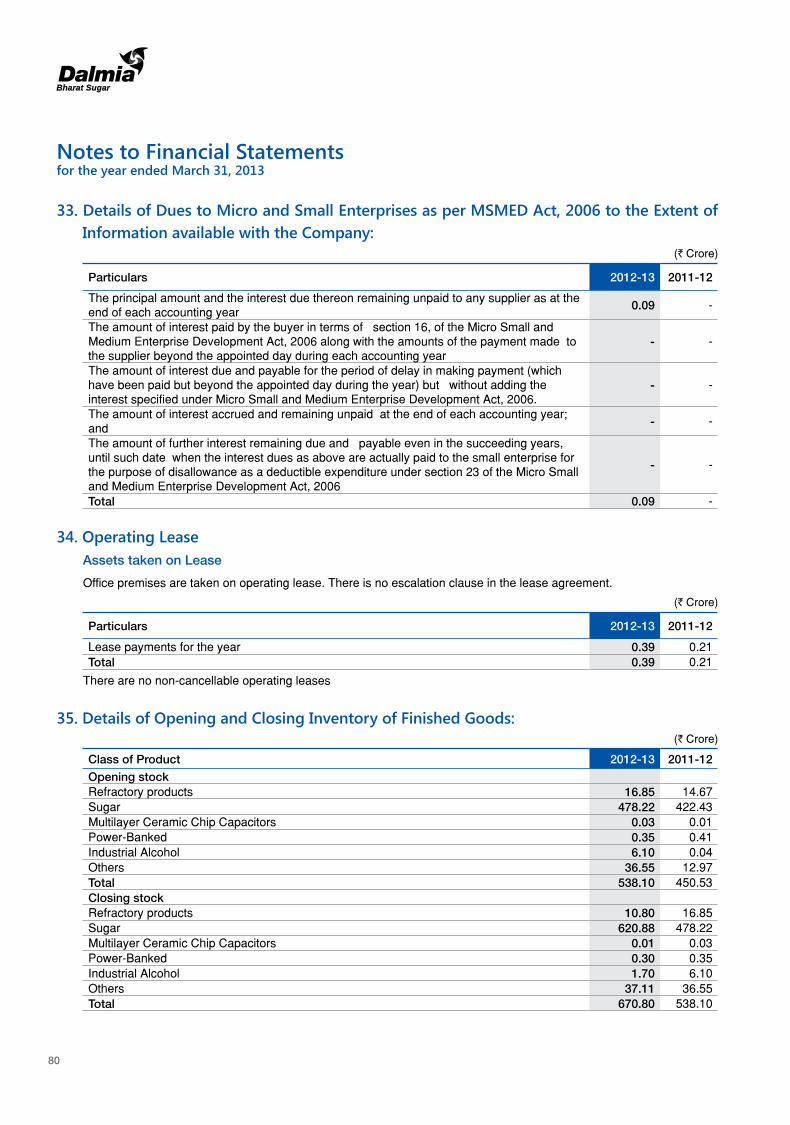
80
33. Details of Dues to Micro and Small Enterprises as per MSMED Act, 2006 to the Extent of Information available with the Company:
(` Crore)
Particulars 2012-13 2011-12
The principal amount and the interest due thereon remaining unpaid to any supplier as at the end of each accounting year 0.09 -
The amount of interest paid by the buyer in terms of section 16, of the Micro Small and Medium Enterprise Development Act, 2006 along with the amounts of the payment made to the supplier beyond the appointed day during each accounting year
- -
The amount of interest due and payable for the period of delay in making payment (which have been paid but beyond the appointed day during the year) but without adding the interest specified under Micro Small and Medium Enterprise Development Act, 2006.
- -
The amount of interest accrued and remaining unpaid at the end of each accounting year; and - -
The amount of further interest remaining due and payable even in the succeeding years, until such date when the interest dues as above are actually paid to the small enterprise for the purpose of disallowance as a deductible expenditure under section 23 of the Micro Small and Medium Enterprise Development Act, 2006
- -
Total 0.09 -
34. Operating Lease Assets taken on Lease
Office premises are taken on operating lease. There is no escalation clause in the lease agreement.
(` Crore)
Particulars 2012-13 2011-12
Lease payments for the year 0.39 0.21Total 0.39 0.21
There are no non-cancellable operating leases
35. Details of Opening and Closing Inventory of Finished Goods:(` Crore)
Class of Product 2012-13 2011-12Opening stockRefractory products 16.85 14.67Sugar 478.22 422.43Multilayer Ceramic Chip Capacitors 0.03 0.01Power-Banked 0.35 0.41Industrial Alcohol 6.10 0.04Others 36.55 12.97Total 538.10 450.53Closing stockRefractory products 10.80 16.85Sugar 620.88 478.22Multilayer Ceramic Chip Capacitors 0.01 0.03Power-Banked 0.30 0.35Industrial Alcohol 1.70 6.10Others 37.11 36.55Total 670.80 538.10
Notes to Financial Statementsfor the year ended March 31, 2013
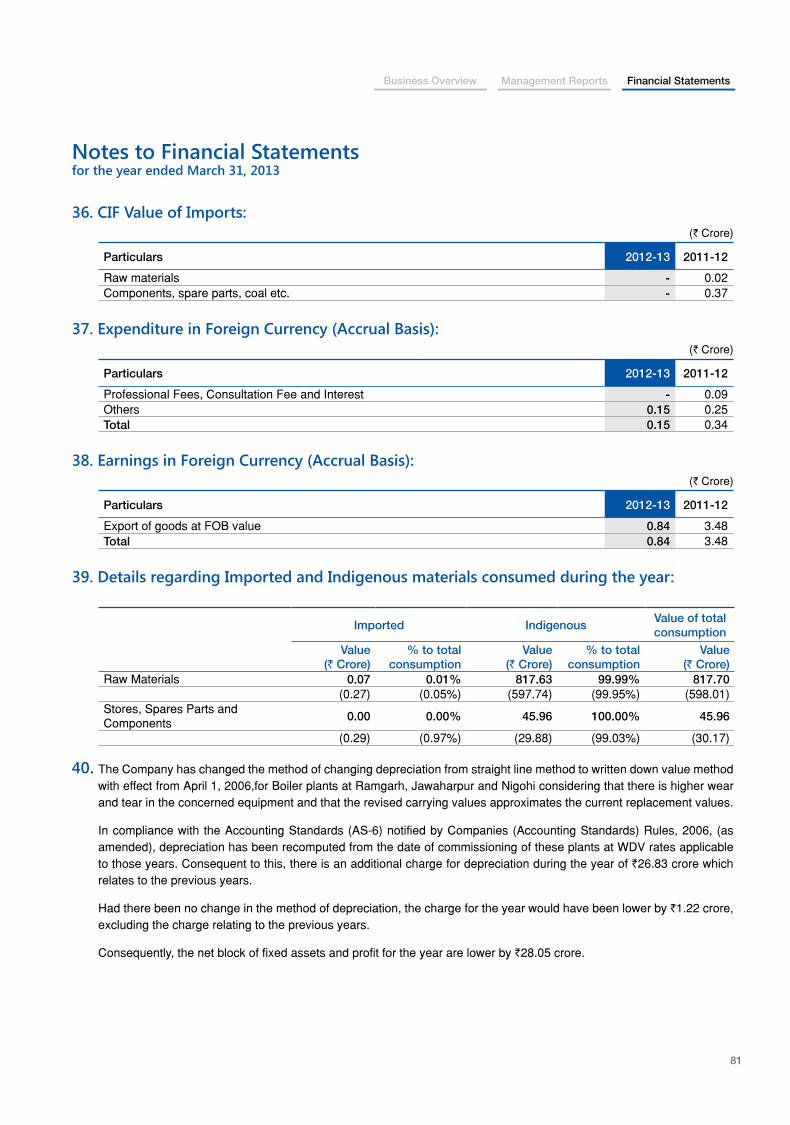
Business Overview Management Reports Financial Statements
81
Notes to Financial Statementsfor the year ended March 31, 2013
36. CIF Value of Imports:(` Crore)
Particulars 2012-13 2011-12
Raw materials - 0.02Components, spare parts, coal etc. - 0.37
37. Expenditure in Foreign Currency (Accrual Basis):(` Crore)
Particulars 2012-13 2011-12
Professional Fees, Consultation Fee and Interest - 0.09Others 0.15 0.25Total 0.15 0.34
38. Earnings in Foreign Currency (Accrual Basis):(` Crore)
Particulars 2012-13 2011-12
Export of goods at FOB value 0.84 3.48Total 0.84 3.48
39. Details regarding Imported and Indigenous materials consumed during the year:
Imported IndigenousValue of total consumption
Value (` Crore)
% to total consumption
Value (` Crore)
% to total consumption
Value (` Crore)
Raw Materials 0.07 0.01% 817.63 99.99% 817.70(0.27) (0.05%) (597.74) (99.95%) (598.01)
Stores, Spares Parts and Components 0.00 0.00% 45.96 100.00% 45.96
(0.29) (0.97%) (29.88) (99.03%) (30.17)
40. The Company has changed the method of changing depreciation from straight line method to written down value method with effect from April 1, 2006,for Boiler plants at Ramgarh, Jawaharpur and Nigohi considering that there is higher wear and tear in the concerned equipment and that the revised carrying values approximates the current replacement values.
In compliance with the Accounting Standards (AS-6) notified by Companies (Accounting Standards) Rules, 2006, (as amended), depreciation has been recomputed from the date of commissioning of these plants at WDV rates applicable to those years. Consequent to this, there is an additional charge for depreciation during the year of `26.83 crore which relates to the previous years.
Had there been no change in the method of depreciation, the charge for the year would have been lower by `1.22 crore, excluding the charge relating to the previous years.
Consequently, the net block of fixed assets and profit for the year are lower by `28.05 crore.
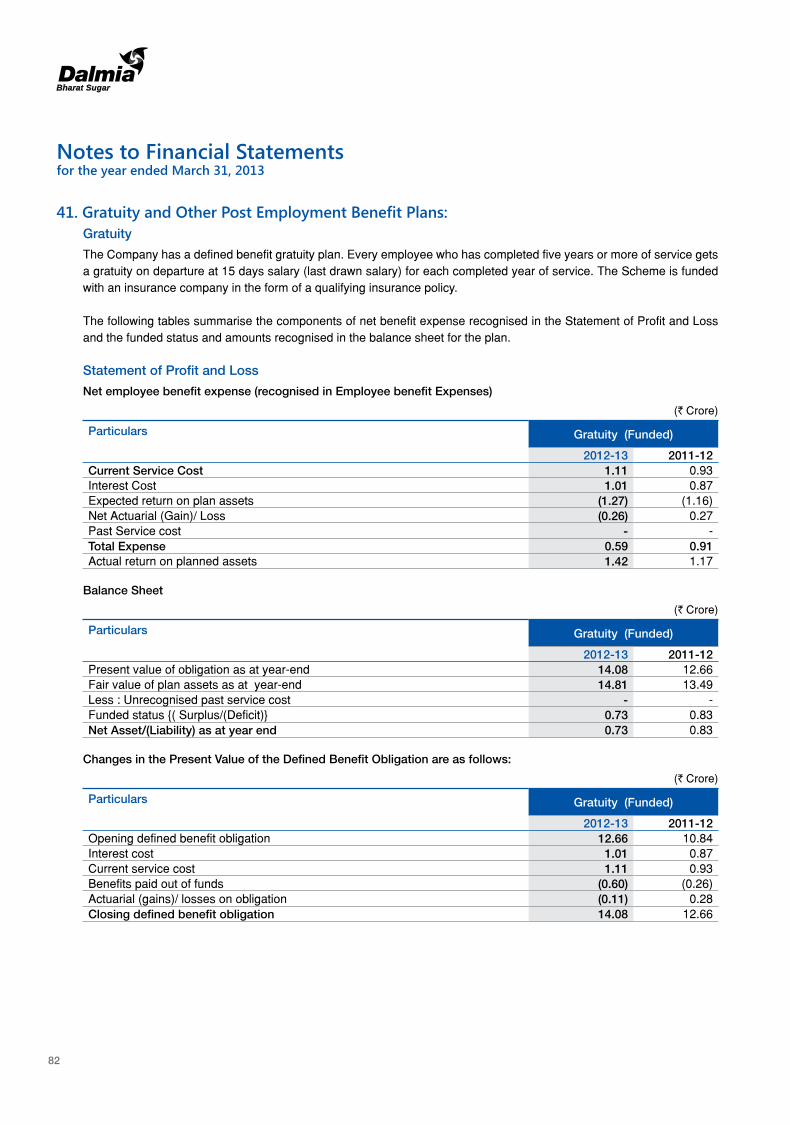
82
41. Gratuity and Other Post Employment Benefit Plans: Gratuity
The Company has a defined benefit gratuity plan. Every employee who has completed five years or more of service gets a gratuity on departure at 15 days salary (last drawn salary) for each completed year of service. The Scheme is funded with an insurance company in the form of a qualifying insurance policy.
The following tables summarise the components of net benefit expense recognised in the Statement of Profit and Loss and the funded status and amounts recognised in the balance sheet for the plan.
Statement of Profit and Loss
Net employee benefit expense (recognised in Employee benefit Expenses)
(` Crore)
Particulars Gratuity (Funded)
2012-13 2011-12Current Service Cost 1.11 0.93Interest Cost 1.01 0.87Expected return on plan assets (1.27) (1.16)Net Actuarial (Gain)/ Loss (0.26) 0.27Past Service cost - -Total Expense 0.59 0.91Actual return on planned assets 1.42 1.17
Balance Sheet
(` Crore)
Particulars Gratuity (Funded)
2012-13 2011-12Present value of obligation as at year-end 14.08 12.66Fair value of plan assets as at year-end 14.81 13.49Less : Unrecognised past service cost - -Funded status {( Surplus/(Deficit)} 0.73 0.83Net Asset/(Liability) as at year end 0.73 0.83
Changes in the Present Value of the Defined Benefit Obligation are as follows:
(` Crore)
Particulars Gratuity (Funded)
2012-13 2011-12Opening defined benefit obligation 12.66 10.84Interest cost 1.01 0.87Current service cost 1.11 0.93Benefits paid out of funds (0.60) (0.26)Actuarial (gains)/ losses on obligation (0.11) 0.28Closing defined benefit obligation 14.08 12.66
Notes to Financial Statementsfor the year ended March 31, 2013
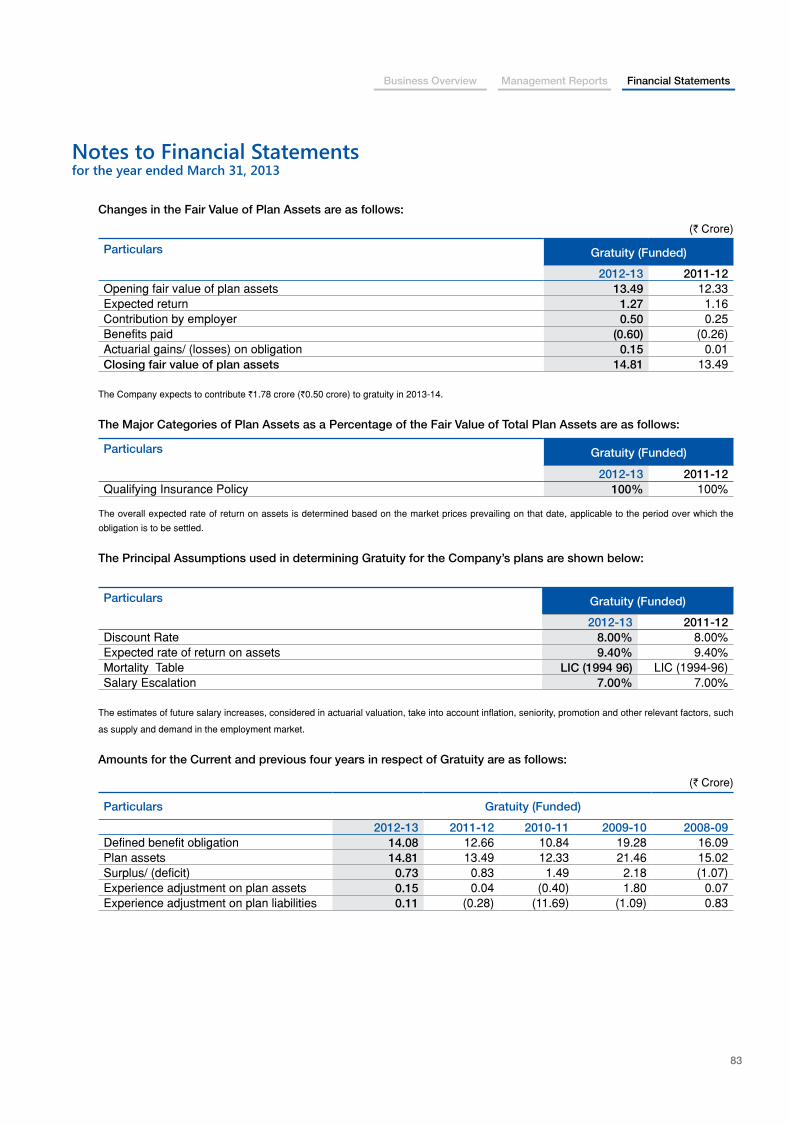
Business Overview Management Reports Financial Statements
83
Notes to Financial Statementsfor the year ended March 31, 2013
Changes in the Fair Value of Plan Assets are as follows:
(` Crore)
Particulars Gratuity (Funded)
2012-13 2011-12Opening fair value of plan assets 13.49 12.33Expected return 1.27 1.16Contribution by employer 0.50 0.25Benefits paid (0.60) (0.26)Actuarial gains/ (losses) on obligation 0.15 0.01Closing fair value of plan assets 14.81 13.49
The Company expects to contribute `1.78 crore (`0.50 crore) to gratuity in 2013-14.
The Major Categories of Plan Assets as a Percentage of the Fair Value of Total Plan Assets are as follows:
Particulars Gratuity (Funded)
2012-13 2011-12Qualifying Insurance Policy 100% 100%
The overall expected rate of return on assets is determined based on the market prices prevailing on that date, applicable to the period over which the
obligation is to be settled.
The Principal Assumptions used in determining Gratuity for the Company’s plans are shown below:
Particulars Gratuity (Funded)
2012-13 2011-12Discount Rate 8.00% 8.00%Expected rate of return on assets 9.40% 9.40%Mortality Table LIC (1994 96) LIC (1994-96) Salary Escalation 7.00% 7.00%
The estimates of future salary increases, considered in actuarial valuation, take into account inflation, seniority, promotion and other relevant factors, such
as supply and demand in the employment market.
Amounts for the Current and previous four years in respect of Gratuity are as follows:
(` Crore)
Particulars Gratuity (Funded)
2012-13 2011-12 2010-11 2009-10 2008-09Defined benefit obligation 14.08 12.66 10.84 19.28 16.09Plan assets 14.81 13.49 12.33 21.46 15.02Surplus/ (deficit) 0.73 0.83 1.49 2.18 (1.07)Experience adjustment on plan assets 0.15 0.04 (0.40) 1.80 0.07Experience adjustment on plan liabilities 0.11 (0.28) (11.69) (1.09) 0.83
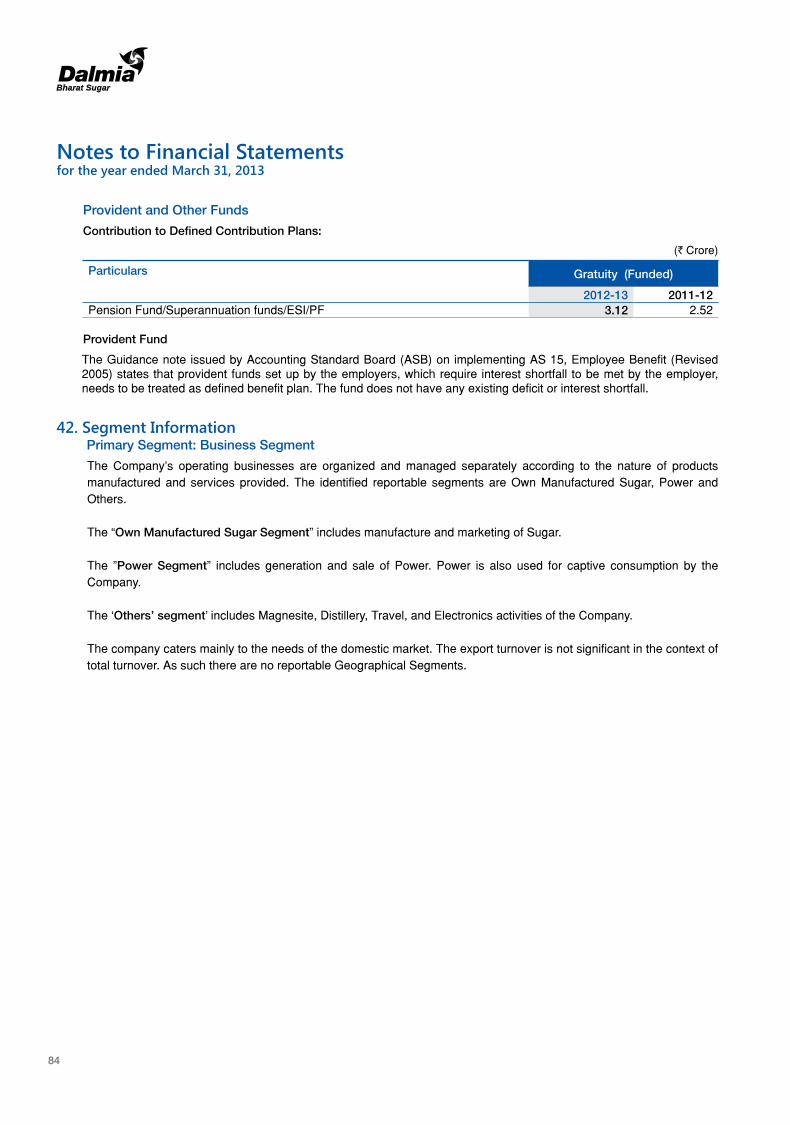
84
Provident and Other Funds
Contribution to Defined Contribution Plans:
(` Crore)
Particulars Gratuity (Funded)
2012-13 2011-12Pension Fund/Superannuation funds/ESI/PF 3.12 2.52
Provident Fund
The Guidance note issued by Accounting Standard Board (ASB) on implementing AS 15, Employee Benefit (Revised 2005) states that provident funds set up by the employers, which require interest shortfall to be met by the employer, needs to be treated as defined benefit plan. The fund does not have any existing deficit or interest shortfall.
42. Segment Information Primary Segment: Business Segment
The Company’s operating businesses are organized and managed separately according to the nature of products manufactured and services provided. The identified reportable segments are Own Manufactured Sugar, Power and Others.
The “Own Manufactured Sugar Segment” includes manufacture and marketing of Sugar. The ”Power Segment” includes generation and sale of Power. Power is also used for captive consumption by the
Company.
The ‘Others’ segment’ includes Magnesite, Distillery, Travel, and Electronics activities of the Company. The company caters mainly to the needs of the domestic market. The export turnover is not significant in the context of
total turnover. As such there are no reportable Geographical Segments.
Notes to Financial Statementsfor the year ended March 31, 2013
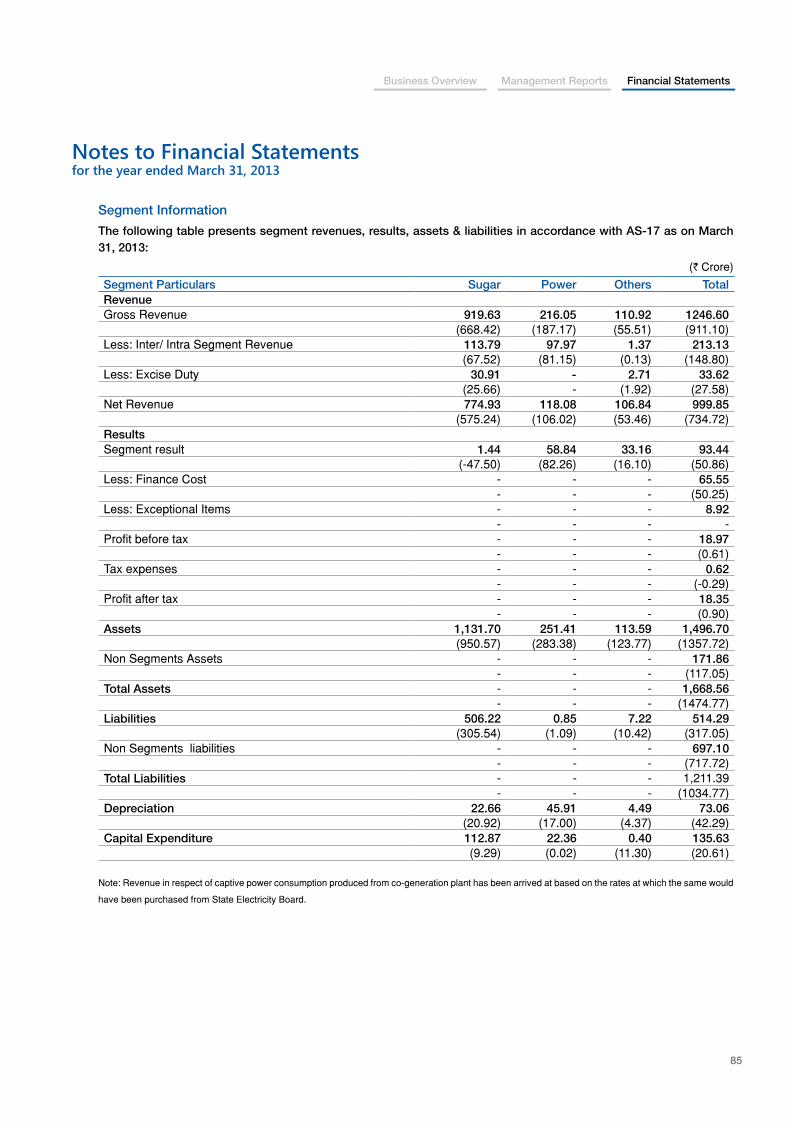
Business Overview Management Reports Financial Statements
85
Notes to Financial Statementsfor the year ended March 31, 2013
Segment Information
The following table presents segment revenues, results, assets & liabilities in accordance with AS-17 as on March 31, 2013:
(` Crore)
Segment Particulars Sugar Power Others TotalRevenueGross Revenue 919.63 216.05 110.92 1246.60
(668.42) (187.17) (55.51) (911.10)Less: Inter/ Intra Segment Revenue 113.79 97.97 1.37 213.13
(67.52) (81.15) (0.13) (148.80)Less: Excise Duty 30.91 - 2.71 33.62
(25.66) - (1.92) (27.58)Net Revenue 774.93 118.08 106.84 999.85
(575.24) (106.02) (53.46) (734.72)ResultsSegment result 1.44 58.84 33.16 93.44
(-47.50) (82.26) (16.10) (50.86)Less: Finance Cost - - - 65.55
- - - (50.25)Less: Exceptional Items - - - 8.92
- - - -Profit before tax - - - 18.97
- - - (0.61)Tax expenses - - - 0.62
- - - (-0.29)Profit after tax - - - 18.35
- - - (0.90)Assets 1,131.70 251.41 113.59 1,496.70
(950.57) (283.38) (123.77) (1357.72)Non Segments Assets - - - 171.86
- - - (117.05)Total Assets - - - 1,668.56
- - - (1474.77)Liabilities 506.22 0.85 7.22 514.29
(305.54) (1.09) (10.42) (317.05)Non Segments liabilities - - - 697.10
- - - (717.72)Total Liabilities - - - 1,211.39
- - - (1034.77)Depreciation 22.66 45.91 4.49 73.06
(20.92) (17.00) (4.37) (42.29)Capital Expenditure 112.87 22.36 0.40 135.63
(9.29) (0.02) (11.30) (20.61)
Note: Revenue in respect of captive power consumption produced from co-generation plant has been arrived at based on the rates at which the same would
have been purchased from State Electricity Board.
86
43. During the year, the Company had incurred some expenditure related to acquisition/construction of fixed assets and therefore accounted for the same under Capital work in progress. Details of the expenses capitalised and carried forward as capital work in progress are given below:
(` Crore)
Particulars 2012-13 2011-12
Carried forward as part of Capital Work in Progress - -Expenditure incurred during the yearPersonnel ExpensesSalary and Wages 0.02 -Operating and Other ExpensesConsultancy Charges 0.42 -Miscellaneous Expenses 0.08 -Total Expenditure incurred during the year 0.52 -Less: Capitalised in Fixed Assets - -Carried forward as part of Capital Work in Progress 0.52 -
44. The company had given advance of ̀ 9.50 crore to its wholly owned subsidiary company, “Dalmia Solar Power Limited” for its solar power business. However, the subsidiary company has abandoned its only project of 10MW Solar Power Project during the year. Hence, advance amounting to `8.92 crore has been written off considering the financial position & future business viability of the subsidiary company.
45. During the year, the company acquired immovable and movable property of “M/s Shri Datta Sahakari Sakhar Karkhana Limited”, Distt. Kolhapur, Maharashtra, having a capacity of 2500 TCD, under the Securitisation and Reconstruction of Financial Assets and Enforcement of Security Interest Act, 2002, on payment of consideration of `108.00 crore. Besides this outstanding liabilities of `17.48 crore consisting of unsecured loan, sales tax dues & employees dues etc. have also been incorporated in the books of account & classified under current & non-current liabilities based upon the tenor of maturity. The capital reserve of `1.41 crore being the difference between net assets acquired and consideration paid, has also been recorded consequent to the Independent valuer report. Pro-rata depreciation on its assets has been charged from the date of taking over the possession.
46. Related Party Disclosure as required by Accounting Standard-18. a) List of related parties along with nature and volume of transactions is given below:
Subsidiaries of the Company
Himshikhar Investment Limited, Dalmia Solar Power Limited and Dalmia Sugar Ventures Limited
Key Management Personnel of the Company
Shri Jai Hari Dalmia– Vice-Chairman, Shri Yadu Hari Dalmia – Vice-Chairman, Shri Gautam Dalmia - Managing Director, Shri Puneet Yadu Dalmia – Managing Director.
Relatives of Key Management Personnel
Shri V.H. Dalmia (Brother of Vice-Chairman), Shri J.H. Dalmia (HUF), Smt. Kavita Dalmia (Wife of Vice- Chairman) Shri Y.H. Dalmia (HUF), Smt. Bela Dalmia (Wife of Vice-Chairman), Shri Gautam Dalmia (HUF), Smt. Anupama Dalmia (Wife of Managing Director), Smt. Avantika Dalmia (Wife of Managing Director), Kumari Shrutipriya Dalmia (Daughter of Vice-Chairman), Kumari Sukeshi Dalmia (Daughter of Managing Director), Kumari Vaidehi Dalmia (Daughter of Managing Director), Kumari Sumana Dalmia (Daughter of Managing Director), Kumari Avanee Dalmia (Daughter of Managing Director), Mst. Priyang Dalmia (Son of Managing Director) Shri M.H. Dalmia (Brother of Vice-Chairman) and Smt. Abha Dalmia (Wife of Brother of Vice-Chairman).
Notes to Financial Statementsfor the year ended March 31, 2013
Business Overview Management Reports Financial Statements
87
Notes to Financial Statementsfor the year ended March 31, 2013
Enterprises controlled by the Key Management Personnel of the Company
Rama Investment Company Private Limited, Puneet Trading & Investment Company Private Limited, Kavita Trading & Investment Company Private Limited, Sita Investment Company Limited, Mayuka Investment Limited, Ankita Pratisthan Limited, Himgiri Commercial Limited, Valley Agro Industries Limited, Shri Nataraj Ceramic and Chemical Industries Limited, Shri Chamundeswari Minerals Limited, Shree Nirman Limited, Keshav Power Limited, Avanee and Ashni Securities Private Limited, ZipAhead.Com Limited, Alirox Abrasives Limited, Shri Investments, Sukeshi Trust, Vaidehi Trust, Sumana Trust, Shrutipriya Dalmia Trust, Priyang Trust, Avanee Trust, New Habitat Housing Finance and Development Limited, Dalmia Bharat Limited, Dalmia Power Limited, Kanika Investment Limited, Arjuna Brokers & Minerals Limited, Dalmia Cement Ventures Limited, D.I. Properties Limited, Dalmia Minerals & Properties Limited, Geetee Estates Limited, Hemshila Properties Limited, Ishita Properties Limited, Shri Radha Krishna Brokers & Holdings Limited, Shri Rangam Properties Limited, Sri Dhandauthapani Mines and Minerals Limited, Sri Madhusudana Mines and Properties Limited, Sri Shanmugha Mines & Minerals Limited, Sri Subramanya Mines & Minerals Limited, Sri Swaminatha Mines & Minerals Limited, Sri Trivikrama Mines and Properties Limited, Adhunik Cement Limited, Calcom Cement India Limited, Adhunik MSP Cement (Assam) Limited, Vinay Cements Limited, RCL Cements Limited, SCL Cements Limited, Golden Hills Resort Private Limited, Rajputana Properties Private Limited, Cosmos Cements Limited, Sutnga Mines Private Limited, DCB Power Ventures Limited, OCL India Limited and Dalmia Cement (Bharat) Limited.
b) The following transactions were carried out with the related parties in the ordinary course of business:
(` Crore)
Nature of TransactionSubsidiary
Companies
Key Management
Personnel
Key Management
Personnel controlled
enterprises
Total
Sale of goods and services - - 4.00 4.00(-) (-) (6.26) (6.26)
Reimbursement of expenses - receivable - - 0.08 0.08(-) (-) (0.19) (0.19)
Reimbursement of expenses – payable - - 0.45 0.45(-) (-) (0.30) (0.30)
Purchase of goods and services - - 10.88 10.88(-) (-) (6.15) (6.15)
Rent payment - - 0.01 0.01(-) (-) (-) (-)
Loans and Advances given 7.23 - - 7.23(0.45) (-) (-) (0.45)
Loan Taken - - 153.25 153.25(-) (-) (222.00) (222.00)
Loan Refund - - 139.25 139.25(-) (-) (197.00) (197.00)
Sale of Assets - - 0.04 0.04(-) (-) (0.01) (0.01)
Receipt of fund on their behalf and transfer - - 0.03 0.03(-) (-) (-) (-)
Purchase of Fixed Assets - - - -(-) (-) (0.01) (0.01)
Interest paid on Loan - - 3.04 3.04(-) (-) (3.97) (3.97)
Salary and Perquisites - 0.95 - 0.95(-) (1.04) (-) (1.04)
Dividend Received - - 0.14 0.14(-) (-) (-) (-)
88
1. Sale of goods and services includes transaction with Dalmia Cement (Bharat) Limited `0.21 crore (`0.53 crore), OCL India Limited `0.46 crore (`4.59 crore) and Dalmia Bharat Limited `3.33 crore (`1.14 crore).
2. Reimbursement of expenses – receivable includes transaction with Dalmia Bharat Limited `0.03 crore (`0.05 crore), Dalmia Cement (Bharat) Limited `0.05 crore (`0.14 crore).
3. Reimbursement of expenses – payable includes transaction with Dalmia Bharat Limited `0.40 crore (`0.20) and Dalmia Cement (Bharat) Limited `0.05 crore (`0.10 crore).
4. Purchase of goods & services includes transaction with Dalmia Bharat Limited `10.19 crore (`5.75 crore), Dalmia Cement (Bharat) Limited `0.66 crore (` Nil) and Shri Natraj Ceramics and Chemical Industries Limited `0.03 crore (` Nil).
5. Rent payment includes transaction with Ishita Properties Limited `0.01 crore (` Nil).
6. Loans and advances given include transaction with Dalmia Solar Power Limited `7.23 crore (`0.45 crore).7. Loan taken includes transaction with Dalmia Bharat Limited `127.25 crore (`166.00 crore) and DCB Power Ventures
Limited `26.00 crore (`56 crore).
8. Loan refund includes transaction with Dalmia Bharat Limited `132.25 crore (`141.00 crore), DCB Power Ventures Limited `7.00 crore (`56 crore).
9. Sale of fixed assets includes transaction with Dalmia Cement (Bharat) Limited ` Nil (`0.01 crore) and Dalmia Bharat Limited `0.04 crore (` Nil).
10. Receipt of fund on their behalf and transfer includes transaction with Dalmia Bharat Limited `0.03 crore (` Nil).
11. Purchase of fixed assets includes transaction with Dalmia Cement (Bharat) Limited ` Nil (`0.01 crore).
12. Interest paid on loan includes transaction with Dalmia Bharat Limited `2.47 crore (`3.73 crore) and DCB Power Ventures Limited `0.57 crore (` Nil).
13. Salary and perquisites includes transaction with Shri J. H. Dalmia `0.42 crore (`0.26 crore), Shri Y. H. Dalmia `0.41 crore (`0.26 crore), Shri Gautam Dalmia `0.05 crore (`0.26 crore), Shri Puneet Yadu Dalmia `0.07 crore (`0.26 crore).
14. Dividend received is on account of Dalmia Bharat Limited `0.14 crore (`Nil).
Notes to Financial Statementsfor the year ended March 31, 2013
Business Overview Management Reports Financial Statements
89
c) Balances Outstanding at Year End:
(` Crore)
Nature of TransactionSubsidiary
Companies
Key Management
Personnel / Promoters
Key Management
Personnel / Promoters controlled
enterprises
Total
Loans receivable 0.58 - - 0.58(2.27) (-) (-) (2.27)
Loan Payable - - 64.00 64.00(-) (-) (50.00) (50.00)
Interest Payable - - 1.76 1.76(-) (-) (-) (-)
Amounts receivable - - 0.09 0.09(-) (-) (0.48) (0.48)
Amounts payable - - 3.87 3.87(-) (-) (2.11) (2.11)
1 Loan receivable includes Dalmia Solar Power Limited `0.58 crore (`2.27 crore) after write off of `8.92 crore in the current year.
2 Loan payable includes Dalmia Bharat Limited `45.00 crore (`50.00 crore) and DCB Power Ventures Limited `19.00 crore (` Nil).
3 Interest payable includes Dalmia Bharat Limited `1.25 crore (` Nil) and DCB Power Ventures Limited `0.51 crore (`Nil).
4 Amount receivable includes Dalmia Bharat Limited ` Nil (`0.20 crore), Dalmia Cement (Bharat) Limited `0.09 crore (`0.23 crore) and OCL India Limited `Nil (`0.05 crore)
5 Amount payable includes Dalmia Cement (Bharat) Limited `0.06 crore (`0.01 crore), Dalmia Bharat Limited `3.80 crore (` Nil) and DCB Power Ventures Limited `0.01 crore (`Nil).
47. Figures less than ` Fifty thousand which are required to be shown separately have been shown at actual in double brackets.
48. Previous Year Comparatives
Figures in brackets pertain to previous year. Previous year’s figures have been regrouped where necessary to conform to this year’s classification.
As per our report of even date
For S.S. Kothari Mehta & Co. For and on behalf of the Board of Directors of
Chartered Accountants Dalmia Bharat Sugar and Industries Limited
per Arun K. Tulsian K. V. Mohan Anil Kataria B. B. Mehta Puneet Yadu Dalmia
Partner Company Secretary Asst. Executive Director Director Managing DirectorMembership No. 89907 (Finance & Accounts)
Place: New DelhiDate: May 27, 2013
Notes to Financial Statementsfor the year ended March 31, 2013
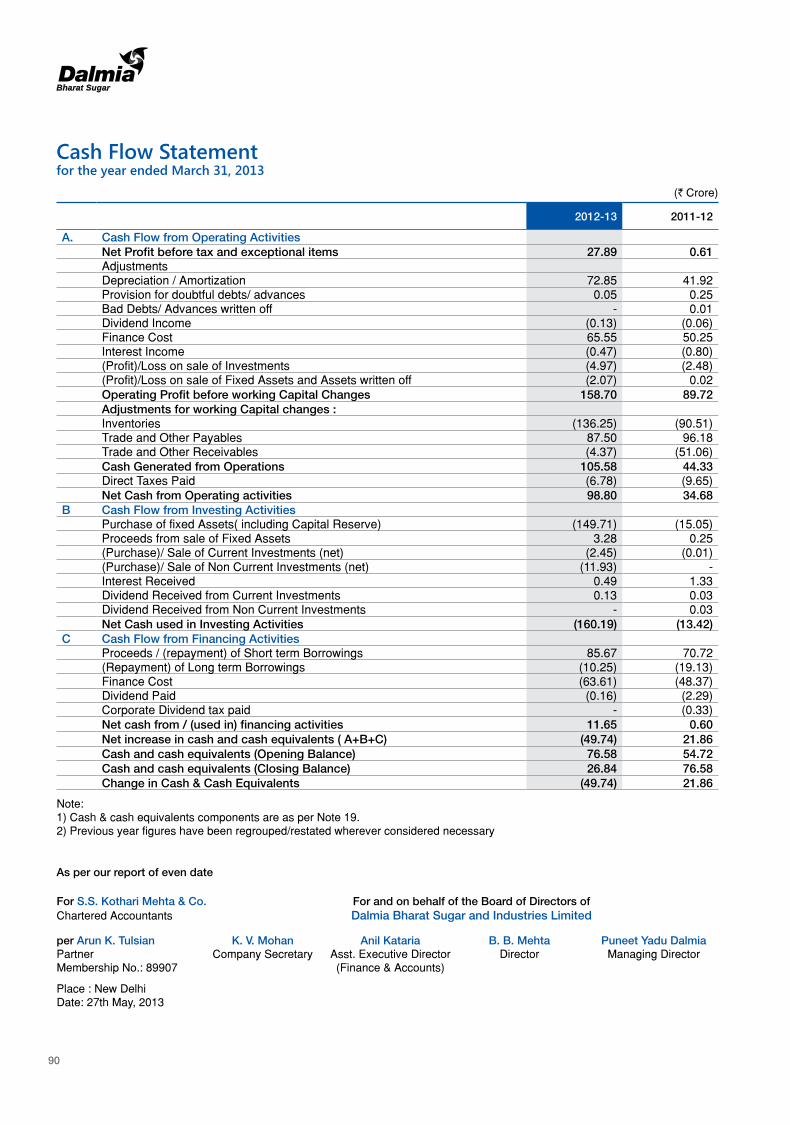
90
Cash Flow Statementfor the year ended March 31, 2013
(` Crore)
2012-13 2011-12
A. Cash Flow from Operating ActivitiesNet Profit before tax and exceptional items 27.89 0.61 AdjustmentsDepreciation / Amortization 72.85 41.92 Provision for doubtful debts/ advances 0.05 0.25 Bad Debts/ Advances written off - 0.01 Dividend Income (0.13) (0.06)Finance Cost 65.55 50.25 Interest Income (0.47) (0.80)(Profit)/Loss on sale of Investments (4.97) (2.48)(Profit)/Loss on sale of Fixed Assets and Assets written off (2.07) 0.02 Operating Profit before working Capital Changes 158.70 89.72 Adjustments for working Capital changes :Inventories (136.25) (90.51)Trade and Other Payables 87.50 96.18 Trade and Other Receivables (4.37) (51.06)Cash Generated from Operations 105.58 44.33 Direct Taxes Paid (6.78) (9.65)Net Cash from Operating activities 98.80 34.68
B Cash Flow from Investing ActivitiesPurchase of fixed Assets( including Capital Reserve) (149.71) (15.05)Proceeds from sale of Fixed Assets 3.28 0.25 (Purchase)/ Sale of Current Investments (net) (2.45) (0.01)(Purchase)/ Sale of Non Current Investments (net) (11.93) - Interest Received 0.49 1.33 Dividend Received from Current Investments 0.13 0.03 Dividend Received from Non Current Investments - 0.03 Net Cash used in Investing Activities (160.19) (13.42)
C Cash Flow from Financing ActivitiesProceeds / (repayment) of Short term Borrowings 85.67 70.72 (Repayment) of Long term Borrowings (10.25) (19.13)Finance Cost (63.61) (48.37)Dividend Paid (0.16) (2.29)Corporate Dividend tax paid - (0.33)Net cash from / (used in) financing activities 11.65 0.60 Net increase in cash and cash equivalents ( A+B+C) (49.74) 21.86 Cash and cash equivalents (Opening Balance) 76.58 54.72 Cash and cash equivalents (Closing Balance) 26.84 76.58 Change in Cash & Cash Equivalents (49.74) 21.86
Note:1) Cash & cash equivalents components are as per Note 19.2) Previous year figures have been regrouped/restated wherever considered necessary
As per our report of even date
For S.S. Kothari Mehta & Co. For and on behalf of the Board of Directors ofChartered Accountants Dalmia Bharat Sugar and Industries Limited
per Arun K. Tulsian K. V. Mohan Anil Kataria B. B. Mehta Puneet Yadu DalmiaPartner Company Secretary Asst. Executive Director Director Managing DirectorMembership No.: 89907 (Finance & Accounts)
Place : New DelhiDate: 27th May, 2013
91
Business Overview Management Reports Financial Statements
Independent Auditors’ Report on Consolidated Financial Statements of Dalmia Bharat Sugar and Industries Limited and its Subsidiaries
To the Board of Directors of Dalmia Bharat Sugar and Industries Limited
We have audited the accompanying consolidated Financial Statements of Dalmia Bharat Sugar and Industries Limited (‘the Company’), and its subsidiaries (the Group) which comprise the Consolidated Balance Sheet as at March 31, 2013, the Consolidated Statement of Profit and Loss and the Consolidated Cash Flow Statement for the year ended on that date, annexed thereto.
Management’s Responsibility for the Financial Statements
Management is responsible for the preparation of these consolidated financial statements that give a true and fair view of the consolidated financial position, consolidated financial performance and consolidated cash flows of the Company in accordance with the Accounting Standards referred to in sub-section (3C) of section 211 of the Companies Act, 1956 (‘the Act’). This responsibility includes the design, implementation and maintenance of internal controls relevant to the preparation and presentation of the consolidated financial statements that give a true and fair view and are free from material misstatements, whether due to fraud or error.
Auditors’ Responsibility
Our responsibility is to express an opinion on these consolidated financial statements based on our audit. We conducted our audit in accordance with the Standards on Auditing issued by the Institute of Chartered Accountants of India. Those Standards require that we comply with ethical requirements and plan and perform the audit to obtain reasonable assurance about whether the financial statements are free from material misstatement.
An audit involves performing procedures to obtain audit evidence about the amounts and disclosures in the consolidated financial statements. The procedures selected depend on the auditor’s judgment, including the assessment of the risks of material misstatement of the financial statements, whether due to fraud or error. In making those risk assessments, the auditor considers internal controls relevant to the Company’s preparation and fair presentation of the consolidated financial statements in order to design audit procedures that are appropriate in the circumstances. An audit also includes evaluating the appropriateness of accounting policies used and reasonableness of the accounting estimates made by management, as well as evaluating the overall presentation of the consolidated financial statements.
Other Matters
We did not audit the financial statements of three subsidiaries whose financial statements reflect total assets of `6.86 crore as at March 31, 2013, total revenues of `0.04 crore and cash flows of ` (-) 0.15 crore for the year then ended. These financial statements have been audited by other auditors whose reports have been furnished to us, and our opinion, in so far as it relates to the amounts included in respect of these subsidiaries, is based solely on the report of the other auditors.
Opinion
Based on our audit and on consideration of the report of other auditors on separate financial statements and on the other information of the subsidiary companies and to the best of our information and according to the explanations given to us, we are of the opinion that the attached Consolidated Financial Statements give a true and fair view in conformity with the Accounting Principles generally accepted in India :
i. In case of Consolidated Balance Sheet, of the Consolidated state of affairs of the Group as at March 31, 2013;
ii. In case of Consolidated Statement of Profit and Loss, of the profit of the Group for the year ended March 31, 2013; and
iii. In case of Consolidated Cash Flow Statement, of the cash flows of the Group for the year ended March 31, 2013.
For S. S. Kothari Mehta & Co.Chartered Accountants
FRN – 000756N
Arun K.TulsianDate: May 27, 2013 PartnerPlace: New Delhi Membership No. 89907
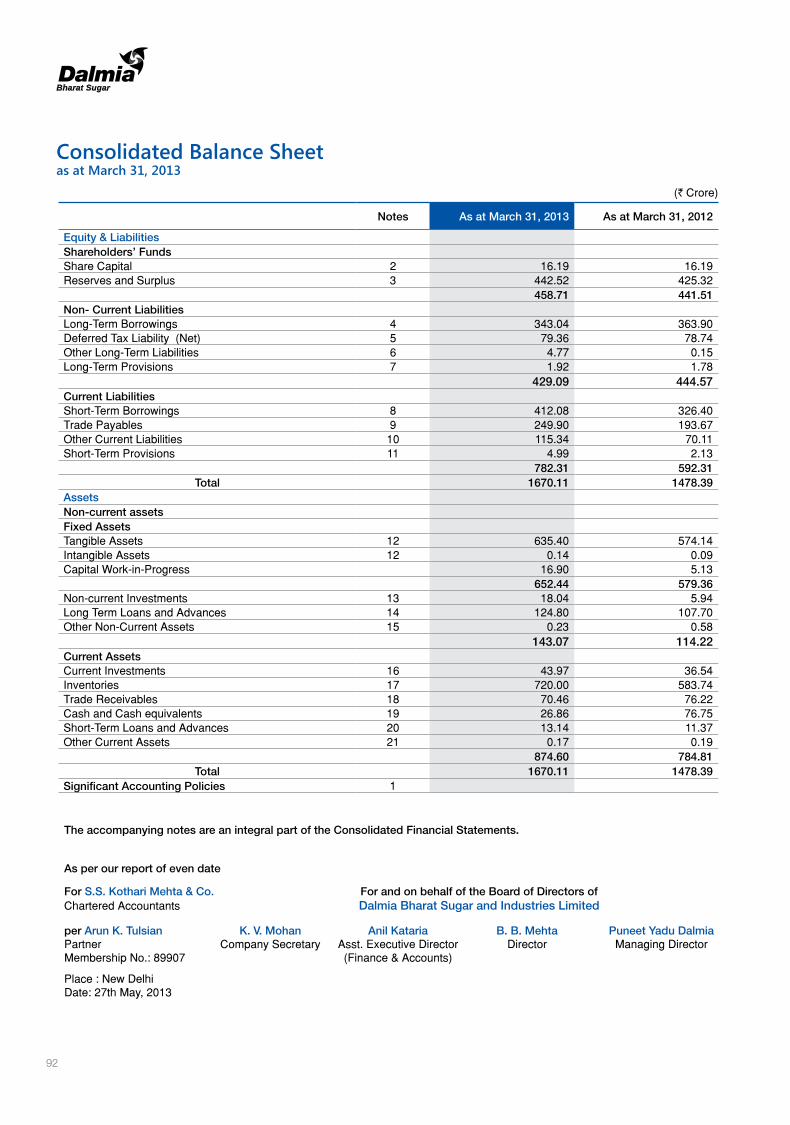
92
Consolidated Balance Sheet as at March 31, 2013
(` Crore)
Notes As at March 31, 2013 As at March 31, 2012
Equity & LiabilitiesShareholders’ FundsShare Capital 2 16.19 16.19 Reserves and Surplus 3 442.52 425.32
458.71 441.51 Non- Current LiabilitiesLong-Term Borrowings 4 343.04 363.90 Deferred Tax Liability (Net) 5 79.36 78.74 Other Long-Term Liabilities 6 4.77 0.15 Long-Term Provisions 7 1.92 1.78
429.09 444.57 Current Liabilities Short-Term Borrowings 8 412.08 326.40 Trade Payables 9 249.90 193.67 Other Current Liabilities 10 115.34 70.11 Short-Term Provisions 11 4.99 2.13
782.31 592.31 Total 1670.11 1478.39
AssetsNon-current assets Fixed Assets Tangible Assets 12 635.40 574.14 Intangible Assets 12 0.14 0.09 Capital Work-in-Progress 16.90 5.13
652.44 579.36 Non-current Investments 13 18.04 5.94 Long Term Loans and Advances 14 124.80 107.70 Other Non-Current Assets 15 0.23 0.58
143.07 114.22 Current AssetsCurrent Investments 16 43.97 36.54 Inventories 17 720.00 583.74 Trade Receivables 18 70.46 76.22 Cash and Cash equivalents 19 26.86 76.75 Short-Term Loans and Advances 20 13.14 11.37 Other Current Assets 21 0.17 0.19
874.60 784.81 Total 1670.11 1478.39
Significant Accounting Policies 1
The accompanying notes are an integral part of the Consolidated Financial Statements.
As per our report of even date
For S.S. Kothari Mehta & Co. For and on behalf of the Board of Directors ofChartered Accountants Dalmia Bharat Sugar and Industries Limited
per Arun K. Tulsian K. V. Mohan Anil Kataria B. B. Mehta Puneet Yadu DalmiaPartner Company Secretary Asst. Executive Director Director Managing DirectorMembership No.: 89907 (Finance & Accounts)
Place : New DelhiDate: 27th May, 2013
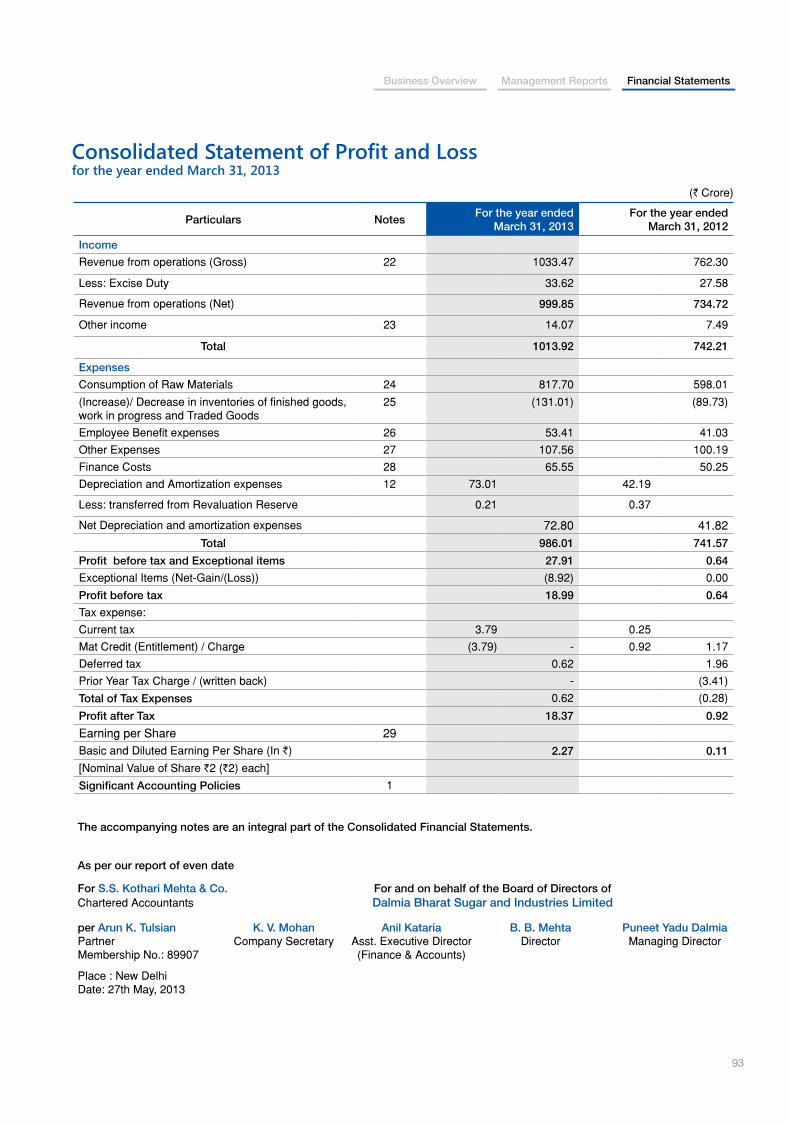
93
Business Overview Management Reports Financial Statements
Consolidated Statement of Profit and Lossfor the year ended March 31, 2013
(` Crore)
Particulars NotesFor the year ended
March 31, 2013For the year ended
March 31, 2012
Income
Revenue from operations (Gross) 22 1033.47 762.30
Less: Excise Duty 33.62 27.58
Revenue from operations (Net) 999.85 734.72
Other income 23 14.07 7.49
Total 1013.92 742.21
Expenses
Consumption of Raw Materials 24 817.70 598.01
(Increase)/ Decrease in inventories of finished goods, work in progress and Traded Goods
25 (131.01) (89.73)
Employee Benefit expenses 26 53.41 41.03
Other Expenses 27 107.56 100.19
Finance Costs 28 65.55 50.25
Depreciation and Amortization expenses 12 73.01 42.19
Less: transferred from Revaluation Reserve 0.21 0.37
Net Depreciation and amortization expenses 72.80 41.82 Total 986.01 741.57
Profit before tax and Exceptional items 27.91 0.64
Exceptional Items (Net-Gain/(Loss)) (8.92) 0.00
Profit before tax 18.99 0.64
Tax expense:
Current tax 3.79 0.25
Mat Credit (Entitlement) / Charge (3.79) - 0.92 1.17
Deferred tax 0.62 1.96
Prior Year Tax Charge / (written back) - (3.41)
Total of Tax Expenses 0.62 (0.28)
Profit after Tax 18.37 0.92
Earning per Share 29Basic and Diluted Earning Per Share (In `) 2.27 0.11
[Nominal Value of Share `2 (`2) each]
Significant Accounting Policies 1
The accompanying notes are an integral part of the Consolidated Financial Statements.
As per our report of even date
For S.S. Kothari Mehta & Co. For and on behalf of the Board of Directors ofChartered Accountants Dalmia Bharat Sugar and Industries Limited
per Arun K. Tulsian K. V. Mohan Anil Kataria B. B. Mehta Puneet Yadu DalmiaPartner Company Secretary Asst. Executive Director Director Managing DirectorMembership No.: 89907 (Finance & Accounts)
Place : New DelhiDate: 27th May, 2013
94
Notes to Consolidated Financial Statementsfor the year ended March 31, 2013
Note 1: Significant Accounting Policies
A. Basis of Preparation
The Consolidated Financial Statements (CFS) have been prepared to comply in all material respects with the Accounting Standards notified by Companies (Accounting Standards) Rules, 2006, (as amended) and the relevant provisions of the Companies Act, 1956. The Consolidated Financial Statements have been prepared under the historical cost convention on an accrual basis except in case of assets for which revaluation is carried out. The accounting policies have been consistently applied by the Group and are consistent with those used in the previous year.
The CFS relates to Dalmia Bharat Sugar and Industries Limited (hereinafter referred as the “Company”) and its Subsidiaries, Associate and Joint Venture (hereinafter referred as the “Group”).
B. Principles of Consolidation
In the preparation of these Consolidated Financial Statements, investment in Subsidiaries, Associate and Joint Venture have been accounted for in accordance with Accounting Standard (AS) 21 – Consolidated Financial Statements, Accounting Standard (AS) 23 – Accounting for Investments in Associates in Consolidated Financial Statements and Accounting Standard (AS) 27 – Financial Reporting of Interests in Joint Ventures. The Consolidated Financial Statements have been prepared on the following basis.
a) Subsidiaries have been consolidated on a line-by-line basis by adding together the book values of like items of assets, liabilities, income and expenses, after eliminating all significant intra-group balances and intra-group transactions and also unrealised profits or losses, except where cost cannot be recovered.
b) Minorities’ interest in net profit of consolidated subsidiaries for the year is identified and adjusted against the income in order to arrive at the net income attributable to the shareholders of the Company. Their share of net assets is identified and presented in the Consolidated Balance Sheet separately. Where accumulated losses attributable to the minorities are in excess of their equity, in
the absence of the contractual obligation on the minorities, the same is accounted for by the Holding Company.
c) Interests in the assets, liabilities, income and expenses of the joint venture are consolidated using proportionate consolidation method. Intra group balances, transactions and unrealised profits/ losses are eliminated to the extent of Company’s proportionate share.
d) The difference of the cost to the Company of its investment in subsidiaries and joint venture over its proportionate share in the equity of the Investee Company as at the date of acquisition of stake is recognized in the Consolidated Financial Statements as Goodwill or Capital Reserve, as the case may be.
e) Investment in entities in which the Group has significant influence but not controlling interest, are reported according to the equity method i.e. the investment is initially recorded at cost adjusted thereafter for post-acquisition change in the Company’s share of net assets of the associates. The Consolidated Statement of Profit and Loss includes the Company’s share of the result of the operations of the associate.
Unrealised profits and losses resulting from transactions between the investor (or its consolidated subsidiaries) and the associate have been eliminated to the extent of the investor’s interest in the associate. Unrealised losses have not been eliminated if and to the extent the cost of the transferred asset cannot be recovered.
f) Goodwill/capital reserve arising on the acquisition of an associate by an investor is included in the carrying amount of investment in the associate and is disclosed separately.
g) The Consolidated Financial Statements have been prepared using uniform accounting policies for like transactions and other events in similar circumstances and are presented to the extent possible, in the same manner as the Company’s separate Consolidated Financial Statements. Differences in accounting policies have been disclosed separately.
h) The difference between the proceeds from disposal
95
Business Overview Management Reports Financial Statements
Notes to Consolidated Financial Statementsfor the year ended March 31, 2013
of investment in subsidiary and the carrying amount of its assets less liabilities as of the date of disposal is recognized in the Consolidated Statement of Profit and Loss as the profit or loss on disposal of investment in subsidiary.
i) The accounts of all the Group Companies are drawn up to the same reporting date as the parent entity (i.e. financial year ended March 31, 2013).
C. Use of Estimates
The preparation of Consolidated Financial Statements in conformity with generally accepted accounting principles requires management to make estimates and assumptions that affect the reported amounts of assets and liabilities and disclosure of contingent liabilities at the date of the Consolidated Financial Statements and the results of operations during the reporting period. Although these estimates are based upon management’s best knowledge of current events and actions, actual results could differ from these estimates. Difference between the actual results and estimates are recognised in the period in which the results are known/ materialized.
D. Fixed Assets
Fixed assets are stated at cost (or revalued amounts, as the case may be), less accumulated depreciation and impairment losses if any. Cost comprises the purchase price and any attributable cost of bringing the asset to its working condition for its intended use.
Intangible assets are recognised on the basis of recognition criteria as set out in the relevant Accounting Standard.
E. Depreciation/Amortisation
Depreciation is provided on fixed assets over the useful lives of the assets estimated by the management, which are equivalent to the rates prescribed in Schedule XIV to the Companies Act, 1956. The following methods of depreciation are used for fixed assets:
"Plant and machinery" at Salem (excluding earth moving machin-ery) and on all fixed assets at Wind Farm Unit, Bangalore Works and Dalmia Chini Mills (Sugar Units) exclud-ing Boiler machinery in Power Plants.
Straight Line Method
Leasehold Land Amortised over the period of lease, i.e., 99 years
Revalued assets Depreciation on amount added on revaluation of fixed assets is transferred from Revaluation Re-serve.
Computer Software Amortised over a period of 3-5 years on a Straight line basis.
Remaining Fixed As-sets
Written Down Value Method
F. Impairment of Assets
The carrying amounts of assets are reviewed at each Balance Sheet date if there is any indication of impairment based on internal/external factors.An impairment loss is recognized wherever the carrying amount of an asset exceeds its recoverable amount. The recoverable amount is the greater of the asset’s net selling price and value in use. In assessing value in use, the estimated future cash flows are discounted to their present value at the weighted average cost of capital.
After impairment, depreciation is provided on the revised carrying amount of the asset over its remaining useful life.
Previously recognised impairment losses are reversed to the extent the recoverable amount exceeds the carrying amount.
G. Goodwill on Consolidation
Goodwill represents the difference between the Group’s share in the net worth of the investee companies and the cost of acquisition at the date of investment. For this purpose, the Groups’ share of equity in the investee

96
companies is determined on the basis of the latest Consolidated Financial Statements of the respective companies available as on the date of acquisition, after making necessary adjustments for material events between the date of such Consolidated Financial Statements and the date of acquisition.
H. Leases
Where the Company is the Lessee
Leases where the lessor effectively retains substantially all the risks and benefits of ownership of the leased item, are classified as operating leases. Operating lease payments are recognized as an expense in the Consolidated Statement of Profit and Loss on a straight-line basis over the lease term.
Where the Company is the Lessor
Assets subject to operating leases are included in fixed assets. Lease income is recognised in the Consolidated Statement of Profit and Loss on a straight-line basis over the lease term. Costs, including depreciation are recognised as an expense in the Consolidated Statement of Profit and Loss. Initial direct costs such as legal costs, brokerage costs, etc. are recognised immediately in the Consolidated Statement of Profit and Loss.
I. Government Grants and Subsidies
Grants and subsidies from the government are recognized when there is reasonable assurance that the grant/subsidy will be received and all attaching conditions will be complied with.
When the grant or subsidy relates to an expense item, it is recognized as income over the periods necessary to match them on a systematic basis to the costs, which it is intended to compensate.
Where the grant or subsidy relates to an asset, its value is deducted from the gross value of the asset concerned in arriving at the carrying amount of the related asset.
J. Borrowing Costs
Borrowing costs directly attributable to the acquisition, construction or production of an asset that necessarily takes a substantial period of time to get ready for its intended use or sale are capitalized as part of the cost of the respective asset. All other borrowing costs are
expensed in the period they occur. Borrowing costs consist of interest and other costs that an entity incurs in connection with the borrowing of funds.
K. Segment Reporting
Identification of Segments
The Company’s operating businesses are organized and managed separately according to the nature of products manufactured and services provided, with each segment representing a strategic business unit that offers different products. The analysis of geographical segments is based on the areas in which major operating divisions of the Group operate.
Inter Segment Transfers
The Group accounts for intersegment sales and transfers as if the sales or transfers were to third parties at current market prices.
Allocation of Common Costs
Common allocable costs are allocated to each segment on reasonable basis.
Unallocated Items
Includes general corporate income and expense items which are not allocable to any business segment.
Segment Policies
The company prepares its segment information in conformity with the accounting policies adopted for preparing and presenting the Consolidated Financial Statements of the Group as a whole.
L. Employee Benefits
a. Employee benefits in the form of the Group’s contribution to provident fund, pension fund, superannuation fund and ESI are considered as defined contribution plan and charged to the Consolidated Statement of Profit and Loss of the year when the contributions to the respective funds are due. There are no other obligations other than the contributions payable to the respective funds.
b. Retirement benefits in the form of gratuity and provident fund contribution to Dalmia Cement Provident Fund Trust are defined benefit plans. Gratuity is provided for on the basis of an actuarial
Notes to Consolidated Financial Statementsfor the year ended March 31, 2013
97
Business Overview Management Reports Financial Statements
valuation on projected unit credit method made at the end of each financial year. Contributions to Dalmia Cement Provident Fund Trust are charged to the Consolidated Statement of Profit and Loss of the year when the contributions to the fund is due. Shortfall in the funds, if any, is adequately provided for by the Company.
c. Leave encashment including compensated absences are provided for based on actuarial valuation at the year end. The actuarial valuation is done as per projected unit credit method.
d. Actuarial gains/losses are immediately taken to Consolidated Statement of Profit and Loss immediately.
e. Payments made under the Voluntary Retirement Scheme are charged to the Consolidated Statement of Profit and Loss in the year in which the same are incurred.
M. Inventories
a. Finished goods are valued at lower of cost or net realisable value. In case of Dead Burnt Magnesite Dust Stocks to the extent these are considered saleable, valuation is done at raw materials cost plus packing charges or net realizable value, whichever is lower. By-products are valued at net realisable value. Cost includes direct materials and labour and a proportion of manufacturing overheads based on normal operating capacity. Cost of finished goods includes excise duty. Cost is determined on a weighted average basis.
b. Work in progress is valued at lower of cost or net realisable value. Cost is determined on a weighted average basis.
c. Stores, Spares and Raw Materials are valued at lower of cost or net realisable value. However materials & other items of inventories held for use in the production are not written below cost if the finished products in which they will be incorporated are expected to be sold at or above cost. Cost is determined on a weighted average basis
Net realizable value is the estimated selling price in the ordinary course of business, less estimated costs of completion and estimated costs necessary to make the sale.
N. Investments
Investments that are readily realisable and intended to be held for not more than a year are classified as current investments. All other investments are classified as long-term investments. Current investments are carried at lower of cost and fair value determined for each category separately. Long-term investments are carried at cost on individual investment basis. However, provision for diminution in value is made to recognise a decline other than temporary in the value of the investments in case of long term investments.
O. Revenue Recognition
Revenue is recognized to the extent that it is probable that the economic benefits will flow to the Company and the revenue can be reliably measured.
Sale of Goods
Revenue is recognised when the significant risks and rewards of ownership of the goods have passed to the buyer. Excise Duty deducted from turnover (gross) are the amount that is included in the amount of turnover (gross) and not the entire amount of liability that arose during the year. Sale is net of trade discount and sales tax.
Dividends
Revenue is recognised when the shareholders’ right to receive payment is established by the Balance Sheet date.
Insurance Claim
Claims lodged with the insurance companies are accounted on accrual basis to the extent these are measurable and ultimate collection is reasonably certain.
P. Foreign Currency Transactions
(i) Initial Recognition
Foreign currency transactions are recorded in the reporting currency, by applying to the foreign currency amount the exchange rate between the reporting currency and the foreign currency at the date of the transaction.
Notes to Consolidated Financial Statementsfor the year ended March 31, 2013
98
(ii) Conversion
Foreign currency monetary items are reported using the closing rate. Non-monetary items which are carried in terms of historical cost denominated in a foreign currency are reported using the exchange rate at the date of the transaction; and non-monetary items which are carried at fair value or other similar valuation denominated in a foreign currency are reported using the exchange rates that existed when the values were determined.
(iii) Exchange Differences
Exchange differences arising on a monetary item that, in substance, form part of the Group’s net investment in a non-integral foreign operation is accumulated in a foreign currency translation reserve in the Consolidated Financial Statements until the disposal of the net investment, at which time they are recognised as income or as expenses.
Exchange differences arising on the settlement of monetary items not covered above, or on reporting such monetary items of Group at rates different from those at which they were initially recorded during the year, or reported in previous Consolidated Financial Statements, are recognized as income or as expenses in the year in which they arise.
(iv) Forward Exchange Contracts not intended for Trading or Speculation Purposes
The premium or discount arising at the inception of forward exchange contracts is amortised as expense or income over the life of the contract. Exchange differences on such contracts are recognised in the Consolidated Statement of Profit and Loss in the year in which the exchange rates change. Any profit or loss arising on cancellation or renewal of forward exchange contract is recognised as income or as expense for the year.
Q. Income Taxes
Tax expense comprises of current and deferred. Current income tax is measured at the amount expected to be paid to the tax authorities in accordance with the Income Tax Act,1961. Deferred income tax reflects the impact of current year timing differences between taxable income and accounting income for the year and reversal of
timing differences of earlier years.
Deferred tax is measured based on the tax rates and the tax laws enacted or substantively enacted at the Balance Sheet date. Deferred tax assets and deferred tax liabilities are offset, if a legally enforceable right exists to set off current tax assets against current tax liabilities and the deferred tax assets and deferred tax liabilities relate to the taxes on income levied by same governing taxation laws. Deferred tax assets are recognised only to the extent that there is reasonable certainty that sufficient future taxable income will be available against which such deferred tax assets can be realised. In situations where the company has unabsorbed depreciation or carry forward tax losses, all deferred tax assets are recognised only if there is virtual certainty supported by convincing evidence that they can be realised against future taxable profits.
At each Consolidated Balance Sheet date the Group re-assesses unrecognised deferred tax assets. It recognises unrecognised deferred tax assets to the extent that it has become reasonably certain or virtually certain, as the case may be, that sufficient future taxable income will be available against which such deferred tax assets can be realised.
The carrying amount of deferred tax assets are reviewed at each Balance Sheet date. The Company writes-down the carrying amount of a deferred tax asset to the extent that it is no longer reasonably certain or virtually certain, as the case may be, that sufficient future taxable income will be available against which deferred tax asset can be realised. Any such write-down is reversed to the extent that it becomes reasonably certain or virtually certain, as the case may be, that sufficient future taxable income will be available.
MAT credit is recognised as an asset only when and to the extent there is convincing evidence that the company will pay normal income tax during the specified period. In the year in which the Minimum Alternative tax (MAT) credit becomes eligible to be recognized as an asset in accordance with the recommendations contained in Guidance Note issued by the Institute of Chartered Accountants of India, the said asset is created by way of a credit to the Consolidated Statement of Profit and Loss and shown as MAT Credit Entitlement. The Company
Notes to Consolidated Financial Statementsfor the year ended March 31, 2013
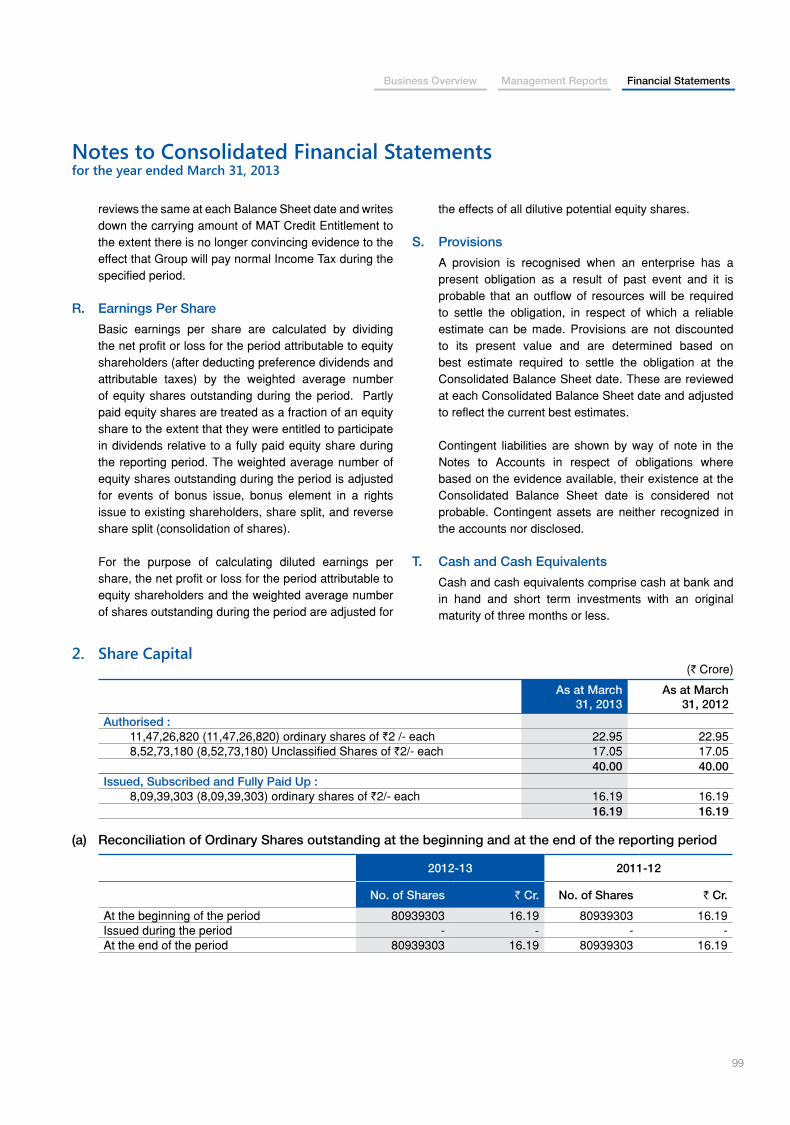
99
Business Overview Management Reports Financial Statements
2. Share Capital(` Crore)
As at March 31, 2013
As at March 31, 2012
Authorised : 11,47,26,820 (11,47,26,820) ordinary shares of `2 /- each 22.95 22.95 8,52,73,180 (8,52,73,180) Unclassified Shares of `2/- each 17.05 17.05 40.00 40.00 Issued, Subscribed and Fully Paid Up : 8,09,39,303 (8,09,39,303) ordinary shares of `2/- each 16.19 16.19 16.19 16.19
(a) Reconciliation of Ordinary Shares outstanding at the beginning and at the end of the reporting period
2012-13 2011-12
No. of Shares ` Cr. No. of Shares ` Cr.
At the beginning of the period 80939303 16.19 80939303 16.19 Issued during the period - - - - At the end of the period 80939303 16.19 80939303 16.19
reviews the same at each Balance Sheet date and writes down the carrying amount of MAT Credit Entitlement to the extent there is no longer convincing evidence to the effect that Group will pay normal Income Tax during the specified period.
R. Earnings Per Share
Basic earnings per share are calculated by dividing the net profit or loss for the period attributable to equity shareholders (after deducting preference dividends and attributable taxes) by the weighted average number of equity shares outstanding during the period. Partly paid equity shares are treated as a fraction of an equity share to the extent that they were entitled to participate in dividends relative to a fully paid equity share during the reporting period. The weighted average number of equity shares outstanding during the period is adjusted for events of bonus issue, bonus element in a rights issue to existing shareholders, share split, and reverse share split (consolidation of shares).
For the purpose of calculating diluted earnings per share, the net profit or loss for the period attributable to equity shareholders and the weighted average number of shares outstanding during the period are adjusted for
the effects of all dilutive potential equity shares.
S. Provisions
A provision is recognised when an enterprise has a present obligation as a result of past event and it is probable that an outflow of resources will be required to settle the obligation, in respect of which a reliable estimate can be made. Provisions are not discounted to its present value and are determined based on best estimate required to settle the obligation at the Consolidated Balance Sheet date. These are reviewed at each Consolidated Balance Sheet date and adjusted to reflect the current best estimates.
Contingent liabilities are shown by way of note in the
Notes to Accounts in respect of obligations where based on the evidence available, their existence at the Consolidated Balance Sheet date is considered not probable. Contingent assets are neither recognized in the accounts nor disclosed.
T. Cash and Cash Equivalents
Cash and cash equivalents comprise cash at bank and in hand and short term investments with an original maturity of three months or less.
Notes to Consolidated Financial Statementsfor the year ended March 31, 2013
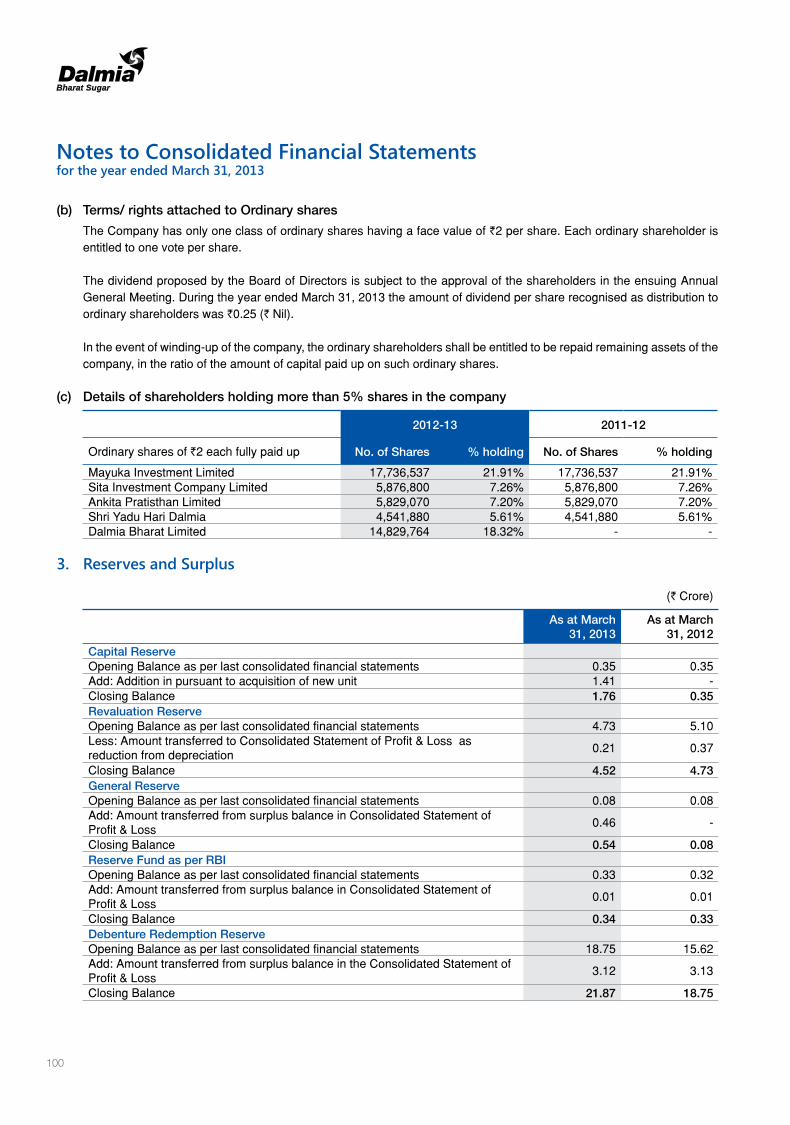
100
(b) Terms/ rights attached to Ordinary shares
The Company has only one class of ordinary shares having a face value of `2 per share. Each ordinary shareholder is entitled to one vote per share.
The dividend proposed by the Board of Directors is subject to the approval of the shareholders in the ensuing Annual General Meeting. During the year ended March 31, 2013 the amount of dividend per share recognised as distribution to ordinary shareholders was `0.25 (` Nil).
In the event of winding-up of the company, the ordinary shareholders shall be entitled to be repaid remaining assets of the company, in the ratio of the amount of capital paid up on such ordinary shares.
(c) Details of shareholders holding more than 5% shares in the company
2012-13 2011-12
Ordinary shares of `2 each fully paid up No. of Shares % holding No. of Shares % holding
Mayuka Investment Limited 17,736,537 21.91% 17,736,537 21.91%Sita Investment Company Limited 5,876,800 7.26% 5,876,800 7.26%Ankita Pratisthan Limited 5,829,070 7.20% 5,829,070 7.20%Shri Yadu Hari Dalmia 4,541,880 5.61% 4,541,880 5.61%Dalmia Bharat Limited 14,829,764 18.32% - -
3. Reserves and Surplus
(` Crore)
As at March 31, 2013
As at March 31, 2012
Capital ReserveOpening Balance as per last consolidated financial statements 0.35 0.35 Add: Addition in pursuant to acquisition of new unit 1.41 - Closing Balance 1.76 0.35 Revaluation ReserveOpening Balance as per last consolidated financial statements 4.73 5.10 Less: Amount transferred to Consolidated Statement of Profit & Loss as reduction from depreciation
0.21 0.37
Closing Balance 4.52 4.73 General ReserveOpening Balance as per last consolidated financial statements 0.08 0.08 Add: Amount transferred from surplus balance in Consolidated Statement of Profit & Loss
0.46 -
Closing Balance 0.54 0.08 Reserve Fund as per RBIOpening Balance as per last consolidated financial statements 0.33 0.32 Add: Amount transferred from surplus balance in Consolidated Statement of Profit & Loss
0.01 0.01
Closing Balance 0.34 0.33 Debenture Redemption Reserve Opening Balance as per last consolidated financial statements 18.75 15.62 Add: Amount transferred from surplus balance in the Consolidated Statement of Profit & Loss
3.12 3.13
Closing Balance 21.87 18.75
Notes to Consolidated Financial Statementsfor the year ended March 31, 2013
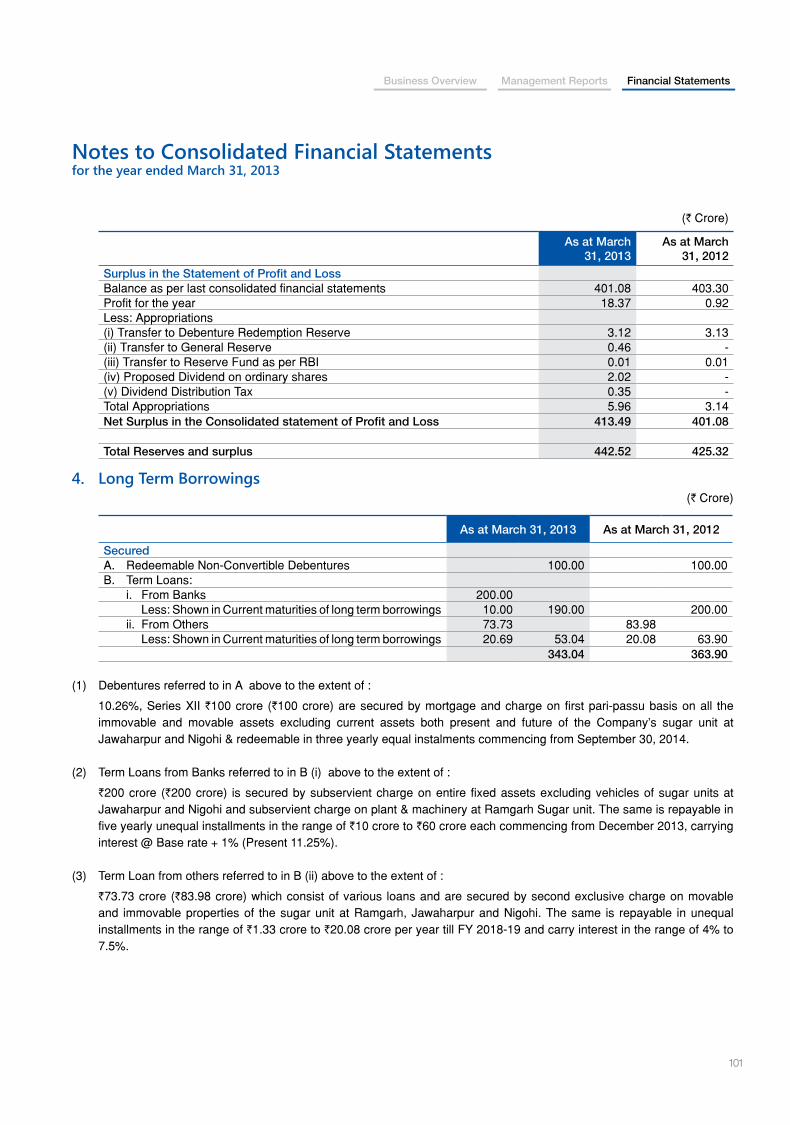
101
Business Overview Management Reports Financial Statements
Notes to Consolidated Financial Statementsfor the year ended March 31, 2013
(` Crore)
As at March 31, 2013
As at March 31, 2012
Surplus in the Statement of Profit and LossBalance as per last consolidated financial statements 401.08 403.30 Profit for the year 18.37 0.92 Less: Appropriations(i) Transfer to Debenture Redemption Reserve 3.12 3.13 (ii) Transfer to General Reserve 0.46 - (iii) Transfer to Reserve Fund as per RBI 0.01 0.01 (iv) Proposed Dividend on ordinary shares 2.02 - (v) Dividend Distribution Tax 0.35 - Total Appropriations 5.96 3.14 Net Surplus in the Consolidated statement of Profit and Loss 413.49 401.08
Total Reserves and surplus 442.52 425.32
4. Long Term Borrowings(` Crore)
As at March 31, 2013 As at March 31, 2012
Secured A. Redeemable Non-Convertible Debentures 100.00 100.00B. Term Loans: i. From Banks 200.00 Less: Shown in Current maturities of long term borrowings 10.00 190.00 200.00 ii. From Others 73.73 83.98 Less: Shown in Current maturities of long term borrowings 20.69 53.04 20.08 63.90
343.04 363.90
(1) Debentures referred to in A above to the extent of :
10.26%, Series XII `100 crore (`100 crore) are secured by mortgage and charge on first pari-passu basis on all the immovable and movable assets excluding current assets both present and future of the Company’s sugar unit at Jawaharpur and Nigohi & redeemable in three yearly equal instalments commencing from September 30, 2014.
(2) Term Loans from Banks referred to in B (i) above to the extent of :
`200 crore (`200 crore) is secured by subservient charge on entire fixed assets excluding vehicles of sugar units at Jawaharpur and Nigohi and subservient charge on plant & machinery at Ramgarh Sugar unit. The same is repayable in five yearly unequal installments in the range of `10 crore to `60 crore each commencing from December 2013, carrying interest @ Base rate + 1% (Present 11.25%).
(3) Term Loan from others referred to in B (ii) above to the extent of :
`73.73 crore (`83.98 crore) which consist of various loans and are secured by second exclusive charge on movable and immovable properties of the sugar unit at Ramgarh, Jawaharpur and Nigohi. The same is repayable in unequal installments in the range of `1.33 crore to `20.08 crore per year till FY 2018-19 and carry interest in the range of 4% to 7.5%.
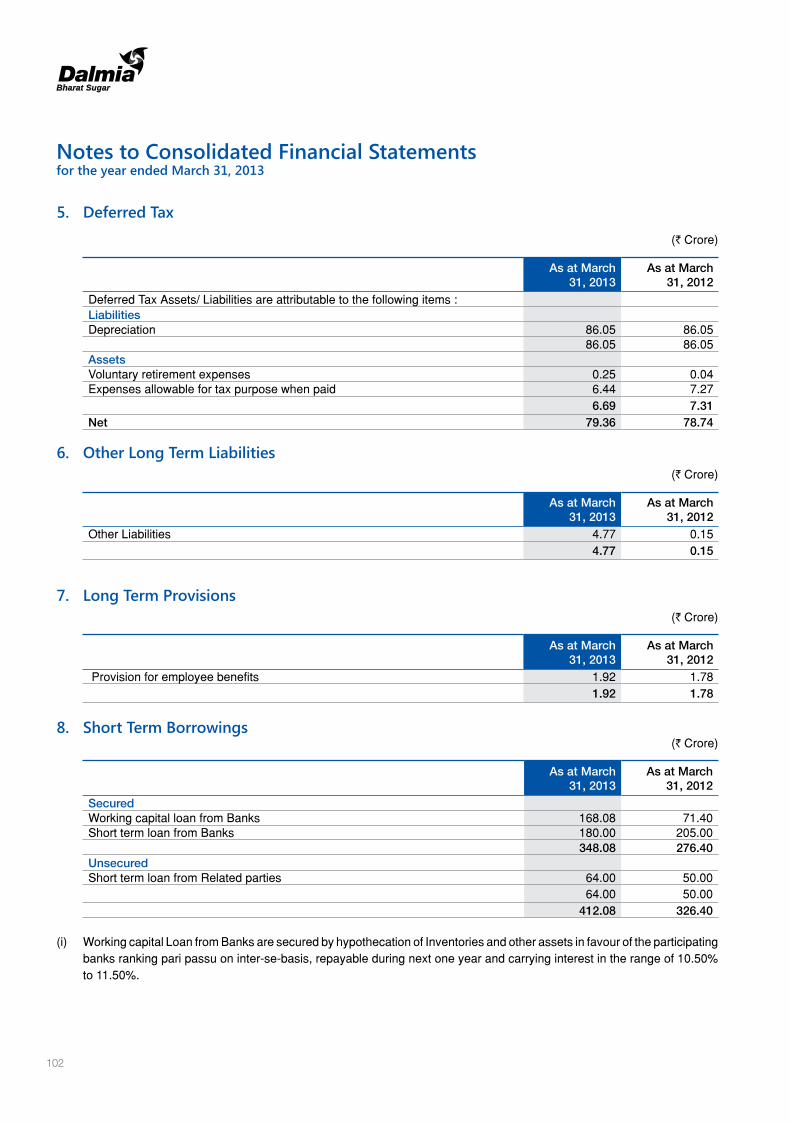
102
5. Deferred Tax
(` Crore) As at March
31, 2013As at March
31, 2012Deferred Tax Assets/ Liabilities are attributable to the following items :LiabilitiesDepreciation 86.05 86.05
86.05 86.05 AssetsVoluntary retirement expenses 0.25 0.04 Expenses allowable for tax purpose when paid 6.44 7.27
6.69 7.31 Net 79.36 78.74
6. Other Long Term Liabilities (` Crore)
As at March 31, 2013
As at March 31, 2012
Other Liabilities 4.77 0.15 4.77 0.15
7. Long Term Provisions(` Crore)
As at March 31, 2013
As at March 31, 2012
Provision for employee benefits 1.92 1.78 1.92 1.78
8. Short Term Borrowings(` Crore)
As at March 31, 2013
As at March 31, 2012
SecuredWorking capital loan from Banks 168.08 71.40 Short term loan from Banks 180.00 205.00 348.08 276.40 UnsecuredShort term loan from Related parties 64.00 50.00
64.00 50.00 412.08 326.40
(i) Working capital Loan from Banks are secured by hypothecation of Inventories and other assets in favour of the participating banks ranking pari passu on inter-se-basis, repayable during next one year and carrying interest in the range of 10.50% to 11.50%.
Notes to Consolidated Financial Statementsfor the year ended March 31, 2013
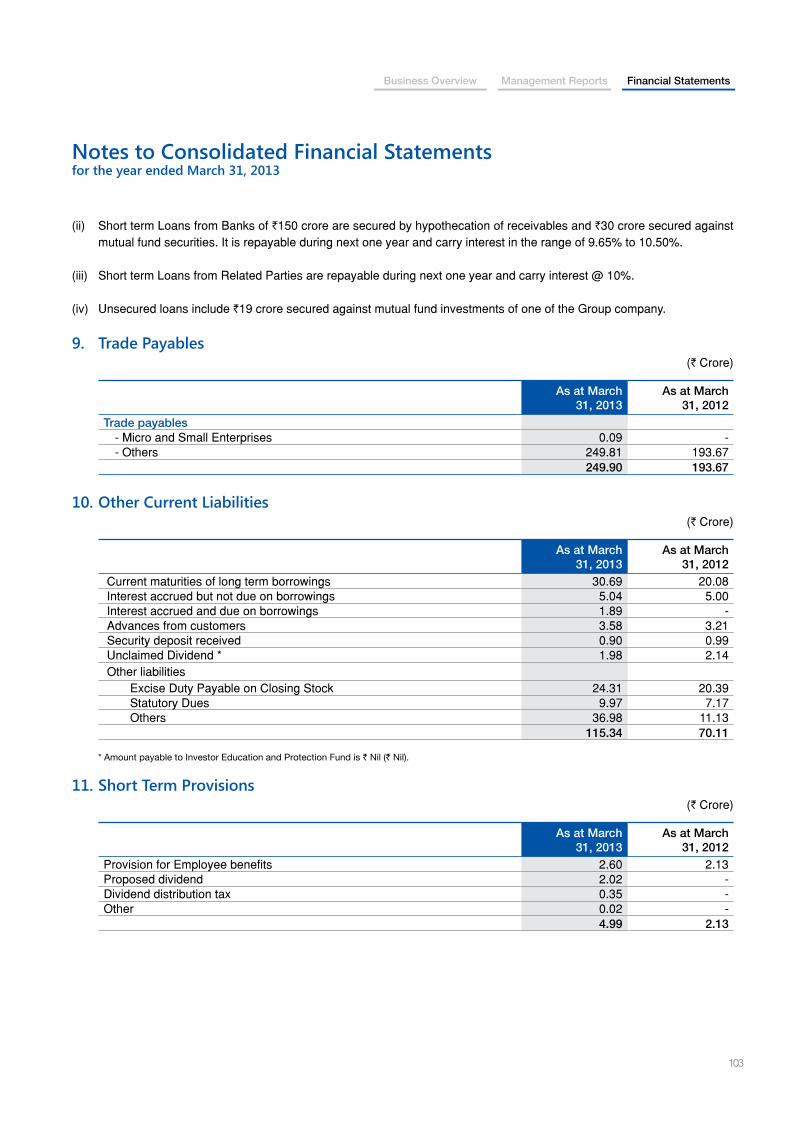
103
Business Overview Management Reports Financial Statements
Notes to Consolidated Financial Statementsfor the year ended March 31, 2013
(ii) Short term Loans from Banks of `150 crore are secured by hypothecation of receivables and `30 crore secured against mutual fund securities. It is repayable during next one year and carry interest in the range of 9.65% to 10.50%.
(iii) Short term Loans from Related Parties are repayable during next one year and carry interest @ 10%.
(iv) Unsecured loans include `19 crore secured against mutual fund investments of one of the Group company.
9. Trade Payables (` Crore)
As at March 31, 2013
As at March 31, 2012
Trade payables - Micro and Small Enterprises 0.09 - - Others 249.81 193.67 249.90 193.67
10. Other Current Liabilities(` Crore)
As at March 31, 2013
As at March 31, 2012
Current maturities of long term borrowings 30.69 20.08 Interest accrued but not due on borrowings 5.04 5.00 Interest accrued and due on borrowings 1.89 - Advances from customers 3.58 3.21 Security deposit received 0.90 0.99 Unclaimed Dividend * 1.98 2.14 Other liabilities Excise Duty Payable on Closing Stock 24.31 20.39 Statutory Dues 9.97 7.17 Others 36.98 11.13
115.34 70.11
* Amount payable to Investor Education and Protection Fund is ` Nil (` Nil).
11. Short Term Provisions(` Crore)
As at March 31, 2013
As at March 31, 2012
Provision for Employee benefits 2.60 2.13 Proposed dividend 2.02 - Dividend distribution tax 0.35 - Other 0.02 -
4.99 2.13

104
Notes to Consolidated Financial Statementsfor the year ended March 31, 2013
12. Fixed Assets(` Crore)
ParticularsTangible Assets
Intangible Assets
Total
Land (Freehold)
Land (Leasehold)
BuildingsPlant and
EquipmentFurniture and
FixturesVehicles
Office Equipment
Computer Software
Costas at March 31,2011 21.08 0.59 115.43 787.32 3.91 1.54 2.76 0.03 932.66 Additions 0.09 0.06 0.51 19.50 0.09 0.15 0.36 0.10 20.86 Disposals 0.10 - 0.03 0.61 - 0.03 0.10 - 0.87 as at March 31,2012 21.07 0.65 115.91 806.21 4.00 1.66 3.02 0.13 952.65 Additions 34.58 - 14.51 83.61 1.23 0.58 1.02 0.09 135.62 Disposals - 0.01 - 11.43 0.02 0.07 0.61 - 12.14 as at March 31,2013 55.65 0.64 130.42 878.39 5.21 2.17 3.43 0.22 1,076.13 Depreciation / Amortisationas at March 31,2011 - 0.10 24.11 306.57 2.28 0.89 2.63 0.02 336.60 Charge for the year @ - 0.01 2.75 38.90 0.17 0.05 0.42 0.02 42.32 Disposals - - - 0.43 - 0.03 0.04 - 0.50 as at March 31,2012 - 0.11 26.86 345.04 2.45 0.91 3.01 0.04 378.42 Charge for the year @ 0.01 3.02 69.08 0.46 0.10 0.37 0.04 73.08 Disposals - - - 10.40 0.00 0.03 0.48 - 10.91 as at March 31,2013 - 0.12 29.88 403.72 2.91 0.98 2.90 0.08 440.59 Net Blockas at March 31,2012 21.07 0.54 89.05 461.17 1.55 0.75 0.01 0.09 574.23 as at March 31,2013 55.65 0.52 100.54 474.67 2.30 1.19 0.53 0.14 635.54
@ includes depreciation charged to other heads `0.07 crore (`0.13 crore).
13. Non-Current Investments (` Crore)
As at March 31, 2013
As at March 31, 2012
Unquoted Shares of Co-operative Societies (Unquoted) DMC Employees Co-op Stores Limited ((2500)) ((3010)) Government or Trust Securities (Unquoted) National Saving Certificates ((23000)) ((23000))Investments Companies other than SubsidiariesEquity Shares (Quoted)942567 (250000) Equity shares of `2 each fully paid up in Dalmia Bharat Limited
9.90 0.05
203655 (203655) Equity shares of `10 each, fully paid up of Poddar Pigments Limited
0.67 0.67
Mutual FundQuoted - Debt Based Scheme 7.47 5.22
18.04 5.94 Quoted Investments : Book Value 10.57 0.72 Aggregate Market Value 16.98 10.38 Book Value of Unquoted Investments ((25500)) ((26010))
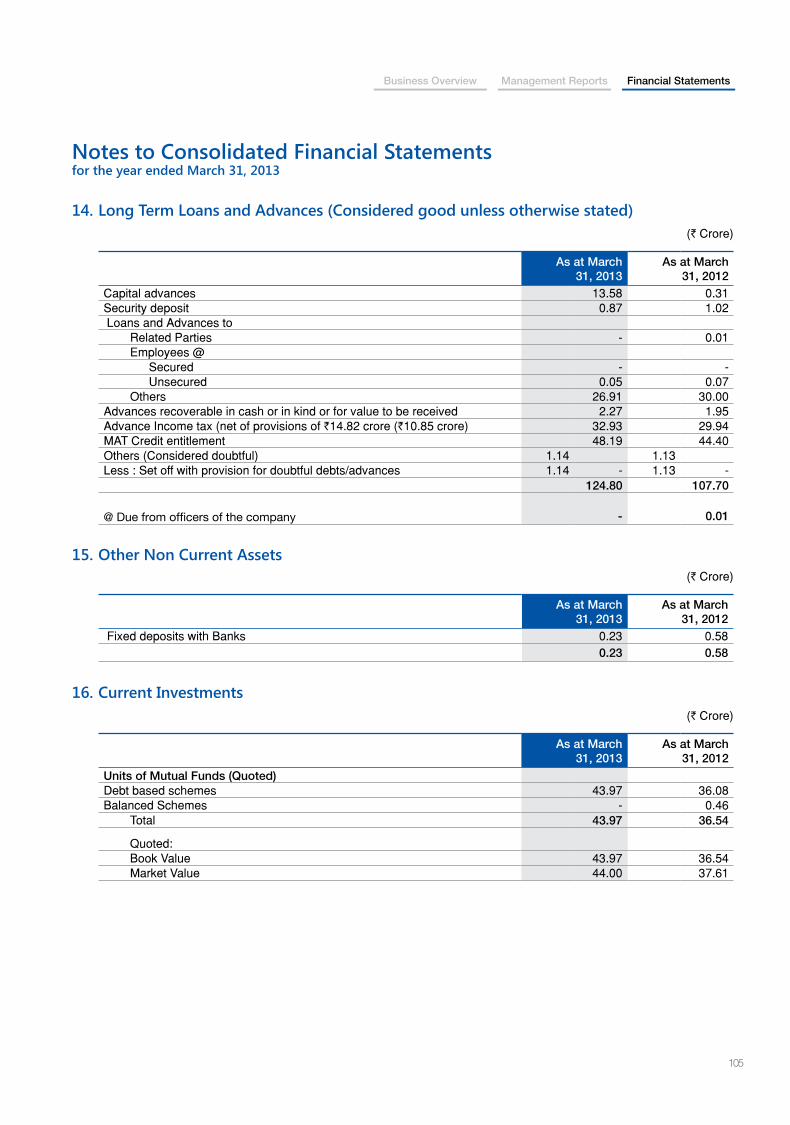
105
Business Overview Management Reports Financial Statements
Notes to Consolidated Financial Statementsfor the year ended March 31, 2013
14. Long Term Loans and Advances (Considered good unless otherwise stated)(` Crore)
As at March 31, 2013
As at March 31, 2012
Capital advances 13.58 0.31 Security deposit 0.87 1.02 Loans and Advances to Related Parties - 0.01 Employees @
Secured - - Unsecured 0.05 0.07
Others 26.91 30.00 Advances recoverable in cash or in kind or for value to be received 2.27 1.95 Advance Income tax (net of provisions of `14.82 crore (`10.85 crore) 32.93 29.94 MAT Credit entitlement 48.19 44.40 Others (Considered doubtful) 1.14 1.13 Less : Set off with provision for doubtful debts/advances 1.14 - 1.13 -
124.80 107.70
@ Due from officers of the company - 0.01
15. Other Non Current Assets (` Crore)
As at March 31, 2013
As at March 31, 2012
Fixed deposits with Banks 0.23 0.58 0.23 0.58
16. Current Investments(` Crore)
As at March 31, 2013
As at March 31, 2012
Units of Mutual Funds (Quoted) Debt based schemes 43.97 36.08 Balanced Schemes - 0.46 Total 43.97 36.54
Quoted: Book Value 43.97 36.54 Market Value 44.00 37.61
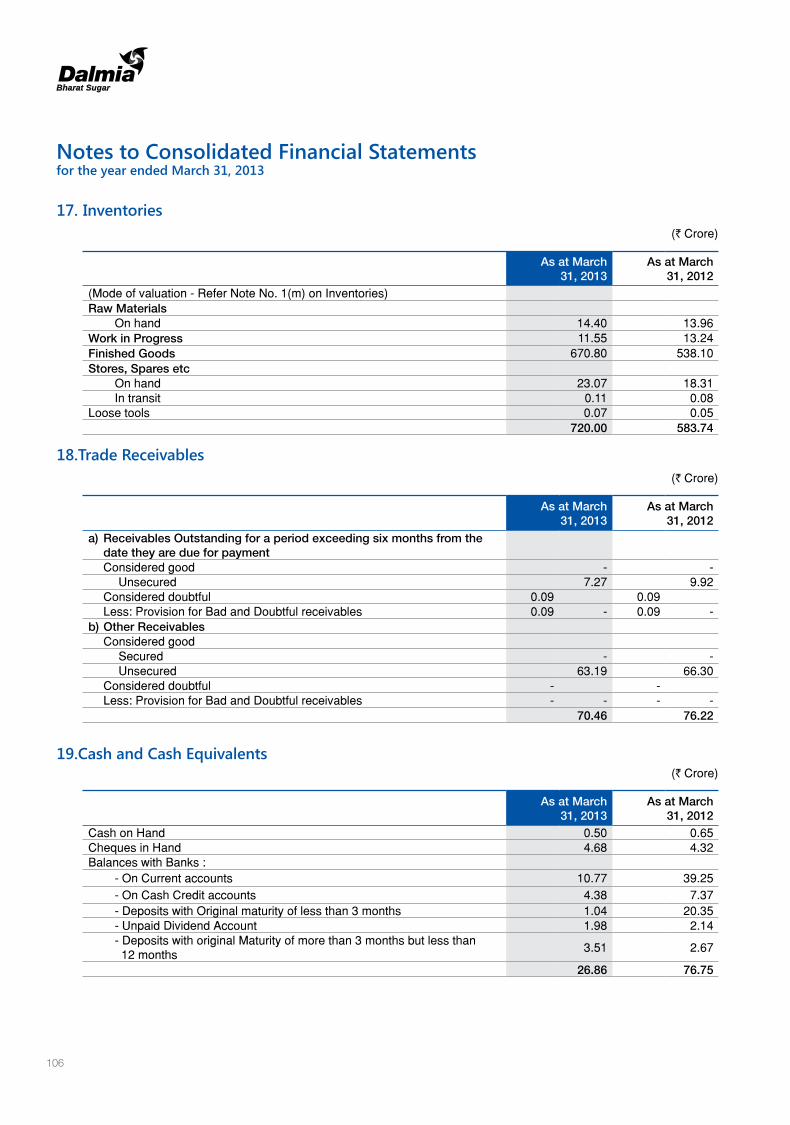
106
17. Inventories(` Crore)
As at March 31, 2013
As at March 31, 2012
(Mode of valuation - Refer Note No. 1(m) on Inventories)Raw Materials On hand 14.40 13.96 Work in Progress 11.55 13.24 Finished Goods 670.80 538.10 Stores, Spares etc On hand 23.07 18.31 In transit 0.11 0.08 Loose tools 0.07 0.05
720.00 583.74
18.Trade Receivables(` Crore)
As at March 31, 2013
As at March 31, 2012
a) Receivables Outstanding for a period exceeding six months from the date they are due for payment
Considered good - - Unsecured 7.27 9.92 Considered doubtful 0.09 0.09 Less: Provision for Bad and Doubtful receivables 0.09 - 0.09 - b) Other Receivables Considered good Secured - - Unsecured 63.19 66.30 Considered doubtful - - Less: Provision for Bad and Doubtful receivables - - - -
70.46 76.22
19.Cash and Cash Equivalents(` Crore)
As at March 31, 2013
As at March 31, 2012
Cash on Hand 0.50 0.65 Cheques in Hand 4.68 4.32 Balances with Banks : - On Current accounts 10.77 39.25 - On Cash Credit accounts 4.38 7.37 - Deposits with Original maturity of less than 3 months 1.04 20.35 - Unpaid Dividend Account 1.98 2.14 - Deposits with original Maturity of more than 3 months but less than 12 months
3.51 2.67
26.86 76.75
Notes to Consolidated Financial Statementsfor the year ended March 31, 2013
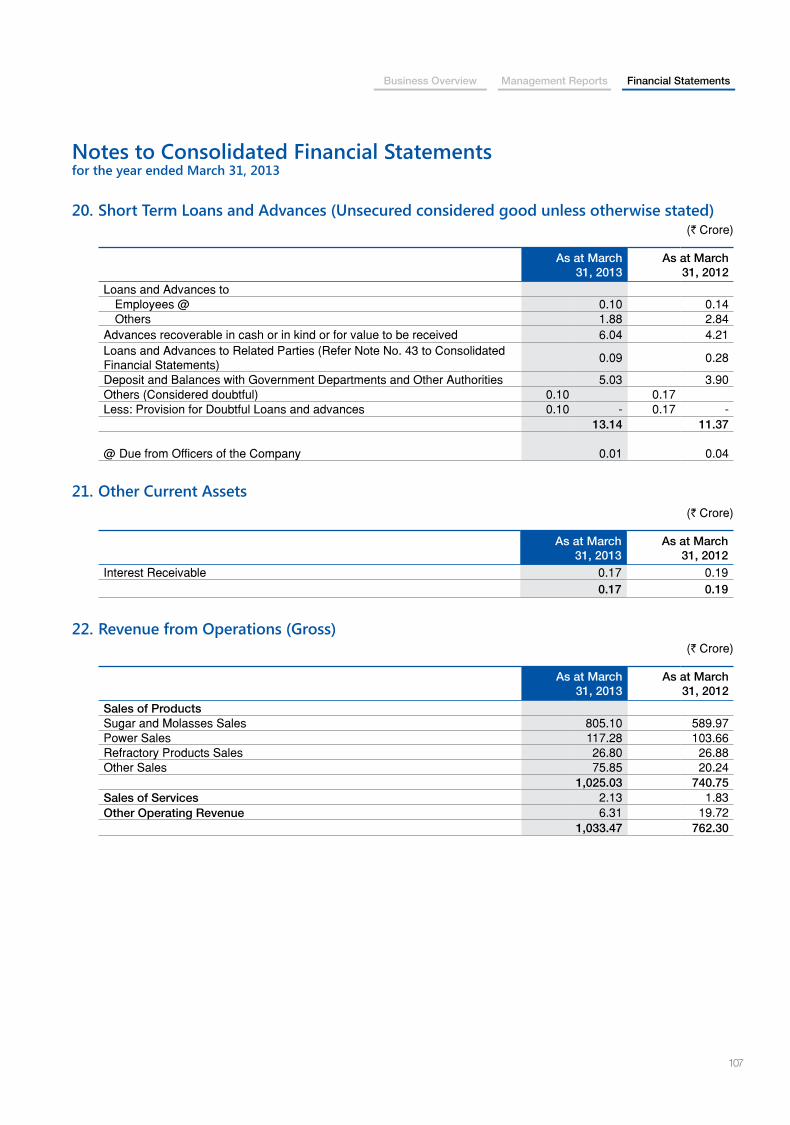
107
Business Overview Management Reports Financial Statements
Notes to Consolidated Financial Statementsfor the year ended March 31, 2013
20. Short Term Loans and Advances (Unsecured considered good unless otherwise stated)(` Crore)
As at March 31, 2013
As at March 31, 2012
Loans and Advances to Employees @ 0.10 0.14 Others 1.88 2.84
Advances recoverable in cash or in kind or for value to be received 6.04 4.21 Loans and Advances to Related Parties (Refer Note No. 43 to Consolidated Financial Statements)
0.09 0.28
Deposit and Balances with Government Departments and Other Authorities 5.03 3.90 Others (Considered doubtful) 0.10 0.17 Less: Provision for Doubtful Loans and advances 0.10 - 0.17 -
13.14 11.37
@ Due from Officers of the Company
0.01
0.04
21. Other Current Assets (` Crore)
As at March 31, 2013
As at March 31, 2012
Interest Receivable 0.17 0.19 0.17 0.19
22. Revenue from Operations (Gross)(` Crore)
As at March 31, 2013
As at March 31, 2012
Sales of ProductsSugar and Molasses Sales 805.10 589.97 Power Sales 117.28 103.66 Refractory Products Sales 26.80 26.88 Other Sales 75.85 20.24
1,025.03 740.75 Sales of Services 2.13 1.83 Other Operating Revenue 6.31 19.72
1,033.47 762.30
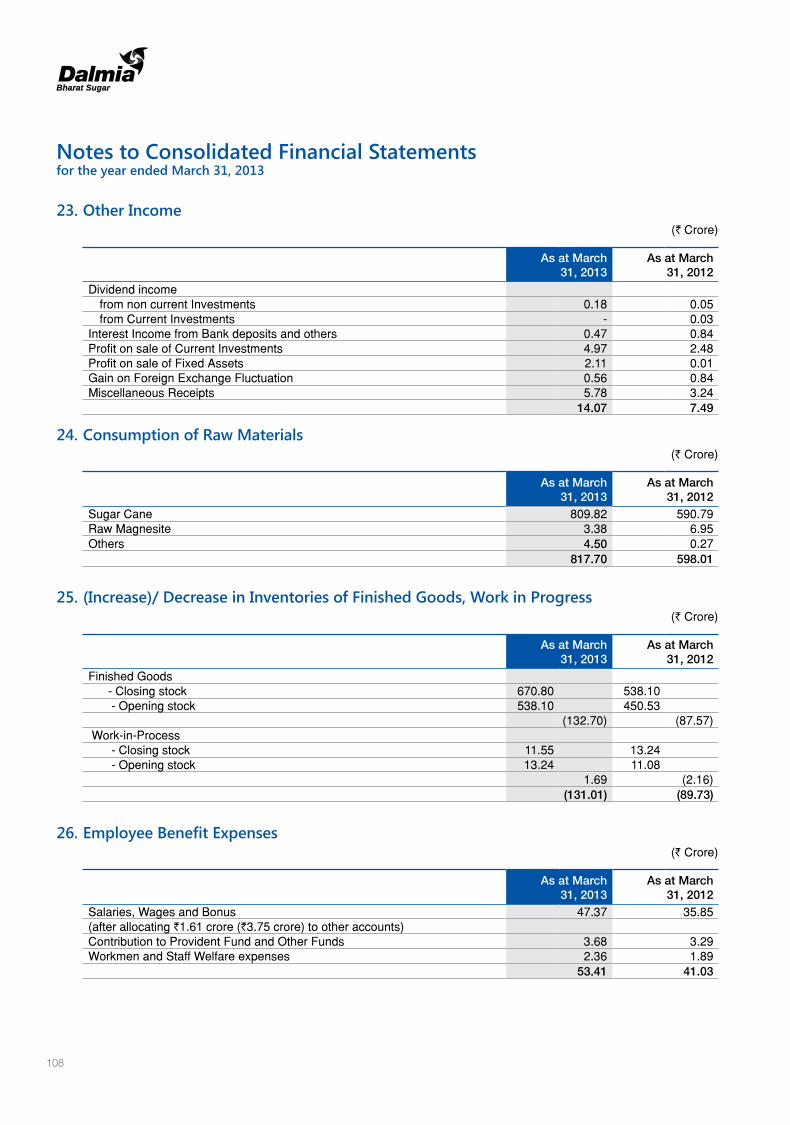
108
23. Other Income(` Crore)
As at March 31, 2013
As at March 31, 2012
Dividend incomefrom non current Investments 0.18 0.05 from Current Investments - 0.03
Interest Income from Bank deposits and others 0.47 0.84 Profit on sale of Current Investments 4.97 2.48 Profit on sale of Fixed Assets 2.11 0.01 Gain on Foreign Exchange Fluctuation 0.56 0.84 Miscellaneous Receipts 5.78 3.24
14.07 7.49
24. Consumption of Raw Materials(` Crore)
As at March 31, 2013
As at March 31, 2012
Sugar Cane 809.82 590.79 Raw Magnesite 3.38 6.95 Others 4.50 0.27
817.70 598.01
25. (Increase)/ Decrease in Inventories of Finished Goods, Work in Progress(` Crore)
As at March 31, 2013
As at March 31, 2012
Finished Goods - Closing stock 670.80 538.10 - Opening stock 538.10 450.53
(132.70) (87.57) Work-in-Process - Closing stock 11.55 13.24 - Opening stock 13.24 11.08
1.69 (2.16)(131.01) (89.73)
26. Employee Benefit Expenses(` Crore)
As at March 31, 2013
As at March 31, 2012
Salaries, Wages and Bonus 47.37 35.85 (after allocating `1.61 crore (`3.75 crore) to other accounts)Contribution to Provident Fund and Other Funds 3.68 3.29 Workmen and Staff Welfare expenses 2.36 1.89
53.41 41.03
Notes to Consolidated Financial Statementsfor the year ended March 31, 2013

109
Business Overview Management Reports Financial Statements
Notes to Consolidated Financial Statementsfor the year ended March 31, 2013
27. Other Expenses(` Crore)
As at March 31, 2013
As at March 31, 2012
Power and Fuel 14.86 28.77 Packing Materials 12.22 10.63 Consumption of Stores and Spares Parts 10.44 7.79 (after allocating `35.52 crore (`22.38 crore) to other accounts)Excise duty variation on opening/closing stock 4.51 1.87 Repairs and Maintenance: - Plant & Machinery 20.18 13.89 - Buildings 2.77 1.87 - Others 0.91 1.07 Rent 0.39 0.21 Rates and Taxes 1.24 0.91 Insurance 0.71 0.52 Travelling 1.35 1.23 Advertisement and Publicity 0.31 0.75 Freight and Forwarding Charges 0.60 0.48 Cane Development Expenses 5.27 7.80 Management Service Charges 9.87 5.35 Selling Expenses 0.15 0.01 Commission paid to Other Selling Agents 1.07 1.24 Rebates, Discount and Allowances 0.19 1.47 Director's Sitting Fees 0.07 0.07 Charity and Donation 0.07 0.19 Assets written off / Loss on sale of Fixed Assets 0.05 0.02 Provision for Doubtful Debts 0.05 0.25 Miscellaneous Expenses 20.28 13.80
107.56 100.19
28. Financial Costs(` Crore)
As at March 31, 2013
As at March 31, 2012
Interest - On Term loans and Debentures 36.73 39.65 - On Borrowing from Banks 24.88 5.38 - Others 3.04 3.97 Other Borrowing Costs 0.90 1.25
65.55 50.25
29. Earning Per Share(` Crore)
As at March 31, 2013
As at March 31, 2012
Net profit for calculation of basic and diluted EPS (` crore) 18.37 0.92 Total number of equity shares outstanding at the end of the year 80939303 80939303 Weighted average number of equity shares in calculating basic and diluted EPS
80939303 80939303
Basic and Diluted EPS (`) 2.27 0.11
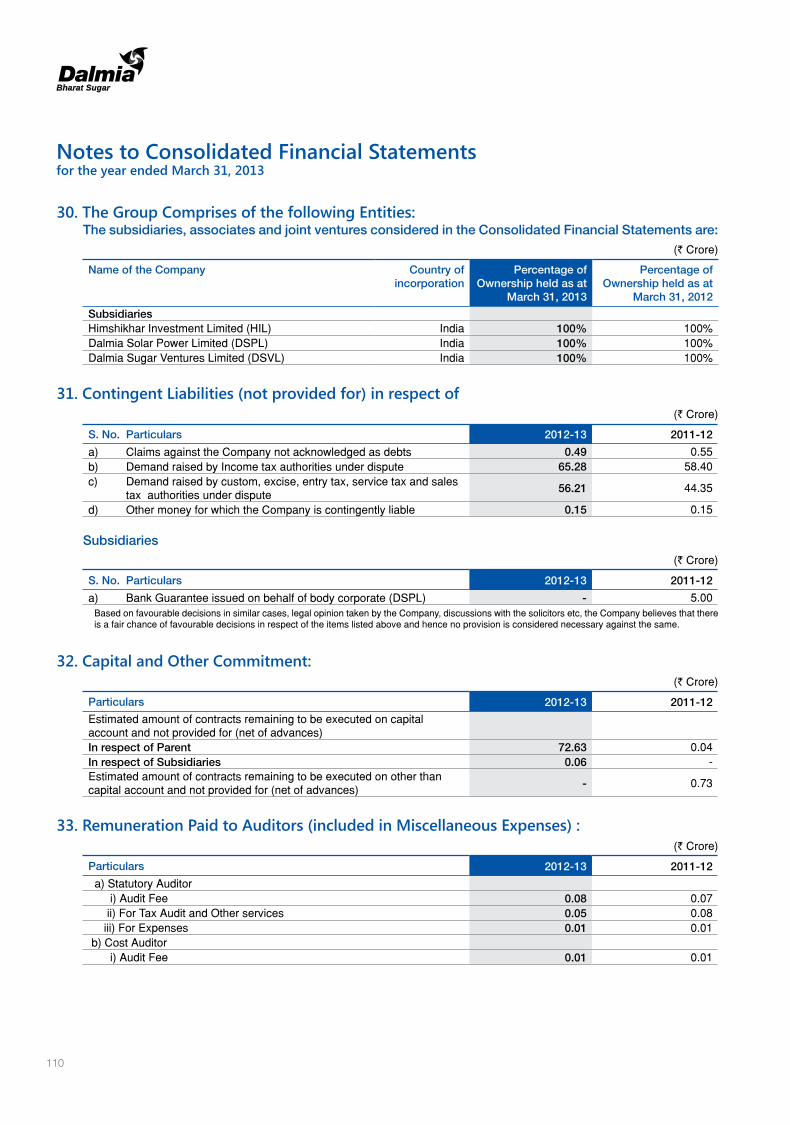
110
30. The Group Comprises of the following Entities: The subsidiaries, associates and joint ventures considered in the Consolidated Financial Statements are:
(` Crore)
Name of the Company Country of incorporation
Percentage of Ownership held as at
March 31, 2013
Percentage of Ownership held as at
March 31, 2012
SubsidiariesHimshikhar Investment Limited (HIL) India 100% 100%Dalmia Solar Power Limited (DSPL) India 100% 100%Dalmia Sugar Ventures Limited (DSVL) India 100% 100%
31. Contingent Liabilities (not provided for) in respect of(` Crore)
S. No. Particulars 2012-13 2011-12
a) Claims against the Company not acknowledged as debts 0.49 0.55b) Demand raised by Income tax authorities under dispute 65.28 58.40c) Demand raised by custom, excise, entry tax, service tax and sales
tax authorities under dispute56.21 44.35
d) Other money for which the Company is contingently liable 0.15 0.15
Subsidiaries(` Crore)
S. No. Particulars 2012-13 2011-12
a) Bank Guarantee issued on behalf of body corporate (DSPL) - 5.00 Based on favourable decisions in similar cases, legal opinion taken by the Company, discussions with the solicitors etc, the Company believes that there
is a fair chance of favourable decisions in respect of the items listed above and hence no provision is considered necessary against the same.
32. Capital and Other Commitment:(` Crore)
Particulars 2012-13 2011-12
Estimated amount of contracts remaining to be executed on capital account and not provided for (net of advances) In respect of Parent 72.63 0.04In respect of Subsidiaries 0.06 -Estimated amount of contracts remaining to be executed on other than capital account and not provided for (net of advances) - 0.73
33. Remuneration Paid to Auditors (included in Miscellaneous Expenses) :(` Crore)
Particulars 2012-13 2011-12
a) Statutory Auditor i) Audit Fee 0.08 0.07 ii) For Tax Audit and Other services 0.05 0.08 iii) For Expenses 0.01 0.01 b) Cost Auditor i) Audit Fee 0.01 0.01
Notes to Consolidated Financial Statementsfor the year ended March 31, 2013
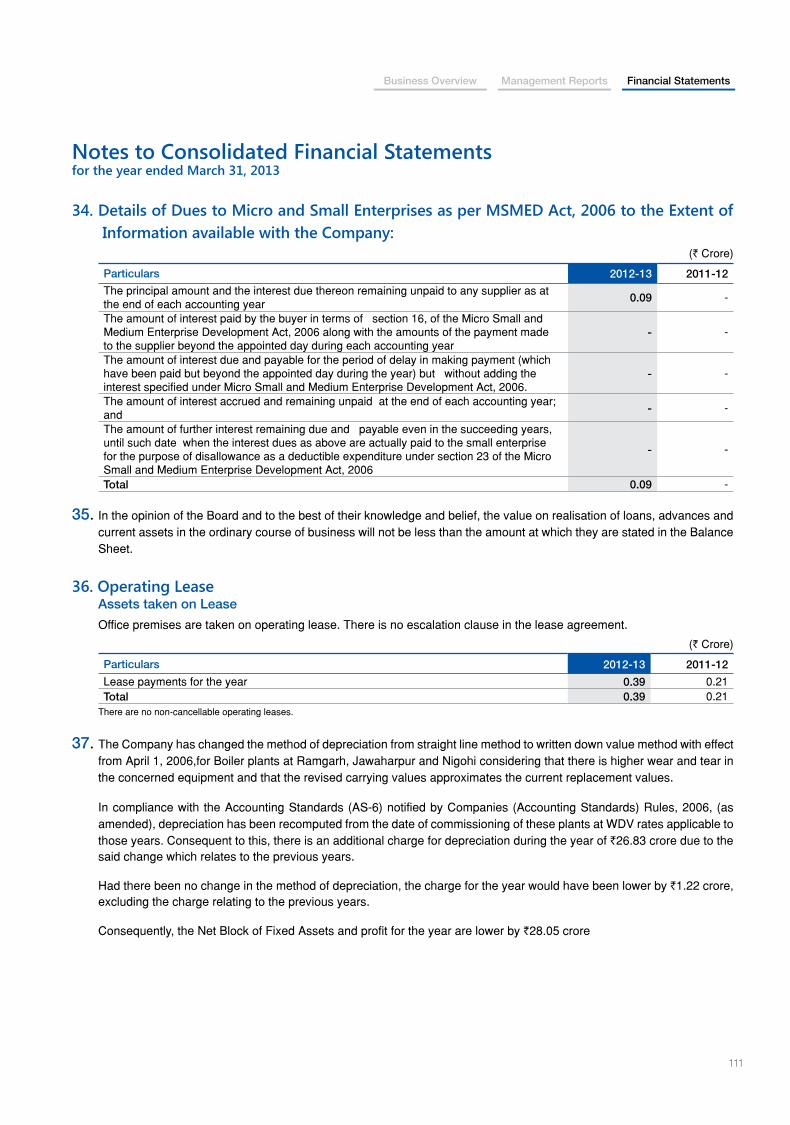
111
Business Overview Management Reports Financial Statements
Notes to Consolidated Financial Statementsfor the year ended March 31, 2013
34. Details of Dues to Micro and Small Enterprises as per MSMED Act, 2006 to the Extent of Information available with the Company:
(` Crore)
Particulars 2012-13 2011-12
The principal amount and the interest due thereon remaining unpaid to any supplier as at the end of each accounting year 0.09 -
The amount of interest paid by the buyer in terms of section 16, of the Micro Small and Medium Enterprise Development Act, 2006 along with the amounts of the payment made to the supplier beyond the appointed day during each accounting year
- -
The amount of interest due and payable for the period of delay in making payment (which have been paid but beyond the appointed day during the year) but without adding the interest specified under Micro Small and Medium Enterprise Development Act, 2006.
- -
The amount of interest accrued and remaining unpaid at the end of each accounting year; and - -
The amount of further interest remaining due and payable even in the succeeding years, until such date when the interest dues as above are actually paid to the small enterprise for the purpose of disallowance as a deductible expenditure under section 23 of the Micro Small and Medium Enterprise Development Act, 2006
- -
Total 0.09 -
35. In the opinion of the Board and to the best of their knowledge and belief, the value on realisation of loans, advances and current assets in the ordinary course of business will not be less than the amount at which they are stated in the Balance Sheet.
36. Operating Lease Assets taken on Lease
Office premises are taken on operating lease. There is no escalation clause in the lease agreement.
(` Crore)
Particulars 2012-13 2011-12
Lease payments for the year 0.39 0.21Total 0.39 0.21
There are no non-cancellable operating leases.
37. The Company has changed the method of depreciation from straight line method to written down value method with effect from April 1, 2006,for Boiler plants at Ramgarh, Jawaharpur and Nigohi considering that there is higher wear and tear in the concerned equipment and that the revised carrying values approximates the current replacement values.
In compliance with the Accounting Standards (AS-6) notified by Companies (Accounting Standards) Rules, 2006, (as amended), depreciation has been recomputed from the date of commissioning of these plants at WDV rates applicable to those years. Consequent to this, there is an additional charge for depreciation during the year of `26.83 crore due to the said change which relates to the previous years.
Had there been no change in the method of depreciation, the charge for the year would have been lower by `1.22 crore, excluding the charge relating to the previous years.
Consequently, the Net Block of Fixed Assets and profit for the year are lower by `28.05 crore
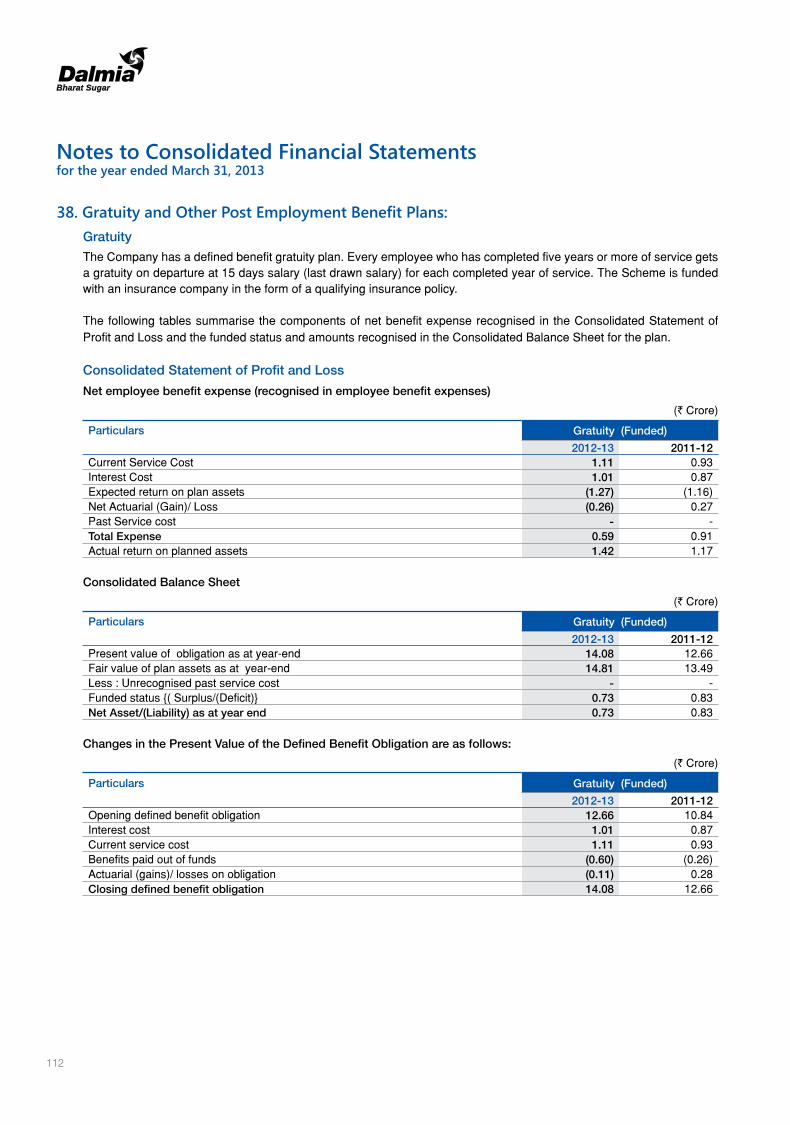
112
Notes to Consolidated Financial Statementsfor the year ended March 31, 2013
38. Gratuity and Other Post Employment Benefit Plans: Gratuity
The Company has a defined benefit gratuity plan. Every employee who has completed five years or more of service gets a gratuity on departure at 15 days salary (last drawn salary) for each completed year of service. The Scheme is funded with an insurance company in the form of a qualifying insurance policy.
The following tables summarise the components of net benefit expense recognised in the Consolidated Statement of Profit and Loss and the funded status and amounts recognised in the Consolidated Balance Sheet for the plan.
Consolidated Statement of Profit and Loss
Net employee benefit expense (recognised in employee benefit expenses)
(` Crore)
Particulars Gratuity (Funded)
2012-13 2011-12Current Service Cost 1.11 0.93Interest Cost 1.01 0.87Expected return on plan assets (1.27) (1.16)Net Actuarial (Gain)/ Loss (0.26) 0.27Past Service cost - -Total Expense 0.59 0.91Actual return on planned assets 1.42 1.17
Consolidated Balance Sheet
(` Crore)
Particulars Gratuity (Funded)
2012-13 2011-12Present value of obligation as at year-end 14.08 12.66Fair value of plan assets as at year-end 14.81 13.49Less : Unrecognised past service cost - -Funded status {( Surplus/(Deficit)} 0.73 0.83Net Asset/(Liability) as at year end 0.73 0.83
Changes in the Present Value of the Defined Benefit Obligation are as follows:
(` Crore)
Particulars Gratuity (Funded)
2012-13 2011-12Opening defined benefit obligation 12.66 10.84Interest cost 1.01 0.87Current service cost 1.11 0.93Benefits paid out of funds (0.60) (0.26)Actuarial (gains)/ losses on obligation (0.11) 0.28Closing defined benefit obligation 14.08 12.66

113
Business Overview Management Reports Financial Statements
Notes to Consolidated Financial Statementsfor the year ended March 31, 2013
Changes in the Fair Value of Plan Assets are as follows:
(` Crore)
Particulars Gratuity (Funded)
2012-13 2011-12Opening fair value of plan assets 13.49 12.33Expected return 1.27 1.16Contribution by employer 0.50 0.25Benefits paid (0.60) (0.26)Actuarial gains/ (losses) on obligation 0.15 0.01Closing fair value of plan assets 14.81 13.49
The Company expects to contribute `1.78 crore (`0.50 crore) to gratuity in 2013-14.
The Major Categories of Plan Assets as a Percentage of the Fair Value of Total Plan Assets are as follows:
Particulars Gratuity (Funded)
2012-13 2011-12Qualifying Insurance Policy 100% 100%
The overall expected rate of return on assets is determined based on the market prices prevailing on that date, applicable to the period over which the
obligation is to be settled.
The Principal Assumptions used in determining Gratuity for the Company’s plans are shown below:
Particulars Gratuity (Funded)
2012-13 2011-12Discount Rate 8.00% 8.00%Expected rate of return on assets 9.40% 9.40%Mortality Table LIC (1994-96) LIC (1994-96) Salary Escalation 7.00% 7.00%
The estimates of future salary increases, considered in actuarial valuation, take into account inflation, seniority, promotion and other relevant factors, such
as supply and demand in the employment market.
Amounts for the Current and previous four years in respect of Gratuity are as follows: (` Crore)
Particulars Gratuity (Funded)
2012-13 2011-12 2010-11 2009-10 2008-09Defined benefit obligation 14.08 12.66 10.84 19.28 16.09Plan assets 14.81 13.49 12.33 21.46 15.02Surplus/ (deficit) 0.73 0.83 1.49 2.18 (1.07)Experience adjustment on plan assets 0.15 0.04 (0.40) 1.80 0.07Experience adjustment on plan liabilities 0.11 (0.28) (11.69) (1.09) 0.83
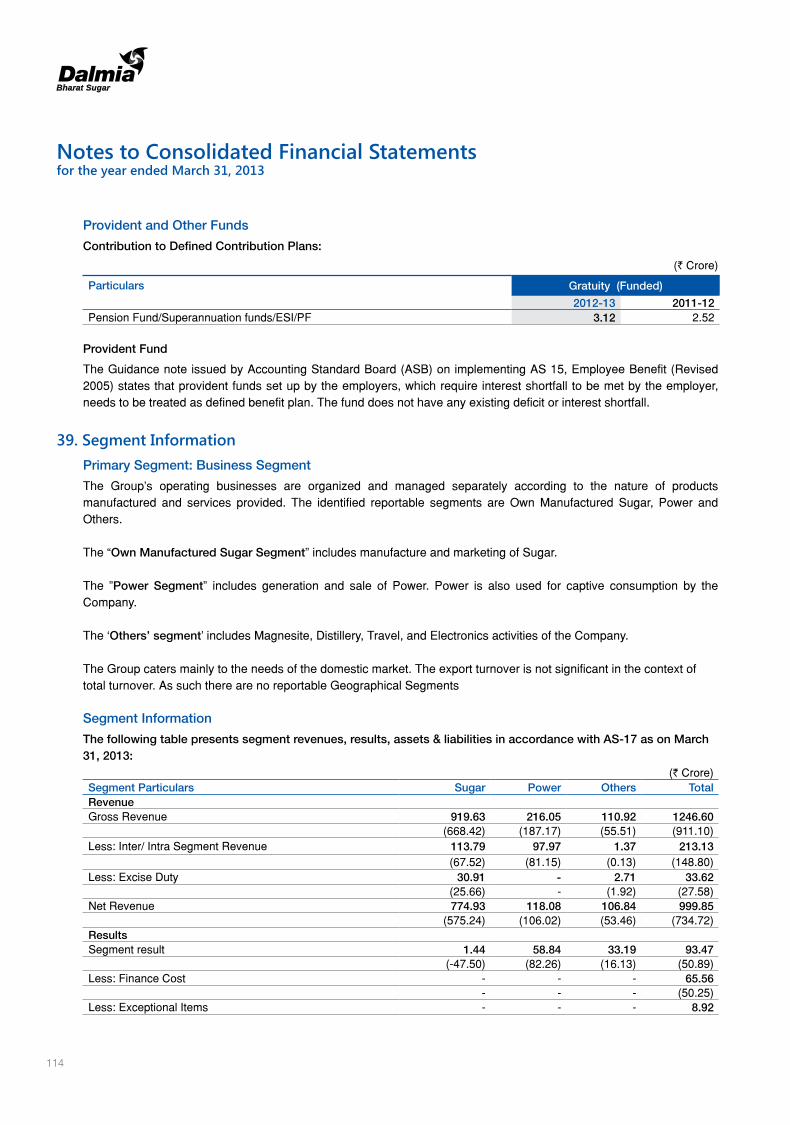
114
Notes to Consolidated Financial Statementsfor the year ended March 31, 2013
Provident and Other Funds
Contribution to Defined Contribution Plans:
(` Crore)
Particulars Gratuity (Funded)
2012-13 2011-12Pension Fund/Superannuation funds/ESI/PF 3.12 2.52
Provident Fund
The Guidance note issued by Accounting Standard Board (ASB) on implementing AS 15, Employee Benefit (Revised 2005) states that provident funds set up by the employers, which require interest shortfall to be met by the employer, needs to be treated as defined benefit plan. The fund does not have any existing deficit or interest shortfall.
39. Segment Information Primary Segment: Business Segment
The Group’s operating businesses are organized and managed separately according to the nature of products manufactured and services provided. The identified reportable segments are Own Manufactured Sugar, Power and Others.
The “Own Manufactured Sugar Segment” includes manufacture and marketing of Sugar.
The ”Power Segment” includes generation and sale of Power. Power is also used for captive consumption by the Company.
The ‘Others’ segment’ includes Magnesite, Distillery, Travel, and Electronics activities of the Company.
The Group caters mainly to the needs of the domestic market. The export turnover is not significant in the context of total turnover. As such there are no reportable Geographical Segments
Segment Information
The following table presents segment revenues, results, assets & liabilities in accordance with AS-17 as on March 31, 2013:
(` Crore)Segment Particulars Sugar Power Others TotalRevenue Gross Revenue 919.63 216.05 110.92 1246.60
(668.42) (187.17) (55.51) (911.10)Less: Inter/ Intra Segment Revenue 113.79 97.97 1.37 213.13
(67.52) (81.15) (0.13) (148.80)Less: Excise Duty 30.91 - 2.71 33.62
(25.66) - (1.92) (27.58)Net Revenue 774.93 118.08 106.84 999.85
(575.24) (106.02) (53.46) (734.72)Results Segment result 1.44 58.84 33.19 93.47
(-47.50) (82.26) (16.13) (50.89)Less: Finance Cost - - - 65.56
- - - (50.25)Less: Exceptional Items - - - 8.92
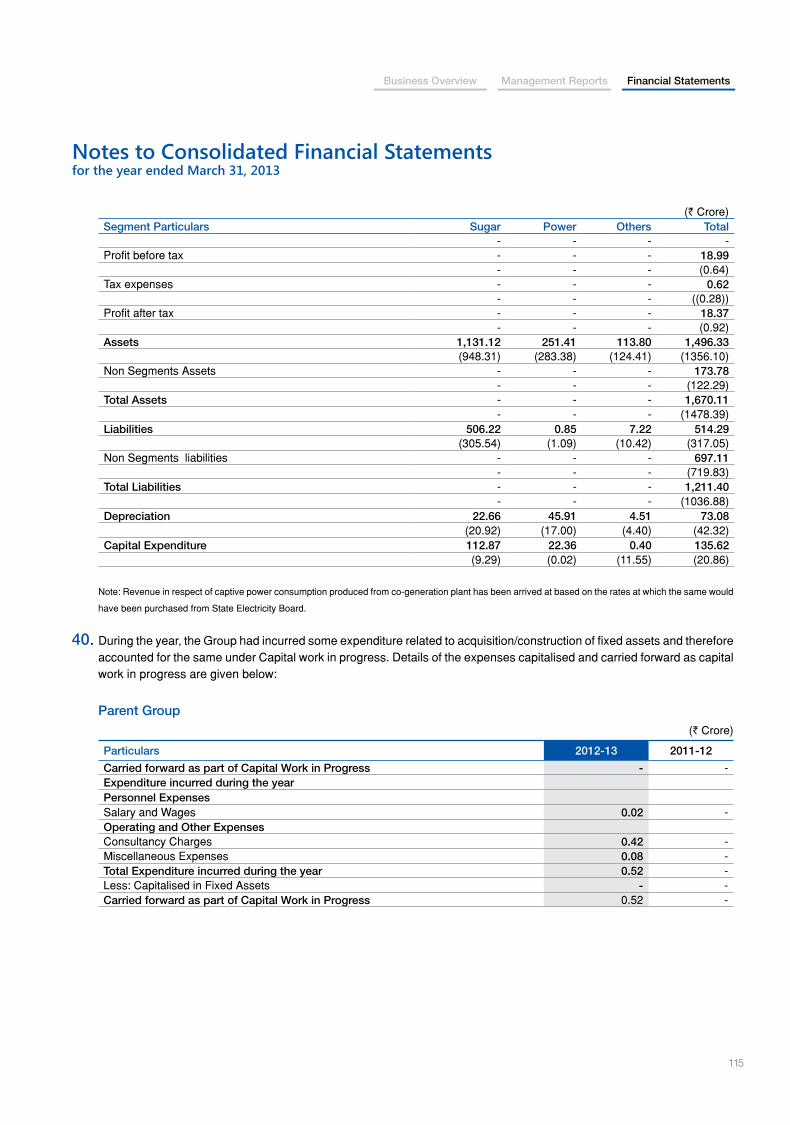
115
Business Overview Management Reports Financial Statements
Notes to Consolidated Financial Statementsfor the year ended March 31, 2013
(` Crore)Segment Particulars Sugar Power Others Total
- - - -Profit before tax - - - 18.99
- - - (0.64)Tax expenses - - - 0.62
- - - ((0.28))Profit after tax - - - 18.37
- - - (0.92)Assets 1,131.12 251.41 113.80 1,496.33
(948.31) (283.38) (124.41) (1356.10)Non Segments Assets - - - 173.78
- - - (122.29)Total Assets - - - 1,670.11
- - - (1478.39)Liabilities 506.22 0.85 7.22 514.29
(305.54) (1.09) (10.42) (317.05)Non Segments liabilities - - - 697.11
- - - (719.83)Total Liabilities - - - 1,211.40
- - - (1036.88)Depreciation 22.66 45.91 4.51 73.08
(20.92) (17.00) (4.40) (42.32)Capital Expenditure 112.87 22.36 0.40 135.62
(9.29) (0.02) (11.55) (20.86)
Note: Revenue in respect of captive power consumption produced from co-generation plant has been arrived at based on the rates at which the same would
have been purchased from State Electricity Board.
40. During the year, the Group had incurred some expenditure related to acquisition/construction of fixed assets and therefore accounted for the same under Capital work in progress. Details of the expenses capitalised and carried forward as capital work in progress are given below:
Parent Group(` Crore)
Particulars 2012-13 2011-12
Carried forward as part of Capital Work in Progress - -Expenditure incurred during the yearPersonnel ExpensesSalary and Wages 0.02 -Operating and Other ExpensesConsultancy Charges 0.42 -Miscellaneous Expenses 0.08 -Total Expenditure incurred during the year 0.52 -Less: Capitalised in Fixed Assets - -Carried forward as part of Capital Work in Progress 0.52 -
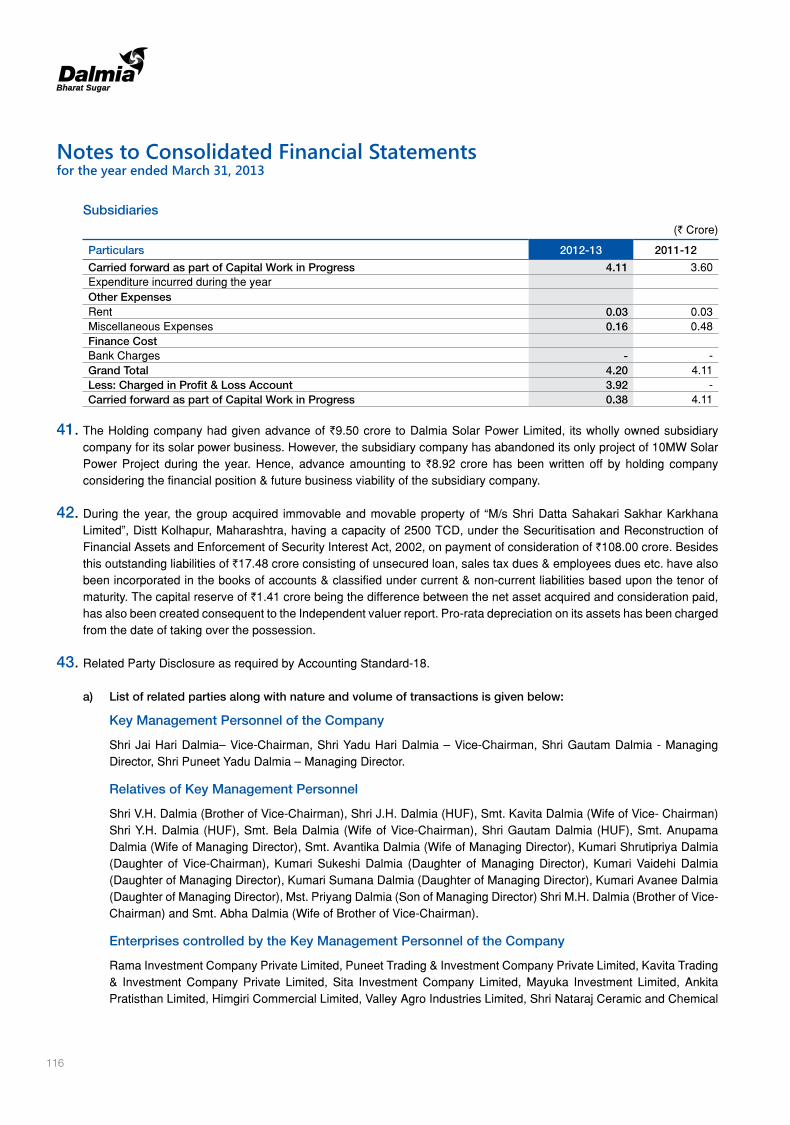
116
Notes to Consolidated Financial Statementsfor the year ended March 31, 2013
Subsidiaries(` Crore)
Particulars 2012-13 2011-12
Carried forward as part of Capital Work in Progress 4.11 3.60Expenditure incurred during the yearOther ExpensesRent 0.03 0.03Miscellaneous Expenses 0.16 0.48Finance CostBank Charges - -Grand Total 4.20 4.11Less: Charged in Profit & Loss Account 3.92 -Carried forward as part of Capital Work in Progress 0.38 4.11
41. The Holding company had given advance of `9.50 crore to Dalmia Solar Power Limited, its wholly owned subsidiary company for its solar power business. However, the subsidiary company has abandoned its only project of 10MW Solar Power Project during the year. Hence, advance amounting to `8.92 crore has been written off by holding company considering the financial position & future business viability of the subsidiary company.
42. During the year, the group acquired immovable and movable property of “M/s Shri Datta Sahakari Sakhar Karkhana Limited”, Distt Kolhapur, Maharashtra, having a capacity of 2500 TCD, under the Securitisation and Reconstruction of Financial Assets and Enforcement of Security Interest Act, 2002, on payment of consideration of `108.00 crore. Besides this outstanding liabilities of `17.48 crore consisting of unsecured loan, sales tax dues & employees dues etc. have also been incorporated in the books of accounts & classified under current & non-current liabilities based upon the tenor of maturity. The capital reserve of `1.41 crore being the difference between the net asset acquired and consideration paid, has also been created consequent to the Independent valuer report. Pro-rata depreciation on its assets has been charged from the date of taking over the possession.
43. Related Party Disclosure as required by Accounting Standard-18.
a) List of related parties along with nature and volume of transactions is given below:
Key Management Personnel of the Company
Shri Jai Hari Dalmia– Vice-Chairman, Shri Yadu Hari Dalmia – Vice-Chairman, Shri Gautam Dalmia - Managing Director, Shri Puneet Yadu Dalmia – Managing Director.
Relatives of Key Management Personnel
Shri V.H. Dalmia (Brother of Vice-Chairman), Shri J.H. Dalmia (HUF), Smt. Kavita Dalmia (Wife of Vice- Chairman) Shri Y.H. Dalmia (HUF), Smt. Bela Dalmia (Wife of Vice-Chairman), Shri Gautam Dalmia (HUF), Smt. Anupama Dalmia (Wife of Managing Director), Smt. Avantika Dalmia (Wife of Managing Director), Kumari Shrutipriya Dalmia (Daughter of Vice-Chairman), Kumari Sukeshi Dalmia (Daughter of Managing Director), Kumari Vaidehi Dalmia (Daughter of Managing Director), Kumari Sumana Dalmia (Daughter of Managing Director), Kumari Avanee Dalmia (Daughter of Managing Director), Mst. Priyang Dalmia (Son of Managing Director) Shri M.H. Dalmia (Brother of Vice-Chairman) and Smt. Abha Dalmia (Wife of Brother of Vice-Chairman).
Enterprises controlled by the Key Management Personnel of the Company
Rama Investment Company Private Limited, Puneet Trading & Investment Company Private Limited, Kavita Trading & Investment Company Private Limited, Sita Investment Company Limited, Mayuka Investment Limited, Ankita Pratisthan Limited, Himgiri Commercial Limited, Valley Agro Industries Limited, Shri Nataraj Ceramic and Chemical
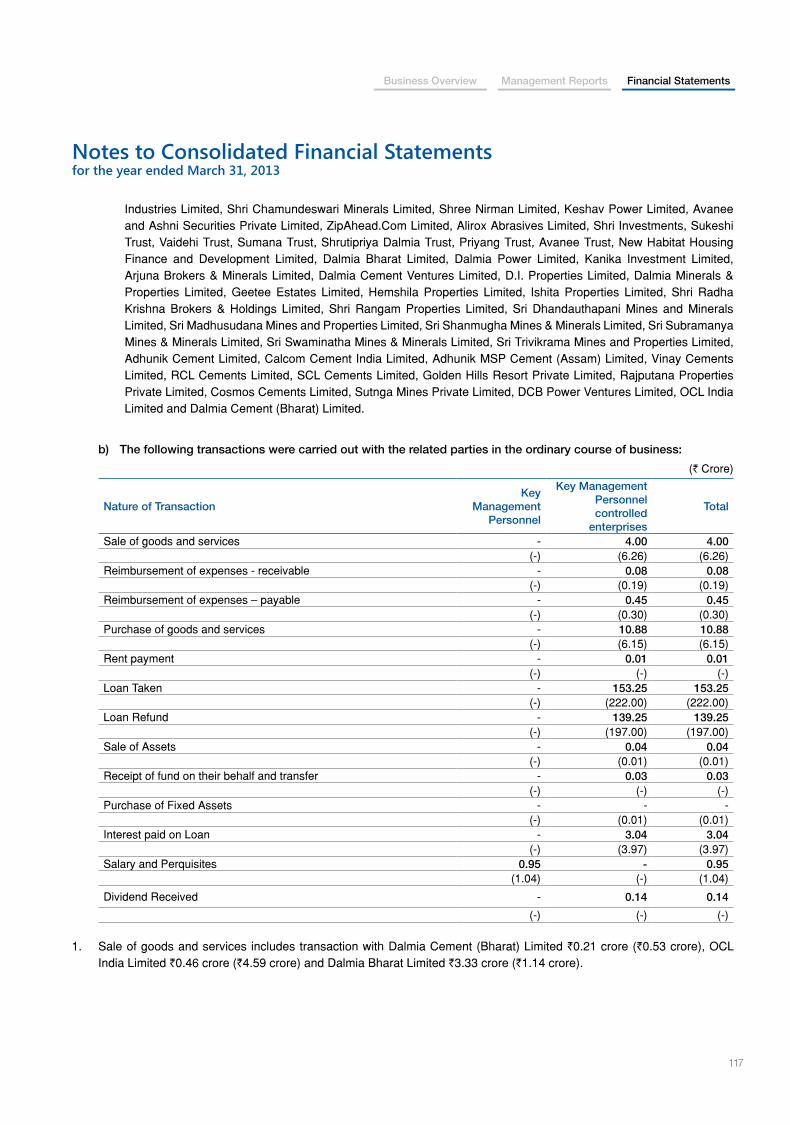
117
Business Overview Management Reports Financial Statements
Notes to Consolidated Financial Statementsfor the year ended March 31, 2013
Industries Limited, Shri Chamundeswari Minerals Limited, Shree Nirman Limited, Keshav Power Limited, Avanee and Ashni Securities Private Limited, ZipAhead.Com Limited, Alirox Abrasives Limited, Shri Investments, Sukeshi Trust, Vaidehi Trust, Sumana Trust, Shrutipriya Dalmia Trust, Priyang Trust, Avanee Trust, New Habitat Housing Finance and Development Limited, Dalmia Bharat Limited, Dalmia Power Limited, Kanika Investment Limited, Arjuna Brokers & Minerals Limited, Dalmia Cement Ventures Limited, D.I. Properties Limited, Dalmia Minerals & Properties Limited, Geetee Estates Limited, Hemshila Properties Limited, Ishita Properties Limited, Shri Radha Krishna Brokers & Holdings Limited, Shri Rangam Properties Limited, Sri Dhandauthapani Mines and Minerals Limited, Sri Madhusudana Mines and Properties Limited, Sri Shanmugha Mines & Minerals Limited, Sri Subramanya Mines & Minerals Limited, Sri Swaminatha Mines & Minerals Limited, Sri Trivikrama Mines and Properties Limited, Adhunik Cement Limited, Calcom Cement India Limited, Adhunik MSP Cement (Assam) Limited, Vinay Cements Limited, RCL Cements Limited, SCL Cements Limited, Golden Hills Resort Private Limited, Rajputana Properties Private Limited, Cosmos Cements Limited, Sutnga Mines Private Limited, DCB Power Ventures Limited, OCL India Limited and Dalmia Cement (Bharat) Limited.
b) The following transactions were carried out with the related parties in the ordinary course of business:
(` Crore)
Nature of TransactionKey
Management Personnel
Key Management Personnel controlled
enterprises
Total
Sale of goods and services - 4.00 4.00(-) (6.26) (6.26)
Reimbursement of expenses - receivable - 0.08 0.08(-) (0.19) (0.19)
Reimbursement of expenses – payable - 0.45 0.45(-) (0.30) (0.30)
Purchase of goods and services - 10.88 10.88(-) (6.15) (6.15)
Rent payment - 0.01 0.01(-) (-) (-)
Loan Taken - 153.25 153.25(-) (222.00) (222.00)
Loan Refund - 139.25 139.25(-) (197.00) (197.00)
Sale of Assets - 0.04 0.04(-) (0.01) (0.01)
Receipt of fund on their behalf and transfer - 0.03 0.03(-) (-) (-)
Purchase of Fixed Assets - - -(-) (0.01) (0.01)
Interest paid on Loan - 3.04 3.04(-) (3.97) (3.97)
Salary and Perquisites 0.95 - 0.95(1.04) (-) (1.04)
Dividend Received - 0.14 0.14
(-) (-) (-)
1. Sale of goods and services includes transaction with Dalmia Cement (Bharat) Limited `0.21 crore (`0.53 crore), OCL India Limited `0.46 crore (`4.59 crore) and Dalmia Bharat Limited `3.33 crore (`1.14 crore).
118
Notes to Consolidated Financial Statementsfor the year ended March 31, 2013
2. Reimbursement of expenses – receivable includes transaction with Dalmia Bharat Limited `0.03 crore (`0.05 crore), Dalmia Cement (Bharat) Limited `0.05 crore (`0.14 crore).
3. Reimbursement of expenses – payable includes transaction with Dalmia Bharat Limited `0.40 crore (`0.20) and Dalmia Cement (Bharat) Limited `0.05 crore (`0.10 crore).
4. Purchase of goods & services includes transaction with Dalmia Bharat Limited `10.19 crore (`5.75 crore), Dalmia Cement (Bharat) Limited `0.66 crore (` Nil) and Shri Natraj Ceramics and Chemical Industries Limited `0.03 crore (` Nil).
5. Rent payment includes transaction with Ishita Properties Limited `0.01 crore (` Nil).
6. Loan taken includes transaction with Dalmia Bharat Limited `127.25 crore (`166.00 crore) and DCB Power Ventures Limited `26.00 crore (`56 crore).
7. Loan refund includes transaction with Dalmia Bharat Limited `132.25 crore (`141.00 crore), DCB Power Ventures Limited `7.00 crore (`56 crore).
8. Sale of fixed assets includes transaction with Dalmia Cement (Bharat) Limited ` Nil (`0.01 crore) and Dalmia Bharat Limited `0.04 crore (`Nil).
9. Receipt of fund on their behalf and transfer includes transaction with Dalmia Bharat Limited `0.03 crore (` Nil).
10. Purchase of fixed assets includes transaction with Dalmia Cement (Bharat) Limited ` Nil (`0.01 crore).
11. Interest paid on loan includes transaction with Dalmia Bharat Limited `2.47 crore (`3.73 crore) and DCB Power Ventures Limited `0.57 crore (` Nil).
12. Salary and perquisites includes transaction with Shri J. H. Dalmia `0.42 crore (`0.26 crore), Shri Y. H. Dalmia `0.41 crore (`0.26 crore), Shri Gautam Dalmia `0.05 crore (`0.26 crore), Shri Puneet Yadu Dalmia `0.07 crore (`0.26 crore).
13. Dividend received is on account of Dalmia Bharat Limited `0.14 crore (`Nil).
c) Balances Outstanding at Year End:
(` Crore)
Nature of TransactionKey
Management Personnel
Key Management Personnel controlled
enterprises
Total
Loan Payable - 64.00 64.00(-) (50.00) (50.00)
Interest Payable - 1.76 1.76(-) (-) (-)
Amounts receivable - 0.09 0.09(-) (0.48) (0.48)
Amounts payable - 3.88 3.88(-) (0.01) (0.01)
119
Business Overview Management Reports Financial Statements
Notes to Consolidated Financial Statementsfor the year ended March 31, 2013
1 Loan payable includes Dalmia Bharat Limited `45.00 crore (`50.00 crore) and DCB Power Ventures Limited `19.00 crore (` Nil).
2 Interest payable includes Dalmia Bharat Limited `1.25 crore (` Nil) and DCB Power Ventures Limited `0.51 crore (`Nil).
3 Amount receivable includes Dalmia Bharat Limited ` Nil (`0.20 crore), Dalmia Cement (Bharat) Limited `0.09 crore (`0.23 crore) and OCL India Limited ` Nil (`0.05 crore)
4 Amount payable includes Dalmia Cement (Bharat) Limited `0.06 crore (`0.01 crore), Dalmia Bharat Limited `3.81 crore (` Nil) and DCB Power Ventures Limited `0.01 crore (` Nil).
44. Figures less than ` Fifty thousand which are required to be shown separately have been shown at actual in double brackets.
45. Previous Year Comparatives
Figures in brackets pertain to previous year. Previous year’s figures have been regrouped where necessary to conform to this year’s classification.
As per our report of even date
For S.S. Kothari Mehta & Co. For and on behalf of the Board of Directors of
Chartered Accountants Dalmia Bharat Sugar and Industries Limited
per Arun K. Tulsian K. V. Mohan Anil Kataria B. B. Mehta Puneet Yadu Dalmia
Partner Company Secretary Asst. Executive Director Director Managing DirectorMembership No. 89907 (Finance & Accounts)
Place: New DelhiDate: May 27, 2013
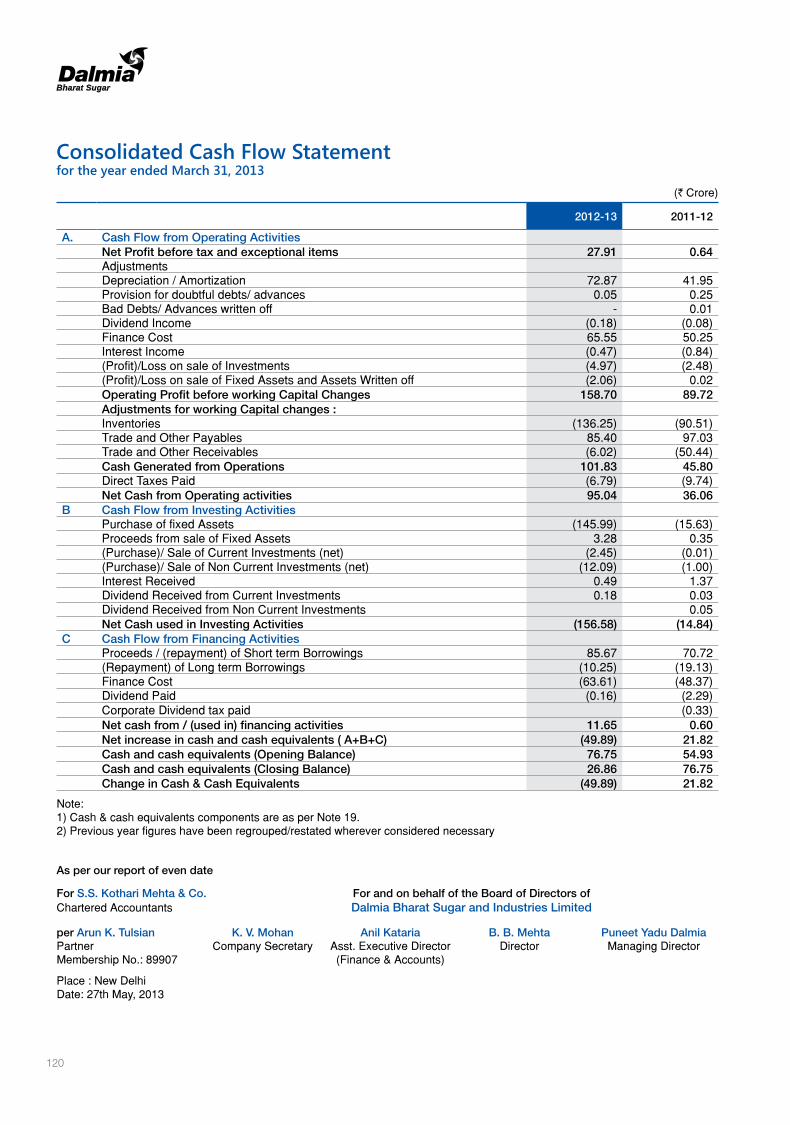
120
Consolidated Cash Flow Statementfor the year ended March 31, 2013
(` Crore)
2012-13 2011-12
A. Cash Flow from Operating ActivitiesNet Profit before tax and exceptional items 27.91 0.64 AdjustmentsDepreciation / Amortization 72.87 41.95 Provision for doubtful debts/ advances 0.05 0.25 Bad Debts/ Advances written off - 0.01 Dividend Income (0.18) (0.08)Finance Cost 65.55 50.25 Interest Income (0.47) (0.84)(Profit)/Loss on sale of Investments (4.97) (2.48)(Profit)/Loss on sale of Fixed Assets and Assets Written off (2.06) 0.02 Operating Profit before working Capital Changes 158.70 89.72 Adjustments for working Capital changes :Inventories (136.25) (90.51)Trade and Other Payables 85.40 97.03 Trade and Other Receivables (6.02) (50.44)Cash Generated from Operations 101.83 45.80 Direct Taxes Paid (6.79) (9.74)Net Cash from Operating activities 95.04 36.06
B Cash Flow from Investing ActivitiesPurchase of fixed Assets (145.99) (15.63)Proceeds from sale of Fixed Assets 3.28 0.35 (Purchase)/ Sale of Current Investments (net) (2.45) (0.01)(Purchase)/ Sale of Non Current Investments (net) (12.09) (1.00)Interest Received 0.49 1.37 Dividend Received from Current Investments 0.18 0.03 Dividend Received from Non Current Investments 0.05 Net Cash used in Investing Activities (156.58) (14.84)
C Cash Flow from Financing ActivitiesProceeds / (repayment) of Short term Borrowings 85.67 70.72 (Repayment) of Long term Borrowings (10.25) (19.13)Finance Cost (63.61) (48.37)Dividend Paid (0.16) (2.29)Corporate Dividend tax paid (0.33)Net cash from / (used in) financing activities 11.65 0.60 Net increase in cash and cash equivalents ( A+B+C) (49.89) 21.82 Cash and cash equivalents (Opening Balance) 76.75 54.93 Cash and cash equivalents (Closing Balance) 26.86 76.75 Change in Cash & Cash Equivalents (49.89) 21.82
Note:1) Cash & cash equivalents components are as per Note 19.2) Previous year figures have been regrouped/restated wherever considered necessary
As per our report of even date
For S.S. Kothari Mehta & Co. For and on behalf of the Board of Directors ofChartered Accountants Dalmia Bharat Sugar and Industries Limited
per Arun K. Tulsian K. V. Mohan Anil Kataria B. B. Mehta Puneet Yadu DalmiaPartner Company Secretary Asst. Executive Director Director Managing DirectorMembership No.: 89907 (Finance & Accounts)
Place : New DelhiDate: 27th May, 2013
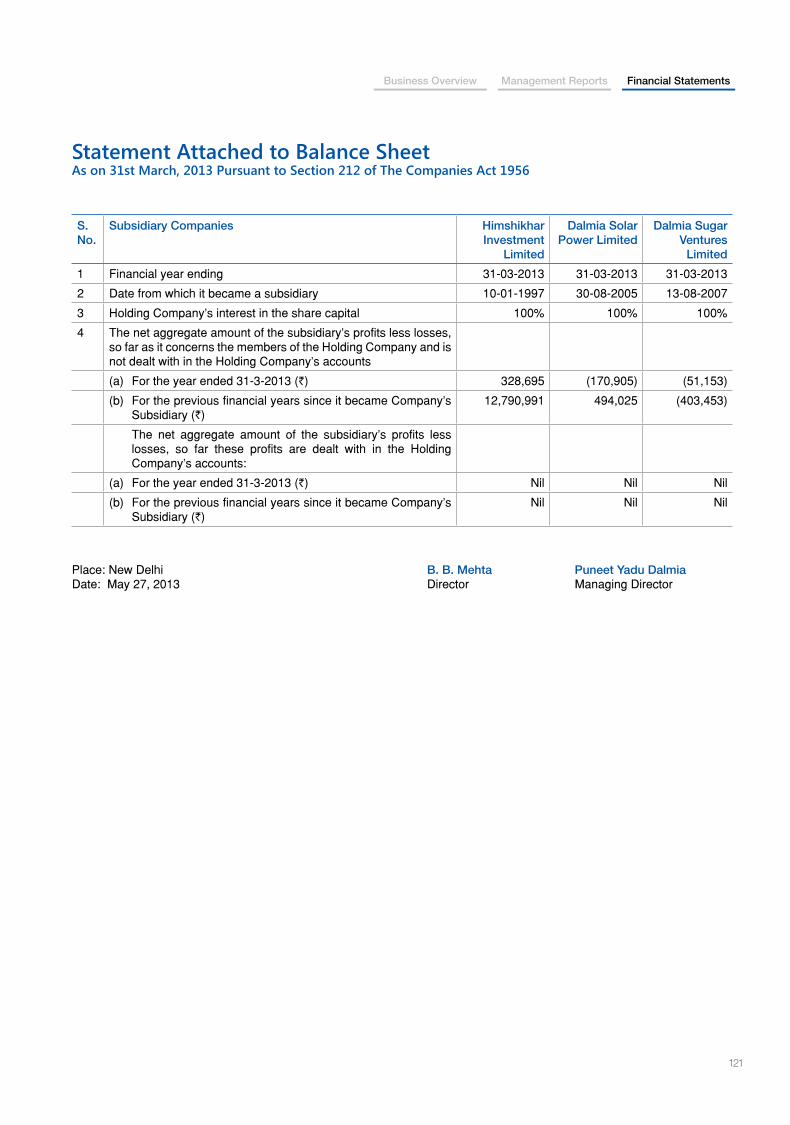
121
Business Overview Management Reports Financial Statements
Statement Attached to Balance SheetAs on 31st March, 2013 Pursuant to Section 212 of The Companies Act 1956
S. No.
Subsidiary Companies Himshikhar Investment
Limited
Dalmia Solar Power Limited
Dalmia Sugar Ventures
Limited
1 Financial year ending 31-03-2013 31-03-2013 31-03-2013
2 Date from which it became a subsidiary 10-01-1997 30-08-2005 13-08-2007
3 Holding Company’s interest in the share capital 100% 100% 100%
4 The net aggregate amount of the subsidiary’s profits less losses, so far as it concerns the members of the Holding Company and is not dealt with in the Holding Company’s accounts
(a) For the year ended 31-3-2013 (`) 328,695 (170,905) (51,153)
(b) For the previous financial years since it became Company’s Subsidiary (`)
12,790,991 494,025 (403,453)
The net aggregate amount of the subsidiary’s profits less losses, so far these profits are dealt with in the Holding Company’s accounts:
(a) For the year ended 31-3-2013 (`) Nil Nil Nil
(b) For the previous financial years since it became Company’s Subsidiary (`)
Nil Nil Nil
Place: New Delhi B. B. Mehta Puneet Yadu DalmiaDate: May 27, 2013 Director Managing Director
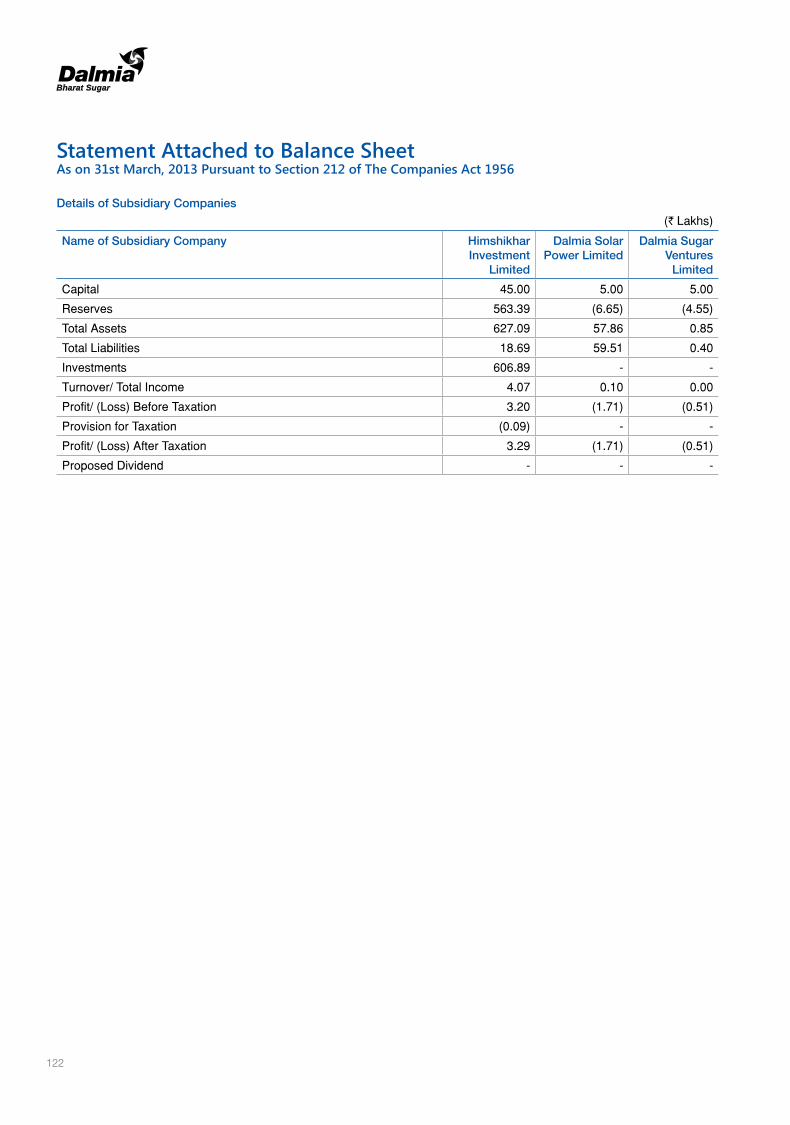
122
Statement Attached to Balance SheetAs on 31st March, 2013 Pursuant to Section 212 of The Companies Act 1956
Details of Subsidiary Companies
(` Lakhs)
Name of Subsidiary Company Himshikhar Investment
Limited
Dalmia Solar Power Limited
Dalmia Sugar Ventures
Limited
Capital 45.00 5.00 5.00
Reserves 563.39 (6.65) (4.55)
Total Assets 627.09 57.86 0.85
Total Liabilities 18.69 59.51 0.40
Investments 606.89 - -
Turnover/ Total Income 4.07 0.10 0.00
Profit/ (Loss) Before Taxation 3.20 (1.71) (0.51)
Provision for Taxation (0.09) - -
Profit/ (Loss) After Taxation 3.29 (1.71) (0.51)
Proposed Dividend - - -

Notes

Notes
Corporate information
Statutory AuditorsS. S. Kothari Mehta & Co.
Corporate Office11th & 12th Floor, Hansalaya Building15, Barakhamba Road, New Delhi - 110 001
Registered OfficeDalmiapuram - 621 651District tiruchirapalli, tamil Nadu
Bankers
State Bank of India
Canara Bank
Corporation Bank
punjab National Bank
the Hong Kong and Shanghai Banking Corporation limited
Deutsche Bank
Axis Bank limited
Management Team Gautam Dalmia Managing Director
puneet Yadu Dalmia Managing Director
B. B. Mehta Business CEO
Jayesh Doshi Group Finance & Strategy
Anil Kataria Chief Financial Officer
K. p. Singh Head-Operations
pankaj Rastogi Head-Projects
Company SecretaryK. V. Mohan
Board of DirectorsJ. S. Baijal Chairman
Jai Hari Dalmia Vice Chairman
Yadu Hari Dalmia Vice Chairman
Gautam Dalmia Managing Director
puneet Yadu Dalmia Managing Director
M. Raghupathy
t. Venkatesan
B. B. Mehta
Kannan panchapakesan
Corporate OfficeHansalaya Building, 11th & 12th Floor, 15, Barakhamba Road, New Delhi – 110001
Ph: 011 – 23310121 / 23 / 24 25, Fax: 23313303
Email: [email protected], [email protected]
| (w
ww
.arin
sigh
t.com
)
