annual report 2012 - graydon nl€¦ · customer driven product innovation ... markets •...
TRANSCRIPT

Annual Report 2012


Graydon Annual Report 2012 3
Contents Page
Profile 4
5 Year Graydon financial key indicators 5
List of members of theSupervisory Board 6
Managing Board 7
Board of Directors 7
Group management team 7
Annual reportReport of the Supervisory Board 8
Report of the Managing Board 9
Financial statements
Consolidated statements of comprehensive income for 2012 14
Consolidated statements of financial position as at December 31st , 2012 15
Consolidated statement of cash flows for 2012 16
Notes to the 2012 consolidated financial statements 17
Company statement of financial position as at December 31st, 2012 35
Company statement of comprehensive income for 2012 36
Notes to the 2012 company financial statements 37
Other information
Statutory profit allocation 40
Profit allocation for 2011 40
Proposed profit allocation for 2012 40
Independent auditor’s report 41
Addresses 42

Graydon Annual Report 20124
Graydon’s services portfolio consists of three services lines: Credit Management services, Risk & Compliance services and Marketing Information services. The combination of the three services fulfil the universal customer demand to gain access to capital, build a knowledge base to invest capital in the best possible way and increase transparency in order to comply with more stringent international rules and regulations. Our core offerings are supported by a publication and education unit offering our customers a variety of training programs and business seminars as well as industry based publications.
Graydon’s Credit Management proposition consist of credit information services and credit collection services. Our Credit Management Services are powered by an extensive network of databases containing specific and relevant information on businesses in more than 100 countries. The databases are continuously updated with input from a network of some 130 partners spanning the entire globe. In addition, Graydon’s specialists can draw on the company’s experience of 125 years in the credit management industry. Graydon’s strength lies in its offer of sophisticated databases containing high quality and up-to-date financial, commercial and transaction-oriented company information on the one hand in combination with strong solution-oriented web-based services that are enabled by advanced technology on the other.
Year after year more information is being produced, making it more difficult for our customers to obtain information that is specific and relevant for them. With the aim to facilitate our customers to find new- and retain existing customers, Graydon has invested in new search engine technology. The Graydon search engine combines the content of Graydon’s marketing databases with information that is publicly available, thus creating unrivalled marketing intelligence for our customers.
Through Graydon’s Risk & Compliance solution (XSeption), we support our customers to comply with increasing rules and regulations. XSeption is an intelligent online tool giving our customers detailed insight in networks and relationships between companies. This insight facilitates customers to assess ownership structures of businesses and prevent fraud.
Graydon is active through its own offices in the Netherlands, Belgium and the United Kingdom. In the credit management market, Graydon has market leading positions in Benelux markets.
The goal of the company is to seek further growth and increase profitability through:
• Enlargement of our unique data assets and development of our analytical capabilities
• Development of discipline and operational excellence in customer driven product innovation
• Building knowledge and allocate resources to strengthen positions in our served markets
• Establishment of optimal process integrity and an increased level of automation
• Ensuring execution of strategy by recruiting and retaining the best management and talent
In 2012, Graydon realised a revenue of C 64.6 million and a net profit of C 8.4 million. In the 2012 financial year, the company had an average workforce of 423 FTE.
Profile

Graydon Annual Report 2012 5
5 year Graydon financial key indicators
2012 2011 2010 2009 2008
Revenue 64,642 67,588 71,312 73,471 70,878
Operating profit 11,372 14,913 19,749 20,818 19,920
Net income 8,437 10,647 13,712 14,947 15,050
Working capital 14,056 3,968 8,993 6,010 15,076
Equity 22,531 14,013 18,832 15,015 24,895
Total assets 57,331 50,921 64,437 56,123 64,162
Cash flow from operations 12,537 19,212 20,500 22,476 22,602
Investments 7,820 9,688 9,159 9,609 8,944Number of employees (FTE) (average) 423 458 474 486 485
2012 2011 2010 2009 2008
Current ratio 1.4 1.1 1.2 1.2 1.4
Working capital to total assets 24.5 7.8 14.0 10.7 23.5
Equity to total assets 39.3 27.5 29.2 26.7 38.8
Net margin 13.1 15.8 19.2 20.3 21.2
Operating profit to total assets 19.8 29.3 30.6 37.1 31.0
Return on equity 37.4 76.0 72.8 100 61.3
2012 2011 2010 2009 2008
Revenue growth (%) -4.4 -5.2 -2.9 3.7 0.7
Operating profit margin (%) 17.6 22.1 27.7 28.3 28.1
Revenue per employee (€1,000) 153 148 150 151 146
Revenue per € of salary 2.85 2.98 3.07 3.06 3.15
Key figures (c 1,000)
Other financial ratio’s
Key performance indicators

Graydon Annual Report 20126
Supervisory Board
*) Thomas Langen (1960)Chairman of the Supervisory Board since November 15th, 2012.Present position: Senior Regional Director Germany, Central & Eastern Europe, Atradius Credit Insurance N.V.Nationality: German.Other Board memberships: Atradius Credit Insurance N.V., Turkish Branch (Turkey) Atradius Pension Trust Germany e.V. (Germany), Salzgitter Mannesmann Handel GmbH (Germany).
**) Sophie Lazarevitch (1961)Member of the Supervisory Board since 12th March, 2013.Present position: Chief Executive Officer of Natixis HCP.Nationality: French.
Gerard van Kaathoven (1957)Member of the Supervisory Board since September 14th, 2007.Present position: Chief Executive Officer of Euler Hermes UK.Nationality: Dutch.
Gertjan Kampman (1972)Member of the Supervisory Board and Chairman of the Audit Committee since September 1st , 2011.Present position: Head of Group Control, Atradius Group.Nationality: Dutch.Other Board memberships: Atradius Insurance Holding N.V.
***) Thomas Krings (1968)Member of the Supervisory Board since January 1st, 2013.Present position: Director of Euler Hermes Deutschland AG.Nationality: German.
Eric Vaingnedroye (1960)Member of the Supervisory Board since April 15th, 2005.Present position: Coface Group Information and Claims Director.Nationality: French.Other Board memberships: Coface Services France (France), Coface Egypt (Egypt), Coface BDI (Israel), CAMEEMS (France), Cogeri (France), ICAP (Greece), KOMPASS INTERNATIONAL (France), CHAL (Latin America).
*) Thomas Langen replaced Delfin Rueda as Chairman of the Supervisory Board per November 15th, 2012.
**) Anne Sallé-Mongauze replaced Jean-Yves Bajon as member of the Supervisory Board per March 26th, 2012 and will be replaced by Sophie Lazarevitch as member of the Supervisory Board per March 12th, 2013.
***) Paul Overeem will be replaced by Thomas Krings as member of the Supervisory Board as per January 1st, 2013.
Graydon Annual Report 2012 7
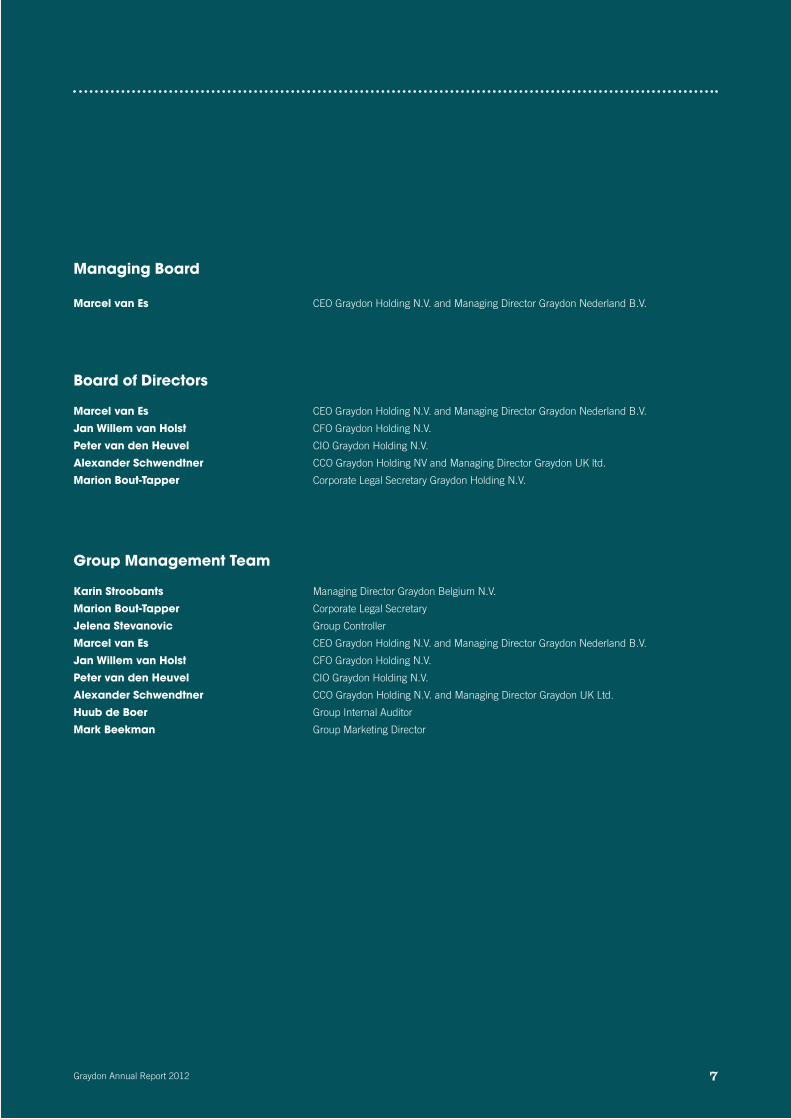
Managing Board
Marcel van Es CEO Graydon Holding N.V. and Managing Director Graydon Nederland B.V.
Board of Directors
Marcel van Es CEO Graydon Holding N.V. and Managing Director Graydon Nederland B.V.
Jan Willem van Holst CFO Graydon Holding N.V.
Peter van den Heuvel CIO Graydon Holding N.V.
Alexander Schwendtner CCO Graydon Holding NV and Managing Director Graydon UK ltd.
Marion Bout-Tapper Corporate Legal Secretary Graydon Holding N.V.
Group Management Team
Karin Stroobants Managing Director Graydon Belgium N.V.
Marion Bout-Tapper Corporate Legal Secretary
Jelena Stevanovic Group Controller
Marcel van Es CEO Graydon Holding N.V. and Managing Director Graydon Nederland B.V.
Jan Willem van Holst CFO Graydon Holding N.V.
Peter van den Heuvel CIO Graydon Holding N.V.
Alexander Schwendtner CCO Graydon Holding N.V. and Managing Director Graydon UK Ltd.
Huub de Boer Group Internal Auditor
Mark Beekman Group Marketing Director

Graydon Annual Report 20128
The Supervisory Board noted that Graydon has experienced a challenging year in 2012 as a consequence of tough market conditions. This is still the result of the financial crisis and intensified competitive and changing market dynamics. Under these conditions the operating profit decreased from C 14,913 in 2011 to C 11,372 in 2012.
The Supervisory Board met four times in 2012. During these meetings the company’s strategy, the general course of affairs, the financial reports and corporate governance were discussed with the Managing Board.
The Audit Committee met three times. The findings of the internal auditor and the external auditors were discussed with the Supervisory Board. In 2012, the internal auditor participated in all three meetings and presented his findings to the Audit Committee. In 2012, Mr. Langen has replaced Mr. Rueda as Chairman of the Supervisory Board. Furthermore, Mrs. Sallé-Mongauze has replaced Mr. Bajon as member of the Supervisory Board. Mrs. Lazarevtich has replaced Mrs. Sallé-Mongauze. Lastly, Mr. Krings has replaced Mr. Overeem. The contributions of Mr. Rueda, Mr. Bajon, Mrs. Sallé-Monguauze and Mr. Overeem in this Board have been of great value and we thank them all for their contributions.
This Annual Report of Graydon Holding N.V. contains the 2012 financial statements audited by KPMG Accountants N.V. The Supervisory Board has discussed the 2012 financial statements and the proposed profit appropriation contained therein as presented by the Managing Board and advises the General Meeting of Shareholders to adopt the 2012 financial statements and to grant to the Managing Board and the Supervisory Board discharge for the management and supervisory duties respectively, performed during the 2012 financial year.
2012 was again a challenging year, in view of the general economic circumstances in the countries where Graydon has its operations. The Supervisory Board wishes to express its gratitude to the Managing Board and all Graydon employees for their hard work and dedication in 2012.
Amsterdam, March 20th, 2013.
The Supervisory Board:Thomas Langen, Chairman
Sophie Lazarevitch
Gerard van Kaathoven
Gertjan Kampman
Thomas Krings
Eric Vaingnedroye
Report of the Supervisory Board

Financial Performance
A challenging year for GraydonThe tough economic climate has continued to impact Graydon in 2012. Euro zone and UK trade volumes have decreased and as a result we have seen a lower demand for business information solutions from our existing customer base. More rigid rules and regulations for the banking sector when it comes to corporate lending impacted demand for credit risk solutions negatively. Strong competition of traditional information providers and new entrants on the information market, combined with an all-time high in business insolvencies, lead to higher customer losses. Negative effects were only moderately offset by the introduction of a new price proposition targeting first time buyers of credit information, and the launch of our Risk & Compliance services module in the Netherlands and UK.
Graydon revenues declined by 4.4% to C 64.6 million. This includes the effects of the cancelation of the secondment business and the restructuring of the MarktSelect business in the Netherlands. Excluding revenues from secondment and MarktSelect in the year on year comparison, the underlying revenue decline would have been 1.3%. The EBIT margin decreased from 22.1%% in 2011 to 17.6% in 2012. This includes one-off restructuring cost for dismissal of secondment- and MarktSelect staff (Euro 2.0 million). Excluding these one-off restructuring cost EBIT margin would be 20.7% in 2012.
Credit Management servicesThe performance of our credit management services shows a mixed picture. The revenues of the credit information business grew with 0.1% vs. 2011, whilst debt collections services posted a revenue decline of 0.3% vs. 2011.
Marketing Information servicesAs a result of repositioning of our marketing proposition in the Netherlands and client losses in Belgium, the Marketing Information service line had a difficult year. Revenues declined with 30.2% vs. 2011.
Risk and Compliance and Other services:Revenues in Risk and Compliance and other services lines was 34% lower against 2011. A positive development in education services and seminars in the Netherlands and Belgium and the launch of the Risk and Compliance proposition in the Netherlands and UK, was not sufficient to compensate the revenue decline as
a result of the discontinuation of the secondment business in the Netherlands and lower results of the call centre services in Belgium.
Review of Operations
Results of Graydon the NetherlandsThe Dutch operations in 2012 consisted of the following services, Credit Information, Debt Collection, Risk & Compliance, MarktSelect and Secondment.
Due to continuous weak market conditions and enduring underperformance for temporary staff, Graydon the Netherlands discontinued its secondment business and integrated its MarktSelect business unit in the Graydon organisation. A social plan was agreed with the Works Council and labour unions. The reorganization was completed in 2012. With the execution of the mentioned measures a more balanced fixed cost base is implemented and managerial focus on core activities is realized.
Revenues of the credit information service line were positively affected by the introduction of a subscription model that caters for small and medium sized enterprises. Furthermore the intensified focus on increasing revenues from the existing customer through selling additional services has yielded positively. Collection business was not able to reverse the negative trend as seen in 2011. The collection service line was negatively impacted by lower than anticipated business intake. The relaunch of the revised MarktSelect business and the introduction of the revolutionary Graydon marketing search engine (https://marketinginformatie.graydon.nl) in the fourth quarter went according to plan.
Results of Graydon BelgiumGraydon Belgium consolidated its market leading position in credit information services. The debt collection services continued its positive trend. The marketing services were impacted by delay in contract approvals from existing and new customers. Call centre services were impacted with fierce price competition and as a consequence underperformed.
Through positioning Graydon Belgium as a knowledge partner, its media profile has further developed. Case studies published by Graydon Belgium are well received by both local and central governments as well as interest groups and trade associations.
Report of the Managing Board
Graydon Annual Report 2012 9

Graydon Annual Report 201210
Results of Graydon United KingdomIn these challenging economic circumstances and despite severe competition, Graydon UK had a good year. Following the appointment of a new Managing Director for the United Kingdom in March 2012, a lot of energy and resources have been invested in the expansion, restructuring and professionalization of the commercial function, with the result being a noticeable increase in credit management customers.
Next to establishing a new management team and recalibrating the commercial outfit, substantial investments in additional data important to credit management customers have been made, which will lead to new value added propositions in 2013.
Strategic Perspective
Information sources and data volumes are growing and the use of search technology is rapidly evolving. Graydon aims to be a business that provides its customers in information intensive industries with information solutions, helping them to make better decisions, achieve better results and become more transparent for its stakeholders.
Graydon combines high quality content and data with analytics and technology and uses the outcome to build easy to use solutions that have a low impact on our customers’ total cost base but have a significant positive impact on its revenues.
With the aim to provide our customers with information solutions that allow them to build their businesses in a more efficient way, we increased our investments and accelerated new product launches in 2012. Through a combination of our centralized operating approach and a more balanced portfolio development, good progress has been made to further increase cost efficiencies and optimize new product innovation.
During 2012, we have made significant progress against our strategic priorities. We have continued to build our unique differentiated data assets, leveraged our analytical and software capabilities and further strengthened and broadened our customer relationships.
For the coming year emphasis is on delivering value by deploying initiatives focusing on customer retention and expansion, making investments in product renewal and innovation and further optimizing our operational excellence.
Technology
It is Graydon’s aim to provide our customers with essential, time critical information, analyzed from structured and unstructured high volume data. To ensure customer demands are adequately fulfilled, a future proof application roadmap is designed and being rolled out. The roadmap consists of the following building blocks that enhances the Graydon product portfolio across the Group:
• Implement Big Data solutions and data warehouse with advanced analytics and reporting capabilities.
• Implement industry standard configurable platform for debt collection, billing, invoicing and scoring.
• Focus IT resources and knowledge on core (domain) activities, support internal processes with industry standard applications, simplify IT architecture, use open standards.
All mainstream applications (i.e. CRM, HRM and Finance) will be homogenous across the Group. Service and maintenance as well as software development will be centralized, thus increasing efficiencies and knowledge sharing.
Sustainability
We are determined to make meaningful contributions as a business by providing access to information that allow our customers to build better businesses. Graydon believes in transparency in business and encourages openness. In the current economic climate it is now more important than ever to understand and manage both risks and opportunities.
Graydon has checks and balances in place to assure its customers can rely on information generated or validated by Graydon. Graydon is supporting business and promotes the importance of doing business with financially healthy organisations.
Personnel and Organisation
Graydon can only be successful for its customers if we are able to hire and retain the best human resources available. As Managing Board we are crucially aware of the importance of our people and the strategic approach that we must take in their development.

Graydon Annual Report 2012 11
We strive to develop our employees to the maximum of their capabilities and create a challenging working environment. Building a unified Graydon culture has been one of the main priorities in 2012 and it is at the forefront of our 2013 people strategy. A Group HR director will be appointed dedicated to the development of our company culture, HR processes and systems that increase employees’ contribution to Graydon’s objectives. The Group HR Director will be responsible to develop this in close cooperation with local Graydon management and HR staff.
Mainly as a result of the discontinuation of the secondment business and integration of the MarktSelect business in the Graydon organisation, the overall employee base was adjusted downwards from 447 at the beginning of 2012 to 399 FTE at the end of 2012. Over year the average number of FTE’s was 423. The Graydon employee base is diverse reflecting the countries in which Graydon operates. Approximately 42% of our employees are female and 58% male.
A prerequisite to successfully execute Graydon’s strategy is the presence of the right people in the right place. There is a growing need for people with different skills and competences. The gradual evolution Graydon is undergoing from a product-oriented organisation to a business model based on a market-driven knowledge organisation specialising in business information, will be reflected in the workforce. The number of staff engaged in data mining, statistical studies, web marketing, cross-media specialisations, web development and channel management is expected to increase, whereas the number of data processors will decrease.
Prospect for 2013
With economic recovery in the Euro zone and UK not expected to become visible before year end, we expect market conditions for business information services to be equally challenging as in previous years. Strategic initiatives are deployed with the objective to reverse the downward revenue trend and improve margins.Sales and marketing across the Group is focussed to win in selected key vertical markets. New services will be launched allowing differentiation and sustainable competitive advantages. Continuous rigorous cost awareness, increased level of automation and optimized process integrity across the Group, is expected to lower the fixed cost base.
Initiatives are taken to optimize our current product mix. Our current services portfolio will be streamlined and time to market of new scalable solutions will be improved. Furthermore investments will be made in optimizing our analytical capacity and fully utilize Big Data initiatives.
Over the past 125 years, the Graydon brand has been built into the industry’s leading trade name that it is today. In this jubilee year, Graydon will launch its unified corporate identity. All Graydon activities will operate under a unified corporate identity that is based on commonly shared norms and values.
Appointment of a Chief Financial Officer, Chief Information Officer and Chief Commercial Officer has been completed. Chaired by the Chief Executive Officer and supported by the Corporate Legal Secretary, a Board of Directors is formed effective from January 1st 2013. The Board of Directors has a collective responsibility for setting an successful execution of the Group strategy as well as functional responsibility for the members’ respective areas of expertise across the Group.
Governance and Risk Management
IntroductionIn accordance with the Dutch Tabaksblat Corporate Governance Code, listed public and private limited liability companies that adhere to the two-tier board system must issue an in control statement. Although Graydon is not a listed company and therefore is not obliged to issue an in control statement, it believes a risk management and control system is an important tool to safeguard the sound operation of its organisation. Since 2009, Graydon has had a formal risk management and control system in place and has issued an in control statement in its annual report. The scope of the risk management and control system includes Graydon Holding N.V. and all subsidiaries. The individual subsidiaries are responsible for developing risk management and control systems that are appropriate to their situation and size and that correspond to their own characteristics and relationship with the holding company and other subsidiaries. Graydon uses the COSO Enterprise Risk Management framework as a reference model and has adopted compatible processes and terminology. COSO is the worldwide standard and has therefore been selected as the basis for Graydon’s risk management and control system.

Graydon Annual Report 201212
GovernanceGovernance within Graydon is an expression of the management structure and is defined as a means to safeguard the relationship between management, control and supervision. Risk management is the starting point. The Graydon Managing Board is responsible for the Graydon risk management and control system. It ensures that the system functions effectively and that identified risks are managed as agreed. The Graydon managing Board has delegated responsibility for maintaining the risk management and control system to the respective Managing Directors of the countries. They are responsible for decision-making and are accountable for the material completeness of risk identification, the material correctness of risk analyses and the timelines and appropriateness of risk decisions at individual and aggregate level.
As a subcommittee of the Supervisory Board, the Audit Committee supervises the activities of the Managing Board with respect to the operation of the risk management and internal control system. The Audit Committee is supported in its supervisory tasks by the Internal Auditor. The Internal Auditor provides additional assurance on Graydon’s risk management and control system and reports its findings to the Managing Board and three times a year to the Audit Committee of the Supervisory Board.
Risk profileGraydon’s risk profile is determined by the Group’s core business: providing credit management services. The risks comprise more than the reliability of financial reporting. They also involve risks relating to the strategic and operational objectives and compliance with laws and regulations. Graydon makes periodic updates of the risk chart to ensure a good insight is available into significant risks that are specific to the Graydon locations and Group.
Control systemBased on the risk chart for 2012, all control frameworks have been updated. Controls have been developed to reduce the likelihood and impact of each key risk. The update of the control frameworks was followed by a self-assessment which is an evaluation of the operating effectiveness of the controls in place and helps to identify improvements and to develop additional controls if needed. Management concluded from this self-assessment that strong control frameworks were in place for all Graydon locations. Risk management and control reviews are a continuous process. Responsibility for them has been delegated to the managers of each location. Risks and controls are carefully
recorded and checked in a control database. In 2012, a number of control frameworks were audited by the Internal Auditor. Shortcomings detected during the self-assessment and during tests by the Internal Auditor were entered in the control database and followed up during the year. Progress regarding the internal control system and follow-up of the shortcomings identified, were communicated in a timely manner to the Managing Board and to the Audit Committee of the Supervisory Board.
In control statementGraydon’s Managing Board is aware of its responsibility for the risk management and internal control system. Significant efforts were made in 2012 to update and improve the risk management and internal control system. On the basis of the results of self-assessments and internal audits of the operation of controls in 2012, the Managing Board is of the opinion that the risk management and internal control system provides reasonable assurance that the financial statements do not contain any material errors and that the risk management and control system worked properly in 2012.
The Managing Board also recognises that the risk management and control system does not provide absolute assurance that the company will not be prevented from achieving its objectives nor can it prevent material errors, losses, fraud or the violation of laws and regulations.
Forward-looking statementThe Managing Board has no reason to believe that the risk management and control system will not work properly in 2013. Continuous efforts will be made to further improve the risk management and control system. The risk chart will be updated in response to changing circumstances and conditions. Further to this updated risk profile, Graydon’s control systems are subject to continuous review and improvement.
Amsterdam, March 20th, 2013.
The Managing Board

Graydon Annual Report 2012 13
Financial Statements

Note 2012 2011
Revenue 1 64,642 67,588
Expenses
Salaries 2 22,714 22,658
Social charges and pension expenses 2 5,755 4,911
Depreciation 7 972 1,229
Amortisation 8 8,619 8,579
Other operating expenses 4 22,022 22,627
60,082 60,004
Capitalisation of:
Database expenses 8 -5,280 -5,708
Software expenses 8 -1,533 -1,621
53,269 52,675
Operating profit 11,372 14,913
Net financing income 5 335 380
Profit before taxation 11,707 15,293
Taxation 6 -3,270 -4,646
Profit after taxation 8,437 10,647
Other comprehensive income
Foreign exchange translation differences -81 -34
Total comprehensive income for the year -81 -34
Profit for the period 8,356 10,613
The notes on pages 17 to 34 are an integral part of these consolidated financial statements.
Graydon Annual Report 201214
Consolidated statements of comprehensive incomefor the period ended December 31st, 2012

Note 2012 2011AssetsMachinery and equipment 7 1,732 2,271
Intangible assets 8 7,802 8,996
Deferred tax assets 9 348 372
Total non-current assets 9,882 11,639
Investments in associates 10 - -
Trade receivables 11 17,534 16,001
Other trade receivables and prepayments 11 5,963 4,581
Cash and cash equivalents 12 23,952 19,154
Total current assets 47,449 39,736
Total assets 57,331 51,375
EquityAuthorized and issued capital 13 1,500 1,500
Share premium 13 1,376 1,376
Legal reserves 13 7,802 8,996
Foreign currency translation reserve 13 -453 -534
Retained earnings 13 3,869 -7,972
Profit for the year 13 8,437 10,647
Total equity 22,531 14,013
LiabilitiesDeferred tax liabilities 9 1,406 1,594
Other provisions 14 585 731
Employee benefits 15 - -
Total non-current liabilities 1,991 2,325
Trade and other payables 16 18,683 19,079
Deferred income 17 14,126 15,958
Total current liabilities 32,809 35,037
Total liabilities 34,800 37,362
Total equity and liabilities 57,331 51,375
*Comparative figures are reclassified for comparison purposesThe notes on pages 17 to 34 are an integral part of these consolidated financial statements.
Graydon Annual Report 2012 15
*
Consolidated statements of financial positionbefore result appropriation
As at December 31st, 2012

* 2012 2011
Operating profit 11,372 14,913
Adjusted for:Amortisation 8,619 8,579
Depreciation 972 1,229
Foreign exchange adjustment -38 -38
Operating profit after adjustment 20,925 24,683
Changes in working capital:Trade and other receivables -1,282 1,440
Trade and other payables (excluding dividend payables) -63 -1,350
Provisions and employee benefit -146 -391
Deferred income -1,832 -1,587
-3,323 -1,106
Net financial income 335 380
Corporate Tax paid -5,400 -4,745
-5,065 -4,365 Net cash flow from operating activities 12,537 19,212
Investments in machinery and equipment -427 -1,029
Disposals in machinery and equipment 2 -
Investments in intangible assets -7,395 -8,659
Net cash from investing activities -7,820 -9,688
Dividends paid - -21,500
Net cash from financing activities - -21,500
Net increase/decrease in cash and cash equivalents 4,717 -11,976
Foreign exchange difference on cash 81 33
Cash & Cash Equivalents at January 1st 19,154 31,097
Cash & cash equivalents as at December 31st 23,952 19,154
*Comparative figures are reclassified for comparison purposes. The notes on pages 17 to 34 are an integral part of these consolidated financial statements.
Graydon Annual Report 201216
Consolidated statement of cash flowsfor the period ended December 31st, 2012

Graydon Annual Report 2012 17
Notes to the 2012 consolidated financial statements for the year ended 31 December 2012
Reporting entity
Graydon Holding N.V. (the ‘Company’) is a company domiciled in The Netherlands. The address of the Company’s registered office is Hullenbergweg 260, 1101 BV Amsterdam. Graydon Holding N.V. is the holder company of credit management companies. The consolidated financial statements of the Company as at and for the year ended December 31st, 2012 comprise the Company and its subsidiaries (together referred to as the ‘Group’ and individually as ‘Group entities’) and the Group’s interest in associates and jointly controlled entities.
Shareholders in Graydon Holding N.V. are:
Atradius Insurance Holding N.V.
45% sharesDavid Ricardostraat 11066 JS AmsterdamThe Netherlands
Euler Hermes Kreditversicherungs-AG
27.5% sharesFriedensallee 254D-22763 HamburgGermany
Natixis HCP S.A.S.
27.5% shares30, Avenue Pierre Mendes75013 ParisFrance
Basis of preparation
A Statement of complianceThe consolidated financial statements have been prepared in accordance with International Financial Reporting Standards as endorsed by the European Union (IFRSs).
The consolidated financial statements were authorised for issue by the Supervisory Board on March, 20th, 2013.
With reference to the income statement of the company, use has been made of the exemption pursuant to Section 402 of Book 2 of the Netherlands Civil Code.
B Basis of measurementThe consolidated financial statements have been prepared on the historical cost basis except the defined benefit asset is recognised as plan assets, plus unrecognised past service cost, less the present value of the defined benefit obligation.
C Functional and presentation currencyThese consolidated financial statements are presented in Euros, which is the Company’s functional currency. All financial information presented in Euros has been rounded to the nearest thousand, except when otherwise indicated.
D Use of estimates and judgementsThe preparation of the consolidated financial statements in conformity with IFRSs requires management to make judgements, estimates and assumptions that affect the application of accounting policies and the reported amounts of assets, liabilities, income and expenses. Actual results may differ from these estimates.
Estimates and underlying assumptions are reviewed on an ongoing basis. Revisions to accounting estimates are recognised in the period in which the estimates are revised and in any future periods affected.
E Changes in accounting policiesThere are no changes in the changes in accounting policies in compare to previous year.
Significant accounting policies
The accounting policies set out below have been applied consistently to all periods presented in these consolidated financial statements, and have been applied consistently by Group entities.
Certain comparative amounts in the consolidated statement of comprehensive income have been reclassified to conform with the current year’s presentation.
A Basis of consolidation(i) SubsidiariesSubsidiaries are entities controlled by the Group. Control is the power to govern the financial and operating policies of an entity so as to obtain benefits from its activities. In assessing control, the Group takes into consideration potential voting rights that

Graydon Annual Report 201218
currently are exercisable. The financial statements of subsidiaries are included in the consolidated financial statements from the date that control commences until the date that control ceases.
(ii) Loss of controlOn the loss of control, the Group derecognises the assets and liabilities of the subsidiary, any non-controlling interests and the other components of equity related to the subsidiary. Any surplus or deficit arising on the loss of control is recognised in profit or loss. If the Group retains any interest in the previous subsidiary, then such interest is measured at fair value at the date that control is lost. Subsequently it is accounted for as an equity-accounted investee or as an available-for-sale financial asset depending on the level of influence retained.
(iii) Investment in associatesAssociates are those entities in which the Group has significant influence, but not control, over the financial and operating policies. Significant influence is presumed to exist when the Group holds between 20% and 50% of the voting power of another entity.
Investments in associates and jointly controlled entities are accounted for using the equity method and are recognised initially at cost. The consolidated financial statements include the Group’s share of the profit or loss and other comprehensive income of equity accounted investees, after adjustments to align the accounting policies with those of the Group, from the date that significant influence or joint control commences until the date that significant influence or joint control ceases.
When the Group’s share of losses exceeds its interest in an associate, the Group’s carrying amount is reduced to nil and recognition of further losses is discontinued, except to the extent that the Group has incurred legal or constructive obligations or made payments on behalf of an associate.
(iv) Transactions eliminated on consolidationIntra-group balances and transactions, and any unrealised income and expenses arising from intra-group transactions, are eliminated in preparing the consolidated financial statements.
B Foreign currency(i) Foreign currency transactionsTransactions in foreign currencies are translated to the respective functional currencies of Group entities at exchange rates at the dates of the transactions. Monetary assets and liabilities
denominated in foreign currencies at the reporting date are retranslated to the functional currency at the exchange rate at that date. The foreign currency gain or loss on monetary items is the difference between amortised cost in the functional currency at the beginning of the year, adjusted for effective interest and payments during the year, and the amortised cost in foreign currency translated at the exchange rate at the end of the year.
Non-monetary assets and liabilities denominated in foreign currencies that are measured at fair value are retranslated to the functional currency at the exchange rate at the date that the fair value was determined. Non-monetary items in a foreign currency that are measured based on historical cost are translated using the exchange rate at the date of the transaction.
Foreign currency differences arising on retranslation are recognised in profit or loss, except for the following differences which are recognised in other comprehensive income.
(ii) Foreign operationsThe assets and liabilities of foreign operations are translated to euro at exchange rates at the reporting date. The income and expenses of foreign operations, excluding foreign operations in hyperinflationary economies, are translated to euros at exchange rates at the dates of the transactions.
Foreign currency differences are recognised in other comprehensive income, and presented in the foreign currency translation reserve (translation reserve) in equity. However, if the foreign operation is a non-wholly owned subsidiary, then the relevant proportion of the translation difference is allocated to non-controlling interests.
When a foreign operation is disposed of such that control, significant influence or joint control is lost, the cumulative amount in the translation reserve related to that foreign operation is reclassified to profit or loss as part of the gain or loss on disposal. When the Group disposes of only part of its interest in a subsidiary that includes a foreign operation while retaining control, the relevant proportion of the cumulative amount is reattributed to non-controlling interests. When the Group disposes of only part of its investment in an associate or joint venture that includes a foreign operation while retaining significant influence or joint control, the relevant proportion of the cumulative amount is reclassified to profit or loss.
When the settlement of a monetary item receivable from or payable to a foreign operation is neither planned nor likely in the

Graydon Annual Report 2012 19
foreseeable future, foreign currency gains and losses arising from such item are considered to form part of a net investment in the foreign operation and are recognised in other comprehensive income, and presented in the translation reserve in equity.
(iii) Exchange rates for the most important currencies
December 31st, Average December 31st, 2011 2012 2012
GBP 1.20 1.22 1.23
C Financial instruments(i) Non-derivative financial assetsThe Group initially recognises loans and receivables on the date that they are originated. All other financial assets (including assets designated as at fair value through profit or loss) are recognised initially on the trade date, which is the date that the Group becomes a party to the contractual provisions of the instrument.The Group derecognises a financial asset when the contractual rights to the cash flows from the asset expire, or it transfers the rights to receive the contractual cash flows in a transaction in which substantially all the risks and rewards of ownership of the financial asset are transferred. Any interest in such transferred financial assets that is created or retained by the Group is recognised as a separate asset or liability.
Financial assets and liabilities are offset and the net amount presented in the statement of financial position when, and only when, the Group has a legal right to offset the amounts and intends either to settle on a net basis or to realise the asset and settle the liability simultaneously.
Loans and receivables are financial assets with fixed or determinable payments that are not quoted in an active market. Such assets are recognised initially at fair value plus any directly attributable transaction costs. Subsequent to initial recognition, loans and receivables are measured at amortised cost using the effective interest method, less any impairment losses.Loans and receivables comprise cash and cash equivalents, and trade and other receivables.
(ii) Non-derivative financial liabilitiesThe Group initially recognises liabilities initially on the trade date, which is the date that the Group becomes a party to the contractual provisions of the instrument.
The Group derecognises a financial liability when its contractual obligations are discharged, cancelled or expire.
The Group classifies non-derivative financial liabilities into the other financial liabilities category. Such financial liabilities are recognised initially at fair value less any directly attributable transaction costs. Subsequent to initial recognition, these financial liabilities are measured at amortised cost using the effective interest method.
Financial liabilities comprise bank overdrafts, and trade and other payables.
Bank overdrafts that are repayable on demand and form an integral part of the Group’s cash management are included as a component of cash and cash equivalents for the purpose of the statement of cash flows.
(iii) Share capitalOrdinary shares are classified as equity. Incremental costs directly attributable to the issue of ordinary shares are recognised as a deduction from equity, net of any tax effects.
D Machines and equipment(i) Recognition and measurementItems of machines and equipment are measured at cost less accumulated depreciation and accumulated impairment losses.Cost includes expenditure that is directly attributable to the acquisition of the asset. Purchased software that is integral to the functionality of the related equipment is capitalised as part of that equipment.
When parts of an item of property, plant and equipment have different useful lives, they are accounted for as separate items (major components) of property, plant and equipment.Any gain or loss on disposal of an item of property, plant and equipment (calculated as the difference between the net proceeds from disposal and the carrying amount of the item) is recognised in profit or loss.
(ii) Subsequent costsSubsequent expenditure is capitalised only when it is probable that the future economic benefits associated with the expenditure will flow to the Group. Ongoing repairs and maintenance is expensed as incurred.

Graydon Annual Report 201220
(iii) DepreciationItems of machines and equipment are depreciated on a straight-line basis in profit or loss over the estimated useful lives of each component and depreciated from the date that they are installed and are ready for use.
The estimated useful lives for the current and comparative years of significant items of machines and equipment are as follows:
• Machinery and equipment 3 - 10 years• Other components 4 - 5 years
Depreciation methods, useful lives and residual values are reviewed at each reporting date and adjusted if appropriate.
E Intangible assets(i) Research and developmentExpenditure on research activities, undertaken with the prospect of gaining new scientific or technical knowledge and understanding, is recognised in profit or loss as incurred.
Development activities involve a plan or design for the production of new or substantially improved products and processes. Development expenditure is capitalised only if development costs can be measured reliably, the product or process is technically and commercially feasible, future economic benefits are probable, and the Group intends to and has sufficient resources to complete development. The expenditure capitalised includes the cost of materials, direct labour, overhead costs that are directly attributable to preparing the asset for its intended use. Other development expenditure is recognised in profit or loss as incurred.
Capitalised development expenditure is measured at cost less accumulated amortisation and accumulated impairment losses.
(ii) Capitalised database costs include the followingExternally purchased data and direct cost relating to the loading and maintenance of the data (only directly related salaries and other employee expenses).
(iii) SoftwareInternally capitalised software comprises direct-labour cost of program development (only directly related salaries and other employee expenses).
Purchased software is amortised over a 3-year period, using the straight-line method.
(iv) Subsequent expenditureSubsequent expenditure is capitalised only when it increases the future economic benefits embodied in the specific asset to which it relates. All other expenditure, including expenditure on internally generated goodwill and brands, is recognised in profit or loss as incurred.
(v) AmortisationIntangible fixed assets are amortised on a straight-line basis in profit or loss over their estimated useful lives, from the date that they are available for use.
Costs directly related to the development of the information databases and internally developed software are capitalised and amortised over a period of 3 years, based upon 65% in year 1, 30% in year 2 and 5% in year 3.
Amortisation methods, useful lives and residual values are reviewed at each reporting date and adjusted if appropriate.
F ImpairmentThe carrying amounts of the Group’s assets, are reviewed at each balance sheet date to determine whether there is any indication of impairment. If any such indication exists, the asset’s recoverable amount is estimated.
For goodwill, assets that have an indefinite useful life, the recoverable amount is estimated at each balance sheet date.An impairment loss is recognised whenever the carrying amount of an asset or its cash-generating unit exceeds its recoverable amount. Impairment losses are recognised in the statement of comprehensive income.
Impairment losses recognised in respect of cash-generating units are allocated first to reduce the carrying amount of any goodwill allocated to cash-generating units (group of units) and then, to reduce the carrying amount of the other assets in the unit (group of units) on a pro rata basis.
G Employee benefits(i) Short-term employee benefitsShort-term employee benefit obligations are measured on an undiscounted basis and are expensed as the related service is provided. A liability is recognised for the amount expected to be paid under short-term cash bonus or profit-sharing plans if the Group has a present legal or constructive obligation to pay this amount as a result of past service provided by the employee, and the obligation can be estimated reliably.

Graydon Annual Report 2012 21
(ii) Defined contribution plansA defined contribution plan is a post-employment benefit plan under which an entity pays fixed contributions into a separate entity and has no legal or constructive obligation to pay further amounts. Obligations for contributions to defined contribution plans are recognised as an employee benefit expense in profit or loss in the periods during which related services are rendered by employees. Prepaid contributions are recognised as an asset to the extent that a cash refund or a reduction in future payments is available. Contributions to a defined contribution plan that are due more than 12 months after the end of the period in which the employees render the service are discounted to their present value.
(iii) Defined benefit plansA defined benefit plan is a post-employment benefit plan other than a defined contribution plan. The Group’s net obligation in respect of defined benefit plans is calculated separately for each plan by estimating the amount of future benefit that employees have earned in return for their service in the current and prior periods; that benefit is discounted to determine its present value. Any unrecognised past service costs and the fair value of any plan assets are deducted. The discount rate is the yield at the reporting date on AA credit-rated bonds that have maturity dates approximating the terms of the Group’s obligations and that are denominated in the currency in which the benefits are expected to be paid.
The calculation is performed annually by a qualified actuary using the projected unit credit method. When the calculation results in a benefit to the Group, the recognised asset is limited to the total of any unrecognised past service costs and the present value of economic benefits available in the form of any future refunds from the plan or reductions in future contributions to the plan. In order to calculate the present value of economic benefits, consideration is given to any minimum funding requirements that apply to any plan in the Group. An economic benefit is available to the Group if it is realisable during the life of the plan, or on settlement of the plan liabilities. When the benefits of a plan are improved, the portion of the increased benefit related to past service by employees is recognised in profit or loss on a straight-line basis over the average period until the benefits become vested. To the extent that the benefits vest immediately, the expense is recognised immediately in profit or loss.
The actuarial gains and losses that arise in calculating the Group’s obligation in respect of a plan, to the extent that any cumulative unrecognised actuarial gain or loss exceeds 10 per cent of the
greater of the present value of the defined benefit obligation and the fair value of plan assets, that portion is recognised in the statement of comprehensive income over the expected average remaining working lives of the employees participating in the plan. Otherwise, the actuarial gain or loss is not recognised.
Where the calculation results in a benefit to the Group, the recognised asset is limited to the net total of any unrecognised actuarial losses and past service costs and the present value of any future refunds from the plan or reductions in future contributions to the plan.
H ProvisionsA provision is recognised if, as a result of a past event, the Group has a present legal or constructive obligation that can be estimated reliably, and it is probable that an outflow of economic benefits will be required to settle the obligation. Provisions are determined by discounting the expected future cash flows at a pre-tax rate that reflects current market assessments of the time value of money and the risks specific to the liability. The unwinding of the discount is recognised as finance cost.
I Onerous contractsA provision for onerous contracts is recognised when the expected benefits to be derived by the Group from a contract are lower than the unavoidable cost of meeting its obligations under the contract. The provision is measured at the present value of the lower of the expected cost of terminating the contract and the expected net cost of continuing with the contract. Before a provision is established, the Group recognises any impairment loss on the assets associated with that contract.
J RevenueRevenue is recognized in the statement of comprehensive income at the moment that services are delivered. Revenue is obtained mainly out of credit information and debt collection activities. A signification portion of revenue is derived from deferred income; once the services are rendered, the liability for deferred income is recognized as revenue.
K LeasesPayments made under operating leases are recognised in profit or loss on a straight-line basis over the term of the lease. Lease incentives received are recognised as an integral part of the total lease expense, over the term of the lease.

Graydon Annual Report 201222
L Finance income and finance costsFinance income comprises interest income. Interest income is recognised as it accrues in profit or loss, using the effective interest method.
Finance costs comprise interest expense and recognised in profit or loss.
Foreign currency gains and losses are reported on a net basis as either finance income or finance cost depending on whether foreign currency movements are in a net gain or net loss position.
M TaxTax expense comprises current and deferred tax. Current tax and deferred tax is recognised in profit or loss.
Current tax is the expected tax payable or receivable on the taxable income or loss for the year, using tax rates enacted or substantively enacted at the reporting date, and any adjustment to tax payable in respect of previous years. Current tax payable also includes any tax liability arising from the declaration of dividends.
Deferred tax is recognised in respect of temporary differences between the carrying amounts of assets and liabilities for financial reporting purposes and the amounts used for taxation purposes. Deferred tax is not recognised for:
• temporary differences on the initial recognition of assets or liabilities in a transaction that is not a business combination and that affects neither accounting nor taxable profit or loss; and• temporary differences related to investments in subsidiaries and jointly controlled entities to the extent that it is probable that they will not reverse in the foreseeable future.
Deferred tax is measured at the tax rates that are expected to be applied to temporary differences when they reverse, using tax rates enacted or substantively enacted at the reporting date.
In determining the amount of current and deferred tax the Company takes into account the impact of uncertain tax positions and whether additional taxes and interest may be due. The Company believes that its accruals for tax liabilities are adequate for all open tax years based on its assessment of many factors, including interpretations of tax law and prior experience. This assessment relies on estimates and assumptions and may involve a series of judgements about future events. New information may become available that causes the Company to change its
judgement regarding the adequacy of existing tax liabilities; such changes to tax liabilities will impact tax expense in the period that such a determination is made.
Deferred tax assets and liabilities are offset if there is a legally enforceable right to offset current tax liabilities and assets, and they relate to taxes levied by the same tax authority on the same taxable entity, or on different tax entities, but they intend to settle current tax liabilities and assets on a net basis or their tax assets and liabilities will be realised simultaneously.
A deferred tax asset is recognised for unused tax losses, tax credits and deductible temporary differences to the extent that it is probable that future taxable profits will be available against which they can be utilised. Deferred tax assets are reviewed at each reporting date and are reduced to the extent that it is no longer probable that the related tax benefit will be realised.
In determining the amount of current and deferred tax, the Group takes into account the impact of uncertain tax positions and whether additional taxes and interest may be due. This assessment relies on estimates and assumptions and may involve a series of judgements about future events. New information may become available that causes the Company to change its judgement regarding the adequacy of existing tax liabilities; such changes to tax liabilities will impact tax expense in the period that such a deter mination is made.
N Segment reportingSegment results that are reported to the CEO include items directly attributable to a segment as well as those that can be allocated on a reasonable basis. Unallocated items comprise mainly corporate assets (primarily the Company’s headquarters), head office expenses, and tax assets and liabilities.

Graydon Annual Report 2012 23
A number of new standards, amendments to standards and interpretations are effective for annual periods beginning after 1 January 2012. Those which may be relevant to the Group are set out below. The Group has not chosen for early adoption for these standards, which is allowed under these standards.
(i) IFRS 9 Financial Instruments (2010), IFRS 9 Financial Instruments (2009)IFRS 9 (2009) introduces new requirements for the classification and measurement of financial assets. Under IFRS 9 (2009), financial assets are classified and measured based on the business model in which they are held and the characteristics of their contractual cash flows. IFRS 9 (2010) introduces additions relating to financial liabilities. The IASB currently has an active project to make limited amendments to the classification and measurement requirements of IFRS 9 and add new requirements to address the impairment of financial assets and hedge accounting.
IFRS 9 (2010 and 2009) are effective for annual periods beginning on or after 1 January 2015 with early adoption permitted. The adoption of IFRS 9 (2010) is expected to have an impact on the Group’s financial assets, but not any impact on the Group’s financial liabilities.
(ii) IFRS 10 Consolidated Financial Statements, IFRS 11 Joint Arrangements, IFRS12 Disclosure of Interests in Other Entities (2011)IFRS 10 introduces a single control model to determine whether an investee should be consolidated. As a result, the Group may need to change its consolidation conclusion in respect of its investees, which may lead to changes in the current accounting for these investees (see Note 3(a)(iii)).
Under IFRS 11, the structure of the joint arrangement, although still an important consideration, is no longer the main factor in determining the type of joint arrangement and therefore the subsequent accounting.
• The Group’s interest in a joint operation, which is an arrangement in which the parties have rights to the assets and obligations for the liabilities, will be accounted for on the basis of the Group’s interest in those assets and liabilities.• The Group’s interest in a joint venture, which is an arrangement in which the parties have rights to the net assets, will be equity-accounted.
The Group may need to reclassify its joint arrangements, which may lead to changes in current accounting for these interests.
IFRS 12 brings together into a single standard all the disclosure requirements about an entity’s interests in subsidiaries, joint arrangements, associates and unconsolidated structured entities. IFRS 12 requires the disclosure of information about the nature, risks and financial effects of these interests.
These standards are effective for annual periods beginning on or after 1 January 2013 with early adoption permitted.
(iii) IFRS 13 Fair Value Measurement (2011)IFRS 13 provides a single source of guidance on how fair value is measured, and replaces the fair value measurement guidance that is currently dispersed throughout IFRS. Subject to limited exceptions, IFRS 13 is applied when fair value measurements or disclosures are required or permitted by other IFRSs. IFRS 13 is effective for annual periods beginning on or after 1 January 2013 with early adoption permitted.
(iv) IAS 19 Employee Benefits (2011)IAS 19 (2011) changes the definition of short-term and other long-term employee benefits to clarify the distinction between the two. For defined benefit plans, removal of the accounting policy choice for recognition of actuarial gains and losses is not expected to have any impact on the Group. However, the Group may need to assess the impact of the change in measurement principles of expected return on plan assets. IAS 19 (2011) is effective for annual periods beginning on or after 1 January 2013 with early adoption permitted.
Operating segmentsThe Group has three reportable segments, which are the Group’s geographical areas of operations.
For each of the strategic divisions, the Group’s CEO (the chief operating decision maker) reviews internal management reports on at least a quarterly basis. Separate reporting exists for credit information, debt collections and other revenues.
Cash flow statementThe cash flow statement has been prepared using the indirect method. The funds in the cash flow statement consist only of cash. Income and expenditure owing to interest and tax on profits have been included under the cash flow from operating activities.
New standards and interpretations not yet adopted

1. Revenue segmentation 2012 2011
Products:
Credit information 49,425 49,396
Debt collections 8,979 9,009
Other 6,238 9,183
Total revenue 2012 64,642 67,588
2. Personnel expenses 2012 2011
Wages and salaries 22,714 22,658
Compulsory social security contributions 3,694 3,440
Contributions to defined contribution plans 1,941 1,383
Pension expenses for defined benefit plans 120 88
28,469 27,569
This includes one-off restructuring cost for dismissal Secondment- & MarktSelect staff of € 2.0 million.
3. The average number of FTE 2012 2011
The Netherlands 224 256
Other countries 199 202
423 458
4. Other operating expenses 2012 2011
Production & Sales 10,620 10,338
Office & General 4,238 4,818
Personnel 3,883 3,820
Marketing 2,628 3,078
Other 651 573
20,022 22,627
Graydon Annual Report 201224

Graydon Annual Report 2012 25
5. Net financing income 2012 2011
Interest income 341 380
Interest expenses -6 -
Net financing income 335 380
6. Income tax expenseReconciliation of effective tax rate 2012 2011
Profit before tax 11,707 15,293
Tax using the company’s domestic corporation tax rate 2,927 3,823
Effect of tax rates in foreign companies 764 767
Changes in tax rate -9 -4
Exchange rate differences -3 -1
Other 68 61
Under (over) provided in prior years -477 -
Income tax in statement of comprehensive income 3,270 4,646
Reconciliation of effective tax rateIn percentage 2012 2011
Profit before tax 100 100
Income tax using the domestic corporation tax rate 25.0 25.0
Effect of tax rates in foreign companies 6.5 5.0
Changes in tax rate -0.1 -0.0
Exchange rate difference -0.0 -0.0
Other 0.6 0.4
Under (over) provided in prior years -4.1 -
Income tax in statement of comprehensive income 27.9 30.4
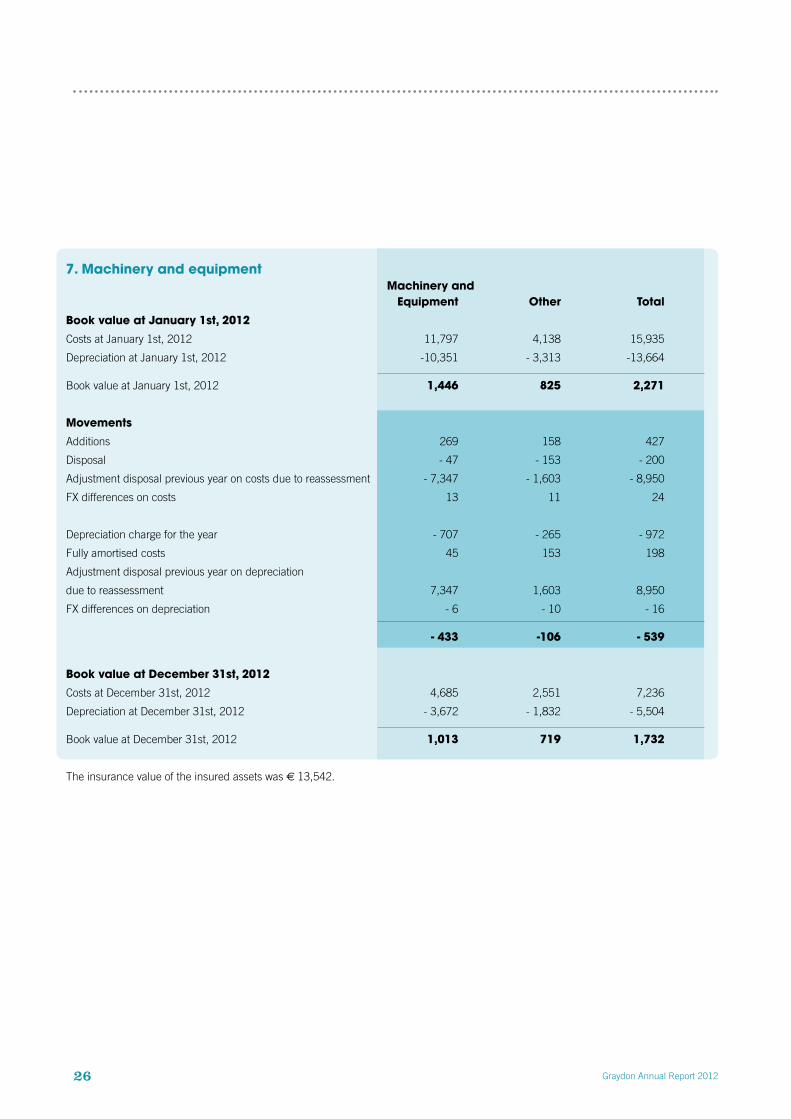
7. Machinery and equipment Machinery and Equipment Other Total
Book value at January 1st, 2012
Costs at January 1st, 2012 11,797 4,138 15,935
Depreciation at January 1st, 2012 -10,351 - 3,313 -13,664
Book value at January 1st, 2012 1,446 825 2,271
Movements
Additions 269 158 427
Disposal - 47 - 153 - 200
Adjustment disposal previous year on costs due to reassessment - 7,347 - 1,603 - 8,950
FX differences on costs 13 11 24
Depreciation charge for the year - 707 - 265 - 972
Fully amortised costs 45 153 198
Adjustment disposal previous year on depreciation
due to reassessment 7,347 1,603 8,950
FX differences on depreciation - 6 - 10 - 16
- 433 -106 - 539
Book value at December 31st, 2012
Costs at December 31st, 2012 4,685 2,551 7,236
Depreciation at December 31st, 2012 - 3,672 - 1,832 - 5,504
Book value at December 31st, 2012 1,013 719 1,732
The insurance value of the insured assets was € 13,542.
Graydon Annual Report 201226

Graydon Annual Report 2012 27
8. Intangible assets Internal developed Purchased Databases software software Total
Book value at January 1st, 2012
Costs at January 1st, 2012 69,453 16,956 9,968 96,377
Depreciation at January 1st, 2012 - 64,350 - 15,034 - 7,997 - 87,381
Book value at January 1st, 2012 5,103 1,922 1,971 8,996
Movements
Additions 5,280 1,533 582 7,395
Disposal - 3,988 - 1,349 - 39 - 5,376
Adjustment disposal previous year on
costs due to reassessment - 38,664 - 10,786 - 6,065 - 55,515
FX differences 73 24 2 99
Depreciation charge for the year - 5,566 - 1,925 - 1,128 - 8,619
Fully amortised costs 3,988 1,349 39 5,376
Adjustment disposal previous year on
depreciation due to reassessment 38,664 10,786 6,065 55,515
FX differences - 52 - 17 - 1 - 70
- 264 - 385 - 545 - 1,194
Book value at December 31st, 2012
Costs at December 31st, 2012 32,154 6,378 4,448 42,980
Depreciation at December 31st, 2012 - 27,315 - 4,840 - 3,022 - 35,178
Book value at December 31st, 2012 4,839 1,537 1,426 7,802

9. Deferred tax assets and liabilitiesDeferred tax assets and liabilities are attributable to the following:
Assets Liabilities Net
In thousands of euro 2012 2011 2012 2011 2012 2011
Tangible assets 90 134 - - 90 134Intangible assets 258 238 - 877 -975 - 619 - 737Other receivables - - - 529 -619 - 529 - 619
Net tax assets / (liabilities) 348 372 - 1,406 - 1,594 - 1,058 - 1,222
10. Investments in associatesThe company had equity interests in the following company:
Associate Residence Year Participation %
STA International Ltd. Maidstone (UK) 2011 0.00
2012 0.00
2012 2011
Opening balance - 166
Change in valuation of associates - -
Disposal - 166
Period end balance - -
The participating interest in STA International Ltd. has been sold on 27th of October 2011, for the amount of C 215. At year end a
receivable in the amount of C 113 (2011: C 192) is still outstanding. This receivable is covered by a pledge on the shares of STA
International Ltd. We refer to note 11.
Graydon Annual Report 201228

Graydon Annual Report 2012 29
11. Trade and other receivables 2012 2011
Trade receivables 17,534 16,001
Income tax receivable 2,201 454
Other trade receivables and prepayments 3,762 4,127
23,497 20,582
An amount of C 2,044 (2011: C 1.054) is included in the trade receivables and relates to long term contracts. Trade receivables are shown
net of a provision for bad debts of December 31st, 2012 C 883 (2011: C 637). Included in the other trade receivables is an amount of €
113 that is covered by a pledge on the shares of STA International Ltd. We refer to note 10.
12. Cash and cash equivalents 2012 2011
Bank balances 23,952 19,154Cash and cash equivalents in the statement of cash flows 23,952 19,154
There are bank guarantees for the rented premises in The Netherlands and Belgium for a total of € 671 (2011 € 546). In the bank
balances is an amount of € 3,628 (2011: € 2,161) separated in ”Stichting Derdengelden Graydon Nederland” that belongs to debt
collection clients and is not available for distribution.
13. EquityFor the explanation of the equity we refer to the company equity on page 38.
14. Provisions 2012 2011
Provision at January 1st 731 340
Additions 106 555
Used -252 -164
Provision at December 31st 585 731

15. Employee benefits
Employee benefits 2011 Netherlands Belgium Total
31-12-11 31-12-11
Present value of the defined benefit obligations 10,952 2,247 13,199
Fair value of plan assets -15,072 -2,279 -17,351
Funded status -4,120 -32 -4,152
Unrecognised actuarial gains/losses 1,835 - 1,835
Unrecognized assets 2,285 32 2,317
Total employee benefits - - -
Employee benefits 2012 Netherlands Belgium Total
31-12-12 31-12-12
Present value of the defined benefit obligations 14,304 3,390 17,694
Fair value of plan assets -16,283 -3,294 -19,577
Funded status -1,979 96 -1,883
Unrecognised actuarial gains/losses -594 96 -498
Unrecognized assets 1,385 - 1,385
Total employee benefits - - -
Liability for defined benefit obligations
The Group makes contributions to a defined benefit plan that provides pension benefits for employees upon retirement. The Group also
makes contributions to defined contribution plans.
Graydon Annual Report 201230

Graydon Annual Report 2012 31
Movements in the net liability for defined benefit obligations recognised in the balance sheet
2012 2011
Net liability for defined benefit obligations at January 1st - -
Cash movements -120 -88
Expense recognised in the statement of comprehensive income 120 88
Asset ceiling adjustment - -
Net liability for defined benefit obligations at December 31st - -
Expense recognised in the statement of comprehensive income
2012 2011
Current service costs 58 52
Interest on obligation 625 641
Expected return on plan assets -843 -808
Actuarial (gains) and losses -10 -
Other adjustments 290 203
120 88
Principal actuarial assumptions at the balance sheet date (expressed as weighted averages):
2012 2011
In percentage Netherlands Belgium Netherlands Belgium
Discount rate at December 31st 3.2 4.0 4.8 4.0
Expected return on plan assets at December 31st 3.2 4.0 5.1 4.0
Future salary increases 2.0 3.5 1.5 2.5
Future inflation rate 2.0 2.0 1.0 2.0
Future pension increases (old) 0.0 N/A 0.0 N/A

16. Trade and other payables
2012 2011
Trade payables 2,650 1,751
Taxes and social charges 2,377 1,783
Debt collection liabilities 3,329 2,211
Accrued expenses 8,034 5,808
Other payables 2,292 7,526
18,683 19,079
The accrued expenses include an amount of € 2,044 (2011: € 1,054) which relates to long term contracts. The debt collection liabilities
relate to expenses incurred for clients with respect to third parties, together with funds received for clients.
17. Deferred incomeThe liability for deferred income of € 14,126 (2011: € 15,958) pertains to amounts paid by customers and set aside for services to be
performed in the future; the maximum period is 5 years and the average is 2 years.
18. Commitments and contingent liabilitiesThe Group has commitments and contingent liabilities for rent of buildings, cars and computer leasing.
2012 2011
Current
Less than one year 4,152 2,973
Non current
Between one and five years 9,878 7,295
More than five years 284 1,093
14,314 11,361
Graydon Annual Report 201232

Graydon Annual Report 2012 33
19. Related partiesThe company considers its shareholders (see page 16) and the companies in which it holds equity stakes as related parties. The shareholders are clients of the Group, the related turnover amounts to C 2,501 (2011 C 2,469). This is all related to credit management services. All the transactions with shareholders were concluded on and at an arms’ length basis. The transactions with the companies in which the Company holds equity investments were not significant. The balance sheet contains a receivable on the shareholders of C 319 (2011: C 447). Graydon Holding has Management Service Agreements with her subsidiaries. In year 2012 Graydon Holding charged an amount of C 1,681 (2011: C 1,268) to its subsidiaries.
20. Risk ManagementGeneralAs part of the operational activities, the Group is exposed to risks relating to databases and IT issues.
The Group does not use financial instruments like bonds, shares or derivatives. The Group only uses time deposits to optimize the interest earnings for the cash at banks. Therefore the Group does not run large risks regarding financial instruments, such as credit risks, liquidity risks, and market risks. Market risk can be broken down into interest rate risks, foreign exchange risks and price risks. The Group runs interest rate risks on their outstanding cash at banks and credit risks on the time deposits and debtors.
Graydon has subsidiaries in the United Kingdom. Therefore, for the Group financial statements Graydon is exposed to foreign exchange risk on these activities.
The aim of the risk policy is to limit these risks to levels acceptable to Graydon. This section of the notes provides disclosures concerning the risks identified above and the aims, policies and procedures of the Group for managing and measuring these risks. In addition, these consolidated financial statements include quantitative disclosures.
The Audit Committee of Graydon oversees the adequacy of the risk management in connection with the risks to which Graydon is exposed. The Audit Committee is supported in its supervisory position by the Internal Audit function within Graydon. This function provides additional assurance concerning the proper control of all the Graydon business processes by performing regular and occasional evaluations. Internal Audit’s findings are reported to the Audit Committee.
Credit riskCredit risk is the risk of financial loss by Graydon if a counterparty of a financial instrument does not meet its contractual obligations. Credit risks mainly arise from receivables from customers and from deposits. Graydon’s policy regarding the credit risk of the time deposits is that time deposits only may be invested in parties that have at least an A+ Long-term rating (based on S&P rating). Graydon’s credit risk is mainly determined by the individual characteristics of the customers. The demographic aspects of the customer base, the risk of non-payment in the sector and the country in which the customers are active, have less impact on the credit risk. As part of the credit policy used by the business units, the individual creditworthiness of each customer is assessed before standard payment and delivery conditions are offered to the customer. In the case of contract extensions, figures from the business unit’s own experience are also used in assessing the customer’s creditworthiness. Deliveries to customers with a high risk profile are only made after approval by the management. Business has been done with the majority of customers for many years, with only incidental non-material losses. The Group has formed a provision for impairment for the amount of the estimated losses from trade and other receivables. The most important elements of this provision are a specific loss provision for important individual positions and a group loss provision for groups of comparable assets concerning losses suffered but not yet identified. The Group loss provision is determined on the basis of historic payment data for comparable financial assets.
Graydon Annual Report 201234
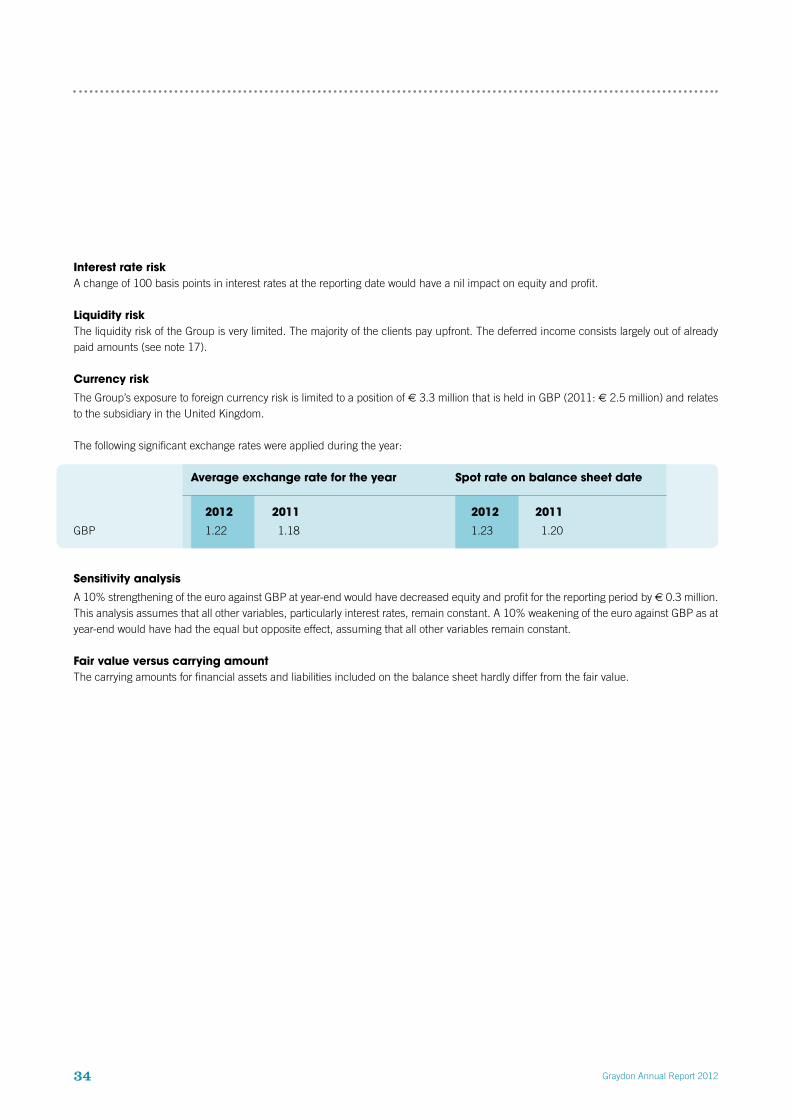
Interest rate riskA change of 100 basis points in interest rates at the reporting date would have a nil impact on equity and profit.
Liquidity riskThe liquidity risk of the Group is very limited. The majority of the clients pay upfront. The deferred income consists largely out of already paid amounts (see note 17).
Currency risk
The Group’s exposure to foreign currency risk is limited to a position of € 3.3 million that is held in GBP (2011: € 2.5 million) and relates to the subsidiary in the United Kingdom.
The following significant exchange rates were applied during the year:
Average exchange rate for the year Spot rate on balance sheet date
2012 2011 2012 2011
GBP 1.22 1.18 1.23 1.20
Sensitivity analysis
A 10% strengthening of the euro against GBP at year-end would have decreased equity and profit for the reporting period by € 0.3 million. This analysis assumes that all other variables, particularly interest rates, remain constant. A 10% weakening of the euro against GBP as at year-end would have had the equal but opposite effect, assuming that all other variables remain constant.
Fair value versus carrying amountThe carrying amounts for financial assets and liabilities included on the balance sheet hardly differ from the fair value.

Graydon Annual Report 2012 35
Note 2012 2011
AssetsIntangible assets 41 57
Machinery and equipment 37 39
Subsidiaries and Associates 1 22,517 17,649
Deferred tax asset 305 339
Total non-current assets 22,900 18,084Other receivables and prepayment 2 4,697 3,257
Total current assets 4,697 3,257
Total assets 27,597 21,341
EquityAuthorized and issued capital 3 1,500 1,500
Share premium 3 1,376 1,376
Legal reserve 3 7,802 8,996
Foreign currency translation reserve 3 -453 -534
Retained earnings 3 3,869 -7,972
Profit for the year 3 8,437 10,647
Total equity 3 22,531 14,013
LiabilitiesEmployee benefits - -
Deferred tax liabilities 877 975
Total non-current liabilities 877 975
Cash and cash equivalents 1,415 212
Other liabilities and accruals 4 2,774 6,141
Total current liabilities 4,189 6,353
Total liabilities 5,066 7,328
Total equity and liabilities 27,597 21,341
The notes on pages 37 to 39 are an integral part of these company financial statements.
Company statement of financial positionbefore result appropriation
As at December 31st, 2012

Company statement of comprehensive incomefor the period ended December 31st, 2012
Note 2012 2011
Results from Group companies after taxation 1 8,600 11,246
Other results after taxation -163 -599
Net profit for the year 3 8,437 10,647
The notes on pages 37 to 39 are an integral part of these company financial statements.
Graydon Annual Report 201236

Graydon Annual Report 2012 37
Accounting principles – general
Accounting policiesThe company financial statements of Graydon Holding N.V. have been prepared in accordance with the requirements in Title 9 Book 2 of the Dutch Civil Code. The Group prepares its consolidated financial statements in accordance with International Financial Reporting Standards (IFRS) as adopted by the EU. The accounting policies applied in the company financial statements are the same as those applied in the consolidated financial statements. Participating interests in the Group companies are valued at net asset value determined on the basis of IFRS as adopted by the European Union.
Basis of preparationThe financial statements are presented in Euro, rounded to the nearest thousand, which is the presentation currency of the company.The accounting principles applied by the Company are disclosed in the notes to the consolidated financial statements.
1 Investments in subsidiaries
Total 2012 Total 2011
Balance as per January 1st 17,649 23,901
Exchange rate differences 81 34
Profit for the year 8,600 11,246
Dividend received - 4,000 -17,366
Disposal 187 -166
Balance as per December 31st 22,517 17,649
Accounting policies
Country of Ownership interest incorporation 2012 2011
Graydon Nederland B.V. Netherlands 100 100
KISYS Krediet Informatie Systemen B.V. Netherlands 100 100
MarktSelect B.V. Netherlands -* 100
Graydon Belgium N.V. Belgium 100 100
Graydon UK Ltd. United Kingdom 100 100
Status Credit Reports Ltd. United Kingdom 100 100
Giant.net BV Netherlands 100 100
Stichting Derdengelden Graydon Nederland Netherlands - -
Creditlink Netherlands - 100**
* In 2012 MarktSelect B.V. is merged with Graydon Nederland B.V.** In 2012 Creditlink is liquidated.
Notes to the 2012 Company financial statements

2 ReceivablesAll receivables are due within one year. Receivables on Group companies are included for an amount of C 2,497 (2011: C 2,611).
3 Equity
Share Share Legal Translation Retained Profit for 2012 2011 capital premium reserve reserve earnings the year Total Total
Balance at January 1st, 2012 1,500 1,376 8,996 -534 -7,972 10,647 14,013 18,832
Distribution of 2011 result 10,647 - 10,647
Total recognised income and expense 8,437 8,437 10,647
Transfer -1,194 1,194
Translation result 81 81 34
Dividends to shareholders - 15,500
Balance at December 31st, 2012 1,500 1,376 7,802 - 453 3,869 8,437 22,531 14,013
Authorized and issued capitalThe shares amount to C 1,- nominal each.
Number of shares Ordinary shares 2012 2011
Authorized and issued capital at January 1st 1,500 1,500
Authorized and issued capital at December 31st, 2012 – fully paid 1,500 1,500
Share premiumThis share premium represents the amount received from shareholders for shares in excess of the nominal value at the date of incorporation of the company.
ReservesThe reserves include a translation reserve and a legal reserve.
Translation reserveThe translation reserve comprises all foreign exchange differences arising from the translation of the financial statements of foreign operations that are not integral to the operations of the Company, as well as from the translation of liabilities that hedge the Company’s net investment in a foreign subsidiary.
Legal reserveThe legal reserve represents the amount to be held against the intangible assets. The reserve is not free at disposal to shareholders.
Graydon Annual Report 201238

Graydon Annual Report 2012 39
4 Current liabilitiesAll current liabilities are due within one year which relates of C 2,719 to Graydon Nederland B.V.
Remuneration of members of the Managing Board and the Board of Supervisory DirectorsIn case of one Managing Board member, Dutch legislation does not require to disclose the amount of this remuneration. Members of the Board of Supervisory Directors do not receive any remuneration.
A liability may exist with the tax authorities regarding the payment of the “crisis tax”. A charge on personnel salaries exceeding C 150 of 16 percent is effectuated. For Graydon Holding N.V. this amounts to C 60 that is recognized and disclosed appropriately.
Fees of the auditorWith reference to Section 2:382a(1) and (2) of the Netherlands Civil Code, the following fees for the financial year have been charged by KPMG Accountants NV to the company:
2012 2011
Statutory audit of annual accounts 147 93
Other assurance services 1 83
Tax advisory services - -
Other non-audit services - -
Total 148 176
Contingent liabilitiesThe Company has assumed unlimited liability as meant in Article 403, Part 9, Book 2 of the Netherlands Civil Code for the wholly owned Dutch subsidiaries whose financial statements have been included in the consolidated financial statements. Accordingly, these subsidiaries apply the exemption provided for in this article, in preparing and filing their financial statements.
The Company and its wholly owned Dutch subsidiaries form one tax unity. As a consequence, the company has full and unlimited liability for all tax liabilities resulting from the tax unit.
Amsterdam, March 20th, 2013
The Managing BoardMarcel van Es
The Supervisory BoardThomas Langen, ChairmanSophie LazarevitchGerard van KaathovenGertjan KampmanThomas KringsEric Vaingnedroye

1. Statutory profit allocationArticle 32 of the Articles of Association provides that:
1 The profit is at the disposal of the General Meeting of Shareholders.
2 Profit allocation can only take place with as maximum the distributable reserves.
3 Profit allocation takes place after adoption of the financial statements from which it appears that profit allocation is permissible.
2. Profit allocation for 2011In December 2011 an interim dividend of € 12,000 over 2011 was declared. € 8,000 was paid in December 2011 and € € 4,000 was paid in June 2012. € 10,647 was derived from profit of 2011 and € 1,353 out of retained earnings.
3. Proposed profit allocation for 2012The Managing Board proposes to the General Meeting of Shareholders to pay out the net profit of € €8,437 as cash dividend.
4. Independent auditor’s reportFor the independent auditor’s report we refer to page 41 of this report.
Graydon Annual Report 201240
Other Information
Graydon Annual Report 2012 41
To: the shareholders of Graydon Holding N.V.
Report on the financial statementsWe have audited the accompanying financial statements 2012 of Graydon Holding N.V., Amsterdam. The financial statements include the consolidated financial statements and the company financial statements. The consolidated financial statements comprise the consolidated statements of financial position as at 31 December 2012, the consolidated statements of comprehensive income and cash flows for the year then ended, and notes, comprising a summary of the significant accounting policies and other explanatory information. The company financial statements comprise the company statement of financial position as at 31 December 2012, the company statement of comprehensive income for the year then ended and the notes, comprising a summary of the accounting policies and other explanatory information.
The Managing Board’s responsibilityThe Managing Board is responsible for the preparation and fair presentation of these financial statements in accordance with International Financial Reporting Standards as adopted by the European Union and with Part 9 of Book 2 of the Netherlands Civil Code, and for the preparation of the annual report in accordance with Part 9 of Book 2 of the Netherlands Civil Code. Furthermore, the Managing Board is responsible for such internal control as it determines is necessary to enable the preparation of the financial statements that are free from material misstatement, whether due to fraud or error.
Auditor’s responsibilityOur responsibility is to express an opinion on these financial statements based on our audit. We conducted our audit in accordance with Dutch law, including the Dutch Standards on Auditing. This requires that we comply with ethical requirements and plan and perform the audit to obtain reasonable assurance about whether the financial statements are free from material misstatement.
An audit involves performing procedures to obtain audit evidence about the amounts and disclosures in the financial statements. The procedures selected depend on the auditor’s judgment, including the assessment of the risks of material misstatement of the financial statements, whether due to fraud or error. In making those risk assessments, the auditor considers internal control relevant to the entity’s preparation and fair presentation of the financial statements in order to design audit procedures that are appropriate in the circumstances, but not for the purpose of expressing an opinion on the effectiveness of the entity’s internal
control. An audit also includes evaluating the appropriateness of accounting policies used and the reasonableness of accounting estimates made by the Managing Board, as well as evaluating the overall presentation of the financial statements.
We believe that the audit evidence we have obtained is sufficient and appropriate to provide a basis for our audit opinion.
Opinion with respect to the consolidated financial statementsIn our opinion, the consolidated financial statements give a true and fair view of the financial position of Graydon Holding N.V. as at 31 December 2012 and of its result and its cash flows for the year then ended in accordance with International Financial Reporting Standards as adopted by the European Union and with Part 9 of Book 2 of the Netherlands Civil Code.
Opinion with respect to the company financial statementsIn our opinion, the company financial statements give a true and fair view of the financial position of Graydon Holding N.V. as at 31 December 2012 and of its result for the year then ended in accordance with Part 9 of Book 2 of the Netherlands Civil Code.
Report on other legal and regulatory requirementsPursuant to the legal requirements under Section 2:393 sub 5 at e and f of the Netherlands Civil Code, we have no deficiencies to report as a result of our examination whether the annual report, to the extent we can assess, has been prepared in accordance with Part 9 of Book 2 of this Code, and whether the information as required under Section 2:392 sub 1 at b - h has been annexed. Further, we report that the annual report, to the extent we can assess, is consistent with the financial statements as required by Section 2:391 sub 4 of the Netherlands Civil Code.
Utrecht, March 20, 2013
KPMG Accountants N.V.A. Zoetbrood RA
Independent auditor’s report

Graydon Holding N.VHullenbergweg 2601101 BV Amsterdam, The NetherlandsTelephone: +31 20 567 9768Fax: +31 20 691 3520Email: [email protected]
Graydon Nederland B.V.Hullenbergweg 2501101 BV Amsterdam, The NetherlandsTelephone: +31 20 567 9999Fax: +31 20 696 3639Email: [email protected]: www.graydon.nl
Kisys Krediet Informatie Systemen B.V.Hullenbergweg 2701101 BV Amsterdam, The NetherlandsTelephone: +31 20 567 9567Fax: +31 20 567 9550Email: [email protected]: www.kisys.nl
Graydon Belgium N.V.Uitbreidingstraat 84 Bus 12600 Berchem, BelgiumTelephone: +32 32 808 800Fax: +32 32 808 899Email: [email protected]: www.graydon.be
Graydon UK Ltd.2nd Floor Hygeia Building66 College Road, Harrow MiddlesexHA1 1BE, United KingdomTelephone: +44 208 515 1400Fax: +44 208 515 1499Email: [email protected]: www.graydon.co.uk
Giant-Net BVHullenbergweg 2601101 BV Amsterdam,The Netherlands Telephone: +31 20 5679702Fax: +31 20 6913520
Graydon Annual Report 201242
Addresses


Graydon Holding N.V.Hullenbergweg 2601101 BV AmsterdamThe Netherlands
www.graydon.nl