annual report 2015 - amazon simple storage serviceannual+report.pdf · serving as las vegas’...
TRANSCRIPT

TAKING CENTER STAGEA N N U A L R E P O R T 2 0 1 5
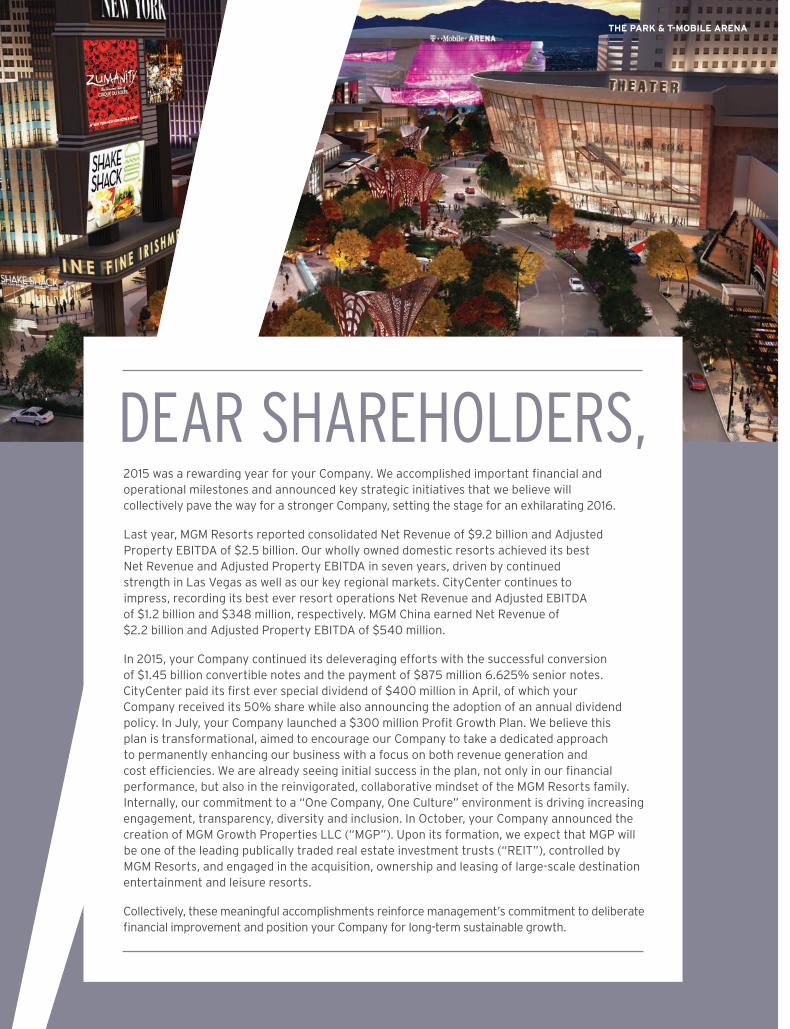
DEAR SHAREHOLDERS,2015 was a rewarding year for your Company. We accomplished important financial and operational milestones and announced key strategic initiatives that we believe will collectively pave the way for a stronger Company, setting the stage for an exhilarating 2016.
Last year, MGM Resorts reported consolidated Net Revenue of $9.2 billion and Adjusted Property EBITDA of $2.5 billion. Our wholly owned domestic resorts achieved its best Net Revenue and Adjusted Property EBITDA in seven years, driven by continued strength in Las Vegas as well as our key regional markets. CityCenter continues to impress, recording its best ever resort operations Net Revenue and Adjusted EBITDA of $1.2 billion and $348 million, respectively. MGM China earned Net Revenue of $2.2 billion and Adjusted Property EBITDA of $540 million.
In 2015, your Company continued its deleveraging efforts with the successful conversion of $1.45 billion convertible notes and the payment of $875 million 6.625% senior notes. CityCenter paid its first ever special dividend of $400 million in April, of which your Company received its 50% share while also announcing the adoption of an annual dividend policy. In July, your Company launched a $300 million Profit Growth Plan. We believe this plan is transformational, aimed to encourage our Company to take a dedicated approach to permanently enhancing our business with a focus on both revenue generation and cost efficiencies. We are already seeing initial success in the plan, not only in our financial performance, but also in the reinvigorated, collaborative mindset of the MGM Resorts family. Internally, our commitment to a “One Company, One Culture” environment is driving increasing engagement, transparency, diversity and inclusion. In October, your Company announced the creation of MGM Growth Properties LLC (“MGP”). Upon its formation, we expect that MGP will be one of the leading publically traded real estate investment trusts (“REIT”), controlled by MGM Resorts, and engaged in the acquisition, ownership and leasing of large-scale destination entertainment and leisure resorts.
Collectively, these meaningful accomplishments reinforce management’s commitment to deliberate financial improvement and position your Company for long-term sustainable growth.
THE PARK & T-MOBILE ARENA

LAS VEGAS 2015 visitation to Las Vegas set a record at 42.3 million visitors supported by another strong year of convention business with year-over-year city-wide convention attendance up 13.4%. With more than 40,000 hotel rooms and over 3 million-square-feet of premium convention and meeting space, MGM Resorts is the market leader. In 2016, we completed the expansion of the 2.1 million square-foot Mandalay Bay Convention Center, and reaffirmed our position as the #1 entertainment provider by selling close to six million tickets to live performances.
In every way, MGM Resorts is the primary contributor to, and beneficiary of, the city’s success.
In 2015, MGM Resorts’ wholly owned Las Vegas Strip Adjusted Property EBITDA increased 11% year-over-year, driven by an increase in wholly owned RevPAR of 7% year-over-year and margin expansion of approximately 180 basis points to 26.1%.
WE CONTINUE TO INVEST IN OUR PREMIER ASSETS TO ENRICH AND DELIVER UNPARALLELED GUEST EXPERIENCES AND WE HAVE EXCITING PROJECTS OPENING IN 2016.
Serving as Las Vegas’ newest landmark, the LEED Gold-certified, 20,000 seat T-Mobile Arena dazzled audiences at its grand opening on April 6, 2016. The arena brings versatility to the entertainment capital of the world and is expected to host more than 100 world-class events annually ranging from sporting events such as UFC, boxing, hockey and basketball to top high-profile concerts and award shows.
The Park, a dining and entertainment district spanning more than six acres, debuted April 4, 2016, with an eclectic blend of restaurants, bars and entertainment tucked into rich desert landscaping and will serve as the central gathering place on The Strip’s west side, connecting New York-New York and Monte Carlo resorts and the new T-Mobile Arena.
The 5,300 seat theater at Monte Carlo Resort and Casino is on schedule to open in late 2016. This new venue will elevate and further diversify MGM Resorts’ entertainment offerings on the Las Vegas Strip by hosting special engagements from many of the music industry’s most celebrated performers.
U.S. REGIONAL DEVELOPMENT We are expanding our presence on the East Coast with MGM National Harbor and MGM Springfield. MGM National Harbor, expected to open in late 2016, is a luxury casino resort with the world’s top entertainment, including a 3,000 seat theater and fine dining from local and celebrity chefs, as well as a diverse array of retailers. The MGM Springfield project envisions an exciting and lively residential, retail, dining and entertainment district that preserves much of downtown’s most iconic architecture while initiating a rebirth of the city’s downtown neighborhood. MGM Springfield is expected to open late 2018.
MGM CHINA MGM China remains committed to the diversification of tourism in Macau and is looking forward to opening its second property on Cotai in early 2017. MGM China’s focus on operating efficiency, product diversification and community engagement sets the stage for continued success as the market evolves to become the top tourist destination in Asia.
IN 2015, COMPANY EMPLOYEES VOLUNTEERED 157,850 HOURS TO NONPROFIT ORGANIZATIONS.
CORPORATE SOCIAL RESPONSIBILITY We practice corporate social responsibility as a moral and business imperative that is integral to our core values, culture and operations—leading to sustained competitiveness, growth and long-term value for our Company, our communities and our society. Through vigorous Corporate Social Responsibility initiatives we are uniting our highly engaged employees in our mission of superior guest service, innovation through team diversity and collaboration, impactful community investment and enduring environmental stewardship. Our quest for continuous excellence in Corporate Social Responsibility as well as our for-profit business has underscored our reputation as a premiere leader in corporate America and one of the world’s most admired companies, as recognized by the Reputation Institute, Diversity Inc, the Human Rights Campaign, the Global Gaming Expo and Fortune Magazine, among others.
Jim MurrenChairman and Chief Executive Officer
Your Company’s accomplishments in 2015 further enhanced
its reputation as one of the leading hospitality companies
in the world, one that is widely recognized for ingenuity
in building long-term value for our guests, employees,
shareholders and communities in which we operate. I’m
excited for MGM Resorts International to take the stage
in 2016 for what will be an exhilarating year and I thank
you for your commitment to this remarkable Company.
2015 Annual Report — Financial Section
CONTENTS
Selected Financial Data . . . . . . . . . . . . . . . . . . . . . . . . . . . . . . . . . . . . . . . . . . . . . . . . . . . . . . . . . . . . . . . . . . . . . . . . . . . . . . . . . . . . . . . . . . . . . . . . 2
Management’s Discussion and Analysis of Financial Condition and Results of Operations . . . . . . . . . . . . . . . . . . . . . 4
Management’s Annual Report on Internal Control Over Financial Reporting . . . . . . . . . . . . . . . . . . . . . . . . . . . . . . . . . . . . 30
Reports of Independent Registered Public Accounting Firm . . . . . . . . . . . . . . . . . . . . . . . . . . . . . . . . . . . . . . . . . . . . . . . . . . . . . . . 31
Consolidated Balance Sheets . . . . . . . . . . . . . . . . . . . . . . . . . . . . . . . . . . . . . . . . . . . . . . . . . . . . . . . . . . . . . . . . . . . . . . . . . . . . . . . . . . . . . . . . . . 33
Consolidated Statements of Operations . . . . . . . . . . . . . . . . . . . . . . . . . . . . . . . . . . . . . . . . . . . . . . . . . . . . . . . . . . . . . . . . . . . . . . . . . . . . . . . 34
Consolidated Statements of Comprehensive Income (Loss) . . . . . . . . . . . . . . . . . . . . . . . . . . . . . . . . . . . . . . . . . . . . . . . . . . . . . . . . 35
Consolidated Statements of Cash Flows . . . . . . . . . . . . . . . . . . . . . . . . . . . . . . . . . . . . . . . . . . . . . . . . . . . . . . . . . . . . . . . . . . . . . . . . . . . . . . 36
Consolidated Statements of Stockholders’ Equity . . . . . . . . . . . . . . . . . . . . . . . . . . . . . . . . . . . . . . . . . . . . . . . . . . . . . . . . . . . . . . . . . . . 37
Notes to Consolidated Financial Statements . . . . . . . . . . . . . . . . . . . . . . . . . . . . . . . . . . . . . . . . . . . . . . . . . . . . . . . . . . . . . . . . . . . . . . . . . 38

SELECTED FINANCIAL DATA
The following reflects selected historical financial data that should be read in conjunction with“Management’s Discussion and Analysis of Financial Condition and Results of Operations” and the consolidatedfinancial statements and notes thereto included elsewhere in this Annual Report. The financial informationpresented below has been adjusted for adoption of Accounting Standard Update No. 2015-03, “Simplifying thePresentation of Debt Issuance Cost,” (“ASU 2015-03”), which requires debt issuance costs to be presented in thebalance sheet as a direct deduction from the carrying amount of the related debt liability. Additionally, priorperiod amounts have not been adjusted for adoption of Accounting Standard Update No. 2015-17, “BalanceSheet Classification of Deferred Taxes,” (“ASU 2015-17”), which we early adopted on a prospective basis. ASU2015-17 requires that deferred tax liabilities and assets, along with any related valuation allowance, be classifiedas noncurrent in a classified statement of financial position. For additional information, please see recently issuedaccounting standards section in Note 2 to the accompanying consolidated financial statements. The historicalresults are not necessarily indicative of the results of operations to be expected in the future.
2015 2014 2013 2012 2011
(In thousands, except per share data)
Net revenues . . . . . . . . . . . . . . . . . . . . . . . . . . . . . . . . . . . . . . . . $ 9,190,068 $ 10,081,984 $ 9,809,663 $ 9,160,844 $ 7,849,312Operating income (loss) . . . . . . . . . . . . . . . . . . . . . . . . . . . . (156,232) 1,323,538 1,137,281 121,351 4,105,779Net income (loss) . . . . . . . . . . . . . . . . . . . . . . . . . . . . . . . . . . . (1,039,649) 127,178 41,374 (1,616,912) 3,238,125Net income (loss) attributable to MGM Resorts
International . . . . . . . . . . . . . . . . . . . . . . . . . . . . . . . . . . . . . . (447,720) (149,873) (171,734) (1,767,691) 3,117,818
Earnings per share of common stock attributableto MGM Resorts International:
Basic:Net income (loss) per share . . . . . . . . . . . . . . . . . . $ (0.82) $ (0.31) $ (0.35) $ (3.62) $ 6.38Weighted average number of shares . . . . . . . . . 542,873 490,875 489,661 488,988 488,652
Diluted:Net income (loss) per share . . . . . . . . . . . . . . . . . . $ (0.82) $ (0.31) $ (0.35) $ (3.62) $ 5.63Weighted average number of shares . . . . . . . . . 542,873 490,875 489,661 488,988 560,895
At-year end:Total assets . . . . . . . . . . . . . . . . . . . . . . . . . . . . . . . . . . . . . . . $ 25,215,178 $ 26,593,914 $ 25,961,843 $ 26,157,799 $ 27,653,655Total debt, including capital leases . . . . . . . . . . . . . 12,713,416 14,063,563 13,326,441 13,462,968 13,359,642Stockholders’ equity . . . . . . . . . . . . . . . . . . . . . . . . . . . . . 7,764,427 7,628,274 7,860,495 8,116,016 9,882,222MGM Resorts International stockholders’
equity . . . . . . . . . . . . . . . . . . . . . . . . . . . . . . . . . . . . . . . . . . . 5,119,927 4,090,917 4,216,051 4,365,548 6,086,578MGM Resorts International stockholders’
equity per share . . . . . . . . . . . . . . . . . . . . . . . . . . . . . . . $ 9.06 $ 8.33 $ 8.60 $ 8.92 $ 12.45Number of shares outstanding . . . . . . . . . . . . . . . . . . 564,839 491,292 490,361 489,234 488,835
The following events/transactions affect the year-to-year comparability of the selected financial datapresented above:
Acquisitions and Dispositions
• In 2011, we acquired an additional 1% of the overall capital stock in MGM China (and obtained a controllinginterest) and thereby became the indirect owner of 51% of MGM China. We recorded a gain of $3.5 billion onthe transaction. As a result of our acquisition of the additional 1% share of MGM China, we beganconsolidating the results of MGM China on June 3, 2011 and ceased recording the results of MGM Macau asan equity method investment.
2
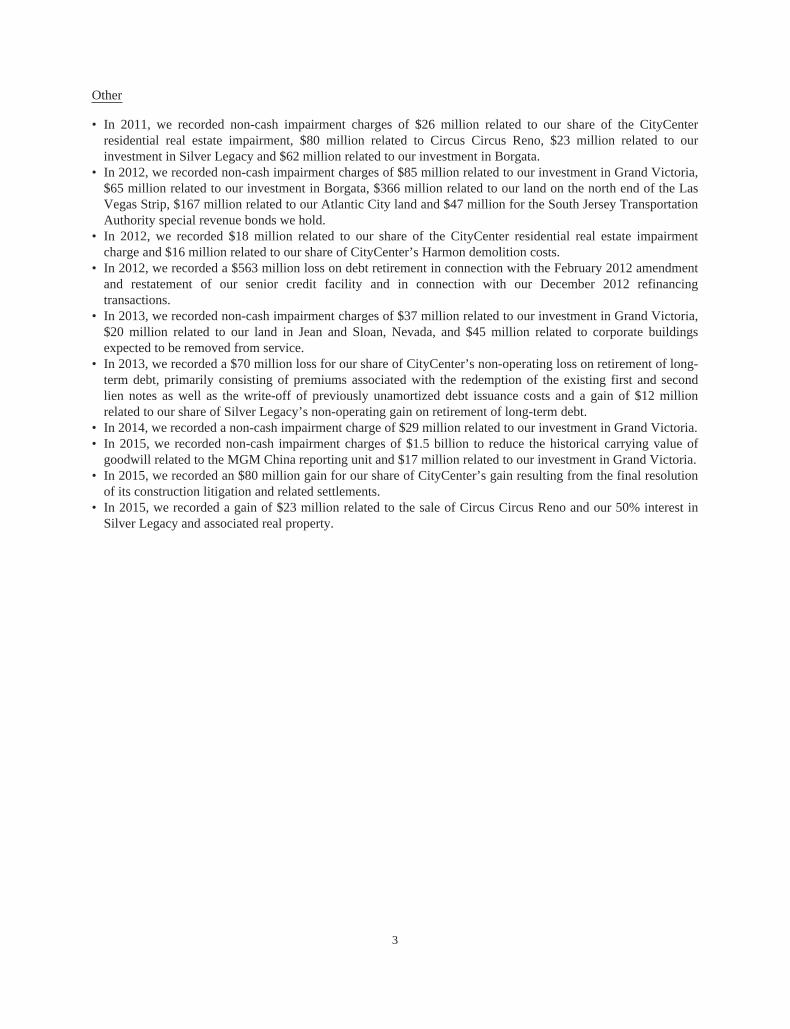
Other
• In 2011, we recorded non-cash impairment charges of $26 million related to our share of the CityCenterresidential real estate impairment, $80 million related to Circus Circus Reno, $23 million related to ourinvestment in Silver Legacy and $62 million related to our investment in Borgata.
• In 2012, we recorded non-cash impairment charges of $85 million related to our investment in Grand Victoria,$65 million related to our investment in Borgata, $366 million related to our land on the north end of the LasVegas Strip, $167 million related to our Atlantic City land and $47 million for the South Jersey TransportationAuthority special revenue bonds we hold.
• In 2012, we recorded $18 million related to our share of the CityCenter residential real estate impairmentcharge and $16 million related to our share of CityCenter’s Harmon demolition costs.
• In 2012, we recorded a $563 million loss on debt retirement in connection with the February 2012 amendmentand restatement of our senior credit facility and in connection with our December 2012 refinancingtransactions.
• In 2013, we recorded non-cash impairment charges of $37 million related to our investment in Grand Victoria,$20 million related to our land in Jean and Sloan, Nevada, and $45 million related to corporate buildingsexpected to be removed from service.
• In 2013, we recorded a $70 million loss for our share of CityCenter’s non-operating loss on retirement of long-term debt, primarily consisting of premiums associated with the redemption of the existing first and secondlien notes as well as the write-off of previously unamortized debt issuance costs and a gain of $12 millionrelated to our share of Silver Legacy’s non-operating gain on retirement of long-term debt.
• In 2014, we recorded a non-cash impairment charge of $29 million related to our investment in Grand Victoria.• In 2015, we recorded non-cash impairment charges of $1.5 billion to reduce the historical carrying value of
goodwill related to the MGM China reporting unit and $17 million related to our investment in Grand Victoria.• In 2015, we recorded an $80 million gain for our share of CityCenter’s gain resulting from the final resolution
of its construction litigation and related settlements.• In 2015, we recorded a gain of $23 million related to the sale of Circus Circus Reno and our 50% interest in
Silver Legacy and associated real property.
3

MANAGEMENT’S DISCUSSION AND ANALYSIS OF FINANCIAL CONDITION ANDRESULTS OF OPERATIONS
Executive Overview
Our primary business is the ownership and operation of casino resorts, which offer gaming, hotel,convention, dining, entertainment, retail and other resort amenities. We own or invest in several of the finestcasino resorts in the world and we continually reinvest in our resorts to maintain our competitive advantage.Most of our revenue is cash-based, through customers wagering with cash or paying for non-gaming serviceswith cash or credit cards. We rely heavily on the ability of our resorts to generate operating cash flow to fundcapital expenditures, provide excess cash flow for future development and repay debt financings. We makesignificant investments in our resorts through newly remodeled hotel rooms, restaurants, entertainment andnightlife offerings, as well as other new features and amenities.
According to the Las Vegas Convention and Visitors Authority, Las Vegas visitor volume increased 3%,Las Vegas Strip REVPAR increased 3% and Las Vegas Strip gaming revenue decreased less than 1% in the yearended December 31, 2015. Results of operations for our wholly owned domestic resorts during 2015 benefitedfrom an increase in operating margins resulting from increases in gaming revenue and REVPAR. Our roomsrevenue benefited from increased visitation to the Las Vegas market and robust convention business at our LasVegas Strip resorts, which resulted in increases in occupancy and allowed us to yield higher room rates acrossour portfolio of resorts.
Gross gaming revenues in the Macau market decreased 34% in 2015 compared to 2014. We believeoperating results have been negatively affected by economic conditions and certain policy initiatives in Chinaand the implementation of a full main floor casino smoking ban in October 2014. Additionally, we believestricter enforcement of entrance into Macau via the use of transit visas, as well as a decrease in duration of staypermitted for transit visa holders, has negatively affected operating results; however, restrictions surrounding theuse of transit visas were eased in July 2015. The decrease in gross gaming revenues accelerated during thesecond half of 2014 and continued throughout 2015 as Macau has become an increasingly challenging andcompetitive market, impacting primarily VIP casino gaming operations and, to a lesser extent, main flooroperations. According to statistics published by the Statistics and Census Service of the Macau Government,visitor arrivals decreased 3% in 2015 compared to 2014. Despite concerns over the recent events and thesustainability of economic growth in China, we expect the Macau market to grow on a long-term basis due tofurther development and penetration of the mainland China market and infrastructure improvements expected tofacilitate more convenient travel to and within Macau.
Our results of operations are affected by decisions we make related to our capital allocation, our access tocapital and our cost of capital. While we continue to be focused on improving our financial position, we are alsodedicated to capitalizing on development opportunities. In Macau, we plan to spend approximately $3.0 billion,excluding development fees eliminated in consolidation, capitalized interest and land related costs, to developMGM Cotai, a resort and casino with capacity for up to 500 gaming tables and up to 1,500 slots, and featuringapproximately 1,500 hotel rooms, built on an approximately 18 acre site on the Cotai Strip in Macau. The actualnumber of gaming tables allocated to MGM Cotai will be determined by the Macau government prior to opening,and such allocation may be less than our 500 gaming table capacity. MGM Cotai is expected to open at the endof the first quarter of 2017.
We were awarded the sixth and final casino license under current statutes in the State of Maryland by theMaryland Video Lottery Facility Location Commission to build and operate MGM National Harbor, a destinationcasino resort in Prince George’s County at National Harbor, which is a waterfront development located on thePotomac River just outside of Washington, D.C. We currently expect the cost to develop and construct MGMNational Harbor to be approximately $1.3 billion, excluding capitalized interest and land related costs. Wedesigned the resort to include a casino with approximately 3,600 slots and 160 table games including poker; a300-room hotel with luxury spa and rooftop pool; 93,100 square feet of high-end branded retail and fine and
4

casual dining; a 3,000-seat theater venue; 50,000 square feet of meeting and event space; and a 4,700-spaceparking garage. We expect MGM National Harbor to open in the fourth quarter of 2016.
We were awarded a casino license to build and operate MGM Springfield in Springfield, Massachusetts.MGM Springfield will be developed on approximately 14 acres of land in downtown Springfield, Massachusetts.MGM’s plans for the resort currently include a casino with approximately 3,000 slots and 100 table gamesincluding poker; a 250-room hotel; 100,000 square feet of retail and restaurant space; 44,000 square feet ofmeeting and event space; and a 3,375-space parking garage; with an expected development and construction costof approximately $865 million, excluding capitalized interest and land-related costs. Construction of MGMSpringfield is expected to be completed in late 2018.
We entered into an agreement with a subsidiary of Anschutz Entertainment Group, Inc. (“AEG”) to design,construct, and operate an arena, which will be located on a parcel of our land between Frank Sinatra Drive andNew York-New York, adjacent to the Las Vegas Strip. We and AEG each own 50% of Las Vegas ArenaCompany, the developer of the arena. In September 2014, a wholly owned subsidiary of Las Vegas ArenaCompany entered into a $200 million senior secured credit facility to finance construction of the arena. The LasVegas Arena Company recently entered into a multi-year naming rights agreement with T-Mobile. T-MobileArena will seat between 18,000 and 20,000 people and is scheduled to open in the April 2016. Such developmentis estimated to cost approximately $350 million, excluding capitalized interest and land-related costs. In addition,we are building The Park entertainment district which connects to New York-New York, Monte Carlo andT-Mobile Arena.
In August 2015, we announced the implementation of a Profit Growth Plan for sustained growth and marginenhancement. The Profit Growth Plan’s initiatives are focused on improving business processes to optimize ourscale for greater efficiency and lower cost throughout our business, and to identify areas of opportunity toorganically drive incremental revenue growth. The Profit Growth Plan includes a large number of opportunitiesto enhance our business operations and we continue to explore additional opportunities to drive further marginenhancements. The plan is expected to result in approximately $300 million of annualized Adjusted EBITDAbenefit. The Profit Growth Plan has begun to show significant results and is expected to be fully realized by theend of 2017.
On October 29, 2015, we announced the formation of MGP as a newly formed subsidiary that we expect tobe taxed as a real estate investment trust (“REIT”) for U.S. federal income tax purposes. We intend to contributeto a newly-formed operating partnership that MGP will control through a general partner subsidiary the realestate associated with Mandalay Bay, The Mirage, New York-New York, Luxor, Monte Carlo, Excalibur, ThePark, MGM Grand Detroit, Beau Rivage and Gold Strike Tunica (collectively, the “Properties”). We also intendto incur approximately $4 billion of debt to refinance a portion of the debt outstanding under our existing seniorcredit facility and senior notes, which refinancing debt would be assumed by the operating partnership inconnection with the REIT transactions. One of our subsidiaries will then lease the Properties from MGP for useunder a long-term, “triple net” master lease agreement with a 10-year term that includes four five-year extensionsat our option. We will guarantee our subsidiary’s obligations under the master lease. We expect to retain throughsubsidiaries an approximate 70% economic interest in the new operating partnership, as well as voting control ofMGP through our ownership of a controlling share in MGP.
Reportable Segments
We have two reportable segments that are based on the regions in which we operate: wholly owneddomestic resorts and MGM China. We currently operate 12 wholly owned resorts in the United States. MGMChina’s operations consist of MGM Macau resort and the development of MGM Cotai on the Cotai Strip inMacau. We have additional business activities including investments in unconsolidated affiliates, our MGMHospitality operations and certain other corporate and management operations. CityCenter is our most significantunconsolidated affiliate, which we also manage for a fee. Our operations that are not segregated into separatereportable segments are reported as “corporate and other” operations in our reconciliations of segment results toconsolidated results.
5
Wholly owned domestic resorts. At December 31, 2015, our wholly owned domestic resorts consisted ofthe following casino resorts:
Las Vegas, Nevada: Bellagio, MGM Grand Las Vegas (including The Signature), Mandalay Bay(including Delano and Four Seasons), The Mirage, Luxor, New York-New York,Excalibur, Monte Carlo and Circus Circus Las Vegas.
Other: MGM Grand Detroit in Detroit, Michigan; Beau Rivage in Biloxi, Mississippi;Gold Strike Tunica in Tunica, Mississippi.
Over half of the net revenue from our wholly owned domestic resorts is derived from non-gamingoperations including hotel, food and beverage, entertainment and other non-gaming amenities. We market todifferent customer groups and utilize our significant convention and meeting facilities to maximize hoteloccupancy and customer volumes during off-peak times such as mid-week or during traditionally slower leisuretravel periods, which also leads to better labor utilization. Our operating results are highly dependent on demandfor our services, and the volume of customers at our resorts, which in turn affects the price we can charge for ourhotel rooms and other amenities. Also, we generate a significant portion of our revenue from our wholly owneddomestic resorts in Las Vegas, Nevada, which exposes us to certain risks, such as increased competition fromnew or expanded Las Vegas resorts, and from the expansion of gaming in the United States generally.
Key performance indicators related to gaming and hotel revenue at our wholly owned domestic resorts are:
• Gaming revenue indicators: table games drop and slots handle (volume indicators); “win” or “hold”percentage, which is not fully controllable by us. Our normal table games hold percentage is in the rangeof 18% to 22% of table games drop and our normal slots hold percentage is approximately 8.5% of slotshandle; and
• Hotel revenue indicators: hotel occupancy (a volume indicator); average daily rate (“ADR,” a priceindicator); and revenue per available room (“REVPAR,” a summary measure of hotel results, combiningADR and occupancy rate). Our calculation of ADR, which is the average price of occupied rooms perday, includes the impact of complimentary rooms. Complimentary room rates are determined based on ananalysis of retail or “cash” rates for each customer segment and each type of room product to estimatecomplimentary rates which are consistent with retail rates. Complimentary rates are reviewed at leastannually and on an interim basis if there are significant changes in market conditions. Because the mix ofrooms provided on a complimentary basis, particularly to casino customers, includes a disproportionatesuite component, the composite ADR including complimentary rooms is slightly higher than the ADR forcash rooms, reflecting the higher retail value of suites.
MGM China. We own a 51% controlling interest in MGM China, which owns MGM Grand Paradise, theMacau company that owns and operates MGM Macau and the related gaming subconcession and landconcessions, and is in the process of developing MGM Cotai, an integrated casino, hotel, and entertainmentresort on the Cotai Strip in Macau. We believe our investment in MGM China plays an important role inextending our reach internationally and will foster future growth and profitability.
Revenues at MGM Macau are generated from three primary customer segments in the Macau gamingmarket: VIP casino gaming operations, main floor gaming operations, and slot machine operations. VIP playersplay mostly in dedicated VIP rooms or designated gaming areas. VIP customers can be further divided intocustomers sourced by in-house VIP programs and those sourced through gaming promoters. A significant portionof our VIP volume is generated through the use of gaming promoters. Gaming promoters introduce VIP gamingplayers to MGM Macau, assist these customers with travel arrangements, and extend gaming credit to theseplayers. In exchange for their services, gaming promoters are compensated through payment of revenue-sharingarrangements or rolling chip turnover based commissions. In-house VIP players also typically receive acommission based on the program in which they participate. MGM Macau main floor operations primarilyconsist of walk-in and day trip visitors. Unlike gaming promoters and in-house VIP players, main floor players
6
do not receive commissions. The profit contribution from the main floor segment exceeds the VIP segment dueto commission costs paid to gaming promoters. Gaming revenues from the main floor segment have become anincreasingly significant portion of total gaming revenues in recent years and we believe this segment representsthe most potential for sustainable growth in the future.
VIP gaming at MGM Macau is conducted by the use of special purpose nonnegotiable gaming chips.Gaming promoters purchase these nonnegotiable chips from MGM Macau and in turn they sell these chips totheir players. The nonnegotiable chips allow MGM Macau to track the amount of wagering conducted by eachgaming promoters’ clients in order to determine VIP gaming play. Gaming promoter commissions are based oneither a percentage of actual win plus a monthly complimentary allowance based on a percentage of the rollingchip turnover their customers generate, or a percentage of the rolling chip turnover plus discounted offerings onnongaming amenities. The estimated portion of the gaming promoter payments that represent amounts passedthrough to VIP customers is recorded as a reduction of casino revenue, and the estimated portion retained by thegaming promoter for its compensation is recorded as casino expense. In-house VIP commissions are based on apercentage of rolling chip turnover and are recorded as a reduction of casino revenue.
In addition to the key performance indicators used by our wholly owned domestic resorts, MGM Macauutilizes “turnover,” which is the sum of nonnegotiable chip wagers won by MGM Macau calculated asnonnegotiable chips purchased plus nonnegotiable chips exchanged less nonnegotiable chips returned. Turnoverprovides a basis for measuring VIP casino win percentage. Win for VIP gaming operations at MGM Macau istypically in the range of 2.7% to 3.0% of turnover.
Corporate and other. Corporate and other includes our investments in unconsolidated affiliates and certainmanagement and other operations. See Note 1 and Note 6 to the accompanying consolidated financial statementsfor discussion of the Company’s unconsolidated affiliates.
Results of Operations
The following discussion is based on our consolidated financial statements for the years endedDecember 31, 2015, 2014 and 2013.
Summary Operating Results
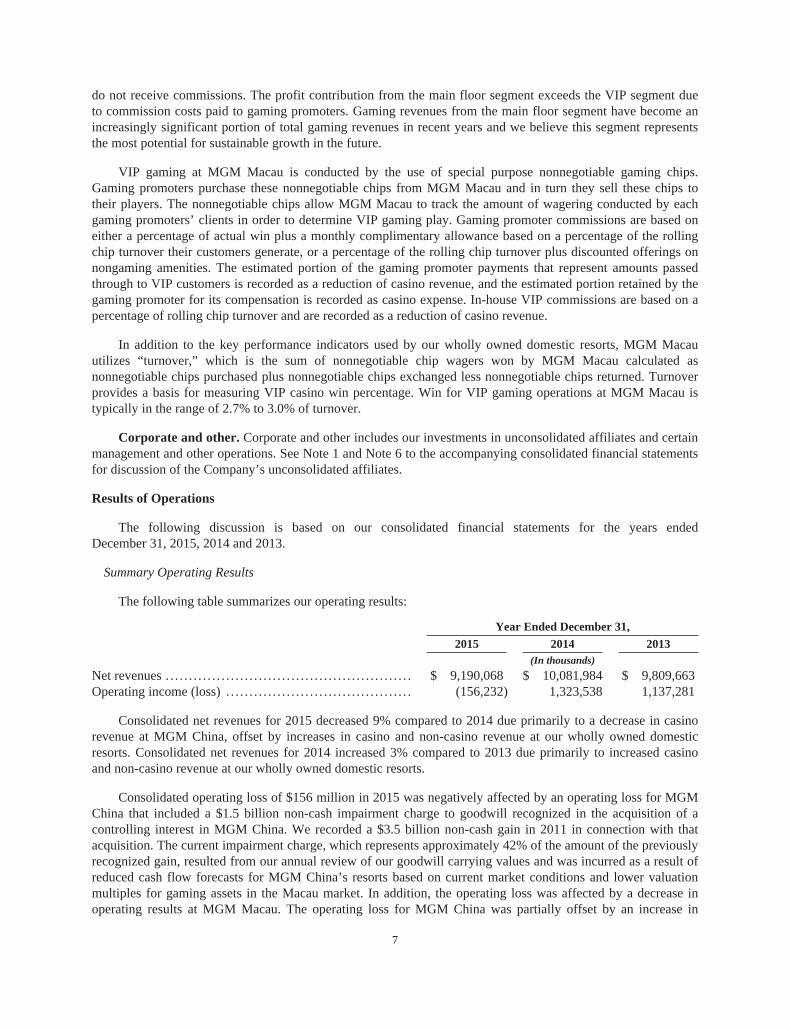
The following table summarizes our operating results:
Year Ended December 31,
2015 2014 2013(In thousands)
Net revenues . . . . . . . . . . . . . . . . . . . . . . . . . . . . . . . . . . . . . . . . . . . . . . . . . . . . . $ 9,190,068 $ 10,081,984 $ 9,809,663Operating income (loss) . . . . . . . . . . . . . . . . . . . . . . . . . . . . . . . . . . . . . . . . (156,232) 1,323,538 1,137,281
Consolidated net revenues for 2015 decreased 9% compared to 2014 due primarily to a decrease in casinorevenue at MGM China, offset by increases in casino and non-casino revenue at our wholly owned domesticresorts. Consolidated net revenues for 2014 increased 3% compared to 2013 due primarily to increased casinoand non-casino revenue at our wholly owned domestic resorts.
Consolidated operating loss of $156 million in 2015 was negatively affected by an operating loss for MGMChina that included a $1.5 billion non-cash impairment charge to goodwill recognized in the acquisition of acontrolling interest in MGM China. We recorded a $3.5 billion non-cash gain in 2011 in connection with thatacquisition. The current impairment charge, which represents approximately 42% of the amount of the previouslyrecognized gain, resulted from our annual review of our goodwill carrying values and was incurred as a result ofreduced cash flow forecasts for MGM China’s resorts based on current market conditions and lower valuationmultiples for gaming assets in the Macau market. In addition, the operating loss was affected by a decrease inoperating results at MGM Macau. The operating loss for MGM China was partially offset by an increase in
7
operating income at our wholly owned domestic resorts and an increase in income from unconsolidated affiliates,primarily from CityCenter, which included $80 million related to our share of the gain recognized by CityCenteras a result of the final resolution of its construction litigation and related settlements. In addition, corporateexpense increased 15% to $275 million in 2015, due primarily to costs incurred to implement initiatives inrelation to the Profit Growth Plan of $24 million and costs associated with our proposed REIT transaction of $20million. Preopening expense primarily related to our ongoing MGM Cotai, MGM Springfield and MGMNational Harbor development projects increased to $71 million in 2015 compared to $39 million in 2014.Consolidated operating loss in 2015 was also negatively affected by impairment charges and losses on disposalof certain assets, in addition to the MGM China goodwill impairment charge discussed above, recorded in“Property transactions, net.” See “Operating Results – Details of Certain Charges” below for additional detail onour preopening expense and property transactions.
Consolidated operating income of $1.3 billion in 2014 benefited from an increase in revenue at our whollyowned domestic resorts and an increase in main floor table games revenue at MGM China, as well as a decreasein property transactions, net to $41 million in 2014 compared to $125 million in 2013. In addition, depreciationand amortization expense decreased $33 million in 2014 compared to 2013, due primarily to certain assets at ourwholly owned resorts and MGM China becoming fully depreciated and a decrease in amortization expense forintangible assets. Operating income was negatively affected by increases in general and administrative expense,corporate expense and preopening expense. General and administrative expense increased primarily related to anincrease in payroll and related expense. Corporate expense increased 10% in 2014, due primarily to an increasein payroll costs and professional fees partially offset by a decrease in development related costs. Preopeningexpense increased to $39 million in 2014, compared to $13 million in 2013, primarily as a result of thecommencement of development on MGM Springfield and MGM National Harbor.
Operating Results – Detailed Segment Information
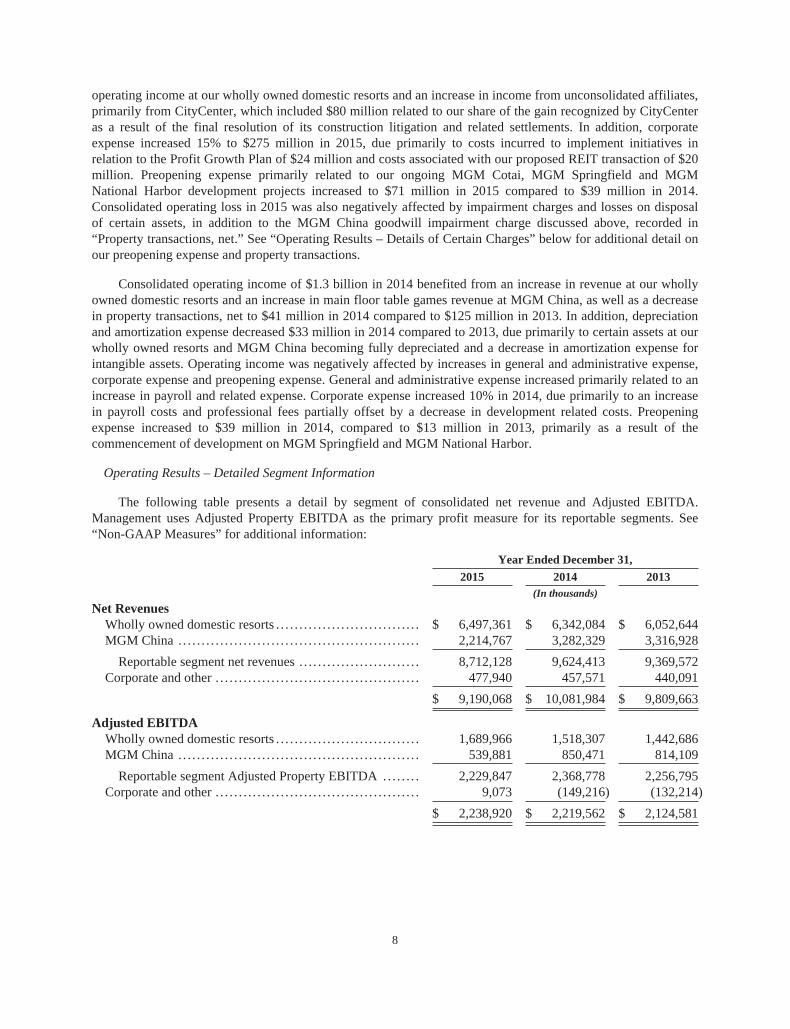
The following table presents a detail by segment of consolidated net revenue and Adjusted EBITDA.Management uses Adjusted Property EBITDA as the primary profit measure for its reportable segments. See“Non-GAAP Measures” for additional information:
Year Ended December 31,
2015 2014 2013(In thousands)
Net RevenuesWholly owned domestic resorts . . . . . . . . . . . . . . . . . . . . . . . . . . . . . . . $ 6,497,361 $ 6,342,084 $ 6,052,644MGM China . . . . . . . . . . . . . . . . . . . . . . . . . . . . . . . . . . . . . . . . . . . . . . . . . . . . 2,214,767 3,282,329 3,316,928
Reportable segment net revenues . . . . . . . . . . . . . . . . . . . . . . . . . . 8,712,128 9,624,413 9,369,572Corporate and other . . . . . . . . . . . . . . . . . . . . . . . . . . . . . . . . . . . . . . . . . . . . 477,940 457,571 440,091
$ 9,190,068 $ 10,081,984 $ 9,809,663
Adjusted EBITDAWholly owned domestic resorts . . . . . . . . . . . . . . . . . . . . . . . . . . . . . . . 1,689,966 1,518,307 1,442,686MGM China . . . . . . . . . . . . . . . . . . . . . . . . . . . . . . . . . . . . . . . . . . . . . . . . . . . . 539,881 850,471 814,109
Reportable segment Adjusted Property EBITDA .. . . . . . . 2,229,847 2,368,778 2,256,795Corporate and other . . . . . . . . . . . . . . . . . . . . . . . . . . . . . . . . . . . . . . . . . . . . 9,073 (149,216) (132,214)
$ 2,238,920 $ 2,219,562 $ 2,124,581
8

Wholly owned domestic resorts. The following table presents detailed net revenue at our wholly owneddomestic resorts:
Year Ended December 31,
2015 2014 2013(In thousands)
Casino revenue, netTable games . . . . . . . . . . . . . . . . . . . . . . . . . . . . . . . . . . . . . . . . . . . . . . . . . . . . . . . . . . . . . $ 880,318 $ 892,842 $ 861,495Slots . . . . . . . . . . . . . . . . . . . . . . . . . . . . . . . . . . . . . . . . . . . . . . . . . . . . . . . . . . . . . . . . . . . . . . 1,720,028 1,679,981 1,671,819Other . . . . . . . . . . . . . . . . . . . . . . . . . . . . . . . . . . . . . . . . . . . . . . . . . . . . . . . . . . . . . . . . . . . . . 70,148 64,419 66,257
Casino revenue, net . . . . . . . . . . . . . . . . . . . . . . . . . . . . . . . . . . . . . . . . . . . . . . . . . . 2,670,494 2,637,242 2,599,571Non-casino revenue
Rooms . . . . . . . . . . . . . . . . . . . . . . . . . . . . . . . . . . . . . . . . . . . . . . . . . . . . . . . . . . . . . . . . . . . 1,813,838 1,705,395 1,589,887Food and beverage . . . . . . . . . . . . . . . . . . . . . . . . . . . . . . . . . . . . . . . . . . . . . . . . . . . . . . 1,500,039 1,470,315 1,382,480Entertainment, retail and other . . . . . . . . . . . . . . . . . . . . . . . . . . . . . . . . . . . . . . . . . 1,167,488 1,184,343 1,130,298
Non-casino revenue . . . . . . . . . . . . . . . . . . . . . . . . . . . . . . . . . . . . . . . . . . . . . . . . . . 4,481,365 4,360,053 4,102,665
7,151,859 6,997,295 6,702,236Less: Promotional allowances . . . . . . . . . . . . . . . . . . . . . . . . . . . . . . . . . . . . . . . . . . . . (654,498) (655,211) (649,592)
$ 6,497,361 $ 6,342,084 $ 6,052,644
Casino revenue increased 1% in 2015 compared to 2014 due to a 2% increase in slots revenue as a result ofa 3% increase in slots volume. Table games revenue in 2015 decreased 1% compared to 2014 due to a decreasein table games volume of 1% and a decrease in tables games hold percentage to 20.5% in 2015 from 20.9% in2014.
Casino revenue in 2014 increased 1% compared to 2013 as a result of a 4% increase in table games revenuecompared to 2013 due to an increase in table games volume of 2% and an increase in tables games holdpercentage to 20.9% in 2014 from 20.5% in 2013. Slots revenue increased slightly compared to 2013.
Rooms revenue increased 6% in 2015 compared to 2014 as a result of a 7% increase in REVPAR at our LasVegas Strip resorts. Rooms revenue increased 7% in 2014 compared to 2013 as a result of an 8% increase inREVPAR at our Las Vegas Strip resorts. The following table shows key hotel statistics for our Las Vegas Stripresorts:
Year Ended December 31,
2015 2014 2013
Occupancy . . . . . . . . . . . . . . . . . . . . . . . . . . . . . . . . . . . . . . . . . . . . . . . . . . . . . . . 93% 93% 91%Average Daily Rate (ADR) . . . . . . . . . . . . . . . . . . . . . . . . . . . . . . . . . . . . . $ 149 $ 139 $ 131Revenue per Available Room (REVPAR) . . . . . . . . . . . . . . . . . . . . 138 129 119
Food and beverage revenues increased 2% in 2015 compared to 2014 primarily as a result of increasedconvention and banquet business as well as the opening of several new outlets. Food and beverage revenuesincreased 6% in 2014 compared to 2013 as a result of the same items noted above for the 2015 and 2014comparative period. Entertainment, retail and other revenues decreased 1% in 2015 compared to 2014 dueprimarily to a 5% decrease in revenue from Cirque du Soleil production shows, partially offset by a 5% increasein retail revenue. Entertainment, retail and other revenues increased 5% in 2014 compared to 2013, due primarilyto the Michael Jackson ONE Cirque du Soleil production show being open for the full year in 2014 compared toa partial year in 2013.
Adjusted Property EBITDA at our wholly owned domestic resorts was $1.7 billion in 2015, an increase of11% compared to 2014 due primarily to improved casino and non-casino revenue results at our wholly owned
9
domestic resorts as discussed above, and approximately $63 million of incremental Adjusted Property EBITDAas a result of the Company’s Profit Growth Plan initiatives. Adjusted Property EBITDA margin increased byapproximately 200 basis points to 26.0% in 2015.
Adjusted Property EBITDA at our wholly owned domestic resorts was $1.5 billion in 2014, an increase of5% compared to 2013 due primarily to improved casino and non-casino revenue results at our wholly owneddomestic resorts as discussed above, offset partially by a 4% increase in payroll and related expenses, includinghealth care costs and paid time off. Adjusted Property EBITDA margin increased by approximately 10 basispoints from 2013, to 23.9% in 2014.
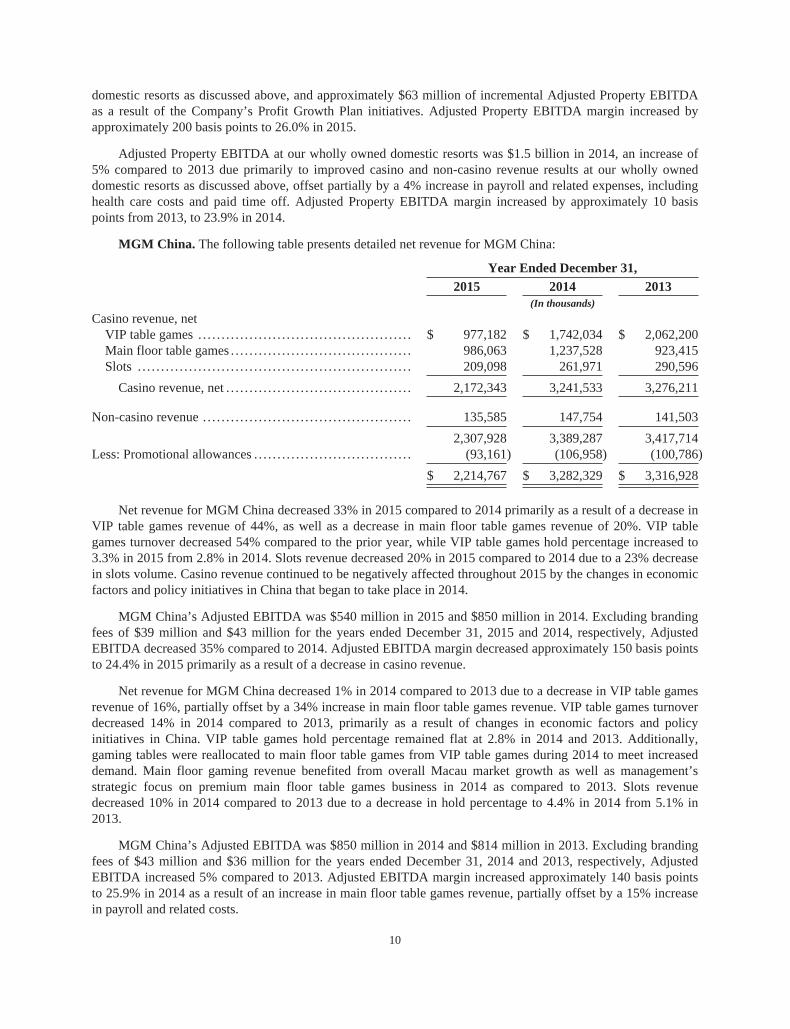
MGM China. The following table presents detailed net revenue for MGM China:
Year Ended December 31,
2015 2014 2013(In thousands)
Casino revenue, netVIP table games . . . . . . . . . . . . . . . . . . . . . . . . . . . . . . . . . . . . . . . . . . . . . . $ 977,182 $ 1,742,034 $ 2,062,200Main floor table games . . . . . . . . . . . . . . . . . . . . . . . . . . . . . . . . . . . . . . . 986,063 1,237,528 923,415Slots . . . . . . . . . . . . . . . . . . . . . . . . . . . . . . . . . . . . . . . . . . . . . . . . . . . . . . . . . . . 209,098 261,971 290,596
Casino revenue, net . . . . . . . . . . . . . . . . . . . . . . . . . . . . . . . . . . . . . . . . 2,172,343 3,241,533 3,276,211
Non-casino revenue . . . . . . . . . . . . . . . . . . . . . . . . . . . . . . . . . . . . . . . . . . . . . 135,585 147,754 141,503
2,307,928 3,389,287 3,417,714Less: Promotional allowances . . . . . . . . . . . . . . . . . . . . . . . . . . . . . . . . . . (93,161) (106,958) (100,786)
$ 2,214,767 $ 3,282,329 $ 3,316,928
Net revenue for MGM China decreased 33% in 2015 compared to 2014 primarily as a result of a decrease inVIP table games revenue of 44%, as well as a decrease in main floor table games revenue of 20%. VIP tablegames turnover decreased 54% compared to the prior year, while VIP table games hold percentage increased to3.3% in 2015 from 2.8% in 2014. Slots revenue decreased 20% in 2015 compared to 2014 due to a 23% decreasein slots volume. Casino revenue continued to be negatively affected throughout 2015 by the changes in economicfactors and policy initiatives in China that began to take place in 2014.
MGM China’s Adjusted EBITDA was $540 million in 2015 and $850 million in 2014. Excluding brandingfees of $39 million and $43 million for the years ended December 31, 2015 and 2014, respectively, AdjustedEBITDA decreased 35% compared to 2014. Adjusted EBITDA margin decreased approximately 150 basis pointsto 24.4% in 2015 primarily as a result of a decrease in casino revenue.
Net revenue for MGM China decreased 1% in 2014 compared to 2013 due to a decrease in VIP table gamesrevenue of 16%, partially offset by a 34% increase in main floor table games revenue. VIP table games turnoverdecreased 14% in 2014 compared to 2013, primarily as a result of changes in economic factors and policyinitiatives in China. VIP table games hold percentage remained flat at 2.8% in 2014 and 2013. Additionally,gaming tables were reallocated to main floor table games from VIP table games during 2014 to meet increaseddemand. Main floor gaming revenue benefited from overall Macau market growth as well as management’sstrategic focus on premium main floor table games business in 2014 as compared to 2013. Slots revenuedecreased 10% in 2014 compared to 2013 due to a decrease in hold percentage to 4.4% in 2014 from 5.1% in2013.
MGM China’s Adjusted EBITDA was $850 million in 2014 and $814 million in 2013. Excluding brandingfees of $43 million and $36 million for the years ended December 31, 2014 and 2013, respectively, AdjustedEBITDA increased 5% compared to 2013. Adjusted EBITDA margin increased approximately 140 basis pointsto 25.9% in 2014 as a result of an increase in main floor table games revenue, partially offset by a 15% increasein payroll and related costs.
10

Corporate and other. Corporate and other revenue includes revenues from other corporate operations,management services and reimbursed costs revenue primarily related to our CityCenter management agreement.Reimbursed costs revenue represents reimbursement of costs, primarily payroll-related, incurred by us inconnection with the provision of management services and was $399 million, $383 million and $365 million for2015, 2014 and 2013, respectively.
Adjusted EBITDA related to corporate and other in 2015 included our share of operating income fromCityCenter, including certain basis difference adjustments, compared to operating loss from CityCenter in theprior year, and an increase in our share of operating income from Borgata in 2015 compared to 2014. See“Operating Results – Income (Loss) from Unconsolidated Affiliates” for further discussion. The increases inincome from CityCenter and Borgata were partially offset by increased corporate expenses in 2015 compared to2014 as discussed previously under “Summary Operating Results.”
Adjusted EBITDA losses related to corporate and other increased in 2014 compared to 2013 due primarilyto our share of operating loss from CityCenter, including certain basis difference adjustments, compared tooperating income from CityCenter in the prior year, partially offset by an increase in our share of operatingincome from Borgata. See “Operating Results – Income (Loss) from Unconsolidated Affiliates” for furtherdiscussion. In addition, corporate expense increased in 2014 compared to 2013 as discussed previously under“Summary Operating Results.”
Operating Results – Details of Certain Charges
Stock compensation expense is recorded within the department of the recipient of the stock compensationaward. The following table shows the amount of compensation expense recognized after reimbursed costs andcapitalized costs related to employee stock-based awards:
Year Ended December 31,
2015 2014 2013(In thousands)
Casino . . . . . . . . . . . . . . . . . . . . . . . . . . . . . . . . . . . . . . . . . . . . . . . . . . . . . . . . . . . . $ 7,571 $ 7,351 $ 5,879Other operating departments . . . . . . . . . . . . . . . . . . . . . . . . . . . . . . . . . . . 2,580 2,257 2,241General and administrative . . . . . . . . . . . . . . . . . . . . . . . . . . . . . . . . . . . . . 10,729 9,323 8,176Corporate expense and other . . . . . . . . . . . . . . . . . . . . . . . . . . . . . . . . . . . 20,966 18,333 16,036
$ 41,846 $ 37,264 $ 32,332
Preopening and start-up expenses consisted of the following:
Year Ended December 31,
2015 2014 2013(In thousands)
MGM China . . . . . . . . . . . . . . . . . . . . . . . . . . . . . . . . . . . . . . . . . . . . . . . . . . . . . $ 13,863 $ 9,091 $ 9,109MGM National Harbor . . . . . . . . . . . . . . . . . . . . . . . . . . . . . . . . . . . . . . . . . . 32,837 19,521 -MGM Springfield . . . . . . . . . . . . . . . . . . . . . . . . . . . . . . . . . . . . . . . . . . . . . . . 19,654 5,261 -Other . . . . . . . . . . . . . . . . . . . . . . . . . . . . . . . . . . . . . . . . . . . . . . . . . . . . . . . . . . . . . . 4,973 5,384 4,205
$ 71,327 $ 39,257 $ 13,314
Preopening and start-up expenses at MGM China relate to the MGM Cotai project which includes $7million of amortization of the Cotai land concession premium in each of the years ended December 31, 2015,2014 and 2013. Preopening and startup expenses at MGM National Harbor include $19 million and $13 millionof rent expense for the years ended December 31, 2015 and 2014, respectively, which relates to the ground leasefor the land on which MGM National Harbor is being developed. Preopening and start-up expenses at MGMSpringfield primarily relate to licensing and assessment fees paid to the state and local governments.
11
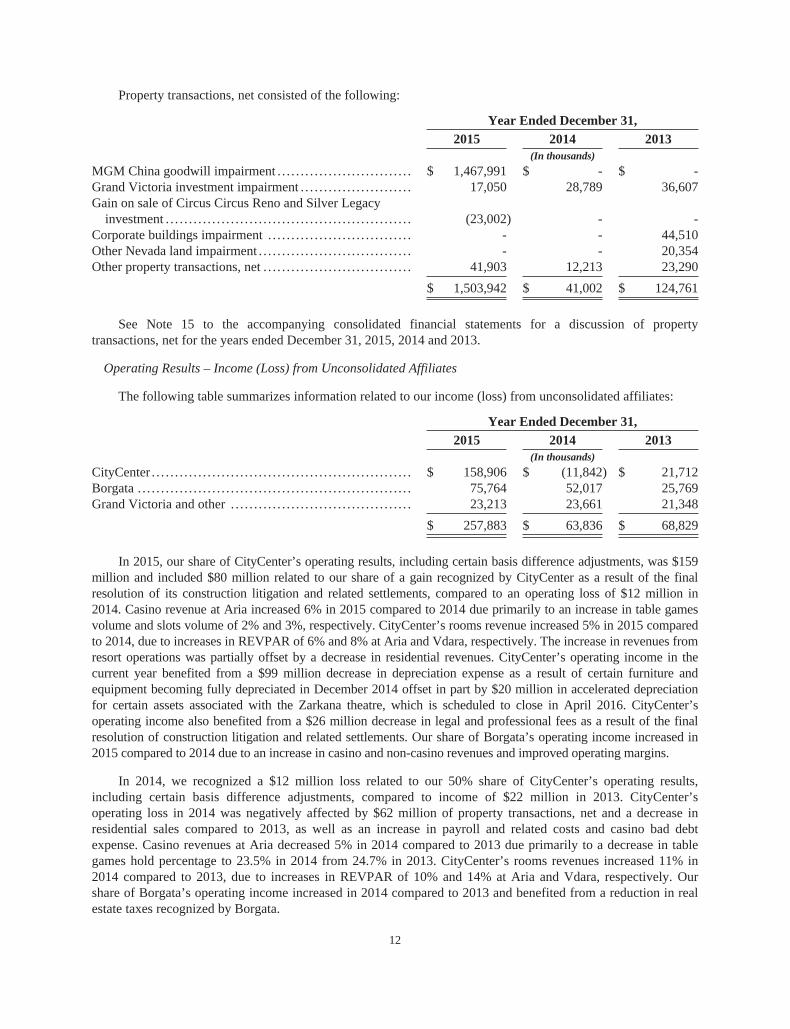
Property transactions, net consisted of the following:
Year Ended December 31,
2015 2014 2013(In thousands)
MGM China goodwill impairment . . . . . . . . . . . . . . . . . . . . . . . . . . . . . $ 1,467,991 $ - $ -Grand Victoria investment impairment . . . . . . . . . . . . . . . . . . . . . . . . 17,050 28,789 36,607Gain on sale of Circus Circus Reno and Silver Legacy
investment . . . . . . . . . . . . . . . . . . . . . . . . . . . . . . . . . . . . . . . . . . . . . . . . . . . . . (23,002) - -Corporate buildings impairment . . . . . . . . . . . . . . . . . . . . . . . . . . . . . . . - - 44,510Other Nevada land impairment . . . . . . . . . . . . . . . . . . . . . . . . . . . . . . . . . - - 20,354Other property transactions, net . . . . . . . . . . . . . . . . . . . . . . . . . . . . . . . . 41,903 12,213 23,290
$ 1,503,942 $ 41,002 $ 124,761
See Note 15 to the accompanying consolidated financial statements for a discussion of propertytransactions, net for the years ended December 31, 2015, 2014 and 2013.
Operating Results – Income (Loss) from Unconsolidated Affiliates
The following table summarizes information related to our income (loss) from unconsolidated affiliates:
Year Ended December 31,
2015 2014 2013(In thousands)
CityCenter . . . . . . . . . . . . . . . . . . . . . . . . . . . . . . . . . . . . . . . . . . . . . . . . . . . . . . . . $ 158,906 $ (11,842) $ 21,712Borgata . . . . . . . . . . . . . . . . . . . . . . . . . . . . . . . . . . . . . . . . . . . . . . . . . . . . . . . . . . . 75,764 52,017 25,769Grand Victoria and other . . . . . . . . . . . . . . . . . . . . . . . . . . . . . . . . . . . . . . . 23,213 23,661 21,348
$ 257,883 $ 63,836 $ 68,829
In 2015, our share of CityCenter’s operating results, including certain basis difference adjustments, was $159million and included $80 million related to our share of a gain recognized by CityCenter as a result of the finalresolution of its construction litigation and related settlements, compared to an operating loss of $12 million in2014. Casino revenue at Aria increased 6% in 2015 compared to 2014 due primarily to an increase in table gamesvolume and slots volume of 2% and 3%, respectively. CityCenter’s rooms revenue increased 5% in 2015 comparedto 2014, due to increases in REVPAR of 6% and 8% at Aria and Vdara, respectively. The increase in revenues fromresort operations was partially offset by a decrease in residential revenues. CityCenter’s operating income in thecurrent year benefited from a $99 million decrease in depreciation expense as a result of certain furniture andequipment becoming fully depreciated in December 2014 offset in part by $20 million in accelerated depreciationfor certain assets associated with the Zarkana theatre, which is scheduled to close in April 2016. CityCenter’soperating income also benefited from a $26 million decrease in legal and professional fees as a result of the finalresolution of construction litigation and related settlements. Our share of Borgata’s operating income increased in2015 compared to 2014 due to an increase in casino and non-casino revenues and improved operating margins.
In 2014, we recognized a $12 million loss related to our 50% share of CityCenter’s operating results,including certain basis difference adjustments, compared to income of $22 million in 2013. CityCenter’soperating loss in 2014 was negatively affected by $62 million of property transactions, net and a decrease inresidential sales compared to 2013, as well as an increase in payroll and related costs and casino bad debtexpense. Casino revenues at Aria decreased 5% in 2014 compared to 2013 due primarily to a decrease in tablegames hold percentage to 23.5% in 2014 from 24.7% in 2013. CityCenter’s rooms revenues increased 11% in2014 compared to 2013, due to increases in REVPAR of 10% and 14% at Aria and Vdara, respectively. Ourshare of Borgata’s operating income increased in 2014 compared to 2013 and benefited from a reduction in realestate taxes recognized by Borgata.
12
Non-operating Results
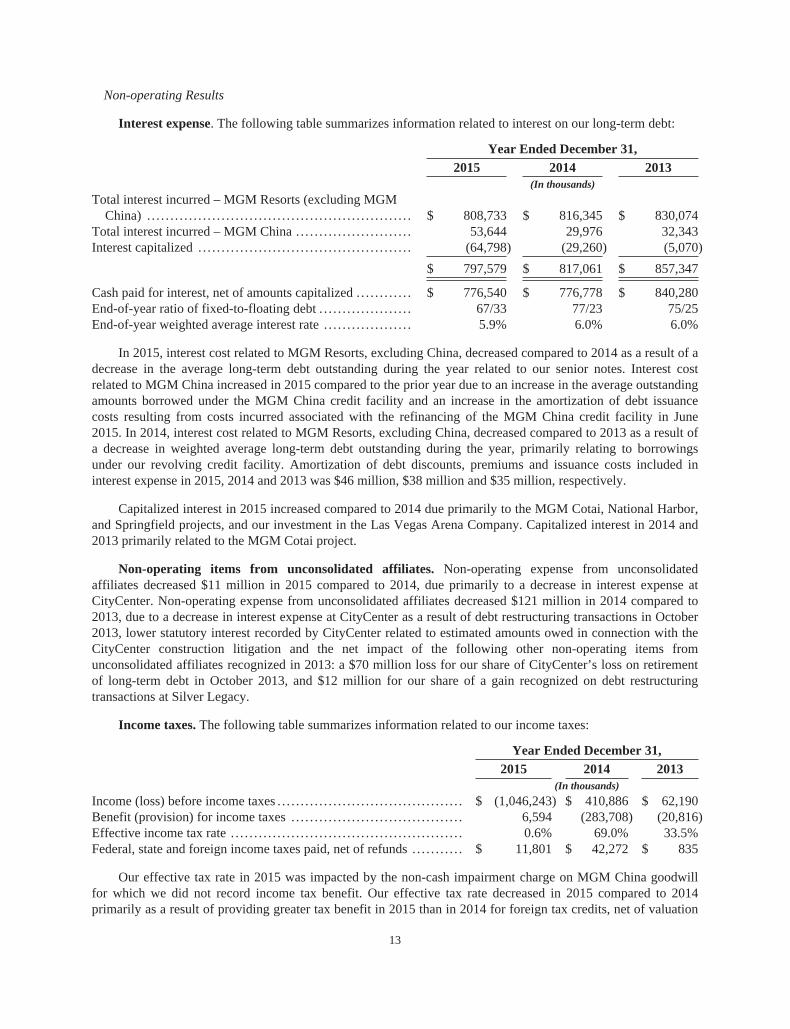
Interest expense. The following table summarizes information related to interest on our long-term debt:
Year Ended December 31,
2015 2014 2013(In thousands)
Total interest incurred – MGM Resorts (excluding MGMChina) . . . . . . . . . . . . . . . . . . . . . . . . . . . . . . . . . . . . . . . . . . . . . . . . . . . . . . . . . $ 808,733 $ 816,345 $ 830,074
Total interest incurred – MGM China . . . . . . . . . . . . . . . . . . . . . . . . . 53,644 29,976 32,343Interest capitalized . . . . . . . . . . . . . . . . . . . . . . . . . . . . . . . . . . . . . . . . . . . . . . (64,798) (29,260) (5,070)
$ 797,579 $ 817,061 $ 857,347
Cash paid for interest, net of amounts capitalized . . . . . . . . . . . . $ 776,540 $ 776,778 $ 840,280End-of-year ratio of fixed-to-floating debt . . . . . . . . . . . . . . . . . . . . 67/33 77/23 75/25End-of-year weighted average interest rate . . . . . . . . . . . . . . . . . . . 5.9% 6.0% 6.0%
In 2015, interest cost related to MGM Resorts, excluding China, decreased compared to 2014 as a result of adecrease in the average long-term debt outstanding during the year related to our senior notes. Interest costrelated to MGM China increased in 2015 compared to the prior year due to an increase in the average outstandingamounts borrowed under the MGM China credit facility and an increase in the amortization of debt issuancecosts resulting from costs incurred associated with the refinancing of the MGM China credit facility in June2015. In 2014, interest cost related to MGM Resorts, excluding China, decreased compared to 2013 as a result ofa decrease in weighted average long-term debt outstanding during the year, primarily relating to borrowingsunder our revolving credit facility. Amortization of debt discounts, premiums and issuance costs included ininterest expense in 2015, 2014 and 2013 was $46 million, $38 million and $35 million, respectively.
Capitalized interest in 2015 increased compared to 2014 due primarily to the MGM Cotai, National Harbor,and Springfield projects, and our investment in the Las Vegas Arena Company. Capitalized interest in 2014 and2013 primarily related to the MGM Cotai project.
Non-operating items from unconsolidated affiliates. Non-operating expense from unconsolidatedaffiliates decreased $11 million in 2015 compared to 2014, due primarily to a decrease in interest expense atCityCenter. Non-operating expense from unconsolidated affiliates decreased $121 million in 2014 compared to2013, due to a decrease in interest expense at CityCenter as a result of debt restructuring transactions in October2013, lower statutory interest recorded by CityCenter related to estimated amounts owed in connection with theCityCenter construction litigation and the net impact of the following other non-operating items fromunconsolidated affiliates recognized in 2013: a $70 million loss for our share of CityCenter’s loss on retirementof long-term debt in October 2013, and $12 million for our share of a gain recognized on debt restructuringtransactions at Silver Legacy.
Income taxes. The following table summarizes information related to our income taxes:
Year Ended December 31,
2015 2014 2013(In thousands)
Income (loss) before income taxes . . . . . . . . . . . . . . . . . . . . . . . . . . . . . . . . . . . . . . . . $ (1,046,243) $ 410,886 $ 62,190Benefit (provision) for income taxes . . . . . . . . . . . . . . . . . . . . . . . . . . . . . . . . . . . . . 6,594 (283,708) (20,816)Effective income tax rate . . . . . . . . . . . . . . . . . . . . . . . . . . . . . . . . . . . . . . . . . . . . . . . . . . 0.6% 69.0% 33.5%Federal, state and foreign income taxes paid, net of refunds . . . . . . . . . . . $ 11,801 $ 42,272 $ 835
Our effective tax rate in 2015 was impacted by the non-cash impairment charge on MGM China goodwillfor which we did not record income tax benefit. Our effective tax rate decreased in 2015 compared to 2014primarily as a result of providing greater tax benefit in 2015 than in 2014 for foreign tax credits, net of valuation
13

allowance, partially offset by tax benefit resulting from audit settlements in 2014. Our effective tax rate increasedin 2014 compared to 2013 primarily as a result of the reduced tax benefit in 2014 for foreign tax credits, net ofvaluation allowance, partially offset by tax provision in 2013 resulting from re-measuring the Macau net deferredtax liability due to the extension of the amortization period of the MGM China gaming subconcession uponeffectiveness of the Cotai land concession.
Cash taxes paid decreased in 2015 compared to 2014 primarily as a result of a $16 million refund of taxesand associated interest received in 2015 on the closure of the IRS examination of CityCenter, which is treated asa partnership for income tax purposes which partially offset federal income tax estimated tax payments of $23million made during the year. The remaining $5 million of cash taxes paid in 2015 consist of state and foreignincome taxes. Cash taxes paid increased in 2014 compared to 2013 primarily as a result of $30 million paid toIRS for the closure of examinations covering the 2005 through 2009 tax years and $8 million estimated taxespaid to the IRS during 2014. The remaining $4 million of cash taxes paid in 2014 consist of state and foreignincome taxes. Cash taxes paid in 2013 consisted primarily of foreign and state taxes.
Non-GAAP Measures
“Adjusted EBITDA” is earnings before interest and other non-operating income (expense), taxes,depreciation and amortization, preopening and start-up expenses, and property transactions, net. “AdjustedProperty EBITDA” is Adjusted EBITDA before corporate expense and stock compensation expense related tothe MGM Resorts stock option plan, which is not allocated to each reportable segment or operating segment, asapplicable. MGM China recognizes stock compensation expense related to its stock compensation plan which isincluded in the calculation of Adjusted EBITDA for MGM China. Adjusted EBITDA and Adjusted PropertyEBITDA information is presented solely as a supplemental disclosure to reported GAAP measures becausemanagement believes these measures are 1) widely used measures of operating performance in the gaming andhospitality industry, and 2) a principal basis for valuation of gaming and hospitality companies.
We believe that while items excluded from Adjusted EBITDA and Adjusted Property EBITDA may berecurring in nature and should not be disregarded in evaluation of our earnings performance, it is useful toexclude such items when analyzing current results and trends compared to other periods because these items canvary significantly depending on specific underlying transactions or events that may not be comparable betweenthe periods being presented. Also, we believe excluded items may not relate specifically to current operatingtrends or be indicative of future results. For example, preopening and start-up expenses will be significantlydifferent in periods when we are developing and constructing a major expansion project and will depend onwhere the current period lies within the development cycle, as well as the size and scope of the project(s).Property transactions, net includes normal recurring disposals, gains and losses on sales of assets related tospecific assets within our resorts, but also includes gains or losses on sales of an entire operating resort or a groupof resorts and impairment charges on entire asset groups or investments in unconsolidated affiliates, which maynot be comparable period over period. In addition, capital allocation, tax planning, financing and stockcompensation awards are all managed at the corporate level. Therefore, we use Adjusted Property EBITDA asthe primary measure of wholly owned domestic resorts operating performance.
Adjusted EBITDA or Adjusted Property EBITDA should not be construed as an alternative to operatingincome or net income, as an indicator of our performance; or as an alternative to cash flows from operatingactivities, as a measure of liquidity; or as any other measure determined in accordance with generally acceptedaccounting principles. We have significant uses of cash flows, including capital expenditures, interest payments,taxes and debt principal repayments, which are not reflected in Adjusted EBITDA or Adjusted PropertyEBITDA. Also, other companies in the gaming and hospitality industries that report Adjusted EBITDA orAdjusted Property EBITDA information may calculate Adjusted EBITDA or Adjusted Property EBITDA in adifferent manner.
14
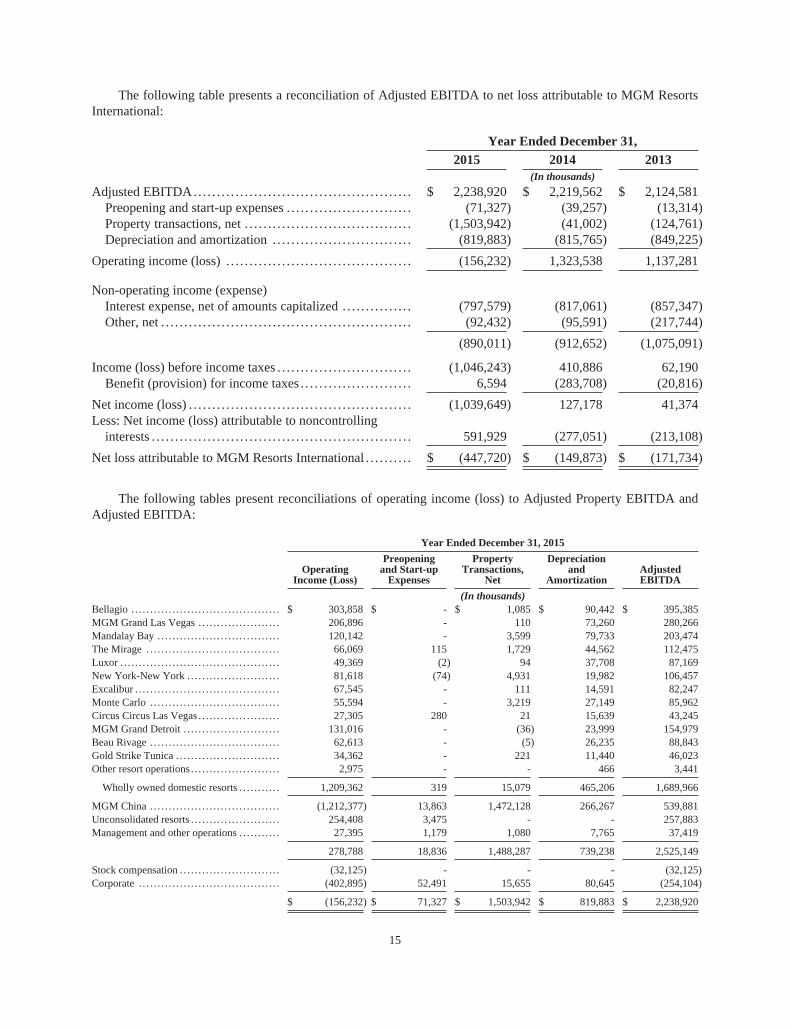
The following table presents a reconciliation of Adjusted EBITDA to net loss attributable to MGM ResortsInternational:
Year Ended December 31,
2015 2014 2013(In thousands)
Adjusted EBITDA.. . . . . . . . . . . . . . . . . . . . . . . . . . . . . . . . . . . . . . . . . . . . . . $ 2,238,920 $ 2,219,562 $ 2,124,581Preopening and start-up expenses . . . . . . . . . . . . . . . . . . . . . . . . . . . (71,327) (39,257) (13,314)Property transactions, net . . . . . . . . . . . . . . . . . . . . . . . . . . . . . . . . . . . . (1,503,942) (41,002) (124,761)Depreciation and amortization . . . . . . . . . . . . . . . . . . . . . . . . . . . . . . (819,883) (815,765) (849,225)
Operating income (loss) . . . . . . . . . . . . . . . . . . . . . . . . . . . . . . . . . . . . . . . . (156,232) 1,323,538 1,137,281
Non-operating income (expense)Interest expense, net of amounts capitalized . . . . . . . . . . . . . . . (797,579) (817,061) (857,347)Other, net . . . . . . . . . . . . . . . . . . . . . . . . . . . . . . . . . . . . . . . . . . . . . . . . . . . . . . (92,432) (95,591) (217,744)
(890,011) (912,652) (1,075,091)
Income (loss) before income taxes . . . . . . . . . . . . . . . . . . . . . . . . . . . . . (1,046,243) 410,886 62,190Benefit (provision) for income taxes . . . . . . . . . . . . . . . . . . . . . . . . 6,594 (283,708) (20,816)
Net income (loss) . . . . . . . . . . . . . . . . . . . . . . . . . . . . . . . . . . . . . . . . . . . . . . . . (1,039,649) 127,178 41,374Less: Net income (loss) attributable to noncontrolling
interests . . . . . . . . . . . . . . . . . . . . . . . . . . . . . . . . . . . . . . . . . . . . . . . . . . . . . . . . 591,929 (277,051) (213,108)
Net loss attributable to MGM Resorts International . . . . . . . . . . $ (447,720) $ (149,873) $ (171,734)
The following tables present reconciliations of operating income (loss) to Adjusted Property EBITDA andAdjusted EBITDA:
Year Ended December 31, 2015
OperatingIncome (Loss)
Preopeningand Start-up
Expenses
PropertyTransactions,
Net
Depreciationand
AmortizationAdjustedEBITDA
(In thousands)Bellagio . . . . . . . . . . . . . . . . . . . . . . . . . . . . . . . . . . . . . . . . $ 303,858 $ - $ 1,085 $ 90,442 $ 395,385MGM Grand Las Vegas . . . . . . . . . . . . . . . . . . . . . . 206,896 - 110 73,260 280,266Mandalay Bay . . . . . . . . . . . . . . . . . . . . . . . . . . . . . . . . . 120,142 - 3,599 79,733 203,474The Mirage . . . . . . . . . . . . . . . . . . . . . . . . . . . . . . . . . . . . 66,069 115 1,729 44,562 112,475Luxor . . . . . . . . . . . . . . . . . . . . . . . . . . . . . . . . . . . . . . . . . . . 49,369 (2) 94 37,708 87,169New York-New York . . . . . . . . . . . . . . . . . . . . . . . . . 81,618 (74) 4,931 19,982 106,457Excalibur . . . . . . . . . . . . . . . . . . . . . . . . . . . . . . . . . . . . . . . 67,545 - 111 14,591 82,247Monte Carlo . . . . . . . . . . . . . . . . . . . . . . . . . . . . . . . . . . . 55,594 - 3,219 27,149 85,962Circus Circus Las Vegas . . . . . . . . . . . . . . . . . . . . . . 27,305 280 21 15,639 43,245MGM Grand Detroit . . . . . . . . . . . . . . . . . . . . . . . . . . 131,016 - (36) 23,999 154,979Beau Rivage . . . . . . . . . . . . . . . . . . . . . . . . . . . . . . . . . . . 62,613 - (5) 26,235 88,843Gold Strike Tunica . . . . . . . . . . . . . . . . . . . . . . . . . . . . 34,362 - 221 11,440 46,023Other resort operations . . . . . . . . . . . . . . . . . . . . . . . . 2,975 - - 466 3,441
Wholly owned domestic resorts . . . . . . . . . . . 1,209,362 319 15,079 465,206 1,689,966
MGM China . . . . . . . . . . . . . . . . . . . . . . . . . . . . . . . . . . . (1,212,377) 13,863 1,472,128 266,267 539,881Unconsolidated resorts . . . . . . . . . . . . . . . . . . . . . . . . 254,408 3,475 - - 257,883Management and other operations . . . . . . . . . . . 27,395 1,179 1,080 7,765 37,419
278,788 18,836 1,488,287 739,238 2,525,149
Stock compensation . . . . . . . . . . . . . . . . . . . . . . . . . . . (32,125) - - - (32,125)Corporate . . . . . . . . . . . . . . . . . . . . . . . . . . . . . . . . . . . . . . (402,895) 52,491 15,655 80,645 (254,104)
$ (156,232) $ 71,327 $ 1,503,942 $ 819,883 $ 2,238,920
15

Year Ended December 31, 2014
OperatingIncome (Loss)
Preopeningand Start-up
Expenses
PropertyTransactions,
Net
Depreciationand
AmortizationAdjustedEBITDA
(In thousands)Bellagio . . . . . . . . . . . . . . . . . . . . . . . . . . . . . . . . . . . . . . . . $ 304,144 $ - $ 900 $ 88,658 $ 393,702MGM Grand Las Vegas . . . . . . . . . . . . . . . . . . . . . . 174,297 197 (667) 81,027 254,854Mandalay Bay . . . . . . . . . . . . . . . . . . . . . . . . . . . . . . . . . 95,449 1,133 2,307 76,737 175,626The Mirage . . . . . . . . . . . . . . . . . . . . . . . . . . . . . . . . . . . . 57,338 452 2,464 49,900 110,154Luxor . . . . . . . . . . . . . . . . . . . . . . . . . . . . . . . . . . . . . . . . . . . 31,801 2 432 37,849 70,084New York-New York . . . . . . . . . . . . . . . . . . . . . . . . . 75,360 732 427 18,586 95,105Excalibur . . . . . . . . . . . . . . . . . . . . . . . . . . . . . . . . . . . . . . . 52,915 - 500 14,804 68,219Monte Carlo . . . . . . . . . . . . . . . . . . . . . . . . . . . . . . . . . . . 48,937 1,507 290 21,046 71,780Circus Circus Las Vegas . . . . . . . . . . . . . . . . . . . . . . 8,135 85 61 15,334 23,615MGM Grand Detroit . . . . . . . . . . . . . . . . . . . . . . . . . . 118,755 - 2,728 23,315 144,798Beau Rivage . . . . . . . . . . . . . . . . . . . . . . . . . . . . . . . . . . . 43,152 - 1,000 26,109 70,261Gold Strike Tunica . . . . . . . . . . . . . . . . . . . . . . . . . . . . 27,460 - 392 12,480 40,332Other resort operations . . . . . . . . . . . . . . . . . . . . . . . . (2,318) - 336 1,759 (223)
Wholly owned domestic resorts . . . . . . . . . . . 1,035,425 4,108 11,170 467,604 1,518,307
MGM China . . . . . . . . . . . . . . . . . . . . . . . . . . . . . . . . . . . 547,977 9,091 1,493 291,910 850,471Unconsolidated resorts . . . . . . . . . . . . . . . . . . . . . . . . 62,919 917 - - 63,836Management and other operations . . . . . . . . . . . 26,152 359 415 9,058 35,984
1,672,473 14,475 13,078 768,572 2,468,598
Stock compensation . . . . . . . . . . . . . . . . . . . . . . . . . . . (28,372) - - - (28,372)Corporate . . . . . . . . . . . . . . . . . . . . . . . . . . . . . . . . . . . . . . (320,563) 24,782 27,924 47,193 (220,664)
$ 1,323,538 $ 39,257 $ 41,002 $ 815,765 $ 2,219,562
Year Ended December 31, 2013
OperatingIncome (Loss)
Preopeningand Start-up
Expenses
PropertyTransactions,
Net
Depreciationand
AmortizationAdjustedEBITDA
(In thousands)Bellagio . . . . . . . . . . . . . . . . . . . . . . . . . . . . . . . . . . . . . . . . $ 261,321 $ - $ 470 $ 96,968 $ 358,759MGM Grand Las Vegas . . . . . . . . . . . . . . . . . . . . . . 149,602 - 2,220 84,310 236,132Mandalay Bay . . . . . . . . . . . . . . . . . . . . . . . . . . . . . . . . . 78,096 1,903 2,823 84,332 167,154The Mirage . . . . . . . . . . . . . . . . . . . . . . . . . . . . . . . . . . . . 63,090 - 4,722 49,612 117,424Luxor . . . . . . . . . . . . . . . . . . . . . . . . . . . . . . . . . . . . . . . . . . . 21,730 802 2,177 36,852 61,561New York-New York . . . . . . . . . . . . . . . . . . . . . . . . . 65,006 - 3,533 20,642 89,181Excalibur . . . . . . . . . . . . . . . . . . . . . . . . . . . . . . . . . . . . . . . 49,184 - 69 14,249 63,502Monte Carlo . . . . . . . . . . . . . . . . . . . . . . . . . . . . . . . . . . . 45,597 791 3,773 18,780 68,941Circus Circus Las Vegas . . . . . . . . . . . . . . . . . . . . . . (1,596) - 1,078 17,127 16,609MGM Grand Detroit . . . . . . . . . . . . . . . . . . . . . . . . . . 135,516 - (2,402) 22,575 155,689Beau Rivage . . . . . . . . . . . . . . . . . . . . . . . . . . . . . . . . . . . 38,015 - (260) 29,182 66,937Gold Strike Tunica . . . . . . . . . . . . . . . . . . . . . . . . . . . . 22,767 - 1,330 13,390 37,487Other resort operations . . . . . . . . . . . . . . . . . . . . . . . . (21,951) - 23,018 2,243 3,310
Wholly owned domestic resorts . . . . . . . . . . . 906,377 3,496 42,551 490,262 1,442,686
MGM China . . . . . . . . . . . . . . . . . . . . . . . . . . . . . . . . . . . 501,021 9,109 390 303,589 814,109Unconsolidated resorts . . . . . . . . . . . . . . . . . . . . . . . . 68,322 507 - - 68,829Management and other operations . . . . . . . . . . . 13,749 189 4 11,835 25,777
1,489,469 13,301 42,945 805,686 2,351,401
Stock compensation . . . . . . . . . . . . . . . . . . . . . . . . . . . (26,112) - - - (26,112)Corporate . . . . . . . . . . . . . . . . . . . . . . . . . . . . . . . . . . . . . . (326,076) 13 81,816 43,539 (200,708)
$ 1,137,281 $ 13,314 $ 124,761 $ 849,225 $ 2,124,581
16
Liquidity and Capital Resources
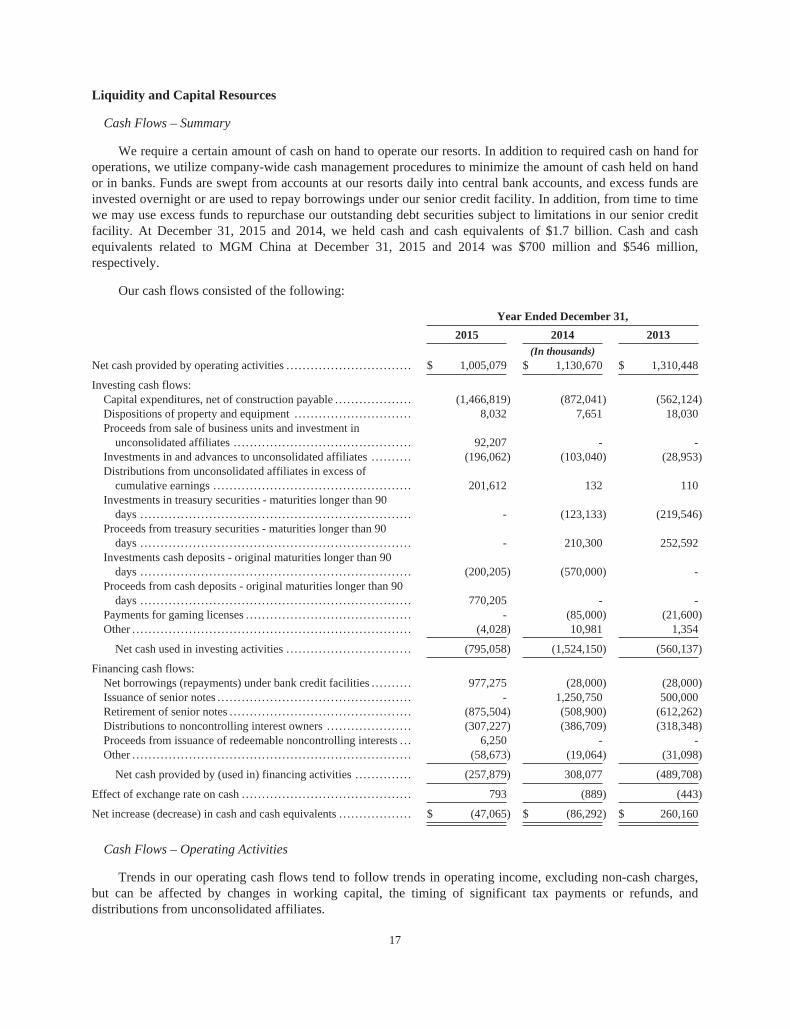
Cash Flows – Summary
We require a certain amount of cash on hand to operate our resorts. In addition to required cash on hand foroperations, we utilize company-wide cash management procedures to minimize the amount of cash held on handor in banks. Funds are swept from accounts at our resorts daily into central bank accounts, and excess funds areinvested overnight or are used to repay borrowings under our senior credit facility. In addition, from time to timewe may use excess funds to repurchase our outstanding debt securities subject to limitations in our senior creditfacility. At December 31, 2015 and 2014, we held cash and cash equivalents of $1.7 billion. Cash and cashequivalents related to MGM China at December 31, 2015 and 2014 was $700 million and $546 million,respectively.
Our cash flows consisted of the following:
Year Ended December 31,
2015 2014 2013(In thousands)
Net cash provided by operating activities . . . . . . . . . . . . . . . . . . . . . . . . . . . . . . . $ 1,005,079 $ 1,130,670 $ 1,310,448
Investing cash flows:Capital expenditures, net of construction payable . . . . . . . . . . . . . . . . . . . (1,466,819) (872,041) (562,124)Dispositions of property and equipment . . . . . . . . . . . . . . . . . . . . . . . . . . . . . 8,032 7,651 18,030Proceeds from sale of business units and investment in
unconsolidated affiliates . . . . . . . . . . . . . . . . . . . . . . . . . . . . . . . . . . . . . . . . . . . . 92,207 - -Investments in and advances to unconsolidated affiliates . . . . . . . . . . (196,062) (103,040) (28,953)Distributions from unconsolidated affiliates in excess of
cumulative earnings . . . . . . . . . . . . . . . . . . . . . . . . . . . . . . . . . . . . . . . . . . . . . . . . . 201,612 132 110Investments in treasury securities - maturities longer than 90
days . . . . . . . . . . . . . . . . . . . . . . . . . . . . . . . . . . . . . . . . . . . . . . . . . . . . . . . . . . . . . . . . . . . - (123,133) (219,546)Proceeds from treasury securities - maturities longer than 90
days . . . . . . . . . . . . . . . . . . . . . . . . . . . . . . . . . . . . . . . . . . . . . . . . . . . . . . . . . . . . . . . . . . . - 210,300 252,592Investments cash deposits - original maturities longer than 90
days . . . . . . . . . . . . . . . . . . . . . . . . . . . . . . . . . . . . . . . . . . . . . . . . . . . . . . . . . . . . . . . . . . . (200,205) (570,000) -Proceeds from cash deposits - original maturities longer than 90
days . . . . . . . . . . . . . . . . . . . . . . . . . . . . . . . . . . . . . . . . . . . . . . . . . . . . . . . . . . . . . . . . . . . 770,205 - -Payments for gaming licenses . . . . . . . . . . . . . . . . . . . . . . . . . . . . . . . . . . . . . . . . . - (85,000) (21,600)Other . . . . . . . . . . . . . . . . . . . . . . . . . . . . . . . . . . . . . . . . . . . . . . . . . . . . . . . . . . . . . . . . . . . . . (4,028) 10,981 1,354
Net cash used in investing activities . . . . . . . . . . . . . . . . . . . . . . . . . . . . . . . (795,058) (1,524,150) (560,137)
Financing cash flows:Net borrowings (repayments) under bank credit facilities . . . . . . . . . . 977,275 (28,000) (28,000)Issuance of senior notes . . . . . . . . . . . . . . . . . . . . . . . . . . . . . . . . . . . . . . . . . . . . . . . . - 1,250,750 500,000Retirement of senior notes . . . . . . . . . . . . . . . . . . . . . . . . . . . . . . . . . . . . . . . . . . . . . (875,504) (508,900) (612,262)Distributions to noncontrolling interest owners . . . . . . . . . . . . . . . . . . . . . (307,227) (386,709) (318,348)Proceeds from issuance of redeemable noncontrolling interests . . . 6,250 - -Other . . . . . . . . . . . . . . . . . . . . . . . . . . . . . . . . . . . . . . . . . . . . . . . . . . . . . . . . . . . . . . . . . . . . . (58,673) (19,064) (31,098)
Net cash provided by (used in) financing activities . . . . . . . . . . . . . . (257,879) 308,077 (489,708)
Effect of exchange rate on cash . . . . . . . . . . . . . . . . . . . . . . . . . . . . . . . . . . . . . . . . . . 793 (889) (443)
Net increase (decrease) in cash and cash equivalents . . . . . . . . . . . . . . . . . . $ (47,065) $ (86,292) $ 260,160
Cash Flows – Operating Activities
Trends in our operating cash flows tend to follow trends in operating income, excluding non-cash charges,but can be affected by changes in working capital, the timing of significant tax payments or refunds, anddistributions from unconsolidated affiliates.
17

Cash provided by operating activities in 2015 decreased due to a decrease in operating cash flows at MGMChina which were $383 million in 2015 compared to $642 million in 2014, partially offset by an increase inoperating cash flows at our wholly owned domestic resorts. In 2015, cash provided by operating activities atMGM China was negatively affected by changes in working capital related to short term gaming liabilities but toa lesser extent than in 2014.
Cash provided by operating activities in 2014 decreased due to a decrease in operating cash flows at MGMChina compared to $932 million in 2013, partially offset by an increase in operating cash flows at our whollyowned domestic resorts and lower cash paid for interest. Cash provided by operating activities at MGM Chinawas negatively affected by changes in working capital related to short-term gaming liabilities in 2014 whileoperating cash flows at MGM China were positively impacted by changes in working capital in 2013.
We paid net taxes of $12 million, $42 million and $1 million in 2015, 2014 and 2013, respectively.
Cash Flows – Investing Activities
Our investing cash flows can fluctuate significantly from year to year depending on our decisions withrespect to strategic capital investments in new or existing resorts, business acquisitions or dispositions, and thetiming of more regular capital investments to maintain the quality of our resorts. Capital expenditures related tomore regular investments in our existing resorts can also vary depending on timing of larger remodel projectsrelated to our public spaces and hotel rooms. Most of such costs relate to construction materials, furniture andfixtures, and external labor costs.
• In 2015, we had capital expenditures of $1.5 billion, which included $579 million at MGM China,excluding development fees and capitalized interest on development fees eliminated in consolidation.Capital expenditures at MGM China included $543 million related to the construction of MGM Cotai and$36 million related to improvements at MGM Macau. Capital expenditures at our wholly owned domesticresorts and corporate entities of $888 million included $361 million and $35 million related to theconstruction of MGM National Harbor and MGM Springfield, respectively, various room remodelsincluding the tower rooms at Mandalay Bay and the suites at Bellagio, construction of additional exhibitspace at the Mandalay Bay Convention Center, construction of the Monte Carlo theater, construction ofThe Park entertainment district, and restaurant and entertainment venue remodels.
• In 2014, we had capital expenditures of $872 million, which included $346 million at MGM China,excluding capitalized interest on development fees eliminated in consolidation. Capital expenditures atMGM China included $301 million related to the construction of MGM Cotai and $45 million related toimprovements at MGM Macau. Capital expenditures at our wholly owned domestic resorts and corporateentities included $97 million related to the construction of MGM National Harbor, various room remodelsincluding the Delano rooms at Mandalay Bay and suites at Bellagio, a remodel of the facades of NewYork-New York and Monte Carlo, construction of The Park entertainment district, restaurant andentertainment venue remodels and costs incurred to relocate and renovate certain corporate offices.
• In 2013, we had capital expenditures of $562 million, which included $239 million at MGM China,excluding development fees eliminated in consolidation. Capital expenditures at MGM China primarilyrelated to the construction of MGM Cotai, including a $47 million construction deposit. We spentapproximately $324 million in 2013 related to capital expenditures at corporate entities and our whollyowned domestic resorts, which included expenditures for a remodel of the front façades of New York-New York and Monte Carlo, room remodels, theater renovations, information technology and slotmachine purchases.
In 2015, investments in and advances to unconsolidated affiliates primarily represented investments inCityCenter pursuant to the completion guarantee of $141 million and investments in the Las Vegas ArenaCompany of $50 million. In 2014, investments and advances to unconsolidated affiliates primarily representedinvestments in CityCenter of $56 million, investments in the Las Vegas Arena Company of $36 million, andinvestments in MGM Hakkasan of $10 million. In 2013, investments in and advances to unconsolidated affiliatesprimarily represented investments in CityCenter of $24 million.
18

In 2015, investing activities also included proceeds of $20 million related to the sale of Railroad Pass andGold Strike Jean, proceeds of $72 million (net of cash included in the sale) related to the sale of Circus CircusReno and the Company’s 50% interest in Silver Legacy, and $202 million of distributions received fromunconsolidated affiliates, which includes a $200 million distribution paid by CityCenter in April 2015. Inaddition, we invested $200 million in certificates of deposit with original maturities longer than 90 days andreceived proceeds of $770 million related to the maturity of certificates of deposit with original maturities longerthan 90 days.
Investing activities also include activity related to investments of funds held by the trust that held our 50%ownership interest in Borgata prior to its dissolution in September 2014. In addition, in 2014 we invested $570million in certificates of deposit with original maturities longer than 90 days.
Cash Flows – Financing Activities
In 2015, we had net borrowings of $102 million, including $1.0 billion of borrowings under the MGMChina credit facility, the repayment of $28 million under our senior credit facility and the repayment of the $875million 6.625% senior notes at maturity in July 2015 using cash on hand. Additionally, we paid $46 million ofdebt issuance costs related to the refinancing of the MGM China credit facility. MGM China paid a $400 millionspecial dividend in March 2015, a $120 million final dividend in June 2015 and a $76 million interim dividend inAugust 2015, of which $196 million, $59 million and $37 million was distributed to noncontrolling interests,respectively. Additionally, we received $6 million in 2015 related to proceeds from the issuance of non-votingmembership interests in MGM National Harbor.
In 2014, we had net borrowings of $714 million, including the repayment of $28 million under our seniorcredit facility. During the year we repaid our $509 million 5.875% senior notes at maturity and issued $1.25billion of 6% senior notes, due 2023 for net proceeds of $1.24 billion. MGM China paid a $499 million specialdividend in March 2014, a $127 million final dividend in June 2014, and a $137 million interim dividend inSeptember 2014, of which $245 million, $62 million and $67 million was distributed to noncontrolling interests,respectively.
In 2013, we repaid net debt of $140 million including $28 million under our senior credit facility. We issued$500 million in 5.25% senior notes due 2020 and repaid the following senior notes:
• $462 million outstanding principal amount of our 6.75% senior notes; and• $150 million outstanding principal amount of our 7.625% senior subordinated debentures at maturity.
We incurred $24 million of debt issuance costs related to the re-pricing of the term loan B facility in May2013 and the December 2013 issuance of the $500 million of 5.25% senior notes due 2020.
MGM China paid a $500 million special dividend in March 2013 and a $113 million interim dividend inSeptember 2013, of which $245 million and $55 million was distributed to noncontrolling interests, respectively.
Other Factors Affecting Liquidity
Anticipated uses of cash. We have significant outstanding debt and contractual obligations in addition toplanned capital expenditures. At December 31, 2015, we had $1.5 billion of principal amount of long-term debtmaturing in 2016, primarily related to our $242.9 million 6.875% senior notes, $732.7 million 7.5% senior notes,and $500 million 10% senior notes, and an estimated $750 million of cash interest payments based on currentoutstanding debt and applicable interest rates, within the next twelve months.
We expect to make the following capital investments, excluding capitalized interest, during 2016:
• Approximately $440 million in capital expenditures at our wholly owned domestic resorts and corporateentities, which includes expenditures on The Park, the Monte Carlo theatre, the new Excalibur parkinggarage, and replacement of aircraft;
19
• Approximately $130 million in capital expenditures related to the MGM Springfield project; and• Approximately $680 million in capital expenditures related to the MGM National Harbor project.
During 2016, MGM China expects to spend approximately $50 million in capital improvements at MGMMacau and $1.6 billion on the MGM Cotai project, excluding capitalized interest, development fees and landrelated costs.
Our capital expenditures fluctuate depending on our decisions with respect to strategic capital investmentsin new or existing resorts and the timing of capital investments to maintain the quality of our resorts, the amountsof which can vary depending on timing of larger remodel projects related to our public spaces and hotel rooms.Future capital expenditures could vary from our current expectations depending on the progress of ourdevelopment efforts and the structure of our ownership interests in future developments.
Cotai land concession. MGM Grand Paradise’s land concession contract for an approximate 18 acre site inCotai, Macau became effective on January 9, 2013 and has an initial term of 25 years. The total land premiumpayable to the Macau government for the land concession contract is $161 million and is composed of a downpayment and eight additional semi-annual payments. As of December 31, 2015, MGM China had paid $130million of the contract premium, including interest due on the semi-annual payments. In January 2016, MGMChina paid the sixth semi-annual payment of $15 million under the land concession contract. Including intereston the two remaining semi-annual payments, MGM China has $29 million remaining payable for the landconcession contract.
MGM China dividend. On February 18, 2016, as part of its regular dividend policy, MGM China’s Boardof Directors announced it will recommend a final dividend for 2015 of $46 million to MGM China shareholderssubject to approval at the MGM China 2016 annual shareholders meeting to be held in May. If approved, we willreceive $23 million, our 51% share of the 2015 final dividend.
REIT transaction. In connection with the proposed REIT transaction, we expect to incur approximately $4billion of debt to refinance a portion of the debt outstanding under our existing senior credit facility and certainof our senior notes, which refinancing debt will be assumed by the Operating Partnership and repaid with theequity proceeds from the contemplated IPO and concurrent debt financings.
Principal Debt Arrangements
Our long-term debt consists of publicly held senior notes and our senior credit facility. At December 31,2015, excluding MGM China, we had $11.3 billion principal amount of indebtedness, including $2.7 billion ofborrowings outstanding under our $3.9 billion senior credit facility. We pay fixed rates of interest ranging from5.25% to 11.375% on our senior notes. Our senior credit facility consists of a $1.2 billion revolving loan facility,a $1.02 billion term loan A facility and a $1.70 billion term loan B facility. The revolving and term loan Afacilities bear interest at LIBOR plus an applicable rate determined by our credit rating (2.75% as ofDecember 31, 2015). The term loan B facility bears interest at LIBOR plus 2.50% with a LIBOR floor of 1.00%.The revolving and term loan A facilities mature in December 2017. The term loan B facility matures inDecember 2019. The term loan A and term loan B facilities are subject to scheduled amortization payments onthe last day of each calendar quarter in an amount equal to 0.25% of the original principal balance. We hadapproximately $1.2 billion of available borrowing capacity under our senior credit facility at December 31, 2015.At December 31, 2015, the interest rate on the term loan A was 3.17% and the interest rate on the term loan Bwas 3.50%.
The land and substantially all of the assets of MGM Grand Las Vegas, Bellagio and The Mirage secure upto $3.35 billion of obligations outstanding under the senior credit facility. In addition, the land and substantiallyall of the assets of New York-New York and Gold Strike Tunica secure the entire amount of the senior creditfacility, and the land and substantially all of the assets of MGM Grand Detroit secure its $450 million ofobligations as a co-borrower under the senior credit facility. In addition, the senior credit facility is secured by apledge of the equity or limited liability company interests of the subsidiaries that own the pledged properties.
20

The senior credit facility contains customary representations and warranties and customary affirmative andnegative covenants. In addition, the senior credit facility requires us and our restricted subsidiaries (the “RestrictedGroup”) to maintain a minimum trailing four-quarter EBITDA and limits the ability of the Restricted Group to makecapital expenditures and investments. As of December 31, 2015, the Restricted Group is required to maintain aminimum EBITDA (as defined) of $1.30 billion. The minimum EBITDA increases to $1.35 billion for March 31, 2016through December 31, 2016, and to $1.40 billion for March 31, 2017 and thereafter. EBITDA for the trailing fourquarters ended December 31, 2015 calculated in accordance with the terms of the senior credit facility was $1.71billion. In accordance with our senior credit facility covenants, the Restricted Group is limited to annual capitalexpenditures of $500 million in each year beginning with 2013 with unused amounts in any fiscal year rolling over tothe next fiscal year, but not any fiscal year thereafter. Our total Restricted Group capital expenditures allowable underthe senior credit facility for 2015, after giving effect to the unused amount from 2014, was $794 million. In addition,our senior credit facility limits the Restricted Group’s ability to make investments subject to certain thresholds andother important exceptions. The Restricted Group was within the limit of capital expenditures and other investmentsfor 2015. We believe we have sufficient capacity under these thresholds to fund our planned development activity.
The senior credit facility provides for customary events of default, including, without limitation, (i) paymentdefaults, (ii) covenant defaults, (iii) cross-defaults to certain other indebtedness in excess of specified amounts,(iv) certain events of bankruptcy and insolvency, (v) judgment defaults in excess of specified amounts, (vi) thefailure of any loan document by a significant party to be in full force and effect and such circumstance, in thereasonable judgment of the required lenders, is materially adverse to the lenders, or (vii) the security documentscease to create a valid and perfected first priority lien on any material portion of the collateral. In addition, thesenior credit facility provides that a cessation of business due to revocation, suspension or loss of any gaminglicense affecting a specified amount of its revenues or assets, will constitute an event of default.
All of our principal debt arrangements are guaranteed by each of our material domestic subsidiaries, otherthan MGM Grand Detroit, LLC (which is a co-borrower under our senior credit facility), MGM National Harbor,LLC and Blue Tarp reDevelopment, LLC (the company that will own and operate our proposed casino inSpringfield, Massachusetts), and each of their respective subsidiaries. Our international subsidiaries, includingMGM China and its subsidiaries, are not guarantors of such indebtedness. We and our subsidiaries may fromtime to time, in our sole discretion, purchase, repay, redeem or retire any of our outstanding debt securities, inprivately negotiated or open market transactions, by tender offer or otherwise pursuant to authorization of ourBoard of Directors and in accordance with the terms of our senior credit facilities.
In June 2015, MGM China and MGM Grand Paradise, as co-borrowers, entered into a second amended andrestated credit facility which consists of $1.55 billion of term loans and a $1.45 billion revolving credit facility.The outstanding balance at December 31, 2015 of $1.6 billion was comprised solely of term loans. The interestrate on the facility fluctuates annually based on HIBOR plus a margin that will range between 1.375% and 2.50%based on MGM China’s leverage ratio. The MGM China credit facility is secured by MGM Grand Paradise’sinterest in the Cotai land use right, and MGM China, MGM Grand Paradise and their guarantor subsidiaries havegranted a security interest in substantially all of their assets to secure the facility. The credit facility will be usedfor general corporate purposes and for the development of the Cotai project.
The MGM China credit facility contains customary representations and warranties, events of default,affirmative covenants and negative covenants, which impose restrictions on, among other things, the ability ofMGM China and its subsidiaries to make investments, pay dividends and sell assets, and to incur additional liens.As of December 31, 2015, MGM China was required to maintain compliance with a maximum leverage ratio of4.50 to 1.00 in addition to a minimum interest coverage ratio of 2.50 to 1.00. MGM China was in compliancewith the credit facility covenants at December 31, 2015.
In February 2016, the MGM China credit facility was amended to increase the maximum consolidated totalleverage ratio. The maximum total leverage ratio increases to 6.00 to 1.00 for September 30, 2016 throughJune 30, 2017, and then decreases to 5.50 to 1.00 for September 30, 2017, 5.00 to 1.00 for December 31, 2017,and 4.50 to 1.00 for March 31, 2018 and thereafter.
21

In January 2016, MGM National Harbor, LLC, the Company’s wholly owned subsidiary developing andconstructing MGM National Harbor, entered into a $100 million revolving credit facility and a $425 milliondelayed draw term loan facility, of which $250 million was funded at closing. The revolving and term loanfacilities will initially bear interest at a LIBOR rate plus an additional rate ranging from 2.00% to 2.25% perannum (determined based on a total leverage ratio). The term loan is subject to scheduled amortization paymentson the last day of each calendar quarter beginning the fourth full fiscal quarter following the opening of MGMNational Harbor, initially in an amount equal to 1.25% of the aggregate principal balance and increasing to1.875% and 2.50% of the aggregate principal balance on the last day of the twelfth and sixteenth full fiscalquarters, respectively. The term loan and revolving facilities are scheduled to mature in January 2021.
The credit agreement is secured by a leasehold mortgage on MGM National Harbor and substantially all ofthe existing and future property of MGM National Harbor. Mandatory prepayments will be required upon theoccurrence of certain events, including sales of certain assets, casualty events and the incurrence of certainadditional indebtedness, subject to certain exceptions and reinvestment rights. In addition, to the extent MGMNational Harbor generates excess cash flow (as defined in the credit agreement), a percentage of such excesscash flow (ranging from 0% to 50% based on a total leverage ratio) will be required to be used to prepay the termloan facilities commencing with the fiscal year ended 2017.
The credit agreement contains customary representations and warranties, events of default, affirmativecovenants and negative covenants, which impose restrictions on, among other things, the ability of MGMNational Harbor, LLC and its restricted subsidiaries to make investments, pay dividends, sell assets, and to incuradditional debt and additional liens. In addition, the credit agreement requires MGM National Harbor, LLC andits restricted subsidiaries to maintain a maximum total leverage ratio and a minimum interest coverage ratio. Inaddition, borrowings under the credit agreement are subject to a customary “in balance test” (as defined in thecredit agreement), which looks to the sufficiency of MGM National Harbor, LLC’s available resources tocomplete the MGM National Harbor casino resort.
Off Balance Sheet Arrangements
Our off-balance sheet arrangements consist primarily of investments in unconsolidated affiliates, whichconsist primarily of our investments in CityCenter, Grand Victoria, Borgata, and T-Mobile Arena. We have notentered into any transactions with special purpose entities, nor have we engaged in any derivativetransactions. Our unconsolidated affiliate investments allow us to realize the proportionate benefits of owning afull-scale resort in a manner that minimizes our initial investment. Other than the T-Mobile Arena guaranteedescribed below, we have not historically guaranteed financings obtained by our investees. In addition, there areno other provisions in the agreements with our investees which we believe are unusual or subject us to risks towhich we would not be subjected if we had full ownership of the resort.
In conjunction with the Las Vegas Arena Company entering into a senior secured credit facility inSeptember 2014, we and AEG each entered into joint and several completion guarantees for the project, as wellas a repayment guarantee for the term loan B (which is subject to increases and decreases in the event of arebalancing of the principal amount of indebtedness between the term loan A and term loan B facilities). As ofDecember 31, 2015, term loan A was $120 million and term loan B was $80 million.
22

Commitments and Contractual Obligations
The following table summarizes our scheduled contractual obligations as of December 31, 2015:
2016 2017 2018 2019 2020 Thereafter(In millions)
Long-term debt . . . . . . . . . . . . . . . . . . . . . . . . . . . . . . . . . . . . . . $ 1,504 $ 1,846 $ 1,272 $ 3,197 $ 1,500 $ 3,505Estimated interest payments on long-term
debt (1) . . . . . . . . . . . . . . . . . . . . . . . . . . . . . . . . . . . . . . . . . . . . 750 646 542 439 316 409Construction commitments (2) . . . . . . . . . . . . . . . . . . . . . 959 212 4 – – –Operating Leases (3) . . . . . . . . . . . . . . . . . . . . . . . . . . . . . . . . 55 26 23 21 22 1,098Capital leases . . . . . . . . . . . . . . . . . . . . . . . . . . . . . . . . . . . . . . . . 8 8 2 – – –Tax liabilities (4) . . . . . . . . . . . . . . . . . . . . . . . . . . . . . . . . . . . . 5 – – – – –Long-term liabilities . . . . . . . . . . . . . . . . . . . . . . . . . . . . . . . . 4 3 3 2 2 35Other obligations (5) . . . . . . . . . . . . . . . . . . . . . . . . . . . . . . . . 340 72 24 1 1 1
$ 3,625 $ 2,813 $ 1,870 $ 3,660 $ 1,841 $ 5,048
(1) Estimated interest payments are based on principal amounts and expected maturities of debt outstanding at December 31, 2015 andmanagement’s forecasted LIBOR rates for our senior credit facility and HIBOR rates for the MGM China credit facility.
(2) The amount for 2016 includes $640 million related to MGM Cotai and $261 million and $15 million related to MGM National Harborand MGM Springfield, respectively.
(3) MGM National Harbor is being built on land subject to a long-term ground lease. See Note 11 to the accompanying consolidatedfinancial statements for further discussion.
(4) Approximately $4 million of liabilities related to uncertain tax positions and other tax liabilities are excluded from the table as wecannot reasonably estimate when examination and other activity related to these amounts will conclude or when these amounts will bepaid, if ever.
(5) The amount for 2016 includes $118 million related to employment agreements, $105 million for entertainment agreements and $77million of open purchase orders. Other commitments include various contracted amounts, including information technology,advertising, maintenance and other service agreements. Our largest entertainment commitments consist of minimum contractualpayments to Cirque du Soleil, which performs shows at several of our resorts. Our contractual commitments for these shows generallydo not exceed 12 months and are based on our ability to exercise certain termination rights; however, we expect these shows to continuefor longer periods.
While we have significant indebtedness, we believe we have the ability to meet known obligations,including principal and interest obligations as well as planned capital expenditures over the next twelve monthsfrom the balance sheet date with existing cash and cash deposits, cash flows from operations, dividends fromMGM China, and availability under our senior credit facility, the MGM China credit agreement and the MGMNational Harbor credit agreement. We have $1.5 billion of maturities of long-term debt in 2016. See “Liquidityand Capital Resources – Other Factors Affecting Liquidity” for further discussion of anticipated uses of cash.
Critical Accounting Policies and Estimates
Management’s discussion and analysis of our results of operations and liquidity and capital resources arebased on our consolidated financial statements. To prepare our consolidated financial statements in accordancewith accounting principles generally accepted in the United States of America, we must make estimates andassumptions that affect the amounts reported in the consolidated financial statements. We regularly evaluatethese estimates and assumptions, particularly in areas we consider to be critical accounting estimates, wherechanges in the estimates and assumptions could have a material effect on our results of operations, financialposition or cash flows. Senior management and the Audit Committee of the Board of Directors have reviewed thedisclosures included herein about our critical accounting estimates, and have reviewed the processes to determinethose estimates. However, by their nature, judgments are subject to an inherent degree of uncertainty andtherefore actual results can differ from our estimates.
23

Allowance for Doubtful Casino Accounts Receivable
Marker play represents a significant portion of the table games volume at certain of our Las Vegas resorts.In addition, MGM China extends credit to certain in-house VIP gaming customers and gaming promoters. Ourother casinos do not emphasize marker play to the same extent, although we offer markers to customers at thosecasinos as well. We maintain strict controls over the issuance of markers and aggressively pursue collection fromour other customers who fail to pay their marker balances timely. These collection efforts are similar to thoseused by most large corporations when dealing with overdue customer accounts, including the mailing ofstatements and delinquency notices, personal contacts, the use of outside collection agencies and civil litigation.Markers are generally legally enforceable instruments in the United States and Macau. At December 31, 2015and 2014, approximately 37% and 30%, respectively, of our casino accounts receivable was owed by customersfrom the United States. Markers are not legally enforceable instruments in some foreign countries, but the UnitedStates assets of foreign customers may be reached to satisfy judgments entered in the United States. AtDecember 31, 2015 and 2014, approximately 44% and 54%, respectively, of our casino accounts receivable wasowed by customers from the Far East. We consider the likelihood and difficulty of enforceability, among otherfactors, when we issue credit to customers who are not residents of the United States.
We maintain an allowance, or reserve, for doubtful casino accounts at all of our operating casino resorts.The provision for doubtful accounts, an operating expense, increases the allowance for doubtful accounts. Weregularly evaluate the allowance for doubtful casino accounts. At resorts where marker play is not significant, theallowance is generally established by applying standard reserve percentages to aged account balances. At resortswhere marker play is significant, we apply standard reserve percentages to aged account balances under aspecified dollar amount and specifically analyze the collectability of each account with a balance over thespecified dollar amount, based on the age of the account, the customer’s financial condition, collection historyand any other known information.
In addition to enforceability issues, the collectability of unpaid markers given by foreign customers isaffected by a number of factors, including changes in currency exchange rates and economic conditions in thecustomers’ home countries. Because individual customer account balances can be significant, the allowance andthe provision can change significantly between periods, as information about a certain customer becomes knownor as changes in a region’s economy occur.
The following table shows key statistics related to our casino receivables:
December 31,
2015 2014(In thousands)
Casino receivables . . . . . . . . . . . . . . . . . . . . . . . . . . . . . . . . . . . . . . . . . . . . . . . . . . . . . . . . . . . . . . . . . . . . . . . . . . $ 285,182 $ 307,152Allowance for doubtful casino accounts receivable . . . . . . . . . . . . . . . . . . . . . . . . . . . . . . . . . . . . . 86,010 84,397Allowance as a percentage of casino accounts receivable . . . . . . . . . . . . . . . . . . . . . . . . . . . . . . . 30% 27%Percentage of casino accounts outstanding over 180 days . . . . . . . . . . . . . . . . . . . . . . . . . . . . . . 26% 24%
Approximately $40 million and $68 million of casino receivables and $9 million and $13 million of theallowance for doubtful casino accounts receivable relate to MGM China at December 31, 2015 and 2014,respectively. The allowance for doubtful accounts as a percentage of casino accounts receivable has increased inthe current year due to an increase in specific reserves for high-end gaming customers and an increase in theaging of accounts. At December 31, 2015, a 100 basis-point change in the allowance for doubtful accounts as apercentage of casino accounts receivable would change income before income taxes by $2.9 million.
Fixed Asset Capitalization and Depreciation Policies
Property and equipment are stated at cost. For the majority of our property and equipment, cost wasdetermined at the acquisition date based on estimated fair values in connection with the June 2011 MGM Chinaacquisition, the April 2005 Mandalay acquisition and the May 2000 Mirage Resorts acquisition. Maintenance and
24

repairs that neither materially add to the value of the property nor appreciably prolong its life are charged toexpense as incurred. Depreciation and amortization are provided on a straight-line basis over the estimated usefullives of the assets. When we construct assets, we capitalize direct costs of the project, including fees paid toarchitects and contractors, property taxes, and certain costs of our design and construction subsidiaries. Inaddition, interest cost associated with major development and construction projects is capitalized as part of thecost of the project. Interest is typically capitalized on amounts expended on the project using the weighted-average cost of our outstanding borrowings. Capitalization of interest starts when construction activities beginand ceases when construction is substantially complete or development activity is suspended for more than abrief period.
We must make estimates and assumptions when accounting for capital expenditures. Whether an expenditureis considered a maintenance expense or a capital asset is a matter of judgment. When constructing or purchasingassets, we must determine whether existing assets are being replaced or otherwise impaired, which also may be amatter of judgment. In addition, our depreciation expense is highly dependent on the assumptions we make aboutour assets’ estimated useful lives. We determine the estimated useful lives based on our experience with similarassets, engineering studies, and our estimate of the usage of the asset. Whenever events or circumstances occurwhich change the estimated useful life of an asset, we account for the change prospectively.
Impairment of Long-lived Assets, Goodwill and Indefinite-lived Intangible Assets
We evaluate our property and equipment and other long-lived assets for impairment based on ourclassification as held for sale or to be held and used. Several criteria must be met before an asset is classified asheld for sale, including that management with the appropriate authority commits to a plan to sell the asset at areasonable price in relation to its fair value and is actively seeking a buyer. For assets classified as held for sale,we recognize the asset at the lower of carrying value or fair market value less costs of disposal, as estimatedbased on comparable asset sales, offers received, or a discounted cash flow model. For assets to be held and used,we review for impairment whenever indicators of impairment exist. We then compare the estimated future cashflows of the asset, on an undiscounted basis, to the carrying value of the asset. If the undiscounted cash flowsexceed the carrying value, no impairment is indicated. If the undiscounted cash flows do not exceed the carryingvalue, then an impairment is recorded based on the fair value of the asset. For operating assets, fair value istypically measured using a discounted cash flow model whereby future cash flows are discounted using aweighted-average cost of capital, developed using a standard capital asset pricing model, based on guidelinecompanies in our industry. If an asset is still under development, future cash flows include remainingconstruction costs. All recognized impairment losses, whether for assets to be held for sale or assets to be heldand used, are recorded as operating expenses.
There are several estimates, assumptions and decisions in measuring impairments of long-lived assets. First,management must determine the usage of the asset. To the extent management decides that an asset will be sold,it is more likely that an impairment may be recognized. Assets must be tested at the lowest level for whichidentifiable cash flows exist. This means that some assets must be grouped, and management has some discretionin the grouping of assets. Future cash flow estimates are, by their nature, subjective and actual results may differmaterially from our estimates.
On a quarterly basis, we review our major long-lived assets to determine if events have occurred orcircumstances exist that indicate a potential impairment. Potential factors which could trigger an impairmentinclude underperformance compared to historical or projected operating results, negative industry or economicfactors, significant changes to our operating environment, or changes in intended use of the asset group. Weestimate future cash flows using our internal budgets and probability weight cash flows in certain circumstancesto consider alternative outcomes associated with recoverability of the asset group, including potential sale.Historically, undiscounted cash flows of our significant operating asset groups have exceeded their carryingvalues by a substantial margin.
We review indefinite-lived intangible assets and goodwill at least annually and between annual test dates incertain circumstances. We perform our annual impairment test for indefinite-lived intangible assets and goodwill
25

in the fourth quarter of each fiscal year. Indefinite-lived intangible assets consist primarily of license rights,which are tested for impairment using a discounted cash flow approach, and trademarks, which are tested forimpairment using the relief-from-royalty method. See Note 7 to the accompanying consolidated financialstatements for further discussion of goodwill and other intangible assets.
Goodwill represents the excess of purchase price over fair market value of net assets acquired in businesscombinations. Goodwill for relevant reporting units is tested for impairment using a discounted cash flowanalysis based on our budgeted future results discounted using a weighted average cost of capital, developedusing a standard capital asset pricing model based on guideline companies in our industry, and market indicatorsof terminal year capitalization rates, as well as a market approach that utilizes business enterprise value multiplesbased on a range of multiples in our peer group. If the carrying value of the reporting unit exceeds its fair value,an indication of impairment exists and we must proceed to measure an impairment loss, if any. In measuring animpairment loss, the implied fair value of a reporting unit’s goodwill is compared to the carrying value of thatgoodwill. The implied fair value of goodwill is determined by allocating the fair value of the reporting unit to itsassets and liabilities and the amount remaining, if any, is the implied fair value of goodwill. If the implied fairvalue of goodwill is less than its carrying value then it must be written down to its implied fair value.
Due to a significant decrease in MGM China’s cash flows as well as a decline in the market capitalization ofMGM China relative to its net book value, we performed an interim impairment test of goodwill related to theMGM China reporting unit in the second quarter of 2015. As of the date we completed our 2015 interim goodwillimpairment analysis, the estimated fair value of our MGM China reporting unit exceeded its carrying value by9%. We therefore concluded that goodwill related to the MGM China reporting unit was not impaired. During thefourth quarter of 2015, we conducted our annual impairment tests of goodwill by reviewing each of our reportingunits, including our MGM China reporting unit. The step one goodwill analysis of the MGM China reporting unitindicated the fair value was less than its carrying value by 4%. The decrease in fair value from the interim testvaluation date resulted from a further decrease in forecasted cash flows from our interim analysis based oncurrent market conditions and a further sustained decline in the enterprise value multiples of the MGM Chinareporting unit as well as those of the MGM China reporting unit’s peer group. As a result of the indication ofimpairment from the step one analysis, we proceeded to perform a step two impairment analysis to measure theimpairment loss. As such, we determined the current fair values of all assets of the MGM China reporting unit,including its separately identifiable intangible assets. The current fair values of each of the separately identifiableintangible assets exceeded their respective carrying values by a significant amount, leading to a lower impliedfair value of goodwill. Therefore, we recorded a $1.5 billion non-cash impairment charge to reduce the historicalcarrying value of goodwill related to the MGM China reporting unit to its implied fair value.
With the exception of our MGM China reporting unit, as discussed above, none of our other reporting unitsincurred any goodwill impairment charges in 2015, 2014 or 2013. As of the date we completed our 2015goodwill impairment analysis, the estimated fair values of our wholly owned domestic resorts reporting unitswith associated goodwill were substantially in excess of their carrying values. As discussed below, managementmakes significant judgments and estimates as part of these analyses. If future operating results of our reportingunits do not meet current expectations it could cause carrying values of our reporting units to exceed their fairvalues in future periods, potentially resulting in a goodwill impairment charge.
There are several estimates inherent in evaluating these assets for impairment. In particular, future cash flowestimates are, by their nature, subjective and actual results may differ materially from our estimates. In addition,the determination of multiples, capitalization rates and the discount rates used in the impairment tests are highlyjudgmental and dependent in large part on expectations of future market conditions.
See Notes 7 and 15 to the accompanying consolidated financial statements for further discussion of writedowns and impairments of goodwill and long-lived assets.
26
Impairment of Investments in Unconsolidated Affiliates
We evaluate our investments in unconsolidated affiliates for impairment whenever events or changes incircumstances indicate that the carrying value of our investment may have experienced an other-than-temporarydecline in value. If such conditions exist, we compare the estimated fair value of the investment to its carryingvalue to determine whether an impairment is indicated and determine whether the impairment is other-than-temporary based on our assessment of relevant factors, including consideration of our intent and ability to retainour investment. We estimate fair value using a discounted cash flow analysis based on estimates of future cashflows and market indicators of discount rates and terminal year capitalization rates, as well as a market approachthat utilizes business enterprise value multiples based on a range of multiples in our peer group. See Note 6 andNote 15 to the accompanying consolidated financial statements for discussion of other-than-temporaryimpairment charges.
Income Taxes
We recognize deferred tax assets, net of applicable reserves, related to net operating loss and tax creditcarryforwards and certain temporary differences with a future tax benefit to the extent that realization of suchbenefit is more likely than not. Otherwise, a valuation allowance is applied. As of December 31, 2015, thescheduled future reversal of existing U.S. federal taxable temporary differences exceeds the scheduled futurereversal of existing U.S. federal deductible temporary differences. Consequently, we no longer apply a valuationallowance against our U.S. federal deferred tax assets other than our foreign tax credit deferred tax asset and acapital loss carryforward.
As of December 31, 2015, we have a foreign tax credit carryover of $2.9 billion against which we haverecorded a valuation allowance of $2.7 billion based upon our assessment of future realization. The foreign taxcredits are attributable to the Macau Special Gaming Tax which is 35% of gross gaming revenue in Macau.Because MGM China is presently exempt from the Macau 12% complementary tax on gaming profits, webelieve that payment of the Macau Special Gaming Tax qualifies as a tax paid in lieu of an income tax that iscreditable against U.S. taxes. Although MGM China’s current five-year exemption from the Macau 12%complementary tax on gaming profits ends on December 31, 2016, we believe it will be entitled to receive a thirdfive-year exemption from Macau based upon exemptions granted to its competitors in order to ensure non-discriminatory treatment among gaming concessionaires and subconcessionaires. For all periods beyondDecember 31, 2021, we have assumed that MGM China will be paying the Macau 12% complementary tax ongaming profits and will thus not be able to credit the Macau Special Gaming Tax in such years and have factoredthat assumption into our assessment of the realization of the foreign tax credit deferred tax asset. Furthermore,we do not rely on future U.S. source operating income in assessing future foreign tax credit realization due to ourhistory of recent losses in the U.S. and therefore only rely on U.S. federal taxable temporary differences that weexpect will reverse during the 10-year foreign tax credit carryover period.
Our assessment of realization of our foreign tax credit deferred tax asset is based on available evidence,including assumptions about future profitability of and distributions from MGM China, our assumptionconcerning renewals of the five year exemption from Macau’s 12% complementary tax on gaming profits andassumptions concerning future U.S. operating profits. As a result, significant judgment is required in assessingthe possible need for a valuation allowance and changes to our assumptions may have a material impact on theamount of the valuation allowance. For example, should we in a future period actually receive or be able toassume an additional five year exemption, an additional valuation allowance would likely need to be provided onsome portion or all of the foreign tax credit deferred tax asset, resulting in an increase in the provision for incometaxes in such period and such increase may be material. In addition, a change to our forecasts of futureprofitability of and distributions from MGM China could also result in a material change in the valuationallowance with a corresponding impact on the provision for income taxes in such period.
Finally, we do not currently rely on future U.S. source operating income in assessing future foreign tax creditrealization due to our recent history of cumulative losses in the U.S. and therefore only rely on U.S. federal taxabletemporary differences that we expect will reverse during the 10-year foreign tax credit carryover period. However,
27
due to improvements in our U.S. operations we have generated U.S. operating profits for the past four consecutivequarters. Should these profits continue in future periods, we may during the next 12 months begin to utilizeprojections of future U.S. source operating income in our assessment of the realizability of our foreign tax creditdeferred tax asset, which could result in a reduction in the valuation allowance and a corresponding reduction in theprovision for income taxes in such period. However, the exact timing and amount of reduction in the valuationallowance are subject to change on the basis of the level of profitability that we are able to actually achieve.
In addition, there is an $18 million valuation allowance, after federal effect, provided on certain statedeferred tax assets, a valuation allowance of $3 million on a federal income tax capital loss carryforward, avaluation allowance of $69 million on certain Macau deferred tax assets, and a valuation allowance of $1 millionon Hong Kong net operating losses because we believe these assets do not meet the “more likely than not”criteria for recognition.
We file income tax returns in the U.S. federal jurisdiction, various state and local jurisdictions, and foreignjurisdictions, although the income taxes paid in foreign jurisdictions are not material. Our income tax returns aresubject to examination by the Internal Revenue Service (“IRS”) and other tax authorities. Positions taken in taxreturns are sometimes subject to uncertainty in the tax laws and may not ultimately be accepted by the IRS orother tax authorities. See Note 10 in the accompanying consolidated financial statements for a discussion of thestatus and impact of examinations by tax authorities.
We assess our tax positions using a two-step process. A tax position is recognized if it meets a “more likely thannot” threshold, and is measured at the largest amount of benefit that is greater than fifty percent likely of being realized.Uncertain tax positions must be reviewed at each balance sheet date. Liabilities we record as a result of this analysis arerecorded separately from any current or deferred income tax accounts, and are classified as current in “Other accruedliabilities” or long-term in “Other long-term liabilities” based on the time until expected payment. Additionally, werecognize accrued interest and penalties, if any, related to unrecognized tax benefits in income tax expense.
During the fourth quarter of 2015, we early adopted on a prospective basis FASB Accounting StandardsUpdate No. 2015-17, “Balance sheet Classification of Deferred Taxes,” (“ASU 2015-17”), which is effective forfiscal years, and interim periods within those years, beginning after December 15, 2016. ASU 2015-17 requiresthat deferred tax liabilities and assets, along with any related valuation allowance, be classified as noncurrent in aclassified statement of financial position. Prior to adopting ASU 2015-17, we had a current deferred tax liabilityof $62 million for the period ending December 31, 2014. Prior periods are not retrospectively adjusted in theaccompanying financial statements.
Stock-based Compensation
We account for stock options and stock appreciation rights (“SARs”) measuring fair value using the Black-Scholes model. For restricted share units (“RSUs”), compensation expense is calculated based on the fair marketvalue of our stock on the date of grant. We account for performance stock units (“PSUs”) measuring fair valueusing the Monte Carlo valuation model. There are several management assumptions required to determine theinputs into the Black-Scholes model and Monte Carlo valuation model. Our volatility and expected termassumptions used in the Black-Scholes model can significantly affect the fair value of stock options and SARs.The Monte Carlo valuation model also utilizes multiple assumptions, including volatility, to determine the fairvalue of the award. Changes in the subjective assumptions can materially affect the estimate of the fair value ofshare-based compensation and consequently, the related amount recognized in the consolidated financialstatements. The extent of the impact will depend, in part, on the extent of awards in any given year.
Market Risk
In addition to the inherent risks associated with our normal operations, we are also exposed to additionalmarket risks. Market risk is the risk of loss arising from adverse changes in market rates and prices, such asinterest rates and foreign currency exchange rates. Our primary exposure to market risk is interest rate riskassociated with our variable rate long-term debt. We attempt to limit our exposure to interest rate risk by
28

managing the mix of our long-term fixed rate borrowings and short-term borrowings under our bank creditfacilities. A change in interest rates generally does not have an impact upon our future earnings and cash flow forfixed-rate debt instruments. As fixed-rate debt matures, however, and if additional debt is acquired to fund thedebt repayment, future earnings and cash flow may be affected by changes in interest rates. This effect would berealized in the periods subsequent to the periods when the debt matures. We do not hold or issue financialinstruments for trading purposes and do not enter into derivative transactions that would be consideredspeculative positions.
As of December 31, 2015, long-term variable rate borrowings represented approximately 33% of our totalborrowings. Assuming a 100 basis-point increase in LIBOR (in the case of term loan B, over the 1% floorspecified in our senior credit facility), our annual interest cost would change by approximately $27 million basedon gross amounts outstanding at December 31, 2015. Assuming a 100 basis-point increase in HIBOR for theMGM China credit facility, our annual interest cost would change by approximately $16 million based onamounts outstanding at December 31, 2015. The following table provides additional information about our grosslong-term debt subject to changes in interest rates:
Debt maturing in, Fair ValueDecember 31,
20152016 2017 2018 2019 2020 Thereafter Total(In millions)
Fixed-rate . . . . . . . . . . . . . . . . . . . . . . . . . . $ 1,476 $ 743 $ 475 $ 850 $ 1,500 $ 3,504 $ 8,548 $ 8,815Average interest rate . . . . . . . . . . . . . . 8.3% 7.6% 11.9% 8.6% 6.3% 6.7% 7.5%Variable rate . . . . . . . . . . . . . . . . . . . . . . . $ 28 $ 1,104 $ 797 $ 2,347 $ - $ - $ 4,276 $ 4,245Average interest rate . . . . . . . . . . . . . . 3.4% 3.1% 2.0% 3.0% N/A N/A 2.9%
In addition to the risk associated with our variable interest rate debt, we are also exposed to risks related tochanges in foreign currency exchange rates, mainly related to MGM China and to our operations at MGM Macauand the development of MGM Cotai. While recent fluctuations in exchange rates have not been significant,potential changes in policy by governments or fluctuations in the economies of the United States, China, Macauor Hong Kong could cause variability in these exchange rates. We cannot assure you that the Hong Kong dollarwill continue to be pegged to the U.S. dollar or the current peg rate for the Hong Kong dollar will remain at thesame level. The possible changes to the peg of the Hong Kong dollar may result in severe fluctuations in theexchange rate thereof. As of December 31, 2015, a 1% increase in the Hong Kong dollar (the functional currencyof MGM China) to the U.S. dollar exchange rate would impact the carrying value of our cash balance by $7million and a 1% decrease in the exchange rate would impact the carrying value of our debt balance by $16million.
29

MANAGEMENT’S ANNUAL REPORTON INTERNAL CONTROL OVER FINANCIAL REPORTING
Management’s Responsibilities
Management is responsible for establishing and maintaining adequate internal control over financialreporting (as defined in Sections 13a-15(f) and 15d-15(f) of the Exchange Act) for MGM Resorts Internationaland subsidiaries (the “Company”).
Objective of Internal Control over Financial Reporting
In establishing adequate internal control over financial reporting, management has developed andmaintained a system of internal control, policies and procedures designed to provide reasonable assurance thatinformation contained in the accompanying consolidated financial statements and other information presented inthis annual report is reliable, does not contain any untrue statement of a material fact or omit to state a materialfact, and fairly presents in all material respects the financial condition, results of operations and cash flows of theCompany as of and for the periods presented in this annual report. These include controls and proceduresdesigned to ensure that this information is accumulated and communicated to the Company’s management,including its principal executive officer and principal financial officer, as appropriate for all timely decisionsregarding required disclosure. Significant elements of the Company’s internal control over financial reportinginclude, for example:
• Hiring skilled accounting personnel and training them appropriately;• Written accounting policies;• Written documentation of accounting systems and procedures;• Segregation of incompatible duties;• Internal audit function to monitor the effectiveness of the system of internal control; and• Oversight by an independent Audit Committee of the Board of Directors.
Management’s Evaluation
Management, with the participation of the Company’s principal executive officer and principal financialofficer, has evaluated the Company’s internal control over financial reporting using the criteria established inInternal Control - Integrated Framework (2013) issued by the Committee of Sponsoring Organizations of theTreadway Commission.
Based on its evaluation as of December 31, 2015, management believes that the Company’s internal controlover financial reporting is effective in achieving the objectives described above.
Report of Independent Registered Public Accounting Firm
Deloitte & Touche LLP audited the Company’s consolidated financial statements as of and for the yearended December 31, 2015 and issued their report thereon, which is included in this annual report. Deloitte &Touche LLP has also issued an attestation report on the effectiveness of the Company’s internal control overfinancial reporting and such report is also included in this annual report.
30
REPORT OF INDEPENDENT REGISTERED PUBLIC ACCOUNTING FIRM
To the Board of Directors and Stockholders ofMGM Resorts International
We have audited the internal control over financial reporting of MGM Resorts International and subsidiaries(the “Company”) as of December 31, 2015, based on criteria established in Internal Control — IntegratedFramework (2013) issued by the Committee of Sponsoring Organizations of the Treadway Commission. TheCompany’s management is responsible for maintaining effective internal control over financial reporting and forits assessment of the effectiveness of internal control over financial reporting, included in the accompanyingManagement’s Annual Report on Internal Control over Financial Reporting. Our responsibility is to express anopinion on the effectiveness of the Company’s internal control over financial reporting based on our audit.
We conducted our audit in accordance with the standards of the Public Company Accounting OversightBoard (United States). Those standards require that we plan and perform the audit to obtain reasonable assuranceabout whether effective internal control over financial reporting was maintained in all material respects. Ouraudit included obtaining an understanding of internal control over financial reporting, assessing the risk that amaterial weakness exists, testing and evaluating the design and operating effectiveness of internal control basedon the assessed risk, and performing such other procedures as we considered necessary in the circumstances. Webelieve that our audit provides a reasonable basis for our opinion.
A company’s internal control over financial reporting is a process designed by, or under the supervision of,the company’s principal executive and principal financial officers, or persons performing similar functions, andeffected by the company’s board of directors, management, and other personnel to provide reasonable assuranceregarding the reliability of financial reporting and the preparation of financial statements for external purposes inaccordance with generally accepted accounting principles. A company’s internal control over financial reportingincludes those policies and procedures that (1) pertain to the maintenance of records that, in reasonable detail,accurately and fairly reflect the transactions and dispositions of the assets of the company; (2) provide reasonableassurance that transactions are recorded as necessary to permit preparation of financial statements in accordancewith generally accepted accounting principles, and that receipts and expenditures of the company are being madeonly in accordance with authorizations of management and directors of the company; and (3) provide reasonableassurance regarding prevention or timely detection of unauthorized acquisition, use, or disposition of thecompany’s assets that could have a material effect on the financial statements.
Because of the inherent limitations of internal control over financial reporting, including the possibility ofcollusion or improper management override of controls, material misstatements due to error or fraud may not beprevented or detected on a timely basis. Also, projections of any evaluation of the effectiveness of the internalcontrol over financial reporting to future periods are subject to the risk that the controls may become inadequatebecause of changes in conditions, or that the degree of compliance with the policies or procedures maydeteriorate.
In our opinion, the Company maintained, in all material respects, effective internal control over financialreporting as of December 31, 2015, based on the criteria established in Internal Control — Integrated Framework(2013) issued by the Committee of Sponsoring Organizations of the Treadway Commission.
We have also audited, in accordance with the standards of the Public Company Accounting Oversight Board(United States), the consolidated financial statements as of and for the year ended December 31, 2015. Our reportdated February 29, 2016 expressed an unqualified opinion on those financial statements.
/s/ DELOITTE & TOUCHE LLP
Las Vegas, NevadaFebruary 29, 2016
31
REPORT OF INDEPENDENT REGISTERED PUBLIC ACCOUNTING FIRM
To the Board of Directors and Stockholders ofMGM Resorts International
We have audited the accompanying consolidated balance sheets of MGM Resorts International andsubsidiaries (the “Company”) as of December 31, 2015 and 2014, and the related consolidated statements ofoperations, comprehensive income (loss), stockholders’ equity, and cash flows for each of the three years in theperiod ended December 31, 2015. These financial statements are the responsibility of the Company’smanagement. Our responsibility is to express an opinion on the financial statements based on our audits.
We conducted our audits in accordance with the standards of the Public Company Accounting OversightBoard (United States). Those standards require that we plan and perform the audit to obtain reasonable assuranceabout whether the financial statements are free of material misstatement. An audit includes examining, on a testbasis, evidence supporting the amounts and disclosures in the financial statements. An audit also includesassessing the accounting principles used and significant estimates made by management, as well as evaluatingthe overall financial statement presentation. We believe that our audits provide a reasonable basis for our opinion
In our opinion, such consolidated financial statements present fairly, in all material respects, the financialposition of MGM Resorts International and subsidiaries as of December 31, 2015 and 2014, and the results oftheir operations and their cash flows for each of the three years in the period ended December 31, 2015, inconformity with accounting principles generally accepted in the United States of America.
We have also audited, in accordance with the standards of the Public Company Accounting Oversight Board(United States), the Company’s internal control over financial reporting as of December 31, 2015, based on thecriteria established in Internal Control — Integrated Framework (2013) issued by the Committee of SponsoringOrganizations of the Treadway Commission and our report dated February 29, 2016 expressed an unqualifiedopinion on the Company’s internal control over financial reporting.
/s/ DELOITTE & TOUCHE LLP
Las Vegas, NevadaFebruary 29, 2016
32
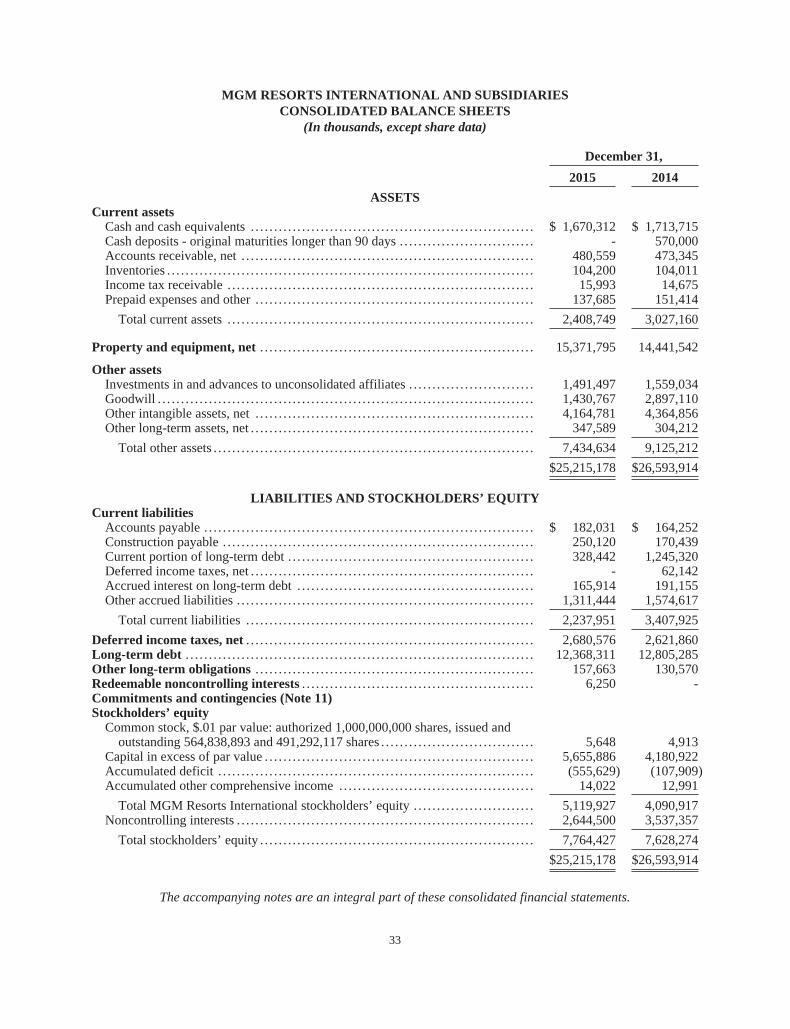
MGM RESORTS INTERNATIONAL AND SUBSIDIARIESCONSOLIDATED BALANCE SHEETS
(In thousands, except share data)
December 31,
2015 2014
ASSETSCurrent assets
Cash and cash equivalents . . . . . . . . . . . . . . . . . . . . . . . . . . . . . . . . . . . . . . . . . . . . . . . . . . . . . . . . . . . . . $ 1,670,312 $ 1,713,715Cash deposits - original maturities longer than 90 days . . . . . . . . . . . . . . . . . . . . . . . . . . . . . - 570,000Accounts receivable, net . . . . . . . . . . . . . . . . . . . . . . . . . . . . . . . . . . . . . . . . . . . . . . . . . . . . . . . . . . . . . . . 480,559 473,345Inventories . . . . . . . . . . . . . . . . . . . . . . . . . . . . . . . . . . . . . . . . . . . . . . . . . . . . . . . . . . . . . . . . . . . . . . . . . . . . . . . 104,200 104,011Income tax receivable . . . . . . . . . . . . . . . . . . . . . . . . . . . . . . . . . . . . . . . . . . . . . . . . . . . . . . . . . . . . . . . . . . 15,993 14,675Prepaid expenses and other . . . . . . . . . . . . . . . . . . . . . . . . . . . . . . . . . . . . . . . . . . . . . . . . . . . . . . . . . . . . 137,685 151,414
Total current assets . . . . . . . . . . . . . . . . . . . . . . . . . . . . . . . . . . . . . . . . . . . . . . . . . . . . . . . . . . . . . . . . . . 2,408,749 3,027,160
Property and equipment, net . . . . . . . . . . . . . . . . . . . . . . . . . . . . . . . . . . . . . . . . . . . . . . . . . . . . . . . . . . . 15,371,795 14,441,542
Other assetsInvestments in and advances to unconsolidated affiliates . . . . . . . . . . . . . . . . . . . . . . . . . . . 1,491,497 1,559,034Goodwill . . . . . . . . . . . . . . . . . . . . . . . . . . . . . . . . . . . . . . . . . . . . . . . . . . . . . . . . . . . . . . . . . . . . . . . . . . . . . . . . . 1,430,767 2,897,110Other intangible assets, net . . . . . . . . . . . . . . . . . . . . . . . . . . . . . . . . . . . . . . . . . . . . . . . . . . . . . . . . . . . . 4,164,781 4,364,856Other long-term assets, net . . . . . . . . . . . . . . . . . . . . . . . . . . . . . . . . . . . . . . . . . . . . . . . . . . . . . . . . . . . . . 347,589 304,212
Total other assets . . . . . . . . . . . . . . . . . . . . . . . . . . . . . . . . . . . . . . . . . . . . . . . . . . . . . . . . . . . . . . . . . . . . . 7,434,634 9,125,212
$25,215,178 $26,593,914
LIABILITIES AND STOCKHOLDERS’ EQUITYCurrent liabilities
Accounts payable . . . . . . . . . . . . . . . . . . . . . . . . . . . . . . . . . . . . . . . . . . . . . . . . . . . . . . . . . . . . . . . . . . . . . . . $ 182,031 $ 164,252Construction payable . . . . . . . . . . . . . . . . . . . . . . . . . . . . . . . . . . . . . . . . . . . . . . . . . . . . . . . . . . . . . . . . . . . 250,120 170,439Current portion of long-term debt . . . . . . . . . . . . . . . . . . . . . . . . . . . . . . . . . . . . . . . . . . . . . . . . . . . . . 328,442 1,245,320Deferred income taxes, net . . . . . . . . . . . . . . . . . . . . . . . . . . . . . . . . . . . . . . . . . . . . . . . . . . . . . . . . . . . . . - 62,142Accrued interest on long-term debt . . . . . . . . . . . . . . . . . . . . . . . . . . . . . . . . . . . . . . . . . . . . . . . . . . . 165,914 191,155Other accrued liabilities . . . . . . . . . . . . . . . . . . . . . . . . . . . . . . . . . . . . . . . . . . . . . . . . . . . . . . . . . . . . . . . . 1,311,444 1,574,617
Total current liabilities . . . . . . . . . . . . . . . . . . . . . . . . . . . . . . . . . . . . . . . . . . . . . . . . . . . . . . . . . . . . . . 2,237,951 3,407,925
Deferred income taxes, net . . . . . . . . . . . . . . . . . . . . . . . . . . . . . . . . . . . . . . . . . . . . . . . . . . . . . . . . . . . . . . 2,680,576 2,621,860Long-term debt . . . . . . . . . . . . . . . . . . . . . . . . . . . . . . . . . . . . . . . . . . . . . . . . . . . . . . . . . . . . . . . . . . . . . . . . . . . 12,368,311 12,805,285Other long-term obligations . . . . . . . . . . . . . . . . . . . . . . . . . . . . . . . . . . . . . . . . . . . . . . . . . . . . . . . . . . . . 157,663 130,570Redeemable noncontrolling interests . . . . . . . . . . . . . . . . . . . . . . . . . . . . . . . . . . . . . . . . . . . . . . . . . . 6,250 -Commitments and contingencies (Note 11)Stockholders’ equity
Common stock, $.01 par value: authorized 1,000,000,000 shares, issued andoutstanding 564,838,893 and 491,292,117 shares . . . . . . . . . . . . . . . . . . . . . . . . . . . . . . . . . 5,648 4,913
Capital in excess of par value . . . . . . . . . . . . . . . . . . . . . . . . . . . . . . . . . . . . . . . . . . . . . . . . . . . . . . . . . . 5,655,886 4,180,922Accumulated deficit . . . . . . . . . . . . . . . . . . . . . . . . . . . . . . . . . . . . . . . . . . . . . . . . . . . . . . . . . . . . . . . . . . . . (555,629) (107,909)Accumulated other comprehensive income . . . . . . . . . . . . . . . . . . . . . . . . . . . . . . . . . . . . . . . . . . 14,022 12,991
Total MGM Resorts International stockholders’ equity . . . . . . . . . . . . . . . . . . . . . . . . . . 5,119,927 4,090,917Noncontrolling interests . . . . . . . . . . . . . . . . . . . . . . . . . . . . . . . . . . . . . . . . . . . . . . . . . . . . . . . . . . . . . . . . 2,644,500 3,537,357
Total stockholders’ equity . . . . . . . . . . . . . . . . . . . . . . . . . . . . . . . . . . . . . . . . . . . . . . . . . . . . . . . . . . . 7,764,427 7,628,274
$25,215,178 $26,593,914
The accompanying notes are an integral part of these consolidated financial statements.
33
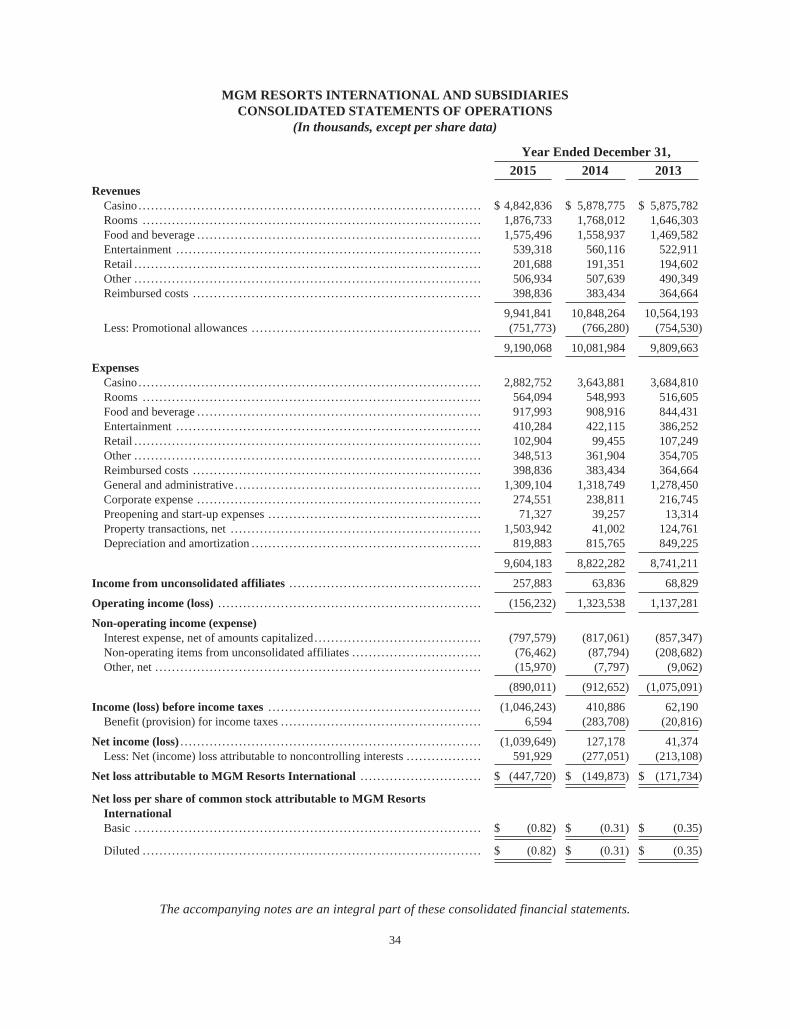
MGM RESORTS INTERNATIONAL AND SUBSIDIARIESCONSOLIDATED STATEMENTS OF OPERATIONS
(In thousands, except per share data)
Year Ended December 31,
2015 2014 2013
RevenuesCasino . . . . . . . . . . . . . . . . . . . . . . . . . . . . . . . . . . . . . . . . . . . . . . . . . . . . . . . . . . . . . . . . . . . . . . . . . . . . . . . . . . $ 4,842,836 $ 5,878,775 $ 5,875,782Rooms . . . . . . . . . . . . . . . . . . . . . . . . . . . . . . . . . . . . . . . . . . . . . . . . . . . . . . . . . . . . . . . . . . . . . . . . . . . . . . . . . 1,876,733 1,768,012 1,646,303Food and beverage . . . . . . . . . . . . . . . . . . . . . . . . . . . . . . . . . . . . . . . . . . . . . . . . . . . . . . . . . . . . . . . . . . . . 1,575,496 1,558,937 1,469,582Entertainment . . . . . . . . . . . . . . . . . . . . . . . . . . . . . . . . . . . . . . . . . . . . . . . . . . . . . . . . . . . . . . . . . . . . . . . . . 539,318 560,116 522,911Retail . . . . . . . . . . . . . . . . . . . . . . . . . . . . . . . . . . . . . . . . . . . . . . . . . . . . . . . . . . . . . . . . . . . . . . . . . . . . . . . . . . . 201,688 191,351 194,602Other . . . . . . . . . . . . . . . . . . . . . . . . . . . . . . . . . . . . . . . . . . . . . . . . . . . . . . . . . . . . . . . . . . . . . . . . . . . . . . . . . . . 506,934 507,639 490,349Reimbursed costs . . . . . . . . . . . . . . . . . . . . . . . . . . . . . . . . . . . . . . . . . . . . . . . . . . . . . . . . . . . . . . . . . . . . . 398,836 383,434 364,664
9,941,841 10,848,264 10,564,193Less: Promotional allowances . . . . . . . . . . . . . . . . . . . . . . . . . . . . . . . . . . . . . . . . . . . . . . . . . . . . . . . (751,773) (766,280) (754,530)
9,190,068 10,081,984 9,809,663
ExpensesCasino . . . . . . . . . . . . . . . . . . . . . . . . . . . . . . . . . . . . . . . . . . . . . . . . . . . . . . . . . . . . . . . . . . . . . . . . . . . . . . . . . . 2,882,752 3,643,881 3,684,810Rooms . . . . . . . . . . . . . . . . . . . . . . . . . . . . . . . . . . . . . . . . . . . . . . . . . . . . . . . . . . . . . . . . . . . . . . . . . . . . . . . . . 564,094 548,993 516,605Food and beverage . . . . . . . . . . . . . . . . . . . . . . . . . . . . . . . . . . . . . . . . . . . . . . . . . . . . . . . . . . . . . . . . . . . . 917,993 908,916 844,431Entertainment . . . . . . . . . . . . . . . . . . . . . . . . . . . . . . . . . . . . . . . . . . . . . . . . . . . . . . . . . . . . . . . . . . . . . . . . . 410,284 422,115 386,252Retail . . . . . . . . . . . . . . . . . . . . . . . . . . . . . . . . . . . . . . . . . . . . . . . . . . . . . . . . . . . . . . . . . . . . . . . . . . . . . . . . . . . 102,904 99,455 107,249Other . . . . . . . . . . . . . . . . . . . . . . . . . . . . . . . . . . . . . . . . . . . . . . . . . . . . . . . . . . . . . . . . . . . . . . . . . . . . . . . . . . . 348,513 361,904 354,705Reimbursed costs . . . . . . . . . . . . . . . . . . . . . . . . . . . . . . . . . . . . . . . . . . . . . . . . . . . . . . . . . . . . . . . . . . . . . 398,836 383,434 364,664General and administrative . . . . . . . . . . . . . . . . . . . . . . . . . . . . . . . . . . . . . . . . . . . . . . . . . . . . . . . . . . . 1,309,104 1,318,749 1,278,450Corporate expense . . . . . . . . . . . . . . . . . . . . . . . . . . . . . . . . . . . . . . . . . . . . . . . . . . . . . . . . . . . . . . . . . . . . 274,551 238,811 216,745Preopening and start-up expenses . . . . . . . . . . . . . . . . . . . . . . . . . . . . . . . . . . . . . . . . . . . . . . . . . . . 71,327 39,257 13,314Property transactions, net . . . . . . . . . . . . . . . . . . . . . . . . . . . . . . . . . . . . . . . . . . . . . . . . . . . . . . . . . . . . 1,503,942 41,002 124,761Depreciation and amortization . . . . . . . . . . . . . . . . . . . . . . . . . . . . . . . . . . . . . . . . . . . . . . . . . . . . . . . 819,883 815,765 849,225
9,604,183 8,822,282 8,741,211
Income from unconsolidated affiliates . . . . . . . . . . . . . . . . . . . . . . . . . . . . . . . . . . . . . . . . . . . . . . 257,883 63,836 68,829
Operating income (loss) . . . . . . . . . . . . . . . . . . . . . . . . . . . . . . . . . . . . . . . . . . . . . . . . . . . . . . . . . . . . . . . (156,232) 1,323,538 1,137,281
Non-operating income (expense)Interest expense, net of amounts capitalized. . . . . . . . . . . . . . . . . . . . . . . . . . . . . . . . . . . . . . . . (797,579) (817,061) (857,347)Non-operating items from unconsolidated affiliates . . . . . . . . . . . . . . . . . . . . . . . . . . . . . . . (76,462) (87,794) (208,682)Other, net . . . . . . . . . . . . . . . . . . . . . . . . . . . . . . . . . . . . . . . . . . . . . . . . . . . . . . . . . . . . . . . . . . . . . . . . . . . . . . (15,970) (7,797) (9,062)
(890,011) (912,652) (1,075,091)
Income (loss) before income taxes . . . . . . . . . . . . . . . . . . . . . . . . . . . . . . . . . . . . . . . . . . . . . . . . . . . (1,046,243) 410,886 62,190Benefit (provision) for income taxes . . . . . . . . . . . . . . . . . . . . . . . . . . . . . . . . . . . . . . . . . . . . . . . . 6,594 (283,708) (20,816)
Net income (loss) . . . . . . . . . . . . . . . . . . . . . . . . . . . . . . . . . . . . . . . . . . . . . . . . . . . . . . . . . . . . . . . . . . . . . . . . (1,039,649) 127,178 41,374Less: Net (income) loss attributable to noncontrolling interests . . . . . . . . . . . . . . . . . . 591,929 (277,051) (213,108)
Net loss attributable to MGM Resorts International . . . . . . . . . . . . . . . . . . . . . . . . . . . . . $ (447,720) $ (149,873) $ (171,734)
Net loss per share of common stock attributable to MGM ResortsInternationalBasic . . . . . . . . . . . . . . . . . . . . . . . . . . . . . . . . . . . . . . . . . . . . . . . . . . . . . . . . . . . . . . . . . . . . . . . . . . . . . . . . . . . $ (0.82) $ (0.31) $ (0.35)
Diluted . . . . . . . . . . . . . . . . . . . . . . . . . . . . . . . . . . . . . . . . . . . . . . . . . . . . . . . . . . . . . . . . . . . . . . . . . . . . . . . . . $ (0.82) $ (0.31) $ (0.35)
The accompanying notes are an integral part of these consolidated financial statements.
34

MGM RESORTS INTERNATIONAL AND SUBSIDIARIESCONSOLIDATED STATEMENTS OF COMPREHENSIVE INCOME (LOSS)
(In thousands)
Year Ended December 31,
2015 2014 2013
Net income (loss) . . . . . . . . . . . . . . . . . . . . . . . . . . . . . . . . . . . . . . . . . . . . . . . $ (1,039,649) $ 127,178 $ 41,374Other comprehensive income (loss), net of tax:
Foreign currency translation adjustment . . . . . . . . . . . . . . . . . . . 3,727 (1,293) (3,993)Other . . . . . . . . . . . . . . . . . . . . . . . . . . . . . . . . . . . . . . . . . . . . . . . . . . . . . . . . . . . (672) 1,250 115
Other comprehensive income (loss) . . . . . . . . . . . . . . . . . . . . . . 3,055 (43) (3,878)
Comprehensive income (loss) . . . . . . . . . . . . . . . . . . . . . . . . . . . . . . . . (1,036,594) 127,135 37,496Less: Comprehensive (income) loss attributable to
noncontrolling interests . . . . . . . . . . . . . . . . . . . . . . . . . . . . . . . . . . . 589,905 (276,520) (211,030)
Comprehensive loss attributable to MGM ResortsInternational . . . . . . . . . . . . . . . . . . . . . . . . . . . . . . . . . . . . . . . . . . . . . . . . . $ (446,689) $ (149,385) $ (173,534)
The accompanying notes are an integral part of these consolidated financial statements.
35
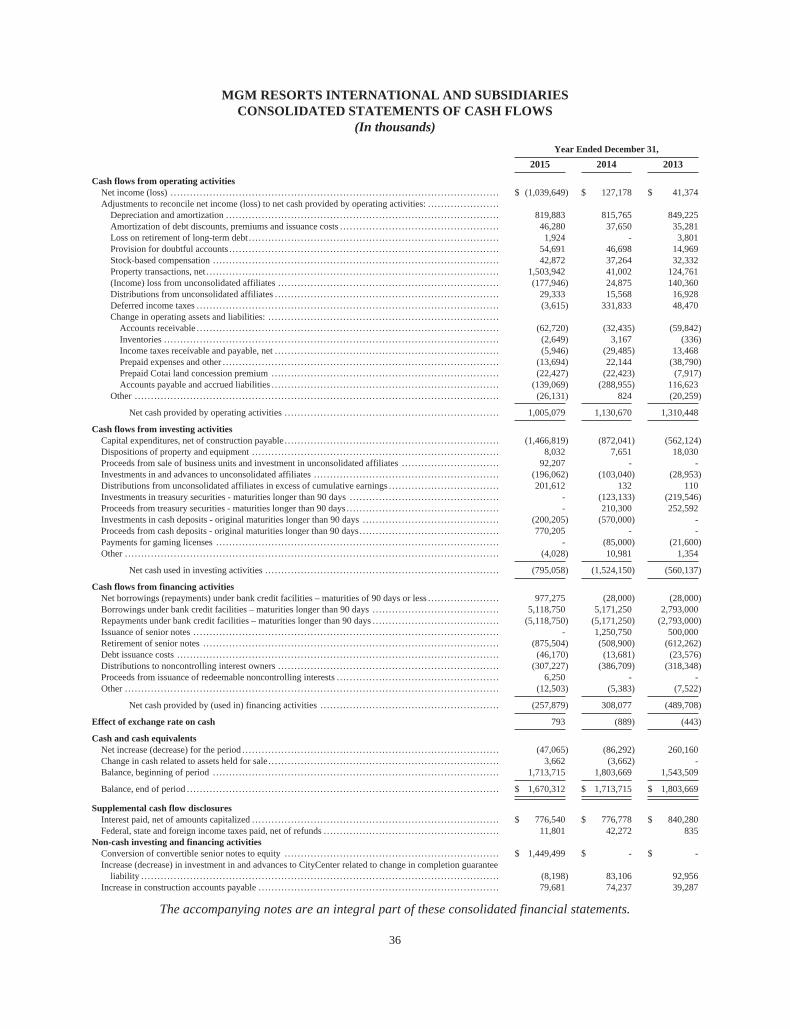
MGM RESORTS INTERNATIONAL AND SUBSIDIARIESCONSOLIDATED STATEMENTS OF CASH FLOWS
(In thousands)
Year Ended December 31,
2015 2014 2013
Cash flows from operating activitiesNet income (loss) . . . . . . . . . . . . . . . . . . . . . . . . . . . . . . . . . . . . . . . . . . . . . . . . . . . . . . . . . . . . . . . . . . . . . . . . . . . . . . . . . . . . . . . . . . . . . . . . . . . . . $ (1,039,649) $ 127,178 $ 41,374Adjustments to reconcile net income (loss) to net cash provided by operating activities: . . . . . . . . . . . . . . . . . . . . . .
Depreciation and amortization . . . . . . . . . . . . . . . . . . . . . . . . . . . . . . . . . . . . . . . . . . . . . . . . . . . . . . . . . . . . . . . . . . . . . . . . . . . . . . . . . . . . 819,883 815,765 849,225Amortization of debt discounts, premiums and issuance costs . . . . . . . . . . . . . . . . . . . . . . . . . . . . . . . . . . . . . . . . . . . . . . . . . 46,280 37,650 35,281Loss on retirement of long-term debt . . . . . . . . . . . . . . . . . . . . . . . . . . . . . . . . . . . . . . . . . . . . . . . . . . . . . . . . . . . . . . . . . . . . . . . . . . . . . 1,924 - 3,801Provision for doubtful accounts . . . . . . . . . . . . . . . . . . . . . . . . . . . . . . . . . . . . . . . . . . . . . . . . . . . . . . . . . . . . . . . . . . . . . . . . . . . . . . . . . . . 54,691 46,698 14,969Stock-based compensation . . . . . . . . . . . . . . . . . . . . . . . . . . . . . . . . . . . . . . . . . . . . . . . . . . . . . . . . . . . . . . . . . . . . . . . . . . . . . . . . . . . . . . . . 42,872 37,264 32,332Property transactions, net . . . . . . . . . . . . . . . . . . . . . . . . . . . . . . . . . . . . . . . . . . . . . . . . . . . . . . . . . . . . . . . . . . . . . . . . . . . . . . . . . . . . . . . . . . 1,503,942 41,002 124,761(Income) loss from unconsolidated affiliates . . . . . . . . . . . . . . . . . . . . . . . . . . . . . . . . . . . . . . . . . . . . . . . . . . . . . . . . . . . . . . . . . . . . (177,946) 24,875 140,360Distributions from unconsolidated affiliates . . . . . . . . . . . . . . . . . . . . . . . . . . . . . . . . . . . . . . . . . . . . . . . . . . . . . . . . . . . . . . . . . . . . . 29,333 15,568 16,928Deferred income taxes . . . . . . . . . . . . . . . . . . . . . . . . . . . . . . . . . . . . . . . . . . . . . . . . . . . . . . . . . . . . . . . . . . . . . . . . . . . . . . . . . . . . . . . . . . . . . (3,615) 331,833 48,470Change in operating assets and liabilities: . . . . . . . . . . . . . . . . . . . . . . . . . . . . . . . . . . . . . . . . . . . . . . . . . . . . . . . . . . . . . . . . . . . . . . .
Accounts receivable . . . . . . . . . . . . . . . . . . . . . . . . . . . . . . . . . . . . . . . . . . . . . . . . . . . . . . . . . . . . . . . . . . . . . . . . . . . . . . . . . . . . . . . . . . . . . (62,720) (32,435) (59,842)Inventories . . . . . . . . . . . . . . . . . . . . . . . . . . . . . . . . . . . . . . . . . . . . . . . . . . . . . . . . . . . . . . . . . . . . . . . . . . . . . . . . . . . . . . . . . . . . . . . . . . . . . . . (2,649) 3,167 (336)Income taxes receivable and payable, net . . . . . . . . . . . . . . . . . . . . . . . . . . . . . . . . . . . . . . . . . . . . . . . . . . . . . . . . . . . . . . . . . . . . . (5,946) (29,485) 13,468Prepaid expenses and other . . . . . . . . . . . . . . . . . . . . . . . . . . . . . . . . . . . . . . . . . . . . . . . . . . . . . . . . . . . . . . . . . . . . . . . . . . . . . . . . . . . . . (13,694) 22,144 (38,790)Prepaid Cotai land concession premium .. . . . . . . . . . . . . . . . . . . . . . . . . . . . . . . . . . . . . . . . . . . . . . . . . . . . . . . . . . . . . . . . . . . . . (22,427) (22,423) (7,917)Accounts payable and accrued liabilities . . . . . . . . . . . . . . . . . . . . . . . . . . . . . . . . . . . . . . . . . . . . . . . . . . . . . . . . . . . . . . . . . . . . . . (139,069) (288,955) 116,623
Other . . . . . . . . . . . . . . . . . . . . . . . . . . . . . . . . . . . . . . . . . . . . . . . . . . . . . . . . . . . . . . . . . . . . . . . . . . . . . . . . . . . . . . . . . . . . . . . . . . . . . . . . . . . . . . . . (26,131) 824 (20,259)
Net cash provided by operating activities . . . . . . . . . . . . . . . . . . . . . . . . . . . . . . . . . . . . . . . . . . . . . . . . . . . . . . . . . . . . . . . . . . 1,005,079 1,130,670 1,310,448
Cash flows from investing activitiesCapital expenditures, net of construction payable . . . . . . . . . . . . . . . . . . . . . . . . . . . . . . . . . . . . . . . . . . . . . . . . . . . . . . . . . . . . . . . . . . (1,466,819) (872,041) (562,124)Dispositions of property and equipment . . . . . . . . . . . . . . . . . . . . . . . . . . . . . . . . . . . . . . . . . . . . . . . . . . . . . . . . . . . . . . . . . . . . . . . . . . . . 8,032 7,651 18,030Proceeds from sale of business units and investment in unconsolidated affiliates . . . . . . . . . . . . . . . . . . . . . . . . . . . . . . 92,207 - -Investments in and advances to unconsolidated affiliates . . . . . . . . . . . . . . . . . . . . . . . . . . . . . . . . . . . . . . . . . . . . . . . . . . . . . . . . . (196,062) (103,040) (28,953)Distributions from unconsolidated affiliates in excess of cumulative earnings . . . . . . . . . . . . . . . . . . . . . . . . . . . . . . . . . . 201,612 132 110Investments in treasury securities - maturities longer than 90 days . . . . . . . . . . . . . . . . . . . . . . . . . . . . . . . . . . . . . . . . . . . . . . - (123,133) (219,546)Proceeds from treasury securities - maturities longer than 90 days . . . . . . . . . . . . . . . . . . . . . . . . . . . . . . . . . . . . . . . . . . . . . . . - 210,300 252,592Investments in cash deposits - original maturities longer than 90 days . . . . . . . . . . . . . . . . . . . . . . . . . . . . . . . . . . . . . . . . . . (200,205) (570,000) -Proceeds from cash deposits - original maturities longer than 90 days . . . . . . . . . . . . . . . . . . . . . . . . . . . . . . . . . . . . . . . . . . . 770,205 - -Payments for gaming licenses . . . . . . . . . . . . . . . . . . . . . . . . . . . . . . . . . . . . . . . . . . . . . . . . . . . . . . . . . . . . . . . . . . . . . . . . . . . . . . . . . . . . . . . - (85,000) (21,600)Other . . . . . . . . . . . . . . . . . . . . . . . . . . . . . . . . . . . . . . . . . . . . . . . . . . . . . . . . . . . . . . . . . . . . . . . . . . . . . . . . . . . . . . . . . . . . . . . . . . . . . . . . . . . . . . . . . . . (4,028) 10,981 1,354
Net cash used in investing activities . . . . . . . . . . . . . . . . . . . . . . . . . . . . . . . . . . . . . . . . . . . . . . . . . . . . . . . . . . . . . . . . . . . . . . . . (795,058) (1,524,150) (560,137)
Cash flows from financing activitiesNet borrowings (repayments) under bank credit facilities – maturities of 90 days or less . . . . . . . . . . . . . . . . . . . . . . 977,275 (28,000) (28,000)Borrowings under bank credit facilities – maturities longer than 90 days . . . . . . . . . . . . . . . . . . . . . . . . . . . . . . . . . . . . . . . 5,118,750 5,171,250 2,793,000Repayments under bank credit facilities – maturities longer than 90 days . . . . . . . . . . . . . . . . . . . . . . . . . . . . . . . . . . . . . . . (5,118,750) (5,171,250) (2,793,000)Issuance of senior notes . . . . . . . . . . . . . . . . . . . . . . . . . . . . . . . . . . . . . . . . . . . . . . . . . . . . . . . . . . . . . . . . . . . . . . . . . . . . . . . . . . . . . . . . . . . . . . - 1,250,750 500,000Retirement of senior notes . . . . . . . . . . . . . . . . . . . . . . . . . . . . . . . . . . . . . . . . . . . . . . . . . . . . . . . . . . . . . . . . . . . . . . . . . . . . . . . . . . . . . . . . . . . (875,504) (508,900) (612,262)Debt issuance costs . . . . . . . . . . . . . . . . . . . . . . . . . . . . . . . . . . . . . . . . . . . . . . . . . . . . . . . . . . . . . . . . . . . . . . . . . . . . . . . . . . . . . . . . . . . . . . . . . . . (46,170) (13,681) (23,576)Distributions to noncontrolling interest owners . . . . . . . . . . . . . . . . . . . . . . . . . . . . . . . . . . . . . . . . . . . . . . . . . . . . . . . . . . . . . . . . . . . . (307,227) (386,709) (318,348)Proceeds from issuance of redeemable noncontrolling interests . . . . . . . . . . . . . . . . . . . . . . . . . . . . . . . . . . . . . . . . . . . . . . . . . . 6,250 - -Other . . . . . . . . . . . . . . . . . . . . . . . . . . . . . . . . . . . . . . . . . . . . . . . . . . . . . . . . . . . . . . . . . . . . . . . . . . . . . . . . . . . . . . . . . . . . . . . . . . . . . . . . . . . . . . . . . . . (12,503) (5,383) (7,522)
Net cash provided by (used in) financing activities . . . . . . . . . . . . . . . . . . . . . . . . . . . . . . . . . . . . . . . . . . . . . . . . . . . . . . . (257,879) 308,077 (489,708)
Effect of exchange rate on cash 793 (889) (443)
Cash and cash equivalentsNet increase (decrease) for the period . . . . . . . . . . . . . . . . . . . . . . . . . . . . . . . . . . . . . . . . . . . . . . . . . . . . . . . . . . . . . . . . . . . . . . . . . . . . . . . (47,065) (86,292) 260,160Change in cash related to assets held for sale. . . . . . . . . . . . . . . . . . . . . . . . . . . . . . . . . . . . . . . . . . . . . . . . . . . . . . . . . . . . . . . . . . . . . . . 3,662 (3,662) -Balance, beginning of period . . . . . . . . . . . . . . . . . . . . . . . . . . . . . . . . . . . . . . . . . . . . . . . . . . . . . . . . . . . . . . . . . . . . . . . . . . . . . . . . . . . . . . . . 1,713,715 1,803,669 1,543,509
Balance, end of period . . . . . . . . . . . . . . . . . . . . . . . . . . . . . . . . . . . . . . . . . . . . . . . . . . . . . . . . . . . . . . . . . . . . . . . . . . . . . . . . . . . . . . . . . . . . . . . . $ 1,670,312 $ 1,713,715 $ 1,803,669
Supplemental cash flow disclosuresInterest paid, net of amounts capitalized . . . . . . . . . . . . . . . . . . . . . . . . . . . . . . . . . . . . . . . . . . . . . . . . . . . . . . . . . . . . . . . . . . . . . . . . . . . . $ 776,540 $ 776,778 $ 840,280Federal, state and foreign income taxes paid, net of refunds . . . . . . . . . . . . . . . . . . . . . . . . . . . . . . . . . . . . . . . . . . . . . . . . . . . . . . 11,801 42,272 835
Non-cash investing and financing activitiesConversion of convertible senior notes to equity . . . . . . . . . . . . . . . . . . . . . . . . . . . . . . . . . . . . . . . . . . . . . . . . . . . . . . . . . . . . . . . . . . $ 1,449,499 $ - $ -Increase (decrease) in investment in and advances to CityCenter related to change in completion guarantee
liability . . . . . . . . . . . . . . . . . . . . . . . . . . . . . . . . . . . . . . . . . . . . . . . . . . . . . . . . . . . . . . . . . . . . . . . . . . . . . . . . . . . . . . . . . . . . . . . . . . . . . . . . . . . . . . (8,198) 83,106 92,956Increase in construction accounts payable . . . . . . . . . . . . . . . . . . . . . . . . . . . . . . . . . . . . . . . . . . . . . . . . . . . . . . . . . . . . . . . . . . . . . . . . . . 79,681 74,237 39,287
The accompanying notes are an integral part of these consolidated financial statements.
36

MGM RESORTS INTERNATIONAL AND SUBSIDIARIESCONSOLIDATED STATEMENTS OF STOCKHOLDERS’ EQUITY
For the Years ended December 31, 2015, 2014 and 2013(In thousands)
CommonStock
Capital inExcess ofPar Value
RetainedEarnings
(AccumulatedDeficit)
AccumulatedOther
ComprehensiveIncome
TotalMGM ResortsInternationalStockholders’
Equity
Non-Controlling
Interests
TotalStockholders’
EquitySharesPar
Value
Balances, January 1, 2013 . . . . . . . . . . . . . . . . . . . . . . . . . . . 489,234 $4,892 $4,132,655 $ 213,698 $ 14,303 $ 4,365,548 $ 3,750,468 $ 8,116,016Net income (loss) . . . . . . . . . . . . . . . . . . . . . . . . . . . . . . . . . . . - - - (171,734) - (171,734) 213,108 41,374Currency translation adjustment . . . . . . . . . . . . . . . . . . . - - - - (1,915) (1,915) (2,078) (3,993)Other comprehensive income from
unconsolidated affiliates, net . . . . . . . . . . . . . . . . . . . . - - - - 115 115 - 115Stock-based compensation . . . . . . . . . . . . . . . . . . . . . . . . . - - 30,374 - - 30,374 3,048 33,422Tax effect of stock-based compensation . . . . . . . . . . - - 4,188 - - 4,188 - 4,188Issuance of common stock pursuant to stock-
based compensation awards . . . . . . . . . . . . . . . . . . . . . 1,127 12 (8,706) - - (8,694) - (8,694)Cash distributions to noncontrolling interest
owners . . . . . . . . . . . . . . . . . . . . . . . . . . . . . . . . . . . . . . . . . . . . . - - - - - - (318,344) (318,344)Other . . . . . . . . . . . . . . . . . . . . . . . . . . . . . . . . . . . . . . . . . . . . . . . . . - - (1,831) - - (1,831) (1,758) (3,589)
Balances, December 31, 2013 . . . . . . . . . . . . . . . . . . . . . . . 490,361 4,904 4,156,680 41,964 12,503 4,216,051 3,644,444 7,860,495Net income (loss) . . . . . . . . . . . . . . . . . . . . . . . . . . . . . . . . . . . - - - (149,873) - (149,873) 277,051 127,178Currency translation adjustment . . . . . . . . . . . . . . . . . . . - - - - (762) (762) (531) (1,293)Other comprehensive income from
unconsolidated affiliates, net . . . . . . . . . . . . . . . . . . . . - - - - 1,250 1,250 - 1,250Stock-based compensation . . . . . . . . . . . . . . . . . . . . . . . . . - - 34,102 - - 34,102 4,266 38,368Tax effect of stock-based compensation . . . . . . . . . . - - (7,807) - - (7,807) - (7,807)Issuance of common stock pursuant to stock-
based compensation awards . . . . . . . . . . . . . . . . . . . . . 931 9 (8,893) - - (8,884) - (8,884)Cash distributions to noncontrolling interest
owners . . . . . . . . . . . . . . . . . . . . . . . . . . . . . . . . . . . . . . . . . . . . . - - - - - - (387,211) (387,211)Issuance of performance share units . . . . . . . . . . . . . . . - - 7,529 - - 7,529 - 7,529Other . . . . . . . . . . . . . . . . . . . . . . . . . . . . . . . . . . . . . . . . . . . . . . . . . - - (689) - - (689) (662) (1,351)
Balances, December 31, 2014 . . . . . . . . . . . . . . . . . . . . . . . 491,292 4,913 4,180,922 (107,909) 12,991 4,090,917 3,537,357 7,628,274Net loss . . . . . . . . . . . . . . . . . . . . . . . . . . . . . . . . . . . . . . . . . . . . . . - - - (447,720) - (447,720) (591,929) (1,039,649)Currency translation adjustment . . . . . . . . . . . . . . . . . . . - - - - 1,703 1,703 2,024 3,727Other comprehensive loss from unconsolidated
affiliates, net . . . . . . . . . . . . . . . . . . . . . . . . . . . . . . . . . . . . . . - - - - (672) (672) - (672)Stock-based compensation . . . . . . . . . . . . . . . . . . . . . . . . . - - 38,464 - - 38,464 4,538 43,002Tax effect of stock-based compensation . . . . . . . . . . - - 7,740 - - 7,740 - 7,740Issuance of common stock pursuant to stock-
based compensation awards . . . . . . . . . . . . . . . . . . . . . 1,844 18 (24,896) - - (24,878) - (24,878)Conversion of convertible debt to common
stock . . . . . . . . . . . . . . . . . . . . . . . . . . . . . . . . . . . . . . . . . . . . . . . 71,703 717 1,448,779 - - 1,449,496 - 1,449,496Cash distributions to noncontrolling interest
owners . . . . . . . . . . . . . . . . . . . . . . . . . . . . . . . . . . . . . . . . . . . . . - - - - - - (307,494) (307,494)Issuance of performance share units . . . . . . . . . . . . . . . - - 4,872 - - 4,872 - 4,872Other . . . . . . . . . . . . . . . . . . . . . . . . . . . . . . . . . . . . . . . . . . . . . . . . . - - 5 - - 5 4 9
Balances, December 31, 2015 . . . . . . . . . . . . . . . . . . . . . . . 564,839 $5,648 $5,655,886 $ (555,629) $ 14,022 $ 5,119,927 $ 2,644,500 $ 7,764,427
The accompanying notes are an integral part of these consolidated financial statements.
37

MGM RESORTS INTERNATIONAL AND SUBSIDIARIESNOTES TO CONSOLIDATED FINANCIAL STATEMENTS
NOTE 1 — ORGANIZATION
Organization. MGM Resorts International (the “Company”) is a Delaware corporation that acts largely as aholding company and, through wholly owned subsidiaries, owns and/or operates casino resorts. The Companyowns and operates the following integrated casino, hotel and entertainment resorts in Las Vegas, Nevada:Bellagio, MGM Grand Las Vegas, The Mirage, Mandalay Bay, Luxor, New York-New York, Monte Carlo,Excalibur and Circus Circus Las Vegas. Operations at MGM Grand Las Vegas include management of TheSignature at MGM Grand Las Vegas, a condominium-hotel consisting of three towers. In April 2015, theCompany closed the sale of Railroad Pass and Gold Strike which included related assets in Jean, Nevada. InNovember 2015, the Company closed the sale of Circus Circus Reno as well as the Company’s 50% interest inSilver Legacy and associated real property, with Eldorado Resorts, Inc. See Note 4 for additional discussion ofdispositions. Along with local investors, the Company owns and operates MGM Grand Detroit in Detroit,Michigan. The Company owns and operates the following resorts in Mississippi: Beau Rivage in Biloxi and GoldStrike Tunica. The Company also owns Shadow Creek, an exclusive world-class golf course locatedapproximately ten miles north of its Las Vegas Strip resorts, Primm Valley Golf Club at the California/Nevadastate line and Fallen Oak golf course in Saucier, Mississippi.
The Company owns 51% and has a controlling interest in MGM China Holdings Limited (“MGM China”),which owns MGM Grand Paradise, S.A. (“MGM Grand Paradise”), the Macau company that owns and operatesthe MGM Macau resort and casino and the related gaming subconcession and land concessions, and is in theprocess of developing an 18 acre site on the Cotai Strip in Macau (“MGM Cotai”). MGM Cotai will be anintegrated casino, hotel and entertainment resort with capacity for up to 500 gaming tables and up to 1,500 slots,and featuring approximately 1,500 hotel rooms. The actual number of gaming tables allocated to MGM Cotaiwill be determined by the Macau government prior to opening, and such allocation may be less than MGMCotai’s 500 gaming table capacity. The total estimated project budget is $3.0 billion excluding development feeseliminated in consolidation, capitalized interest and land related costs.
The Company owns 50% of and manages CityCenter, located between Bellagio and Monte Carlo. The other50% of CityCenter is owned by Infinity World Development Corp, a wholly owned subsidiary of Dubai World, aDubai, United Arab Emirates government decree entity. CityCenter consists of Aria, an integrated casino, hoteland entertainment resort; Mandarin Oriental Las Vegas, a non-gaming boutique hotel; Crystals, a retail, diningand entertainment district; and Vdara, a luxury condominium-hotel. In addition, CityCenter features residentialunits in the Residences at Mandarin Oriental and Veer. See Note 6, Note 11 and Note 17 for additionalinformation related to CityCenter.
The Company owns 50% of the Borgata Hotel Casino & Spa (“Borgata”) located on Renaissance Pointe inthe Marina area of Atlantic City, New Jersey. Boyd Gaming Corporation owns the other 50% of Borgata and alsooperates the resort. The Company also has a 50% interest in Grand Victoria. Grand Victoria is a riverboat casinoin Elgin, Illinois; an affiliate of Hyatt Gaming owns the other 50% of Grand Victoria and also operates the resort.See Note 6 for additional information regarding the Company’s investments in unconsolidated affiliates.
The Maryland Video Lottery Facility Location Commission has awarded the Company’s subsidiarydeveloping MGM National Harbor a license to build and operate a destination integrated casino, hotel andentertainment resort in Prince George’s County at National Harbor, which is a waterfront development located onthe Potomac River just outside of Washington D.C. The expected cost to develop and construct MGM NationalHarbor is approximately $1.3 billion, excluding capitalized interest and land related costs. The Company expectsthe resort to include a casino with approximately 3,600 slots and 160 table games including poker; a 300-roomhotel with luxury spa and rooftop pool; 93,100 square feet of high-end branded retail and fine and casual dining;a dedicated 3,000 seat theater venue; 50,000 square feet of meeting and event space; and a 4,700-space parkinggarage.
38
A subsidiary of the Company was awarded a casino license to build and operate MGM Springfield inSpringfield, Massachusetts. MGM Springfield will be developed on approximately 14 acres of land in downtownSpringfield, Massachusetts. The Company’s plans for the resort currently include a casino with approximately3,000 slots and 100 table games including poker; a 250-room hotel; 100,000 square feet of retail and restaurantspace; 44,000 square feet of meeting and event space; and a 3,375 space parking garage, with an expecteddevelopment and construction cost of approximately $865 million, excluding capitalized interest and land relatedcosts.
In 2013, the Company formed Las Vegas Arena Company, LLC (the “Las Vegas Arena Company”) with asubsidiary of Anschutz Entertainment Group, Inc. (“AEG”) – a leader in sports, entertainment, and promotions –to design, construct, and operate an arena that will be located on a parcel of the Company’s land between FrankSinatra Drive and New York-New York, adjacent to the Las Vegas Strip. The Company and AEG each own 50%of Las Vegas Arena Company. Such development is estimated to cost approximately $350 million, excludingcapitalized interest and land-related costs. The Las Vegas Arena Company recently entered into a multi-yearnaming rights agreement with T-Mobile. T-Mobile Arena is anticipated to seat between 18,000-20,000 people. Inaddition, the Company is building The Park entertainment district which connects to New York-New York,Monte Carlo and T-Mobile Arena. Also, effective January 1, 2016, the Las Vegas Arena Company leases andoperates the MGM Grand Garden Arena under a long term lease with an initial 15-year term, plus two 5-yearrenewal options. See Note 6 and Note 11 for additional information related to Las Vegas Arena Company.
The Company has two reportable segments: wholly owned domestic resorts and MGM China. See Note 16for additional information about the Company’s segments.
NOTE 2 — BASIS OF PRESENTATION AND SIGNIFICANT ACCOUNTING POLICIES
Principles of consolidation. The consolidated financial statements include the accounts of the Companyand its subsidiaries. The Company’s investments in unconsolidated affiliates which are 50% or less owned areaccounted for under the equity method. The Company does not have significant variable interests in variableinterest entities. All intercompany balances and transactions have been eliminated in consolidation.
Management’s use of estimates. The consolidated financial statements have been prepared in conformitywith accounting principles generally accepted in the United States of America. These principles require theCompany’s management to make estimates and assumptions that affect the reported amounts of assets andliabilities and disclosure of contingent assets and liabilities at the date of the financial statements and the reportedamounts of revenues and expenses during the reporting period. Actual results could differ from those estimates.
Fair value measurements. Fair value measurements affect the Company’s accounting and impairmentassessments of its long-lived assets, investments in unconsolidated affiliates, cost method investments, assetsacquired and liabilities assumed in an acquisition, and goodwill and other intangible assets. Fair valuemeasurements also affect the Company’s accounting for certain of its financial assets and liabilities. Fair value isdefined as the price that would be received to sell an asset or paid to transfer a liability in an orderly transactionbetween market participants at the measurement date and is measured according to a hierarchy that includes:Level 1 inputs, such as quoted prices in an active market; Level 2 inputs, which are observable inputs for similarassets; or Level 3 inputs, which are unobservable inputs.
• The Company uses Level 1 inputs for its long-term debt fair value disclosures. See Note 9;• The Company used Level 3 inputs when assessing the fair value of its investment in Grand Victoria. See
Note 6; and• The Company used Level 2 and Level 3 inputs when measuring the impairment of goodwill related to the
MGM China reporting unit, See Note 7.
Cash and cash equivalents. Cash and cash equivalents include investments and interest bearinginstruments with maturities of 90 days or less at the date of acquisition. Such investments are carried at cost,which approximates market value. Book overdraft balances resulting from the Company’s cash managementprogram are recorded as accounts payable, construction payable, or other accrued liabilities, as applicable.
39
Cash deposits – original maturities longer than 90 days. At December 31, 2014, the Company had $570million in certificates of deposit with original maturities longer than 90 days. Scheduled maturities were at orprior to March 31, 2015. The fair value of the certificates of deposit equaled their carrying value.
Accounts receivable and credit risk. Financial instruments that potentially subject the Company toconcentrations of credit risk consist primarily of casino accounts receivable. The Company issues credit toapproved casino customers and gaming promoters following background checks and investigations ofcreditworthiness. At December 31, 2015, 63% of the Company’s casino receivables were due from customersresiding in foreign countries. Business or economic conditions or other significant events in these countries couldaffect the collectability of such receivables.
Accounts receivable are typically non-interest bearing and are initially recorded at cost. Accounts arewritten off when management deems the account to be uncollectible. Recoveries of accounts previously writtenoff are recorded when received. An estimated allowance for doubtful accounts is maintained to reduce theCompany’s receivables to their net carrying amount, which approximates fair value. The allowance is estimatedbased on both a specific review of customer accounts as well as historical collection experience and currenteconomic and business conditions. Management believes that as of December 31, 2015, no significantconcentrations of credit risk existed for which an allowance had not already been recorded.
Inventories. Inventories consist primarily of food and beverage, retail merchandise and operating supplies,and are stated at the lower of cost or market. Cost is determined primarily using the average cost method for foodand beverage and operating supplies. Cost for retail merchandise is determined using the cost method.
Property and equipment. Property and equipment are stated at cost. A significant amount of theCompany’s property and equipment was acquired through business combinations and therefore recognized at fairvalue at the acquisition date. Gains or losses on dispositions of property and equipment are included in thedetermination of income or loss. Maintenance costs are expensed as incurred. As of December 31, 2015 and2014, the Company had accrued $17 million and $14 million for property and equipment within accounts payableand $44 million and $24 million related to construction retention accrued in other long-term liabilities,respectively.
Property and equipment are generally depreciated over the following estimated useful lives on a straight-linebasis:
Buildings and improvements . . . . . . . . . . . . . . . . . . . . . . . . . . . . . . . . . . . . 20 to 40 yearsLand improvements . . . . . . . . . . . . . . . . . . . . . . . . . . . . . . . . . . . . . . . . . . . . . . 10 to 20 yearsFurniture and fixtures . . . . . . . . . . . . . . . . . . . . . . . . . . . . . . . . . . . . . . . . . . . . 3 to 20 yearsEquipment . . . . . . . . . . . . . . . . . . . . . . . . . . . . . . . . . . . . . . . . . . . . . . . . . . . . . . . . . 3 to 20 years
The Company evaluates its property and equipment and other long-lived assets for impairment based on itsclassification as held for sale or to be held and used. Several criteria must be met before an asset is classified asheld for sale, including that management with the appropriate authority commits to a plan to sell the asset at areasonable price in relation to its fair value and is actively seeking a buyer. For assets held for sale, the Companyrecognizes the asset at the lower of carrying value or fair market value less costs to sell, as estimated based oncomparable asset sales, offers received, or a discounted cash flow model. For assets to be held and used, theCompany reviews for impairment whenever indicators of impairment exist. The Company then compares theestimated future cash flows of the asset, on an undiscounted basis, to the carrying value of the asset. If theundiscounted cash flows exceed the carrying value, no impairment is indicated. If the undiscounted cash flows donot exceed the carrying value, then an impairment is recorded based on the fair value of the asset, typicallymeasured using a discounted cash flow model. If an asset is still under development, future cash flows includeremaining construction costs. All recognized impairment losses, whether for assets held for sale or assets to beheld and used, are recorded as operating expenses. See Note 15 for information on recorded impairment charges.
40

Capitalized interest. The interest cost associated with major development and construction projects iscapitalized and included in the cost of the project. When no debt is incurred specifically for a project, interest iscapitalized on amounts expended on the project using the weighted-average cost of the Company’s outstandingborrowings. Capitalization of interest ceases when the project is substantially complete or development activity issuspended for more than a brief period.
Investments in and advances to unconsolidated affiliates. The Company has investments inunconsolidated affiliates accounted for under the equity method. Under the equity method, carrying value isadjusted for the Company’s share of the investees’ earnings and losses, amortization of certain basis differences,as well as capital contributions to and distributions from these companies. Distributions in excess of equitymethod earnings are recognized as a return of investment and recorded as investing cash inflows in theaccompanying consolidated statements of cash flows. The Company classifies operating income and losses aswell as gains and impairments related to its investments in unconsolidated affiliates as a component of operatingincome or loss, as the Company’s investments in such unconsolidated affiliates are an extension of theCompany’s core business operations.
The Company evaluates its investments in unconsolidated affiliates for impairment whenever events orchanges in circumstances indicate that the carrying value of its investment may have experienced an “other-than-temporary” decline in value. If such conditions exist, the Company compares the estimated fair value of theinvestment to its carrying value to determine if an impairment is indicated and determines whether theimpairment is “other-than-temporary” based on its assessment of all relevant factors, including consideration ofthe Company’s intent and ability to retain its investment. The Company estimates fair value using a discountedcash flow analysis based on estimated future results of the investee and market indicators of terminal yearcapitalization rates, and a market approach that utilizes business enterprise value multiples based on a range ofmultiples from the Company’s peer group. See Note 6 for results of the Company’s review of its investment incertain of its unconsolidated affiliates.
Goodwill and other intangible assets. Goodwill represents the excess of purchase price over fair marketvalue of net assets acquired in business combinations. Goodwill and indefinite-lived intangible assets must bereviewed for impairment at least annually and between annual test dates in certain circumstances. The Companyperforms its annual impairment tests in the fourth quarter of each fiscal year. An impairment of goodwill relatedto the MGM China reporting unit was recorded as a result of the annual impairment review in 2015. Noimpairments were indicated or recorded in 2014 and 2013. See Note 7.
Goodwill for relevant reporting units is tested for impairment using a discounted cash flow analysis based onthe estimated future results of the Company’s reporting units discounted using market discount rates and marketindicators of terminal year capitalization rates, and a market approach that utilizes business enterprise valuemultiples based on a range of multiples from the Company’s peer group. If the carrying value of the reporting unitexceeds its fair value, an indication of impairment exists and the Company must proceed to measure an impairmentloss, if any. To measure an impairment loss, the implied fair value of a reporting unit’s goodwill is compared to thecarrying value of that goodwill. The implied fair value of goodwill is determined by allocating the fair value of thereporting unit to its assets and liabilities and the amount remaining, if any, is the implied fair value of goodwill. Ifthe implied fair value of goodwill is less than its carrying value then it must be written down to its implied fairvalue. License rights are tested for impairment using a discounted cash flow approach, and trademarks are tested forimpairment using the relief-from-royalty method. If the fair value of an indefinite-lived intangible asset is less thanits carrying amount, an impairment loss is recognized equal to the difference.
Revenue recognition and promotional allowances. Casino revenue is the aggregate net differencebetween gaming wins and losses, with liabilities recognized for funds deposited by customers before gaming playoccurs (“casino front money”) and for chips in the customers’ possession (“outstanding chip liability”). Hotel,food and beverage, entertainment, retail and other operating revenues are recognized as services are performedand goods are provided. Advance deposits on rooms and advance ticket sales are recorded as accrued liabilitiesuntil services are provided to the customer.
41

Gaming revenues are recognized net of certain sales incentives, including discounts and points earned inpoint-loyalty programs. The retail value of hotel rooms, food and beverage, and other services furnished to guestswithout charge is included in gross revenue and then deducted as promotional allowances. The estimated cost ofproviding promotional allowances is primarily included in casino expenses as follows:
Year Ended December 31,
2015 2014 2013(In thousands)
Rooms . . . . . . . . . . . . . . . . . . . . . . . . . . . . . . . . . . . . . . . . . . . . . . . . . . . . . . . . . . . . . . . . . $ 112,313 $ 115,463 $ 111,842Food and beverage . . . . . . . . . . . . . . . . . . . . . . . . . . . . . . . . . . . . . . . . . . . . . . . . . . . 279,041 295,667 294,555Entertainment, retail and other . . . . . . . . . . . . . . . . . . . . . . . . . . . . . . . . . . . . . . 39,388 39,673 39,606
$ 430,742 $ 450,803 $ 446,003
Gaming promoters. A significant portion of the high-end (“VIP”) gaming volume at MGM Macau isgenerated through the use of gaming promoters, also known as junket operators. These operators introduce high-end gaming players to MGM Macau, assist these customers with travel arrangements, and extend gaming creditto these players. VIP gaming at MGM Macau is conducted by the use of special purpose nonnegotiable gamingchips. Gaming promoters purchase these nonnegotiable chips from MGM Macau and in turn sell these chips totheir players. The nonnegotiable chips allow MGM Macau to track the amount of wagering conducted by eachgaming promoters’ clients in order to determine VIP gaming play volume, or rolling chip turnover, which is theamount of nonnegotiable chips wagered and lost. In exchange for the gaming promoters’ services, MGM Macaucompensates the gaming promoters through revenue-sharing arrangements or rolling chip turnover-basedcommissions. The estimated portion of the gaming promoter commissions that represent amounts passed throughto VIP customers is recorded as a reduction of casino revenue, and the estimated portion retained by the gamingpromoter for its compensation is recorded as casino expense.
Reimbursed expenses. The Company recognizes costs reimbursed pursuant to management services asrevenue in the period it incurs the costs. Reimbursed costs related primarily to the Company’s management ofCityCenter.
Loyalty programs. The Company’s primary loyalty program is “M life” and is available to patrons atsubstantially all of the Company’s wholly owned and operated resorts and CityCenter. Members may earn pointsand/or Express Comps for their gaming play which can be redeemed at restaurants, box offices or the M life frontdesk at participating properties. Points may also be redeemed for free slot play on participating machines. TheCompany records a liability based on the points earned multiplied by the redemption value, less an estimate forpoints not expected to be redeemed, and records a corresponding reduction in casino revenue. Customers alsoearn Express Comps based on their gaming play which can be redeemed for complimentary goods and services,including hotel rooms, food and beverage, and entertainment. The Company records a liability for the estimatedcosts of providing goods and services for Express Comps based on the Express Comps earned multiplied by acost margin, less an estimate for Express Comps not expected to be redeemed and records a correspondingexpense in the casino department. MGM Macau also has a loyalty program, whereby patrons earn rewards thatcan be redeemed for complimentary services, including hotel rooms, food and beverage, and entertainment.
Advertising. The Company expenses advertising costs the first time the advertising takes place. Advertisingexpense, which is generally included in general and administrative expenses, was $156 million for 2015 and2014 and $153 million for 2013.
Corporate expense. Corporate expense represents unallocated payroll, aircraft costs, professional fees andvarious other expenses not directly related to the Company’s casino resort operations. In addition, corporateexpense includes the costs associated with the Company’s evaluation and pursuit of new business opportunities,which are expensed as incurred.
42

Preopening and start-up expenses. Preopening and start-up costs, including organizational costs, areexpensed as incurred. Costs classified as preopening and start-up expenses include payroll, outside services,advertising, and other expenses related to new or start-up operations.
Property transactions, net. The Company classifies transactions such as write-downs and impairments,demolition costs, and normal gains and losses on the sale of assets as “Property transactions, net.” See Note 15for a detailed discussion of these amounts.
Redeemable noncontrolling interest. In April 2015, MGM National Harbor issued non-voting economicinterests in MGM National Harbor (“Interests”) to Radio One, Inc. (“Radio One”), a noncontrolling interestparty, for a purchase price of $5 million. In addition, Radio One was given the right to make one additionalcapital contribution of up to $35 million prior to July 1, 2016 for the purchase of additional Interests. InDecember 2015, MGM National Harbor issued Interests to 42 Gaming N.H., LLC (“42 Gaming”), anoncontrolling interest party, for a purchase price of $1.25 million. In addition, 42 Gaming was given the right tomake one additional capital contribution of up to $8.75 million prior to July 1, 2016 for the purchase ofadditional Interests.
The Interests provide for annual preferred distributions by MGM National Harbor to Radio One and 42Gaming based on a percentage of its annual net gaming revenue (as defined in the MGM National Harboroperating agreement). Such distributions will begin within ninety days after the end of the fiscal year in whichthe opening date of MGM National Harbor occurs, and after the end of each subsequent fiscal year. Also,beginning on the third anniversary of the last day of the calendar quarter in which the opening date of MGMNational Harbor occurs (and on each subsequent anniversary thereof) Radio One and 42 Gaming will each havethe ability to require MGM National Harbor to purchase all or a portion of their Interests for a purchase pricebased on a contractually agreed upon formula. Radio One and 42 Gaming also each have the right to sell back allor a portion of their Interests prior to such date if MGM National Harbor were to guarantee or grant liens tosecure any indebtedness of the Company or its affiliates other than the indebtedness of MGM National Harbor.
The Company has recorded the Interests as “Redeemable noncontrolling interests” in the mezzanine sectionof the accompanying consolidated balance sheets and not stockholders’ equity because their redemption is notexclusively in the Company’s control. Interests are initially accounted for at fair value. Subsequently, theCompany will recognize changes in the redemption value as they occur and adjust the carrying amount of theredeemable noncontrolling interests to equal the maximum redemption value, provided such amount does not fallbelow the initial carrying value, at the end of each reporting period. The Company will reflect any changescaused by such an adjustment in retained earnings or accumulated deficit.
43

Income (loss) per share of common stock. The table below reconciles basic and diluted income (loss) pershare of common stock. Diluted net loss attributable to MGM Resorts International includes adjustments for thepotentially dilutive effect on the Company’s equity interest in MGM China due to shares outstanding under theMGM China Share Option Plan. Diluted weighted-average common and common equivalent shares includesadjustments for potential dilution of share-based awards outstanding under the Company’s stock compensationplans and the assumed conversion of convertible debt, unless the effect of inclusion of such shares would beantidilutive.
Year Ended December 31,
2015 2014 2013(In thousands)
Numerator:Net loss attributable to MGM Resorts International - basic . . . . $ (447,720) $ (149,873) $ (171,734)Potentially dilutive effect due to MGM China Share Option
Plan . . . . . . . . . . . . . . . . . . . . . . . . . . . . . . . . . . . . . . . . . . . . . . . . . . . . . . . . . . . . . . - (340) (104)
Net loss attributable to MGM ResortsInternational - diluted . . . . . . . . . . . . . . . . . . . . . . . . . . . . . . . . . . . . . . . . . . . $ (447,720) $ (150,213) $ (171,838)
Denominator:Weighted-average common shares outstanding - basic and
diluted . . . . . . . . . . . . . . . . . . . . . . . . . . . . . . . . . . . . . . . . . . . . . . . . . . . . . . . . . . . . 542,873 490,875 489,661
Antidilutive share-based awards excluded from thecalculation of diluted earnings per share . . . . . . . . . . . . . . . . . . . . . . 18,276 19,254 18,468
The weighted-average common shares outstanding for the year ended December 31, 2015 included theweighted average impact of the $300 million 4.25% convertible senior notes issued in June 2011 and the $1.15billion 4.25% convertible senior notes issued in April 2010 from the date of their conversion on April 15, 2015.The weighted-average impact of the assumed conversion of the convertible senior notes was excluded from thecalculation of diluted earnings per share for the years ended December 31, 2015, 2014 and 2013 as their effectwould be antidilutive.
Currency translation. The Company translates the financial statements of foreign subsidiaries that are notdenominated in U.S. dollars. Balance sheet accounts are translated at the exchange rate in effect at each balancesheet date. Income statement accounts are translated at the average rate of exchange prevailing during the period.Translation adjustments resulting from this process are recorded to other comprehensive income (loss).
Comprehensive income (loss). Comprehensive income (loss) includes net income (loss) and all other non-stockholder changes in equity, or other comprehensive income (loss). Elements of the Company’s accumulatedother comprehensive income are reported in the accompanying consolidated statements of stockholders’ equity,and the cumulative balance of these elements consisted of the following:
December 31,
2015 2014(In thousands)
Currency translation adjustments . . . . . . . . . . . . . . . . . . . . . . . . . . . . . . . . . . . . . . . . . . . . . . . . . . . . . . . . . . . . . $ 27,167 $ 23,440Other comprehensive income from unconsolidated affiliates . . . . . . . . . . . . . . . . . . . . . . . . . . . . . . - 672
Accumulated other comprehensive income . . . . . . . . . . . . . . . . . . . . . . . . . . . . . . . . . . . . . . . . . . . . . . . 27,167 24,112Less: Currency translation adjustment attributable to noncontrolling interests . . . . . . . . . . . (13,145) (11,121)
Accumulated other comprehensive income attributable to MGM ResortsInternational . . . . . . . . . . . . . . . . . . . . . . . . . . . . . . . . . . . . . . . . . . . . . . . . . . . . . . . . . . . . . . . . . . . . . . . . . . . . . . . $ 14,022 $ 12,991
44

Recently issued accounting standards. On February 25, 2016, the Financial Accounting Standards Board(“FASB”) issued Accounting Standards Update No. 2016-02, “Leases (Topic 842),” (“ASU 2016-02”), whichreplaces the existing guidance in Accounting Standard Codification 840, Leases. ASU 2016-02 is effective forfiscal years, and interim periods within those years, beginning after December 15, 2018. ASU 2016-02 requires adual approach for lessee accounting under which a lessee would account for leases as finance leases or operatingleases. Both finance leases and operating leases will result in the lessee recognizing a right-of-use (“ROU”) assetand a corresponding lease liability. For finance leases the lessee would recognize interest expense andamortization of the ROU asset and for operating leases the lessee would recognize a straight-line total leaseexpense. The Company is currently assessing the impact that adoption of this guidance will have on itsconsolidated financial statements and footnote disclosures.
In August 2015, the FASB issued Accounting Standards Update No. 2015-14, “Revenue From ContractsWith Customers (Topic 606): Deferral of the Effective Date,” which defers the effective date of AccountingStandards Update No. 2014-09, “Revenue From Contracts With Customers,” (“ASU 2014-09”) to the fiscal year,and interim periods within the year, beginning on or after December 15, 2017. FASB ASU 2014-09 outlines anew, single comprehensive model for entities to use in accounting for revenue arising from contracts withcustomers and supersedes most current revenue recognition guidance, including industry-specific guidance. Thisnew revenue recognition model provides a five-step analysis in determining when and how revenue isrecognized. Additionally, the new model will require revenue recognition to depict the transfer of promisedgoods or services to customers in an amount that reflects the consideration a company expects to receive inexchange for those goods or services. The Company is currently assessing the impact that adoption of thisguidance will have on its consolidated financial statements and footnote disclosures.
In July 2015, the FASB issued Accounting Standards Update No. 2015-11, “Simplifying the Measurementof Inventory,” (“ASU 2015-11”), effective for fiscal years beginning after December 15, 2016, including interimperiods within those fiscal years. ASU 2015-11 requires inventory that is measured using first-in, first-out (FIFO)or average cost method to be measured “at the lower of cost and net realizable value,” thereby simplifying thecurrent guidance under which an entity must measure inventory at the lower of cost or market (market in thiscontext is defined as one of three different measures). ASU No. 2015-11 will not apply to inventories that aremeasured by using either the LIFO method or the retail inventory method. The Company is currently assessingthe impact that adoption of ASU 2015-11 will have on its consolidated financial statements and footnotedisclosures.
In February 2015, the FASB issued Accounting Standards Update No. 2015-02, “Amendments to theConsolidation Analysis,” (“ASU 2015-02”), which is effective for fiscal years, and interim periods within thoseyears, beginning after December 15, 2015. ASU 2015-02 amends: the assessment of whether a limitedpartnership is a variable interest entity; the effect that fees paid to a decision maker have on the consolidationanalysis; how variable interests held by a reporting entity’s related parties or de facto agents affect itsconsolidation conclusion; and for entities other than limited partnerships, clarifies how to determine whether theequity holders as a group have power over an entity. The adoption of ASU 2015-02 will not have a materialimpact on the Company’s consolidated financial statements and footnote disclosures.
During 2015, the Company early adopted Accounting Standard Update No. 2015-03, “Simplifying thePresentation of Debt Issuance Costs,” (“ASU 2015-03”), which requires debt issuance costs to be presented inthe balance sheet as a direct deduction from the carrying value of the associated debt liability, consistent with thepresentation of a debt discount. The amortization of such costs will continue to be reported as interest expense. Inaddition, in accordance with ASU No. 2015-15, “Presentation and Subsequent Measurement of Debt IssuanceCosts Associated with Line-of-Credit Arrangements: Amendments to SEC Paragraph Pursuant to StaffAnnouncement at June 18, 2015 EITF Meeting,” (“ASU 2015-15”), which was adopted concurrent with ASU2015-03, the Company will continue to present the debt issuance costs associated with the Company’s revolvingcredit facilities as other assets included within the Company’s consolidated balance sheets and continueamortizing those deferred costs over the term of the related facilities. ASU 2015-03 requires the new guidance to
45

be applied on a retrospective basis. Accordingly, as of December 31, 2015 and 2014, the Companyreclassified $118 million and $109 million, respectively, of debt issuance costs in the accompanying consolidatedbalance sheets.
During the fourth quarter of 2015, the Company early adopted on a prospective basis FASB AccountingStandards Update No. 2015-17, “Balance Sheet Classification of Deferred Taxes,” (“ASU 2015-17”). ASU 2015-17 requires that deferred tax liabilities and assets, along with any related valuation allowance, be classified asnoncurrent in a classified statement of financial position. The amendments in ASU 2015-17 may be applied oneither a prospective or retrospective basis. The Company had a current deferred tax liability of $62 million forthe year ended December 31, 2014. The Company adopted ASU 2015-17 on a prospective basis, and accordinglythe prior periods have not been retrospectively adjusted in the accompanying financial statements.
NOTE 3 — ACCOUNTS RECEIVABLE, NET
Accounts receivable, net consisted of the following:
December 31,
2015 2014(In thousands)
Casino . . . . . . . . . . . . . . . . . . . . . . . . . . . . . . . . . . . . . . . . . . . . . . . . . . . . . . . . . . . . . . . . . . . . . . . . . . . . . . . . . $ 285,182 $ 307,152Hotel . . . . . . . . . . . . . . . . . . . . . . . . . . . . . . . . . . . . . . . . . . . . . . . . . . . . . . . . . . . . . . . . . . . . . . . . . . . . . . . . . . 157,489 149,268Other . . . . . . . . . . . . . . . . . . . . . . . . . . . . . . . . . . . . . . . . . . . . . . . . . . . . . . . . . . . . . . . . . . . . . . . . . . . . . . . . . . 127,677 106,527
570,348 562,947Less: Allowance for doubtful accounts . . . . . . . . . . . . . . . . . . . . . . . . . . . . . . . . . . . . . . . . . . . . (89,789) (89,602)
$ 480,559 $ 473,345
NOTE 4 — DISPOSITIONS AND ASSETS HELD FOR SALE
On April 1, 2015, the Company closed the sale of Railroad Pass. At closing, the Company received $8million in cash proceeds. The assets and liabilities of Railroad Pass were classified as held for sale as ofDecember 31, 2014. At December 31, 2014, assets held for sale of $9 million, comprised predominantly ofproperty, plant and equipment, were classified within “Prepaid expenses and other” and liabilities related toassets held for sale of $2 million, comprised of accounts payable and other accrued liabilities, were classifiedwithin “Other accrued liabilities.”
On April 30, 2015, the Company closed the sale of Gold Strike and related assets in Jean, Nevada. Atclosing, the Company received $12 million in cash proceeds. The assets and liabilities of Gold Strike wereclassified as held for sale as of December 31, 2014. At December 31, 2014, assets held for sale of $14 millioncomprised predominantly of property, plant and equipment, were classified within “Prepaid expenses andother” and liabilities related to assets held for sale of $2 million, comprised of accounts payable and otheraccrued liabilities, were classified within “Other accrued liabilities.”
On July 7, 2015, the Company entered into an agreement with Eldorado Resorts, Inc. to sell Circus CircusReno, as well as the Company’s 50% interest in Silver Legacy and associated real property. On November 23,2015, the Company closed the sale and received $80 million in cash proceeds and recorded a gain of $23 millionrelated to the sale, classified within “Property transactions, net.” See Note 6 for further discussion of the sale ofthe Company’s 50% investment in Silver Legacy.
Railroad Pass, Gold Strike and Circus Circus Reno were not classified as discontinued operations becausethe Company concluded that the sales did not have a major effect on the Company’s operations or its financialresults and they do not represent a disposal of a major geographic segment or product line.
46

NOTE 5 — PROPERTY AND EQUIPMENT, NET
Property and equipment, net consisted of the following:
December 31,
2015 2014(In thousands)
Land . . . . . . . . . . . . . . . . . . . . . . . . . . . . . . . . . . . . . . . . . . . . . . . . . . . . . . . . . . . . . . . . . . . . . . . . . . . . . . . . . . . $ 6,495,391 $ 6,475,134Buildings, building improvements and land improvements . . . . . . . . . . . . . . . . . . . . . . 9,429,945 9,313,308Furniture, fixtures and equipment . . . . . . . . . . . . . . . . . . . . . . . . . . . . . . . . . . . . . . . . . . . . . . . . . . 4,274,537 4,178,723Construction in progress . . . . . . . . . . . . . . . . . . . . . . . . . . . . . . . . . . . . . . . . . . . . . . . . . . . . . . . . . . . . . 2,111,860 999,616
22,311,733 20,966,781Less: Accumulated depreciation and amortization . . . . . . . . . . . . . . . . . . . . . . . . . . . . . . . . (6,939,938) (6,525,239)
$ 15,371,795 $ 14,441,542
NOTE 6 — INVESTMENTS IN AND ADVANCES TO UNCONSOLIDATED AFFILIATES
Investments in and advances to unconsolidated affiliates consisted of the following:
December 31,
2015 2014(In thousands)
CityCenter Holdings, LLC – CityCenter (50%) . . . . . . . . . . . . . . . . . . . . . . . . . . . . . . . . . . . $ 1,136,452 $ 1,221,306Elgin Riverboat Resort–Riverboat Casino – Grand Victoria (50%) . . . . . . . . . . . . . 122,500 141,162Marina District Development Company – Borgata (50%) . . . . . . . . . . . . . . . . . . . . . . . 134,454 109,252Other . . . . . . . . . . . . . . . . . . . . . . . . . . . . . . . . . . . . . . . . . . . . . . . . . . . . . . . . . . . . . . . . . . . . . . . . . . . . . . . . . . 98,091 87,314
$ 1,491,497 $ 1,559,034
The Company recorded its share of the net income (loss) from unconsolidated affiliates, includingadjustments for basis differences, as follows:
Year Ended December 31,
2015 2014 2013(In thousands)
Income from unconsolidated affiliates . . . . . . . . . . . . . . . . . . . . . . . . $ 257,883 $ 63,836 $ 68,829Preopening and start-up expenses . . . . . . . . . . . . . . . . . . . . . . . . . . . . . . (3,475) (917) (507)Non-operating items from unconsolidated affiliates . . . . . . . . . (76,462) (87,794) (208,682)
$ 177,946 $ (24,875) $ (140,360)
CityCenter
CityCenter litigation settlement. In December 2014, the Company and CityCenter entered into asettlement agreement with Perini Building Company, Inc. (“Perini”), general contractor for CityCenter, theremaining Perini subcontractors and relevant insurers to resolve all outstanding project lien claims andCityCenter’s counterclaims relating to the Harmon Hotel and Spa. The settlement was subject to execution of aglobal settlement agreement among the parties described above, which was subsequently executed, andCityCenter’s procurement of replacement general liability insurance covering construction of the CityCenterdevelopment, which was obtained in January 2015. The proceeds pursuant to such global settlement agreement,combined with certain prior Harmon-related insurance settlement proceeds, resulted in a gain of $160 millionrecorded by CityCenter during the first quarter of 2015, of which the Company recorded its 50% share of $80million.
47

CityCenter distribution. In April 2015, CityCenter adopted an annual distribution policy and declared aspecial distribution of $400 million, of which the Company received its 50% share of $200 million. Under theannual distribution policy, CityCenter will distribute up to 35% of excess cash flow, subject to the approval ofthe CityCenter board of directors.
October 2013 debt restructuring transactions. In October 2013, CityCenter entered into a $1.775 billionsenior secured credit facility. The senior secured credit facility consists of a $75 million revolving facilitymaturing in October 2018, and a $1.7 billion term loan B facility maturing in October 2020. The term loan Bfacility was issued at 99% of the principal amount and bears interest at LIBOR plus 3.25% with a LIBOR floor of1.00%. Concurrent with the closing of the new senior secured credit facility, CityCenter issued a notice of fullredemption with respect to its existing 7.625% senior secured first lien notes and 10.75%/11.50% senior securedsecond lien PIK toggle notes and discharged each of the indentures for its first and second lien notes at apremium in accordance with the terms of such indentures. As a result of the transaction, the Company recorded acharge of $70 million for its share of CityCenter’s non-operating loss on retirement of long-term debt, primarilyconsisting of premiums associated with the redemption of the existing first and second lien notes as well as thewrite-off of previously unamortized debt issuance costs. CityCenter permanently repaid $38 million and $154million of its term loan B facility in 2015 and 2014, respectively.
In addition, in connection with the October 2013 debt restructuring, sponsor notes with a carrying value ofapproximately $738 million were converted to members’ equity. Subsequent to these transactions, CityCenter’ssenior credit facility is its only remaining long-term debt. The senior secured credit facility is secured bysubstantially all the assets of CityCenter, and contains certain financial covenants including minimum interestcoverage ratios and maximum leverage ratio requirements (as defined in the CityCenter agreements).
Grand Victoria
At December 31, 2015, the Company reviewed the carrying value of its Grand Victoria investment forimpairment due to a greater than anticipated decline in operating results due in part to a continued loss of marketshare to video gaming terminals, as well as a decrease in forecasted cash flows compared to the prior forecast.The Company used a blended discounted cash flow analysis and guideline public company method to determinethe estimated fair value from a market participant’s viewpoint. Key assumptions included in the discounted cashflow analysis were estimates of future cash flows including outflows for capital expenditures, a long-term growthrate of 2% and a discount rate of 10.5%. Key assumptions in the guideline public company method includedbusiness enterprise value multiples selected based on the range of multiples in Grand Victoria’s peer group. As aresult of the analysis, the Company determined that it was necessary to record an other-than-temporaryimpairment charge of $17 million at December 31, 2015, based on an estimated fair value of $123 million for theCompany’s 50% interest. The Company intends to, and believes it will be able to, retain the investment in GrandVictoria; however, due to the extent of the shortfall and the Company’s assessment of the uncertainty of fullyrecovering its investment, the Company has determined that the impairment was other-than-temporary.
At June 30, 2014, the Company reviewed the carrying value of its Grand Victoria investment forimpairment due to a greater than anticipated decline in operating results and loss of market share due to theproliferation of video gaming terminals in the Illinois market, as well as a decrease in forecasted cash flowscompared to the prior forecast. The Company used a blended discounted cash flow analysis and guideline publiccompany method to determine the estimated fair value from a market participant’s viewpoint. Key assumptionsincluded in the discounted cash flow analysis were estimates of future cash flows including outflows for capitalexpenditures, a long-term growth rate of 2% and a discount rate of 10.5%. Key assumptions in the guidelinepublic company method included business enterprise value multiples selected based on the range of multiples inGrand Victoria’s peer group. As a result of the analysis, the Company determined that it was necessary to recordan other-than-temporary impairment charge of $29 million at June 30, 2014, based on an estimated fair value of$140 million for the Company’s 50% interest.
At June 30, 2013, the Company reviewed the carrying value of its Grand Victoria investment forimpairment due to a greater than anticipated decline in operating results and loss of market share as a result of the
48
opening of a new river boat casino in the Illinois market, as well as a decrease in forecasted cash flows comparedto the prior forecast. The Company used a blended discounted cash flow analysis and guideline public companymethod to determine the estimated fair value from a market participant’s viewpoint. Key assumptions included inthe discounted cash flow analysis were estimates of future cash flows including outflows for capital expenditures,a long-term growth rate of 2% and a discount rate of 11%. Key assumptions in the guideline public companymethod included business enterprise value multiples selected based on the range of multiples in Grand Victoria’speer group. As a result of the analysis, the Company determined that it was necessary to record another-than-temporary impairment charge of $37 million based on an estimated fair value of $170 million for theCompany’s 50% interest.
Las Vegas Arena Company
In September 2014, a wholly owned subsidiary of Las Vegas Arena Company entered into a senior securedcredit facility to finance construction of the T-Mobile Arena. In connection with this senior credit facility, MGMResorts International and AEG each entered into a repayment guarantee for the term loan B (which is subject toincreases and decreases in the event of rebalancing of the principal amount of indebtedness between the termloan A and term loan B facilities). As of December 31, 2015, the senior secured credit facility consisted of a $120million term loan A and an $80 million term loan B. The senior secured credit facility matures in October 2016,with an option to extend the maturity for three years. The senior secured credit facility is secured by substantiallyall the assets of the Las Vegas Arena Company, and contains certain financial covenants applicable upon openingof the T-Mobile Arena. In accordance with the Las Vegas Arena Company’s senior secured credit facility, theCompany and AEG contributed equal amounts totaling $175 million for construction, all of which has beencontributed as of December 31, 2015. See Note 11 for discussion of the Company’s joint and several completionand repayment guarantees and equity contribution commitments related to the Las Vegas Arena Company.
Silver Legacy
As discussed in Note 4, the Company closed the sale of its 50% interest in Silver Legacy on November 23,2015, received proceeds of $58 million, and recorded a gain of $20 million. The Company’s investment in SilverLegacy was not classified as discontinued operations because the Company has concluded that the sale will nothave a major effect on the Company’s operations or its financial results and it does not represent a disposal of amajor geographic segment or product line.
Unconsolidated Affiliate Financial Information
Summarized balance sheet information of the unconsolidated affiliates is as follows:
December 31,
2015 2014(In thousands)
Current assets . . . . . . . . . . . . . . . . . . . . . . . . . . . . . . . . . . . . . . . . . . . . . . . . . . . . . . . . . . . . . . . . . . . . . . . . . $ 592,883 $ 772,412Property and other assets, net . . . . . . . . . . . . . . . . . . . . . . . . . . . . . . . . . . . . . . . . . . . . . . . . . . . . . . . 9,128,866 9,381,601Current liabilities . . . . . . . . . . . . . . . . . . . . . . . . . . . . . . . . . . . . . . . . . . . . . . . . . . . . . . . . . . . . . . . . . . . . . 482,633 683,452Long-term debt and other long-term obligations . . . . . . . . . . . . . . . . . . . . . . . . . . . . . . . . . . 2,268,157 2,396,376Equity . . . . . . . . . . . . . . . . . . . . . . . . . . . . . . . . . . . . . . . . . . . . . . . . . . . . . . . . . . . . . . . . . . . . . . . . . . . . . . . . . 6,970,959 7,074,185
49
Summarized results of operations of the unconsolidated affiliates are as follows:
Year Ended December 31,
2015 2014 2013(In thousands)
Net revenues . . . . . . . . . . . . . . . . . . . . . . . . . . . . . . . . . . . . . . . . . . . . . . . . . . . . . $ 2,362,258 $ 2,299,698 $ 2,280,309Operating expenses . . . . . . . . . . . . . . . . . . . . . . . . . . . . . . . . . . . . . . . . . . . . . . (1,941,812) (2,278,039) (2,247,743)
Operating income . . . . . . . . . . . . . . . . . . . . . . . . . . . . . . . . . . . . . . . . . . . . . 420,446 21,659 32,566Interest expense . . . . . . . . . . . . . . . . . . . . . . . . . . . . . . . . . . . . . . . . . . . . . . . . . . (142,396) (164,055) (328,740)Non-operating expenses . . . . . . . . . . . . . . . . . . . . . . . . . . . . . . . . . . . . . . . . (15,101) (13,337) (146,898)
Net income (loss) . . . . . . . . . . . . . . . . . . . . . . . . . . . . . . . . . . . . . . . . . . . . . $ 262,949 $ (155,733) $ (443,072)
Results of operations of the unconsolidated affiliates includes the results of Silver Legacy through the dateof disposition on November 23, 2015.
Basis Differences
The Company’s investments in unconsolidated affiliates do not equal the Company’s share of venture-levelequity due to various basis differences. Basis differences related to depreciable assets are being amortized basedon the useful lives of the related assets and liabilities and basis differences related to non–depreciable assets, suchas land and indefinite-lived intangible assets, are not being amortized. Differences between the Company’s shareof venture-level equity and investment balances are as follows:
December 31,
2015 2014(In thousands)
Venture-level equity attributable to the Company . . . . . . . . . . . . . . . . . . . . . . . . . . . . . . . . $ 3,486,117 $ 3,532,746Adjustment to CityCenter equity upon contribution of net assets by MGM
Resorts International (1) . . . . . . . . . . . . . . . . . . . . . . . . . . . . . . . . . . . . . . . . . . . . . . . . . . . . . . . . . . (573,163) (578,554)CityCenter capitalized interest (2) . . . . . . . . . . . . . . . . . . . . . . . . . . . . . . . . . . . . . . . . . . . . . . . . . . 241,374 251,450CityCenter completion guarantee (3) . . . . . . . . . . . . . . . . . . . . . . . . . . . . . . . . . . . . . . . . . . . . . . . 372,785 466,660CityCenter deferred gain (4) . . . . . . . . . . . . . . . . . . . . . . . . . . . . . . . . . . . . . . . . . . . . . . . . . . . . . . . . (236,327) (238,749)CityCenter capitalized interest on sponsor notes (5) . . . . . . . . . . . . . . . . . . . . . . . . . . . . . . (47,158) (49,892)Other-than-temporary impairments of CityCenter investment (6) . . . . . . . . . . . . . . . (1,800,191) (1,857,673)Other-than-temporary impairments of Borgata investment (7) . . . . . . . . . . . . . . . . . . (126,446) (130,333)Acquisition fair value adjustments net of other-than-temporary impairments
of Grand Victoria investment (8) . . . . . . . . . . . . . . . . . . . . . . . . . . . . . . . . . . . . . . . . . . . . . . . . 99,619 116,669Other adjustments . . . . . . . . . . . . . . . . . . . . . . . . . . . . . . . . . . . . . . . . . . . . . . . . . . . . . . . . . . . . . . . . . . . . 74,887 46,710
$ 1,491,497 $ 1,559,034
(1) Primarily relates to land and fixed assets.(2) Relates to interest capitalized on the Company’s investment balance during development and construction stages.(3) Created by contributions to CityCenter under the completion guarantee recognized as equity contributions by CityCenter split
between the members.(4) Relates to a deferred gain on assets contributed to CityCenter upon formation of CityCenter.(5) Relates to interest on the sponsor notes capitalized by CityCenter during development. Such sponsor notes were converted to
equity in 2013.(6) The impairment of the Company’s CityCenter investment includes $426 million of impairments allocated to land.(7) The impairment of the Company’s Borgata investment includes $90 million of impairments allocated to land.(8) Relates to indefinite-lived gaming license rights for Grand Victoria and other-than-temporary impairments of the Company’s
investment in Grand Victoria.
50
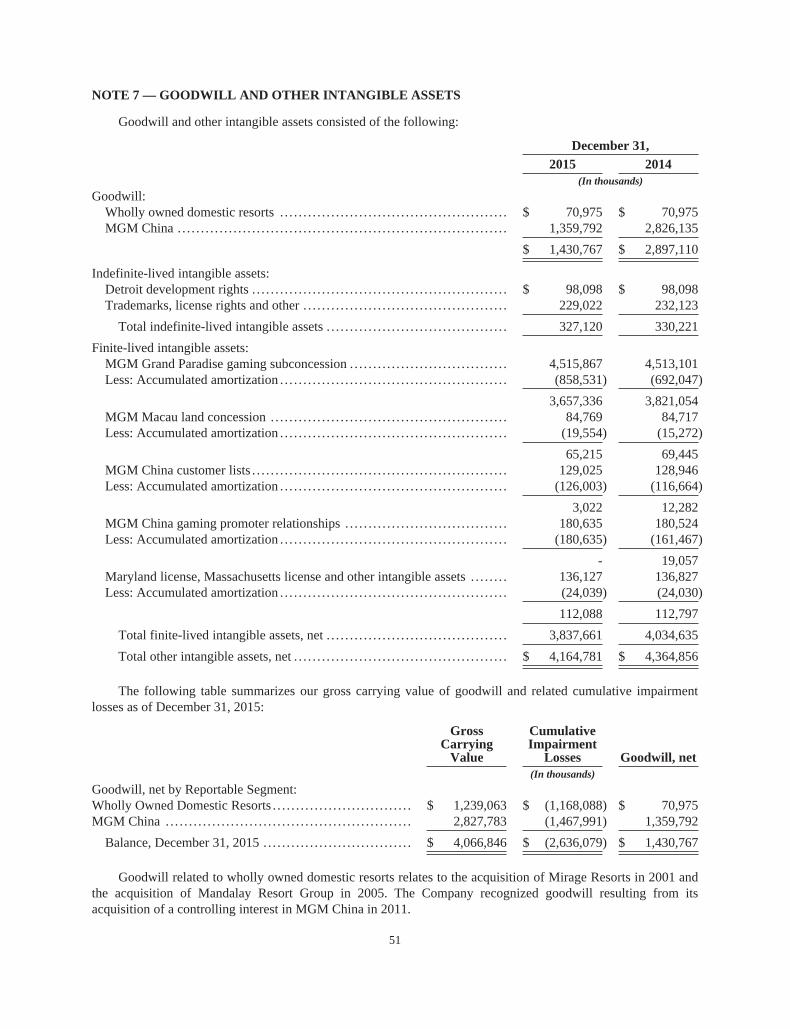
NOTE 7 — GOODWILL AND OTHER INTANGIBLE ASSETS
Goodwill and other intangible assets consisted of the following:
December 31,
2015 2014(In thousands)
Goodwill:Wholly owned domestic resorts . . . . . . . . . . . . . . . . . . . . . . . . . . . . . . . . . . . . . . . . . . . . . . . . . $ 70,975 $ 70,975MGM China . . . . . . . . . . . . . . . . . . . . . . . . . . . . . . . . . . . . . . . . . . . . . . . . . . . . . . . . . . . . . . . . . . . . . . . 1,359,792 2,826,135
$ 1,430,767 $ 2,897,110
Indefinite-lived intangible assets:Detroit development rights . . . . . . . . . . . . . . . . . . . . . . . . . . . . . . . . . . . . . . . . . . . . . . . . . . . . . . . $ 98,098 $ 98,098Trademarks, license rights and other . . . . . . . . . . . . . . . . . . . . . . . . . . . . . . . . . . . . . . . . . . . . 229,022 232,123
Total indefinite-lived intangible assets . . . . . . . . . . . . . . . . . . . . . . . . . . . . . . . . . . . . . . . 327,120 330,221
Finite-lived intangible assets:MGM Grand Paradise gaming subconcession . . . . . . . . . . . . . . . . . . . . . . . . . . . . . . . . . . 4,515,867 4,513,101Less: Accumulated amortization . . . . . . . . . . . . . . . . . . . . . . . . . . . . . . . . . . . . . . . . . . . . . . . . . (858,531) (692,047)
3,657,336 3,821,054MGM Macau land concession . . . . . . . . . . . . . . . . . . . . . . . . . . . . . . . . . . . . . . . . . . . . . . . . . . . 84,769 84,717Less: Accumulated amortization . . . . . . . . . . . . . . . . . . . . . . . . . . . . . . . . . . . . . . . . . . . . . . . . . (19,554) (15,272)
65,215 69,445MGM China customer lists . . . . . . . . . . . . . . . . . . . . . . . . . . . . . . . . . . . . . . . . . . . . . . . . . . . . . . . 129,025 128,946Less: Accumulated amortization . . . . . . . . . . . . . . . . . . . . . . . . . . . . . . . . . . . . . . . . . . . . . . . . . (126,003) (116,664)
3,022 12,282MGM China gaming promoter relationships . . . . . . . . . . . . . . . . . . . . . . . . . . . . . . . . . . . 180,635 180,524Less: Accumulated amortization . . . . . . . . . . . . . . . . . . . . . . . . . . . . . . . . . . . . . . . . . . . . . . . . . (180,635) (161,467)
- 19,057Maryland license, Massachusetts license and other intangible assets . . . . . . . . 136,127 136,827Less: Accumulated amortization . . . . . . . . . . . . . . . . . . . . . . . . . . . . . . . . . . . . . . . . . . . . . . . . . (24,039) (24,030)
112,088 112,797
Total finite-lived intangible assets, net . . . . . . . . . . . . . . . . . . . . . . . . . . . . . . . . . . . . . . . 3,837,661 4,034,635
Total other intangible assets, net . . . . . . . . . . . . . . . . . . . . . . . . . . . . . . . . . . . . . . . . . . . . . . $ 4,164,781 $ 4,364,856
The following table summarizes our gross carrying value of goodwill and related cumulative impairmentlosses as of December 31, 2015:
GrossCarrying
Value
CumulativeImpairment
Losses Goodwill, net(In thousands)
Goodwill, net by Reportable Segment:Wholly Owned Domestic Resorts . . . . . . . . . . . . . . . . . . . . . . . . . . . . . . $ 1,239,063 $ (1,168,088) $ 70,975MGM China . . . . . . . . . . . . . . . . . . . . . . . . . . . . . . . . . . . . . . . . . . . . . . . . . . . . . 2,827,783 (1,467,991) 1,359,792
Balance, December 31, 2015 . . . . . . . . . . . . . . . . . . . . . . . . . . . . . . . . $ 4,066,846 $ (2,636,079) $ 1,430,767
Goodwill related to wholly owned domestic resorts relates to the acquisition of Mirage Resorts in 2001 andthe acquisition of Mandalay Resort Group in 2005. The Company recognized goodwill resulting from itsacquisition of a controlling interest in MGM China in 2011.
51

Due to a significant decrease in MGM China’s cash flows as well as a decline in the market capitalization ofMGM China relative to its net book value, the Company performed an interim impairment test of goodwillrelated to the MGM China reporting unit in the second quarter of 2015. The results of the Company’s interimimpairment test indicated the fair value of the MGM China reporting unit exceeded its carrying value by 9%.
During the fourth quarter of 2015, the Company conducted its annual impairment tests of goodwill byreviewing each of its reporting units, including its MGM China reporting unit. The step one goodwill analysis ofthe MGM China reporting unit indicated the fair value was less than its carrying value by 4%. The decrease infair value from the interim test valuation date resulted from a further decrease in forecasted cash flows from theinterim analysis based on current market conditions and a further and sustained decline in the enterprise valuemultiples of the MGM China reporting unit as well as the multiples of the reporting unit’s peer group.
As a result of the indication of impairment from its step one analysis, the Company performed a step twoimpairment analysis to measure the impairment loss. As such, the Company determined the current fair values ofall assets of the MGM China reporting unit, including its separately identifiable intangible assets. The current fairvalues of each of the separately identifiable intangible assets exceeded their respective carrying values by asignificant amount, leading to a lower implied fair value of goodwill. Therefore, the Company recorded a $1.5billion non-cash impairment charge to reduce the historical carrying value of goodwill related to the MGM Chinareporting unit to its implied fair value. The impairment charge is reflected in “Property transactions, net” in theaccompanying Consolidated Statements of Operations for the year ended December 31, 2015. The carrying valueof goodwill related to the MGM China reporting unit as of December 31, 2015 following the impairment chargewas $1.4 billion.
The Company’s indefinite-lived intangible assets consist primarily of development rights in Detroit,trademarks and license rights, of which $210 million consists of trademarks and trade names related to theMandalay Resort Group acquisition.
MGM Grand Paradise gaming subconcession. Pursuant to the agreement dated June 19, 2004 betweenMGM Grand Paradise and Sociedade de Jogos de Macau, S.A., a gaming subconcession was acquired by MGMGrand Paradise for the right to operate casino games of chance and other casino games for a period of 15 yearscommencing on April 20, 2005. The Company cannot provide any assurance that the gaming subconcession willbe extended beyond the original terms of the agreement; however, management believes that the gamingsubconcession will be extended, given that the land concession agreement with the government extendssignificantly beyond the gaming subconcession. In addition, management believes that the fair value of MGMChina reflected in the IPO pricing suggests that market participants have assumed the gaming subconcession willbe extended beyond its initial term. As such, the Company was amortizing the gaming subconcession intangibleasset on a straight-line basis over the initial term of the land concession through April 6, 2031. In January 2013,the Company’s Cotai land concession was gazetted by the Macau government at which time the Companydetermined that the estimated remaining useful life of its gaming subconcession would be extended through theinitial 25-year term of the Cotai land concession, ending in January 2038.
MGM Macau land concession. MGM Grand Paradise entered into a contract with the Macau governmentto use the land under MGM Macau commencing from April 6, 2006. The land use right has an initial termthrough April 6, 2031, subject to renewal for additional periods. The land concession intangible asset isamortized on a straight-line basis over the remaining initial contractual term.
MGM China customer lists. The Company recognized an intangible asset related to customer lists, whichis amortized on an accelerated basis over its estimated useful life of five years.
MGM China gaming promoter relationships. The Company recognized an intangible asset related to itsrelationships with gaming promoters, which was amortized on a straight-line basis over its estimated useful lifeof four years. The gaming promoter relationship intangible asset became fully amortized in 2015.
52

Maryland license. The Company was granted a license to operate a casino in Maryland. The considerationpaid to the State of Maryland for the license fee of $22 million is considered a finite-lived intangible asset thatwill be amortized over a period of 15 years beginning upon the opening of the casino resort.
Massachusetts license. The Company was granted a license to operate a casino in Massachusetts. Theconsideration paid to the State of Massachusetts for the license fee of $85 million is considered a finite-livedintangible asset that will be amortized over a period of 15 years beginning upon the opening of the casino resort.
Other. The Company’s other finite–lived intangible assets consist primarily of lease acquisition costsamortized over the life of the related leases, and certain license rights amortized over their contractual life.
Total amortization expense related to intangible assets was $199 million, $232 million and $243 million for2015, 2014, and 2013, respectively. Estimated future amortization is as follows:
(In thousands)
Years ending December 31,2016 . . . . . . . . . . . . . . . . . . . . . . . . . . . . . . . . . . . . . . . . . . . . . . . . . . . . . . . . . . . . . . . . . . . . . . . . . . . . . . . . . . . . . . . . . . . . . . . . . . . . . $ 174,4242017 . . . . . . . . . . . . . . . . . . . . . . . . . . . . . . . . . . . . . . . . . . . . . . . . . . . . . . . . . . . . . . . . . . . . . . . . . . . . . . . . . . . . . . . . . . . . . . . . . . . . . 172,4822018 . . . . . . . . . . . . . . . . . . . . . . . . . . . . . . . . . . . . . . . . . . . . . . . . . . . . . . . . . . . . . . . . . . . . . . . . . . . . . . . . . . . . . . . . . . . . . . . . . . . . . 173,4262019 . . . . . . . . . . . . . . . . . . . . . . . . . . . . . . . . . . . . . . . . . . . . . . . . . . . . . . . . . . . . . . . . . . . . . . . . . . . . . . . . . . . . . . . . . . . . . . . . . . . . . 178,1492020 . . . . . . . . . . . . . . . . . . . . . . . . . . . . . . . . . . . . . . . . . . . . . . . . . . . . . . . . . . . . . . . . . . . . . . . . . . . . . . . . . . . . . . . . . . . . . . . . . . . . . 178,149Thereafter . . . . . . . . . . . . . . . . . . . . . . . . . . . . . . . . . . . . . . . . . . . . . . . . . . . . . . . . . . . . . . . . . . . . . . . . . . . . . . . . . . . . . . . . . . . . . . 2,961,031
$ 3,837,661
NOTE 8 — OTHER ACCRUED LIABILITIES
Other accrued liabilities consisted of the following:
December 31,
2015 2014(In thousands)
Payroll and related . . . . . . . . . . . . . . . . . . . . . . . . . . . . . . . . . . . . . . . . . . . . . . . . . . . . . . . . . . . . . . . . . . . $ 370,672 $ 369,497Advance deposits and ticket sales . . . . . . . . . . . . . . . . . . . . . . . . . . . . . . . . . . . . . . . . . . . . . . . . . . 104,461 103,440Casino outstanding chip liability . . . . . . . . . . . . . . . . . . . . . . . . . . . . . . . . . . . . . . . . . . . . . . . . . . . 282,810 294,466Casino front money deposits . . . . . . . . . . . . . . . . . . . . . . . . . . . . . . . . . . . . . . . . . . . . . . . . . . . . . . . . 127,947 122,184MGM China gaming promoter commissions . . . . . . . . . . . . . . . . . . . . . . . . . . . . . . . . . . . . . . 33,064 74,754Other gaming related accruals . . . . . . . . . . . . . . . . . . . . . . . . . . . . . . . . . . . . . . . . . . . . . . . . . . . . . . 91,318 114,165Taxes, other than income taxes . . . . . . . . . . . . . . . . . . . . . . . . . . . . . . . . . . . . . . . . . . . . . . . . . . . . . 153,531 201,562Completion guarantee liability . . . . . . . . . . . . . . . . . . . . . . . . . . . . . . . . . . . . . . . . . . . . . . . . . . . . . . - 148,929Other . . . . . . . . . . . . . . . . . . . . . . . . . . . . . . . . . . . . . . . . . . . . . . . . . . . . . . . . . . . . . . . . . . . . . . . . . . . . . . . . . . 147,641 145,620
$ 1,311,444 $ 1,574,617
53

NOTE 9 — LONG-TERM DEBT
Long-term debt consisted of the following:
December 31,
2015 2014(In thousands)
Senior credit facility term loans . . . . . . . . . . . . . . . . . . . . . . . . . . . . . . . . . . . . . . . . . . . . . . . . . . . . $ 2,716,000 $ 2,744,000MGM China credit facility . . . . . . . . . . . . . . . . . . . . . . . . . . . . . . . . . . . . . . . . . . . . . . . . . . . . . . . . . . 1,559,909 553,177$1,450 million 4.25% convertible senior notes, due 2015 . . . . . . . . . . . . . . . . . . . . . . . . - 1,450,000$875 million 6.625% senior notes, due 2015 . . . . . . . . . . . . . . . . . . . . . . . . . . . . . . . . . . . . . . - 875,000$242.9 million 6.875% senior notes, due 2016 . . . . . . . . . . . . . . . . . . . . . . . . . . . . . . . . . . . . 242,900 242,900$732.7 million 7.5% senior notes, due 2016 . . . . . . . . . . . . . . . . . . . . . . . . . . . . . . . . . . . . . . . 732,749 732,749$500 million 10% senior notes, due 2016. . . . . . . . . . . . . . . . . . . . . . . . . . . . . . . . . . . . . . . . . . 500,000 500,000$743 million 7.625% senior notes, due 2017 . . . . . . . . . . . . . . . . . . . . . . . . . . . . . . . . . . . . . . 743,000 743,000$475 million 11.375% senior notes, due 2018. . . . . . . . . . . . . . . . . . . . . . . . . . . . . . . . . . . . . 475,000 475,000$850 million 8.625% senior notes, due 2019 . . . . . . . . . . . . . . . . . . . . . . . . . . . . . . . . . . . . . . 850,000 850,000$500 million 5.25% senior notes, due 2020 . . . . . . . . . . . . . . . . . . . . . . . . . . . . . . . . . . . . . . . 500,000 500,000$1,000 million 6.75% senior notes, due 2020 . . . . . . . . . . . . . . . . . . . . . . . . . . . . . . . . . . . . . 1,000,000 1,000,000$1,250 million 6.625% senior notes, due 2021 . . . . . . . . . . . . . . . . . . . . . . . . . . . . . . . . . . . . 1,250,000 1,250,000$1,000 million 7.75% senior notes, due 2022 . . . . . . . . . . . . . . . . . . . . . . . . . . . . . . . . . . . . . 1,000,000 1,000,000$1,250 million 6% senior notes, due 2023 . . . . . . . . . . . . . . . . . . . . . . . . . . . . . . . . . . . . . . . . . 1,250,000 1,250,000$0.6 million 7% debentures, due 2036 . . . . . . . . . . . . . . . . . . . . . . . . . . . . . . . . . . . . . . . . . . . . . 552 552$4.3 million 6.7% debentures, due 2096 . . . . . . . . . . . . . . . . . . . . . . . . . . . . . . . . . . . . . . . . . . . 4,265 4,265
12,824,375 14,170,643Less: premiums, discounts, and unamortized debt issuance costs, net . . . . . . . . . . (127,622) (120,038)
12,696,753 14,050,605Less: Current portion, net of discounts and unamortized debt issuance costs . . (328,442) (1,245,320)
$ 12,368,311 $ 12,805,285
As of December 31, 2015, the amount available under the Company’s revolving senior credit facility wasless than current maturities related to the Company’s term loan credit facilities and senior notes. AtDecember 31, 2014, the amount available under the Company’s revolving senior credit facility was less thancurrent maturities related to the Company’s term loan credit facilities, convertible senior notes and senior notes.The Company excluded from the December 31, 2015 and 2014 current portion of long-term debt the amountavailable for refinancing under its revolving credit facility.
Interest expense, net consisted of the following:
Year Ended December 31,
2015 2014 2013(In thousands)
Total interest incurred . . . . . . . . . . . . . . . . . . . . . . . . . . . . . . . . . . . . . . . . . . . . $ 862,377 $ 846,321 $ 862,417Interest capitalized . . . . . . . . . . . . . . . . . . . . . . . . . . . . . . . . . . . . . . . . . . . . . . . . (64,798) (29,260) (5,070)
$ 797,579 $ 817,061 $ 857,347
Senior credit facility. At December 31, 2015, the Company’s senior credit facility consisted of a $1.2billion revolving credit facility, a $1.02 billion term loan A facility and a $1.70 billion term loan B facility. Therevolving and term loan A facilities bear interest at LIBOR plus an applicable rate determined by the Company’scredit rating (2.75% as of December 31, 2015). The term loan B facility bears interest at LIBOR plus 2.50%,with a LIBOR floor of 1.00%. The revolving and term loan A facilities mature in December 2017 and the term
54

loan B facility matures in December 2019. The term loan A and term loan B facilities are subject to scheduledamortization payments on the last day of each calendar quarter in an amount equal to 0.25% of the originalprincipal balance. The Company permanently repaid $28 million in 2015, in accordance with the scheduledamortization. The Company had $1.2 billion of available borrowing capacity under its senior credit facility atDecember 31, 2015. At December 31, 2015, the interest rate on the term loan A was 3.17% and the interest rateon the term loan B was 3.50%.
The land and substantially all of the assets of MGM Grand Las Vegas, Bellagio and The Mirage secure upto $3.35 billion of obligations outstanding under the senior credit facility. In addition, the land and substantiallyall of the assets of New York-New York and Gold Strike Tunica secure the entire amount of the senior creditfacility, and the land and substantially all of the assets of MGM Grand Detroit secure its $450 million ofobligations as a co-borrower under the senior credit facility. In addition, the senior credit facility is secured by apledge of the equity or limited liability company interests of the subsidiaries that own the pledged properties.
The senior credit facility contains customary representations and warranties and customary affirmative andnegative covenants. In addition, the senior credit facility requires the Company and its restricted subsidiaries (the“Restricted Group”) to maintain a minimum trailing four-quarter EBITDA (as defined in the senior creditfacility) and limits the ability of the Restricted Group to make capital expenditures and investments. As ofDecember 31, 2015, the Restricted Group is required to maintain a minimum EBITDA of $1.30 billion. Theminimum EBITDA requirement increases to $1.35 billion for March 31, 2016 through December 31, 2016, andto $1.40 billion for March 31, 2017 and thereafter. EBITDA for the trailing four quarters ended December 31,2015, calculated in accordance with the terms of the senior credit facility (which includes cash distributions fromunconsolidated affiliates, such as the CityCenter distribution), was $1.71 billion. The senior credit facility limitsthe Restricted Group to capital expenditures of $500 million per fiscal year, with unused amounts in any fiscalyear rolling over to the next fiscal year, but not any fiscal year thereafter. The Restricted Group’s total capitalexpenditures allowable under the senior credit facility for fiscal year 2015, after giving effect to unused amountsfrom 2014, was $794 million. In addition, the senior credit facility limits the Restricted Group’s ability to makeinvestments subject to certain thresholds and other important exceptions. As of December 31, 2015, theRestricted Group was within the limit of capital expenditures and other investments for the 2015 calendar year.
The senior credit facility provides for customary events of default, including, without limitation, (i) paymentdefaults, (ii) covenant defaults, (iii) cross-defaults to certain other indebtedness in excess of specified amounts,(iv) certain events of bankruptcy and insolvency, (v) judgment defaults in excess of specified amounts, (vi) thefailure of any loan document by a significant party to be in full force and effect and such circumstance, in thereasonable judgment of the required lenders, is materially adverse to the lenders, or (vii) the security documentscease to create a valid and perfected first priority lien on any material portion of the collateral. In addition, thesenior credit facility provides that a cessation of business due to revocation, suspension or loss of any gaminglicense affecting a specified amount of its revenues or assets, will constitute an event of default.
MGM China credit facility. In June 2015, MGM China and MGM Grand Paradise, as co-borrowers,entered into a second amended and restated credit facility which consists of $1.55 billion of term loans and a$1.45 billion revolving credit facility. The term was extended for an eighteen month period to April 2019, withscheduled amortization payments of the term loans beginning in October 2017. The MGM China credit facilitybears interest at a fluctuating rate per annum based on HIBOR plus a margin that will range between 1.375% and2.50% based on MGM China’s leverage ratio. The MGM China credit facility is secured by MGM GrandParadise’s interest in the Cotai land use right, and MGM China, MGM Grand Paradise and their guarantorsubsidiaries have granted a security interest in substantially all of their assets to secure the facility. Theoutstanding balance at December 31, 2015 was comprised solely of term loans. At December 31, 2015, weightedaverage interest rate on the term loans was 1.97%.
The MGM China credit facility contains customary representations and warranties, events of default,affirmative covenants and negative covenants, which impose restrictions on, among other things, the ability ofMGM China and its subsidiaries to make investments, pay dividends and sell assets, and to incur additional liens.
55

As of December 31, 2015, MGM China was required to maintain compliance with a maximum leverage ratio of4.50 to 1.00 in addition to a minimum interest coverage ratio of 2.50 to 1.00. MGM China was in compliancewith the credit facility covenants at December 31, 2015.
In February 2016, the MGM China credit facility was amended. The amendment included changes to therequired maximum leverage ratio which increases to 6.00 to 1.00 beginning September 30, 2016 through June 30,2017, then decreases to 5.50 to 1.00 for September 30, 2017, 5.00 to 1.00 for December 31, 2017, and 4.50 to1.00 for March 31, 2018 and thereafter.
MGM National Harbor credit agreement. In January 2016, MGM National Harbor, LLC, the Company’swholly owned subsidiary developing and constructing MGM National Harbor, entered into a credit agreementconsisting of a $100 million revolving credit facility and a $425 million delayed draw term loan facility, of which$250 million was funded at closing. The revolving and term loan facilities initially bear interest at a LIBOR rateplus an additional rate ranging from 2.00% to 2.25% per annum (determined based on a total leverage ratio). Theterm loan facilities are subject to scheduled amortization payments on the last day of each calendar quarterbeginning the fourth full fiscal quarter following the opening date of MGM National Harbor, initially in anamount equal to 1.25% of the aggregate principal balance and increasing to 1.875% and 2.50% of the aggregateprincipal balance on the last day of the twelfth and sixteenth full fiscal quarter, respectively. The term loan andrevolving facilities are scheduled to mature in January 2021.
The credit agreement is secured by a leasehold mortgage on MGM National Harbor and substantially all ofthe existing and future property of MGM National Harbor. Mandatory prepayments will be required upon theoccurrence of certain events, including sales of certain assets, casualty events and the incurrence of certainadditional indebtedness, subject to certain exceptions and reinvestment rights. In addition, to the extent MGMNational Harbor generates excess cash flow (as defined), a percentage of such excess cash flow (ranging from0% to 50% based on a total leverage ratio) will be required to be used to prepay the term loan facilitiescommencing with the fiscal year ended 2017.
The credit agreement contains customary representations and warranties, events of default, affirmativecovenants and negative covenants, which impose restrictions on, among other things, the ability of MGMNational Harbor, LLC and its restricted subsidiaries to make investments, pay dividends, sell assets, and to incuradditional debt and additional liens. In addition, the credit agreement requires MGM National Harbor, LLC andits restricted subsidiaries to maintain a maximum total leverage ratio and a minimum interest coverage ratio. Inaddition, borrowings under the credit agreement are subject to a customary “in balance test” (as defined in thecredit agreement), which requires that, as of the date of determination prior to the opening date, the availablefunds (including resources that may be available from the Company under the Company’s senior credit facility)are equal to or exceed the remaining costs for MGM National Harbor.
Senior Notes. During 2015, the Company repaid its $875 million 6.625% senior notes at maturity. In 2014,the Company repaid its $509 million 5.875% senior notes at maturity and issued $1.25 billion of 6% senior notesdue 2023 for net proceeds of $1.24 billion. The senior notes are unsecured and otherwise rank equally in right ofpayment with the Company’s existing and future senior indebtedness. The senior notes are effectivelysubordinated to the Company’s existing and future secured obligations, primarily consisting of its senior creditfacility, to the extent of the value of the assets securing such obligations.
Convertible senior notes. In April 2015, holders of substantially all of the $1.45 billion in aggregateprincipal amount of 4.25% convertible senior notes elected to convert the notes into approximately 78 millionshares of the Company’s common stock. The notes were converted at 53.83 shares of common stock per $1,000principal amount, which is equivalent to a conversion price of approximately $18.58 per share. In addition, theCompany settled the capped call transactions entered into in connection with the initial issuance of $1.15 billionin aggregate principal amount of notes and received approximately 6 million shares from such financialinstitutions. Such shares received in connection with the capped call transactions were subsequently retired.
56
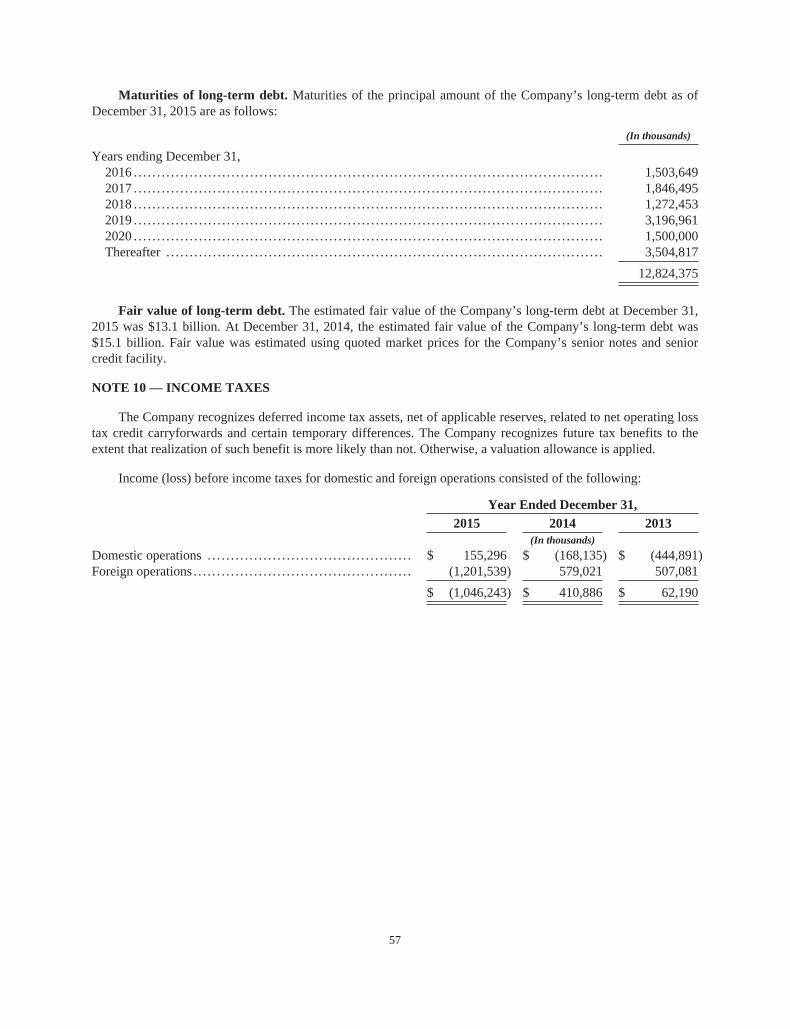
Maturities of long-term debt. Maturities of the principal amount of the Company’s long-term debt as ofDecember 31, 2015 are as follows:
(In thousands)
Years ending December 31,2016 . . . . . . . . . . . . . . . . . . . . . . . . . . . . . . . . . . . . . . . . . . . . . . . . . . . . . . . . . . . . . . . . . . . . . . . . . . . . . . . . . . . . . . . . . . . . . . . . . . . . . 1,503,6492017 . . . . . . . . . . . . . . . . . . . . . . . . . . . . . . . . . . . . . . . . . . . . . . . . . . . . . . . . . . . . . . . . . . . . . . . . . . . . . . . . . . . . . . . . . . . . . . . . . . . . . 1,846,4952018 . . . . . . . . . . . . . . . . . . . . . . . . . . . . . . . . . . . . . . . . . . . . . . . . . . . . . . . . . . . . . . . . . . . . . . . . . . . . . . . . . . . . . . . . . . . . . . . . . . . . . 1,272,4532019 . . . . . . . . . . . . . . . . . . . . . . . . . . . . . . . . . . . . . . . . . . . . . . . . . . . . . . . . . . . . . . . . . . . . . . . . . . . . . . . . . . . . . . . . . . . . . . . . . . . . . 3,196,9612020 . . . . . . . . . . . . . . . . . . . . . . . . . . . . . . . . . . . . . . . . . . . . . . . . . . . . . . . . . . . . . . . . . . . . . . . . . . . . . . . . . . . . . . . . . . . . . . . . . . . . . 1,500,000Thereafter . . . . . . . . . . . . . . . . . . . . . . . . . . . . . . . . . . . . . . . . . . . . . . . . . . . . . . . . . . . . . . . . . . . . . . . . . . . . . . . . . . . . . . . . . . . . . . 3,504,817
12,824,375
Fair value of long-term debt. The estimated fair value of the Company’s long-term debt at December 31,2015 was $13.1 billion. At December 31, 2014, the estimated fair value of the Company’s long-term debt was$15.1 billion. Fair value was estimated using quoted market prices for the Company’s senior notes and seniorcredit facility.
NOTE 10 — INCOME TAXES
The Company recognizes deferred income tax assets, net of applicable reserves, related to net operating losstax credit carryforwards and certain temporary differences. The Company recognizes future tax benefits to theextent that realization of such benefit is more likely than not. Otherwise, a valuation allowance is applied.
Income (loss) before income taxes for domestic and foreign operations consisted of the following:
Year Ended December 31,
2015 2014 2013(In thousands)
Domestic operations . . . . . . . . . . . . . . . . . . . . . . . . . . . . . . . . . . . . . . . . . . . . $ 155,296 $ (168,135) $ (444,891)Foreign operations . . . . . . . . . . . . . . . . . . . . . . . . . . . . . . . . . . . . . . . . . . . . . . . (1,201,539) 579,021 507,081
$ (1,046,243) $ 410,886 $ 62,190
57

The benefit (provision) for income taxes attributable to income (loss) before income taxes is as follows:
Year Ended December 31,
2015 2014 2013(In thousands)
Federal:Current . . . . . . . . . . . . . . . . . . . . . . . . . . . . . . . . . . . . . . . . . . . . . . . . . . . . . . . . $ (13,540) $ (10,448) $ 3,532Deferred (excluding separate components) . . . . . . . . . . . . . . . . 280,220 785,225 963,919Deferred—operating loss carryforward . . . . . . . . . . . . . . . . . . . . . — (277,453) (305,760)Deferred—valuation allowance . . . . . . . . . . . . . . . . . . . . . . . . . . . . . (247,867) (815,851) (634,190)Other noncurrent . . . . . . . . . . . . . . . . . . . . . . . . . . . . . . . . . . . . . . . . . . . . . . (590) 33,130 14,522
Benefit (provision) for federal income taxes . . . . . . . . . . . . 18,223 (285,397) 42,023
State:Current . . . . . . . . . . . . . . . . . . . . . . . . . . . . . . . . . . . . . . . . . . . . . . . . . . . . . . . . (1,840) (2,214) (1,812)Deferred (excluding separate components) . . . . . . . . . . . . . . . . (2,768) 4,338 4,056Deferred—operating loss carryforward . . . . . . . . . . . . . . . . . . . . . (2,263) 531 393Deferred—valuation allowance . . . . . . . . . . . . . . . . . . . . . . . . . . . . . (4,465) 412 (4,374)Other noncurrent . . . . . . . . . . . . . . . . . . . . . . . . . . . . . . . . . . . . . . . . . . . . . . 7,153 (547) 879
Benefit (provision) for state income taxes . . . . . . . . . . . . . . . (4,183) 2,520 (858)
Foreign:Current . . . . . . . . . . . . . . . . . . . . . . . . . . . . . . . . . . . . . . . . . . . . . . . . . . . . . . . . (2,127) (1,656) (2,214)Deferred (excluding separate components) . . . . . . . . . . . . . . . . (5,832) 1,726 (70,440)Deferred—operating loss carryforward . . . . . . . . . . . . . . . . . . . . . 10,472 3,495 1,312Deferred—valuation allowance . . . . . . . . . . . . . . . . . . . . . . . . . . . . . (9,959) (4,396) 9,361
Provision for foreign income taxes . . . . . . . . . . . . . . . . . . . . . . . (7,446) (831) (61,981)
$ 6,594 $ (283,708) $ (20,816)
A reconciliation of the federal income tax statutory rate and the Company’s effective tax rate is as follows:
Year Ended December 31,
2015 2014 2013
Federal income tax statutory rate . . . . . . . . . . . . . . . . . . . . . . . . . . . . . . 35.0% 35.0% 35.0%Foreign tax credit . . . . . . . . . . . . . . . . . . . . . . . . . . . . . . . . . . . . . . . . . . . . . . . . 63.7 (222.0) (1,557.1)Repatriation of foreign earnings . . . . . . . . . . . . . . . . . . . . . . . . . . . . . . . (32.0) 113.2 738.4Foreign goodwill impairment . . . . . . . . . . . . . . . . . . . . . . . . . . . . . . . . . . (49.1) - -Federal valuation allowance . . . . . . . . . . . . . . . . . . . . . . . . . . . . . . . . . . . . (23.7) 198.6 1,019.8State income tax, net of federal benefit and valuation
allowance . . . . . . . . . . . . . . . . . . . . . . . . . . . . . . . . . . . . . . . . . . . . . . . . . . . . . . (0.2) (0.4) 0.8Settlements with taxing authorities . . . . . . . . . . . . . . . . . . . . . . . . . . . . 0.1 (7.6) (23.5)Macau deferred tax liability re-measurement . . . . . . . . . . . . . . . . . - - 96.1Foreign jurisdiction income/losses taxed at other than
35% .. . . . . . . . . . . . . . . . . . . . . . . . . . . . . . . . . . . . . . . . . . . . . . . . . . . . . . . . . . . 6.9 (49.1) (281.8)Tax credits . . . . . . . . . . . . . . . . . . . . . . . . . . . . . . . . . . . . . . . . . . . . . . . . . . . . . . . 0.4 (1.0) (13.1)Permanent and other items . . . . . . . . . . . . . . . . . . . . . . . . . . . . . . . . . . . . . (0.5) 2.3 18.9
0.6% 69.0% 33.5%
58

The major tax-effected components of the Company’s net deferred tax liability are as follows:
December 31,
2015 2014(In thousands)
Deferred tax assets - federal and state:Bad debt reserve . . . . . . . . . . . . . . . . . . . . . . . . . . . . . . . . . . . . . . . . . . . . . . . . . . . . . . . . . . . . . . . . . . . $ 42,133 $ 47,563Deferred compensation . . . . . . . . . . . . . . . . . . . . . . . . . . . . . . . . . . . . . . . . . . . . . . . . . . . . . . . . . . . 4,719 4,074Net operating loss carryforward . . . . . . . . . . . . . . . . . . . . . . . . . . . . . . . . . . . . . . . . . . . . . . . . . 20,084 21,555Capital loss carryforward . . . . . . . . . . . . . . . . . . . . . . . . . . . . . . . . . . . . . . . . . . . . . . . . . . . . . . . . . 2,827 -Accruals, reserves and other . . . . . . . . . . . . . . . . . . . . . . . . . . . . . . . . . . . . . . . . . . . . . . . . . . . . . 42,614 129,311Investments in unconsolidated affiliates . . . . . . . . . . . . . . . . . . . . . . . . . . . . . . . . . . . . . . . . 198,594 236,528Stock-based compensation . . . . . . . . . . . . . . . . . . . . . . . . . . . . . . . . . . . . . . . . . . . . . . . . . . . . . . . 32,108 34,449Tax credits . . . . . . . . . . . . . . . . . . . . . . . . . . . . . . . . . . . . . . . . . . . . . . . . . . . . . . . . . . . . . . . . . . . . . . . . . 2,883,839 2,601,653
3,226,918 3,075,133Less: Valuation allowance . . . . . . . . . . . . . . . . . . . . . . . . . . . . . . . . . . . . . . . . . . . . . . . . . . . . . . . . . . (2,736,972) (2,498,299)
489,946 576,834
Deferred tax assets - foreign:Bad debt reserve . . . . . . . . . . . . . . . . . . . . . . . . . . . . . . . . . . . . . . . . . . . . . . . . . . . . . . . . . . . . . . . . . . . 976 1,456Net operating loss carryforward . . . . . . . . . . . . . . . . . . . . . . . . . . . . . . . . . . . . . . . . . . . . . . . . . 69,800 59,329Accruals, reserves and other . . . . . . . . . . . . . . . . . . . . . . . . . . . . . . . . . . . . . . . . . . . . . . . . . . . . . 1,270 64Property and equipment . . . . . . . . . . . . . . . . . . . . . . . . . . . . . . . . . . . . . . . . . . . . . . . . . . . . . . . . . . 2,837 10,687
74,883 71,536Less: Valuation allowance . . . . . . . . . . . . . . . . . . . . . . . . . . . . . . . . . . . . . . . . . . . . . . . . . . . . . . . . . . (70,159) (60,468)
4,724 11,068
Total deferred tax assets . . . . . . . . . . . . . . . . . . . . . . . . . . . . . . . . . . . . . . . . . . . . . . . . . . . . . . . . . . $ 494,670 $ 587,902
Deferred tax liabilities - federal and state:Property and equipment . . . . . . . . . . . . . . . . . . . . . . . . . . . . . . . . . . . . . . . . . . . . . . . . . . . . . . . . . . (2,536,724) (2,549,866)Long-term debt . . . . . . . . . . . . . . . . . . . . . . . . . . . . . . . . . . . . . . . . . . . . . . . . . . . . . . . . . . . . . . . . . . . . (220,245) (293,006)Intangibles . . . . . . . . . . . . . . . . . . . . . . . . . . . . . . . . . . . . . . . . . . . . . . . . . . . . . . . . . . . . . . . . . . . . . . . . . (99,419) (109,161)
(2,856,388) (2,952,033)
Deferred tax liabilities - foreign:Intangibles . . . . . . . . . . . . . . . . . . . . . . . . . . . . . . . . . . . . . . . . . . . . . . . . . . . . . . . . . . . . . . . . . . . . . . . . . (318,858) (319,871)
(318,858) (319,871)
Total deferred tax liability . . . . . . . . . . . . . . . . . . . . . . . . . . . . . . . . . . . . . . . . . . . . . . . . . . . . . . . . $ (3,175,246) $ (3,271,904)
Net deferred tax liability . . . . . . . . . . . . . . . . . . . . . . . . . . . . . . . . . . . . . . . . . . . . . . . . . . . . . . . . . . $ (2,680,576) $ (2,684,002)
Income generated from gaming operations of MGM Grand Paradise, which is wholly owned by MGMChina, is exempted from Macau’s 12% complementary tax for the five-year period ending December 31, 2016,pursuant to approval from the Macau government in 2011. Absent this exemption, “Net loss attributable to MGMResorts International” would have increased by $25 million and $47 million for 2015 and 2014, respectively, andnet loss per share (diluted) would have increased by $0.04 and $0.10 for 2015 and 2014, respectively. Theapproval granted in 2011 represented the second five-year exemption period granted to MGM Grand Paradise.The Company measures the net deferred tax liability of MGM Grand Paradise under the assumption that it willreceive an additional five-year exemption beyond 2016. Such assumption is based upon the granting of a thirdfive-year exemption to competitors of MGM Grand Paradise. While no assurance can be given, the Companybelieves MGM Grand Paradise should also be entitled to a third five-year exemption in order to ensure
59

non-discriminatory treatment among gaming concessionaires and subconcessionaires, a requirement underMacanese law. The net deferred tax liability of MGM Grand Paradise was re-measured during the first quarter of2013 due to the extension of the amortization period of the Macau gaming subconcession in connection with theeffectiveness of the Cotai land concession. This resulted in an increase in the net deferred tax liability and acorresponding increase in provision for income taxes of $65 million in 2013.
Non-gaming operations remain subject to the Macau complementary tax. MGM Grand Paradise had atDecember 31, 2015 a complementary tax net operating loss carryforward of $571 million resulting from non-gaming operations that will expire if not utilized against non-gaming income in years 2016 through 2018.
MGM Grand Paradise’s exemption from the Macau 12% complementary tax on gaming profits does notapply to dividend distributions of such profits to MGM China. However, MGM Grand Paradise has entered intoan agreement with the Macau government to settle the 12% complementary tax that would otherwise be due byits shareholder, MGM China, on distributions of its gaming profits by paying a flat annual payment (“annual feearrangement”) regardless of the amount of distributable dividends. Such annual fee arrangement is effective untilDecember 31, 2016. MGM China is not subject to the complementary tax on distributions it receives during thecovered period as a result of the annual fee arrangement. Annual payments of $2 million are required under theannual fee arrangement. The $2 million annual payment for 2015 and 2014 was accrued and a correspondingprovision for income taxes was recorded in each year.
The Company repatriated $304 million and $390 million of foreign earnings and profits in 2015 and 2014,respectively. At December 31, 2015, there are approximately $178 million of unrepatriated foreign earnings andprofits, all of which the Company anticipates will be repatriated without the incurrence of additional U.S. incometax expense. Accordingly, no deferred tax liability has been recorded for those earnings. Creditable foreign taxesassociated with the repatriated earnings and profits increased the Company’s foreign tax credit carryover by $318million and $782 million in 2015 and 2014, respectively. Such foreign taxes consist of the Macau SpecialGaming Tax, which the Company believes qualifies as a tax paid in lieu of an income tax that is creditableagainst U.S. income taxes. The foreign tax credit carryovers expire as follows: $785 million in 2022; $976million in 2023; $782 million in 2024; and $318 million in 2025. The foreign tax credit carryovers are subject tovaluation allowance as described further below.
The Company has an alternative minimum tax credit carryforward of $23 million that will not expire.
For state income tax purposes, the Company has Illinois and New Jersey net operating loss carryforwards of$82 million and $207 million, respectively, which equates to deferred tax assets after federal tax effect andbefore valuation allowance, of $4 million and $12 million, respectively. The Illinois net operating losscarryforwards will expire if not utilized by 2021 through 2026. The New Jersey net operating loss carryforwardswill expire if not utilized by 2029 through 2035.
As of December 31, 2015, the scheduled future reversal of existing U.S. federal taxable temporarydifferences exceeds the scheduled future reversal of existing U.S. federal deductible temporary differences.Consequently, the Company no longer applies a valuation allowance against its U.S. federal deferred tax assetsother than the foreign tax credit deferred tax asset and a capital loss carryforward. The Company has recorded avaluation allowance of $2.7 billion against the $2.9 billion foreign tax credit deferred tax asset at December 31,2015. In addition, there is an $18 million valuation allowance, after federal effect, provided on certain statedeferred tax assets, a valuation allowance of $3 million on a federal income tax capital loss carryforward, avaluation allowance of $69 million on certain Macau deferred tax assets, and a valuation allowance of $1 millionon Hong Kong net operating losses because we believe these assets do not meet the “more likely than not”criteria for recognition.
The foreign tax credits are attributable to the Macau Special Gaming Tax which is 35% of gross gamingrevenue in Macau. Because MGM Grand Paradise is presently exempt from the Macau 12% complementary taxon gaming profits, the Company believes that payment of the Macau Special Gaming Tax qualifies as a tax paidin lieu of an income tax that is creditable against U.S. taxes. Although MGM Grand Paradise’s current five-year
60
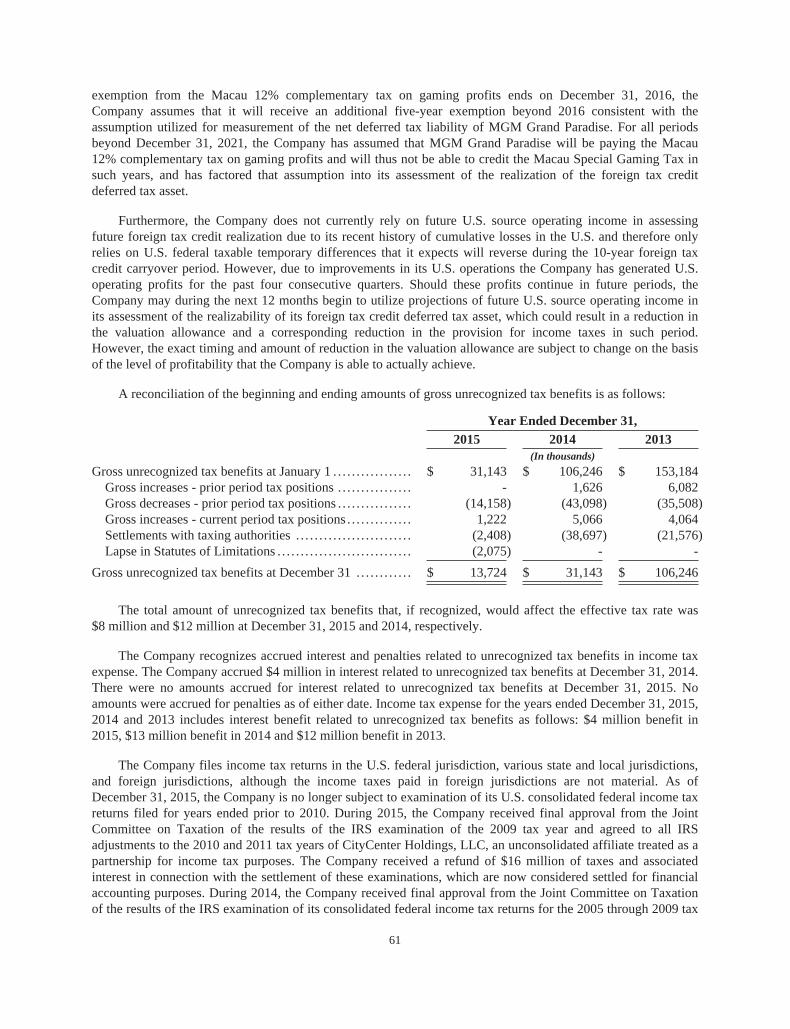
exemption from the Macau 12% complementary tax on gaming profits ends on December 31, 2016, theCompany assumes that it will receive an additional five-year exemption beyond 2016 consistent with theassumption utilized for measurement of the net deferred tax liability of MGM Grand Paradise. For all periodsbeyond December 31, 2021, the Company has assumed that MGM Grand Paradise will be paying the Macau12% complementary tax on gaming profits and will thus not be able to credit the Macau Special Gaming Tax insuch years, and has factored that assumption into its assessment of the realization of the foreign tax creditdeferred tax asset.
Furthermore, the Company does not currently rely on future U.S. source operating income in assessingfuture foreign tax credit realization due to its recent history of cumulative losses in the U.S. and therefore onlyrelies on U.S. federal taxable temporary differences that it expects will reverse during the 10-year foreign taxcredit carryover period. However, due to improvements in its U.S. operations the Company has generated U.S.operating profits for the past four consecutive quarters. Should these profits continue in future periods, theCompany may during the next 12 months begin to utilize projections of future U.S. source operating income inits assessment of the realizability of its foreign tax credit deferred tax asset, which could result in a reduction inthe valuation allowance and a corresponding reduction in the provision for income taxes in such period.However, the exact timing and amount of reduction in the valuation allowance are subject to change on the basisof the level of profitability that the Company is able to actually achieve.
A reconciliation of the beginning and ending amounts of gross unrecognized tax benefits is as follows:
Year Ended December 31,
2015 2014 2013(In thousands)
Gross unrecognized tax benefits at January 1 . . . . . . . . . . . . . . . . . $ 31,143 $ 106,246 $ 153,184Gross increases - prior period tax positions . . . . . . . . . . . . . . . . - 1,626 6,082Gross decreases - prior period tax positions . . . . . . . . . . . . . . . . (14,158) (43,098) (35,508)Gross increases - current period tax positions . . . . . . . . . . . . . . 1,222 5,066 4,064Settlements with taxing authorities . . . . . . . . . . . . . . . . . . . . . . . . . (2,408) (38,697) (21,576)Lapse in Statutes of Limitations . . . . . . . . . . . . . . . . . . . . . . . . . . . . . (2,075) - -
Gross unrecognized tax benefits at December 31 . . . . . . . . . . . . $ 13,724 $ 31,143 $ 106,246
The total amount of unrecognized tax benefits that, if recognized, would affect the effective tax rate was$8 million and $12 million at December 31, 2015 and 2014, respectively.
The Company recognizes accrued interest and penalties related to unrecognized tax benefits in income taxexpense. The Company accrued $4 million in interest related to unrecognized tax benefits at December 31, 2014.There were no amounts accrued for interest related to unrecognized tax benefits at December 31, 2015. Noamounts were accrued for penalties as of either date. Income tax expense for the years ended December 31, 2015,2014 and 2013 includes interest benefit related to unrecognized tax benefits as follows: $4 million benefit in2015, $13 million benefit in 2014 and $12 million benefit in 2013.
The Company files income tax returns in the U.S. federal jurisdiction, various state and local jurisdictions,and foreign jurisdictions, although the income taxes paid in foreign jurisdictions are not material. As ofDecember 31, 2015, the Company is no longer subject to examination of its U.S. consolidated federal income taxreturns filed for years ended prior to 2010. During 2015, the Company received final approval from the JointCommittee on Taxation of the results of the IRS examination of the 2009 tax year and agreed to all IRSadjustments to the 2010 and 2011 tax years of CityCenter Holdings, LLC, an unconsolidated affiliate treated as apartnership for income tax purposes. The Company received a refund of $16 million of taxes and associatedinterest in connection with the settlement of these examinations, which are now considered settled for financialaccounting purposes. During 2014, the Company received final approval from the Joint Committee on Taxationof the results of the IRS examination of its consolidated federal income tax returns for the 2005 through 2009 tax
61

years; the 2007 through 2008 tax years of CityCenter Holdings, LLC; the 2008 through 2009 tax years of MGMGrand Detroit, LLC, a subsidiary treated as a partnership for income tax purposes; and the 2005 through 2009 taxyears of Marina District Development Holding Company, LLC an unconsolidated affiliate treated as apartnership for income tax purposes. These examinations are now considered settled for financial reportingpurposes. The Company previously deposited $30 million with the IRS to cover the expected cash taxes andinterest resulting from the tentatively agreed adjustments for these examinations.
As of December 31, 2015, other than adjustments resulting from the federal income tax audits discussedabove, the Company was no longer subject to examination of its various state and local tax returns filed for yearsended prior to 2011. During 2015, the state of New Jersey completed its examination of Marina DistrictDevelopment Holding Company, LLC for the 2003 through 2009 tax years. All adjustments were agreed to bythe members of Marina District Development Holding Company, LLC and the examination is now consideredsettled for financial accounting purposes. The Company made a $1 million payment of tax and associated interestas a result of this settlement. No other state or local income tax returns are currently under examination.
The Company does not anticipate that the total amounts of unrecognized tax benefits at December 31, 2015will change materially within the next twelve months.
NOTE 11 — COMMITMENTS AND CONTINGENCIES
Leases. The Company leases real estate and various equipment under operating and, to a lesser extent,capital lease arrangements. Certain real estate leases provide for escalation of rent based upon a specified priceindex and/or based upon periodic appraisals.
At December 31, 2015, the Company was obligated under non-cancellable operating leases and capitalleases to make future minimum lease payments as follows:
OperatingLeases
CapitalLeases
(In thousands)
Years ending December 31,2016 . . . . . . . . . . . . . . . . . . . . . . . . . . . . . . . . . . . . . . . . . . . . . . . . . . . . . . . . . . . . . . . . . . . . . . . . . . . . . . . . . . . $ 54,780 $ 8,2292017 . . . . . . . . . . . . . . . . . . . . . . . . . . . . . . . . . . . . . . . . . . . . . . . . . . . . . . . . . . . . . . . . . . . . . . . . . . . . . . . . . . . 26,067 7,5622018 . . . . . . . . . . . . . . . . . . . . . . . . . . . . . . . . . . . . . . . . . . . . . . . . . . . . . . . . . . . . . . . . . . . . . . . . . . . . . . . . . . . 22,666 1,7252019 . . . . . . . . . . . . . . . . . . . . . . . . . . . . . . . . . . . . . . . . . . . . . . . . . . . . . . . . . . . . . . . . . . . . . . . . . . . . . . . . . . . 20,564 -2020 . . . . . . . . . . . . . . . . . . . . . . . . . . . . . . . . . . . . . . . . . . . . . . . . . . . . . . . . . . . . . . . . . . . . . . . . . . . . . . . . . . . 21,564 -Thereafter . . . . . . . . . . . . . . . . . . . . . . . . . . . . . . . . . . . . . . . . . . . . . . . . . . . . . . . . . . . . . . . . . . . . . . . . . . . . . 1,097,757 -
Total minimum lease payments . . . . . . . . . . . . . . . . . . . . . . . . . . . . . . . . . . . . . . . . . . . . . . . . . . $ 1,243,398 17,516
Less: Amounts representing interest . . . . . . . . . . . . . . . . . . . . . . . . . . . . . . . . . . . . . . . . . . . . . . . (853)
Total obligations under capital leases . . . . . . . . . . . . . . . . . . . . . . . . . . . . . . . . . . . . . . . . . . . 16,663Less: Amounts due within one year . . . . . . . . . . . . . . . . . . . . . . . . . . . . . . . . . . . . . . . . . . . . . . . . (7,572)
Amounts due after one year . . . . . . . . . . . . . . . . . . . . . . . . . . . . . . . . . . . . . . . . . . . . . . . . . . . . . . $ 9,091
The current and long-term obligations under capital leases are included in “Other accrued liabilities” and“Other long-term obligations,” respectively. Rental expense for operating leases was $74 million, $65 millionand $41 million for 2015, 2014 and 2013, respectively. Amounts included short term rentals charged to rentexpense. Rental expense includes $7 million related to the Cotai land concession for 2015, 2014 and 2013. TheCompany accounts for the Cotai land concession contract as an operating lease for which the required upfrontpayments are amortized over the initial 25-year contract term. Rent recognized for the Cotai land concession isincluded in “Preopening and start-up expenses” prior to opening.
62
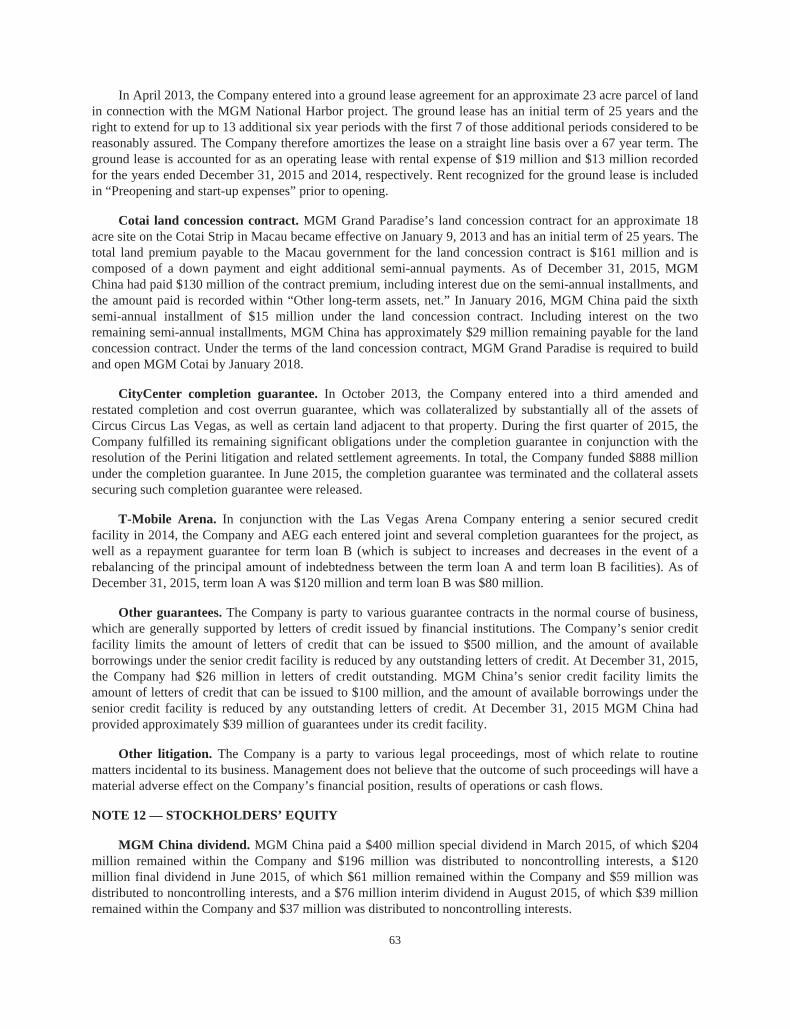
In April 2013, the Company entered into a ground lease agreement for an approximate 23 acre parcel of landin connection with the MGM National Harbor project. The ground lease has an initial term of 25 years and theright to extend for up to 13 additional six year periods with the first 7 of those additional periods considered to bereasonably assured. The Company therefore amortizes the lease on a straight line basis over a 67 year term. Theground lease is accounted for as an operating lease with rental expense of $19 million and $13 million recordedfor the years ended December 31, 2015 and 2014, respectively. Rent recognized for the ground lease is includedin “Preopening and start-up expenses” prior to opening.
Cotai land concession contract. MGM Grand Paradise’s land concession contract for an approximate 18acre site on the Cotai Strip in Macau became effective on January 9, 2013 and has an initial term of 25 years. Thetotal land premium payable to the Macau government for the land concession contract is $161 million and iscomposed of a down payment and eight additional semi-annual payments. As of December 31, 2015, MGMChina had paid $130 million of the contract premium, including interest due on the semi-annual installments, andthe amount paid is recorded within “Other long-term assets, net.” In January 2016, MGM China paid the sixthsemi-annual installment of $15 million under the land concession contract. Including interest on the tworemaining semi-annual installments, MGM China has approximately $29 million remaining payable for the landconcession contract. Under the terms of the land concession contract, MGM Grand Paradise is required to buildand open MGM Cotai by January 2018.
CityCenter completion guarantee. In October 2013, the Company entered into a third amended andrestated completion and cost overrun guarantee, which was collateralized by substantially all of the assets ofCircus Circus Las Vegas, as well as certain land adjacent to that property. During the first quarter of 2015, theCompany fulfilled its remaining significant obligations under the completion guarantee in conjunction with theresolution of the Perini litigation and related settlement agreements. In total, the Company funded $888 millionunder the completion guarantee. In June 2015, the completion guarantee was terminated and the collateral assetssecuring such completion guarantee were released.
T-Mobile Arena. In conjunction with the Las Vegas Arena Company entering a senior secured creditfacility in 2014, the Company and AEG each entered joint and several completion guarantees for the project, aswell as a repayment guarantee for term loan B (which is subject to increases and decreases in the event of arebalancing of the principal amount of indebtedness between the term loan A and term loan B facilities). As ofDecember 31, 2015, term loan A was $120 million and term loan B was $80 million.
Other guarantees. The Company is party to various guarantee contracts in the normal course of business,which are generally supported by letters of credit issued by financial institutions. The Company’s senior creditfacility limits the amount of letters of credit that can be issued to $500 million, and the amount of availableborrowings under the senior credit facility is reduced by any outstanding letters of credit. At December 31, 2015,the Company had $26 million in letters of credit outstanding. MGM China’s senior credit facility limits theamount of letters of credit that can be issued to $100 million, and the amount of available borrowings under thesenior credit facility is reduced by any outstanding letters of credit. At December 31, 2015 MGM China hadprovided approximately $39 million of guarantees under its credit facility.
Other litigation. The Company is a party to various legal proceedings, most of which relate to routinematters incidental to its business. Management does not believe that the outcome of such proceedings will have amaterial adverse effect on the Company’s financial position, results of operations or cash flows.
NOTE 12 — STOCKHOLDERS’ EQUITY
MGM China dividend. MGM China paid a $400 million special dividend in March 2015, of which $204million remained within the Company and $196 million was distributed to noncontrolling interests, a $120million final dividend in June 2015, of which $61 million remained within the Company and $59 million wasdistributed to noncontrolling interests, and a $76 million interim dividend in August 2015, of which $39 millionremained within the Company and $37 million was distributed to noncontrolling interests.
63
MGM China paid a $499 million special dividend in March 2014, of which $254 million remained withinthe Company and $245 million was distributed to noncontrolling interests, a $127 million final dividend in June2014, of which $65 million remained within the Company and $62 million was distributed to noncontrollinginterests, and a $137 million interim dividend in September 2014, of which $70 million remained within theCompany and $67 million was distributed to noncontrolling interests.
MGM China paid a $500 million special dividend in March 2013, of which $255 million remained withinthe Company and $245 million was distributed to noncontrolling interests, and a $113 million interim dividend inSeptember 2013, of which $58 million remained within the Company and $55 million was distributed tononcontrolling interests.
On February 18, 2016, as part of its regular dividend policy, MGM China’s Board of Directors announced itwill recommend a final dividend for 2015 of $46 million to MGM China shareholders subject to approval at theMGM China 2016 annual shareholders meeting to be held in May. If approved, the Company will receive $23million, its 51% share of the 2015 final dividend.
NOTE 13 — STOCK-BASED COMPENSATION
2005 Omnibus Incentive Plan. The Company’s omnibus incentive plan, as amended (the “Omnibus Plan”),allows it to grant stock options, stock appreciation rights (“SARs”), restricted stock units (“RSUs”), performanceshare units (“PSUs”) and other stock-based awards to eligible directors, officers and employees of the Companyand its subsidiaries. The Omnibus Plan is administered by the Compensation Committee (the “Committee”) ofthe Board of Directors. The Committee has discretion under the Omnibus Plan regarding which type of awards togrant, the vesting and service requirements, exercise price and other conditions, in all cases subject to certainlimits, including:
• As amended, the Omnibus Plan allows for the issuance of up to 45 million shares or share-based awards;and
• For stock options and SARs, the exercise price of the award must be at least equal to the fair market valueof the stock on the date of grant and the maximum term of such an award is 10 years.
SARs granted under the Omnibus Plan generally have terms of seven years, and in most cases vest in fourequal annual installments. RSUs granted vest ratably over four years, a portion of which are subject toachievement of a performance target based on operational results compared to budget in order for such RSUs tobe eligible to vest. Expense is recognized primarily on a straight-line basis over the vesting period of the awardsnet of estimated forfeitures. Estimated forfeitures are updated periodically with actual forfeitures recognizedcurrently to the extent they differ from the estimate.
PSUs granted vest subject to a market condition, in which a percentage of the target award granted vestsbased on the performance of the Company’s stock price in relation to the target price at the end of a three yearperformance period. Specifically, the ending average stock price must equal the target price, which is defined as125% of the beginning average stock price, in order for the target award to vest. No shares are issued unless theending average stock price is at least 60% of the target price, and the maximum payout is capped at 160% of thetarget award. If the ending average stock price is at least 60% or more of the target price, then the amount ofunits granted in the target award is multiplied by the stock performance multiplier. The stock performancemultiplier equals the ending average stock price divided by the target price. For this purpose, the target andending prices are based on the average closing price of the Company’s common stock over the 60 calendar dayperiods ending on the grant date and the third anniversary of the grant date. Expense is recognized on a gradedbasis over the performance period beginning on the date of grant. Estimated forfeitures are updated periodicallywith actual forfeitures recognized currently to the extent they differ from the estimate.
64

As of December 31, 2015, the Company had an aggregate of approximately 22 million shares of commonstock available for grant as share-based awards under the Omnibus Plan. A summary of activity under theCompany’s share-based payment plans for the year ended December 31, 2015 is presented below:
Stock options and stock appreciation rights
WeightedWeighted Average AggregateAverage Remaining Intrinsic
Units Exercise Contractual Value(000’s) Price Term (000’s)
Outstanding at January 1, 2015 . . . . . . . . . . . . . . . . . . . . . . . . . . . . . . . . 16,176 $ 15.27Granted . . . . . . . . . . . . . . . . . . . . . . . . . . . . . . . . . . . . . . . . . . . . . . . . . . . . . . . . . . . 2,247 20.26Exercised . . . . . . . . . . . . . . . . . . . . . . . . . . . . . . . . . . . . . . . . . . . . . . . . . . . . . . . . . (2,571) 10.83Forfeited or expired . . . . . . . . . . . . . . . . . . . . . . . . . . . . . . . . . . . . . . . . . . . . . (1,721) 32.47
Outstanding at December 31, 2015 . . . . . . . . . . . . . . . . . . . . . . . . . . . . 14,131 14.82 3.76 $ 111,900
Vested and expected to vest at December 31, 2015 . . . . . . . . . . 13,733 14.66 3.69 $ 111,129
Exercisable at December 31, 2015 . . . . . . . . . . . . . . . . . . . . . . . . . . . . . 9,056 11.97 2.60 $ 97,655
As of December 31, 2015, there was a total of $33 million of unamortized compensation related to stockoptions and SARs expected to vest, which is expected to be recognized over a weighted-average period of 1.8years.
Restricted stock units and performance share units
RSUs PSUs
Weighted Weighted WeightedAverage Average Average
Units Grant-Date Units Grant-Date Target(000’s) Fair Value (000’s) Fair Value Price
Nonvested at January 1, 2015 . . . . . . . . . . . . . . . 1,358 $ 18.27 1,455 $ 15.14 $ 20.48Granted . . . . . . . . . . . . . . . . . . . . . . . . . . . . . . . . . . . . . . . . 848 20.28 1,045 17.73 25.76Vested . . . . . . . . . . . . . . . . . . . . . . . . . . . . . . . . . . . . . . . . . (540) 16.18 (682) 10.03 13.37Forfeited . . . . . . . . . . . . . . . . . . . . . . . . . . . . . . . . . . . . . . . (88) 18.45 - - -
Nonvested at December 31, 2015 . . . . . . 1,578 20.05 1,818 18.54 26.18
As of December 31, 2015, there was a total of $24 million of unamortized compensation related to RSUswhich is expected to be recognized over a weighted-average period of 1.8 years. As of December 31, 2015, therewas a total of $21 million of unamortized compensation related to PSUs which is expected to be recognized overa weighted-average period of 2.1 years.
The Company grants PSUs for a portion of any calculated bonus for a Section 16 officer of the Companythat is in excess of such officer’s base salary (the “Bonus PSU Policy”). Awards granted under the Bonus PSUPolicy have the same terms as the other PSUs granted under the Omnibus Plan with the exception that as of thegrant date the awards will not be subject to forfeiture in the event of the officer’s termination. In March 2015 and2014, the Company granted 0.2 million and 0.3 million PSUs pursuant to the Bonus PSU Policy with a targetprice of $25.91 and $31.72, respectively. Additionally, the Company grants PSUs for certain employees of theCompany in connection with the Profit Growth Plan (“Profit Growth Plan PSUs”). Profit Growth Plan PSUs havethe same terms as the other PSUs granted under the Omnibus Plan with the exception of an additional service andperformance condition tied to the results of the Profit Growth Plan which must be achieved for the awards tovest. In October 2015, the Company granted 0.3 million Profit Growth Plan PSUs with a target price of $25.76.Awards granted under the Bonus PSU Policy and in connection with the Profit Growth Plan are excluded fromthe table above.
65

The following table includes additional information related to stock options, SARs and RSUs:
Year Ended December 31,
2015 2014 2013(In thousands)
Intrinsic value of share-based awards exercised or RSUs andPSUs vested . . . . . . . . . . . . . . . . . . . . . . . . . . . . . . . . . . . . . . . . . . . . . . . . . . . . . . . . . . $ 67,420 $ 31,613 $ 28,880
Income tax benefit from share-based awards exercised or RSUsand PSUs vested . . . . . . . . . . . . . . . . . . . . . . . . . . . . . . . . . . . . . . . . . . . . . . . . . . . . . . 23,288 10,805 9,975
The Company net settles SAR exercises, whereby shares of common stock are issued equivalent to theintrinsic value of the SAR less applicable taxes.
MGM China Share Option Plan. The Company’s subsidiary, MGM China, adopted an equity award planin 2011 for grants of stock options to purchase ordinary shares of MGM China to eligible directors, employeesand non-employees of MGM China and its subsidiaries (“MGM China Plan”). The MGM China Plan isadministered by MGM China’s Board of Directors, which has the discretion to determine the exercise price andterm of the award, as well as other conditions, in all cases subject to certain limits, including:
• The maximum number of shares which may be issued upon exercise of all options to be granted under theMGM China Plan shall not in aggregate exceed 10% of the total number of shares in issue as of the dateof the shareholders’ approval of the MGM China Plan; and
• The exercise price of the award must be the higher of the closing price of the stock on the offer date, orthe average of the closing price for the five business days immediately preceding the offer date, and themaximum term of the award must not exceed ten years.
Stock options currently granted under the MGM China Plan have a term of ten years, and vest in four equalannual installments. Expense is recognized on a straight-line basis over the vesting period of the awards net ofestimated forfeitures. Forfeitures are estimated at the time of grant, with such estimate updated periodically andwith actual forfeitures recognized currently to the extent they differ from the estimate.
As of December 31, 2015, MGM China had an aggregate of approximately 327 million shares of optionsavailable for grant as share-based awards. A summary of activity under the MGM China Plan for the year endedDecember 31, 2015 is presented below:
Stock options
WeightedWeighted Average AggregateAverage Remaining Intrinsic
Units Exercise Contractual Value(000’s) Price Term (000’s)
Outstanding at January 1, 2015 . . . . . . . . . . . . . . . . . 35,058 $ 2.85Granted . . . . . . . . . . . . . . . . . . . . . . . . . . . . . . . . . . . . . . . . . . . . 16,546 1.84Exercised . . . . . . . . . . . . . . . . . . . . . . . . . . . . . . . . . . . . . . . . . . (20) 2.01Forfeited or expired . . . . . . . . . . . . . . . . . . . . . . . . . . . . . . (2,373) 2.24
Outstanding at December 31, 2015 . . . . . . . . . . . . . 49,211 2.54 7.95 $ -
Vested and expected to vest at December 31,2015 . . . . . . . . . . . . . . . . . . . . . . . . . . . . . . . . . . . . . . . . . . . . 46,659 2.54 7.89 $ -
Exercisable at December 31, 2015 . . . . . . . . . . . . . . 18,013 2.42 6.24 $ -
As of December 31, 2015, there was a total of $19 million of unamortized compensation related to stockoptions expected to vest, which is expected to be recognized over a weighted-average period of 2.8 years.
66
Recognition of compensation cost. Compensation cost for both the Omnibus Plan and MGM China Planwas recognized as follows:
Year Ended December 31,
2015 2014 2013(In thousands)
Compensation cost:Omnibus Plan . . . . . . . . . . . . . . . . . . . . . . . . . . . . . . . . . . . . . . . . . . . . . . . . . . . . . . . . . $ 33,742 $ 29,662 $ 27,201MGM China Plan . . . . . . . . . . . . . . . . . . . . . . . . . . . . . . . . . . . . . . . . . . . . . . . . . . . . 9,260 8,706 6,221
Total compensation cost . . . . . . . . . . . . . . . . . . . . . . . . . . . . . . . . . . . . . . . . . . 43,002 38,368 33,422Less: Reimbursed costs and capitalized cost . . . . . . . . . . . . . . . . . . . . . . . . . (1,156) (1,104) (1,090)
Compensation cost after reimbursed costs and capitalizedcost . . . . . . . . . . . . . . . . . . . . . . . . . . . . . . . . . . . . . . . . . . . . . . . . . . . . . . . . . . . . . . . 41,846 37,264 32,332
Less: Related tax benefit . . . . . . . . . . . . . . . . . . . . . . . . . . . . . . . . . . . . . . . . . . . . . . . (11,230) (9,822) -
Compensation cost, net of tax benefit . . . . . . . . . . . . . . . . . . . . . . . . . . . $ 30,616 $ 27,442 $ 32,332
Compensation cost for SARs granted under the Omnibus Plan is based on the fair value of each award,measured by applying the Black-Scholes model on the date of grant, using the following weighted-averageassumptions:
Year Ended December 31,
2015 2014 2013
Expected volatility . . . . . . . . . . . . . . . . . . . . . . . . . . . . . . . . . . . . . . . . . . . . . . . . . . . . . . 38% 40% 54%Expected term . . . . . . . . . . . . . . . . . . . . . . . . . . . . . . . . . . . . . . . . . . . . . . . . . . . . . . . . . . . 4.9 yrs. 4.9 yrs. 4.9 yrs.Expected dividend yield . . . . . . . . . . . . . . . . . . . . . . . . . . . . . . . . . . . . . . . . . . . . . . . . 0% 0% 0%Risk-free interest rate . . . . . . . . . . . . . . . . . . . . . . . . . . . . . . . . . . . . . . . . . . . . . . . . . . . 1.8% 1.6% 1.6%Weighted-average fair value of SARs granted . . . . . . . . . . . . . . . . . . . . . . . $ 7.27 $ 8.18 $ 9.44
Expected volatility is based in part on historical volatility and in part on implied volatility based on tradedoptions on the Company’s stock. The expected term considers the contractual term of the option as well ashistorical exercise and forfeiture behavior. The risk-free interest rate is based on the rates in effect on the grantdate for U.S. Treasury instruments with maturities matching the relevant expected term of the award.
Compensation cost for PSUs granted under the Omnibus Plan is based on the fair value of each award,measured by applying a Monte Carlo simulation method on the date of grant, using the following weighted-average assumptions:
Year Ended December 31,
2015 2014 2013
Expected volatility . . . . . . . . . . . . . . . . . . . . . . . . . . . . . . . . . . . . . . . . . . . . . . . . . . . . . . 39% 31% 40%Expected term . . . . . . . . . . . . . . . . . . . . . . . . . . . . . . . . . . . . . . . . . . . . . . . . . . . . . . . . . . . 3.0 yrs. 3.0 yrs. 3.0 yrs.Expected dividend yield . . . . . . . . . . . . . . . . . . . . . . . . . . . . . . . . . . . . . . . . . . . . . . . . 0% 0% 0%Risk-free interest rate . . . . . . . . . . . . . . . . . . . . . . . . . . . . . . . . . . . . . . . . . . . . . . . . . . . 0.9% 1.0% 0.6%Weighted-average fair value of PSUs granted . . . . . . . . . . . . . . . . . . . . . . . . $ 17.73 $ 18.39 $ 21.01
Expected volatility is based in part on historical volatility and in part on implied volatility based on tradedoptions on the Company’s stock. The expected term is equal to the three year performance period. The risk-freeinterest rate is based on the rates in effect on the grant date for U.S. Treasury instruments with maturitiesmatching the relevant expected term of the award.
67
Compensation cost for stock options granted under the MGM China Plan is based on the fair value of eachaward, measured by applying the Black-Scholes model on the date of grant, using the following weighted-average assumptions:
Year Ended December 31,
2015 2014 2013
Expected volatility . . . . . . . . . . . . . . . . . . . . . . . . . . . . . . . . . . . . . . . . . . . . . . 43% 39% 46%Expected term . . . . . . . . . . . . . . . . . . . . . . . . . . . . . . . . . . . . . . . . . . . . . . . . . . . 5.8 yrs. 7.9 yrs. 8.0 yrs.Expected dividend yield . . . . . . . . . . . . . . . . . . . . . . . . . . . . . . . . . . . . . . . . 2.4% 1.6% 1.2%Risk-free interest rate . . . . . . . . . . . . . . . . . . . . . . . . . . . . . . . . . . . . . . . . . . . 1.3% 1.8% 1.7%Weighted-average fair value of options granted . . . . . . . . . . . . . . $ 0.55 $ 1.06 $ 1.39
Expected volatilities are based on a blend of historical volatility from a selection of companies in MGMChina’s peer group and historical volatility of MGM China’s stock price. Expected term considers the contractualterm of the option as well as historical exercise behavior of previously granted options. Dividend yield is basedon the estimate of annual dividends expected to be paid at the time of the grant. The risk-free interest rate isbased on rates in effect at the valuation date for the Hong Kong Exchange Fund Notes with maturities matchingthe relevant expected term of the award.
NOTE 14 — EMPLOYEE BENEFIT PLANS
Multiemployer benefit plans. Employees of the Company who are members of various unions are coveredby union-sponsored, collectively bargained, multiemployer health and welfare and defined benefit pension plans.Of these plans, the Company considers the Southern Nevada Culinary and Bartenders Pension Plan (the “PensionPlan”), under the terms of collective bargaining agreements with the Local Joint Executive Board of Las Vegasfor and on behalf of Culinary Workers Union Local No. 226 and Bartenders Union Local No. 165, to beindividually significant. The risk of participating in the Pension Plan differs from single-employer plans in thefollowing aspects:
a) Assets contributed to the multiemployer plan by one employer may be used to provide benefits toemployees of other participating employers;
b) If a participating employer stops contributing to the plan, the unfunded obligations of the plan may beborne by the remaining participating employers;
c) If an entity chooses to stop participating in some of its multiemployer plans, the entity may be requiredto pay those plans an amount based on the underfunded status of the plan, referred to as a withdrawalliability;
d) If the Pension Plan is terminated by withdrawal of all employers and if the value of the nonforfeitablebenefits exceeds plan assets and withdrawal liability payments, employers are required by law to makeup the insufficient difference.
Pursuant to its collective bargaining agreements referenced above, the Company also contributes to UNITEHERE Health (the “Health Fund”), which provides healthcare benefits to its active and retired members. TheCompany’s participation in the Pension Plan is outlined in the table below.
EIN/PensionPlan Number
Pension Protection Act ZoneStatus (1)
Expiration Dateof CollectiveBargaining
Agreements (2)Pension Fund 2014 2013
Southern Nevada Culinary andBartenders Pension Plan . . . . . . . . . . . . . . 88-6016617/001 Green Green 5/31/18
(1) The trustees of the Pension Plan have elected to apply the extended amortization and the special ten year asset smoothing rules underthe Pension Relief Act of 2010.
68
(2) The Company is party to ten collective bargaining agreements that require contributions to the Pension Plan. The agreements betweenCityCenter Hotel Casino, LLC, Bellagio, Mandalay Corp., MGM Grand Hotel, LLC and the Local Joint Executive Board of Las Vegasare the most significant because more than half of the Company’s employee participants in the Pension Plan are covered by those fouragreements.
Contributions to the Company’s multiemployer pension plans and other multiemployer benefit plans wereas follows:
Year Ended December 31,
2015 2014 2013(In thousands)
Multiemployer Pension PlansSouthern Nevada Culinary and Bartenders Pension Plan . . . . . . . . . $ 41,904 $ 33,927 $ 37,691Other pension plans not individually significant . . . . . . . . . . . . . . . . . . 9,680 7,323 8,280
Total multiemployer pension plans . . . . . . . . . . . . . . . . . . . . . . . . . . . . . . $ 51,584 $ 41,250 $ 45,971
Multiemployer Benefit Plans Other Than PensionsUNITE HERE Health . . . . . . . . . . . . . . . . . . . . . . . . . . . . . . . . . . . . . . . . . . . . . . . . $ 191,733 $ 202,641 $ 167,494Other . . . . . . . . . . . . . . . . . . . . . . . . . . . . . . . . . . . . . . . . . . . . . . . . . . . . . . . . . . . . . . . . . . 12,840 12,746 15,367
Total multiemployer benefit plans other than pensions . . . . . . . . $ 204,573 $ 215,387 $ 182,861
During 2014 an amendment to the collective bargaining agreements to temporarily divert contributions fromthe Pension Plan to the Health Fund was in effect. As a result contributions to the Pension Plan decreased in 2014compared to 2013 and increased in 2015 compared to 2014 as the amendment ended in June of 2014. Hoursworked in 2015 increased approximately 1% compared to 2014. Bellagio, Aria, Mandalay Bay and MGM GrandLas Vegas were listed in the Pension Plan’s Forms 5500 as providing more than 5% of the total contributions forthe plan years ended December 31, 2014 and 2013. At the date the financial statements were issued, Form 5500was not available for the plan year ending in 2015. No surcharges were imposed on the Company’s contributionsto any of the plans.
Self-insurance. The Company is self-insured for most health care benefits and workers compensation for itsnon-union employees. The liability for health care claims filed and estimates of claims incurred but not reportedwas $22 million and $20 million at December 31, 2015 and 2014, respectively. The workers compensationliability for claims filed and estimates of claims incurred but not reported was $43 million and $48 million as ofDecember 31, 2015 and 2014, respectively. Both liabilities are included in “Other accrued liabilities.”
Retirement savings plans. The Company has retirement savings plans under Section 401(k) of the IRC foreligible employees. The plans allow employees to defer, within prescribed limits, up to 75% of their income on apre-tax and/or after-tax basis through contributions to the plans. The Company matches 50% of the first 6% ofeligible employee deferrals up to a specified annual maximum dollar amount. The Company recorded charges for401(k) contributions of $16 million, $17 million and $13 million in 2015, 2014 and 2013, respectively.
The Company maintains nonqualified deferred retirement plans for certain key employees. The plans allowparticipants to defer, on a pre-tax basis, a portion of their salary and bonus and accumulate tax deferred earnings,plus investment earnings on the deferred balances, as a deferred tax savings. All employee deferrals vestimmediately. The Company does not contribute to the plan.
The Company also maintains nonqualified supplemental executive retirement plans (“SERP”) for certainkey employees. Until September 2008, the Company made quarterly contributions intended to provide aretirement benefit that is a fixed percentage of a participant’s estimated final five-year average annual salary, upto a maximum of 65%. The Company has indefinitely suspended these contributions. Employees do not makecontributions under these plans. A portion of the Company contributions and investment earnings thereon vestafter three years of SERP participation and the remaining portion vests after both five years of SERPparticipation and 10 years of continuous service.
69
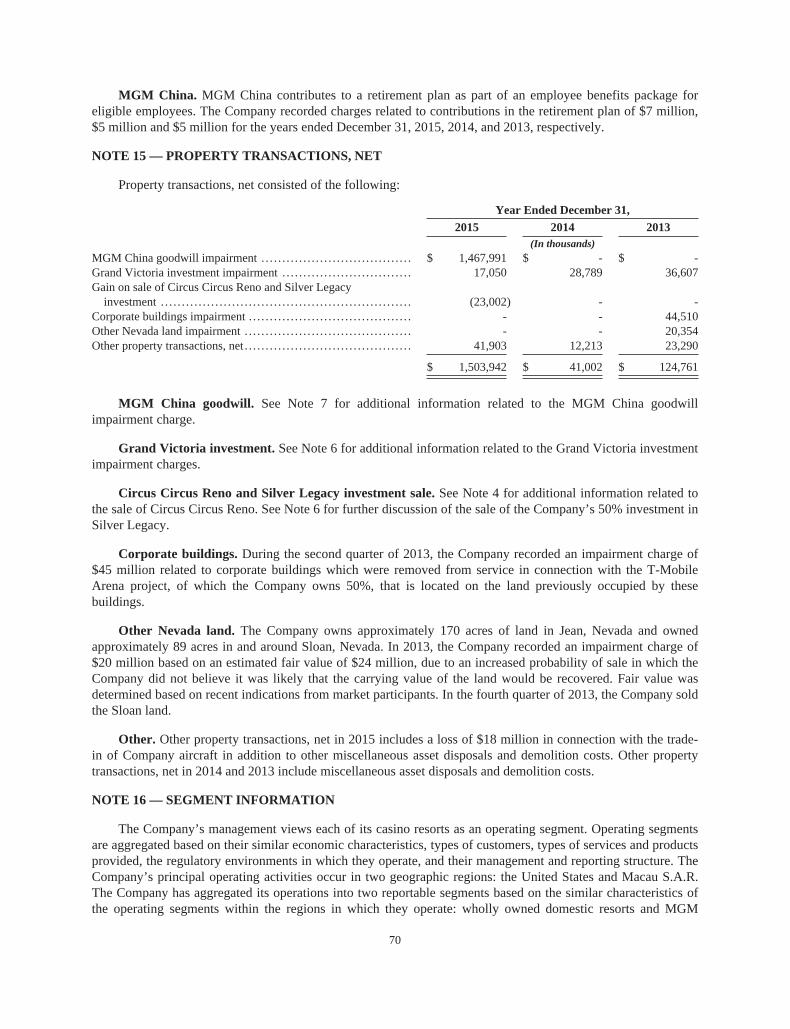
MGM China. MGM China contributes to a retirement plan as part of an employee benefits package foreligible employees. The Company recorded charges related to contributions in the retirement plan of $7 million,$5 million and $5 million for the years ended December 31, 2015, 2014, and 2013, respectively.
NOTE 15 — PROPERTY TRANSACTIONS, NET
Property transactions, net consisted of the following:
Year Ended December 31,
2015 2014 2013(In thousands)
MGM China goodwill impairment . . . . . . . . . . . . . . . . . . . . . . . . . . . . . . . . . . . . $ 1,467,991 $ - $ -Grand Victoria investment impairment . . . . . . . . . . . . . . . . . . . . . . . . . . . . . . . 17,050 28,789 36,607Gain on sale of Circus Circus Reno and Silver Legacy
investment . . . . . . . . . . . . . . . . . . . . . . . . . . . . . . . . . . . . . . . . . . . . . . . . . . . . . . . . . . . . (23,002) - -Corporate buildings impairment . . . . . . . . . . . . . . . . . . . . . . . . . . . . . . . . . . . . . . . - - 44,510Other Nevada land impairment . . . . . . . . . . . . . . . . . . . . . . . . . . . . . . . . . . . . . . . . - - 20,354Other property transactions, net . . . . . . . . . . . . . . . . . . . . . . . . . . . . . . . . . . . . . . . . 41,903 12,213 23,290
$ 1,503,942 $ 41,002 $ 124,761
MGM China goodwill. See Note 7 for additional information related to the MGM China goodwillimpairment charge.
Grand Victoria investment. See Note 6 for additional information related to the Grand Victoria investmentimpairment charges.
Circus Circus Reno and Silver Legacy investment sale. See Note 4 for additional information related tothe sale of Circus Circus Reno. See Note 6 for further discussion of the sale of the Company’s 50% investment inSilver Legacy.
Corporate buildings. During the second quarter of 2013, the Company recorded an impairment charge of$45 million related to corporate buildings which were removed from service in connection with the T-MobileArena project, of which the Company owns 50%, that is located on the land previously occupied by thesebuildings.
Other Nevada land. The Company owns approximately 170 acres of land in Jean, Nevada and ownedapproximately 89 acres in and around Sloan, Nevada. In 2013, the Company recorded an impairment charge of$20 million based on an estimated fair value of $24 million, due to an increased probability of sale in which theCompany did not believe it was likely that the carrying value of the land would be recovered. Fair value wasdetermined based on recent indications from market participants. In the fourth quarter of 2013, the Company soldthe Sloan land.
Other. Other property transactions, net in 2015 includes a loss of $18 million in connection with the trade-in of Company aircraft in addition to other miscellaneous asset disposals and demolition costs. Other propertytransactions, net in 2014 and 2013 include miscellaneous asset disposals and demolition costs.
NOTE 16 — SEGMENT INFORMATION
The Company’s management views each of its casino resorts as an operating segment. Operating segmentsare aggregated based on their similar economic characteristics, types of customers, types of services and productsprovided, the regulatory environments in which they operate, and their management and reporting structure. TheCompany’s principal operating activities occur in two geographic regions: the United States and Macau S.A.R.The Company has aggregated its operations into two reportable segments based on the similar characteristics ofthe operating segments within the regions in which they operate: wholly owned domestic resorts and MGM
70

China. The Company’s operations related to investments in unconsolidated affiliates, MGM Hospitality, andcertain other corporate and management operations have not been identified as separate reportable segments;therefore, these operations are included in corporate and other in the following segment disclosures to reconcileto consolidated results.
The Company’s management utilizes Adjusted Property EBITDA as the primary profit measure for itsreportable segments. Adjusted Property EBITDA is a measure defined as Adjusted EBITDA before corporateexpense and stock compensation expense related to the Omnibus Plan, which are not allocated to the reportablesegments or each operating segment, as applicable. MGM China recognizes stock compensation expense relatedto the MGM China Plan which is included in the calculation of Adjusted EBITDA for MGM China. AdjustedEBITDA is a measure defined as earnings before interest and other non-operating income (expense), taxes,depreciation and amortization, preopening and start-up expenses, property transactions, net.
The following tables present the Company’s segment information:
Year Ended December 31,
2015 2014 2013(In thousands)
Net Revenues . . . . . . . . . . . . . . . . . . . . . . . . . . . . . . . . . . . . . . . . . . . . . . . . . . . . . . . . . . .Wholly owned domestic resorts . . . . . . . . . . . . . . . . . . . . . . . . . . . . . . . . . . . . . $ 6,497,361 $ 6,342,084 $ 6,052,644MGM China . . . . . . . . . . . . . . . . . . . . . . . . . . . . . . . . . . . . . . . . . . . . . . . . . . . . . . . . . . 2,214,767 3,282,329 3,316,928
Reportable segment net revenues . . . . . . . . . . . . . . . . . . . . . . . . . . . . . . . . 8,712,128 9,624,413 9,369,572Corporate and other . . . . . . . . . . . . . . . . . . . . . . . . . . . . . . . . . . . . . . . . . . . . . . . . . . 477,940 457,571 440,091
$ 9,190,068 $ 10,081,984 $ 9,809,663
Adjusted Property EBITDAWholly owned domestic resorts . . . . . . . . . . . . . . . . . . . . . . . . . . . . . . . . . . . . . $ 1,689,966 $ 1,518,307 $ 1,442,686MGM China . . . . . . . . . . . . . . . . . . . . . . . . . . . . . . . . . . . . . . . . . . . . . . . . . . . . . . . . . . 539,881 850,471 814,109
Reportable segment Adjusted Property EBITDA .. . . . . . . . . . . . . 2,229,847 2,368,778 2,256,795
Other operating income (expense)Corporate, unconsolidated affiliates and other, net . . . . . . . . . . . . . . . . 9,073 (149,216) (132,214)Preopening and start-up expenses . . . . . . . . . . . . . . . . . . . . . . . . . . . . . . . . . . . (71,327) (39,257) (13,314)Property transactions, net . . . . . . . . . . . . . . . . . . . . . . . . . . . . . . . . . . . . . . . . . . . . (1,503,942) (41,002) (124,761)Depreciation and amortization . . . . . . . . . . . . . . . . . . . . . . . . . . . . . . . . . . . . . . (819,883) (815,765) (849,225)
Operating income (loss) . . . . . . . . . . . . . . . . . . . . . . . . . . . . . . . . . . . . . . . . . . (156,232) 1,323,538 1,137,281
Non-operating income (expense)Interest expense, net of amounts capitalized . . . . . . . . . . . . . . . . . . . . . . . (797,579) (817,061) (857,347)Non-operating items from unconsolidated affiliates . . . . . . . . . . . . . . (76,462) (87,794) (208,682)Other, net . . . . . . . . . . . . . . . . . . . . . . . . . . . . . . . . . . . . . . . . . . . . . . . . . . . . . . . . . . . . . (15,970) (7,797) (9,062)
(890,011) (912,652) (1,075,091)
Income (loss) before income taxes . . . . . . . . . . . . . . . . . . . . . . . . . . . . . . . . . . . (1,046,243) 410,886 62,190Benefit (provision) for income taxes . . . . . . . . . . . . . . . . . . . . . . . . . . . . . . . 6,594 (283,708) (20,816)
Net income (loss) . . . . . . . . . . . . . . . . . . . . . . . . . . . . . . . . . . . . . . . . . . . . . . . . . . . . . . . (1,039,649) 127,178 41,374Less: Net (income) loss attributable to noncontrolling
interests . . . . . . . . . . . . . . . . . . . . . . . . . . . . . . . . . . . . . . . . . . . . . . . . . . . . . . . . . . . . 591,929 (277,051) (213,108)
Net loss attributable to MGM Resorts International . . . . . . . . . . . . . $ (447,720) $ (149,873) $ (171,734)
71

December 31,
2015 2014(In thousands)
Total assets:Wholly owned domestic resorts . . . . . . . . . . . . . . . . . . . . . . . . . . . . . . . . . . . . . . . . . . . . . . . . . . . . . . . . . . . $ 13,261,882 $ 13,234,233MGM China . . . . . . . . . . . . . . . . . . . . . . . . . . . . . . . . . . . . . . . . . . . . . . . . . . . . . . . . . . . . . . . . . . . . . . . . . . . . . . . . . 7,895,376 8,836,856
Reportable segment total assets . . . . . . . . . . . . . . . . . . . . . . . . . . . . . . . . . . . . . . . . . . . . . . . . . . . . . . . . . 21,157,258 22,071,089Corporate and other . . . . . . . . . . . . . . . . . . . . . . . . . . . . . . . . . . . . . . . . . . . . . . . . . . . . . . . . . . . . . . . . . . . . . . . . . 4,099,837 4,545,448Eliminated in consolidation . . . . . . . . . . . . . . . . . . . . . . . . . . . . . . . . . . . . . . . . . . . . . . . . . . . . . . . . . . . . . . . . (41,917) (22,623)
$ 25,215,178 $ 26,593,914
December 31,
2015 2014(In thousands)
Property and equipment, net:Wholly owned domestic resorts . . . . . . . . . . . . . . . . . . . . . . . . . . . . . . . . . . . . . . . . . . . . . . . . . . . . . . . . . . . $ 11,853,802 $ 11,933,559MGM China . . . . . . . . . . . . . . . . . . . . . . . . . . . . . . . . . . . . . . . . . . . . . . . . . . . . . . . . . . . . . . . . . . . . . . . . . . . . . . . . . 1,896,815 1,323,432
Reportable segment property and equipment, net . . . . . . . . . . . . . . . . . . . . . . . . . . . . . . . . . . . . . 13,750,617 13,256,991Corporate and other . . . . . . . . . . . . . . . . . . . . . . . . . . . . . . . . . . . . . . . . . . . . . . . . . . . . . . . . . . . . . . . . . . . . . . . . . 1,663,095 1,207,174Eliminated in consolidation . . . . . . . . . . . . . . . . . . . . . . . . . . . . . . . . . . . . . . . . . . . . . . . . . . . . . . . . . . . . . . . . (41,917) (22,623)
$ 15,371,795 $ 14,441,542
Year Ended December 31,
2015 2014 2013
(In thousands)Capital expenditures:
Wholly owned domestic resorts . . . . . . . . . . . . . . . . . . . . . . . . . . . . . . . . . . . . . $ 383,367 $ 292,463 $ 216,147MGM China . . . . . . . . . . . . . . . . . . . . . . . . . . . . . . . . . . . . . . . . . . . . . . . . . . . . . . . . . . 590,968 347,338 254,516
Reportable segment capital expenditures . . . . . . . . . . . . . . . . . . . . . . . . 974,335 639,801 470,663Corporate and other . . . . . . . . . . . . . . . . . . . . . . . . . . . . . . . . . . . . . . . . . . . . . . . . . . 504,398 233,173 107,442Eliminated in consolidation . . . . . . . . . . . . . . . . . . . . . . . . . . . . . . . . . . . . . . . . . (11,914) (933) (15,981)
$ 1,466,819 $ 872,041 $ 562,124
NOTE 17 — RELATED PARTY TRANSACTIONS
CityCenter
Management agreements. The Company and CityCenter have entered into agreements whereby theCompany is responsible for management of the operations of CityCenter for a fee of 2% of revenue and 5% ofEBITDA (as defined) for Aria and Vdara and $3 million per year for Crystals. The Company earned fees of $41million, $38 million and $38 million for the years ended December 31, 2015, 2014 and 2013. The Company isbeing reimbursed for certain costs in performing its development and management services. During the yearsended December 31, 2015, 2014 and 2013 the Company incurred $393 million, $380 million and $364 million,respectively, of costs reimbursable by CityCenter, primarily for employee compensation and certain allocatedcosts. As of December 31, 2015 and 2014, CityCenter owed the Company $55 million and $45 million,respectively, for management services and reimbursable costs recorded in “Accounts receivable, net” in theaccompanying consolidated balance sheets.
Other agreements. The Company entered into an agreement with CityCenter whereby the Companyprovides CityCenter the use of its aircraft on a time sharing basis. CityCenter is charged a rate that is based onFederal Aviation Administration regulations, which provides for reimbursement for specific costs incurred by theCompany. For the years ended December 31, 2015, 2014 and 2013, the Company was reimbursed $2 million, $3
72

million, $3 million, respectively, for aircraft related expenses. The Company has certain other arrangements withCityCenter for the provision of certain shared services, reimbursement of costs and other transactions undertakenin the ordinary course of business.
MGM China
Ms. Pansy Ho is member of the Board of Directors of, and holds a minority ownership interest in, MGMChina. Ms. Pansy Ho is also the managing director of Shun Tak Holdings Limited (together with its subsidiaries“Shun Tak”), a leading conglomerate in Hong Kong with core businesses in transportation, property, hospitalityand investments. Shun Tak provides various services and products, including ferry tickets, travel products, rentalof hotel rooms, laundry services, advertising services and property cleaning services to MGM China and MGMChina provides rental of hotel rooms at wholesale room rates to Shun Tak and receives rebates for ferry ticketsfrom Shun Tak. MGM China incurred expenses of $16 million, $28 million and $18 million for the years endedDecember 31, 2015, 2014 and 2013, respectively. MGM China recorded revenue of less than $1 million relatedto hotel rooms provided to Shun Tak for the years ended December 31, 2015, 2014 and 2013, respectively. As ofDecember 31, 2015 and 2014, MGM China did not have a material payable to or receivable from Shun Tak.
MGM Branding and Development Holdings, Ltd., (together with its subsidiary MGM DevelopmentServices, Ltd, “MGM Branding and Development”), an entity included in the Company’s consolidated financialstatements in which Ms. Pansy Ho indirectly holds a noncontrolling interest, entered into a brand licenseagreement with MGM China. MGM China pays a license fee to MGM Branding and Development equal to1.75% of MGM Macau’s consolidated net revenue, subject to a 2015 annual cap of $52 million with a20% increase per annum for each subsequent calendar year during the term of the agreement. During the yearsended December 31, 2015, 2014 and 2013, MGM China incurred total license fees of $39 million, $43 millionand $36 million, respectively. Such amounts have been eliminated in consolidation.
MGM China entered into a development services agreement with MGM Branding and Development toprovide certain development services to MGM China in connection with future expansion of existing projectsand development of future resort gaming projects. Such services are subject to a development fee which iscalculated separately for each resort casino property upon commencement of development. For each suchproperty, the fee is 2.625% of project costs, to be paid in installments as certain benchmarks are achieved. Projectcosts are the total costs incurred for the design, development and construction of the casino, casino hotel,integrated resort and other related sites associated with each project, including costs of construction, fixtures andfittings, signage, gaming and other supplies and equipment and all costs associated with the opening of thebusiness to be conducted at each project but excluding the cost of land and gaming concessions and financingcosts. The development fee is subject to an annual cap of $27 million in 2015, which will increase by 10% perannum for each year during the term of the agreement. For the years ended December 31, 2015 and 2013, MGMChina incurred $10 million and $15 million of fees, respectively, to MGM Branding and Development related todevelopment services. Such amount is eliminated in consolidation. No fee was paid for the year endedDecember 31, 2014.
An entity owned by Ms. Pansy Ho received distributions of $15 million, $13 million and $18 million duringthe years ended December 31, 2015, 2014 and 2013, respectively, in connection with the ownership of anoncontrolling interest in MGM Branding and Development Holdings, Ltd.
T-Mobile Arena
The Las Vegas Arena Company leases the land underlying the T-Mobile Arena from the Company under a50 year operating lease, which commences upon the opening of the Arena. In conjunction with Las Vegas ArenaCompany obtaining financing and beginning construction in 2014, the Company began accruing rental income.For the years ended December 31, 2015 and 2014, the Company recorded accrued income of $3 million and $1million, respectively, for the T-Mobile Arena ground lease.
73

NOTE 18 — CONSOLIDATING CONDENSED FINANCIAL INFORMATION
All of the Company’s principal debt arrangements are guaranteed by each of its material domestic subsidiaries,other than MGM Grand Detroit, LLC (which is a co-borrower under the Company’s senior credit facility), MGMNational Harbor, LLC and Blue Tarp reDevelopment, LLC (the company that will own and operate the Company’sproposed casino in Springfield, Massachusetts), and each of their respective subsidiaries. The Company’s internationalsubsidiaries, including MGM China and its subsidiaries, are not guarantors of such indebtedness. Separate condensedfinancial statement information for the subsidiary guarantors and non-guarantors as of December 31, 2015 and 2014and for the years ended December 31, 2015, 2014 and 2013, are presented below. Within the Condensed ConsolidatingStatements of Cash Flows for the periods ending December 31, 2015 and 2014, the Company has presented netchanges in intercompany accounts as investing activities if the applicable entities have a net asset in intercompanyaccounts, and as a financing activity if the applicable entities have a net intercompany liability balance.
CONDENSED CONSOLIDATING BALANCE SHEET INFORMATION
December 31, 2015
ParentGuarantor
SubsidiariesNon-Guarantor
Subsidiaries Elimination Consolidated
(In thousands)Current assets . . . . . . . . . . . . . . . . . . . . . . . . . . . . . . . . . . . . . . . . . . . . . $ 561,310 $ 932,374 $ 915,979 $ (914) $ 2,408,749Property and equipment, net . . . . . . . . . . . . . . . . . . . . . . . . . . . . . - 12,364,382 3,019,384 (11,971) 15,371,795Investments in subsidiaries . . . . . . . . . . . . . . . . . . . . . . . . . . . . . . 20,226,258 2,956,404 - (23,182,662) -Investments in and advances to unconsolidated
affiliates . . . . . . . . . . . . . . . . . . . . . . . . . . . . . . . . . . . . . . . . . . . . . . . . - 1,460,084 6,413 25,000 1,491,497Intercompany accounts . . . . . . . . . . . . . . . . . . . . . . . . . . . . . . . . . . . - 3,234,271 - (3,234,271) -Other non-current assets . . . . . . . . . . . . . . . . . . . . . . . . . . . . . . . . . 38,577 444,333 5,460,227 - 5,943,137
$ 20,826,145 $ 21,391,848 $ 9,402,003 $ (26,404,818) $ 25,215,178
Current liabilities . . . . . . . . . . . . . . . . . . . . . . . . . . . . . . . . . . . . . . . . . $ 536,165 $ 994,570 $ 708,130 $ (914) $ 2,237,951Intercompany accounts . . . . . . . . . . . . . . . . . . . . . . . . . . . . . . . . . . . 2,390,461 - 843,810 (3,234,271) -Deferred income taxes, net . . . . . . . . . . . . . . . . . . . . . . . . . . . . . . 2,366,443 - 314,133 - 2,680,576Long-term debt . . . . . . . . . . . . . . . . . . . . . . . . . . . . . . . . . . . . . . . . . . . 10,393,197 4,837 1,970,277 - 12,368,311Other long-term obligations . . . . . . . . . . . . . . . . . . . . . . . . . . . . . 19,952 67,212 70,499 - 157,663
Total liabilities . . . . . . . . . . . . . . . . . . . . . . . . . . . . . . . . . . . . . . . . . 15,706,218 1,066,619 3,906,849 (3,235,185) 17,444,501
Redeemable noncontrolling interests . . . . . . . . . . . . . . . . . . . - - 6,250 - 6,250
MGM Resorts International stockholders’ equity . . . . . 5,119,927 20,325,229 2,844,404 (23,169,633) 5,119,927Noncontrolling interests . . . . . . . . . . . . . . . . . . . . . . . . . . . . . . . . . - - 2,644,500 - 2,644,500
Total stockholders’ equity . . . . . . . . . . . . . . . . . . . . . . . . . . . . 5,119,927 20,325,229 5,488,904 (23,169,633) 7,764,427
$ 20,826,145 $ 21,391,848 $ 9,402,003 $ (26,404,818) $ 25,215,178
December 31, 2014
ParentGuarantor
SubsidiariesNon-Guarantor
Subsidiaries Elimination Consolidated
(In thousands)Current assets . . . . . . . . . . . . . . . . . . . . . . . . . . . . . . . . . . . . . . . . . . . . . $ 1,390,806 $ 868,688 $ 768,335 $ (669) $ 3,027,160Property and equipment, net . . . . . . . . . . . . . . . . . . . . . . . . . . . . . - 12,445,086 2,008,428 (11,972) 14,441,542Investments in subsidiaries . . . . . . . . . . . . . . . . . . . . . . . . . . . . . . 20,430,160 3,896,365 - (24,326,525) -Investments in and advances to unconsolidated
affiliates . . . . . . . . . . . . . . . . . . . . . . . . . . . . . . . . . . . . . . . . . . . . . . . . - 1,526,446 7,588 25,000 1,559,034Intercompany accounts . . . . . . . . . . . . . . . . . . . . . . . . . . . . . . . . . . . - 2,175,091 - (2,175,091) -Other non-current assets . . . . . . . . . . . . . . . . . . . . . . . . . . . . . . . . . 38,531 414,801 7,112,846 - 7,566,178
$ 21,859,497 $ 21,326,477 $ 9,897,197 $ (26,489,257) $ 26,593,914
Current liabilities . . . . . . . . . . . . . . . . . . . . . . . . . . . . . . . . . . . . . . . . . $ 1,680,319 $ 953,179 $ 775,097 $ (670) $ 3,407,925Intercompany accounts . . . . . . . . . . . . . . . . . . . . . . . . . . . . . . . . . . . 1,932,780 - 242,311 (2,175,091) -Deferred income taxes, net . . . . . . . . . . . . . . . . . . . . . . . . . . . . . . 2,312,828 - 309,032 - 2,621,860Long-term debt . . . . . . . . . . . . . . . . . . . . . . . . . . . . . . . . . . . . . . . . . . . 11,805,030 4,837 995,418 - 12,805,285Other long-term obligations . . . . . . . . . . . . . . . . . . . . . . . . . . . . . 37,623 58,016 34,931 - 130,570
Total liabilities . . . . . . . . . . . . . . . . . . . . . . . . . . . . . . . . . . . . . . . . . 17,768,580 1,016,032 2,356,789 (2,175,761) 18,965,640
MGM Resorts International stockholders’ equity . . . . . 4,090,917 20,310,445 4,003,051 (24,313,496) 4,090,917Noncontrolling interests . . . . . . . . . . . . . . . . . . . . . . . . . . . . . . . . . - - 3,537,357 - 3,537,357
Total stockholders’ equity . . . . . . . . . . . . . . . . . . . . . . . . . . . . 4,090,917 20,310,445 7,540,408 (24,313,496) 7,628,274
$ 21,859,497 $ 21,326,477 $ 9,897,197 $ (26,489,257) $ 26,593,914
74
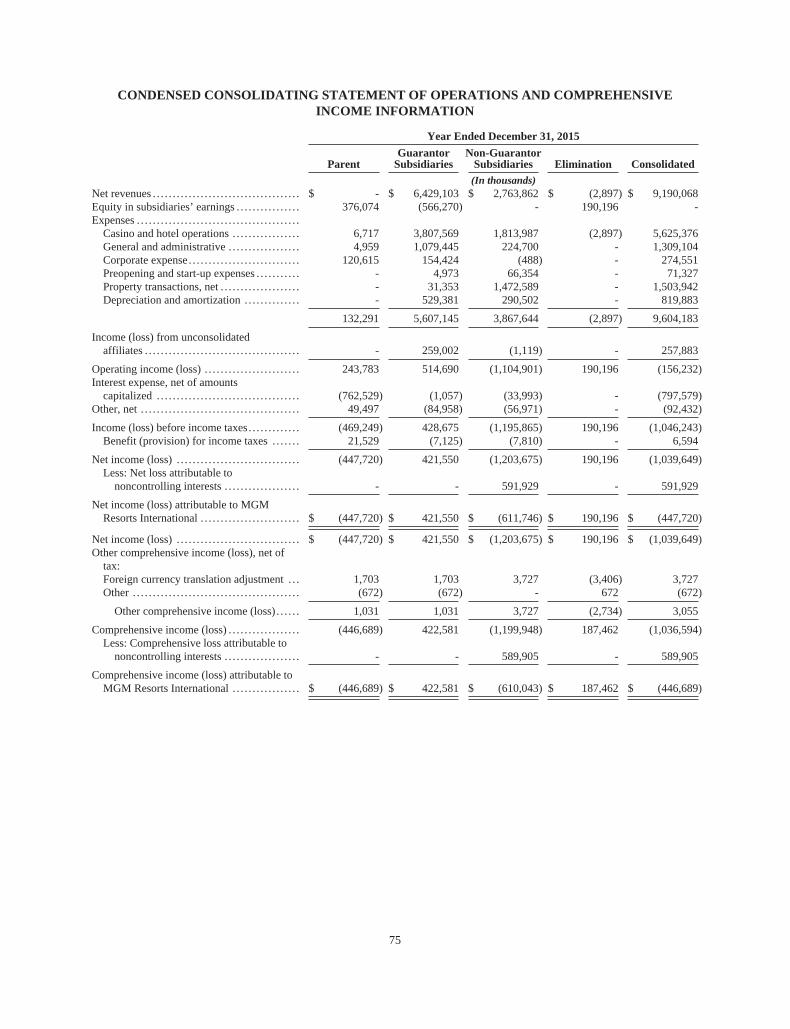
CONDENSED CONSOLIDATING STATEMENT OF OPERATIONS AND COMPREHENSIVEINCOME INFORMATION
Year Ended December 31, 2015
ParentGuarantor
SubsidiariesNon-Guarantor
Subsidiaries Elimination Consolidated
(In thousands)Net revenues . . . . . . . . . . . . . . . . . . . . . . . . . . . . . . . . . . . . . $ - $ 6,429,103 $ 2,763,862 $ (2,897) $ 9,190,068Equity in subsidiaries’ earnings . . . . . . . . . . . . . . . . 376,074 (566,270) - 190,196 -Expenses . . . . . . . . . . . . . . . . . . . . . . . . . . . . . . . . . . . . . . . . .
Casino and hotel operations . . . . . . . . . . . . . . . . . 6,717 3,807,569 1,813,987 (2,897) 5,625,376General and administrative . . . . . . . . . . . . . . . . . . 4,959 1,079,445 224,700 - 1,309,104Corporate expense. . . . . . . . . . . . . . . . . . . . . . . . . . . . 120,615 154,424 (488) - 274,551Preopening and start-up expenses . . . . . . . . . . . - 4,973 66,354 - 71,327Property transactions, net . . . . . . . . . . . . . . . . . . . . - 31,353 1,472,589 - 1,503,942Depreciation and amortization . . . . . . . . . . . . . . - 529,381 290,502 - 819,883
132,291 5,607,145 3,867,644 (2,897) 9,604,183
Income (loss) from unconsolidatedaffiliates . . . . . . . . . . . . . . . . . . . . . . . . . . . . . . . . . . . . . . . - 259,002 (1,119) - 257,883
Operating income (loss) . . . . . . . . . . . . . . . . . . . . . . . . 243,783 514,690 (1,104,901) 190,196 (156,232)Interest expense, net of amounts
capitalized . . . . . . . . . . . . . . . . . . . . . . . . . . . . . . . . . . . . (762,529) (1,057) (33,993) - (797,579)Other, net . . . . . . . . . . . . . . . . . . . . . . . . . . . . . . . . . . . . . . . . 49,497 (84,958) (56,971) - (92,432)
Income (loss) before income taxes. . . . . . . . . . . . . (469,249) 428,675 (1,195,865) 190,196 (1,046,243)Benefit (provision) for income taxes . . . . . . . 21,529 (7,125) (7,810) - 6,594
Net income (loss) . . . . . . . . . . . . . . . . . . . . . . . . . . . . . . . (447,720) 421,550 (1,203,675) 190,196 (1,039,649)Less: Net loss attributable to
noncontrolling interests . . . . . . . . . . . . . . . . . . . - - 591,929 - 591,929
Net income (loss) attributable to MGMResorts International . . . . . . . . . . . . . . . . . . . . . . . . . $ (447,720) $ 421,550 $ (611,746) $ 190,196 $ (447,720)
Net income (loss) . . . . . . . . . . . . . . . . . . . . . . . . . . . . . . . $ (447,720) $ 421,550 $ (1,203,675) $ 190,196 $ (1,039,649)Other comprehensive income (loss), net of
tax:Foreign currency translation adjustment . . . 1,703 1,703 3,727 (3,406) 3,727Other . . . . . . . . . . . . . . . . . . . . . . . . . . . . . . . . . . . . . . . . . . (672) (672) - 672 (672)
Other comprehensive income (loss) . . . . . . 1,031 1,031 3,727 (2,734) 3,055
Comprehensive income (loss) . . . . . . . . . . . . . . . . . . (446,689) 422,581 (1,199,948) 187,462 (1,036,594)Less: Comprehensive loss attributable to
noncontrolling interests . . . . . . . . . . . . . . . . . . . - - 589,905 - 589,905
Comprehensive income (loss) attributable toMGM Resorts International . . . . . . . . . . . . . . . . . $ (446,689) $ 422,581 $ (610,043) $ 187,462 $ (446,689)
75
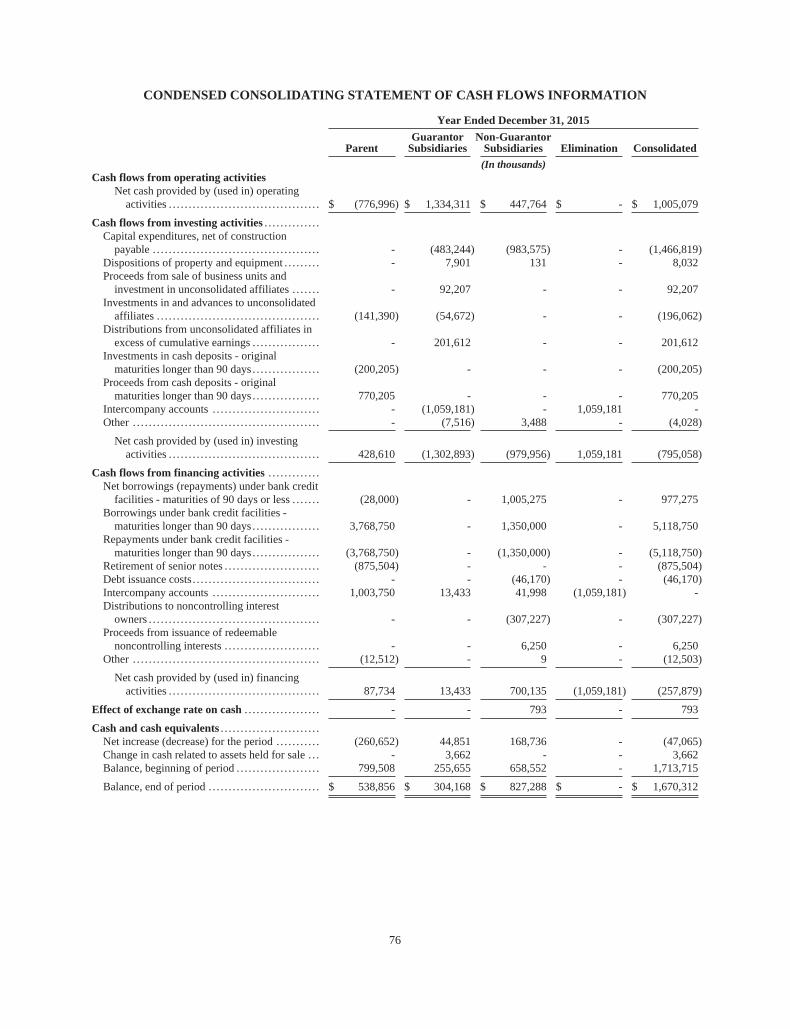
CONDENSED CONSOLIDATING STATEMENT OF CASH FLOWS INFORMATION
Year Ended December 31, 2015
ParentGuarantor
SubsidiariesNon-Guarantor
Subsidiaries Elimination Consolidated
(In thousands)Cash flows from operating activities
Net cash provided by (used in) operatingactivities . . . . . . . . . . . . . . . . . . . . . . . . . . . . . . . . . . . . . . $ (776,996) $ 1,334,311 $ 447,764 $ - $ 1,005,079
Cash flows from investing activities . . . . . . . . . . . . . .Capital expenditures, net of construction
payable . . . . . . . . . . . . . . . . . . . . . . . . . . . . . . . . . . . . . . . . . . - (483,244) (983,575) - (1,466,819)Dispositions of property and equipment . . . . . . . . . - 7,901 131 - 8,032Proceeds from sale of business units and
investment in unconsolidated affiliates . . . . . . . - 92,207 - - 92,207Investments in and advances to unconsolidated
affiliates . . . . . . . . . . . . . . . . . . . . . . . . . . . . . . . . . . . . . . . . . (141,390) (54,672) - - (196,062)Distributions from unconsolidated affiliates in
excess of cumulative earnings . . . . . . . . . . . . . . . . . - 201,612 - - 201,612Investments in cash deposits - original
maturities longer than 90 days . . . . . . . . . . . . . . . . . (200,205) - - - (200,205)Proceeds from cash deposits - original
maturities longer than 90 days . . . . . . . . . . . . . . . . . 770,205 - - - 770,205Intercompany accounts . . . . . . . . . . . . . . . . . . . . . . . . . . . - (1,059,181) - 1,059,181 -Other . . . . . . . . . . . . . . . . . . . . . . . . . . . . . . . . . . . . . . . . . . . . . . . - (7,516) 3,488 - (4,028)
Net cash provided by (used in) investingactivities . . . . . . . . . . . . . . . . . . . . . . . . . . . . . . . . . . . . . . 428,610 (1,302,893) (979,956) 1,059,181 (795,058)
Cash flows from financing activities . . . . . . . . . . . . .Net borrowings (repayments) under bank credit
facilities - maturities of 90 days or less . . . . . . . (28,000) - 1,005,275 - 977,275Borrowings under bank credit facilities -
maturities longer than 90 days . . . . . . . . . . . . . . . . . 3,768,750 - 1,350,000 - 5,118,750Repayments under bank credit facilities -
maturities longer than 90 days . . . . . . . . . . . . . . . . . (3,768,750) - (1,350,000) - (5,118,750)Retirement of senior notes . . . . . . . . . . . . . . . . . . . . . . . . (875,504) - - - (875,504)Debt issuance costs . . . . . . . . . . . . . . . . . . . . . . . . . . . . . . . . - - (46,170) - (46,170)Intercompany accounts . . . . . . . . . . . . . . . . . . . . . . . . . . . 1,003,750 13,433 41,998 (1,059,181) -Distributions to noncontrolling interest
owners . . . . . . . . . . . . . . . . . . . . . . . . . . . . . . . . . . . . . . . . . . . - - (307,227) - (307,227)Proceeds from issuance of redeemable
noncontrolling interests . . . . . . . . . . . . . . . . . . . . . . . . - - 6,250 - 6,250Other . . . . . . . . . . . . . . . . . . . . . . . . . . . . . . . . . . . . . . . . . . . . . . . (12,512) - 9 - (12,503)
Net cash provided by (used in) financingactivities . . . . . . . . . . . . . . . . . . . . . . . . . . . . . . . . . . . . . . 87,734 13,433 700,135 (1,059,181) (257,879)
Effect of exchange rate on cash . . . . . . . . . . . . . . . . . . . - - 793 - 793
Cash and cash equivalents . . . . . . . . . . . . . . . . . . . . . . . . .Net increase (decrease) for the period . . . . . . . . . . . (260,652) 44,851 168,736 - (47,065)Change in cash related to assets held for sale . . . - 3,662 - - 3,662Balance, beginning of period . . . . . . . . . . . . . . . . . . . . . 799,508 255,655 658,552 - 1,713,715
Balance, end of period . . . . . . . . . . . . . . . . . . . . . . . . . . . . $ 538,856 $ 304,168 $ 827,288 $ - $ 1,670,312
76

CONDENSED CONSOLIDATING STATEMENT OF OPERATIONS AND COMPREHENSIVEINCOME INFORMATION
Year Ended December 31, 2014
ParentGuarantor
SubsidiariesNon-Guarantor
Subsidiaries Elimination Consolidated
(In thousands)Net revenues . . . . . . . . . . . . . . . . . . . . . . . . . . . . . . . . . . . . . . . . . . $ - $ 6,270,708 $ 3,813,736 $ (2,460) $ 10,081,984Equity in subsidiaries’ earnings . . . . . . . . . . . . . . . . . . . . . 938,712 339,312 - (1,278,024) -Expenses
Casino and hotel operations . . . . . . . . . . . . . . . . . . . . . . 5,482 3,810,711 2,554,965 (2,460) 6,368,698General and administrative . . . . . . . . . . . . . . . . . . . . . . . 4,743 1,089,192 224,814 - 1,318,749Corporate expense. . . . . . . . . . . . . . . . . . . . . . . . . . . . . . . . . 72,116 150,938 15,757 - 238,811Preopening and start-up expenses . . . . . . . . . . . . . . . . - 5,384 33,873 - 39,257Property transactions, net . . . . . . . . . . . . . . . . . . . . . . . . . - 36,612 4,390 - 41,002Depreciation and amortization . . . . . . . . . . . . . . . . . . . - 500,401 315,364 - 815,765
82,341 5,593,238 3,149,163 (2,460) 8,822,282
Income (loss) from unconsolidated affiliates . . . . . . - 64,014 (178) - 63,836
Operating income (loss) . . . . . . . . . . . . . . . . . . . . . . . . . . . . . 856,371 1,080,796 664,395 (1,278,024) 1,323,538Interest expense, net of amounts capitalized . . . . . . . (794,826) (574) (21,661) - (817,061)Other, net . . . . . . . . . . . . . . . . . . . . . . . . . . . . . . . . . . . . . . . . . . . . . 50,793 (90,679) (55,705) - (95,591)
Income (loss) before income taxes. . . . . . . . . . . . . . . . . . 112,338 989,543 587,029 (1,278,024) 410,886Provision for income taxes . . . . . . . . . . . . . . . . . . . . . . . (262,211) (20,735) (762) - (283,708)
Net income (loss) . . . . . . . . . . . . . . . . . . . . . . . . . . . . . . . . . . . . (149,873) 968,808 586,267 (1,278,024) 127,178Less: Net income attributable to noncontrolling
interests . . . . . . . . . . . . . . . . . . . . . . . . . . . . . . . . . . . . . . . . . - - (277,051) - (277,051)
Net income (loss) attributable to MGM ResortsInternational . . . . . . . . . . . . . . . . . . . . . . . . . . . . . . . . . . . . . . . $ (149,873) $ 968,808 $ 309,216 $ (1,278,024) $ (149,873)
Net income (loss) . . . . . . . . . . . . . . . . . . . . . . . . . . . . . . . . . . . . $ (149,873) $ 968,808 $ 586,267 $ (1,278,024) $ 127,178Other comprehensive income (loss), net of tax:
Foreign currency translation adjustment . . . . . . . . (762) (762) (1,293) 1,524 (1,293)Other . . . . . . . . . . . . . . . . . . . . . . . . . . . . . . . . . . . . . . . . . . . . . . . 1,250 1,250 - (1,250) 1,250
Other comprehensive income (loss) . . . . . . . . . . . 488 488 (1,293) 274 (43)
Comprehensive income (loss) . . . . . . . . . . . . . . . . . . . . . . . (149,385) 969,296 584,974 (1,277,750) 127,135Less: Comprehensive income attributable to
noncontrolling interests . . . . . . . . . . . . . . . . . . . . . . . . - - (276,520) - (276,520)
Comprehensive income (loss) attributable toMGM Resorts International . . . . . . . . . . . . . . . . . . . . . . $ (149,385) $ 969,296 $ 308,454 $ (1,277,750) $ (149,385)
77

CONDENSED CONSOLIDATING STATEMENT OF CASH FLOWS INFORMATION
Year Ended December 31, 2014
ParentGuarantor
Subsidiaries
Non-Guarantor
Subsidiaries Elimination Consolidated
(In thousands)Cash flows from operating activities
Net cash provided by (used in) operatingactivities . . . . . . . . . . . . . . . . . . . . . . . . . . . . . . . . . . . . . . $ (718,756) $ 1,121,013 $ 703,413 $ 25,000 $ 1,130,670
Cash flows from investing activitiesCapital expenditures, net of construction
payable . . . . . . . . . . . . . . . . . . . . . . . . . . . . . . . . . . . . . . . . . . - (375,719) (496,322) - (872,041)Dispositions of property and equipment . . . . . . . . . - 6,631 1,020 - 7,651Investments in and advances to unconsolidated
affiliates . . . . . . . . . . . . . . . . . . . . . . . . . . . . . . . . . . . . . . . . . (31,400) (46,640) - (25,000) (103,040)Distributions from unconsolidated affiliates in
excess of cumulative earnings . . . . . . . . . . . . . . . . . - 132 - - 132Investments in treasury securities - maturities
longer than 90 days . . . . . . . . . . . . . . . . . . . . . . . . . . . . . - (123,133) - - (123,133)Proceeds from treasury securities - maturities
longer than 90 days . . . . . . . . . . . . . . . . . . . . . . . . . . . . . - 210,300 - - 210,300Investments in cash deposits - original
maturities longer than 90 days . . . . . . . . . . . . . . . . . (570,000) - - - (570,000)Intercompany accounts . . . . . . . . . . . . . . . . . . . . . . . . . . . - (704,785) - 704,785 -Payments for gaming licenses . . . . . . . . . . . . . . . . . . . . - - (85,000) - (85,000)Other . . . . . . . . . . . . . . . . . . . . . . . . . . . . . . . . . . . . . . . . . . . . . . . - 10,981 - - 10,981
Net cash provided by (used in) investingactivities . . . . . . . . . . . . . . . . . . . . . . . . . . . . . . . . . . . . . . (601,400) (1,022,233) (580,302) 679,785 (1,524,150)
Cash flows from financing activitiesNet repayments under bank credit facilities -
maturities of 90 days or less . . . . . . . . . . . . . . . . . . . (28,000) - - - (28,000)Borrowings under bank credit facilities -
maturities longer than 90 days . . . . . . . . . . . . . . . . . 3,821,250 - 1,350,000 - 5,171,250Repayments under bank credit facilities -
maturities longer than 90 days . . . . . . . . . . . . . . . . . (3,821,250) - (1,350,000) - (5,171,250)Issuance of senior notes . . . . . . . . . . . . . . . . . . . . . . . . . . . 1,250,750 - - - 1,250,750Retirement of senior notes . . . . . . . . . . . . . . . . . . . . . . . . (508,900) - - - (508,900)Debt issuance costs . . . . . . . . . . . . . . . . . . . . . . . . . . . . . . . . (13,681) - - - (13,681)Intercompany accounts . . . . . . . . . . . . . . . . . . . . . . . . . . . 1,045,048 (76,117) (264,146) (704,785) -Distributions to noncontrolling interest
owners . . . . . . . . . . . . . . . . . . . . . . . . . . . . . . . . . . . . . . . . . . . - - (386,709) - (386,709)Other . . . . . . . . . . . . . . . . . . . . . . . . . . . . . . . . . . . . . . . . . . . . . . . (4,213) (803) (367) - (5,383)
Net cash provided by (used in) financingactivities . . . . . . . . . . . . . . . . . . . . . . . . . . . . . . . . . . . . . . 1,741,004 (76,920) (651,222) (704,785) 308,077
Effect of exchange rate on cash . . . . . . . . . . . . . . . . . . . - - (889) - (889)
Cash and cash equivalentsNet increase (decrease) for the period . . . . . . . . . . . 420,848 21,860 (529,000) - (86,292)Change in cash related to assets held for sale . . . - (3,662) - - (3,662)Balance, beginning of period . . . . . . . . . . . . . . . . . . . . . 378,660 237,457 1,187,552 - 1,803,669
Balance, end of period . . . . . . . . . . . . . . . . . . . . . . . . . . . . . . . $ 799,508 $ 255,655 $ 658,552 $ - $ 1,713,715
78

CONDENSED CONSOLIDATING STATEMENT OF OPERATIONS AND COMPREHENSIVEINCOME INFORMATION
Year Ended December 31, 2013
ParentGuarantor
Subsidiaries
Non-Guarantor
Subsidiaries Elimination Consolidated
(In thousands)Net revenues . . . . . . . . . . . . . . . . . . . . . . . . . . . . . . . . . . . . . . . . $ - $ 5,955,001 $ 3,856,728 $ (2,066) $ 9,809,663Equity in subsidiaries’ earnings . . . . . . . . . . . . . . . . . . . 638,030 289,384 - (927,414) -Expenses . . . . . . . . . . . . . . . . . . . . . . . . . . . . . . . . . . . . . . . . . . . .
Casino and hotel operations . . . . . . . . . . . . . . . . . . . . 5,644 3,622,940 2,632,198 (2,066) 6,258,716General and administrative . . . . . . . . . . . . . . . . . . . . . 4,432 1,051,757 222,261 - 1,278,450Corporate expense . . . . . . . . . . . . . . . . . . . . . . . . . . . . . . . 66,307 125,500 41,938 (17,000) 216,745Preopening and start-up expenses . . . . . . . . . . . . . . - 4,205 9,109 - 13,314Property transactions, net . . . . . . . . . . . . . . . . . . . . . . . - 126,773 (2,012) - 124,761Depreciation and amortization . . . . . . . . . . . . . . . . . . - 522,900 326,325 - 849,225
76,383 5,454,075 3,229,819 (19,066) 8,741,211
Income from unconsolidated affiliates . . . . . . . . . . . . - 68,807 22 - 68,829
Operating income (loss) . . . . . . . . . . . . . . . . . . . . . . . . . . . 561,647 859,117 626,931 (910,414) 1,137,281Interest expense, net of amounts capitalized . . . . . (805,933) (6,333) (45,081) - (857,347)Other, net . . . . . . . . . . . . . . . . . . . . . . . . . . . . . . . . . . . . . . . . . . . . 39,524 (212,065) (45,203) - (217,744)
Income (loss) before income taxes . . . . . . . . . . . . . . . . (204,762) 640,719 536,647 (910,414) 62,190Benefit (provision) for income taxes . . . . . . . . . . . 33,028 11,111 (64,955) - (20,816)
Net income (loss) . . . . . . . . . . . . . . . . . . . . . . . . . . . . . . . . . . . (171,734) 651,830 471,692 (910,414) 41,374Less: Net income attributable to
noncontrolling interests . . . . . . . . . . . . . . . . . . . . . . - - (213,108) - (213,108)
Net income (loss) attributable to MGM ResortsInternational . . . . . . . . . . . . . . . . . . . . . . . . . . . . . . . . . . . . . . $ (171,734) $ 651,830 $ 258,584 $ (910,414) $ (171,734)
Net income (loss) . . . . . . . . . . . . . . . . . . . . . . . . . . . . . . . . . . . $ (171,734) $ 651,830 $ 471,692 $ (910,414) $ 41,374Other comprehensive income (loss), net of tax:
Foreign currency translation adjustment . . . . . . . (1,915) (1,915) (3,993) 3,830 (3,993)Other . . . . . . . . . . . . . . . . . . . . . . . . . . . . . . . . . . . . . . . . . . . . . . 115 115 - (115) 115
Other comprehensive income (loss) . . . . . . . . . (1,800) (1,800) (3,993) 3,715 (3,878)
Comprehensive income (loss) . . . . . . . . . . . . . . . . . . . . . (173,534) 650,030 467,699 (906,699) 37,496Less: Comprehensive income attributable to
noncontrolling interests . . . . . . . . . . . . . . . . . . . . . . - - (211,030) - (211,030)
Comprehensive income (loss) attributable toMGM Resorts International . . . . . . . . . . . . . . . . . . . . . $ (173,534) $ 650,030 $ 256,669 $ (906,699) $ (173,534)
79

CONDENSED CONSOLIDATING STATEMENT OF CASH FLOWS INFORMATION
Year Ended December 31, 2013
ParentGuarantor
Subsidiaries
Non-Guarantor
Subsidiaries Elimination Consolidated
(In thousands)Cash flows from operating activities
Net cash provided by (used in) operatingactivities . . . . . . . . . . . . . . . . . . . . . . . . . . . . . . . . . . . . . . . . $ (819,282) $ 1,089,341 $ 1,040,389 $ - $ 1,310,448
Cash flows from investing activitiesCapital expenditures, net of construction
payable . . . . . . . . . . . . . . . . . . . . . . . . . . . . . . . . . . . . . . . . . . . . - (311,635) (250,489) - (562,124)Dispositions of property and equipment . . . . . . . . . . . - 11,648 6,382 - 18,030Investments in and advances to unconsolidated
affiliates . . . . . . . . . . . . . . . . . . . . . . . . . . . . . . . . . . . . . . . . . . . (23,600) (5,353) - - (28,953)Distributions from unconsolidated affiliates in
excess of cumulative earnings . . . . . . . . . . . . . . . . . . . - 110 - - 110Investments in treasury securities - maturities
longer than 90 days . . . . . . . . . . . . . . . . . . . . . . . . . . . . . . . - (219,546) - - (219,546)Proceeds from treasury securities - maturities
longer than 90 days . . . . . . . . . . . . . . . . . . . . . . . . . . . . . . . - 252,592 - - 252,592Payments for gaming licenses . . . . . . . . . . . . . . . . . . . . . . - - (21,600) - (21,600)Other . . . . . . . . . . . . . . . . . . . . . . . . . . . . . . . . . . . . . . . . . . . . . . . . . - 1,354 - - 1,354
Net cash used in investing activities . . . . . . . . . . . . (23,600) (270,830) (265,707) - (560,137)
Cash flows from financing activitiesNet repayments under bank credit facilities -
maturities of 90 days or less . . . . . . . . . . . . . . . . . . . . . (28,000) - - - (28,000)Borrowings under bank credit facilities -
maturities longer than 90 days . . . . . . . . . . . . . . . . . . . 2,343,000 - 450,000 - 2,793,000Repayments under bank credit facilities -
maturities longer than 90 days . . . . . . . . . . . . . . . . . . . (2,343,000) - (450,000) - (2,793,000)Issuance of senior notes . . . . . . . . . . . . . . . . . . . . . . . . . . . . . 500,000 - - - 500,000Retirement of senior notes . . . . . . . . . . . . . . . . . . . . . . . . . . (462,226) (150,036) - - (612,262)Debt issuance costs . . . . . . . . . . . . . . . . . . . . . . . . . . . . . . . . . . (23,576) - - - (23,576)Intercompany accounts . . . . . . . . . . . . . . . . . . . . . . . . . . . . . 985,465 (657,260) (328,205) - -Distributions to noncontrolling interest owners . . . - - (318,348) - (318,348)Other . . . . . . . . . . . . . . . . . . . . . . . . . . . . . . . . . . . . . . . . . . . . . . . . . (4,506) - (3,016) - (7,522)
Net cash provided by (used in) financingactivities . . . . . . . . . . . . . . . . . . . . . . . . . . . . . . . . . . . . . . . . 967,157 (807,296) (649,569) - (489,708)
Effect of exchange rate on cash - - (443) - (443)
Cash and cash equivalentsNet increase for the period. . . . . . . . . . . . . . . . . . . . . . . . . . 124,275 11,215 124,670 - 260,160Balance, beginning of period . . . . . . . . . . . . . . . . . . . . . . . 254,385 226,242 1,062,882 - 1,543,509
Balance, end of period . . . . . . . . . . . . . . . . . . . . . . . . . . . . . . $ 378,660 $ 237,457 $ 1,187,552 $ - $ 1,803,669
80

NOTE 19 — SELECTED QUARTERLY FINANCIAL RESULTS (UNAUDITED)
Quarter
First Second Third Fourth Total
(In thousands, except per share data)2015
Net revenues . . . . . . . . . . . . . . . . . . . . . . . . . . . . . . . . . . . . . . . . . . . . . . $ 2,332,244 $ 2,385,135 $ 2,280,816 $ 2,191,873 $ 9,190,068Operating income (loss) . . . . . . . . . . . . . . . . . . . . . . . . . . . . . . . . . . 395,104 348,521 297,377 (1,197,234) (156,232)Net income (loss) . . . . . . . . . . . . . . . . . . . . . . . . . . . . . . . . . . . . . . . . . 212,646 126,467 94,735 (1,473,497) (1,039,649)Net income (loss) attributable to MGM Resorts
International . . . . . . . . . . . . . . . . . . . . . . . . . . . . . . . . . . . . . . . . . . . . 169,850 97,459 66,425 (781,454) (447,720)Basic income (loss) per share . . . . . . . . . . . . . . . . . . . . . . . . . . . . $ 0.35 $ 0.18 $ 0.12 $ (1.38) $ (0.82)Diluted income (loss) per share. . . . . . . . . . . . . . . . . . . . . . . . . . $ 0.33 $ 0.17 $ 0.12 $ (1.38) $ (0.82)
2014Net revenues . . . . . . . . . . . . . . . . . . . . . . . . . . . . . . . . . . . . . . . . . . . . . . $ 2,630,398 $ 2,581,033 $ 2,485,007 $ 2,385,546 $ 10,081,984Operating income . . . . . . . . . . . . . . . . . . . . . . . . . . . . . . . . . . . . . . . . . 416,472 354,464 286,489 266,113 1,323,538Net income (loss) . . . . . . . . . . . . . . . . . . . . . . . . . . . . . . . . . . . . . . . . . 186,100 178,168 50,382 (287,472) 127,178Net income (loss) attributable to MGM Resorts
International . . . . . . . . . . . . . . . . . . . . . . . . . . . . . . . . . . . . . . . . . . . . 102,652 110,008 (20,270) (342,263) (149,873)Basic income (loss) per share . . . . . . . . . . . . . . . . . . . . . . . . . . . . $ 0.21 $ 0.22 $ (0.04) $ (0.70) $ (0.31)Diluted income (loss) per share. . . . . . . . . . . . . . . . . . . . . . . . . . $ 0.20 $ 0.22 $ (0.04) $ (0.70) $ (0.31)
Because income (loss) per share amounts are calculated using the weighted average number of common anddilutive common equivalent shares outstanding during each quarter, the sum of the per share amounts for the fourquarters does not equal the total loss per share amounts for the year. The following sections list certain itemsaffecting comparability of quarterly and year-to-date results and related per share amounts. Additionalinformation related to these items is included elsewhere in the notes to the accompanying financial statements.
2015 certain items affecting comparability are as follows:
• First Quarter. The Company recorded an $80 million ($0.09 and $0.10 per share in the quarter and fullyear of 2015, respectively) gain for its share of CityCenter’s gain resulting from the final resolution of itsconstruction litigation and related settlements;
• Second Quarter. None;• Third Quarter. None; and• Fourth Quarter. The Company recorded a $1.5 billion ($1.33 and $1.38 loss per share in the quarter and
full year of 2015, respectively) impairment charge related to goodwill of its MGM China reporting unitand a $17 million ($0.02 loss per share in the quarter and full year of 2015) impairment charge related toits investment in Grand Victoria. The Company recorded a $23 million ($0.03 per share in the quarter andfull year of 2015) gain on sale of Circus Circus Reno, and the Company’s 50% interest in Silver Legacyand associated real property.
2014 certain items affecting comparability are as follows:
• First Quarter. None;• Second Quarter. The Company recorded an impairment charge related to its investment in Grand
Victoria of $29 million ($0.04 loss per share in the quarter and full year of 2014);• Third Quarter. None; and• Fourth Quarter. The Company recorded its 50% share of CityCenter’s Harmon – related property
transactions of $18 million ($0.02 loss per share in the quarter and full year of 2014) primarily related to asettlement charge with an insurer participating in the owner controlled insurance program for CityCenter.
81

[THIS PAGE INTENTIONALLY LEFT BLANK]

[THIS PAGE INTENTIONALLY LEFT BLANK]

[THIS PAGE INTENTIONALLY LEFT BLANK]

INVESTOR INFORMATIONThe graph below compares MGM Resorts International’s cumulative 5-Year total
shareholder return on common stock with the cumulative total returns of the
Dow Jones U.S. Total Return index and the Dow Jones U.S. Gambling index. The
graph tracks the performance of a $100 investment in our common stock and in
each index (with the reinvestment of all dividends) from 12/31/2010 to 12/31/2015.
FORM 10-K A copy of the Company’s annual report on Form 10-K, as filed with the Securities and Exchange Commission, will be furnished without charge to any stockholder upon written request to:
Mr. John M. McManus Executive Vice President – General Counsel and Secretary MGM Resorts International 3600 Las Vegas Blvd, South Las Vegas, NV 89109The stock price performance included in this graph is not necessarily indicative of future stock price performance.
12/10 12/11 12/12 12/13 12/14 12/15
MGM Resorts International 100.00 70.24 78.38 158.38 143.97 153.00
Dow Jones U.S. 100.00 101.34 117.89 156.76 177.06 178.18
Dow Jones U.S. Gambling 100.00 92.95 102.73 176.43 143.24 109.82
TRANSFER AGENT AND REGISTRAR FOR COMMON STOCK Shareholder correspondence should be mailed to: Computershare 211 Quality Circle, Suite 210 College Station, TX 77845 1.800.358.2066 Toll Free within the U.S. 1.201.680.6578 Foreign Shareholders
INDEPENDENT REGISTERED PUBLIC ACCOUNTING FIRM Deloitte & Touche LLP 3883 Howard Hughes Parkway, Suite 400 Las Vegas, NV 89169
The following table represents the high and low trading prices of the Company’s common stock.
FortheyearsendedDecember31 2015 2014
HIGH LOW HIGH LOW
First Quarter $23.25 $18.82 $28.27 $23.28
Second Quarter $22.65 $17.50 $26.43 $23.02
Third Quarter $22.77 $16.84 $26.92 $22.16
Fourth Quarter $24.41 $18.19 $23.23 $18.01
The Company’s common stock is listed on the New York Stock Exchange under the symbol “MGM.” There were approximately 3,956 record holders of our common stock as of February 24, 2016. The Company has not paid dividends on its common stock in the last three fiscal years. The Company’s current senior credit facility restricts the making of cash dividends with respect to its common stock, subject to certain exceptions. In addition, the MGM National Harbor and the MGM China credit facilities each contain limitations on their ability to pay dividends to us. Furthermore, as a holding company with no independent operations, the Company’s ability to pay dividends in the future will depend upon the receipt of dividends and other payments from its subsidiaries. The Company’s Board of Directors periodically reviews its policy with respect to dividends consistent with applicable contract and legal restrictions, and any determination to pay dividends in the future will be at the sole discretion of the Board of Directors. The Company currently intends to retain any earnings to fund the operation of its businesses, to service and repay its debt and to make strategic investments.
CAUTIONARY LANGUAGE CONCERNING FORWARD-LOOKING STATEMENTS Statements in this annual report that are not historical facts are “forward-looking” statements and “safe harbor statements” within the meaning of the Private Securities Litigation Reform Act of 1995 and other related laws that involve risks and/or uncertainties, including risks and/or uncertainties described in the Company’s public filings with the Securities and Exchange Commission. The Company has based these forward-looking statements on management’s current expectations and assumptions and not on historical facts. Examples of these statements include, but are not limited to, statements regarding the Company’s ability to generate future cash flow growth and to execute on future development and other projects, such as the Profit Growth Plan, the expected results of the Profit Growth Plan, the opening of strategic resort and other developments and the estimated costs and expected components associated with those developments, amounts the Company expects to receive as a result of MGM China and CityCenter dividends and distributions, amounts the Company expects to spend in capital expenditures and investments, the completion of the initial public offering of MGM Growth Properties and, if completed, the value realized by the Company from such transaction. Among the important factors that could cause actual results to differ materially from those indicated in such forward-looking statements include effects of economic conditions and market conditions in the markets in which the Company operates and competition with other destination travel locations throughout the United States and the world, the design, timing and costs of expansion projects, risks relating to international operations, permits, licenses, financings, approvals and other contingencies in connection with growth in new or existing jurisdictions and additional risks and uncertainties described in the Company’s Form 10-K, Form 10-Q and Form 8-K reports (including all amendments to those reports). In providing forward-looking statements, the Company is not undertaking any duty or obligation to update these statements publicly as a result of new information, future events or otherwise except as required by law.
COMMON STOCK INFORMATION
$0
$20
$40
$60
$80
$100
$120
$140
$160
$180
$200
12/10 12/11 12/12 12/13 12/14 12/15
COMPARISON OF 5-YEAR CUMULATIVE TOTAL RETURN* Among MGM Resorts International, the Dow Jones U.S. Total Return Index
and the Dow Jones U.S. Gambling Index
MGM Resorts International Dow Jones U.S. Total Return Dow Jones U.S. Gambling
*$100 invested on 12/31/10 in stock or index, including reinvestment of dividends. Fiscal year ending December 31. Copyright© 2016 Dow Jones & Co. All rights reserved.

CORPORATE INFORMATION
James J. Murren Director/Officer Chairman of the Board, Chief Executive Officer, MGM Resorts International
Robert H. Baldwin Director/Officer Chief Customer Development Officer, MGM Resorts International
William A. Bible Director
Mary Chris Gay Director
William W. Grounds Director President, Infinity World Development Corp, a private investment entity
Willie D. Davis Director Emeritus
William J. Hornbuckle President
Corey I. Sanders Chief Operating Officer
Daniel J. D’Arrigo Executive Vice President, Chief Financial Officer and Treasurer
MGM Resorts International 3600 Las Vegas Blvd. South Las Vegas, NV 89109 1.702.693.7120 www.mgmresorts.com
Bellagio Las Vegas, NV 1.702.693.7111 www.bellagio.com
ARIA Las Vegas, NV 1.866.359.7757 www.aria.com
Vdara Las Vegas, NV 1.866.745.7111 www.vdara.com
Mandarin Oriental Las Vegas Las Vegas, NV 1.702.590.8888 www.mandarinoriental.com/lasvegas
The Shops at Crystals Las Vegas, NV 1.866.754.2489 www.theshopsatcrystals.com
Alexis M. Herman Director President and Chief Executive Officer, New Ventures, a corporate consulting company
Roland Hernandez Director President, Hernandez Media Ventures, a privately held media assets company
Anthony L. Mandekic Director President and Chief Executive Officer, Tracinda Corporation, a private investment company
Rose McKinney-James Director Managing Principal, McKinney-James and Associates, a government affairs firm
Melvin B. Wolzinger Director Emeritus
Phyllis A. James Executive Vice President, Special Counsel – Litigation and Chief Diversity & Corporate Responsibility Officer
John M. McManus Executive Vice President, General Counsel and Secretary
MGM Grand Las Vegas Las Vegas, NV 1.702.891.1111 www.mgmgrand.com
The Signature at MGM Grand Las Vegas, NV 1.877.612.2121 www.signaturemgmgrand.com
Mandalay Bay Las Vegas, NV 1.702.632.7777 www.mandalaybay.com
Four Seasons Hotel Las Vegas, NV 1.702.632.5000 www.fourseasons.com/lasvegas
Delano Las Vegas Las Vegas, NV 1.702.632.7400 www.delanolasvegas.com
The Mirage Las Vegas, NV 1.702.791.7111 www.mirage.com
Gregory M. Spierkel Director
Daniel J. Taylor Director Executive, Tracinda Corporation, a private investment company
Robert C. Selwood Executive Vice President and Chief Accounting Officer
Monte Carlo Las Vegas, NV 1.702.730.7777 www.montecarlo.com
New York-New York Las Vegas, NV 1.702.740.6969 www.nynyhotelcasino.com
Luxor Las Vegas, NV 1.702.262.4000 www.luxor.com
Excalibur Las Vegas, NV 1.702.597.7777 www.excalibur.com
Circus Circus Las Vegas Las Vegas, NV 1.702.734.0410 www.circuscircus.com
Beau Rivage Biloxi, MS 1.228.386.7111 www.beaurivage.com
Gold Strike Tunica Tunica, MS 1.662.357.1111 www.goldstrikemississippi.com
MGM Grand Detroit Detroit, MI 1.877.888.2121 www.mgmgranddetroit.com
Grand Victoria Elgin, IL 1.847.468.7000 www.grandvictoriacasino.com
MGM Macau Macau, S.A.R. 853.8802.8888 www.mgmmacau.com
MGM Grand Sanya Yalong Bay National Resort District, China +86.898.8863.9999 www.mgmgrandsanya.com
Borgata Hotel Casino & Spa Atlantic City, NJ 1.609.317.1000 www.theborgata.com
DIRECTORS
DIRECTORS EMERITUS
OFFICERS
CORPORATE DIRECTORY

IN MEMORIAM
KIRK KERKORIAN (1917-2015)
“MGM Resorts and our family of 60,000 employees
honor the memory of a great man, a great business
leader, a great community leader, an innovator, and
a member of our country’s greatest generation.
As the Founder of our Company, he combined brilliant
business insight with steadfast integrity to become
one of the most reputable and influential financiers of
our time. Mr. Kerkorian was a quiet but powerful force
behind the transformation of the Las Vegas Strip into
one of the world’s most popular tourist destinations.
He was also a generous humanitarian.
We celebrate his memory in all that we do.”
- Jim Murren Chairman and Chief Executive Officer
