annual report 2018 - paulig · the future availability of coffee is threatened by climate change....
TRANSCRIPT
Annual Report 2018
In Paulig Group, everything we do is about exploring great taste. It is our promise and the core of our identity.
Contents4 Paulig Group in brief 6 CEO’s review 9 A world of tastes12 Corporate governance
15 Review by the Board of Directors 19 Consolidated income statement 20 Consolidated balance sheet 22 Consolidated cash flow statement 23 Accounting principles 25 Notes to the financial statements 30 The Board’s proposal to the Annual General Meeting31 Auditor’s report
32 Board of Directors 33 Management team34 Definitions 34 Contact information
Paulig Ltd 20184
Strive for Excellence
Stay Curious
Grow Together
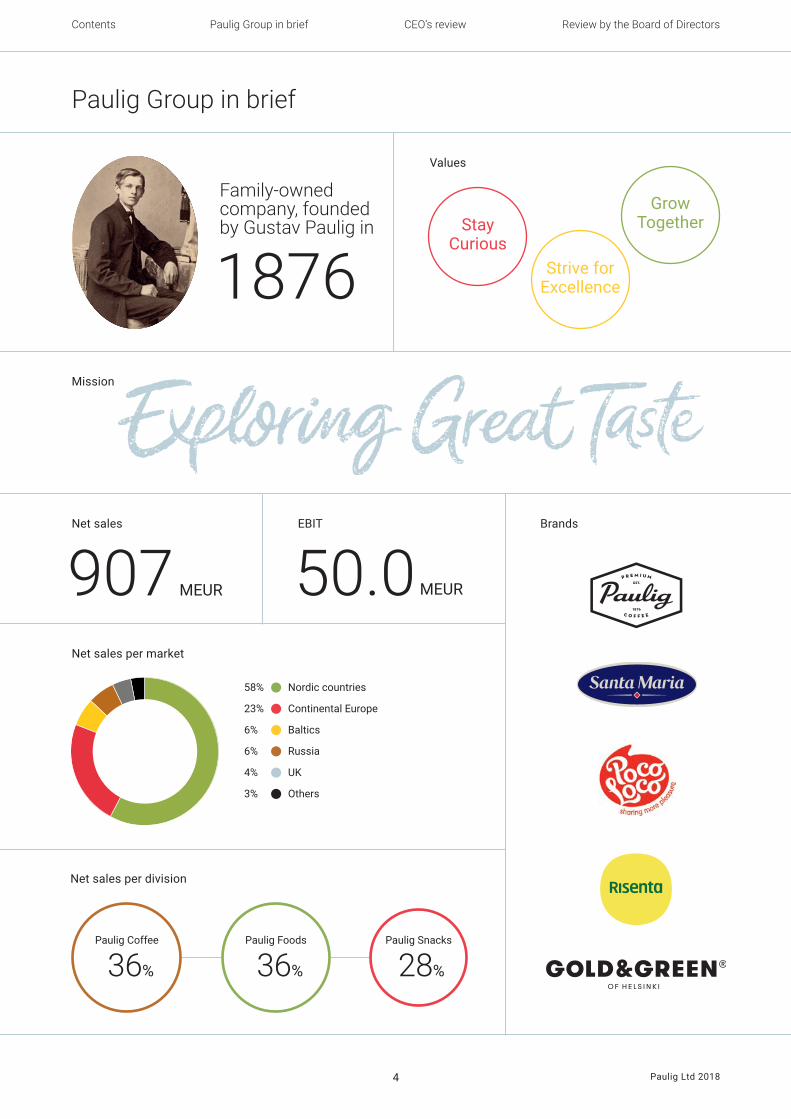
Net sales per division
Paulig Coffee
36%
Paulig Foods
36%
Paulig Snacks
28%
Paulig Group in brief
Brands
MEUR907 MEUR50.058% •
Nordic countries
23% • Continental Europe
6% • Baltics
6% • Russia
4% • UK
3% • Others
Net sales per market
Net sales
Mission
Values
Family-owned company, founded by Gustav Paulig in
EBIT
1876
Paulig Group in brief CEO’s review Review by the Board of DirectorsContents
Paulig Ltd 20185
sales
production
Tallinn
Riga
Vilnius
Landskrona Moscow
St. Petersburg
Tver
Oslo
Nieuwegein
Gothenburg
Stockholm
PorvooHelsinkiJärvenpää
Roeselare
Minsk
Lille
BrøndbyMilton Keynes
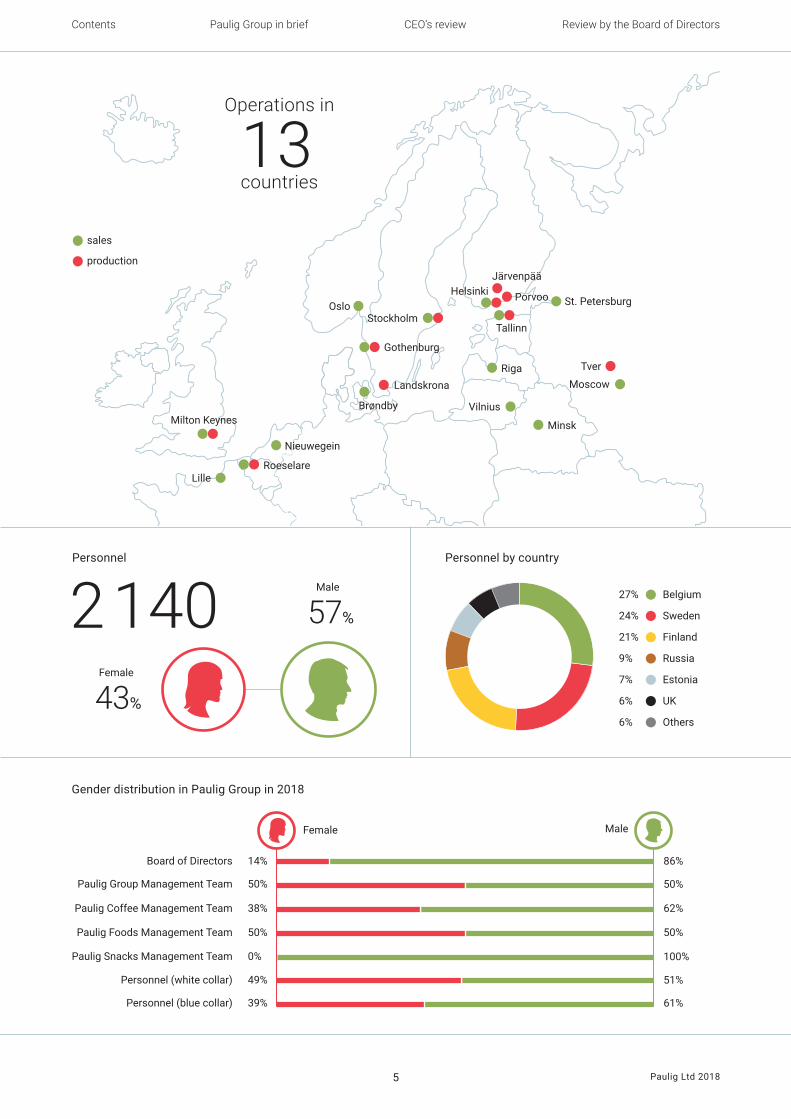
27% • Belgium
24% • Sweden
21% • Finland
9% • Russia
7% • Estonia
6% • UK
6% • Others
Personnel by countryPersonnel
2 140Female
43%
Male
57%
Operations in
13 countries
Gender distribution in Paulig Group in 2018
Female
Board of Directors
Paulig Foods Management Team
Paulig Group Management Team
Paulig Snacks Management Team
Personnel (white collar)
Paulig Coffee Management Team
Personnel (blue collar)
14%
50%
50%
0%
49%
38%
39%
86%
50%
50%
100%
51%
62%
61%
Male
Paulig Group in brief CEO’s review Review by the Board of DirectorsContents
Paulig Ltd 20186
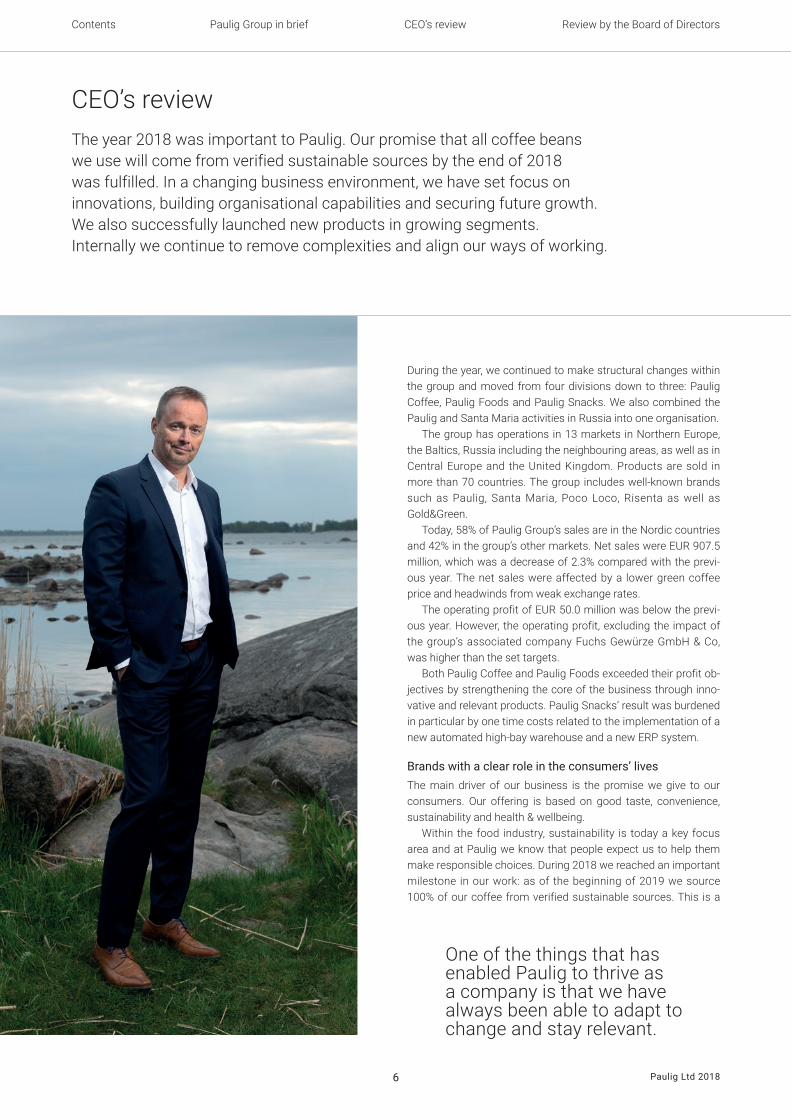
CEO’s review
During the year, we continued to make structural changes within the group and moved from four divisions down to three: Paulig Coffee, Paulig Foods and Paulig Snacks. We also combined the Paulig and Santa Maria activities in Russia into one organisation.
The group has operations in 13 markets in Northern Europe, the Baltics, Russia including the neighbouring areas, as well as in Central Europe and the United Kingdom. Products are sold in more than 70 countries. The group includes well-known brands such as Paulig, Santa Maria, Poco Loco, Risenta as well as Gold&Green.
Today, 58% of Paulig Group’s sales are in the Nordic countries and 42% in the group’s other markets. Net sales were EUR 907.5 million, which was a decrease of 2.3% compared with the previ-ous year. The net sales were affected by a lower green coffee price and headwinds from weak exchange rates.
The operating profit of EUR 50.0 million was below the previ-ous year. However, the operating profit, excluding the impact of the group’s associated company Fuchs Gewürze GmbH & Co, was higher than the set targets.
Both Paulig Coffee and Paulig Foods exceeded their profit ob-jectives by strengthening the core of the business through inno-vative and relevant products. Paulig Snacks’ result was burdened in particular by one time costs related to the implementation of a new automated high-bay warehouse and a new ERP system.
Brands with a clear role in the consumers’ livesThe main driver of our business is the promise we give to our consumers. Our offering is based on good taste, convenience, sustainability and health & wellbeing.
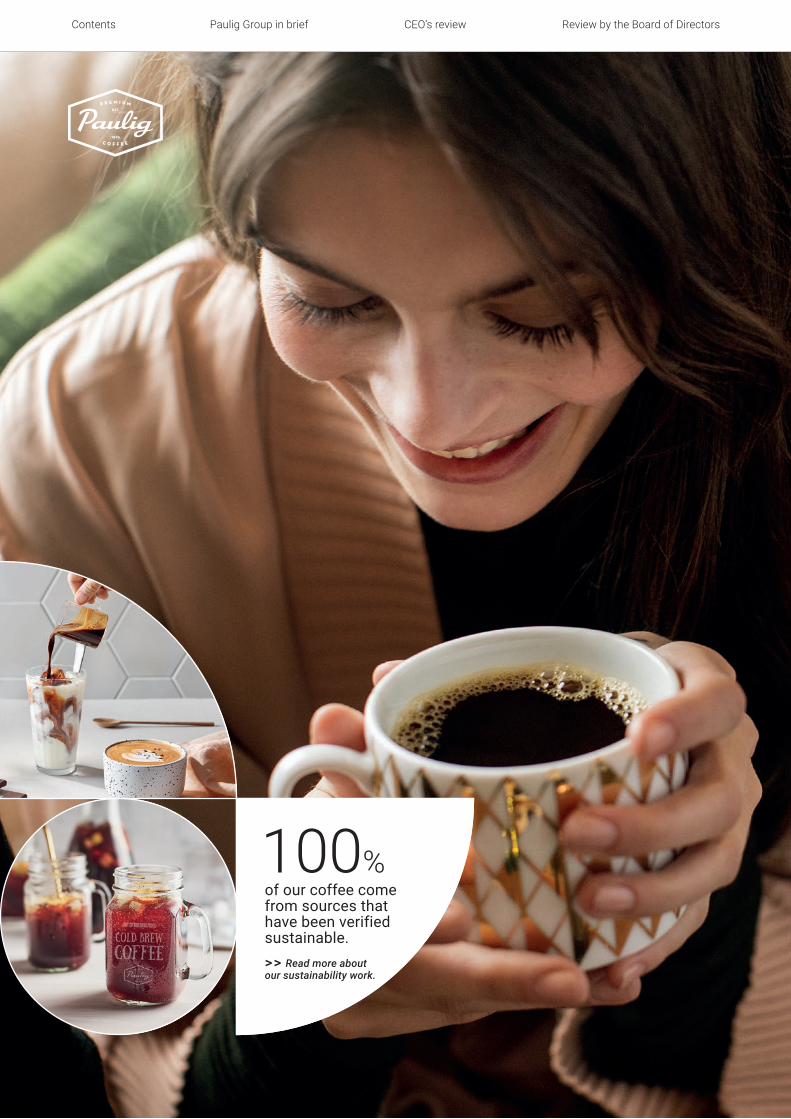
Within the food industry, sustainability is today a key focus area and at Paulig we know that people expect us to help them make responsible choices. During 2018 we reached an important milestone in our work: as of the beginning of 2019 we source 100% of our coffee from verified sustainable sources. This is a
The year 2018 was important to Paulig. Our promise that all coffee beans we use will come from verified sustainable sources by the end of 2018 was fulfilled. In a changing business environment, we have set focus on innovations, building organisational capabilities and securing future growth. We also successfully launched new products in growing segments.Internally we continue to remove complexities and align our ways of working.
One of the things that has enabled Paulig to thrive as a company is that we have always been able to adapt to change and stay relevant.
Paulig Group in brief CEO’s review Review by the Board of DirectorsContents
Paulig Ltd 20187
Sustainability Report 2018
CEO’s review
You will find Paulig Group’s Sustainability Report 2018 on our website >> www.pauliggroup.com
major achievement and – as one of the first large coffee roaster-ies in the world to exclusively use sustainable coffee beans – Paulig is a coffee industry forerunner in terms of its sourcing principles. In 2018, Paulig Foods set three themes for reshaping the future: Caring for the environment, Healthy & sustainable life-styles and Social responsibility.
In 2018, we also launched many successful novelties. The Paulig City Coffee product portfolio expanded with Café Sydney and the whole product range more than doubled in sales volume. The product family is a good example of our work to grow our share in the premium segment and build value to the category. Furthermore, our new vegan Frezza Almond Latte and Frezza Oat Latte coffee range clearly tapped into consumer need and ex-ceeded the sales expectations.
The new Santa Maria spice jars are a significant change to our spice range. The jars spice up a rather conservative category with a new lid concept as well as a clearer and tastier visual outlook.
In Finland, Gold&Green has in two years grown into a multi-mil-lion euro business and become a part of our everyday meals. However, internationally the Gold&Green brand is still developing and the work to grow this business continues. Alternative protein sources continue to be a topic of interest for us also in the future.
Also the Risenta brand is expected to pave the way for future growth with a healthy and environmentally friendly vegetarian offering for which the demand is increasing.
Driven by our vision 2030*) we established our PINC incubator in Stockholm. PINC is a green-house for radical innovation and ventures in and around topics of the food industry. The goal is to find future growth areas.
Paulig Snacks, our customer brand business, continued to de-velop its portfolio and has today more than 700 customers in more than 70 countries. The business is continuing to grow through innovative products and cost efficient operations.
*) The Nordic challenger loved and valued for reshaping the world of pure taste experiences.
For our organisation it is inspiring to work with a portfolio of brands that have a sense of purpose and a clear role in the con-sumers’ lives. This is a great platform for future expansion.
Transformation needed for future growthOne of the red threads that defines Paulig and that has enabled the company to thrive is that we always have managed to stay relevant and been able to adapt to change. Changes in our busi-ness environment – for example in consumer behaviour and technology – are faster than ever before and we want to continue to play a strong role in the development of the food industry.
In doing so, it is obvious that we at Paulig must transform too. This is why we have defined growth enabler programmes to drive increased growth.
Our values: Stay Curious, Strive for Excellence and Grow To-gether are the foundation of our culture and will support us in our choices moving forward as a company.
I want to thank all our employees who with great commitment work to develop the company and our offerings with the consum-er in focus. I also want to thank all our partners for the collabora-tion during 2018.
Helsinki, March 2019
Rolf LadauCEOPaulig Group
Paulig Group in brief CEO’s review Review by the Board of DirectorsContents
Paulig Ltd 20188
100%of our coffee come from sources that have been verified sustainable.> > Read more about our sustainability work.
Paulig Group in brief CEO’s review Review by the Board of DirectorsContents
Paulig Ltd 20189
2016 2017 2018
M€
0
100
150
50
200
250
300
350
400
Paulig Group consists of three divisions – Paulig Coffee, Paulig Foods and Paulig Snacks.
A world of tastes
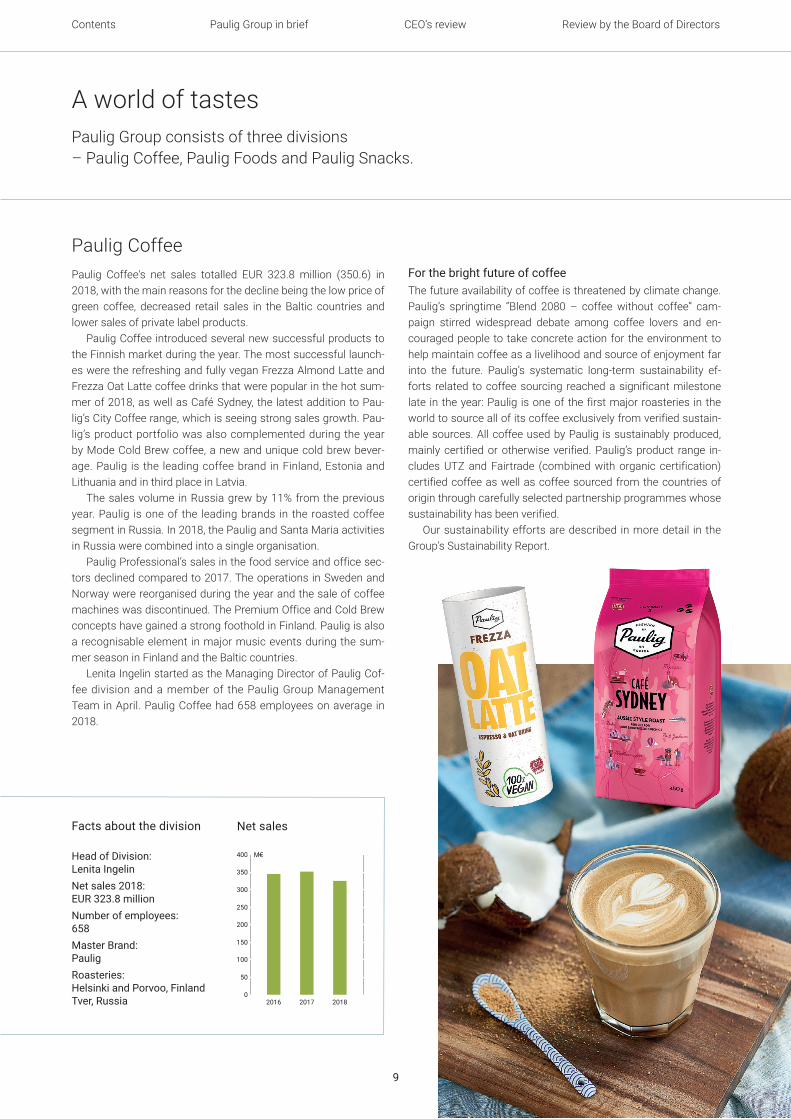
Paulig CoffeePaulig Coffee's net sales totalled EUR 323.8 million (350.6) in 2018, with the main reasons for the decline being the low price of green coffee, decreased retail sales in the Baltic countries and lower sales of private label products.
Paulig Coffee introduced several new successful products to the Finnish market during the year. The most successful launch-es were the refreshing and fully vegan Frezza Almond Latte and Frezza Oat Latte coffee drinks that were popular in the hot sum-mer of 2018, as well as Café Sydney, the latest addition to Pau-lig’s City Coffee range, which is seeing strong sales growth. Pau-lig’s product portfolio was also complemented during the year by Mode Cold Brew coffee, a new and unique cold brew bever-age. Paulig is the leading coffee brand in Finland, Estonia and Lithuania and in third place in Latvia.
The sales volume in Russia grew by 11% from the previous year. Paulig is one of the leading brands in the roasted coffee segment in Russia. In 2018, the Paulig and Santa Maria activities in Russia were combined into a single organisation.
Paulig Professional’s sales in the food service and office sec-tors declined compared to 2017. The operations in Sweden and Norway were reorganised during the year and the sale of coffee machines was discontinued. The Premium Office and Cold Brew concepts have gained a strong foothold in Finland. Paulig is also a recognisable element in major music events during the sum-mer season in Finland and the Baltic countries.
Lenita Ingelin started as the Managing Director of Paulig Cof-fee division and a member of the Paulig Group Management Team in April. Paulig Coffee had 658 employees on average in 2018.
For the bright future of coffeeThe future availability of coffee is threatened by climate change. Paulig’s springtime “Blend 2080 – coffee without coffee” cam-paign stirred widespread debate among coffee lovers and en-couraged people to take concrete action for the environment to help maintain coffee as a livelihood and source of enjoyment far into the future. Paulig’s systematic long-term sustainability ef-forts related to coffee sourcing reached a significant milestone late in the year: Paulig is one of the first major roasteries in the world to source all of its coffee exclusively from verified sustain-able sources. All coffee used by Paulig is sustainably produced, mainly certified or otherwise verified. Paulig’s product range in-cludes UTZ and Fairtrade (combined with organic certification) certified coffee as well as coffee sourced from the countries of origin through carefully selected partnership programmes whose sustainability has been verified.
Our sustainability efforts are described in more detail in the Group’s Sustainability Report.
Facts about the division
Head of Division: Lenita IngelinNet sales 2018: EUR 323.8 millionNumber of employees: 658Master Brand: PauligRoasteries: Helsinki and Porvoo, Finland Tver, Russia
Net sales
Paulig Group in brief CEO’s review Review by the Board of DirectorsContents
Paulig Ltd 201810
2016 2017 2018
M€
0
100
150
50
200
250
300
350
400
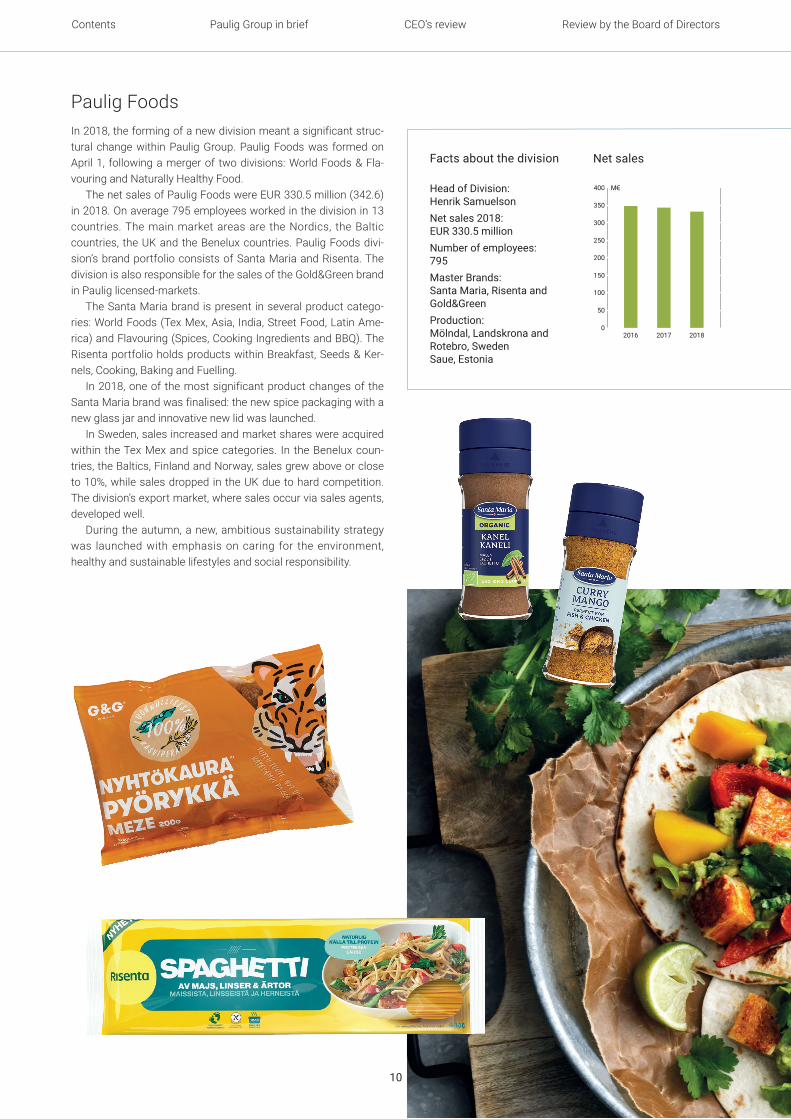
Paulig FoodsIn 2018, the forming of a new division meant a significant struc-tural change within Paulig Group. Paulig Foods was formed on April 1, following a merger of two divisions: World Foods & Fla-vouring and Naturally Healthy Food.
The net sales of Paulig Foods were EUR 330.5 million (342.6) in 2018. On average 795 employees worked in the division in 13 countries. The main market areas are the Nordics, the Baltic countries, the UK and the Benelux countries. Paulig Foods divi-sion’s brand portfolio consists of Santa Maria and Risenta. The division is also responsible for the sales of the Gold&Green brand in Paulig licensed-markets.
The Santa Maria brand is present in several product catego-ries: World Foods (Tex Mex, Asia, India, Street Food, Latin Ame- rica) and Flavouring (Spices, Cooking Ingredients and BBQ). The Risenta portfolio holds products within Breakfast, Seeds & Ker-nels, Cooking, Baking and Fuelling.
In 2018, one of the most significant product changes of the Santa Maria brand was finalised: the new spice packaging with a new glass jar and innovative new lid was launched.
In Sweden, sales increased and market shares were acquired within the Tex Mex and spice categories. In the Benelux coun-tries, the Baltics, Finland and Norway, sales grew above or close to 10%, while sales dropped in the UK due to hard competition. The division’s export market, where sales occur via sales agents, developed well.
During the autumn, a new, ambitious sustainability strategy was launched with emphasis on caring for the environment, healthy and sustainable lifestyles and social responsibility.
Facts about the division
Head of Division: Henrik SamuelsonNet sales 2018: EUR 330.5 millionNumber of employees: 795 Master Brands: Santa Maria, Risenta and Gold&GreenProduction: Mölndal, Landskrona and Rotebro, Sweden Saue, Estonia
Net sales
Paulig Group in brief CEO’s review Review by the Board of DirectorsContents
Paulig Ltd 201811
2016 2017 2018
M€
0
100
150
50
200
250
300
350
400
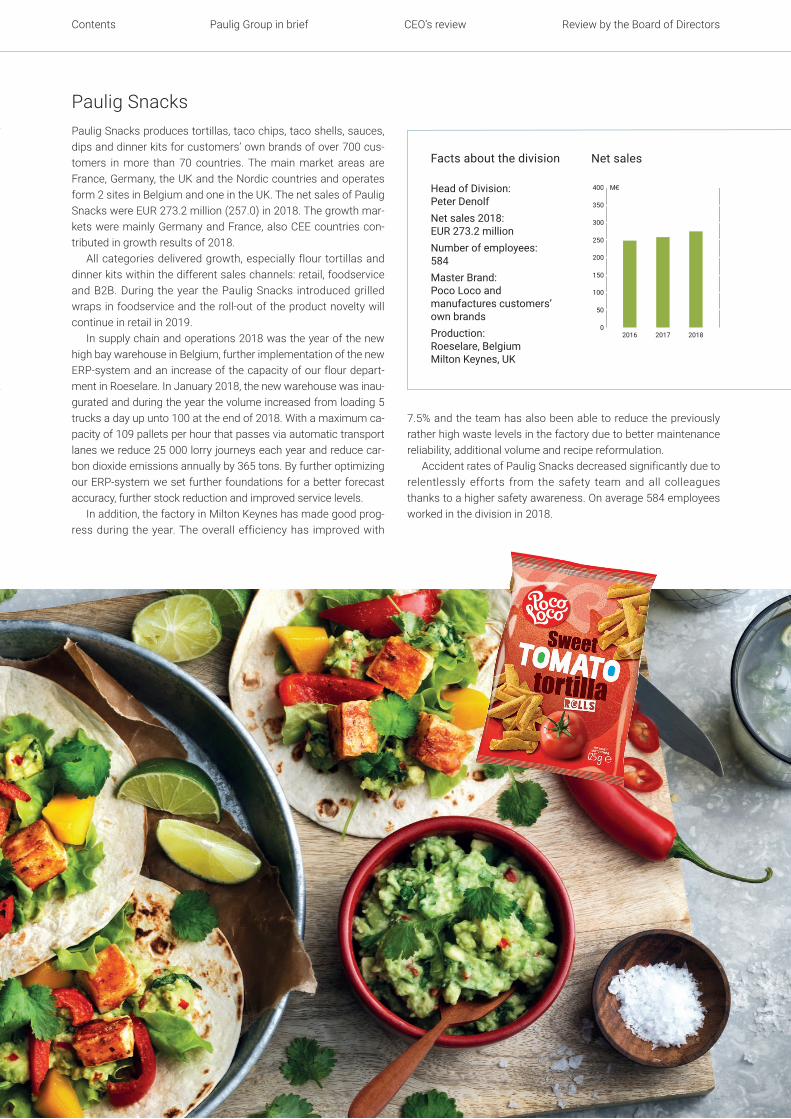
Paulig Snacks
Net salesFacts about the division
Head of Division: Peter Denolf Net sales 2018: EUR 273.2 million Number of employees: 584Master Brand: Poco Loco and manufactures customers’ own brandsProduction: Roeselare, Belgium Milton Keynes, UK
Net sales
Paulig Snacks produces tortillas, taco chips, taco shells, sauces, dips and dinner kits for customers’ own brands of over 700 cus-tomers in more than 70 countries. The main market areas are France, Germany, the UK and the Nordic countries and operates form 2 sites in Belgium and one in the UK. The net sales of Paulig Snacks were EUR 273.2 million (257.0) in 2018. The growth mar-kets were mainly Germany and France, also CEE countries con-tributed in growth results of 2018.
All categories delivered growth, especially flour tortillas and dinner kits within the different sales channels: retail, foodservice and B2B. During the year the Paulig Snacks introduced grilled wraps in foodservice and the roll-out of the product novelty will continue in retail in 2019.
In supply chain and operations 2018 was the year of the new high bay warehouse in Belgium, further implementation of the new ERP-system and an increase of the capacity of our flour depart-ment in Roeselare. In January 2018, the new warehouse was inau-gurated and during the year the volume increased from loading 5 trucks a day up unto 100 at the end of 2018. With a maximum ca-pacity of 109 pallets per hour that passes via automatic transport lanes we reduce 25 000 lorry journeys each year and reduce car-bon dioxide emissions annually by 365 tons. By further optimizing our ERP-system we set further foundations for a better forecast accuracy, further stock reduction and improved service levels.
In addition, the factory in Milton Keynes has made good prog-ress during the year. The overall efficiency has improved with
7.5% and the team has also been able to reduce the previously rather high waste levels in the factory due to better maintenance reliability, additional volume and recipe reformulation.
Accident rates of Paulig Snacks decreased significantly due to relentlessly efforts from the safety team and all colleagues thanks to a higher safety awareness. On average 584 employees worked in the division in 2018.
Paulig Group in brief CEO’s review Review by the Board of DirectorsContents
Paulig Ltd 201812
Corporate governancePaulig Ltd, the parent company of Paulig Group, is a Finnish family-owned company incorporated under the Finnish law. Corporate governance is based on its Articles of Association, the Limited Liability Companies Act, applicable codes and standards, ethical principles and other instructions and policies. Paulig Group also follows applicable parts of the recommendations for listed and family-owned companies.
Annual General MeetingPaulig Group’s highest decision-making body is the parent com-pany’s Annual General Meeting (AGM). The AGM deals with mat-ters that are covered by legislation and by the articles of asso- ciation, such as adoption of the financial statements, dividend distribution and the election of members of the Board and audi-tor as well as their remuneration.
Board of Directors
Composition and tasks of the BoardAccording to the Articles of Association of Paulig Ltd, the AGM elects a minimum of four and a maximum of eight persons as members of the Board. Under the Limited Liability Companies Act, the Board is responsible for the administration of the compa-ny and the appropriate organisation of operations. It is also the Board’s responsibility to ensure that the supervision of account-ing and asset management has been organised appropriately. The tasks also include determining the Group’s strategy and the annual business plan and deciding on acquisitions and strategic investments. The Board oversees the Group’s financial perfor-mance and financial position.
The Board appoints the Managing Director and CEO, and approves the appointment of members of the Group manage-ment. The Board decides on the remunerations of the Group management. The Board undertakes regular reviews of its own operations and of its cooperation with the management.
MeetingsIn 2018, the Board convened eight times. The Board deals with the financial statements in March, finalises the Group strategy in June and decides on the business plan and financial plans for the following year in December.
Chairman of the BoardThe Chairman of the Board is appointed by the AGM. The Chair-man’s role is to lead the activities of the Board, convene the Board and prepare the meetings together with the CEO. The Chairman is in active dialogue with the CEO and keeps him/her-self informed about events in the company and the operating environment. Together with the CEO, the Chairman ensures that the notice, agenda and any necessary material for a meeting are delivered to the members of the Board as agreed before the meeting.
Paulig Group in brief CEO’s review Review by the Board of DirectorsContents
Paulig Ltd 201813
Board committeesThe members of the Board decide on the appointment of com-mittees and their members. The committees prepare matters for the decision of the Board. Paulig Ltd’s Board has appointed a HR and Remuneration Committee and an Audit Committee.
CEO and Management TeamPaulig Ltd’s Board appoints the Managing Director, who also serves as the CEO. The Managing Director’s task is to manage the company’s current affairs according to the Board’s instruc-tions and to ensure that the company’s accounting is managed responsibly and by law.
The Managing Director reports to the Board and keeps the Board informed about the company’s business environment, fi-nancial situation and development.
The Group’s Management Team consists of the Managing Director, who is also the chairman, Heads of Division and the di-rectors of certain corporate functions. Together with the Group’s Management Team, the Managing Director prepares and imple-ments the strategy and steers the business operations. The Man-agement Team also coordinates the Group’s various functions and ensures efficient operations at the Group level.
Risk managementThe principles for Paulig Group’s enterprise risk management have been determined in the risk management policy approved by Paulig Ltd’s Board. Under these principles, risks are identified, evaluated and handled systematically. The objective is to attain strategic and operating targets and to secure the continuity of the business.
AuditingThe AGM appoints an auditor. The auditor’s task is to audit the corporate accounts, financial statements and administration. The tasks are defined in legislation and in generally accepted au-diting practices.
Paulig Group’s ethical principles The purpose of Paulig Group’s ethical principles is to promote responsible entrepreneurship and sustainable development as well as to support decision-making. Based on strong, shared val-ues, the ethical principles guide the Group’s employees in their cooperation with colleagues, customers, suppliers and other business partners.
Paulig Group in brief CEO’s review Review by the Board of DirectorsContents
Paulig Ltd 201814
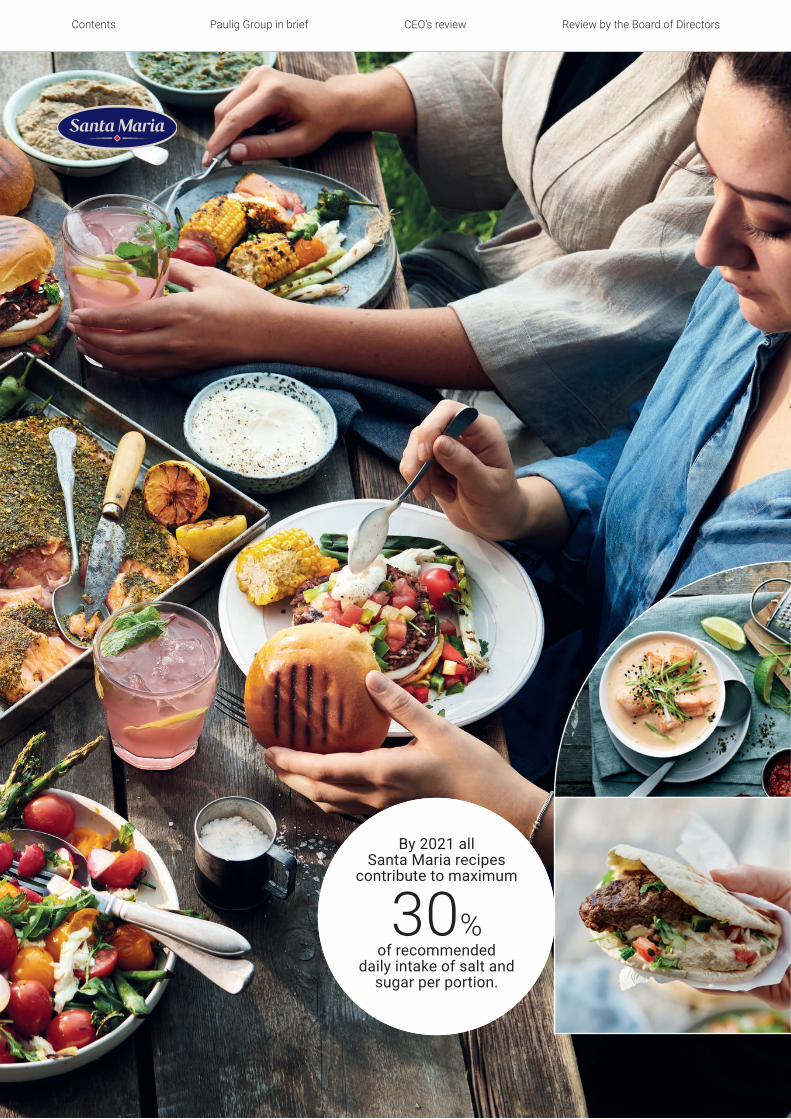
By 2021 all Santa Maria recipes
contribute to maximum
30% of recommended
daily intake of salt and sugar per portion.
Paulig Group in brief CEO’s review Review by the Board of DirectorsContents
Paulig Ltd 201815
Net sales per division (MEUR)
2018 2017 Change
Paulig Coffee 323.8 350.6 -7.6%Paulig Foods 330.5 342.6 -3.5%Paulig Snacks 273.2 257.0 6.3%Gold&Green Foods Oy 4.7 4.9 -5.4%Eliminations -24.7 -26.1 - Total 907.5 928.9 -2.3%
Review by the Board of Directors for 1 January–31 December 2018
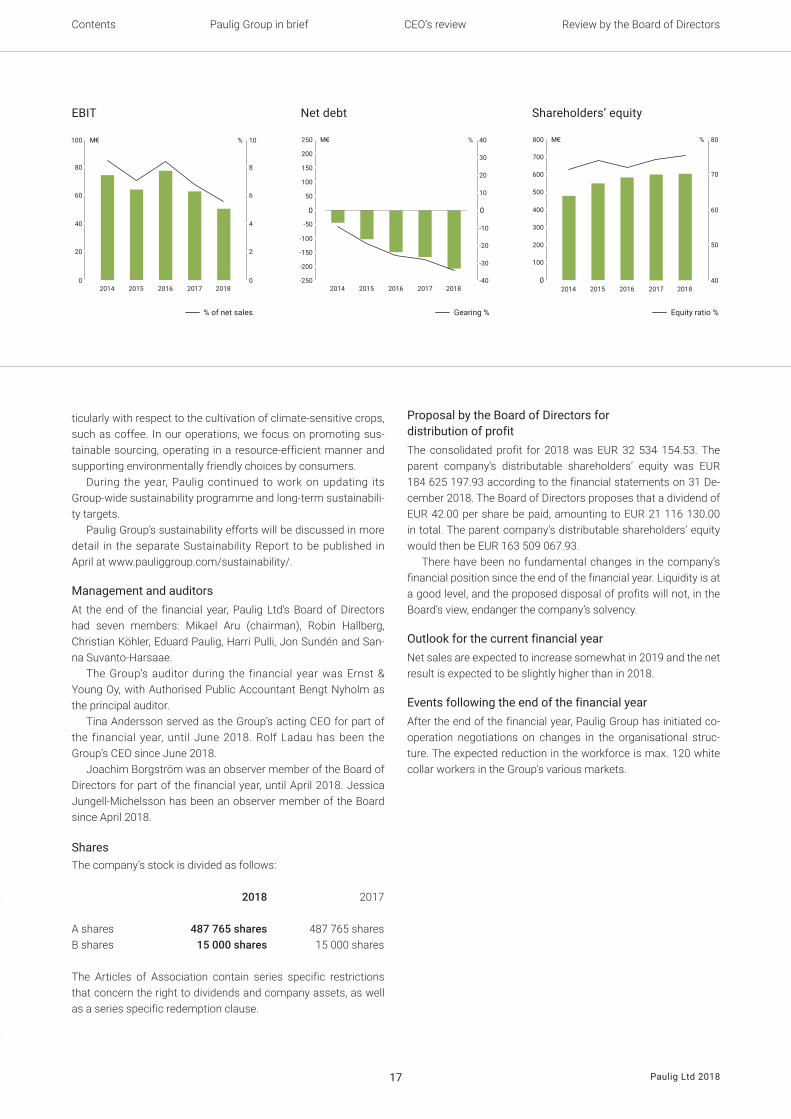
In 2018, Paulig Group’s net sales were EUR 907.5 million (928.9), a decrease of 2.3% on the previous year. The Group’s operating profit was EUR 50.0 million (62.3), which was 5.5% (6.7) of net sales. Paulig Group employed 2 140 people on average during the year (2 042).
Changes in Group structure during the financial yearThe following changes took place in the Group structure in 2018:• Robert Paulig Roastery Ltd was merged with Gustav Paulig Ltd in March 2018.• The Group’s operating structure was changed during the year by combining the World Foods & Flavouring division and the Naturally Healthy Food division into the Paulig Foods division. The new Paulig Foods division includes the Santa Maria and Risenta brands as well as the Gold&Green brand in the Group’s current operating countries except Finland.
Net salesIn 2018, Paulig Group’s net sales were EUR 907.5 million (928.9), a decrease of 2.3% on the previous year. The factors behind the decrease in net sales included the lower price of green coffee and the depreciation of the Swedish krona.
Of Paulig Group’s total net sales of EUR 907.5 million, 58% came from the Nordic countries and 42 per cent from other countries. The Paulig Coffee division accounted for 36% of the external net sales, the Paulig Foods division for 36% and the Paulig Snacks division for 28%.
Result for the financial yearThe Group’s operating profit was EUR 50.0 million (62.3), and its ratio to net sales was 5.5% (6.7).
The associated company’s (Fuchs Gewürze GmbH & Co) con-tribution to the consolidated result was EUR -5.8 million (-3.7), including EUR 5.8 million of goodwill amortization (5.8). The result of the associated company was affected by non-recurring write-downs.
The consolidated result for the financial year, EUR 32.5 million (42.2), did not include profit from real estate sales associated with the sale of land areas in Vuosaari where the old roastery was located, as in the previous year (EUR 4.3 million). Deprecia-tion and impairment totalled EUR 47.4 million (44.4), with the goodwill amortization representing EUR 16.5 million (17.3) of the total.
Financial positionDue to the Group’s strong cash flow during the financial year, the fi-nancial position remained good for the entire financial year. Cash flow was positive during the financial year with net cash flow from operations being EUR 86.1 million (88.0). At the end of the fi-nancial year, the Group’s net debt was EUR -206.1 million (-164.5). The Group’s solvency was at a good level throughout the year.
InvestmentsInvestments during the financial year came to a total of EUR 29.3 million (63.4). The most significant investments were related to increasing the capacity of Pulled Oats production in Finland and Sweden and completing the warehouse investment in Belgium which was mostly carried out in the previous financial year.
RisksIn its risk management Paulig Group observes the risk manage-ment policy adopted by Paulig Ltd’s Board of Directors. Risks are systematically identified and assessed based on this policy.
In the management of liability risks the Group follows the insurance policies adopted by the Board of Directors. The insur-ance coverage against damage related to property and business, such as product liability and interruption of operations, is com-prehensive in accordance with these policies.
The Group’s main strategic and operative risks remained the same during the financial year as in the previous years. The prin-cipal strategic risks were changes in competition and consumer behaviour in different market areas. The principal operative risk
Paulig Group in brief CEO’s review Review by the Board of DirectorsContents
Paulig Ltd 201816
Key indicators of Paulig Group’s financial status and result
2018 2017 2016
Net sales, MEUR 907.5 928.9 916.9Other operating income, MEUR 1.4 5.2 6.2Share of results in associated companies, MEUR -5.8 -3.7 1.5Operating profit, MEUR 50.0 62.3 76.9Operating profit, % of net sales 5.5 6.7 8.4Operating profit before depreciation, MEUR 97.4 106.7 125.4Net profit for the year, MEUR 32.5 42.2 55.1Shareholders’ equity, MEUR 602.6 597.6 580.9Return on equity, % 5.4 7.2 9.8Equity ratio, % 75.0 74.2 71.6Liquid assets, MEUR 213.9 172.0 154.3Interest-bearing debt, MEUR 7.8 7.5 7.1Investments, MEUR 29.3 63.4 59.3
Key personnel indicators
2018 2017 2016
Average number of personnel 2 140 2 042 1 903Wages and salaries for the financial year, MEUR 128.0 120.1 117.5
involves raw materials, the availability and quality of which may vary significantly. In addition, speculative trading of raw materials can cause unexpected changes to their prices. In the manage-ment of risks associated with acquisition of coffee raw materials, the Group follows the policies adopted by the Board of Directors.
In the management of financial risks the Group follows the treasury policy adopted by the Board of Directors. Availability of sufficient financing for the business in the future has been guar-anteed with credit facilities also in the current solvent situation. The treasury policy also covers hedging of currency and interest rate risks. The most significant of these risks is the currency risk associated with the US dollar, as a substantial share of raw mate-rials is paid for in dollars.
PersonnelPaulig Group’s average number of personnel increased by 98 per-sons from the previous year.
The majority of the Group’s 2 140 employees on average were employed in Belgium (27%), Sweden (24%) and Finland (21%).
Innovation and product developmentPaulig Group opened PINC, an incubator for future innovations and ventures, during the year. The mission of PINC, which started its operations in spring 2018 in the A House in Stockholm, Swe-den, is to develop radical innovations around four basic pillars: taste, wellbeing, sustainability and experiences. PINC is also aimed at identifying potential future targets for equity investment.
Innovation and product development activities are also car-
ried out by all of Paulig Group’s divisions, and product develop-ment plays an important role in the development of the product portfolio and ensuring growth. During the year, the divisions intro-duced several new products to the market under the Group’s various brands, including: Café Sydney in the City Coffee range, the coffee drinks Frezza Almond Latte and Frezza Oat Latte and Santa Maria spices in new packaging with a redesigned lid and opening mechanism.
Product development also focused on updating existing prod-ucts and improving recipes.
Besides taste, content and concept, product development fo-cuses on packaging, which must be kept up to date and have a strong profile in order to be valued by consumers.
SustainabilityPaulig’s sustainability efforts are based on the Group’s values, vi-sion and ethical principles. Paulig’s work in this area is guided by the most significant impacts arising from the Group’s operations as well as stakeholder expectations. The Group’s sustainability efforts are focused on three priorities: Fostering social responsi-bility, Caring for the environment, and Supporting consumers’ health and wellbeing.
As a food company, Paulig’s most significant sustainability risks are related to product safety and quality. Observing human rights and workplace safety throughout the supply chain is also among the key challenges, and the Group pays special attention to the management and development of these areas. Climate change and biodiversity loss are the biggest long-term risks, par-
Paulig Group in brief CEO’s review Review by the Board of DirectorsContents
Paulig Ltd 201817
0
2
4
6
8
10%
0
20
40
60
80
100
2014 2015 2016 2017 2018
M€ %
-100
-200
50
100
250
-150
-250
-50
0
150
200
40
0
10
-10
-20
-30
-40
20
30
M€
2014 2015 2016 2017 2018 2014 2015 2016 2017 20180
100
300
400
500
800
200
600
700
40
50
60
80
70
%M€
EBIT
% of net sales
Net debt
Gearing %
Shareholders’ equity
Equity ratio %
ticularly with respect to the cultivation of climate-sensitive crops, such as coffee. In our operations, we focus on promoting sus-tainable sourcing, operating in a resource-efficient manner and supporting environmentally friendly choices by consumers.
During the year, Paulig continued to work on updating its Group-wide sustainability programme and long-term sustainabili-ty targets.
Paulig Group’s sustainability efforts will be discussed in more detail in the separate Sustainability Report to be published in April at www.pauliggroup.com/sustainability/.
Management and auditorsAt the end of the financial year, Paulig Ltd’s Board of Directors had seven members: Mikael Aru (chairman), Robin Hallberg, Christian Köhler, Eduard Paulig, Harri Pulli, Jon Sundén and San-na Suvanto-Harsaae.
The Group’s auditor during the financial year was Ernst & Young Oy, with Authorised Public Accountant Bengt Nyholm as the principal auditor.
Tina Andersson served as the Group’s acting CEO for part of the financial year, until June 2018. Rolf Ladau has been the Group’s CEO since June 2018.
Joachim Borgström was an observer member of the Board of Directors for part of the financial year, until April 2018. Jessica Jungell-Michelsson has been an observer member of the Board since April 2018.
SharesThe company’s stock is divided as follows:
2018 2017
A shares 487 765 shares 487 765 sharesB shares 15 000 shares 15 000 shares
The Articles of Association contain series specific restrictions that concern the right to dividends and company assets, as well as a series specific redemption clause.
Proposal by the Board of Directors for distribution of profitThe consolidated profit for 2018 was EUR 32 534 154.53. The parent company’s distributable shareholders’ equity was EUR 184 625 197.93 according to the financial statements on 31 De-cember 2018. The Board of Directors proposes that a dividend of EUR 42.00 per share be paid, amounting to EUR 21 116 130.00 in total. The parent company’s distributable shareholders’ equity would then be EUR 163 509 067.93.
There have been no fundamental changes in the company’s financial position since the end of the financial year. Liquidity is at a good level, and the proposed disposal of profits will not, in the Board’s view, endanger the company’s solvency.
Outlook for the current financial yearNet sales are expected to increase somewhat in 2019 and the net result is expected to be slightly higher than in 2018.
Events following the end of the financial yearAfter the end of the financial year, Paulig Group has initiated co-operation negotiations on changes in the organisational struc-ture. The expected reduction in the workforce is max. 120 white collar workers in the Group's various markets.
Paulig Group in brief CEO’s review Review by the Board of DirectorsContents
Paulig Ltd 201818
Paulig Snacks is committed to reducing its CO2 emissions by
20% by the end of 2020. > > Read more about our sustainability work.
Paulig Group in brief CEO’s review Review by the Board of DirectorsContents
Paulig Ltd 201819
Consolidated income statement
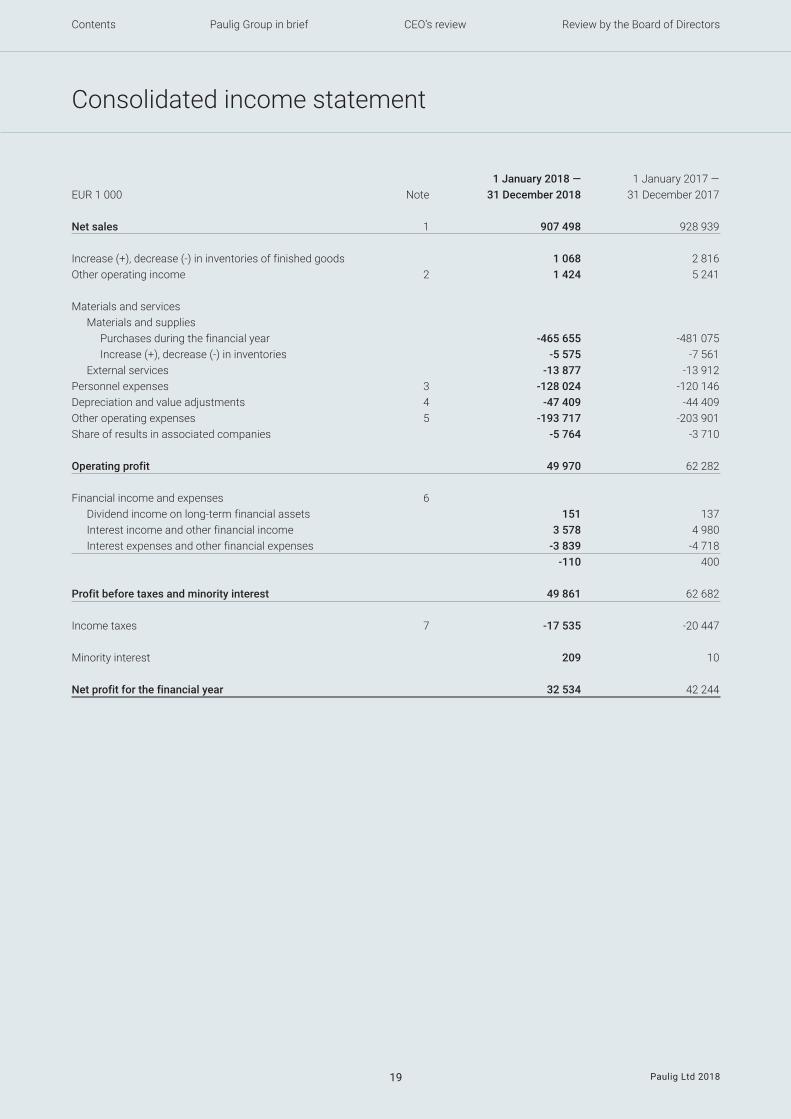
1 January 2018 — 1 January 2017 —EUR 1 000 Note 31 December 2018 31 December 2017 Net sales 1 907 498 928 939 Increase (+), decrease (-) in inventories of finished goods 1 068 2 816Other operating income 2 1 424 5 241 Materials and services Materials and supplies Purchases during the financial year -465 655 -481 075 Increase (+), decrease (-) in inventories -5 575 -7 561 External services -13 877 -13 912Personnel expenses 3 -128 024 -120 146Depreciation and value adjustments 4 -47 409 -44 409Other operating expenses 5 -193 717 -203 901Share of results in associated companies -5 764 -3 710 Operating profit 49 970 62 282 Financial income and expenses 6 Dividend income on long-term financial assets 151 137 Interest income and other financial income 3 578 4 980 Interest expenses and other financial expenses -3 839 -4 718 -110 400 Profit before taxes and minority interest 49 861 62 682 Income taxes 7 -17 535 -20 447 Minority interest 209 10 Net profit for the financial year 32 534 42 244
Paulig Group in brief CEO’s review Review by the Board of DirectorsContents
Paulig Ltd 201820
Consolidated balance sheet
EUR 1 000 Note 31 December 2018 31 December 2017
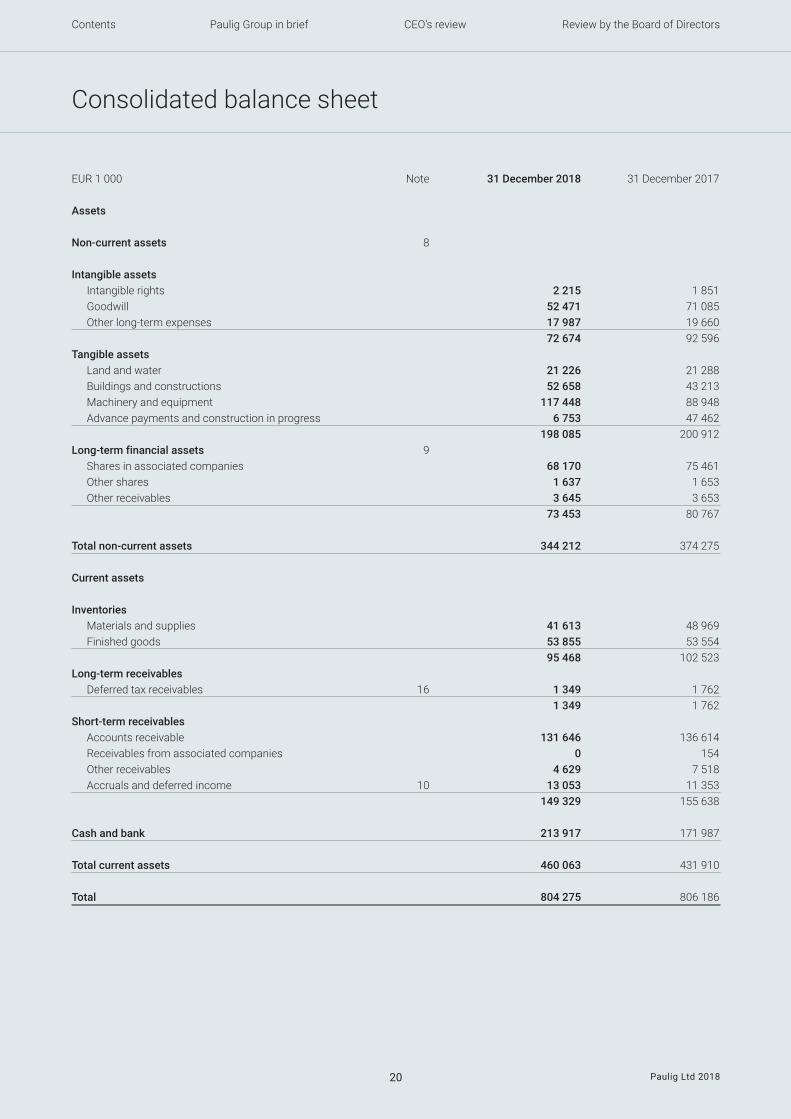
Assets Non-current assets 8 Intangible assets Intangible rights 2 215 1 851 Goodwill 52 471 71 085 Other long-term expenses 17 987 19 660 72 674 92 596Tangible assets Land and water 21 226 21 288 Buildings and constructions 52 658 43 213 Machinery and equipment 117 448 88 948 Advance payments and construction in progress 6 753 47 462 198 085 200 912Long-term financial assets 9 Shares in associated companies 68 170 75 461 Other shares 1 637 1 653 Other receivables 3 645 3 653 73 453 80 767 Total non-current assets 344 212 374 275 Current assets Inventories Materials and supplies 41 613 48 969 Finished goods 53 855 53 554 95 468 102 523Long-term receivables Deferred tax receivables 16 1 349 1 762 1 349 1 762Short-term receivables Accounts receivable 131 646 136 614 Receivables from associated companies 0 154 Other receivables 4 629 7 518 Accruals and deferred income 10 13 053 11 353 149 329 155 638 Cash and bank 213 917 171 987 Total current assets 460 063 431 910 Total 804 275 806 186
Paulig Group in brief CEO’s review Review by the Board of DirectorsContents
Paulig Ltd 201821
Consolidated balance sheet
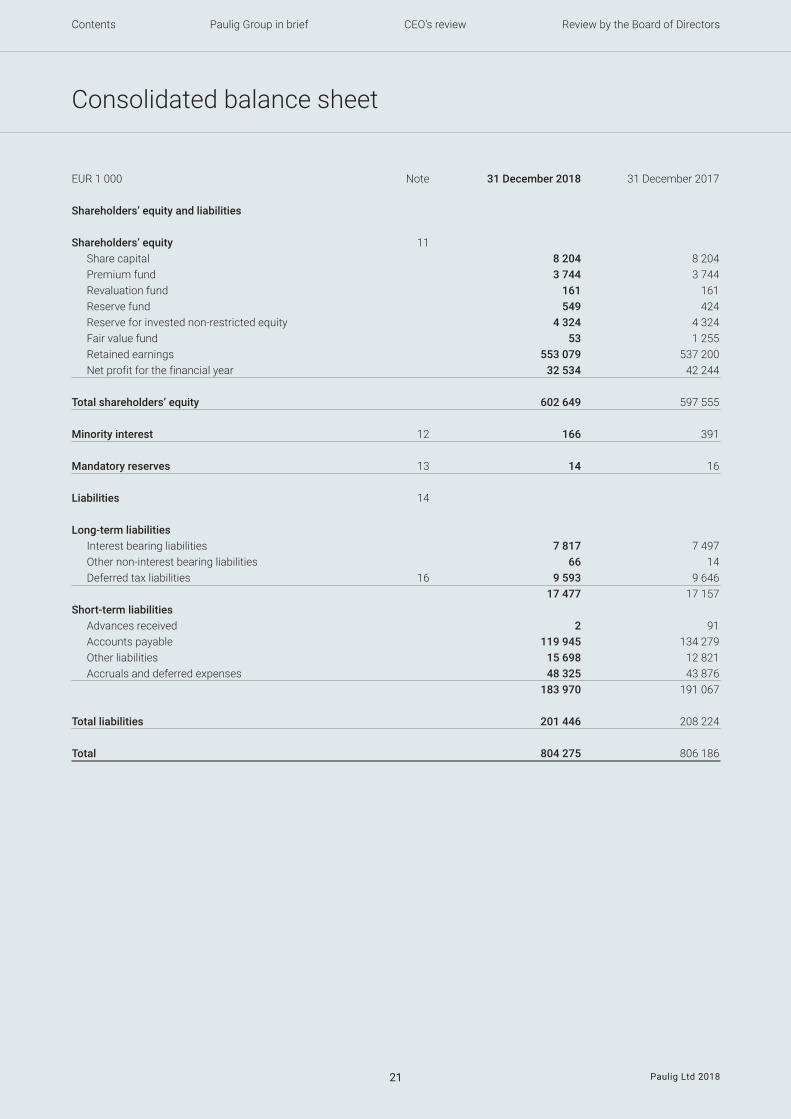
EUR 1 000 Note 31 December 2018 31 December 2017
Shareholders’ equity and liabilities Shareholders’ equity 11 Share capital 8 204 8 204 Premium fund 3 744 3 744 Revaluation fund 161 161 Reserve fund 549 424 Reserve for invested non-restricted equity 4 324 4 324 Fair value fund 53 1 255 Retained earnings 553 079 537 200 Net profit for the financial year 32 534 42 244 Total shareholders’ equity 602 649 597 555 Minority interest 12 166 391 Mandatory reserves 13 14 16 Liabilities 14 Long-term liabilities Interest bearing liabilities 7 817 7 497 Other non-interest bearing liabilities 66 14 Deferred tax liabilities 16 9 593 9 646 17 477 17 157Short-term liabilities Advances received 2 91 Accounts payable 119 945 134 279 Other liabilities 15 698 12 821 Accruals and deferred expenses 48 325 43 876 183 970 191 067 Total liabilities 201 446 208 224 Total 804 275 806 186
Paulig Group in brief CEO’s review Review by the Board of DirectorsContents
Paulig Ltd 201822
Consolidated cash flow statement
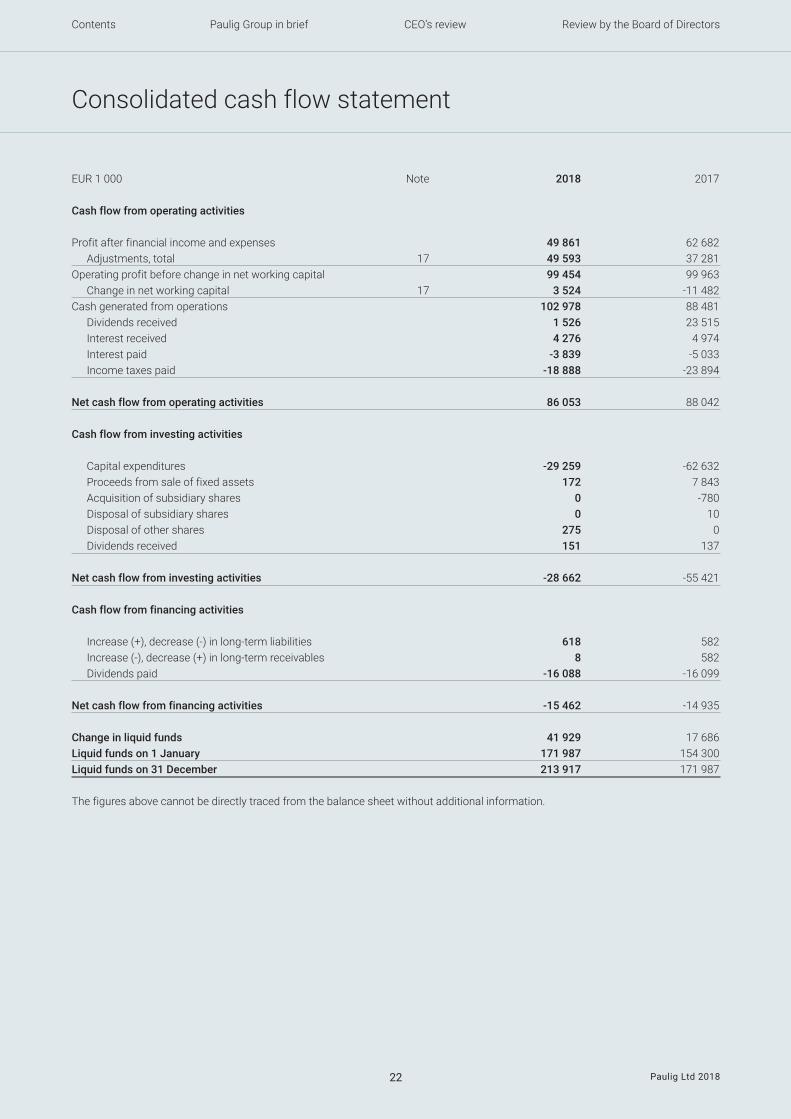
EUR 1 000 Note 2018 2017
Cash flow from operating activities Profit after financial income and expenses 49 861 62 682 Adjustments, total 17 49 593 37 281Operating profit before change in net working capital 99 454 99 963 Change in net working capital 17 3 524 -11 482Cash generated from operations 102 978 88 481 Dividends received 1 526 23 515 Interest received 4 276 4 974 Interest paid -3 839 -5 033 Income taxes paid -18 888 -23 894 Net cash flow from operating activities 86 053 88 042 Cash flow from investing activities Capital expenditures -29 259 -62 632 Proceeds from sale of fixed assets 172 7 843 Acquisition of subsidiary shares 0 -780 Disposal of subsidiary shares 0 10 Disposal of other shares 275 0 Dividends received 151 137 Net cash flow from investing activities -28 662 -55 421 Cash flow from financing activities Increase (+), decrease (-) in long-term liabilities 618 582 Increase (-), decrease (+) in long-term receivables 8 582 Dividends paid -16 088 -16 099 Net cash flow from financing activities -15 462 -14 935 Change in liquid funds 41 929 17 686Liquid funds on 1 January 171 987 154 300Liquid funds on 31 December 213 917 171 987
The figures above cannot be directly traced from the balance sheet without additional information.
Paulig Group in brief CEO’s review Review by the Board of DirectorsContents
Paulig Ltd 201823
Accounting principles
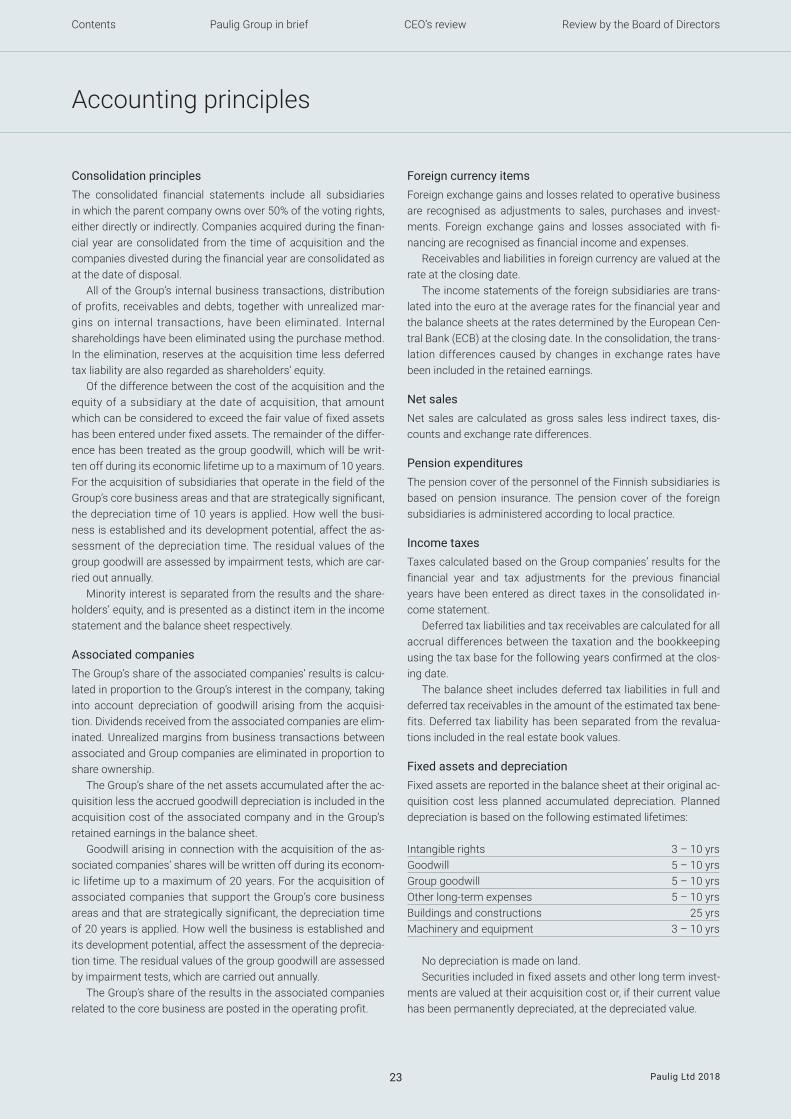
Consolidation principlesThe consolidated financial statements include all subsidiaries in which the parent company owns over 50% of the voting rights, either directly or indirectly. Companies acquired during the finan-cial year are consolidated from the time of acquisition and the companies divested during the financial year are consolidated as at the date of disposal.
All of the Group’s internal business transactions, distribution of profits, receivables and debts, together with unrealized mar-gins on internal transactions, have been eliminated. Internal shareholdings have been eliminated using the purchase method. In the elimination, reserves at the acquisition time less deferred tax liability are also regarded as shareholders’ equity.
Of the difference between the cost of the acquisition and the equity of a subsidiary at the date of acquisition, that amount which can be considered to exceed the fair value of fixed assets has been entered under fixed assets. The remainder of the differ-ence has been treated as the group goodwill, which will be writ-ten off during its economic lifetime up to a maximum of 10 years. For the acquisition of subsidiaries that operate in the field of the Group’s core business areas and that are strategically significant, the depreciation time of 10 years is applied. How well the busi-ness is established and its development potential, affect the as-sessment of the depreciation time. The residual values of the group goodwill are assessed by impairment tests, which are car-ried out annually.
Minority interest is separated from the results and the share-holders’ equity, and is presented as a distinct item in the income statement and the balance sheet respectively.
Associated companiesThe Group’s share of the associated companies’ results is calcu-lated in proportion to the Group’s interest in the company, taking into account depreciation of goodwill arising from the acquisi-tion. Dividends received from the associated companies are elim-inated. Unrealized margins from business transactions between associated and Group companies are eliminated in proportion to share ownership.
The Group’s share of the net assets accumulated after the ac-quisition less the accrued goodwill depreciation is included in the acquisition cost of the associated company and in the Group’s retained earnings in the balance sheet.
Goodwill arising in connection with the acquisition of the as-sociated companies’ shares will be written off during its econom-ic lifetime up to a maximum of 20 years. For the acquisition of associated companies that support the Group’s core business areas and that are strategically significant, the depreciation time of 20 years is applied. How well the business is established and its development potential, affect the assessment of the deprecia-tion time. The residual values of the group goodwill are assessed by impairment tests, which are carried out annually.
The Group’s share of the results in the associated companies related to the core business are posted in the operating profit.
Foreign currency itemsForeign exchange gains and losses related to operative business are recognised as adjustments to sales, purchases and invest-ments. Foreign exchange gains and losses associated with fi-nancing are recognised as financial income and expenses.
Receivables and liabilities in foreign currency are valued at the rate at the closing date.
The income statements of the foreign subsidiaries are trans-lated into the euro at the average rates for the financial year and the balance sheets at the rates determined by the European Cen-tral Bank (ECB) at the closing date. In the consolidation, the trans-lation differences caused by changes in exchange rates have been included in the retained earnings.
Net salesNet sales are calculated as gross sales less indirect taxes, dis-counts and exchange rate differences.
Pension expendituresThe pension cover of the personnel of the Finnish subsidiaries is based on pension insurance. The pension cover of the foreign subsidiaries is administered according to local practice.
Income taxesTaxes calculated based on the Group companies’ results for the financial year and tax adjustments for the previous financial years have been entered as direct taxes in the consolidated in-come statement.
Deferred tax liabilities and tax receivables are calculated for all accrual differences between the taxation and the bookkeeping using the tax base for the following years confirmed at the clos-ing date.
The balance sheet includes deferred tax liabilities in full and deferred tax receivables in the amount of the estimated tax bene-fits. Deferred tax liability has been separated from the revalua-tions included in the real estate book values.
Fixed assets and depreciationFixed assets are reported in the balance sheet at their original ac-quisition cost less planned accumulated depreciation. Planned depreciation is based on the following estimated lifetimes:
Intangible rights 3 – 10 yrsGoodwill 5 – 10 yrsGroup goodwill 5 – 10 yrsOther long-term expenses 5 – 10 yrsBuildings and constructions 25 yrsMachinery and equipment 3 – 10 yrs
No depreciation is made on land.Securities included in fixed assets and other long term invest-
ments are valued at their acquisition cost or, if their current value has been permanently depreciated, at the depreciated value.
Paulig Group in brief CEO’s review Review by the Board of DirectorsContents
Paulig Ltd 201824
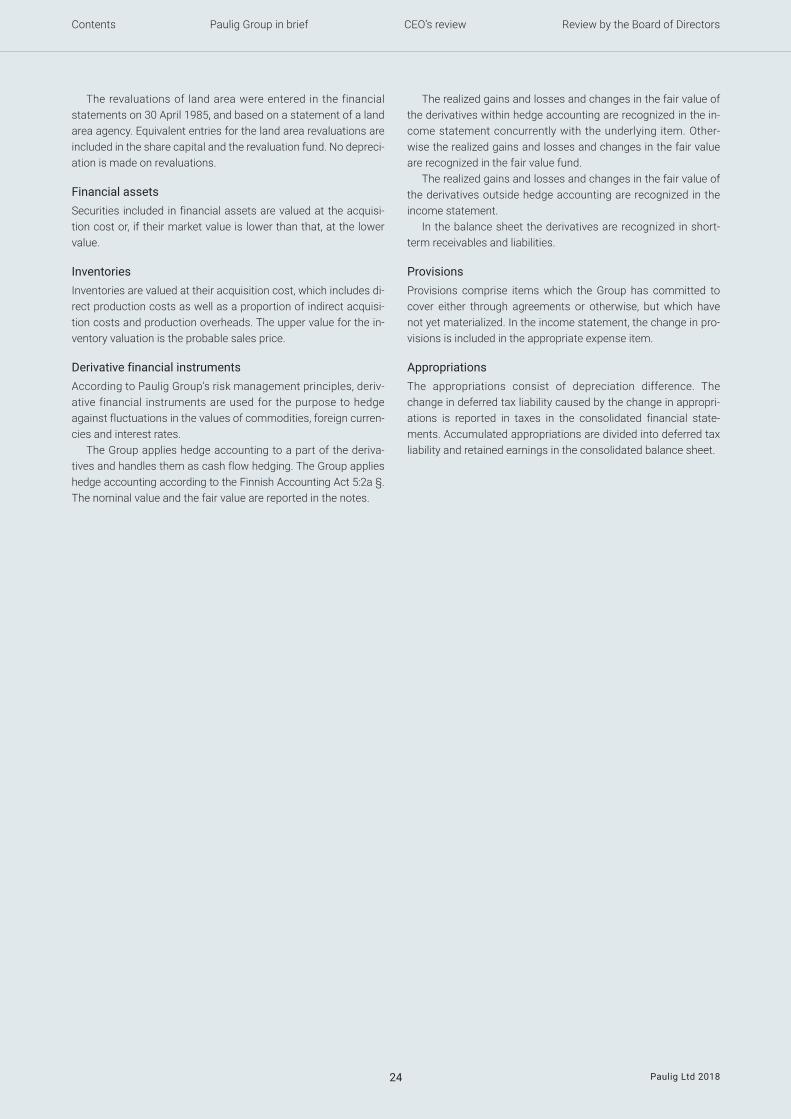
The revaluations of land area were entered in the financial statements on 30 April 1985, and based on a statement of a land area agency. Equivalent entries for the land area revaluations are included in the share capital and the revaluation fund. No depreci-ation is made on revaluations.
Financial assetsSecurities included in financial assets are valued at the acquisi-tion cost or, if their market value is lower than that, at the lower value.
InventoriesInventories are valued at their acquisition cost, which includes di-rect production costs as well as a proportion of indirect acquisi-tion costs and production overheads. The upper value for the in-ventory valuation is the probable sales price.
Derivative financial instruments According to Paulig Group’s risk management principles, deriv-ative financial instruments are used for the purpose to hedge against fluctuations in the values of commodities, foreign curren-cies and interest rates.
The Group applies hedge accounting to a part of the deriva-tives and handles them as cash flow hedging. The Group applies hedge accounting according to the Finnish Accounting Act 5:2a §. The nominal value and the fair value are reported in the notes.
The realized gains and losses and changes in the fair value of the derivatives within hedge accounting are recognized in the in-come statement concurrently with the underlying item. Other-wise the realized gains and losses and changes in the fair value are recognized in the fair value fund.
The realized gains and losses and changes in the fair value of the derivatives outside hedge accounting are recognized in the income statement.
In the balance sheet the derivatives are recognized in short-term receivables and liabilities.
ProvisionsProvisions comprise items which the Group has committed to cover either through agreements or otherwise, but which have not yet materialized. In the income statement, the change in pro-visions is included in the appropriate expense item.
AppropriationsThe appropriations consist of depreciation difference. The change in deferred tax liability caused by the change in appropri-ations is reported in taxes in the consolidated financial state-ments. Accumulated appropriations are divided into deferred tax liability and retained earnings in the consolidated balance sheet.
Paulig Group in brief CEO’s review Review by the Board of DirectorsContents
Paulig Ltd 201825
Notes to the financial statements
EUR 1 000 2018 2017
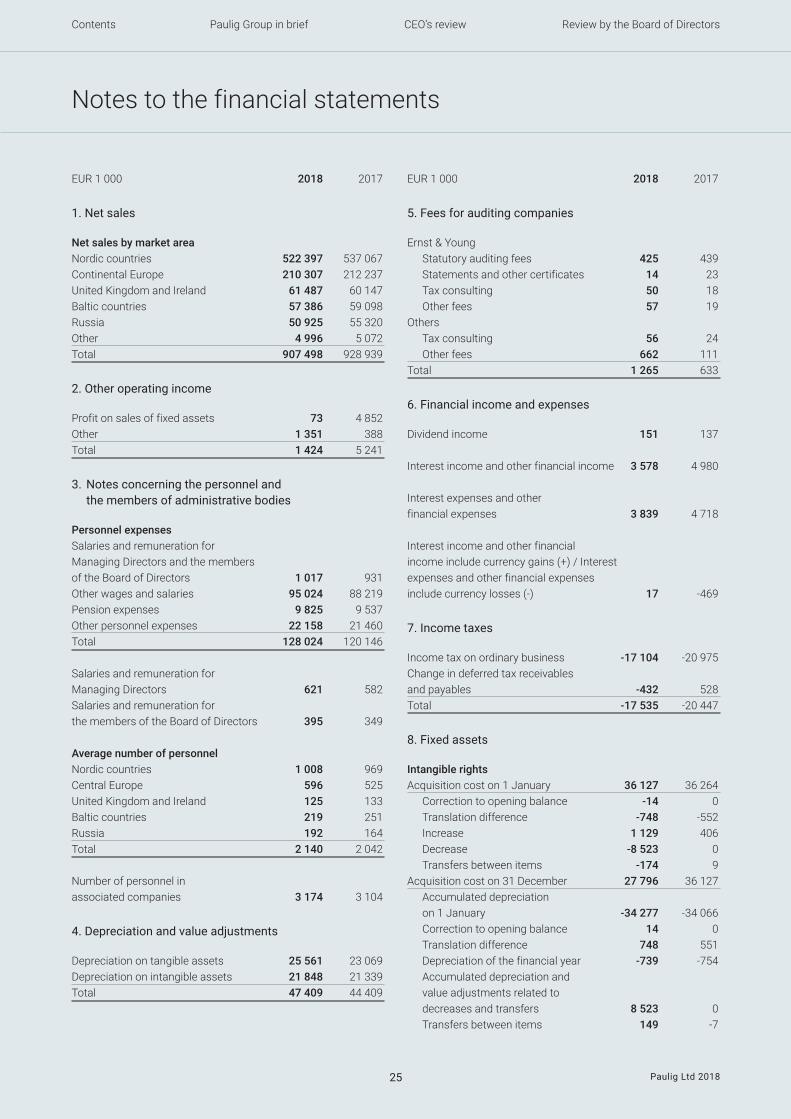
1. Net sales Net sales by market area Nordic countries 522 397 537 067Continental Europe 210 307 212 237United Kingdom and Ireland 61 487 60 147Baltic countries 57 386 59 098Russia 50 925 55 320Other 4 996 5 072Total 907 498 928 939
2. Other operating income Profit on sales of fixed assets 73 4 852Other 1 351 388Total 1 424 5 241
3. Notes concerning the personnel and the members of administrative bodies Personnel expenses Salaries and remuneration for Managing Directors and the members of the Board of Directors 1 017 931Other wages and salaries 95 024 88 219Pension expenses 9 825 9 537Other personnel expenses 22 158 21 460Total 128 024 120 146 Salaries and remuneration for Managing Directors 621 582Salaries and remuneration for the members of the Board of Directors 395 349 Average number of personnel Nordic countries 1 008 969Central Europe 596 525United Kingdom and Ireland 125 133Baltic countries 219 251Russia 192 164Total 2 140 2 042 Number of personnel in associated companies 3 174 3 104
4. Depreciation and value adjustments Depreciation on tangible assets 25 561 23 069Depreciation on intangible assets 21 848 21 339Total 47 409 44 409
EUR 1 000 2018 2017
5. Fees for auditing companies Ernst & Young Statutory auditing fees 425 439 Statements and other certificates 14 23 Tax consulting 50 18 Other fees 57 19Others Tax consulting 56 24 Other fees 662 111Total 1 265 633
6. Financial income and expenses Dividend income 151 137 Interest income and other financial income 3 578 4 980 Interest expenses and other financial expenses 3 839 4 718 Interest income and other financial income include currency gains (+) / Interest expenses and other financial expenses include currency losses (-) 17 -469
7. Income taxes Income tax on ordinary business -17 104 -20 975Change in deferred tax receivables and payables -432 528Total -17 535 -20 447
8. Fixed assets Intangible rights Acquisition cost on 1 January 36 127 36 264 Correction to opening balance -14 0 Translation difference -748 -552 Increase 1 129 406 Decrease -8 523 0 Transfers between items -174 9Acquisition cost on 31 December 27 796 36 127 Accumulated depreciation on 1 January -34 277 -34 066 Correction to opening balance 14 0 Translation difference 748 551 Depreciation of the financial year -739 -754 Accumulated depreciation and value adjustments related to decreases and transfers 8 523 0 Transfers between items 149 -7
Paulig Group in brief CEO’s review Review by the Board of DirectorsContents
Paulig Ltd 201826
EUR 1 000 2018 2017
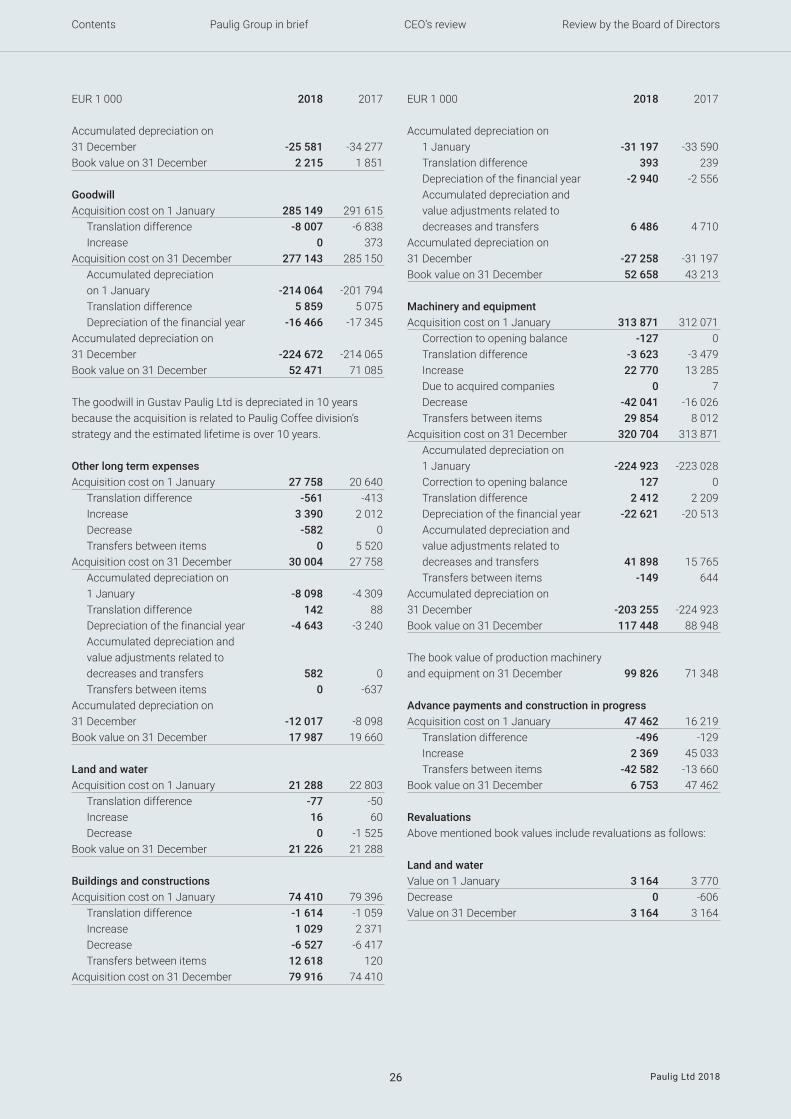
Accumulated depreciation on 31 December -25 581 -34 277Book value on 31 December 2 215 1 851 Goodwill Acquisition cost on 1 January 285 149 291 615 Translation difference -8 007 -6 838 Increase 0 373Acquisition cost on 31 December 277 143 285 150 Accumulated depreciation on 1 January -214 064 -201 794 Translation difference 5 859 5 075 Depreciation of the financial year -16 466 -17 345Accumulated depreciation on 31 December -224 672 -214 065Book value on 31 December 52 471 71 085 The goodwill in Gustav Paulig Ltd is depreciated in 10 years because the acquisition is related to Paulig Coffee division’s strategy and the estimated lifetime is over 10 years. Other long term expenses Acquisition cost on 1 January 27 758 20 640 Translation difference -561 -413 Increase 3 390 2 012 Decrease -582 0 Transfers between items 0 5 520Acquisition cost on 31 December 30 004 27 758 Accumulated depreciation on 1 January -8 098 -4 309 Translation difference 142 88 Depreciation of the financial year -4 643 -3 240 Accumulated depreciation and value adjustments related to decreases and transfers 582 0 Transfers between items 0 -637Accumulated depreciation on 31 December -12 017 -8 098Book value on 31 December 17 987 19 660 Land and water Acquisition cost on 1 January 21 288 22 803 Translation difference -77 -50 Increase 16 60 Decrease 0 -1 525Book value on 31 December 21 226 21 288 Buildings and constructions Acquisition cost on 1 January 74 410 79 396 Translation difference -1 614 -1 059 Increase 1 029 2 371 Decrease -6 527 -6 417 Transfers between items 12 618 120Acquisition cost on 31 December 79 916 74 410
EUR 1 000 2018 2017
Accumulated depreciation on 1 January -31 197 -33 590 Translation difference 393 239 Depreciation of the financial year -2 940 -2 556 Accumulated depreciation and value adjustments related to decreases and transfers 6 486 4 710Accumulated depreciation on 31 December -27 258 -31 197Book value on 31 December 52 658 43 213 Machinery and equipment Acquisition cost on 1 January 313 871 312 071 Correction to opening balance -127 0 Translation difference -3 623 -3 479 Increase 22 770 13 285 Due to acquired companies 0 7 Decrease -42 041 -16 026 Transfers between items 29 854 8 012Acquisition cost on 31 December 320 704 313 871 Accumulated depreciation on 1 January -224 923 -223 028 Correction to opening balance 127 0 Translation difference 2 412 2 209 Depreciation of the financial year -22 621 -20 513 Accumulated depreciation and value adjustments related to decreases and transfers 41 898 15 765 Transfers between items -149 644Accumulated depreciation on 31 December -203 255 -224 923Book value on 31 December 117 448 88 948 The book value of production machinery and equipment on 31 December 99 826 71 348 Advance payments and construction in progress Acquisition cost on 1 January 47 462 16 219 Translation difference -496 -129 Increase 2 369 45 033 Transfers between items -42 582 -13 660Book value on 31 December 6 753 47 462 Revaluations Above mentioned book values include revaluations as follows: Land and water Value on 1 January 3 164 3 770Decrease 0 -606Value on 31 December 3 164 3 164
Paulig Group in brief CEO’s review Review by the Board of DirectorsContents
Paulig Ltd 201827
EUR 1 000 2018 2017
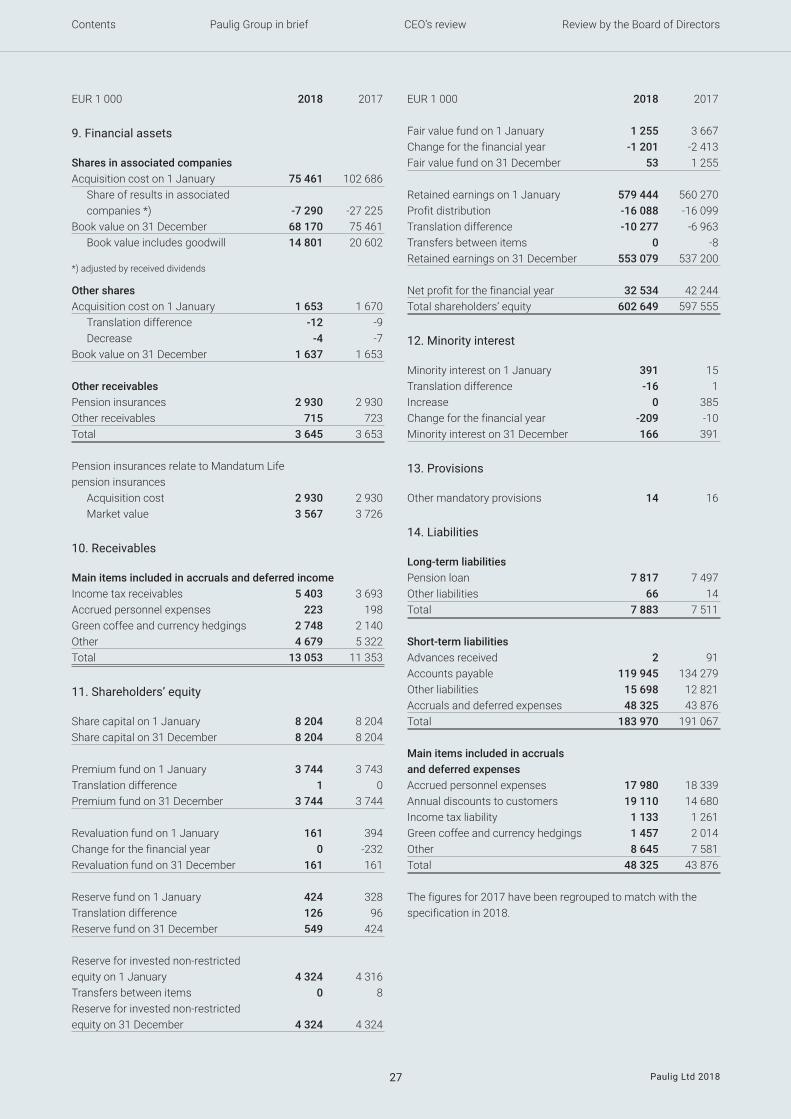
9. Financial assets Shares in associated companies Acquisition cost on 1 January 75 461 102 686 Share of results in associated companies *) -7 290 -27 225Book value on 31 December 68 170 75 461 Book value includes goodwill 14 801 20 602 *) adjusted by received dividends
Other shares Acquisition cost on 1 January 1 653 1 670 Translation difference -12 -9 Decrease -4 -7Book value on 31 December 1 637 1 653 Other receivables Pension insurances 2 930 2 930Other receivables 715 723Total 3 645 3 653 Pension insurances relate to Mandatum Life pension insurances Acquisition cost 2 930 2 930 Market value 3 567 3 726
10. Receivables Main items included in accruals and deferred income Income tax receivables 5 403 3 693Accrued personnel expenses 223 198Green coffee and currency hedgings 2 748 2 140Other 4 679 5 322Total 13 053 11 353
11. Shareholders’ equity Share capital on 1 January 8 204 8 204Share capital on 31 December 8 204 8 204 Premium fund on 1 January 3 744 3 743Translation difference 1 0Premium fund on 31 December 3 744 3 744 Revaluation fund on 1 January 161 394Change for the financial year 0 -232Revaluation fund on 31 December 161 161 Reserve fund on 1 January 424 328Translation difference 126 96Reserve fund on 31 December 549 424 Reserve for invested non-restricted equity on 1 January 4 324 4 316Transfers between items 0 8Reserve for invested non-restricted equity on 31 December 4 324 4 324
EUR 1 000 2018 2017
Fair value fund on 1 January 1 255 3 667Change for the financial year -1 201 -2 413Fair value fund on 31 December 53 1 255 Retained earnings on 1 January 579 444 560 270Profit distribution -16 088 -16 099Translation difference -10 277 -6 963Transfers between items 0 -8Retained earnings on 31 December 553 079 537 200 Net profit for the financial year 32 534 42 244Total shareholders’ equity 602 649 597 555
12. Minority interest Minority interest on 1 January 391 15Translation difference -16 1Increase 0 385Change for the financial year -209 -10Minority interest on 31 December 166 391
13. Provisions Other mandatory provisions 14 16
14. Liabilities Long-term liabilities Pension loan 7 817 7 497Other liabilities 66 14Total 7 883 7 511 Short-term liabilities Advances received 2 91Accounts payable 119 945 134 279Other liabilities 15 698 12 821Accruals and deferred expenses 48 325 43 876Total 183 970 191 067 Main items included in accruals and deferred expenses Accrued personnel expenses 17 980 18 339Annual discounts to customers 19 110 14 680Income tax liability 1 133 1 261Green coffee and currency hedgings 1 457 2 014Other 8 645 7 581Total 48 325 43 876 The figures for 2017 have been regrouped to match with the specification in 2018.
Paulig Group in brief CEO’s review Review by the Board of DirectorsContents
Paulig Ltd 201828
EUR 1 000 2018 2017
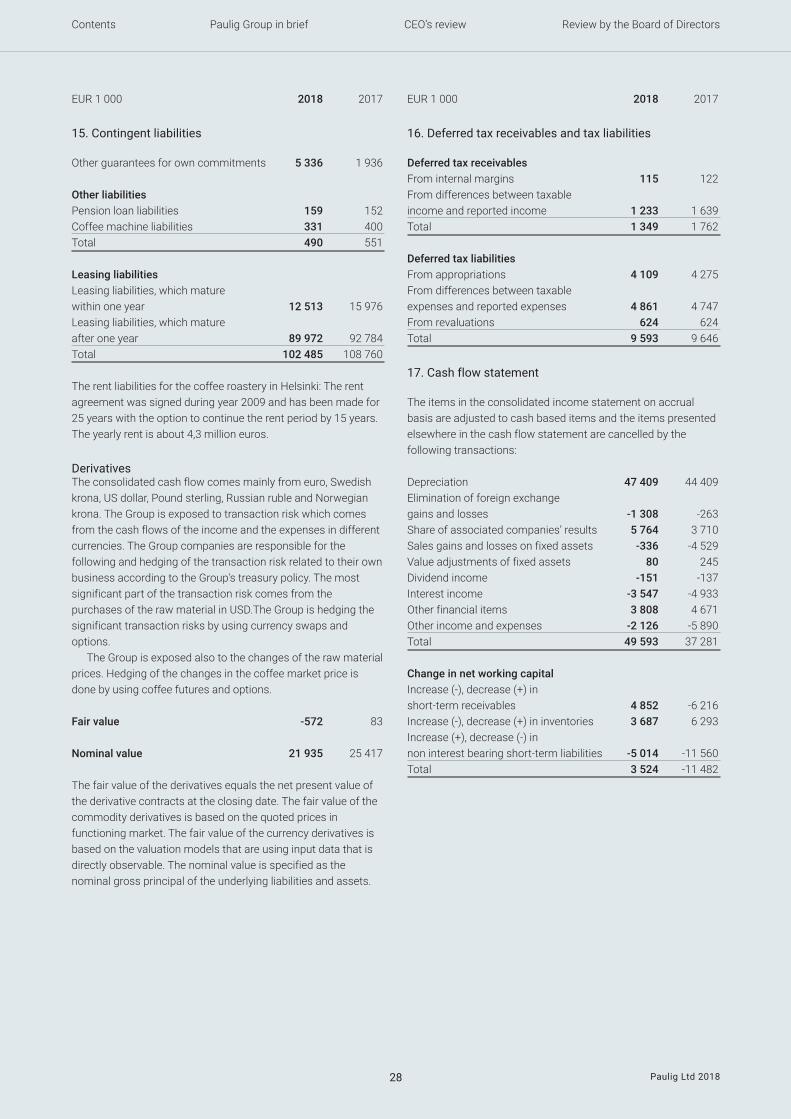
15. Contingent liabilities Other guarantees for own commitments 5 336 1 936 Other liabilities Pension loan liabilities 159 152Coffee machine liabilities 331 400Total 490 551 Leasing liabilities Leasing liabilities, which mature within one year 12 513 15 976Leasing liabilities, which mature after one year 89 972 92 784Total 102 485 108 760 The rent liabilities for the coffee roastery in Helsinki: The rent agreement was signed during year 2009 and has been made for 25 years with the option to continue the rent period by 15 years. The yearly rent is about 4,3 million euros.
Derivatives The consolidated cash flow comes mainly from euro, Swedish krona, US dollar, Pound sterling, Russian ruble and Norwegian krona. The Group is exposed to transaction risk which comes from the cash flows of the income and the expenses in different currencies. The Group companies are responsible for the following and hedging of the transaction risk related to their own business according to the Group's treasury policy. The most significant part of the transaction risk comes from the purchases of the raw material in USD.The Group is hedging the significant transaction risks by using currency swaps and options. The Group is exposed also to the changes of the raw material prices. Hedging of the changes in the coffee market price is done by using coffee futures and options. Fair value -572 83 Nominal value 21 935 25 417 The fair value of the derivatives equals the net present value of the derivative contracts at the closing date. The fair value of the commodity derivatives is based on the quoted prices in functioning market. The fair value of the currency derivatives is based on the valuation models that are using input data that is directly observable. The nominal value is specified as the nominal gross principal of the underlying liabilities and assets.
EUR 1 000 2018 2017
16. Deferred tax receivables and tax liabilities Deferred tax receivables From internal margins 115 122From differences between taxable income and reported income 1 233 1 639Total 1 349 1 762 Deferred tax liabilities From appropriations 4 109 4 275From differences between taxable expenses and reported expenses 4 861 4 747From revaluations 624 624Total 9 593 9 646
17. Cash flow statement The items in the consolidated income statement on accrual basis are adjusted to cash based items and the items presented elsewhere in the cash flow statement are cancelled by the following transactions: Depreciation 47 409 44 409Elimination of foreign exchange gains and losses -1 308 -263Share of associated companies’ results 5 764 3 710Sales gains and losses on fixed assets -336 -4 529Value adjustments of fixed assets 80 245Dividend income -151 -137Interest income -3 547 -4 933Other financial items 3 808 4 671Other income and expenses -2 126 -5 890Total 49 593 37 281 Change in net working capital Increase (-), decrease (+) in short-term receivables 4 852 -6 216Increase (-), decrease (+) in inventories 3 687 6 293Increase (+), decrease (-) in non interest bearing short-term liabilities -5 014 -11 560Total 3 524 -11 482
Paulig Group in brief CEO’s review Review by the Board of DirectorsContents
Paulig Ltd 201829
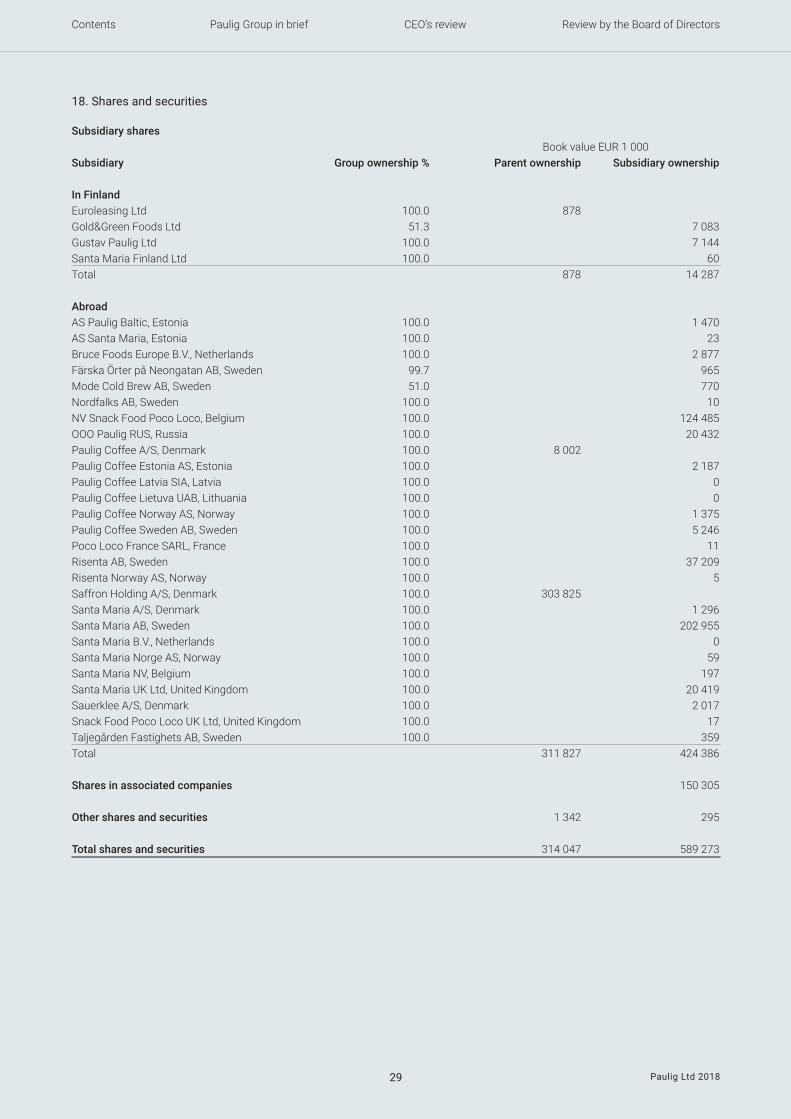
18. Shares and securities Subsidiary shares Book value EUR 1 000Subsidiary Group ownership % Parent ownership Subsidiary ownership In Finland Euroleasing Ltd 100.0 878 Gold&GreenFoodsLtd 51.3 7 083GustavPauligLtd 100.0 7 144Santa Maria Finland Ltd 100.0 60Total 878 14 287 Abroad ASPauligBaltic,Estonia 100.0 1 470AS Santa Maria, Estonia 100.0 23BruceFoodsEuropeB.V.,Netherlands 100.0 2 877Färska Örter på Neongatan AB, Sweden 99.7 965Mode Cold Brew AB, Sweden 51.0 770Nordfalks AB, Sweden 100.0 10NVSnackFoodPocoLoco,Belgium 100.0 124 485OOOPauligRUS,Russia 100.0 20 432PauligCoffeeA/S,Denmark 100.0 8 002PauligCoffeeEstoniaAS,Estonia 100.0 2 187Paulig Coffee Latvia SIA, Latvia 100.0 0Paulig Coffee Lietuva UAB, Lithuania 100.0 0PauligCoffeeNorwayAS,Norway 100.0 1 375PauligCoffeeSwedenAB,Sweden 100.0 5 246Poco Loco France SARL, France 100.0 11RisentaAB,Sweden 100.0 37 209Risenta Norway AS, Norway 100.0 5SaffronHoldingA/S,Denmark 100.0 303 825SantaMariaA/S,Denmark 100.0 1 296SantaMariaAB,Sweden 100.0 202 955Santa Maria B.V., Netherlands 100.0 0Santa Maria Norge AS, Norway 100.0 59Santa Maria NV, Belgium 100.0 197SantaMariaUKLtd,UnitedKingdom 100.0 20 419SauerkleeA/S,Denmark 100.0 2 017Snack Food Poco Loco UK Ltd, United Kingdom 100.0 17Taljegården Fastighets AB, Sweden 100.0 359Total 311 827 424 386 Shares in associated companies 150 305 Other shares and securities 1 342 295 Total shares and securities 314 047 589 273
Paulig Group in brief CEO’s review Review by the Board of DirectorsContents
Paulig Ltd 201830
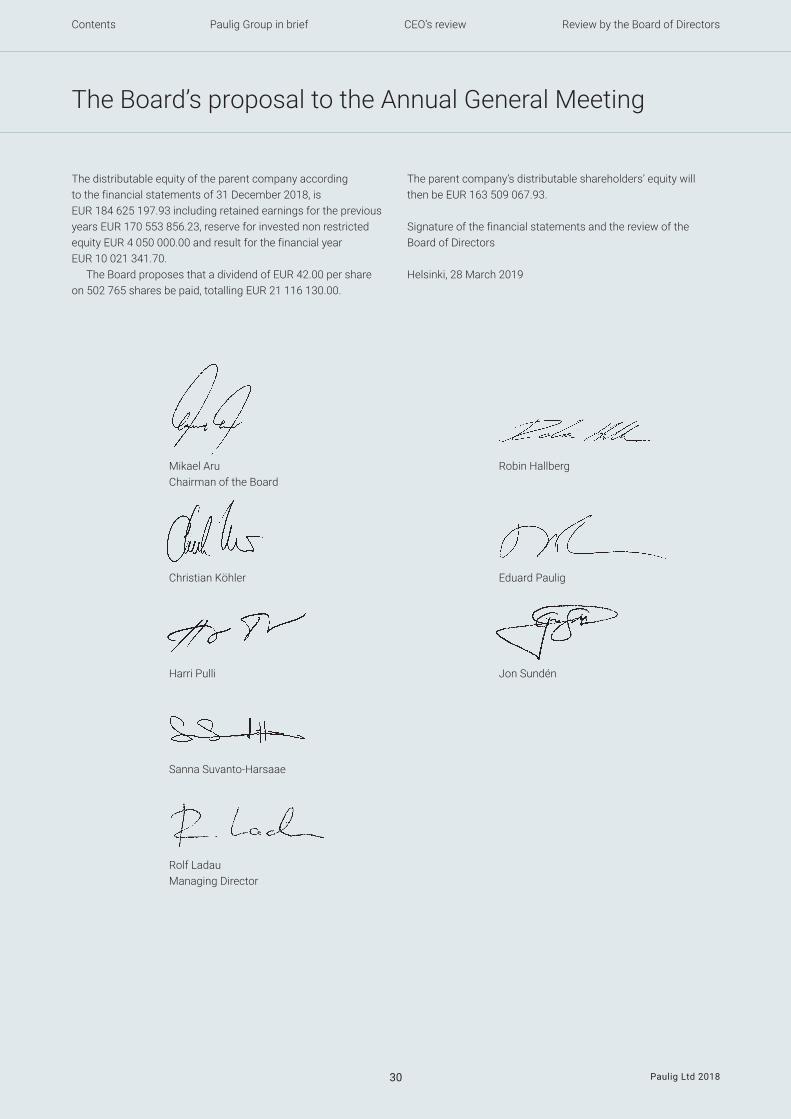
The Board’s proposal to the Annual General Meeting
Mikael Aru Robin Hallberg Chairman of the Board
Christian Köhler Eduard Paulig
Harri Pulli Jon Sundén
Sanna Suvanto-Harsaae
Rolf Ladau Managing Director
The distributable equity of the parent company according to the financial statements of 31 December 2018, is EUR 184 625 197.93 including retained earnings for the previous years EUR 170 553 856.23, reserve for invested non restricted equity EUR 4 050 000.00 and result for the financial year EUR 10 021 341.70.
The Board proposes that a dividend of EUR 42.00 per share on 502 765 shares be paid, totalling EUR 21 116 130.00.
The parent company’s distributable shareholders’ equity will then be EUR 163 509 067.93.
Signature of the financial statements and the review of the Board of Directors Helsinki, 28 March 2019
Paulig Group in brief CEO’s review Review by the Board of DirectorsContents
Paulig Ltd 201831
Auditor’s report To the Annual General Meeting of Paulig Ltd(Translation of the Swedish original)
Report on the Audit of Financial Statements
Opinion We have audited the financial statements of Paulig Ltd (business identity code 0112563-0) for the year ended 31 December, 2018. The financial statements comprise the balance sheets, the income statements, cash flow statements and notes for the group as well as for the parent company.
In our opinion, the financial statements give a true and fair view of the group’s and the company’s financial performance and finan-cial position in accordance with the laws and regulations governing the preparation of financial statements in Finland and comply with statutory requirements.
Basis for Opinion We conducted our audit in accordance with good auditing practice in Finland. Our responsibilities under good auditing practice are fur-ther described in the Auditor’s Responsibilities for the Audit of Fi-nancial Statements section of our report. We are independent of the parent company and of the group companies in accordance with the ethical requirements that are applicable in Finland and are rele-vant to our audit, and we have fulfilled our other ethical responsibili-ties in accordance with these requirements. We believe that the au-dit evidence we have obtained is sufficient and appropriate to provide a basis for our opinion.
Responsibilities of the Board of Directors and the Managing Director for the Financial Statements The Board of Directors and the Managing Director are responsible for the preparation of financial statements that give a true and fair view in accordance with the laws and regulations governing the preparation of financial statements in Finland an comply with statu-tory requirements. The Board of Directors and the Managing Direc-tor are also responsible for such internal control as they determine is necessary to enable the preparation of financial statements that are free from material misstatement, whether due to fraud or error.
In preparing the financial statements, the Board of Directors and the Managing Director are responsible for assessing the parent company’s and the group’s ability to continue as going concern, dis-closing, as applicable, matters relating to going concern and using the going concern basis of accounting. The financial statements are prepared using the going concern basis of accounting unless there is an intention to liquidate the parent company or the group or cease operations, or there is no realistic alternative but to do so.
Auditor’s Responsibilities for the Audit of Financial Statements Our objectives are to obtain reasonable assurance on whether the financial statements as a whole are free from material misstate-ment, whether due to fraud or error, and to issue an auditor’s report that includes our opinion. Reasonable assurance is a high level of assurance, but is not a guarantee that an audit conducted in accor-dance with good auditing practice will always detect a material misstatement when it exists. Misstatements can arise from fraud or error and are considered material if, individually or in aggregate, they could reasonably be expected to influence the economic decisions of users taken on the basis of the financial statements.
As part of an audit in accordance with good auditing practice, we exercise professional judgment and maintain professional skepti-cism throughout the audit. We also: • Identify and assess the risks of material misstatement of the fi-
nancial statements, whether due to fraud or error, design and per-form audit procedures responsive to those risks, and obtain audit evidence that is sufficient and appropriate to provide a basis for our opinion. The risk of not detecting a material misstatement re-sulting from fraud is higher than for one resulting from error, as fraud may involve collusion, forgery, intentional omissions, mis-representations, or the override of internal control.
• Obtain an understanding of internal control relevant to the audit in order to design audit procedures that are appropriate in the
circumstances, but not for the purpose of expressing an opinion on the effectiveness of the parent company’s or the group’s inter-nal control.
• Evaluate the appropriateness of accounting policies used and the reasonableness of accounting estimates and related disclosures made by management.
• Conclude on the appropriateness of the Board of Directors’ and the Managing Director’s use of the going concern basis of ac-counting and based on the audit evidence obtained, whether a material uncertainty exists related to events or conditions that may cast significant doubt on the parent company’s or the group’s ability to continue as a going concern. If we conclude that a mate-rial uncertainty exists, we are required to draw attention in our au-ditor’s report to the related disclosures in the financial statements or, if such disclosures are inadequate, to modify our opinion. Our conclusions are based on the audit evidence obtained up to the date of our auditor’s report. However, future events or conditions may cause the company to cease to continue as a going concern.
• Evaluate the overall presentation, structure and content of the fi-nancial statements, including the disclosures, and whether the fi-nancial statements represent the underlying transactions and events so that the financial statements give a true and fair view.
• Obtain sufficient appropriate audit evidence regarding the finan-cial information of the entities or business activities within the group to express an opinion on the consolidated financial state-ments. We are responsible for the direction, supervision and per-formance of the group audit. We remain solely responsible for our audit opinion.
We communicate with those charged with governance regarding, among other matters, the planned scope and timing of the audit and significant audit findings, including any significant deficiencies in internal control that we identify during our audit.
Other reporting requirements Other informationThe Board of Directors and the Managing Director are responsible for the other information. The other information comprises the re-port of the Board of Directors and the information included in the An-nual Report, but does not include the financial statements and our auditor’s report thereon. We have obtained the report of the Board of Directors prior to the date of this auditor’s report, and the Annual Report is expected to be made available to us after that date.
Our opinion on the financial statements does not cover the other information.
In connection with our audit of the financial statements, our re-sponsibility is to read the other information identified above and, in doing so, consider whether the other information is materially incon-sistent with the financial statements or our knowledge obtained in the audit, or otherwise appears to be materially misstated. With respect to report of the Board of Directors, our responsibility also includes considering whether the report of the Board of Directors has been prepared in accordance with the applicable laws and regulations.
In our opinion, the information in the report of the Board of Direc-tors is consistent with the information in the financial statements and the report of the Board of Directors has been prepared in accor-dance with the applicable laws and regulations.
If, based on the work we have performed on the other informa-tion that we obtained prior to the date of this auditor’s report, we conclude that there is a material misstatement of this other infor-mation, we are required to report that fact. We have nothing to re-port in this regard.
Helsinki, 29 March 2019
Ernst & Young OyAuthorized Public Accountant FirmBengt Nyholm Authorized Public Accountant
Paulig Group in brief CEO’s review Review by the Board of DirectorsContents
Paulig Ltd 201832
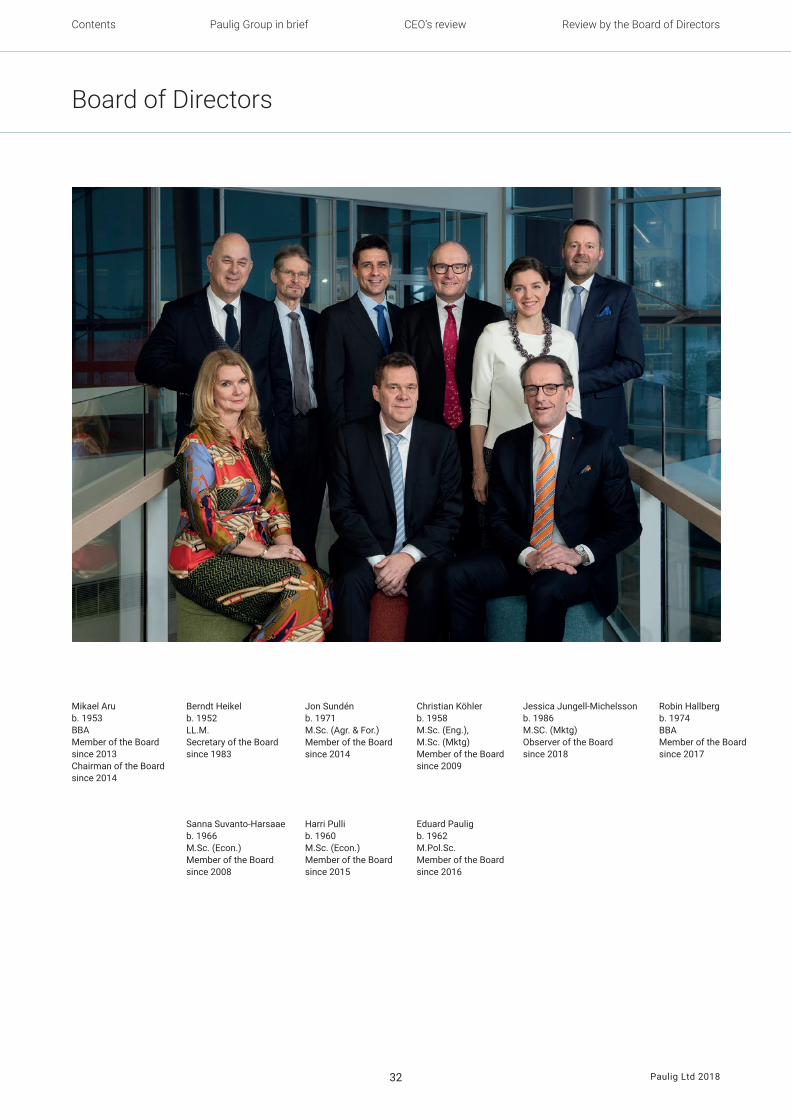
Board of Directors
Mikael Arub. 1953BBAMember of the Board since 2013Chairman of the Board since 2014
Christian Köhlerb. 1958M.Sc. (Eng.), M.Sc. (Mktg)Member of the Board since 2009
Jessica Jungell-Michelssonb. 1986 M.SC. (Mktg) Observer of the Board since 2018
Robin Hallbergb. 1974BBA Member of the Boardsince 2017
Berndt Heikelb. 1952LL.M.Secretary of the Board since 1983
Eduard Pauligb. 1962M.Pol.Sc.Member of the Board since 2016
Harri Pullib. 1960 M.Sc. (Econ.)Member of the Board since 2015
Sanna Suvanto-Harsaaeb. 1966M.Sc. (Econ.)Member of the Board since 2008
Jon Sundénb. 1971M.Sc. (Agr. & For.)Member of the Board since 2014
Paulig Group in brief CEO’s review Review by the Board of DirectorsContents
Paulig Ltd 201833
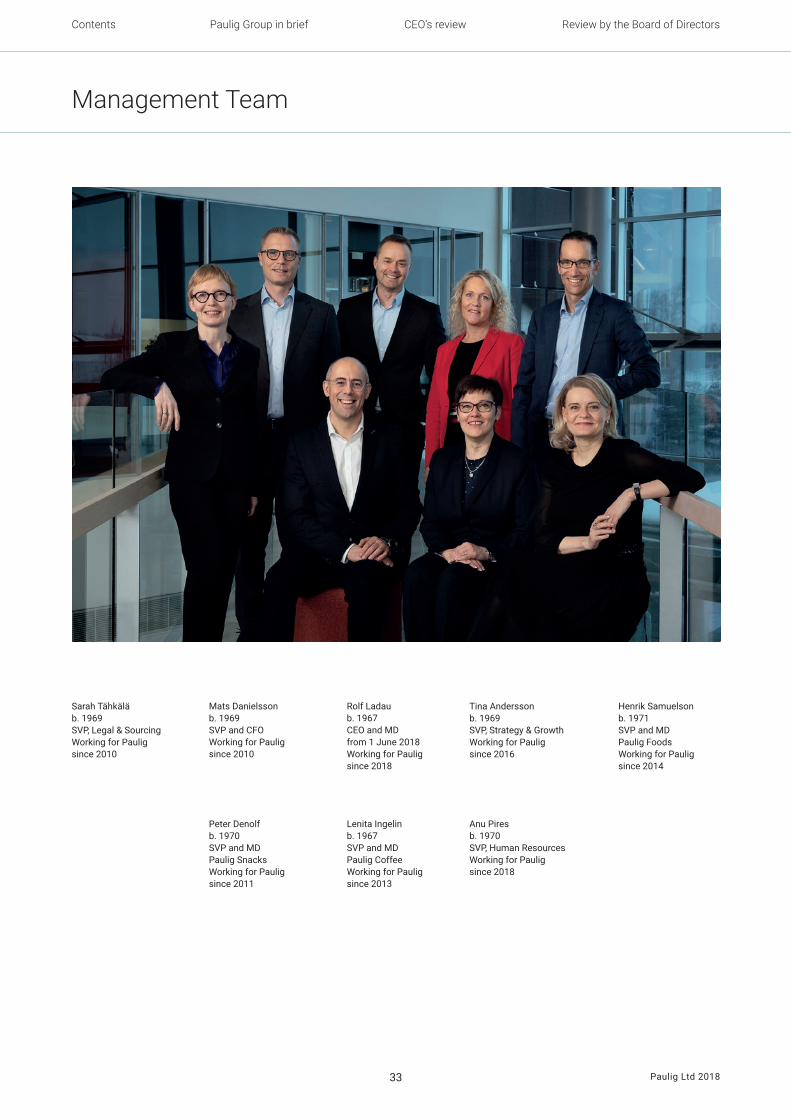
Management Team
Rolf Ladaub. 1967 CEO and MD from 1 June 2018 Working for Paulig since 2018
Lenita Ingelinb. 1967 SVP and MD Paulig Coffee Working for Paulig since 2013
Anu Piresb. 1970 SVP, Human Resources Working for Paulig since 2018
Mats Danielssonb. 1969SVP and CFOWorking for Paulig since 2010
Peter Denolfb. 1970SVP and MD Paulig SnacksWorking for Paulig since 2011
Henrik Samuelsonb. 1971SVP and MDPaulig FoodsWorking for Pauligsince 2014
Tina Anderssonb. 1969 SVP, Strategy & GrowthWorking for Paulig since 2016
Sarah Tähkäläb. 1969SVP, Legal & SourcingWorking for Paulig since 2010
Paulig Group in brief CEO’s review Review by the Board of DirectorsContents
Paulig Ltd 201834
Definitions
Contact information
Paulig LtdCommunicationsTelephone +358 9 319 [email protected]
Operating profit x 100Net Sales Result before taxes and minority interest x 100Shareholders’ equity + minority interest (average) Shareholders’ equity + minority interest x 100Net assets – advances received Interest-bearing liabilities – cash and bank Interest-bearing liabilities + advances received – cash and bank x 100Shareholders’ equity + minority interest
Operating profit %
Return on equity %
Equity ratio %
Net debt
Gearing %
Design: Sininen Arkki • Printed by Kirjapaino Öhrling Oy, 2019 • Photos: Paulig Group, Valtteri Kantanen and ShutterstockThis product is printed on Arjowiggins Cocoon Offset paper that is 100% recycled paper. The European Union Ecolabel reg.nr FR/011/003 has been awarded to the paper.
Paulig Group in brief CEO’s review Review by the Board of DirectorsContents
Paulig Ltd 201835
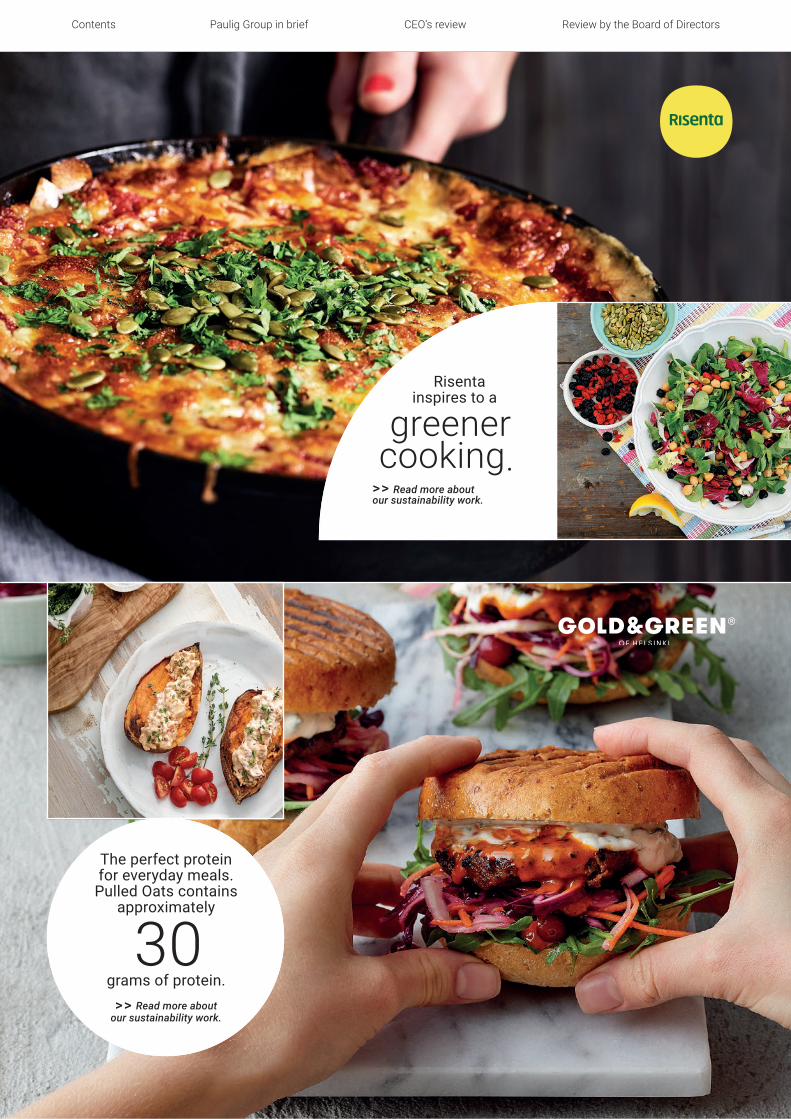
The perfect protein for everyday meals.
Pulled Oats contains approximately
30
grams of protein. > > Read more about
our sustainability work.
Risenta
inspires to a
greener cooking.
> > Read more about our sustainability work.
Paulig Group in brief CEO’s review Review by the Board of DirectorsContents
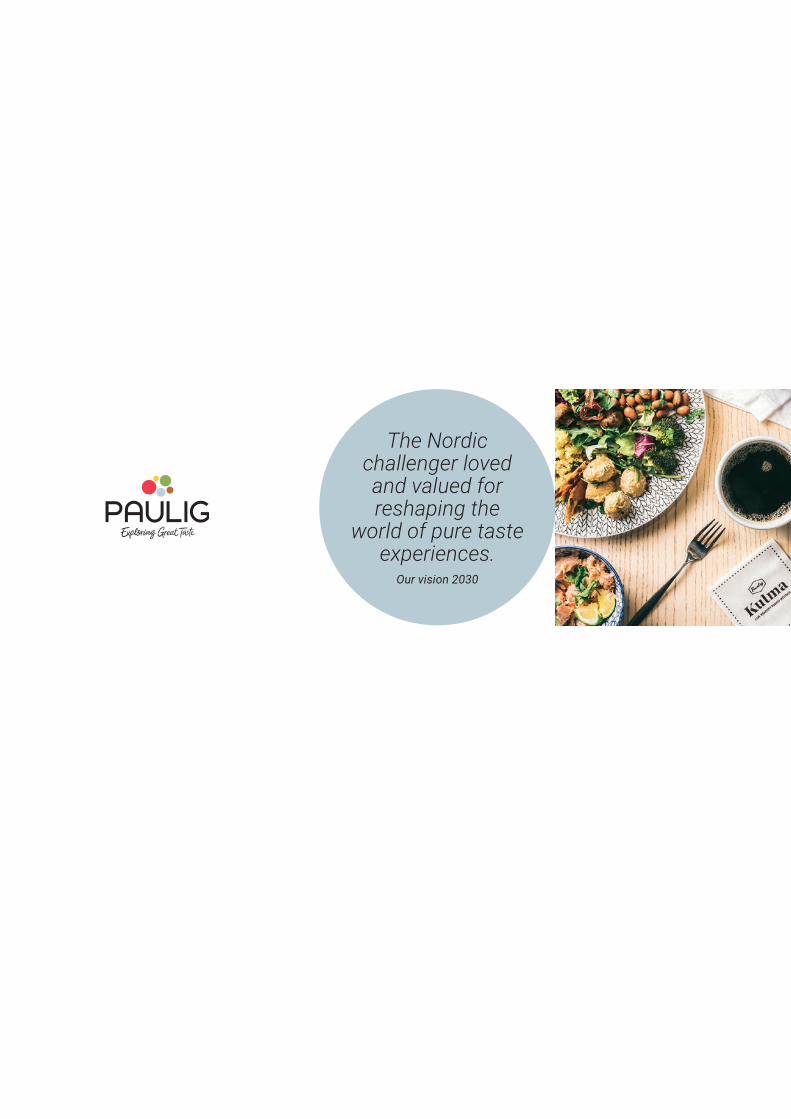
The Nordic challenger loved and valued for reshaping the
world of pure taste experiences.
Our vision 2030