annual report and accounts 2012 - ashmore groupashmore group plc | annual report and accounts 2012...
TRANSCRIPT
Annual Report and Accounts 2012

Latin America
Great alpha opportunities in liquid marketsStrongly contrasting macro dynamics, exposure to global markets, and a variety of domestic policy choices offer investors in Latin America a rich variety of opportunities right across the spectrum of sovereigns, corporates, FX, rates, equities, and in the special situations space. The rapid expansion of pension systems and bulging FX reserves have significantly reduced the region’s vulnerability to commodity price movements.
Middle East and Africa
Opportunities off the beaten pathThe Middle East and Africa now comprise nearly one third of established Emerging Market issuers and the region has the fastest evolving capital markets in the world. Value opportunities, many off-benchmark, are backed by strong growth, low leverage, and solid sovereign support. More Frontier Market issuers are entering global capital markets for the first time from this region than from any other.
Regional GDP (% of global total)
Ashmore AuM Investment in Middle East and Africa
Regional growth statistics
+7% +8.0%
from 2011
Middle East and Africa:
US$7.3bn
Latin America:
US$21.0bn
Regional GDP (% of global total)
Ashmore AuM Investment in Latin America
Regional growth statistics
+9% +1.9%
from 2011
30
25
15
10
5
20
0 A B C D
CA
GR
(200
4-11
)
30
25
15
10
5
20
0 A B C D
CA
GR
(200
4-11
)
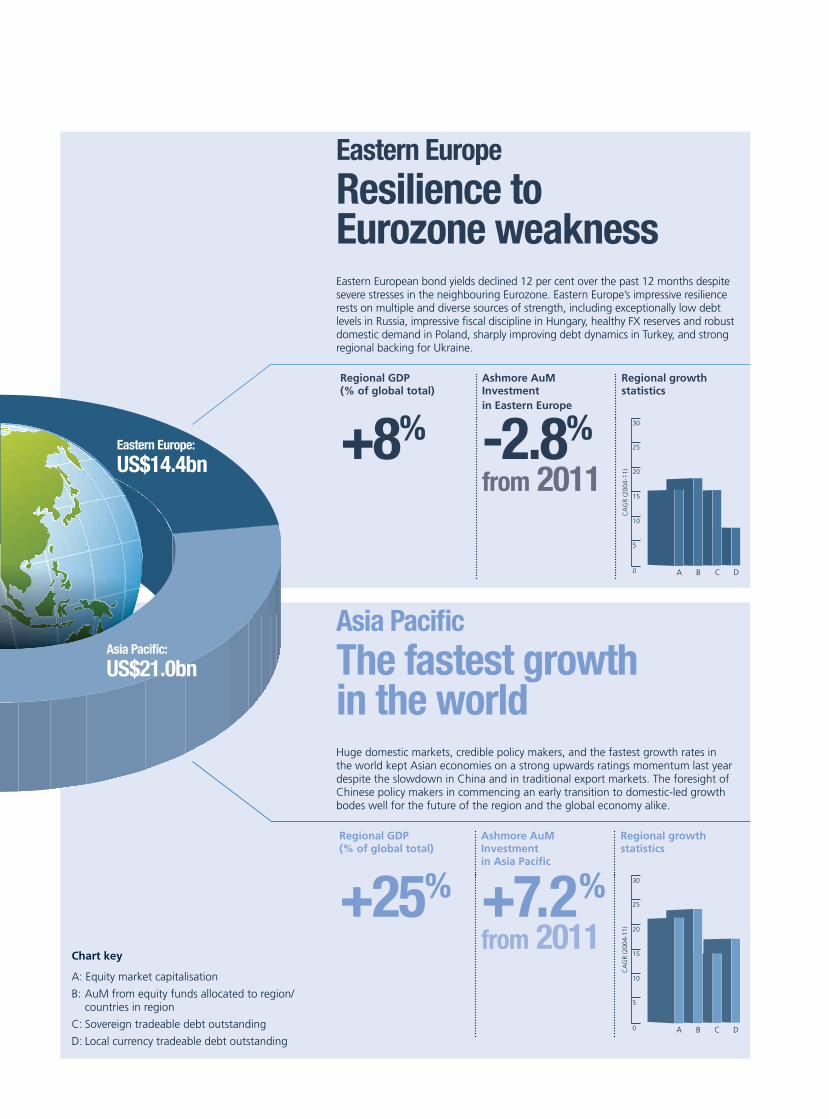
Eastern Europe
Resilience to Eurozone weaknessEastern European bond yields declined 12 per cent over the past 12 months despite severe stresses in the neighbouring Eurozone. Eastern Europe’s impressive resilience rests on multiple and diverse sources of strength, including exceptionally low debt levels in Russia, impressive fiscal discipline in Hungary, healthy FX reserves and robust domestic demand in Poland, sharply improving debt dynamics in Turkey, and strong regional backing for Ukraine.
Asia Pacific
The fastest growth in the worldHuge domestic markets, credible policy makers, and the fastest growth rates in the world kept Asian economies on a strong upwards ratings momentum last year despite the slowdown in China and in traditional export markets. The foresight of Chinese policy makers in commencing an early transition to domestic-led growth bodes well for the future of the region and the global economy alike.
Regional GDP (% of global total)
Ashmore AuM Investment in Asia Pacific
Regional growth statistics
+25% +7.2%
from 2011
Eastern Europe:
US$14.4bn
Asia Pacific:
US$21.0bn
Chart key
A: Equity market capitalisation
B: AuM from equity funds allocated to region/ countries in region
C: Sovereign tradeable debt outstanding
D: Local currency tradeable debt outstanding
Regional GDP (% of global total)
Ashmore AuM Investment in Eastern Europe
Regional growth statistics
+8% -2.8%
from 2011
30
25
15
10
5
20
0 A B C D
CA
GR
(200
4-11
)
30
25
15
10
5
20
0 A B C D
CA
GR
(200
4-11
)

Overlay/Liquidity
13%
Local currency
16%
Corporate debt
4%
Alternatives
4%Multi-strategy
9%
External debt
25%
Blended debt
19%
Equities
10%
Ashmore Group plc | Annual Report and Accounts 2012 1
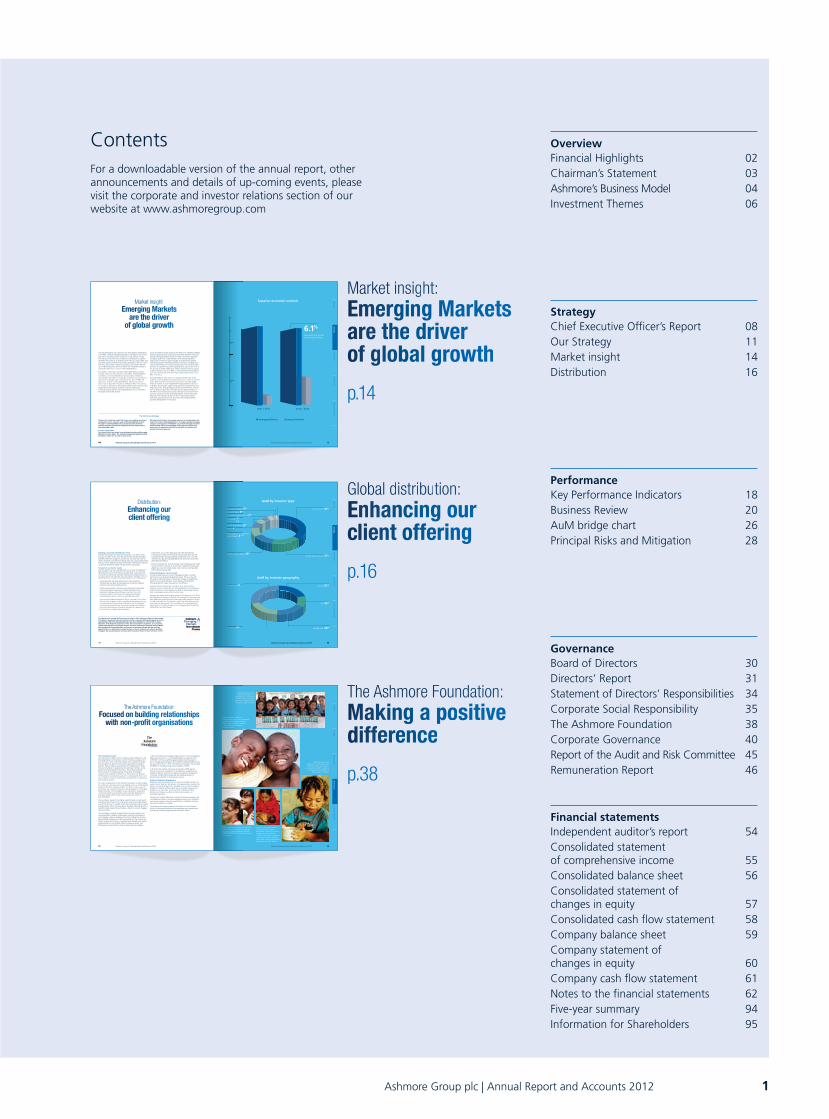
OverviewFinancial Highlights 02Chairman’s Statement 03Ashmore’s Business Model 04Investment Themes 06
StrategyChief Executive Officer’s Report 08Our Strategy 11Market insight 14Distribution 16
PerformanceKey Performance Indicators 18Business Review 20AuM bridge chart 26Principal Risks and Mitigation 28
GovernanceBoard of Directors 30Directors’ Report 31Statement of Directors’ Responsibilities 34Corporate Social Responsibility 35The Ashmore Foundation 38Corporate Governance 40Report of the Audit and Risk Committee 45Remuneration Report 46
Financial statementsIndependent auditor’s report 54Consolidated statement of comprehensive income 55Consolidated balance sheet 56Consolidated statement of changes in equity 57Consolidated cash flow statement 58Company balance sheet 59Company statement of changes in equity 60Company cash flow statement 61Notes to the financial statements 62Five-year summary 94Information for Shareholders 95
Contents
Gloobal ddistribuutiooon:EEEnnnnnhhaaannnnccinnng oooour ccclliieennnt offfeeerinnnng
p.16
Thee Ashhmorre FFooundattion:MMMMaaaakkkinnnngg aaa poooositivve dddiifffffeeereeeennccee
p.38
Maarket insigghtt:EEEmmmmmmeeergggginnggg MMaarkeets aaarrreeee ttthee drriveeeer ooofff gglllobbbbaal groooowthh
p.14
38 Ashmore Group plc | Annual Report and Accounts 2012
Go
vernan
ceO
verviewStrategy
Performance
Financial statements
TTThee AAAshhmooore FFouunddation:FFooccuuusseed onnn n buuillldiinngg rrelationships
wwiwittth nooonn---prrooofififi t oorrgganisations
The Foundation’s AimsThe Ashmore Foundation aims to make a positive difference in the Emerging Market communities in which Ashmore operates and in the countries in which Ashmore invests. The Foundation provides fi nancial grants to effective non-profi t organisations working to enhance human welfare, opportunities and capabilities for those that are vulnerable or neglected and in particular children, young people and marginalised communities. The Emerging Market focus allows for increased leverage of the skills, knowledge, expertise and networks of Ashmore to deliver the social goals of the Foundation and provides support for a thriving and diverse civil sector, which is essential to democratic development in transitional and emerging nations.
The grant making policy of the Ashmore Foundation is wide ranging but maintains a particular focus on providing access to and improving quality of education and basic health, the former in particular seen as the best way to help the long-term self-development of Emerging Market countries. The Foundation is also interested in supporting community-based social enterprise and sustainable livelihoods, to empower people with the tools and resources with which to help themselves.
The Foundation supports charitable causes through a Small Grants and Partnership scheme. The Small Grants scheme provides fl exible one-off funds of up to £5,000, whilst the Partnership Grants scheme provides larger, often multi-year grants, building relationships with a handful of particularly strong charities or NGOs in pursuit of agreed social outcomes.
The Foundation primarily sources partners through research and recommendation, seeking locally-based, emerging organisations which display a deep knowledge of the local context and culture, demonstrable involvement of and commitment to the community served, a good track record in meeting clearly defi ned social needs, professionalism, accountability, ability to measure results, cost-effectiveness and potential to scale or disseminate knowledge.
In 2011, the Ashmore Foundation paid out £473,710 to 23 grantees delivering social work in 11 Emerging Market countries (up from £197,690 in 2010), benefi tting approximately 60,000 people. In 2011, trustees approved grant commitments totalling £768,000 over the period from 2011 – 2014. The Ashmore Foundation has donated £934,832 to charitable causes since inception in 2008.
In 2012 the Foundation will also be funding the STARS Impact Awards in Asia as a complement to its approach, awarding much needed funding to and shining a light on exceptional examples of innovative frontline NGOs delivering life changing services to disadvantaged children in developing countries.
Ashmore Employee EngagementEmployees have the opportunity to recommend eligible charities for support by the Ashmore Foundation. All organisations considered for support are assessed against the standard criteria of the Foundation designed to identify well managed and accountable organisations. Employees can also make use of matched funding offered by Ashmore for donations and by the Ashmore Foundation to Foundation grantees.
The board of trustees (directors) comprises Ashmore employees and an independent director. Ashmore employee directors are rotated to ensure new members have the opportunity to contribute and learn from the Foundation’s activities.
The Ashmore Foundation presents information on local charities within the Emerging Markets to fi rm employees on a regular basis, including showcasing by grantees at Ashmore’s offi ces.
Class sponsored by the Ashmore Foundation at
the Philippine Community Fund’s community school
for children living in Tondo or Navotas slum in Manila
Sunday and Joe, residents at Mama Laadi’s foster home supported by Ashmore Foundation grantee, Afrikids, which works to alleviate child suffering and poverty in Northern Ghana
Girl-friendly soccer training is combined with nutrition and life skills workshops for at-risk children and youth through grantee, Futbol Con Corozon at La Playa in Colombia
A pre and post natal satellite clinic delivered by Impact Bangladesh as part of a holistic programme funded by the Ashmore Foundation to reduce malnutrition, protect mothers and babies, and provide primary healthcare to 22,500 people
Nutritious meals and supplements along with family education and social support,
are provided by Nu3 Foundation for malnourished children in
Barranquilla, Colombia
Go
vernan
ce
Ashmore Group plc | Annual Report and Accounts 2012 39
Class spAshmor
the PhilippFund’s co
for childrenor Navotas
SuSununundaay y aandnd Joeoeoe, e, residents atMMaaamama LLaLaadadi’s fffososter home subyby Ay Ay Ashshmmmorere Fooouundation granAAfrfrfrikididss, , whwhichhh wworks to allevchchililild ssuufffferring g g anand poverty inNNorororthherernrn GGhannnaa
GGirrrl-frfrieenndlyly soooccccer training iswwittth nnuuttritition aaannd life skills wfofor r r at-t-ririssk cchildddrreen and youthggraaanteteee, e, Fuutboool CCon Corozoninn CCCololomommbiabia
Ashmore Group plc | Annual Report and Accounts 2012 1716 Ashmore Group plc | Annual Report and Accounts 2012
Overview
Performance
Governance
Financial statements
Strategy
Ashmore Group plc | Annual Report and Accounts 2012 17
Diiistribbbbutitioon:EEEEnhhaaanccccinngg our cccclieennnt oooofffeering
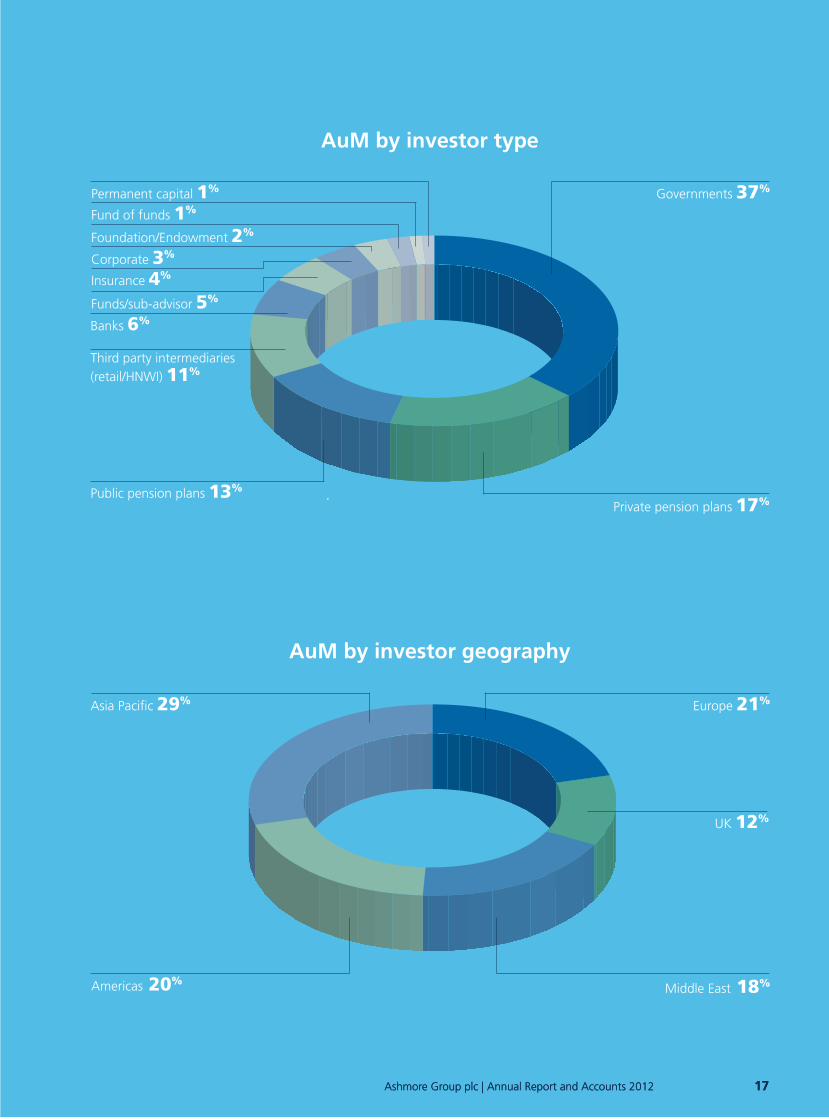
Private pension plans 17%Public pension plans 13%
Governments 37%
Insurance 4%Corporate 3%Foundation/Endowment 2%
Fund of funds 1%Permanent capital 1%
Banks 6%
Asia Pacific 29%
Middle East 18%
UK 12%
Europe 21%
Third party intermediaries (retail/HNWI) 11%
Funds/sub-advisor 5%
AuM by investor type
AuM by investor geography
Building a world class distribution team Ashmore has always had a culture of focusing on our clients’ needs. Our goal is simple: we aim to be the pre-eminent specialist Emerging Markets investment manager. To achieve this, we know that all of us need to be totally committed to building close and ongoing relationships with our clients. Testament to that commitment is the fact that many of our clients have been invested with Ashmore for many years.
Focused on our clients’ needsOver the period we have strengthened our account management teams globally. This has allowed us to keep close to our growing client base so that we can better anticipate their needs and focus our resources where they have the most impact. Feedback from our clients has led to a number of enhancements to our client service:
– Client reporting. We have enhanced our client reporting, introducing more depth and transparency and quicker delivery, and have more improvement planned.
– Client communications. We have recruited product specialists who are focused on keeping our clients informed on our investment strategy and performance outlook. Given the continuing market uncertainty, this ongoing and regular communication with our clients is especially important.
– Structured and tailored education. This is a key part of our client offering. One example of this is a residential programme we run in partnership with Cass Business School for our central bank and sovereign wealth clients. As well as hearing from Ashmore investment professionals, attendees also have the opportunity to hear from a number of guest speakers.
– Client events. As our client base grows we have responded by increasing the number of client events we hold. May 2012 saw the inaugural Ashmore Emerging Markets Investment Forum in London held over two days and was attended by key clients from around the globe (discussed below).
– Product Development. During the year we provided access through 40 Act and SICAV vehicles to all our main investment themes and added new ones in Frontier equity, local currency corporate debt and investment grade debt.
Understanding our clients’ worldsAs well as expanding our account management team, we have also built out our business development team. This is in line with the second and third phases of Ashmore’s strategy of establishing Ashmore as a trusted allocator across themes and mobilising Emerging Markets capital managed on and offshore.
Growing the team means we can talk to more clients in their domestic market and deepen our understanding of local regulations and requirements. It also supports our goal of maintaining diversity both in geographical spread and in client type.
Ashmore has made good initial progress in the expansion of its Third Party Distribution business in Europe. Our strategy of partnering with both global and regional private banks and wealth managers as well as making inroads into the platform market has started to generate asset flows for the business. The foundations that have been built over the past 12 months will put us in a strong position to take this distribution franchise forward.
Americas 20%
Our objective for hosting the Forum was not only to offer clients an insight into the breadth of Ashmore’s investment services, but also to bring a variety of different perspectives on the opportunities offered by Emerging Markets. We were delighted to welcome Mr Jin Liqun, Chairman of the Board of Supervisors of the China Investment Corporation, as our keynote speaker opening the Forum, Naguib Sawiris, Executive Chairman of Orascom Telecom Media and Henrique de Campos Meirelles, ex-Governor of the Bank of Brazil. We also took the opportunity to run workshops in smaller groups so clients could interact with our portfolio managers. We are planning our next key client Investment Forum in New York later in 2012.
PPPubblicc c ppension plan
InInsusurananancnce 4%CCCororpopoorrate 3%FFouundddatation/Endow
FFunnd ooof f funds 1%PPermrmaaanenent capital
BBBannkss s 66%
AAAsiaia PPaPaacific 29%
TTThirird ppaparty interme(r(r(retatail/l/H/HHNWI) 11%
FFunnds/s/s/susub-advisor
AAAmmerriciccas 20%
Ashmore Group plc | Annual Report and Accounts 2012 1514 Ashmore Group plc | Annual Report and Accounts 2012
Overview
Performance
Governance
Financial statements
Strategy
14 Ashmore Group plc | Annual Report and Accounts 2012
Mararrkket ininsiggght:EEmeeergigiinng MMaMarkkkketss
aaare ttththe drrrivererrr of globobbbal grrrowwtwtwth
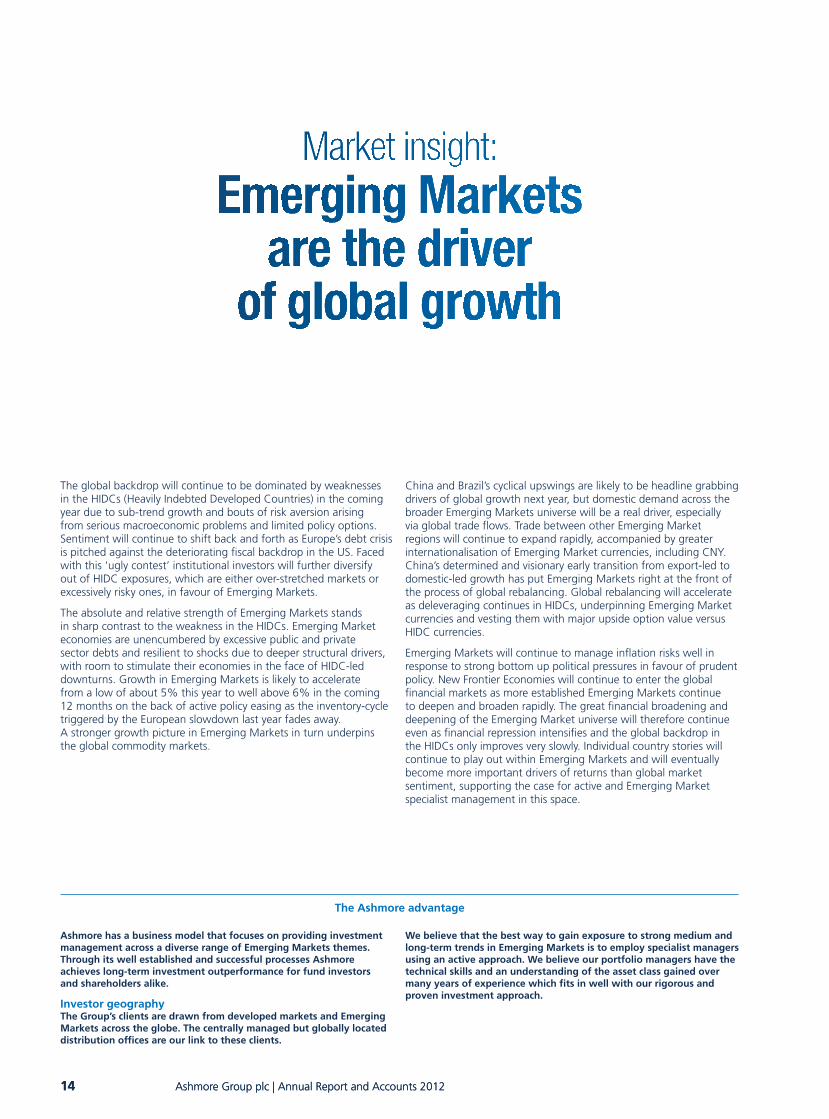
The global backdrop will continue to be dominated by weaknesses in the HIDCs (Heavily Indebted Developed Countries) in the coming year due to sub-trend growth and bouts of risk aversion arising from serious macroeconomic problems and limited policy options. Sentiment will continue to shift back and forth as Europe’s debt crisis is pitched against the deteriorating fiscal backdrop in the US. Faced with this ‘ugly contest’ institutional investors will further diversify out of HIDC exposures, which are either over-stretched markets or excessively risky ones, in favour of Emerging Markets.
The absolute and relative strength of Emerging Markets stands in sharp contrast to the weakness in the HIDCs. Emerging Market economies are unencumbered by excessive public and private sector debts and resilient to shocks due to deeper structural drivers, with room to stimulate their economies in the face of HIDC-led downturns. Growth in Emerging Markets is likely to accelerate from a low of about 5% this year to well above 6% in the coming 12 months on the back of active policy easing as the inventory-cycle triggered by the European slowdown last year fades away. A stronger growth picture in Emerging Markets in turn underpins the global commodity markets.
China and Brazil’s cyclical upswings are likely to be headline grabbing drivers of global growth next year, but domestic demand across the broader Emerging Markets universe will be a real driver, especially via global trade flows. Trade between other Emerging Market regions will continue to expand rapidly, accompanied by greater internationalisation of Emerging Market currencies, including CNY. China’s determined and visionary early transition from export-led to domestic-led growth has put Emerging Markets right at the front of the process of global rebalancing. Global rebalancing will accelerate as deleveraging continues in HIDCs, underpinning Emerging Market currencies and vesting them with major upside option value versus HIDC currencies.
Emerging Markets will continue to manage inflation risks well in response to strong bottom up political pressures in favour of prudent policy. New Frontier Economies will continue to enter the global financial markets as more established Emerging Markets continue to deepen and broaden rapidly. The great financial broadening and deepening of the Emerging Market universe will therefore continue even as financial repression intensifies and the global backdrop in the HIDCs only improves very slowly. Individual country stories will continue to play out within Emerging Markets and will eventually become more important drivers of returns than global market sentiment, supporting the case for active and Emerging Market specialist management in this space.
Superior economic outlook
1
0
2
3
4
5
6
7
Emerging Markets Developed Markets
2007 – 2011 2012 – 2016
6.1% Forecasted GDP growth for Emerging Markets
The Ashmore advantage
Ashmore has a business model that focuses on providing investment management across a diverse range of Emerging Markets themes. Through its well established and successful processes Ashmore achieves long-term investment outperformance for fund investors and shareholders alike.
Investor geographyThe Group’s clients are drawn from developed markets and Emerging Markets across the globe. The centrally managed but globally located distribution offices are our link to these clients.
We believe that the best way to gain exposure to strong medium and long-term trends in Emerging Markets is to employ specialist managers using an active approach. We believe our portfolio managers have the technical skills and an understanding of the asset class gained over many years of experience which fits in well with our rigorous and proven investment approach.
11
00
22
33
44
55
66
77
For a downloadable version of the annual report, other announcements and details of up-coming events, please visit the corporate and investor relations section of our website at www.ashmoregroup.com

2 Ashmore Group plc | Annual Report and Accounts 2012
Financial Highlights
Net revenue(£m) £333.3m
-0%
0 08 09 10 11 12
350
300
250
200
150
100
50
Assets under Management (AuM) (US$bn) US$63.7bn
-3%
0 08 09 10 11 12
80
60
40
20
Profit before tax(£m) £243.2m
-1%
0 08 09 10 11 12
250
200
150
100
50
EPS basic(p) 26.8p
-4%
0 08 09 10 11 12
30
25
20
15
10
5

“
“Chairman’s Statement
Demonstrable progress in raising and retaining assets, utilising specialist knowledge and skills to invest.
As shareholders will be aware, global economies are currently facing many challenges, not least of which centre round the European debt crisis and the contraction of trade around the world. Such conditions create great uncertainty, which in turn lead to considerable market volatility. Against this background Ashmore has had a year of consolidation, one in which it has been able to use its specialist knowledge and skills to enhance its scalable operating platform. This is a key component for achieving success in any asset management business and the Chief Executive Officer’s report and Business Review which follow provide details of what has been achieved.
In financial terms, the Group has produced a solid performance. The closing level of AUM was US$ 63.7 billion, marginally down from last year, which reflects the impact of difficult and volatile market conditions. Despite this, a number of the asset classes have grown through net inflows. As against last year the Group’s revenues have fallen very marginally, largely due to the anticipated reduction in performance fees. This fall was mitigated to some extent by increased management fees.
A little over a year ago the Group completed the acquisition of AshmoreEMM and after a considerable amount of planning the business has been successfully integrated into the Group and the new equity team is operating well. Looking forward, the Group is determined to grow its equity footprint and the experience which AshmoreEMM has developed over many years will provide a sturdy platform to help achieve this.
The Board continues to place great emphasis on all issues surrounding corporate governance and it welcomes the appointment of Simon Fraser, who joined the Group as a Non-executive Director in February this year. He has had a long and extensive career in the field of investment management and his experience will be very helpful to the Board. We are looking to appoint a further Non-executive Director in due course. Jonathan Asquith, who has been on the Board since September 2008, will retire and not seek re-election at the AGM.
On behalf of the Board I would like to thank him for the service and contribution that he has given to the Group during this period.
Although the Group saw a modest fall in earnings per share, as against last year, the Board remains confident about the future and the growth of the operations and the Directors are recommending a final dividend of 10.75p a share for the year to 30 June 2012, which, subject to shareholders’ approval, will be paid on 7 December, to those shareholders on the register on 9 November. This makes a total dividend for the year of 15.00p a share (FY2010/11: 14.50p a share).
While the challenges facing the global markets look likely to continue, Ashmore’s investment team will continue to strive to produce top class investment performance, through its exclusive focus on the Emerging Markets. The distribution and support teams will also seek to win, serve and retain the assets of the Group’s diverse and growing client base.
Looking back over the year there is much that has been accomplished, but there are always areas where improvements can be made and the Group remains totally committed to achieving the highest standards and levels of excellence in everything it does.
The Board is grateful to everyone across the Group’s global offices for their hard work and commitment over the past year.
Michael Benson Chairman
Ashmore Group plc | Annual Report and Accounts 2012 3
4 Ashmore Group plc | Annual Report and Accounts 2012
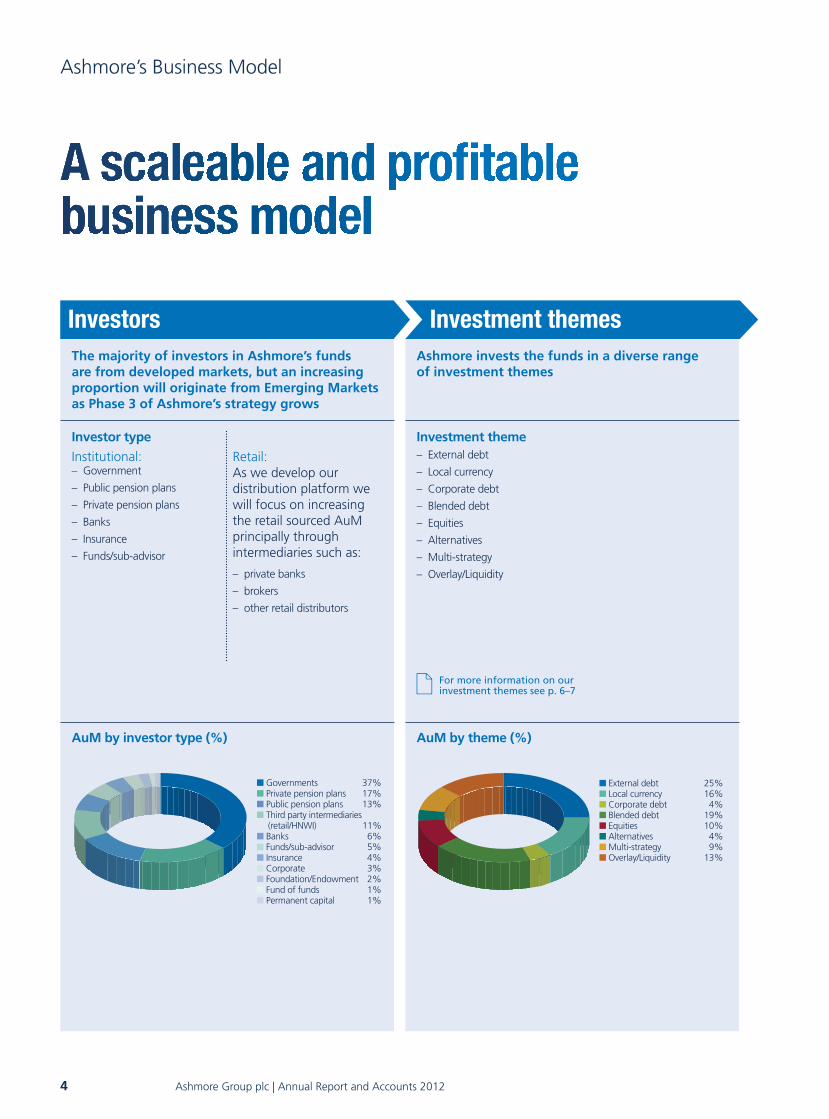
The majority of investors in Ashmore’s funds are from developed markets, but an increasing proportion will originate from Emerging Markets as Phase 3 of Ashmore’s strategy grows
Ashmore invests the funds in a diverse range of investment themes
Ashmore’s Business Model
AuM by investor type (%) AuM by theme (%)
Governments 37% Private pension plans 17% Public pension plans 13% Third party intermediaries
(retail/HNWI) 11% Banks 6% Funds/sub-advisor 5% Insurance 4% Corporate 3% Foundation/Endowment 2% Fund of funds 1% Permanent capital 1%
External debt 25% Local currency 16% Corporate debt 4% Blended debt 19% Equities 10% Alternatives 4% Multi-strategy 9% Overlay/Liquidity 13%
Investment themesInvestors
Investor type
Institutional: – Government
– Public pension plans
– Private pension plans
– Banks
– Insurance
– Funds/sub-advisor
Retail:As we develop our distribution platform we will focus on increasing the retail sourced AuM principally through intermediaries such as:
– private banks
– brokers
– other retail distributors
Investment theme – External debt
– Local currency
– Corporate debt
– Blended debt
– Equities
– Alternatives
– Multi-strategy
– Overlay/Liquidity
For more information on our investment themes see p. 6–7

Ashmore Group plc | Annual Report and Accounts 2012 5
Ashmore improves the performance of these funds through the expertise of its people, through its relationships and by rigorous adherence to a proven investment philosophy and a unique commitment to Emerging Markets
By applying this unique business model, Ashmore continues to outperform
OutperformanceMaximising the Ashmore advantage
Expertise and commitment – 20 years’ experience of investing in Emerging Markets
– Team-based approach, not a star culture
– Quality of Ashmore’s employees, depth, breadth and experience in Emerging Markets
– Relationships with investors, investees and other contacts in over 60 Emerging Markets countries
Underpinned by – Support departments ensure robust and controlled processes
– Legal, Risk and Compliance ensure appropriate governance
– A risk aware culture throughout the organisation
Investment philosophy – Global and local asset management bringing together macro views and deep analysis of individual investments
– Specialist long-term approach
– Proven across a wide range of market conditions
– Active forward-looking fund management of portfolios over market cycles
Assets under management (AuM) at period end
US$63.7bn2011: US$65.8bn
EBITDA margin
71%2011: 73%
AuM outperforming benchmark over three years
86%2011: 71%
External debt, Local currency & Blended debt Corporate debt
Macro, top-down overlay
Sector strategy
Bottom up stock selection
Equities
Top down country allocationCountry analysis
Bottom up stock selectionInstrument selection
Portfolio construction
Execution process
Global macro overview

6 Ashmore Group plc | Annual Report and Accounts 2012
Investment Themes
Themes External debt
Local currency
Corporate debt
Theme premise A highly diversified portfolio of Emerging Markets debt assets with a primary focus on external debt.
Takes advantage of the rapidly expanding local currency and local currency denominated debt market with low correlations to other asset classes.
Focuses on the developing corporate debt asset class inEmerging Markets.
Global Emerging Markets sub-themes
– Broad
– Sovereign
– Sovereign, investment grade
– Broad
– FX
– Bonds
– Investment grade
– Inflation linked
– Broad
– High yield
– Investment grade
– Local currency
Theme Blended debt
Theme premise Mandates specifically combine external, local currency and sometimes corporatedebt measured against tailor-made blended indices.
Regional/country focused sub-theme
Russia Asia, Brazil, China, Turkey Asia, Brazil, China, Turkey
Theme Multi-strategy
Theme premise Dynamic asset allocation across all investment themes.

Ashmore Group plc | Annual Report and Accounts 2012 7
Equities Alternatives Overlay/ Liquidity
Utilising top down macro country skills together with the bottom up micro investing excellence of one of the largest dedicated corporate research teams in Emerging Markets equities.
Investments are mainly in corporate restructurings through distressed debt, private and public equity and equity linked securities.
To separate and centralise the currency risk of an underlying Emerging Markets asset class in order to manage them effectively and efficiently.
– Broad global active
– Global small cap
– Fund of closed-ended funds
– Global quant
– Special situations
– Distressed debt
– Private equity
– Infrastructure
– Real estate
– Overlay
– Hedging
– Cash management
Africa, Brazil, China, Frontier, Latin America, Middle East, Russia, South Asia, Turkey
Asia, China, Colombia, India, Russia, Turkey
“
“Chief Executive Officer’s Report
In facing all of our challenges togetherI continue to be impressed by our team, and by the significant levels of emotional capital they invest in what we do.
The results for the year ended 30 June 2012 provided a demonstration of the continuing resilient nature of Ashmore Group in a difficult year for investing. The business is now a more diversified one with the full range of Emerging Markets investment themes in place. This provides for an unrivalled depth of Emerging Markets fund products for which the distribution architecture is significantly developed. The expected increased levels of management fee income largely offset the anticipated reduction in performance fees. The Group was successful in completing the integration of the Emerging Markets equities business AshmoreEMM, with the consideration structure providing a reduction in the expected level of contingent payments, as global equity indices declined and hence levels of equities AuM reduced. Overall therefore the profit before tax for the Group was £243.2 million, a reduction of 1% on the previous year.
AuM Development During the year, although average AuM increased by US$17.5 billion (38%), AuM decreased by 3% from US$65.8 billion to US$63.7 billion as overall negative investment performance of US$3.4 billion exceeded the level of net subscriptions achieved of US$1.3 billion.
Gross subscriptions totalled US$13.0 billion (FY2010/11: US$23.0 billion) principally into all the debt themes with further large segregated mandates from both new and existing clients being a substantial component.
Gross redemptions increased in absolute terms to US$11.7 billion (FY2010/11: US$7.5 billion) which at an overall level of 18% of average AuM remain on the low side by industry standards, although slightly up on the prior year. The absolute increase over levels experienced in prior periods was due to a combination of equities outflows in the first year after acquisition, and from retail multi-strategy assets raised in Japan in the prior period, undoubtedly amplified by the extreme market volatility experienced during the year.
Investment performance Overall negative investment performance was primarily driven by the negative performance in equities and local currency exceeding positive investment performance in the external, corporate and blended debt themes.
The sharp declines in equities indices, particularly in the first and fourth quarters, impacted AuM levels significantly in both the dedicated equities and multi-strategy themes. The predominantly dollar denominated external, corporate and blended debt mandates maintained positive performance given their relative attractions over developed world debt. In contrast, the declines in a number of Emerging Markets currencies due to the climate of risk aversion ensured that local currency debt indices were negative, notwithstanding the same underlying relative attractiveness. This led to negative investment performance in the local currency debt theme and of course impacted currency overlay AuM. At an overall Group level the percentage of funds outperforming benchmarks at 30 June 2012 was 23% over one year reflecting our consistent approach of adding risk in the risk off environment at the end of the first quarter and 86% over three years. This strong long-term investment performance profile, particularly in the debt themes, continues to underpin the Group’s position as one of the leading specialist Emerging Markets fund managers, which has again this year been recognised with a number of awards.
For more information on our financial performance see p. 20–27
8 Ashmore Group plc | Annual Report and Accounts 2012

Financial performance Revenue Net revenue for the year of £333.3 million was in line with the prior year. This resulted from a 21% increase in management fee income to £302.6 million, driven by an increase in average AuM levels offset by the reduction of average revenue margins which were largely in line with the levels reported at the interim stage (FY 2011/12: 74bps, H1 2011/12: 76 bps, FY 2010/11: 86bps). As reported at the interim this fall resulted from theme and mix effects including the respective weighting of the Group’s higher and lower margin themes as they were differently impacted by flows and performance, the inclusion of the equities theme for the full period with lower margins than the Group’s previous average, and further segregated account gains. The fall in performance fees to £25.4 million (FY 2010/11: £85.4 million) was expected as it is determined by levels of absolute investment performance, which reduce as is normal at this point in the cycle after peaking immediately following the credit crisis, and they were further reduced through the significant market sell offs at the end of the first quarter which largely eliminated performance fees for funds with year ends thereafter.
Cost structure The Group has maintained its cost structure, and continues to focus on ensuring this remains a key strength, with the year on year changes largely reflecting the increment arising from the increase in staff and other costs resulting from the inclusion of the AshmoreEMM business for a first full year, together with the amortisation and share-based accounting charges arising from the transaction.
The structure of staff costs has been maintained, whereby fixed salaries and benefits are set at a capped and low basic level, with the majority of staff costs arising from variable compensation, including a significant component of equity based long-term incentive share awards. This remains a core characteristic of Ashmore‘s business model. In the year to 30 June 2012 variable compensation as a percentage of earnings before variable compensation (VC/EBVCIT) was 18% (FY 2010/11: 19%). The VC/EBVCIT fell by 1% from the level of the prior period reflecting the less good overall performance metrics of the business – in particular short-term investment performance and shareholder return.
Other expenses increased by 50% to £34.4 million (FY2010/11: £22.9 million). The increase reflected largely the costs of the acquired business and the amortisation of intangible assets (£6.2 million) arising within it.
As a result operating profit for the year is £225.1 million (FY 2010/11: £239.4 million). In line with the statement made in the report last year, the Group‘s margins have reduced, although by slightly less than expected due to the lower variable compensation charge to an EBITDA margin of 71% for the year (FY 2010/11: 73%).
Finance income during the period increased as a result of adjustments to the contingent consideration for the acquisition of AshmoreEMM. As in the first half, the further reduction during the second half in levels of AuM within the business, including outflows and negative investment performance, resulted in a downward revision of the level of the contingent payment at 31 May 2012, as well as reductions to the expected levels of the two further contingent payments scheduled for 31 May 2013 and 2014. This underlines the benefit of a significant component of the overall consideration being in the form of contingent payments. Incorporating finance charges arising from the unwind of the discount of contingent payments and gains upon the Group‘s seed capital, the overall finance income was £18.1 million (FY 2010/11: £6.5 million).
Profit after tax for the year was £185.7 million (FY 2010/11: £190.2 million). Earnings per share for the year was 26.82p (FY2010/11: 28.08p).
Strategic progress Equities acquisition update The acquisition of AshmoreEMM was completed at the end of the prior financial year and integrating the business successfully was the focus for the current year. Immediately following change of control the distribution responsibilities for the equities theme were undertaken within Ashmore’s global distribution team and during the year this included the establishment of business development, institutional account management and product specialist functions through firstly familiarisation, then ongoing focus and training and targeted recruitment. The seeding and launch of daily dealing SICAV and US mutual funds on the Ashmore platforms for both the broad global active and global small cap strategies were completed providing efficient access to these two key conduits. Full investment responsibility for the Group’s equities theme was transferred to the AshmoreEMM team during the year and thereafter there has been a focus on further developing the equities investment process. The integration of AshmoreEMM onto the Group’s core portfolio management and fund accounting systems was completed on schedule. This implementation gives consistent systems across the Group and provides greater transparency and enables more effective and efficient group-wide support for the AshmoreEMM business. AshmoreEMM is now fully integrated into the Group with the local governance structure reflecting Ashmore‘s global operating model and with local functional units reporting into the respective global function head. Finally, in July 2012, immediately after the year end, the physical infrastructure was enhanced with the move to a new purpose designed office, open plan in nature in line with the Group’s global standard, providing for the adoption of the optimised group-wide technology infrastructure.
Ashmore Group plc | Annual Report and Accounts 2012 9

Chief Executive Officer’s Report continued
Investment theme developments We continue to seek investment themes and sub-themes for investors to allocate capital across the Emerging Markets where we can provide both diversification of risk/return profiles and depth and growth of investable asset pools. The period has seen a widening adoption of Emerging Markets investment grade products, the initial establishment of dedicated local currency corporate debt funds, and the set up of conduits to allow wider access to our equity product suite, including in particular our small and mid cap and frontier markets expertise where we have outstanding track records across the Middle East, Asia and Africa. As expected with the inversion of credit quality between developed markets and Emerging Markets sovereigns, we have seen increasing momentum within Emerging Markets investment grade products as investors find the universe of developed world investment grade debt reduces, whilst it increases in Emerging Markets. We have also now launched investment grade bond products denominated in local currency. This enables investors to take advantage of attractive local currency exposure whilst diversifying away from Dollar, Euro, Yen and Sterling denominated bond assets which have traditionally dominated the investment grade space. Not all fixed income managers have the appropriate combination of interest rate, credit and foreign exchange skills to manage such a product successfully over the cycle, and we have been pleased with our immediate outperformance here.
One of the most significant product initiatives in the year was not in the form of new product, but in new conduits for our existing global equities themes. We now have both SICAV and US 40 Act mutual funds in place for our broad global active, global small cap and frontier Emerging Markets equities products. These conduits open up the chance of investing with us to a far larger audience of both institutional and retail clients and we expect great things from both our investing and distribution teams in these sub themes.
Distribution platform update In line with the progress reported over the previous two years, this year saw the final elements of the organisational structure added to the distribution platform, coupled with a deepening of resources within all the key functions. The addition of product specialists completes the architecture providing clients with access to individuals who are focused entirely upon the efficient communication of the investment management strategies and results. This function enables the investment management team to maximise their time managing assets yet ensuring the client or prospective client has full access to individuals participating in the respective investment committees and who are fully aware of every nuance of the resultant performance.
Further progress was achieved in both the institutional and retail areas of the business. In terms of institutional clients, the global reach of the business development team delivered a broadening of the client base both in terms of client type and geographic location. Meanwhile further progress was made in the buildout of the Group’s retail activities with the Group securing access to a number of intermediary platforms in the US and Europe which are beginning to show encouraging early signs.
The distribution headcount at the end of the year was 41 (30 June 2011: 32) substantially completing the rapid growth phase of the team and ensuring the Group is positioned to raise assets and service clients globally from developed world and Emerging Markets with a highly experienced team of professionals focused on the Emerging Markets for all asset classes.
Local asset management developments The Group believes strongly that, in addition to the AuM sourced from developed world investors who are increasing their allocations to the Emerging Markets in line with the trend of growth of these markets, its own long-term growth will be enhanced by successfully mobilising Emerging Markets capital in line with the third phase of the Group’s strategy. This recognises the absence of a history of the high leverage that is prevalent in the developed world, the economic growth prospects, demographics and enviable savings rate dynamics of these countries as well as the relatively early stage of development of asset management industries within many of these Emerging Markets.
The Group has previously reported the establishment of local asset management subsidiaries in Brazil, Turkey and Colombia and real estate joint ventures in China and Russia which during the year have continued investing successfully and made progress in raising AuM, although much needs to be done. At the same time the Group has been looking throughout the period at further opportunities which aim to extend the geographic and asset class breadth.
This has resulted in July 2012 in the establishment of a further new local asset management venture for Ashmore in Indonesia. We look forward to reporting on the developments within this new venture alongside the existing ones in the coming years.
Overall the key now is to start seeing significant performance and asset growth from our local asset management operations.
People and culture At the end of the year the Group’s headcount has increased to 257 (30 June 2011: 246) reflecting the increase in both distribution and some of the key support functions which was offset by a small reduction arising from synergies achieved within the integration of AshmoreEMM. Whilst AuM levels overall have reduced by 3%, gross inflows of US$13 billion have resulted from the significant efforts across the Group in winning mandates and bringing them on board efficiently by strong cross functional collaboration. Our investment professionals have continued to ensure that their exclusive focus on the Emerging Markets and our long standing and rigorous investment process provide for the maximum potential for investment outperformance, in a year where global markets have provided many further challenges. In summary, last year judged through our KPIs, investment performance and shareholder return would probably be assessed as satisfactory. We, of course, like to do much better than this.
10 Ashmore Group plc | Annual Report and Accounts 2012

For more information on our investor type and geography see p. 22
2. Diversifying developed world capital sources and themesStatus: Underway – significant growth available
Status: Mostly completed
1. Establish Emerging Markets class
3. Mobilise Emerging Markets capitalStatus: Commenced – enormous future growth opportunities
Description– Establish Ashmore Emerging
Markets investment processes
– Enhance understanding of Emerging Markets debt in the developed world
– Provide access to Emerging Markets, and their rapid development opportunities
– Develop strong performance track record
– Increase developed world investor base
Description– Establish new investment
themes to diversify Emerging Markets product offerings
– Develop new product structures and capabilities
– Establish Ashmore as trusted allocator
– Broaden and deepen developed world investor base
– Deliver strong performance consistently
Description– Mobilise Emerging Markets
capital managed offshore
– Capital sourced initially from largest pools, i.e. central banks, governments, reserve managers and sovereign wealth funds
– Develop network of domestic asset management businesses
– Manage domestic capital locally
– Create strong local performance track record
Ashmore Group plc | Annual Report and Accounts 2012 11

Chief Executive Officer’s Report continued
In facing all of our challenges together I continue to be impressed by our team, and by the significant levels of emotional capital they invest in what we do. As we grow and clients’ demands get more complex, and new people such as our AshmoreEMM colleagues join us, the pressure on individuals and the need for the whole firm to help each other will only increase. I should like to thank everyone for the contribution made during the last year and look forward to our continuing joint effort to do everything better, achieving investment outperformance and retaining and raising AuM whilst operating in an efficient and controlled manner across our existing and new businesses.
Outlook Markets have been obsessed with Eurozone ‘tail-risk’ and low levels of developed world growth, and we expect these concerns to continue to affect financial market sentiment over the coming months, but to a steadily declining degree. The larger backdrop of de-leveraging and global rebalancing of currencies remains and justifies investment allocations to Emerging Markets much higher than today.
Although this developed world environment means that Emerging Markets will go through periods of slower growth via lower export orders from the US and EU, they are becoming less dependent on this export demand as they are trading (and investing) more amongst themselves. For several of the most export-dependent Asian economies there is also a progressive shift to a domestic demand-led model of growth and hence growth rates of Emerging Markets economies are not only higher than in the West, but increasingly more resilient.
As a result an Emerging Markets allocation is more and more seen as an important diversifier and risk reducer for investors as in the worst developed world scenarios Emerging Markets are likely to be safer investment destinations. Countries with high levels of foreign exchange reserves and low debt are most insulated from global risks, and in an about-turn from 15 years ago, that means Emerging Markets. Having the odd US$300 billion in reserves means a central bank can intervene to protect its currency at will at any time.
Continuing to hold such large reserves concentrated in US dollars is, of course, unsustainable in the longer term and 2013 may see more diversification by central banks into Emerging Markets currencies. This also benefits other asset classes denominated in those currencies, both fixed income and, in due course, equity.
We expect that this will contribute to significant growth in fixed income and equity issuance. Corporate debt market growth is being encouraged in many countries to provide term financing to companies and to help dis-intermediate banks that need to de-lever. Valuations are not expensive in either asset class, with both unsustainably low price/earnings ratios in equities, and certain spreads almost double 2008 levels despite greater relative safety.
Prejudice about Emerging Markets is steadily being eroded. Whilst it is difficult for some investors to accept the harsh realities in the West, there is gradually less difficulty in taking the plunge and investing in Emerging Markets. Fears of slow growth in Emerging Markets or a Chinese ‘hard landing’ constitute excuses for delay rather than long-term reasons for not investing. We are seeing new types of developed world investors steadily increase allocations.
Investors from Emerging Markets into other Emerging Markets are also increasing in number and size as they re-assess global risks. In particular, we have seen substantial growth of assets from Emerging Markets government entities, including central banks, as these institutions diversify away from developed countries. We expect this trend to continue. Our strategy of building on-the-ground presence in Emerging Markets also positions us to take advantage of the institutionalisation of local savings over the next few years which together with our growing access to more distribution channels and end investor types in developed countries will continue to diversify our income streams
In summary, more and more investors are seeing Emerging Markets debt as an alternative to fixed income in general, not just developed world corporate credit. Indeed, with yields in the developed world either high for a good reason or yielding next to nothing, Emerging Markets debt looks highly attractive. Furthermore, after a period of relatively poor performance and flows, Emerging Markets equity, which has long been an established asset class, looks to be ripe for a good year given relatively low valuations. In particular, we believe that our depth and outstanding performance advantage in small and mid-cap companies, in new frontier markets and regions in the Middle East, Africa, and Asia are bound to attract attention as investors lose their solely large cap bias in the search for high long-term returns and outperformance.
Our job remains to outperform across as broad a product set as possible, to fight for our investors to achieve risk/return diversification and, through focusing on revenue and costs, to maintain a high margin. We are up for it as ever.
Mark Coombs Chief Executive Officer
12 Ashmore Group plc | Annual Report and Accounts 2012

Ashmore’s focus exclusively within the Emerging Markets is key to its long-term
investment outperformance
Emerging Markets are the driver of global growth
see p.14–15
Strengthening our global platform to enhance our client offering
see p.16–17
This commitment to Emerging Markets is furthered by the Ashmore Foundation, which
supports locally-based organisations and charities, and emphasises that people are
at the heart of the business. see p.38–39
Ashmore Group plc | Annual Report and Accounts 2012 13
14 Ashmore Group plc | Annual Report and Accounts 201214 Ashmore Group plc | Annual Report and Accounts 2012
The global backdrop will continue to be dominated by weaknesses in the HIDCs (Heavily Indebted Developed Countries) in the coming year due to sub-trend growth and bouts of risk aversion arising from serious macroeconomic problems and limited policy options. Sentiment will continue to shift back and forth as Europe’s debt crisis is pitched against the deteriorating fiscal backdrop in the US. Faced with this ‘ugly contest’ institutional investors will further diversify out of HIDC exposures, which are either over-stretched markets or excessively risky ones, in favour of Emerging Markets.
The absolute and relative strength of Emerging Markets stands in sharp contrast to the weakness in the HIDCs. Emerging Market economies are unencumbered by excessive public and private sector debts and resilient to shocks due to deeper structural drivers, with room to stimulate their economies in the face of HIDC-led downturns. Growth in Emerging Markets is likely to accelerate from a low of about 5% this year to well above 6% in the coming 12 months on the back of active policy easing as the inventory-cycle triggered by the European slowdown last year fades away. A stronger growth picture in Emerging Markets in turn underpins the global commodity markets.
China and Brazil’s cyclical upswings are likely to be headline grabbing drivers of global growth next year, but domestic demand across the broader Emerging Markets universe will be a real driver, especially via global trade flows. Trade between other Emerging Market regions will continue to expand rapidly, accompanied by greater internationalisation of Emerging Market currencies, including CNY. China’s determined and visionary early transition from export-led to domestic-led growth has put Emerging Markets right at the front of the process of global rebalancing. Global rebalancing will accelerate as deleveraging continues in HIDCs, underpinning Emerging Market currencies and vesting them with major upside option value versus HIDC currencies.
Emerging Markets will continue to manage inflation risks well in response to strong bottom up political pressures in favour of prudent policy. New Frontier Economies will continue to enter the global financial markets as more established Emerging Markets continue to deepen and broaden rapidly. The great financial broadening and deepening of the Emerging Market universe will therefore continue even as financial repression intensifies and the global backdrop in the HIDCs only improves very slowly. Individual country stories will continue to play out within Emerging Markets and will eventually become more important drivers of returns than global market sentiment, supporting the case for active and Emerging Market specialist management in this space.
The Ashmore advantage
Ashmore has a business model that focuses on providing investment management across a diverse range of Emerging Markets themes. Through its well established and successful processes Ashmore achieves long-term investment outperformance for fund investors and shareholders alike.
Investor geographyThe Group’s clients are drawn from developed markets and Emerging Markets across the globe. The centrally managed but globally located distribution offices are our link to these clients.
We believe that the best way to gain exposure to strong medium and long-term trends in Emerging Markets is to employ specialist managers using an active approach. We believe our portfolio managers have the technical skills and an understanding of the asset class gained over many years of experience which fits in well with our rigorous and proven investment approach.

Ashmore Group plc | Annual Report and Accounts 2012 15
Superior economic outlook
1
0
2
3
4
5
6
7
Emerging Markets Developed Markets
2007 – 2011 2012 – 2016
6.1% Forecasted GDP growth for Emerging Markets

16 Ashmore Group plc | Annual Report and Accounts 2012
Building a world class distribution team Ashmore has always had a culture of focusing on our clients’ needs. Our goal is simple: we aim to be the pre-eminent specialist Emerging Markets investment manager. To achieve this, we know that all of us need to be totally committed to building close and ongoing relationships with our clients. Testament to that commitment is the fact that many of our clients have been invested with Ashmore for many years.
Focused on our clients’ needsOver the period we have strengthened our account management teams globally. This has allowed us to keep close to our growing client base so that we can better anticipate their needs and focus our resources where they have the most impact. Feedback from our clients has led to a number of enhancements to our client service:
– Client reporting. We have enhanced our client reporting, introducing more depth and transparency and quicker delivery, and have more improvement planned.
– Client communications. We have recruited product specialists who are focused on keeping our clients informed on our investment strategy and performance outlook. Given the continuing market uncertainty, this ongoing and regular communication with our clients is especially important.
– Structured and tailored education. This is a key part of our client offering. One example of this is a residential programme we run in partnership with Cass Business School for our central bank and sovereign wealth clients. As well as hearing from Ashmore investment professionals, attendees also have the opportunity to hear from a number of guest speakers.
– Client events. As our client base grows we have responded by increasing the number of client events we hold. May 2012 saw the inaugural Ashmore Emerging Markets Investment Forum in London held over two days and was attended by key clients from around the globe (discussed below).
– Product Development. During the year we provided access through 40 Act and SICAV vehicles to all our main investment themes and added new ones in Frontier equity, local currency corporate debt and investment grade debt.
Understanding our clients’ worldsAs well as expanding our account management team, we have also built out our business development team. This is in line with the second and third phases of Ashmore’s strategy of establishing Ashmore as a trusted allocator across themes and mobilising Emerging Markets capital managed on and offshore.
Growing the team means we can talk to more clients in their domestic market and deepen our understanding of local regulations and requirements. It also supports our goal of maintaining diversity both in geographical spread and in client type.
Ashmore has made good initial progress in the expansion of its Third Party Distribution business in Europe. Our strategy of partnering with both global and regional private banks and wealth managers as well as making inroads into the platform market has started to generate asset flows for the business. The foundations that have been built over the past 12 months will put us in a strong position to take this distribution franchise forward.
Our objective for hosting the Forum was not only to offer clients an insight into the breadth of Ashmore’s investment services, but also to bring a variety of different perspectives on the opportunities offered by Emerging Markets. We were delighted to welcome Mr Jin Liqun, Chairman of the Board of Supervisors of the China Investment Corporation, as our keynote speaker opening the Forum, Naguib Sawiris, Executive Chairman of Orascom Telecom Media and Henrique de Campos Meirelles, ex-Governor of the Bank of Brazil. We also took the opportunity to run workshops in smaller groups so clients could interact with our portfolio managers. We are planning our next key client Investment Forum in New York later in 2012.
Ashmore Group plc | Annual Report and Accounts 2012 17 Ashmore Group plc | Annual Report and Accounts 2012 17
Private pension plans 17%Public pension plans 13%
Governments 37%
Insurance 4%Corporate 3%Foundation/Endowment 2%
Fund of funds 1%Permanent capital 1%
Banks 6%
Asia Pacific 29%
Middle East 18%
UK 12%
Europe 21%
Third party intermediaries (retail/HNWI) 11%
Funds/sub-advisor 5%
AuM by investor type
AuM by investor geography
Americas 20%
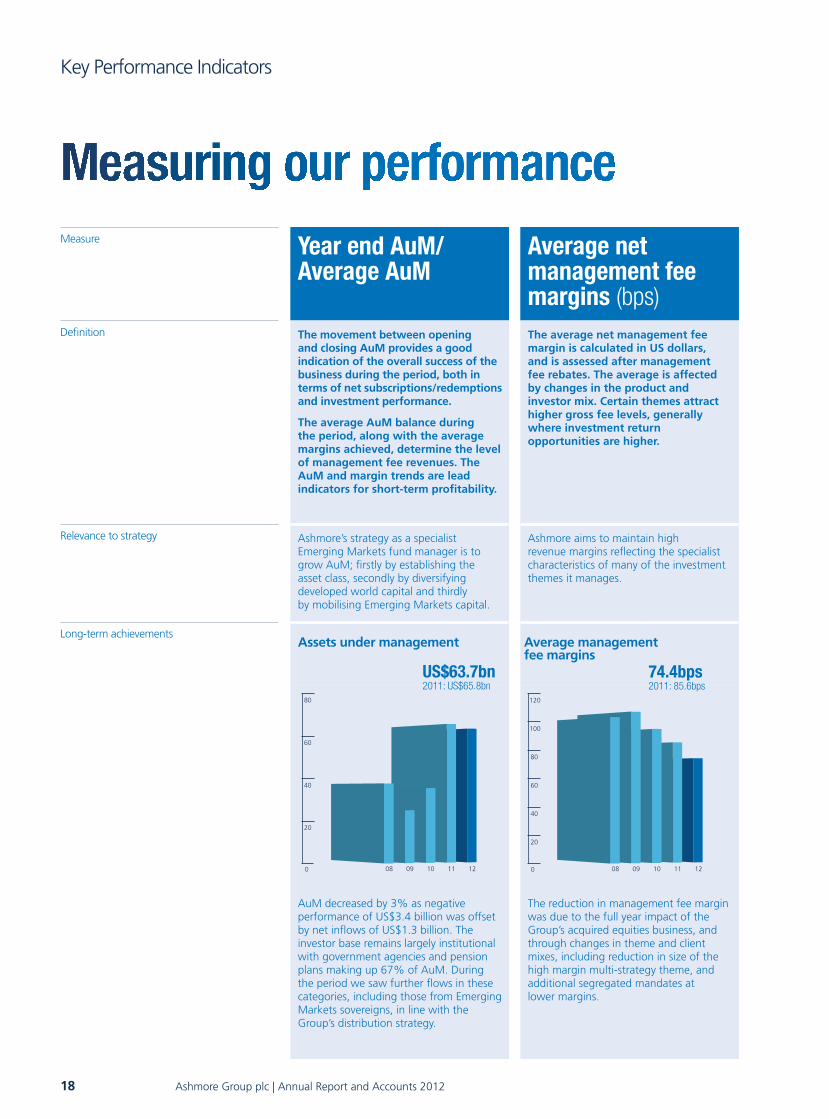
Key Performance Indicators
Measure Year end AuM/Average AuM
Average netmanagement feemargins (bps)
Definition The movement between opening and closing AuM provides a good indication of the overall success of the business during the period, both in terms of net subscriptions/redemptions and investment performance.
The average AuM balance during the period, along with the average margins achieved, determine the level of management fee revenues. The AuM and margin trends are lead indicators for short-term profitability.
The average net management fee margin is calculated in US dollars, and is assessed after management fee rebates. The average is affected by changes in the product and investor mix. Certain themes attract higher gross fee levels, generally where investment return opportunities are higher.
Relevance to strategy Ashmore’s strategy as a specialist Emerging Markets fund manager is to grow AuM; firstly by establishing the asset class, secondly by diversifying developed world capital and thirdly by mobilising Emerging Markets capital.
Ashmore aims to maintain high revenue margins reflecting the specialist characteristics of many of the investment themes it manages.
Long-term achievements
AuM decreased by 3% as negative performance of US$3.4 billion was offset by net inflows of US$1.3 billion. The investor base remains largely institutional with government agencies and pension plans making up 67% of AuM. During the period we saw further flows in these categories, including those from Emerging Markets sovereigns, in line with the Group’s distribution strategy.
The reduction in management fee margin was due to the full year impact of the Group’s acquired equities business, and through changes in theme and client mixes, including reduction in size of the high margin multi-strategy theme, and additional segregated mandates at lower margins.
20
0 08 09 10 11 12
40
80
60
Assets under management
US$63.7bn2011: US$65.8bn
08 09 10 11 12
120
100
80
60
40
20
0
Average managementfee margins
74.4bps2011: 85.6bps
18 Ashmore Group plc | Annual Report and Accounts 2012
EBITDA margin Variable compensation(VC)/EBVCIT
Year endheadcount
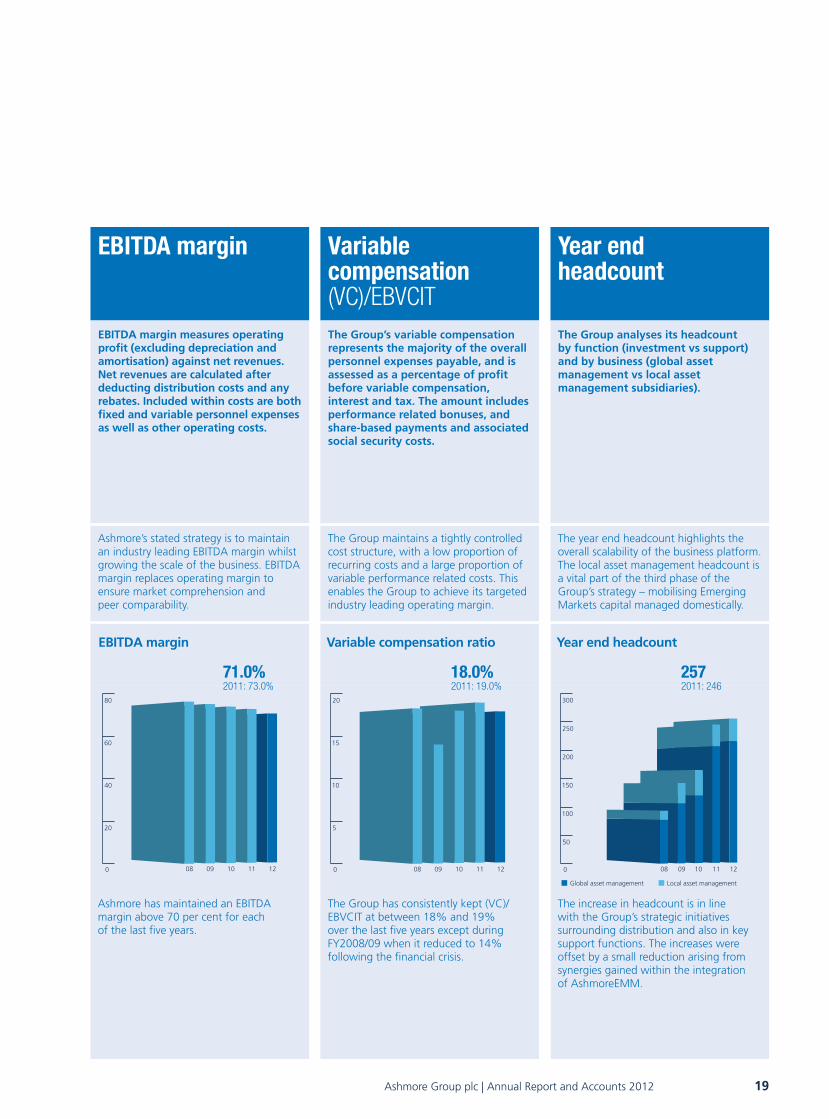
EBITDA margin measures operating profit (excluding depreciation and amortisation) against net revenues. Net revenues are calculated after deducting distribution costs and any rebates. Included within costs are both fixed and variable personnel expenses as well as other operating costs.
The Group’s variable compensation represents the majority of the overall personnel expenses payable, and is assessed as a percentage of profit before variable compensation, interest and tax. The amount includes performance related bonuses, and share-based payments and associated social security costs.
The Group analyses its headcount by function (investment vs support) and by business (global asset management vs local asset management subsidiaries).
Ashmore’s stated strategy is to maintain an industry leading EBITDA margin whilst growing the scale of the business. EBITDA margin replaces operating margin to ensure market comprehension and peer comparability.
The Group maintains a tightly controlled cost structure, with a low proportion of recurring costs and a large proportion of variable performance related costs. This enables the Group to achieve its targeted industry leading operating margin.
The year end headcount highlights the overall scalability of the business platform. The local asset management headcount is a vital part of the third phase of the Group’s strategy – mobilising Emerging Markets capital managed domestically.
Ashmore has maintained an EBITDA margin above 70 per cent for each of the last five years.
The Group has consistently kept (VC)/EBVCIT at between 18% and 19% over the last five years except during FY2008/09 when it reduced to 14% following the financial crisis.
The increase in headcount is in line with the Group’s strategic initiatives surrounding distribution and also in key support functions. The increases were offset by a small reduction arising from synergies gained within the integration of AshmoreEMM.
08 09 10 11 12
20
0
40
80
60
EBITDA margin
71.0%2011: 73.0%
5
10
20
15
0 08 09 10 11 12
Variable compensation ratio
18.0%2011: 19.0%
0 08 09 10 11 12
Year end headcount
2572011: 246
Global asset management Local asset management
300
250
200
150
100
50
Ashmore Group plc | Annual Report and Accounts 2012 19
Business Review
Ashmore Group result The Group recorded an operating profit before tax for the year ended 30 June 2012 of £225.1 million (FY2010/11: £239.4 million), giving rise to an EBITDA margin of 71 per cent (FY2010/11: 73 per cent); a profit before tax of £243.2 million (FY2010/11: £245.9 million); and a profit after tax of £185.7 million (FY2010/11: £190.2 million). The financial results are analysed further below.
Assets under Management and Fund Flows During the year AuM decreased by 3% from US$65.8 billion to US$63.7 billion, comprising net inflows of US$1.3 billion, which was somewhat lower than our expectation, and adverse investment performance of US$3.4 billion.
The year saw good levels of gross subscriptions which totalled US$13.0 billion (FY2010/11: US$23.0 billion). The reduction from the prior year was perhaps to be anticipated given the extraordinary subscriptions in the multi-strategy and overlay themes in that period. Subscriptions this year were greatest in the external debt and local currency themes with strong contributions both from new and existing segregated account clients and into a range of the public funds in these two themes. Corporate debt continues to be a theme where there is significant interest and this included the particular growth of the investment grade corporate debt sub-theme which increased in the period, following several new segregated client wins, to become approximately half of AuM in the theme. Likewise blended debt attracted further segregated account wins and as the period ended we began to see subscriptions through its US mutual fund vehicle.
The absolute levels of gross redemptions increased to US$11.7 billion (FY2010/11: US$7.5 billion). However, as a percentage of opening AuM the level of redemptions was slightly down on the prior period, and only slightly up on average AuM. Within the equities theme there were redemptions principally within the broad global active strategy from a number of funds and segregated accounts.
After the significant accumulation of AuM in the multi-strategy theme over the prior period, given its origin, there was an expectation of an increase in the redemption levels for this year and the asset allocation and currency component inherent within this product meant that the sharp mark downs in equities and Emerging Markets currencies, particularly in the first and fourth quarters, contributed additionally to this effect.
New funds and accounts The year saw further launches of new funds, including a new Japanese retail focused multi-strategy fund and three new equities funds. As such our principal equities strategies, broad global active, global small cap and frontier, are now available for investors on Ashmore’s most widely distributed platforms.
There were also 11 new segregated and white label/dual brand funds won during the year, within the external debt, local currency, corporate debt and blended debt themes.
At 136, the overall number of funds and accounts is in line with that from the prior year (30 June 2011: 135) since the above additions have been offset by a number of fund closures as the Group has rationalised its public fund product offerings, including the closure of a number of overlapping equity strategies after the acquisition of AshmoreEMM, and by reductions in equity segregated accounts.
20 Ashmore Group plc | Annual Report and Accounts 2012
AuM movements by investment theme In line with the interim results and the historically reported quarterly updates, the AuM by theme as classified by mandate is shown in the following table. This details gross subscriptions and redemptions, investment performance and average management fee margins for each theme.
AuM movements by investment theme as mandated:
Theme
AuM 30 Jun 11
(US$bn) Performance
(US$bn)
GrossRedemptions
(US$bn)
Gross subscriptions
(US$bn) Net flows
(US$bn)
AuM30 Jun 12
(US$bn)
Average management fee
margins (bps)
External debt 14.3 0.6 (3.2) 4.2 1.0 15.9 70
Local currency 9.4 (0.4) (1.8) 2.8 1.0 10.0 75
Corporate debt 1.3 0.3 (0.3) 1.1 0.8 2.4 108
Blended debt 10.9 1.2 (0.6) 0.9 0.3 12.4 51
Equities 10.1 (1.9) (2.0) – (2.0) 6.2 67
Alternatives 2.8 (0.2) (0.1) 0.1 – 2.6 239
Multi-strategy 8.4 (2.0) (2.9) 2.1 (0.8) 5.6 127
Overlay/Liquidity 8.6 (1.0) (0.8) 1.8 1.0 8.6 16
Total 65.8 (3.4) (11.7) 13.0 1.3 63.7 74
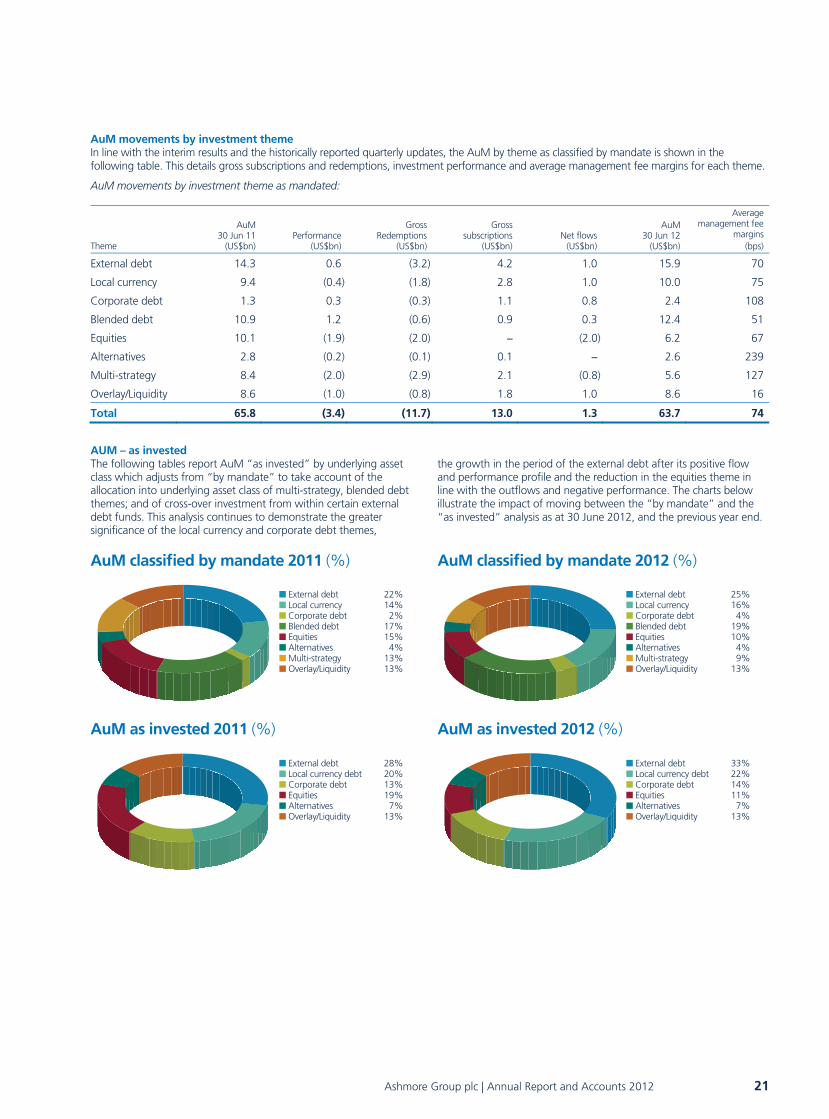
AUM – as invested The following tables report AuM “as invested” by underlying asset class which adjusts from “by mandate” to take account of the allocation into underlying asset class of multi-strategy, blended debt themes; and of cross-over investment from within certain external debt funds. This analysis continues to demonstrate the greater significance of the local currency and corporate debt themes,
the growth in the period of the external debt after its positive flow and performance profile and the reduction in the equities theme in line with the outflows and negative performance. The charts below illustrate the impact of moving between the “by mandate” and the “as invested” analysis as at 30 June 2012, and the previous year end.
■ External debt 22%■ Local currency 14%■ Corporate debt 2%■ Blended debt 17%■ Equities 15%■ Alternatives 4%■ Multi-strategy 13%■ Overlay/Liquidity 13%
AuM classified by mandate 2011 (%)
■ External debt 28%■ Local currency debt 20%■ Corporate debt 13%■ Equities 19%■ Alternatives 7%■ Overlay/Liquidity 13%
AuM as invested 2011 (%)
■ External debt 25%■ Local currency 16%■ Corporate debt 4%■ Blended debt 19%■ Equities 10%■ Alternatives 4%■ Multi-strategy 9%■ Overlay/Liquidity 13%
AuM classified by mandate 2012 (%)
■ External debt 33%■ Local currency debt 22%■ Corporate debt 14%■ Equities 11%■ Alternatives 7%■ Overlay/Liquidity 13%
AuM as invested 2012 (%)
Ashmore Group plc | Annual Report and Accounts 2012 21
Business Review continued
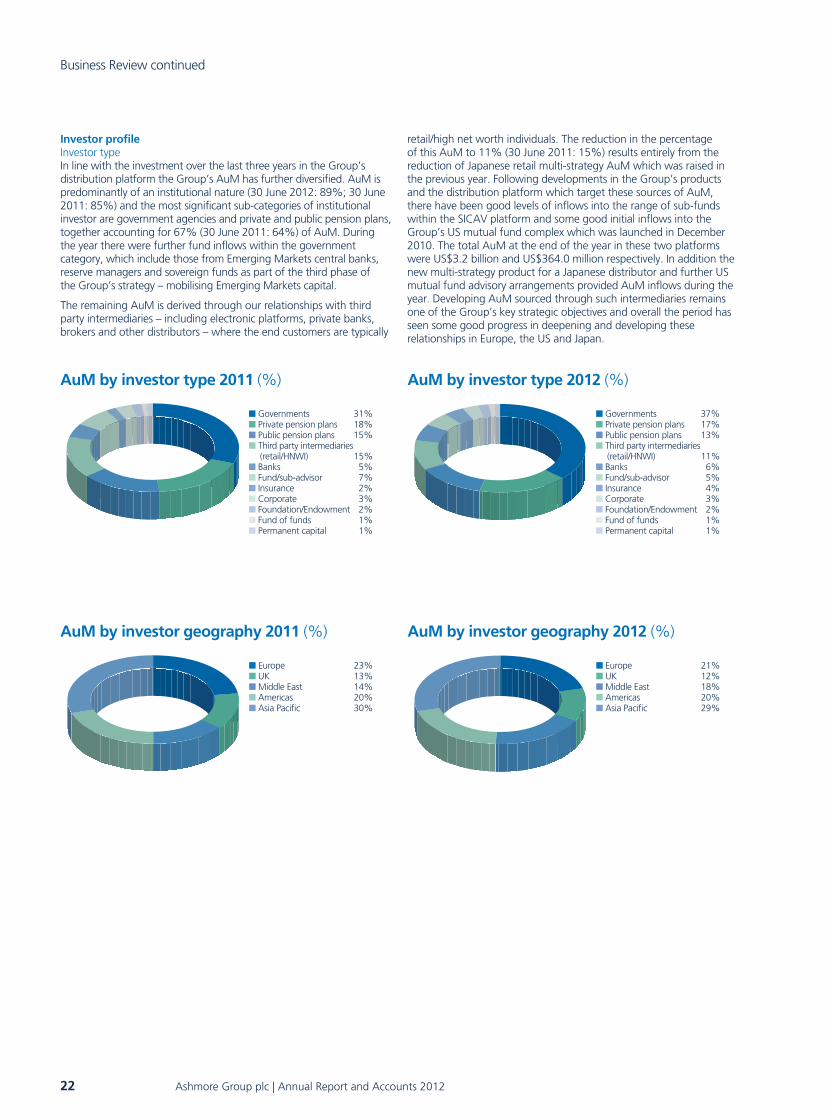
Investor profile Investor type In line with the investment over the last three years in the Group’s distribution platform the Group’s AuM has further diversified. AuM is predominantly of an institutional nature (30 June 2012: 89%; 30 June 2011: 85%) and the most significant sub-categories of institutional investor are government agencies and private and public pension plans, together accounting for 67% (30 June 2011: 64%) of AuM. During the year there were further fund inflows within the government category, which include those from Emerging Markets central banks, reserve managers and sovereign funds as part of the third phase of the Group’s strategy – mobilising Emerging Markets capital.
The remaining AuM is derived through our relationships with third party intermediaries – including electronic platforms, private banks, brokers and other distributors – where the end customers are typically
retail/high net worth individuals. The reduction in the percentage of this AuM to 11% (30 June 2011: 15%) results entirely from the reduction of Japanese retail multi-strategy AuM which was raised in the previous year. Following developments in the Group’s products and the distribution platform which target these sources of AuM, there have been good levels of inflows into the range of sub-funds within the SICAV platform and some good initial inflows into the Group’s US mutual fund complex which was launched in December 2010. The total AuM at the end of the year in these two platforms were US$3.2 billion and US$364.0 million respectively. In addition the new multi-strategy product for a Japanese distributor and further US mutual fund advisory arrangements provided AuM inflows during the year. Developing AuM sourced through such intermediaries remains one of the Group’s key strategic objectives and overall the period has seen some good progress in deepening and developing these relationships in Europe, the US and Japan.
Investor Geography The increasing appeal of the Emerging Markets asset class to investors globally is demonstrated by the Group’s continued diverse geographic investor profile.
AuM by investor type 2011 (%)
■ Governments 31%■ Private pension plans 18%■ Public pension plans 15%■ Third party intermediaries (retail/HNWI) 15%■ Banks 5%■ Fund/sub-advisor 7%■ Insurance 2%■ Corporate 3%■ Foundation/Endowment 2%■ Fund of funds 1%■ Permanent capital 1%
■ Europe 23%■ UK 13%■ Middle East 14%■ Americas 20%■ Asia Pacific 30%
AuM by investor geography 2011 (%)
AuM by investor type 2012 (%)
■ Governments 37%■ Private pension plans 17%■ Public pension plans 13%■ Third party intermediaries (retail/HNWI) 11%■ Banks 6%■ Fund/sub-advisor 5%■ Insurance 4%■ Corporate 3%■ Foundation/Endowment 2%■ Fund of funds 1%■ Permanent capital 1%
■ Europe 21%■ UK 12%■ Middle East 18%■ Americas 20%■ Asia Pacific 29%
AuM by investor geography 2012 (%)
22 Ashmore Group plc | Annual Report and Accounts 2012

Management fees and performance fees As the Group’s AuM are predominantly US dollar based, the majority of management and performance fees are also US dollar denominated. The table below sets out AuM, net management fees, net management fee margins, and performance fees, by theme in US dollars:
Underlying US dollar management and performance fees:
Theme
FY2010/11AuM
(US$bn)
FY2011/12AuM
(US$bn)
Net management fees to
30 June 2012 (US$m)
Average management
fee margin (bps)
Performance fees to
30 June 2012(US$m)
External debt 14.3 15.9 103.1 70 27.1
Local currency 9.4 10 72.1 75 6.3
Corporate debt 1.3 2.4 20.7 108 0.1
Blended debt 10.9 12.4 59.9 51 3.0
Equities 10.1 6.2 54.0 67 0.8
Alternatives 2.8 2.6 66.4 239 3.6
Multi-strategy 8.4 5.6 85.6 127 0.1
Overlay/Liquidity 8.6 8.6 13.5 16 –
Total 65.8 63.7 475.3 74 41.0
Management fees Net management fee income in Sterling terms increased by 21% to £302.6 million as a function of increased levels of average AuM (FY2011/12: US$63.9 billion; FY2010/11: US$46.4 billion), stable GBP/USD foreign exchange rates (FY2011/12: 1.59 effective; FY2010/11: 1.59 effective) offset by a reduction in average management fee margins (FY2011/12: 74 bps; FY2010/11: 86 bps). The average revenue margin reduction was initially driven by an exit rate of 82 bps and includes, as anticipated, the full year impact of the Group’s acquired equities business. The remaining reduction is through both theme and client mix effects. These include the reduction in AuM of the higher margin multi-strategy theme, the development for the first time of substantial levels of AuM within the sub-theme of investment grade corporate debt with a lower revenue margin than high yield corporate debt and further segregated mandate subscriptions at lower margins.
Performance fees Total performance fee income for the year was £25.4 million (FY2010/11: £85.4 million) being earned across the investment themes. The majority of these fees were annual performance fees from funds having an August 2011 year end with the balance being made up of other annual performance fees and crystallised fees arising on redemptions during the year. This reduction had been anticipated as absolute levels of investment return reduced period on period after peaking in 2009/10 following the credit crisis. The market wide corrections seen in the period reduced performance fees for the funds with a December 2011 and April 2012 year end to a minimal level.
It is the Group’s policy to maintain a good balance between those funds where the Group is eligible to earn performance fees and those that generate revenues for the Group solely through management fees. At the year end the Group was eligible to earn performance fees on 30% of AuM (30 June 2011: 38%), or 37% of funds (30 June 2011: 43%). Of this AuM, 54% (30 June 2011: 41%) of it, whilst able to generate performance fees in the future, was ineligible to do so in FY2011/12 either as a result of such fees only being available at the end of the multi-year fund life, such funds not earning a fee in the performance year, or as a result of rebate agreements in the new period.
In the new financial year, unaudited annual performance fees for the funds with performance years ended 31 August 2012 were approximately £4.0 million (August 2011: £18.8 million).
Operating costs and operating margin The Group has maintained its tightly controlled cost structure, with a low proportion of recurring costs and a large proportion of variable performance related costs. Closing headcount increased from 246 at 30 June 2011 to 257 at 30 June 2012 while the average headcount shows a larger increase from 182 to 251 as a result of the full year impact of AshmoreEMM. The increase in wages and salaries to £18.0 million (FY2010/11: £11.5 million) reflects this increase in average headcount. There has been continued recruitment this year to support the future growth of the business particularly to support the development of our distribution and support teams.
Variable compensation costs represent the majority of overall personnel expenses and consist of performance related bonuses, share-based payments and associated social security costs. Variable compensation is calculated as a percentage of profit before variable compensation, interest and tax. The rate of variable compensation applied in the year to 30 June 2012 reduced to 18% (FY2010/11: 19%). The lower level of variable compensation from the prior year reflects the flat to slightly lower performance of the overall business over the year.
The overall total for other expenses for the year to 30 June 2012 was £34.4 million (FY2010/11: £22.9 million) with key drivers for the year on year rise being increased amortisation charges on intangible assets, integration costs for AshmoreEMM (most notably with information technology and communications) and the full year impact of AshmoreEMM, offset partly by reduced professional fees of £4.0 million (FY2010/11: £5.5 million), largely resulting from acquisition-related costs in the prior year. Other costs have also increased reflecting the geographic expansion of the business and increased distribution activities.
Ashmore Group plc | Annual Report and Accounts 2012 23

Business Review continued
The five year trend graphs of total employee numbers and total employment costs are shown below. These demonstrate how the Group’s operating model has been maintained:
Taxation The majority of the Group’s profit is subject to UK taxation. The Group’s effective tax rate for the year is 23.7% (FY2010/11: 22.7%). The tax rate for the year is less than the blended UK corporation tax rate of 25.5% principally as a result of deductions in respect of share based awards vesting during the period.
There is a £15.1 million deferred tax asset on the Group’s balance sheet at 30 June 2012 (30 June 2011: £17.9 million), as a result of timing differences in the recognition of the accounting expense and actual tax deductions in connection with share price appreciation on share-based awards.
Balance sheet management and cash flow It is the Group’s policy to maintain a strong balance sheet in order to support regulatory capital requirements, to meet the commercial demands of current and prospective investors, and to fulfil development needs across the business which include funding establishment costs of distribution offices and local asset management ventures, seeding new funds, trading or investment in funds or other assets and other strategic initiatives.
As at 30 June 2012, total equity attributable to shareholders of the parent was £537.3 million, as compared to £498.5 million at 30 June 2011. There is no debt on the Group’s balance sheet.
Cash The Group’s cash and cash equivalents balance decreased by £22.4 million in the year to £346.6 million. The Group continues to generate significant cash from operations, totalling £238.8 million in the year (FY2010/11: £253.4 million), from which it paid the following significant items: £106.9 million in cash dividends (FY2010/11: £93.7 million); £58.2 million of taxation (FY2010/11: £62.1 million); £62.2 million for net new seed capital investments (FY2010/11: £12.5 million); and £40.8 million for purchase of own shares to satisfy share awards (FY2010/11: £10.9 million).
The Group’s cash balances are invested with the objective of optimising returns within a strict framework which emphasises capital preservation, security, liquidity and counterparty risk. Cash is invested only with institutions and liquidity funds with approved credit ratings of A or better. Typically during the financial year these have been short-term cash deposits with banks and investments in the Group’s S&P AAA rated money market liquidity funds.
Seed capital investments As at 30 June 2012 the amount invested was £140.1 million (at cost), with a market value of £148.9 million. During the period the largest seed capital investments were further amounts invested in respect of the launch of a new equities focused SICAV sub-funds and an equities (small cap) focused 40 Act fund as well as further seeding in to the Group’s recently launched SICAV funds, including the inflation linked bond fund. In addition the year saw capital commitment calls made by funds managed by the Group’s local asset management subsidiaries and associates. Some of the seed capital investments made in earlier periods were able to be recycled profitably.
Purchase of own shares The Group purchases and holds shares through an Employee Benefit Trust (“EBT”) in anticipation of the exercise of outstanding share options and the vesting of share awards. At 30 June 2012 the EBT owned 32,668,764 (30 June 2011: 24,555,042) ordinary shares.
Goodwill and Intangible assets Total goodwill and intangible assets on the Group’s balance sheet at 30 June 2012 are £98.1 million (30 June 2011: £103.2 million). The year on year decrease of £5.1 million is driven by amortisation charges of £6.2 million (FY2010/11: £0.5 million), combined with a non-recurring impairment charge of £1.2 million (FY2010/11: nil), partly offset by FX retranslation gains of £2.3 million arising on non-Sterling denominated goodwill and intangible assets (FY2010/11: £2.3 million). This gain is included within the Group’s other comprehensive income.
50
0 1211100908
100
200
150
250
300
Year end headcount
■ Global asset management■ Local asset management subsidiaries
10
0
20
40
30
70
60
50
80
£m
Employee costs
■ Fixed personnel costs■ Variable compensation
1211100908
24 Ashmore Group plc | Annual Report and Accounts 2012
Deferred acquisition costs (DAC) The Group carries on its balance sheet unamortised deferred acquisition costs of £4.7 million (FY2010/11: £6.9 million) in respect of the launch of Ashmore Global Opportunities Limited (“AGOL”), a publicly listed closed-ended investment company incorporated in 2007.
During FY2011/12, the shares of AGOL have continued to trade at a discount to the net asset value of its balance sheet and, as previously, where this discount is in excess of 10 per cent for 12 consecutive months, an EGM is required to consider whether AGOL should be wound up. The EGM was held on 7 June 2012, with over 90 per cent of the voting shareholders voting against winding up. Should the discount continue to exceed 10 per cent for a further 12 consecutive months, an EGM will once again be required. Should, as a result of any future vote, AGOL be wound up, this would not result in an acceleration or recognition of these deferred acquisition costs. An early termination of AGOL would instead trigger the full recovery of the initial set-up costs including the portion of £9.6 million amortised to 30 June 2012.
Foreign exchange management The Group’s long-standing policy is to hedge between a quarter and two-thirds of the notional value of foreign exchange exposure in connection with its net management fee cash flows, using either forward foreign exchange contracts or options for up to two years forward with at least 25% coverage for the first 12 month period. The GBP/USD exchange rate to 30 June 2012 ranged between GBP1.00:1.5387 – 1.6419USD.
The Group experienced an overall foreign exchange gain for the year to 30 June 2012 of £2.8 million (FY2010/11: £7.4m loss), comprising a gain of £2.7 million (FY2010/11: loss of £9.2 million) on the translation of non-Sterling denominated assets and liabilities combined with a gain of £0.1 million (FY2010/11: gain of £1.8 million) on realised and unrealised hedging transactions.
The notional level of foreign exchange hedges in place at 30 June 2012 is US$168.5 million. This consists of options (US$119.5 million) and forwards (US$49.0 million) in respect of FY2012/13 and FY2013/14 net management fee cash flows.
The options effectively operate as a collar, and together with the forwards, protect the Sterling value of US$168.5 million of the Group’s forecast management fee revenue cash flows for FY2012/13 and FY2013/14 from being impacted by currency movements (outside the contracted ranges for the collars).
The options and forwards have been marked-to-market at the year end rate of GBP1:1.5707USD.
As designated hedges the mark-to-market movement in the value of the options and forwards will be taken through reserves, until such time as they and the associated hedged revenues mature, so long as the hedges are assessed as being effective. If assessed as ineffective, the mark-to-market of the options and forwards will be taken through the income statement.
Regulatory capital As a UK listed asset management group, Ashmore is subject to regulatory supervision by the Financial Services Authority (FSA) under the Prudential Sourcebook for Banks, Building Societies and Investment Firms. The Group has one UK-regulated entity, Ashmore Investment Management Limited (“AIML”), on behalf of which half yearly capital adequacy returns are filed. AIML held surplus capital resources relative to its requirements at all times during the period under review.
Further, since 1 January 2007, the Group has been subject to consolidated regulatory capital requirements, whereby the Board is required to assess the degree of risk across the Group’s business, and hold sufficient capital against these.
The Board has assessed the amount of Pillar II capital required to cover such risks as £65.6 million. Thus, given the considerable balance sheet resources available to the Group, the Board is satisfied that the Group is adequately capitalised to continue its operations effectively.
Further information regarding the Group’s capital adequacy status can be found in the Group’s Internal Capital Adequacy Assessment Process (ICAAP) and Pillar III disclosures, which are available on our website at www.ashmoregroup.com.
Risk Risk is inherent in all businesses and is therefore present within the Group’s activities. The Group seeks to effectively identify, monitor and manage each of its risks and actively promotes a risk awareness culture throughout the organisation. The ultimate responsibility for risk management rests with the Board. However, from a practical perspective some of this activity is delegated.
The key risks, their mitigants, and their delegated owners are set out on pages 28 and 29 for each of the four risk categories that Ashmore considers most important: strategic and business, investment, operational, and treasury – with reputational risk being a common characteristic across all four categories.
Ashmore Group plc | Annual Report and Accounts 2012 25
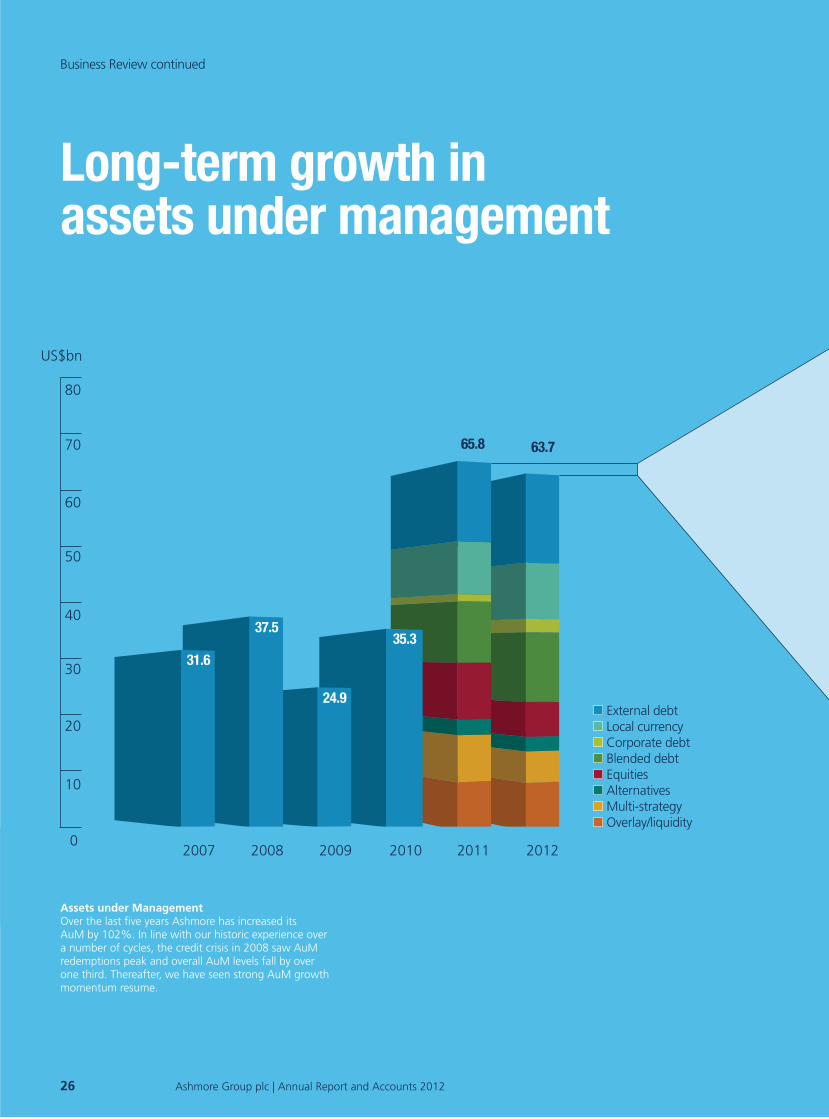
26 Ashmore Group plc | Annual Report and Accounts 2012
80
70
60
50
40
30
20
10
65.8 63.7
35.3
24.9
37.5
31.6
External debt Local currency Corporate debt Blended debt Equities Alternatives Multi-strategy Overlay/liquidity
0
US$bn
20122011201020092007 2008
26 Ashmore Group plc | Annual Report and Accounts 2012
Business Review continued
Long-term growth in assets under management
Assets under ManagementOver the last five years Ashmore has increased its AuM by 102%. In line with our historic experience over a number of cycles, the credit crisis in 2008 saw AuM redemptions peak and overall AuM levels fall by over one third. Thereafter, we have seen strong AuM growth momentum resume.
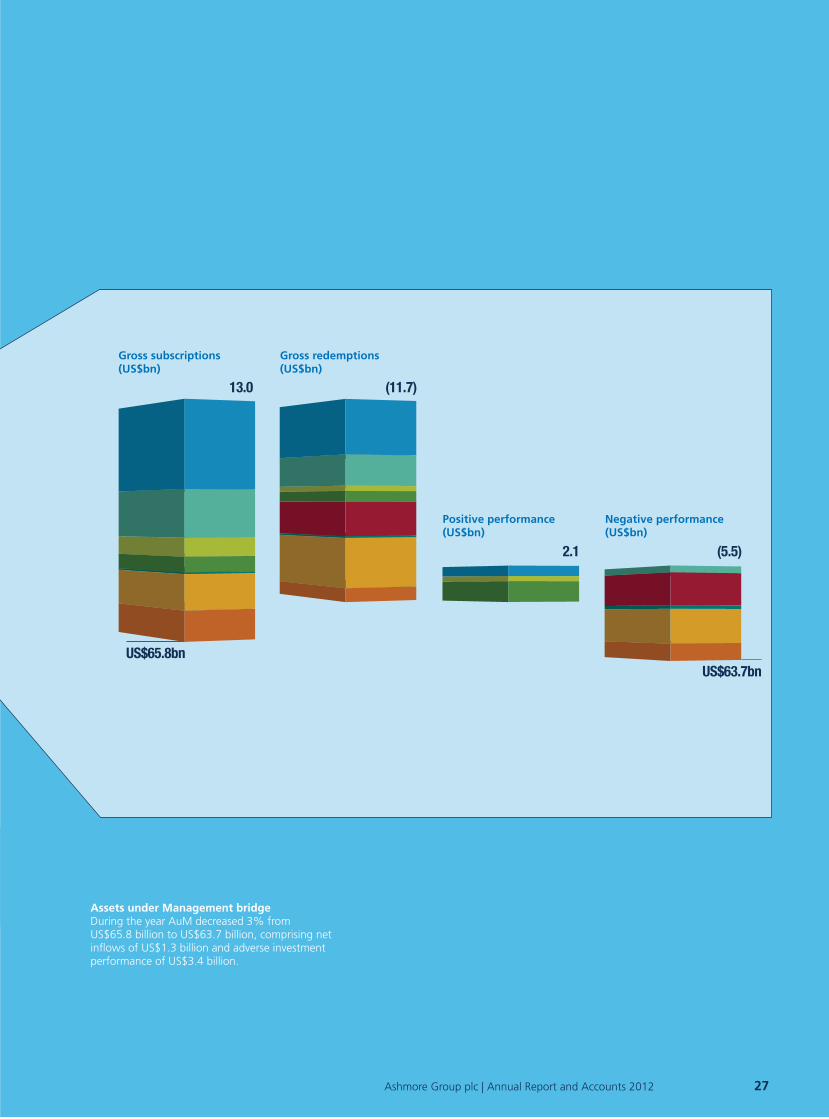
(5.5)2.1
(11.7)13.0
US$65.8bnUS$63.7bn
Assets under Management bridge During the year AuM decreased 3% from US$65.8 billion to US$63.7 billion, comprising net inflows of US$1.3 billion and adverse investment performance of US$3.4 billion.
Positive performance (US$bn)
Negative performance (US$bn)
Gross redemptions (US$bn)
Gross subscriptions (US$bn)
Ashmore Group plc | Annual Report and Accounts 2012 27

Principal Risks and Mitigation
Risk type/owner Description of risk Mitigation
Strategic and business risk The risk that the medium and long-term profitability of the Group could be adversely impacted by the failure to identify and implement the correct strategy, and to react appropriately to changes in the business environment.
Delegated to: Ashmore Group plc Board
These include: – A long-term downturn in the fundamental
and technical dynamics of emerging markets;– Reputational damage to Ashmore impacting
marketing and distribution capabilities; – Potential market capacity issues and
increased competition.
These include: – The Board’s long investment
management experience; – A clearly defined Group strategy,
understood throughout the organisation and actively monitored;
– The diversification of investment capabilities to reduce single event/product exposure;
– A committee based top down investment methodology to create a scalable business model;
– Experienced, centrally managed and globally located distribution team;
– Product Committee with knowledge of the markets in place.
Investment risk The risk of non-performance or manager neglect, including the risk that long-term investment outperformance is not delivered thereby damaging prospects for winning and retaining clients, and putting average management fee margins under increased pressure.
Delegated to: Ashmore Group Investment Committees
These include: – That the investment manager does not
adhere to policies; – A downturn in investment performance; – Expansion into unsuccessful themes; – Insufficient counterparties.
These include: – Experienced Investment Committees meet
weekly ensuring consistent core investment processes are applied;
– Dedicated emerging markets research and investment focus, with frequent country visits as well as physical presence in key Emerging Markets;
– Strong Compliance and Risk Management oversight of policies, restrictions, limits and other related controls;
– Formal counterparty policy with reviews held at least quarterly.
Operational risk Risks in this category are broad in nature and inherent in most businesses and processes. They include the risk that operational flaws result from a lack of resources or planning, error or fraud or weaknesses in systems and controls, and may lead to the inability to capitalise on market opportunities.
Delegated to: Ashmore Group Risk and Compliance Committee
These include: – The inability to fairly price assets; – Oversight of overseas subsidiaries; – Compliance with regulatory requirements
as well as with respect to the monitoring of investment breaches;
– Availability and retention of staff; – Execution and process management; – Business and systems disruption; – Fraud by an employee or third party
service provider.
These include: – The valuations of the most material assets
are outsourced to independent third parties with the Pricing Methodology Valuation Committee (PMVC) providing additional oversight of valuations used for hard- to-price assets;
– An integrated control and management framework is in place to ensure day-to-day global operations are managed effectively;
– Resources regularly reviewed and also career development and succession planning in place;
– A Risk and Compliance Committee meets on a monthly basis to consider the Group’s Key Risk Indicators (“KRIs”);
– A disaster recovery procedure exists and is tested regularly;
– Engagement letters or service level agreements are in place with all significant service providers;
– A Product Committee approves new product launches and regularly reviews existing products.
28 Ashmore Group plc | Annual Report and Accounts 2012

Risk type/owner Description of risk Mitigation
Treasury risk These are the risks that management does not appropriately mitigate balance sheet risks or exposures which could ultimately impact the financial performance or position of the Group.
Delegated to: Chief Executive Officer and Group Finance Director
These include: – Group revenues are primarily US dollar based,
whereas results are denominated in Sterling; – The Group invests in its own funds from time
to time, exposing it to price risk, credit risk and foreign exchange risk;
– Liquidity management;
– The Group is exposed to credit risk and interest rate risk in respect of its cash balances.
These include: – Monthly reporting of all balance sheet
exposures to the Executive; – A proportion of Group currency exposures
are hedged as a matter of policy; – Significant corporate investments are
approved by the Board, and all others by the CEO;
– Cash flows are forecast and monitored on a regular basis and managed in line with approved policy;
– The availability of GBP and USD S&P AAA rated liquidity funds managed by experienced cash managers;
– Defined Risk Appetite in place.
During the year the Group’s risk control framework has been enhanced to take account of changing business and market conditions. This included reviews conducted by the Group’s Internal Audit function. There has also been specific focus on the further refinement of the Group Risk Matrix, which seeks to identify the key risks to the Group, as well as current mitigants and forward-looking action plans.
Risk management and control Risk management and control is one element of the Group’s overall system of internal controls within its corporate governance framework – incorporating Risk, Compliance and Internal Audit. Further details of the Group’s internal control environment are described in the corporate governance report on pages 40 to 44.
Dividend In recognition of the satisfactory financial performance during the period, and of our confidence in the Group’s future prospects, the Directors are recommending a final dividend of 10.75 pence per share for the year ended 30 June 2012 which, subject to shareholder approval, will be paid on 7 December 2012 to all shareholders who are on the register on 9 November 2012.
An interim dividend for the six-month period to 31 December 2011 of 4.25 pence (31 December 2010: 4.16 pence) was paid on 4 April 2012. Together, these result in a full-year dividend of 15.00 pence (2011: 14.50 pence), an increase of 3.4%.
Graeme Dell Group Finance Director
Ashmore Group plc | Annual Report and Accounts 2012 29

Board of Directors
The Hon. Michael Benson, Non-executive Chairman (Age 69) Michael Benson was appointed to the Board as Non-executive Chairman on 3 July 2006. He is Chairman of the Company’s Nominations Committee. Michael began his career in the City in 1963 and, after a series of senior positions in the investment management industry, was, from 2002 to March 2005, Chairman of Invesco and Vice Chairman of Amvescap plc. Prior to that he was CEO of Invesco Global (1997 to 2002). Michael is a Non-executive Director of Trinity Street Asset Management, is the Director of the York Minster Fund and is CEO of the York Minster Revealed project.
Committee membership: N, R
Mark Coombs, Chief Executive Officer (Age 52) Mark Coombs was appointed a Director on the incorporation of the Company in December 1998, and has served as its Chief Executive Officer since then. He held a number of positions at Australia and New Zealand Banking Group (ANZ) and led Ashmore’s buyout from ANZ in early 1999. He is Co-Chair of EMTA, the trade association for emerging markets, having been on the Board since 1993. Mark has an MA in Law from Cambridge University.
Graeme Dell, Group Finance Director (Age 46) Graeme Dell was appointed to the Board as Group Finance Director in December 2007. Prior to joining Ashmore, Graeme was Group Finance Director of Evolution Group plc from 2001 to 2007, where he had group-wide responsibility for finance, operations, technology, compliance, risk and HR which included playing a significant role in the foundation and development of Evolution’s Chinese securities business. Graeme previously worked for Deutsche Bank and Goldman Sachs in a range of business management, finance and operations roles both in Europe and in Asia Pacific. Graeme qualified as a Chartered Accountant with Coopers & Lybrand and is a graduate of Hertford College, Oxford University.
Nick Land, Senior Independent Non-executive Director (Age 64) Nick Land was appointed to the Board as Senior Independent Non-executive Director and Chairman of the Audit and Risk Committee on 3 July 2006. He is a qualified accountant and was a partner of Ernst & Young LLP from 1978 to 2006 and its Chairman from 1995 to 2006. Nick is a Non-executive Director of BBA Aviation plc, Alliance Boots GmbH and Vodafone Group plc and a trustee of the Vodafone Group Foundation. He is a Board member of the Financial Reporting Council, a member of the Finance and Audit Committees of the National Gallery and is Chairman of the Board of Trustees of Farnham Castle.
Committee membership: A, N, R
Jonathan Asquith, Non-executive Director (Age 55) Jonathan Asquith joined the Board on 1 September 2008 and is Chairman of the Remuneration Committee. He was formerly Vice Chairman of Schroders plc and held the position of Chief Financial Officer between 2002 and 2007. Prior to that he worked for Morgan Grenfell and was appointed as Chief Financial Officer of Deutsche Morgan Grenfell in 1995 and Chief Operating Officer in 1997. He is also Non-executive Chairman of AXA UK plc and a Non-executive Director of AXA Investment Managers, 3i Group plc, Dexion Capital plc, and a member of the Finance and Audit Committees of the Tate galleries.
Committee membership: A, N, R
Melda Donnelly, Non-executive Director (Age 62) Melda Donnelly joined the Ashmore Group plc Board as a Non-executive Director in July 2009, and is also a member of the Audit and Risk Committee. Melda is an Australian citizen and a Chartered Accountant. She was the Founder and Chairperson of the Centre for Investor Education. Current directorships include Treasury Group Limited and Uni Super Limited. Ms Donnelly’s past investment experience includes being CEO of Queensland Investment Corporation, Deputy Managing Director of ANZ Funds Management and Managing Director of ANZ Trustees. She is currently a member of the Advisory Committee of the Oxford University Centre for Ageing.
Committee membership: A
Simon Fraser, Non-executive Director (Age 53) Simon Fraser joined the Board on 10 February 2012. Simon has extensive experience of the fund management industry, having worked at Fidelity International from 1981 to 2008. At Fidelity he held a number of positions during his career, including President of the European & UK Institutional Business, Global Chief Investment Officer, Chief Investment Officer for Asia Pacific and Chief Investment Officer of the European Investment Group. He is a Non-executive Director of Barclays Bank plc and Barclays plc, Chairman of Foreign & Colonial Investment Trust plc, The Merchants Trust plc and a Non-executive Director of Fidelity European Values Plc and Fidelity Japanese Values Plc.
Committee membership: None
Key to membership of committees A – Audit and Risk N – Nominations R – Remuneration
30 Ashmore Group plc | Annual Report and Accounts 2012

Directors’ Report
The Directors present their Annual Report and financial statements for the year ended 30 June 2012.
The financial statements have been prepared in accordance with International Financial Reporting Standards as adopted by the EU (IFRS).
Principal activity and business review The principal activity of the Group is the provision of investment management services. The Company is required to set out in this report a fair review of the business of the Group during the financial year ended 30 June 2012 and of the position of the Group at the end of that financial year and a description of the principal risks and uncertainties facing the Group (referred to as the business review). The information that fulfils the requirements of the business review can be found in the financial and operational highlights on page 2, the Chief Executive Officer’s report on pages 8 to 13, the business review on pages 20 to 29 and the Corporate Governance report on pages 40 to 44.
The principal risks facing the business are detailed in the business review on pages 28 and 29 and in the Corporate Governance report on pages 40 to 44.
Results and dividends The results of the Group for the year are set out in the consolidated statement of comprehensive income on page 55.
The Directors recommend a final dividend of 10.75 pence per share (2011: 10.34 pence) which, together with the interim dividend of 4.25 pence per share (2011: 4.16 pence) already declared, makes a total for the year ended 30 June 2012 of 15.00 pence per share (2011: 14.50 pence). Details of the interim dividend payment are set out in note 11 to the financial statements.
Subject to approval at the Annual General Meeting, the final dividend will be paid on 7 December 2012 to shareholders on the register on 9 November 2012 (ex-dividend date being 7 November 2012).
Related party transactions Details of related party transactions are set out in note 26 to the financial statements.
Post-balance sheet events As set out in note 28 to the financial statements there were no post-balance sheet events that required adjustment or disclosure herein.
Directors The members of the Board together with biographical details are shown on page 30, all of whom served as Directors throughout the year with the exception of Simon Fraser who was appointed to the Board on 10 February 2012.
Details of the service contracts of the current Directors are shown in the remuneration report on pages 46 to 53.
Details of the constitution and powers of the Board and its committees are set out in the corporate governance report on pages 40 to 44. The corporate governance report also summarises the Company’s rules concerning appointment and replacement of Directors.
Directors’ conflicts of interests Since October 2008, the Companies Act 2006 has imposed upon Directors a new statutory duty to avoid unauthorised conflicts of interest with the Company. The Company has adopted revisions to its Articles of Association which enable Directors to approve conflicts of interest and which also include other conflict of interest provisions. The Company has implemented processes to identify potential and actual conflicts of interest. Such conflicts are then considered for approval by the Board, subject, where necessary, to appropriate conditions.
Executive Directors do not presently hold any external appointments with any non-Ashmore related companies.
Directors’ share interests The interests of Directors in the Company’s shares are shown on page 53 within the remuneration report.
Significant agreements with provisions applicable to a change in control of the Company Save as described, there are no agreements in place applicable to a change in control of the Company.
Resolution 16 in the Notice of Annual General Meeting will seek approval from shareholders to a waiver of the provisions of Rule 9 of the Takeover Code in respect of the obligation that could arise for Mark Coombs to make a mandatory offer for the Company in the event that the Company exercises the authority to make market purchases of its own shares. Further details are contained in the separate Notice of AGM.
Restrictions on transfer of shares On 31 May 2011 the Company completed the acquisition of Emerging Markets Management LLC (now renamed Ashmore EMM LLC). A proportion of the initial and earnout consideration paid and to be paid to the selling shareholders of AshmoreEMM is in Ashmore Group plc shares which are subject to certain restrictions on sale for a period of up to three years from either completion or the date of earnout.
Dealings in the Company’s ordinary shares by persons discharging managerial responsibilities, employees of the Company and, in each case, their connected persons, are subject to the Group’s Dealing Code which adopts the Model Code of the Listing Rules contained in the Financial Services Authority’s Handbook.
Certain restrictions, customary for a listed company, apply to transfers of shares in the Company.
The Board may, at its absolute discretion, decline to register any transfer of a share which is not fully paid or where there are more than four joint holders.
Ashmore Group plc | Annual Report and Accounts 2012 31

Director’s Report continued
In the case of certificated shares, registration of a transfer may also be refused where (i) the instrument of transfer is not duly stamped (unless exempt from stamping); (ii) insufficient evidence of title is produced in respect of a transfer; or (iii) the transferor has been served with a restriction notice (as defined in the Articles) after failure to provide the Company with information concerning interests in those
shares required to be provided under the Companies Acts, unless the transfer is shown to the Board to be pursuant to an arm’s length sale. Registration of a transfer of shares may be refused in the case of uncertificated shares in the circumstances set out in the Uncertificated Securities Regulations (as defined in the Articles).
Substantial shareholdings The Company has been notified of the following significant interests (over 3 per cent) in accordance with the FSA’s Disclosure and Transparency Rules (other than those of the Directors which are disclosed separately on page 53) in the Company’s ordinary shares of 0.01 pence each as set out in the table below.
Number ofshares as at
30 June 2012 Percentage
interests2
Number of shares as at
10 September 2012 Percentage
interests2
Jerome Paul Booth 48,355,024 6.88 48,355,024 6.88
Carey Pensions and Benefits Limited as Trustees of the Ashmore 2004 Employee Benefit Trust1 32,668,764 4.62 32,668,764 4.62
BlackRock Inc 30,997,089 4.38 30,997,089 4.41
FMR LLC 35,260,338 4.98 35,260,338 4.98
1. In addition to the interests in the Company’s ordinary shares referred to above, each Director and senior manager who is an employee of the Group has an interest in the Company’s ordinary shares held by Carey Pensions and Benefits Limited under the terms of the Ashmore 2004 Employee Benefit Trust.
2. Percentage interests are based upon 707,372,473 shares in issue (which excludes 5,368,331 shares held in Treasury) (2011: 707,916,106 shares in issue which excluded 5,368,331in Treasury).
Share capital The Company has a single class of share capital which is divided into ordinary shares of 0.01 pence, each of which rank pari passu in respect of participation and voting rights. The shares are in registered form. The issued share capital of the Company at 30 June 2012 is 712,740,804 shares in issue (of which 5,368,331 shares are held in Treasury).
Details of the structure of and changes in share capital are set out in note 20 to the financial statements.
Restrictions on voting rights A member shall not be entitled to vote at any general meeting or class meeting in respect of any share held by him if any call or other sum then payable by him in respect of that share remains unpaid or if a member has been served with a restriction notice (as defined in the Articles) after failure to provide the Company with information concerning interests in those shares required to be provided under the Companies Acts. Votes may be exercised in person or by proxy. The Articles currently provide a deadline for submission of proxy forms of 48 hours before the meeting.
Purchase of own shares The Company is, until the date of the next Annual General Meeting, generally and unconditionally authorised to buy back up to 70,791,600 of its own issued shares. In the year under review the Company did not purchase any shares for Treasury. The Company retains a total of 5,368,331 shares for Treasury which were acquired at an average price of 129 pence per share. The Company is seeking a renewal of this authority at the 2012 Annual General Meeting.
Power to issue and allot shares The Directors are generally and unconditionally authorised to allot unissued shares in the Company up to a maximum nominal amount of £23,597.20 (and £47,194.40 in connection with an offer by way of a rights issue).
A further authority has been granted to the Directors to allot the Company’s shares for cash, up to a maximum nominal amount of £3,559.28, without regard to the pre-emption provisions of the Companies Acts. No such shares have been issued or allotted under these authorities, nor is there any current intention to do so, other than to satisfy outstanding obligations under the employee share schemes where necessary.
These authorities are valid until the date of the next Annual General Meeting. A resolution for the renewal of such authorities will be proposed at the 2012 Annual General Meeting.
Employees Details of the Company’s employment practices (including the employment of disabled persons) can be found in the corporate governance report on pages 40 to 44.
Carey Pensions and Benefits Limited as trustee of the Ashmore 2004 Employee Benefit Trust (the EBT) has discretion as to the exercise of voting rights over shares which it holds in respect of employee share options that have not vested and other restricted share awards. The current arrangement is that the EBT considers the Company’s recommendation(s) before voting such shares at a general meeting of the Company, subject to an overriding duty to act in the interests of the EBT.
Corporate governance The Company is governed according to the applicable provisions of company law and by the Company’s Articles. As a listed company, the Company must also comply with the Listing Rules and the Disclosure and Transparency Rules issued by the United Kingdom Listing Authority (UKLA). Listed companies are expected to comply as far as possible with the Financial Reporting Council’s UK Corporate Governance Code, and to state how its principles have been applied. A report on corporate governance and compliance with the provisions of the Code is set out on pages 40 to 44.
Board diversity The Board has noted the recommendations of the Davies Report issued in February 2011 relating to Board diversity. The Nominations Committee considers diversity, including the balance of skills, experience, gender and nationality, amongst many other factors, when reviewing the appointment of new Directors but does not consider it appropriate to establish targets or quotas in this regard.
32 Ashmore Group plc | Annual Report and Accounts 2012

Charitable and political contributions During the year, the Group made charitable donations of £0.1 million (2011: £0.3 million). The work of the Ashmore Foundation is described further below in the corporate social responsibility section of this report. It is the Group’s policy not to make contributions for political purposes.
Creditor payment policy The Group’s policy and practice in the UK is to follow its suppliers’ terms of payment and to make payment in accordance with those terms subject to receipt of satisfactory invoicing. Unless otherwise agreed payments to creditors are made within 30 days of receipt of an invoice. At 30 June 2012, the amount owed to the Group’s trade creditors in the UK represented approximately 28 days’ average purchases from suppliers (2011: 30 days).
Auditors and the disclosure of information to auditors The Directors who held office at the date of approval of this Directors’ report confirm that, so far as they are each aware, there is no relevant audit information of which the Company’s auditors are unaware, and each Director has taken all the steps that they ought to have taken as Directors to make himself or herself aware of any relevant audit information and to establish that the Company’s auditors are aware of that information.
Resolutions will be proposed at the Annual General Meeting to reappoint KPMG Audit Plc as auditors and to authorise the Directors to agree their remuneration. Note 7 to the financial statements sets out details of the auditors’ remuneration.
2012 Annual General Meeting The 2012 Annual General Meeting of the Company will be held at 12.00 noon on Wednesday 31 October 2012 at Kingsway Hall Hotel, 66 Great Queen Street, London WC2B 5BX. Details of the resolutions to be proposed at the Annual General Meeting are given in the separate circular and notice of meeting.
Going concern The Company and Group have considerable financial resources and the Directors believe that both are well placed to manage their business risks successfully. Further information regarding the Group’s business activities, together with the factors likely to affect its future development, performance and position is set out on pages 40 to 44.
After making enquiries, the Directors are satisfied that the Company and the Group have adequate resources to continue to operate for the foreseeable future and confirm that the Company and the Group are going concerns. For this reason they continue to adopt the going concern basis in preparing these financial statements.
Companies Act 2006 This Directors’ report on pages 31 to 33 inclusive has been drawn up and presented in accordance with and in reliance on English company law and the liabilities of the Directors in connection with that report shall be subject to the limitations and restrictions provided by such law.
References in this Directors’ report to the financial highlights, the business review, the corporate governance report and the remuneration report are deemed to be included by reference in this Directors’ report.
Approved by the Board and signed on its behalf by:
Michael Perman Company Secretary
10 September 2012
Ashmore Group plc | Annual Report and Accounts 2012 33

Statement of Directors’ Responsibilities
The Directors are responsible for preparing the Annual Report and the Group and parent company financial statements in accordance with applicable law and regulations.
Company law requires the Directors to prepare Group and parent company financial statements for each financial year. Under that law they are required to prepare the Group financial statements in accordance with IFRSs as adopted by the EU and applicable law and have elected to prepare the parent company financial statements on the same basis.
Under company law the Directors must not approve the financial statements unless they are satisfied that they give a true and fair view of the state of affairs of the Group and parent company and of their profit and loss for that period. In preparing each of the Group and parent company financial statements, the Directors are required to:
– select suitable accounting policies and then apply them consistently;
– make judgements and estimates that are reasonable and prudent;
– state whether they have been prepared in accordance with IFRSs as adopted by the EU; and
– prepare the financial statements on the going concern basis unless it is inappropriate to presume that the Group and the parent company will continue in business.
The Directors are responsible for keeping adequate accounting records that are sufficient to show and explain the parent company’s transactions and disclose with reasonable accuracy at any time the financial position of the parent company and enable them to ensure that its financial statements comply with the Companies Act 2006. They have general responsibility for taking such steps as are reasonably open to them to safeguard the assets of the Group and to prevent and detect fraud and other irregularities.
Under applicable law and regulations, the Directors are also responsible for preparing a Directors’ report, Directors’ remuneration report and corporate governance statement that comply with that law and those regulations.
The Directors are responsible for the maintenance and integrity of the corporate and financial information included on the Company’s website. Legislation in the UK governing the preparation and dissemination of financial statements may differ from legislation in other jurisdictions.
Responsibility statement of the Directors in respect of the annual financial report We confirm that to the best of our knowledge:
– the financial statements, prepared in accordance with the applicable set of accounting standards, give a true and fair view of the assets, liabilities, financial position and profit or loss of the Company and the undertakings included in the consolidation taken as a whole; and
– the Directors’ report includes a fair review of the development and performance of the business and the position of the issuer and the undertakings included in the consolidation taken as a whole, together with a description of the principal risks and uncertainties that they face.
Michael Benson Chairman
10 September 2012
34 Ashmore Group plc | Annual Report and Accounts 2012
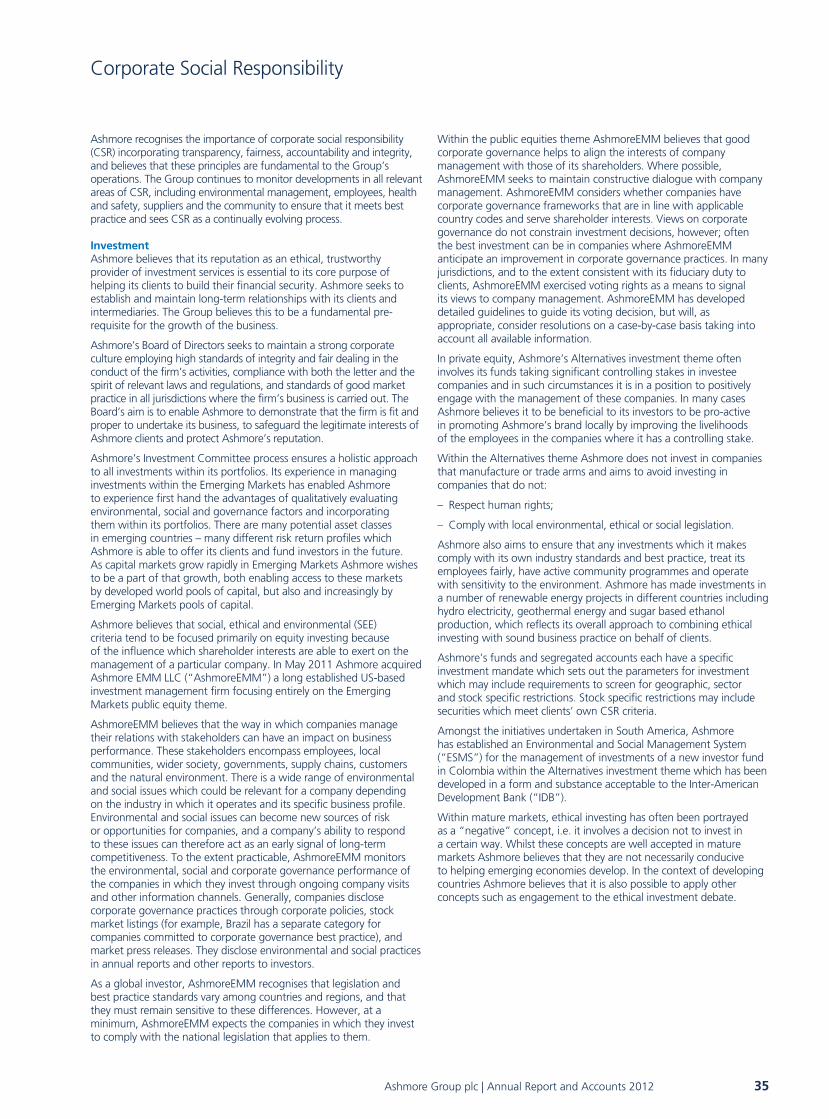
Corporate Social Responsibility
Ashmore recognises the importance of corporate social responsibility (CSR) incorporating transparency, fairness, accountability and integrity, and believes that these principles are fundamental to the Group’s operations. The Group continues to monitor developments in all relevant areas of CSR, including environmental management, employees, health and safety, suppliers and the community to ensure that it meets best practice and sees CSR as a continually evolving process.
Investment Ashmore believes that its reputation as an ethical, trustworthy provider of investment services is essential to its core purpose of helping its clients to build their financial security. Ashmore seeks to establish and maintain long-term relationships with its clients and intermediaries. The Group believes this to be a fundamental pre-requisite for the growth of the business.
Ashmore’s Board of Directors seeks to maintain a strong corporate culture employing high standards of integrity and fair dealing in the conduct of the firm’s activities, compliance with both the letter and the spirit of relevant laws and regulations, and standards of good market practice in all jurisdictions where the firm’s business is carried out. The Board’s aim is to enable Ashmore to demonstrate that the firm is fit and proper to undertake its business, to safeguard the legitimate interests of Ashmore clients and protect Ashmore’s reputation.
Ashmore’s Investment Committee process ensures a holistic approach to all investments within its portfolios. Its experience in managing investments within the Emerging Markets has enabled Ashmore to experience first hand the advantages of qualitatively evaluating environmental, social and governance factors and incorporating them within its portfolios. There are many potential asset classes in emerging countries – many different risk return profiles which Ashmore is able to offer its clients and fund investors in the future. As capital markets grow rapidly in Emerging Markets Ashmore wishes to be a part of that growth, both enabling access to these markets by developed world pools of capital, but also and increasingly by Emerging Markets pools of capital.
Ashmore believes that social, ethical and environmental (SEE) criteria tend to be focused primarily on equity investing because of the influence which shareholder interests are able to exert on the management of a particular company. In May 2011 Ashmore acquired Ashmore EMM LLC (“AshmoreEMM”) a long established US-based investment management firm focusing entirely on the Emerging Markets public equity theme.
AshmoreEMM believes that the way in which companies manage their relations with stakeholders can have an impact on business performance. These stakeholders encompass employees, local communities, wider society, governments, supply chains, customers and the natural environment. There is a wide range of environmental and social issues which could be relevant for a company depending on the industry in which it operates and its specific business profile. Environmental and social issues can become new sources of risk or opportunities for companies, and a company’s ability to respond to these issues can therefore act as an early signal of long-term competitiveness. To the extent practicable, AshmoreEMM monitors the environmental, social and corporate governance performance of the companies in which they invest through ongoing company visits and other information channels. Generally, companies disclose corporate governance practices through corporate policies, stock market listings (for example, Brazil has a separate category for companies committed to corporate governance best practice), and market press releases. They disclose environmental and social practices in annual reports and other reports to investors.
As a global investor, AshmoreEMM recognises that legislation and best practice standards vary among countries and regions, and that they must remain sensitive to these differences. However, at a minimum, AshmoreEMM expects the companies in which they invest to comply with the national legislation that applies to them.
Within the public equities theme AshmoreEMM believes that good corporate governance helps to align the interests of company management with those of its shareholders. Where possible, AshmoreEMM seeks to maintain constructive dialogue with company management. AshmoreEMM considers whether companies have corporate governance frameworks that are in line with applicable country codes and serve shareholder interests. Views on corporate governance do not constrain investment decisions, however; often the best investment can be in companies where AshmoreEMM anticipate an improvement in corporate governance practices. In many jurisdictions, and to the extent consistent with its fiduciary duty to clients, AshmoreEMM exercised voting rights as a means to signal its views to company management. AshmoreEMM has developed detailed guidelines to guide its voting decision, but will, as appropriate, consider resolutions on a case-by-case basis taking into account all available information.
In private equity, Ashmore’s Alternatives investment theme often involves its funds taking significant controlling stakes in investee companies and in such circumstances it is in a position to positively engage with the management of these companies. In many cases Ashmore believes it to be beneficial to its investors to be pro-active in promoting Ashmore’s brand locally by improving the livelihoods of the employees in the companies where it has a controlling stake.
Within the Alternatives theme Ashmore does not invest in companies that manufacture or trade arms and aims to avoid investing in companies that do not:
– Respect human rights;
– Comply with local environmental, ethical or social legislation.
Ashmore also aims to ensure that any investments which it makes comply with its own industry standards and best practice, treat its employees fairly, have active community programmes and operate with sensitivity to the environment. Ashmore has made investments in a number of renewable energy projects in different countries including hydro electricity, geothermal energy and sugar based ethanol production, which reflects its overall approach to combining ethical investing with sound business practice on behalf of clients.
Ashmore’s funds and segregated accounts each have a specific investment mandate which sets out the parameters for investment which may include requirements to screen for geographic, sector and stock specific restrictions. Stock specific restrictions may include securities which meet clients’ own CSR criteria.
Amongst the initiatives undertaken in South America, Ashmore has established an Environmental and Social Management System (“ESMS”) for the management of investments of a new investor fund in Colombia within the Alternatives investment theme which has been developed in a form and substance acceptable to the Inter-American Development Bank (“IDB”).
Within mature markets, ethical investing has often been portrayed as a “negative” concept, i.e. it involves a decision not to invest in a certain way. Whilst these concepts are well accepted in mature markets Ashmore believes that they are not necessarily conducive to helping emerging economies develop. In the context of developing countries Ashmore believes that it is also possible to apply other concepts such as engagement to the ethical investment debate.
Ashmore Group plc | Annual Report and Accounts 2012 35

Corporate Social Responsibility continued
The majority of Ashmore’s assets continue to be invested in either External Debt (the majority of which is Sovereign) or Local Currencies. In the case of external debt investments, the ability to have an influence is generally limited to a decision whether or not to invest, however, at a country level it is believed that Ashmore is able to exert an influence through dialogue with governments and central banks. Engagement with a country, as opposed to disengagement, is akin to many small pressures every day as opposed to one “big stick”. By remaining engaged it is often possible to have a positive influence and to have credibility.
Where Emerging Markets are concerned therefore, Ashmore believes that in certain circumstances it may be more beneficial to keep investment flowing as well as the influence which accompanies it in order to continue to be able to help a country’s population. In country specific terms, at the extreme, being cut off from capital may allow undemocratic rulers to control their people by attributing blame for economic problems to foreign involvement. Sanctions may be counter-productive and may reduce the welfare of the population considerably. Hence Ashmore takes investment and engagement/ disengagement decisions on a case by case basis relative to the specific circumstances and investment criteria in the best interests of clients.
Details on how, and the extent to which, Ashmore complies with the principles of the UK Stewardship Code are described separately on the Ashmore website at: www.ashmoregroup.com.
The Ashmore Foundation Consistent with the Group’s commitment to responsible corporate citizenship, the Ashmore Foundation was created in 2008 and is funded by personal financial contributions from employees of the Group. The Foundation reflects Ashmore’s overall philosophy that we can and should make a positive difference in communities in which Ashmore operates, in countries which contribute to Ashmore’s income and profitability. The Foundation therefore seeks to provide financial grants to worthwhile causes within the Emerging Markets in order to enhance human welfare, opportunities and capabilities, particularly for those that are vulnerable and at the lower end of the socio-economic spectrum.
The Foundation’s grant-making policy is wide-ranging but has a particular focus on education and healthcare, the former in particular being seen as the best way to help the long-term self-development of Emerging Markets countries. The Foundation is also interested in supporting sustainable livelihoods and social enterprise as a method of reducing poverty in a manner that empowers people to help themselves.
Despite strong economic growth in many Emerging Market countries, inequality creates ongoing challenges and many of the most vulnerable groups are excluded from opportunities afforded by wider national developments. The Ashmore Foundation works to address disadvantage in the Emerging Markets by enhancing the capabilities and resources of underprivileged communities. For Ashmore, the Foundation signals to its investors, clients, employees and the general public a philosophy of giving back to the countries and communities that contribute to the Company’s success. The Ashmore Foundation provides for Ashmore to demonstrate its commitment to the local communities in which the business operates and provides an opportunity for employee engagement in a rewarding programme of philanthropic work, as well as the much-coveted opportunity for grantees to connect with Ashmore’s talent, network and brand.
An Emerging Markets (EM) focus:
– Reflects a desire to give back to the countries that have contributed to the Company’s profitability;
– Allows for increased leverage of the EM skills, knowledge, expertise and networks of Ashmore to deliver the social goals of the Foundation;
– Provides support for a thriving and diverse civil sector, which is essential to democratic development in transitional and emerging nations;
– Offers potential “bang” for philanthropic “buck”.
Operating in EM poses challenges, principally:
– Scale of need versus resources available;
– Language, distance and cultural issues – particularly in carrying out due diligence and monitoring.
Awareness of these challenges informs the Foundation’s giving strategy.
The Ashmore Foundation provides grants to non-profit organisations that are closely connected to local communities and that provide vital services to disadvantaged groups, particularly young people, in the areas of education, health and livelihoods. A partnership scheme identifies organisations that are accountable, have a strong track record and demonstrable potential impact in addressing pressing social needs, providing flexible funding potentially over a number of years. In 2012 the Foundation will also fund the STARS Impact Awards in Asia as a complement to its approach, awarding much needed unrestricted funding to and shining a light on exceptional examples of innovative frontline Non Government Organisations (NGOs) delivering tangible outcomes for disadvantaged children.
Priorities for the Ashmore Foundation are currently:
– Supporting NGOs with the potential to achieve tangible social outcomes to improve the education, health and livelihoods prospects of disadvantaged communities, particularly young people, in the Emerging Markets;
– 10 priority locations, where Ashmore has a presence and/or invests and where there exist pressing social needs;
– A small (one to three) portfolio of sourced, effective non-profit partners in each priority country, supported over a number of years to achieve social goals;
– Support for the STARS Foundation’s Asia Impact Awards;
– Supplementary ‘small grants’ scheme for wider, eligible charities.
Ashmore Foundation grantees have the opportunity to showcase their work at Ashmore’s offices. Ashmore provides matched funding of up to £2,000 per employee per year for donations to the Foundation, whilst the Foundation provides matching of up to £500 per employee per year for donations to Foundation grantees. Ashmore employees are increasingly involved in additional activities such as in-country mentoring, as well as fundraising for Ashmore Foundation grantees, through events such as the 3 Peaks Challenge in May 2012.
The board of trustees of the Ashmore Foundation are responsible for ensuring strategic oversight, including financial oversight and risk management, to ensure that it is solvent and performing in its delivery of public benefit. Ashmore trustees (six) bring skills including general management, financial and investment management, knowledge of the markets in which the Foundation operates as well as experience of fundraising and governance for charities. Legal and specific grant-making expertise is provided through an external trustee.
36 Ashmore Group plc | Annual Report and Accounts 2012

The management of the Foundation is delegated to one member of staff with experience in management of charities working in international development and human rights, fundraising and communications.
The Ashmore Foundation has assets of approximately £7.5 million, and has committed grants totalling £1,228,830 for Emerging Markets social causes since inception.
The Ashmore Foundation is a member of the Association of Charitable Foundations.
Regular updates on the activities of the Foundation are published on the Ashmore Foundation section of our website at www.ashmoregroup.com.
Employees At year end Ashmore employed 257 people in 11 countries worldwide. Ashmore’s people have always been its most important asset, at the heart of everything it does. Ashmore has many talented people and it remains a priority to develop, manage and retain this talent in order to deliver the potential of the organisation. Ashmore wants to be an employer which the most talented people aspire to join wherever it operates.
Ashmore seeks to ensure that its workforce reflects, as far as practicable, the diversity of the many communities in which it is located. Ashmore also recognises the diverse needs of its employees in managing the responsibilities of their work and personal lives, and believes that achieving an effective balance in these areas is beneficial to both the Company and the individual.
Ashmore encourages employees to act ethically and to clearly uphold the standards of practice which its clients have come to expect. It also means ensuring that its employees understand the strategic aims and objectives of the Group and are clear about their role in achieving them.
The Group recognises that the involvement of its employees is key to the future success of the business and adopts a practice of keeping employees informed on significant matters affecting them, via email and in meetings arranged for the purpose. The Group has consistently operated a remuneration strategy that recognises both corporate and individual performance.
The Group is also committed to following good practice in employment matters, recognising the part this plays in attracting and retaining staff. The Group promotes the importance of high ethical standards to all employees and staff have the opportunity to voice any concerns they may have, either direct with management or on a confidential basis via the whistle-blowing process.
Equal opportunities The Group is committed to ensuring that all employees are treated fairly and with dignity and respect. This commitment is reflected in the Staff Handbook that all employees receive on joining.
The policies and practices in place within the Group to deter acts of harassment and discrimination are regularly monitored.
It is the Group’s policy that no employee shall be treated less favourably on the grounds of their age, sex, sexual orientation, race, religion, nationality or marital status or on the grounds of disability. This policy applies, without limitation, to promotion, training, placement, transfer, dismissal, remuneration, grievance and disciplinary procedures and decisions. This policy also applies to persons from outside the workplace and the treatment of contract workers.
Health and Safety The Group has in place a global health and safety policy which can be accessed by all staff via an internal database. The aim of this policy is to provide both staff and visitors with a safe and healthy working environment. The Group is committed to adhering to the high standards of health and safety set out by its policies and procedures and to providing training as necessary.
Environment As an investment manager, Ashmore has a limited direct impact upon the environment and there are few environmental risks associated with the Group’s activities. Ashmore moved into its premises at 61 Aldwych, London in May 2008 and occupies a single floor of approximately 19,000 square feet in a nine storey multi-tenanted building. Water and gas supplied into the building are metered centrally by the building management and costs apportioned to each tenant pro-rata according to floor occupancy.
As part of its ongoing commitment to the environment, Ashmore throughout its operations has adopted policies and programmes to promote energy conservation and the avoidance of waste through a number of initiatives, such as the recycling of paper, glass and other waste and the use of “green” energy. Electricity usage is separately monitored by floor with renewable energy accounting for a minimum of 10 per cent of supply. Energy-efficient lighting is installed in the building with sensors which turn lights off when no movement is detected. The building has received an Energy Performance Certificate with an Asset Rating of 98. Utilities are not monitored by the building management in terms of carbon emissions as no accurate data is available on the consumptive quality of each item. The registration and reporting obligations under the Carbon Reduction Commitment (CRC) Energy Efficient Scheme do not apply to the Company.
Ashmore endeavours to make maximum use of available technology such as video conferencing; however, its business model as an investor in Emerging Markets inevitably requires that its investment professionals and other members of staff travel frequently to these countries to assess and monitor opportunities.
Ashmore provides obsolete computers to Computer Aid International (“Computer Aid”), a UK registered charity that aims to reduce poverty through practical ICT solutions, and has in place recycling programmes for waste paper, photocopier toners and other disposable materials.
Ashmore has published a separate corporate responsibility report which can be found on its website at www.ashmoregroup.com.
By order of the Board
Michael Perman Company Secretary
10 September 2012
Ashmore Group plc | Annual Report and Accounts 2012 37

38 Ashmore Group plc | Annual Report and Accounts 2012
The Foundation’s AimsThe Ashmore Foundation aims to make a positive difference in the Emerging Market communities in which Ashmore operates and in the countries in which Ashmore invests. The Foundation provides financial grants to effective non-profit organisations working to enhance human welfare, opportunities and capabilities for those that are vulnerable or neglected and in particular children, young people and marginalised communities. The Emerging Market focus allows for increased leverage of the skills, knowledge, expertise and networks of Ashmore to deliver the social goals of the Foundation and provides support for a thriving and diverse civil sector, which is essential to democratic development in transitional and emerging nations.
The grant making policy of the Ashmore Foundation is wide ranging but maintains a particular focus on providing access to and improving quality of education and basic health, the former in particular seen as the best way to help the long-term self-development of Emerging Market countries. The Foundation is also interested in supporting community-based social enterprise and sustainable livelihoods, to empower people with the tools and resources with which to help themselves.
The Foundation supports charitable causes through a Small Grants and Partnership scheme. The Small Grants scheme provides flexible one-off funds of up to £5,000, whilst the Partnership Grants scheme provides larger, often multi-year grants, building relationships with a handful of particularly strong charities or NGOs in pursuit of agreed social outcomes.
The Foundation primarily sources partners through research and recommendation, seeking locally-based, emerging organisations which display a deep knowledge of the local context and culture, demonstrable involvement of and commitment to the community served, a good track record in meeting clearly defined social needs, professionalism, accountability, ability to measure results, cost-effectiveness and potential to scale or disseminate knowledge.
In 2011, the Ashmore Foundation paid out £473,710 to 23 grantees delivering social work in 11 Emerging Market countries (up from £197,690 in 2010), benefitting approximately 60,000 people. In 2011, trustees approved grant commitments totalling £768,000 over the period from 2011 – 2014. The Ashmore Foundation has donated £934,832 to charitable causes since inception in 2008.
In 2012 the Foundation will also be funding the STARS Impact Awards in Asia as a complement to its approach, awarding much needed funding to and shining a light on exceptional examples of innovative frontline NGOs delivering life changing services to disadvantaged children in developing countries.
Ashmore Employee EngagementEmployees have the opportunity to recommend eligible charities for support by the Ashmore Foundation. All organisations considered for support are assessed against the standard criteria of the Foundation designed to identify well managed and accountable organisations. Employees can also make use of matched funding offered by Ashmore for donations and by the Ashmore Foundation to Foundation grantees.
The board of trustees (directors) comprises Ashmore employees and an independent director. Ashmore employee directors are rotated to ensure new members have the opportunity to contribute and learn from the Foundation’s activities.
The Ashmore Foundation presents information on local charities within the Emerging Markets to firm employees on a regular basis, including showcasing by grantees at Ashmore’s offices.

Go
vernan
ce
Class sponsored by the Ashmore Foundation at
the Philippine Community Fund’s community school
for children living in Tondo or Navotas slum in Manila
Sunday and Joe, residents at Mama Laadi’s foster home supported by Ashmore Foundation grantee, Afrikids, which works to alleviate child suffering and poverty in Northern Ghana
Girl-friendly soccer training is combined with nutrition and life skills workshops for at-risk children and youth through grantee, Futbol Con Corozon at La Playa in Colombia
A pre and post natal satellite clinic delivered by Impact Bangladesh as part of a holistic programme funded by the Ashmore Foundation to reduce malnutrition, protect mothers and babies, and provide primary healthcare to 22,500 people
Nutritious meals and supplements along with family education and social support,
are provided by Nu3 Foundation for malnourished children in
Barranquilla, Colombia
Ashmore Group plc | Annual Report and Accounts 2012 39

Corporate Governance Report
In May 2010 the FRC published a new edition of the UK Corporate Governance Code (“the 2010 Code”) which applies to financial years beginning on or after 29 June 2010.
The Company has been in compliance with the predecessor Combined Code since Admission to listing on the London Stock Exchange on 17 October 2006, except where the Directors consider that in particular limited circumstances, departure may be justified and explained.
No departures from the 2010 Code occurred during the year under review.
This report describes the Company’s corporate governance arrangements, explaining how it has applied the principles of the Combined Code.
Michael Benson Chairman
Directors The Board of Directors comprises two Executive Directors and five Non-executive Directors. The two Executive Directors are Mark Coombs, the Chief Executive Officer, and Graeme Dell, the Group Finance Director. The Non-executive Directors are Michael Benson, Chairman; Nick Land, Senior Independent Director; Jonathan Asquith, Melda Donnelly and Simon Fraser. With the exception of Simon Fraser who joined the Board on 10 February 2012 all Directors served throughout the year.
The Board has a schedule of matters specifically reserved to it for decision and approval, which include, but are not limited to:
– the Group’s long-term commercial objectives and strategy;
– major acquisitions, disposals and investments;
– the Group’s annual and interim reports and financial statements;
– interim dividend and recommendation of final dividend;
– annual budgets and forecast updates;
– significant capital expenditure; and
– the effectiveness of internal controls.
The roles of the Chairman and Chief Executive Officer are separate, clearly defined and have been approved by the Board. The Chairman is responsible for the effective conduct of the Board, while the Chief Executive Officer is responsible for execution of strategy and for the day-to-day management of the Group.
In considering Non-executive Director independence, the Board has taken into consideration the guidance provided by the 2010 Code. The Board considers Michael Benson, Nick Land, Jonathan Asquith, Melda Donnelly and Simon Fraser to be independent. Nick Land is the Senior Independent Director.
During the year under review the Group complied with the 2010 Code requirement that at least half of the Board consist of independent Directors (excluding the Chairman).
Biographical details of the Directors are given on page 30.
The Board met six times during the year to review financial performance and strategy and to follow the formal schedule of matters reserved for its decision. Comprehensive Board papers, comprising an agenda and formal reports and briefing papers, are sent to Directors in advance of each meeting. Throughout their period in office, Directors are continually updated by means of written and verbal reports from senior executives and external advisors on the Group’s business, and the competitive and regulatory environments in which it operates, as well as on legal, corporate governance, corporate social responsibility and other relevant matters.
In addition to its formal business, the Board received a number of briefings and presentations from executive management during the year covering a wide range of topics across the range of the Group’s business. All Directors have access to independent professional advice, if required, at the Company’s expense as well as to the advice and services of the Company Secretary. New Directors appointed to the Board will receive advice as to the legal and other duties and obligations arising from the role of a director of a UK listed company within a full, formal and tailored induction programme. The Company Secretary, under the direction of the Chairman, is responsible for maintaining an adequate continuing education programme, reminding the Directors of their duties and obligations on a regular basis, ensuring good information flows between the Board, its committees and management and assisting with Directors’ continuing professional development needs.
The Company’s Nominations Committee considers the appointment and replacement of Directors subject to the rules set out in the Articles, a summary of which is set out below.
Under the Articles, the minimum number of Directors shall be two and the maximum shall be nine. Directors may be appointed by the Company by ordinary resolution or by the Board. A Director appointed by the Board must offer himself for election at the next Annual General Meeting of the Company following his appointment but he is not taken into account in determining the Directors or the number of Directors who are to retire by rotation at that meeting. The Directors to retire by rotation must be those who held office at the time of the two preceding Annual General Meetings and did not retire at either of them or if they have held office with the Company for a continuous period of nine years or more at the date of the Annual General Meeting. The office of Director shall be vacated in other circumstances, including where (i) that Director resigns or is asked to resign; (ii) they are or have been suffering from mental ill health; (iii) they are absent without permission of the Board from meetings of the Board for six consecutive months; (iv) they become bankrupt or compound with their creditors generally; or (v) they are prohibited by law from being a Director. Notwithstanding these provisions the Board has adopted provision B.7.1 of the 2010 Code and therefore all Directors (excluding Jonathan Asquith who is to stand down from the Board) will retire and seek re-election at the Annual General Meeting on 31 October 2012.
40 Ashmore Group plc | Annual Report and Accounts 2012

Powers of the Directors Subject to the Company’s Articles, the Companies Acts and any directions given by the Company by special resolution, the business of the Company is managed by the Board, who may exercise all powers of the Company, whether relating to the management of the business of the Company or not.
Annual performance evaluation The 2010 Code recommends that the Board should undertake a formal annual evaluation of its own performance and that of its committees and individual Directors and that an externally facilitated evaluation should be undertaken at least once every three years. During the year, the Board undertook an externally facilitated evaluation of its own performance and that of its committees and individual Directors led by an independent consultant experienced in board evaluation. The external facilitator had no other connection with the Company. Meetings were held between each Director and the independent external facilitator in which issues and developments over the year were discussed and performance was considered by reference to the objectives of the Board and its committees. The issues raised during this process were discussed by the Board together. During the year, the Non-executive Directors, led by the Senior Independent Non-executive Director, evaluated the performance of the Chairman and gave feedback on his performance as Chairman which was also reflected in the externally facilitated evaluation. The Board believes that, following the completion of the independently facilitated performance evaluation, the performance of the Directors continues to be effective and that they continue to demonstrate commitment to their roles.
Board and committee attendance The table below sets out the number of pre-scheduled meetings of the Board and its committees and individual attendance by the Directors.
Board and committee attendance
Board
Nominations Committee
Audit and Risk
Committee Remuneration
Committee
Total number of scheduled meetings between 1 July 2011 and 30 June 2012 6 2 4 4
Michael Benson 100% 100% – 100%
Mark Coombs1 100% – – –
Graeme Dell1 100% – – –
Nick Land 100% 100% 100% 100%
Jonathan Asquith 100% 100% 100% 100%
Melda Donnelly 100% – 100% –
Simon Fraser2 100% – – –
1. Members of executive management are invited to attend Board Committee meetings as required but do not attend as members of those Committees.
2. Simon Fraser joined the Board on 10 February 2012 and has attended all Board meetings since that date.
Any Directors who are not members of Board Committees are also invited to attend meetings of such Committees as necessary.
Board committees The Board has appointed Audit and Risk, Remuneration and Nominations Committees to assist in the execution of its duties.
All of these committees operate within written terms of reference, which are reviewed annually. In order to strengthen and enhance the Audit Committee’s oversight on risk matters the terms of reference and agenda for the committee were revised from September 2011 and the committee was changed to the Audit and Risk Committee in order to reflect this role. The terms of reference of the Remuneration Committee have also been revised to give due regard to the provisions and recommendations of the FSA’s Remuneration Code.
The chairman of each committee reports regularly to the Board.
Each of the committees is authorised, at the Company’s expense, to obtain external legal or other professional advice to assist in carrying out its duties. Only the members of each committee are entitled to attend its meetings but others, such as senior management and external advisors, may be invited to attend as appropriate.
Current membership of the committees is shown in the relevant sections below. The composition of these committees is reviewed annually, taking into consideration the recommendations of the Nominations Committee.
Audit and Risk Committee During the year under review the Audit and Risk Committee comprised the following Non-executive Directors and was fully compliant with the 2010 Code:
Nick Land (Chairman) Melda Donnelly Jonathan Asquith
The Board is satisfied that for the year under review and thereafter Nick Land, Jonathan Asquith and Melda Donnelly had and have recent and relevant commercial and financial knowledge and experience to satisfy the provisions of the 2010 Code. Nick Land and Melda Donnelly are Chartered Accountants and Jonathan Asquith has previously served as Chief Financial Officer of Schroders plc and Deutsche Morgan Grenfell.
A report on the activities of the Audit and Risk Committee is set out below. The terms of reference for the committee take into account the requirements of the 2010 Code and are available for inspection at the registered office and at the Annual General Meeting and can also be found on the Company website at www.ashmoregroup.com.
The terms of reference for the Audit and Risk Committee include:
– monitoring the integrity of the financial statements of the Company, any formal announcements relating to the Company’s financial performance and any significant financial issues and judgements contained in them;
– reviewing the Group’s draft annual financial statements and interim results statement prior to discussion and approval by the Board and reviewing the external auditors’ detailed reports thereon;
– reviewing the external auditors’ plan for the audit of the Group’s financial statements, receiving and reviewing confirmations of auditor independence and approving the terms of engagement and proposed fees for the audit;
– making recommendations to the Board for a resolution to be put to shareholders to approve the re-appointment of the external auditors;
– reviewing the level and amount of external auditor non-audit services;
– reviewing the Group’s internal control and risk management systems, reporting to the Board on the results of this review and receiving updates on key risks and controls;
Ashmore Group plc | Annual Report and Accounts 2012 41

Corporate Governance Report continued
– overseeing and challenging the day-to-day risk management and oversight arrangements of the executive and the design and execution of stress and scenario testing;
– overseeing and challenging due diligence on risk issues relating to material transactions and strategic proposals that are subject to approval by the Board;
– considering and approving the remit of the risk management function and ensuring that it has adequate independence; and
– reviewing the Audit and Risk Committee’s terms of reference, carrying out an annual performance evaluation exercise and noting the satisfactory operation of the Committee.
The Audit and Risk Committee has requested and received reports from management to enable it to fulfil its duties under its terms of reference.
The Audit and Risk Committee also has responsibility for reviewing the Company’s arrangements on whistle-blowing, ensuring that appropriate arrangements are in place for employees to be able to raise, in confidence, matters of possible impropriety, with suitable subsequent follow-up action.
The Audit and Risk Committee has the authority to seek any information it requires to perform its duties from any employee of the Company and to obtain outside legal or other independent professional advice as appropriate.
The number of Audit and Risk Committee meetings and their attendance by the Directors are set out in the table on page 41. Representatives of KPMG Audit Plc, the Group Finance Director, Group Head of Risk and representatives of the internal auditors, Ernst & Young, attend each meeting as a matter of practice and presentations are made by the executive management as required.
Remuneration Committee The Group complied during the year with the 2010 Code requirement that the Remuneration Committee should consist of at least three independent Non-executive Directors. The Remuneration Committee was chaired throughout the financial year by Jonathan Asquith with Michael Benson and Nick Land as members, all of whom served on the Remuneration Committee throughout the year. Jonathan Asquith has indicated his wish not to stand for re-election at the Annual General Meeting on 31 October 2012 and Nick Land has assumed the role of the Chairman of the Remuneration Committee at the date of this report.
A report on the activities of the Remuneration Committee is included in the remuneration report on pages 46 to 53. The terms of reference for the Remuneration Committee take into account the requirements of the 2010 Code and are available for inspection at the registered office, at the Annual General Meeting and can also be found on the Company website at www.ashmoregroup.com.
The terms of reference for the Remuneration Committee include:
– reviewing the ongoing appropriateness and relevance of the remuneration policy;
– reviewing the design of all share incentive plans for approval by the Board and shareholders;
– ensuring that members of the executive management of the Company are provided with appropriate incentives to encourage enhanced performance and that remuneration incentives are compatible with the Company’s risk policies and systems;
– making recommendations to the Board as to the Company’s framework or broad policy for the remuneration of the Chairman, the Executive Directors and the Company Secretary and to determine their total individual remuneration packages including bonuses, incentive payments and share options or other share awards;
– ensuring that a significant proportion of Executive Directors’ remuneration is structured so as to link rewards to corporate and individual performance and that performance conditions are stretching and designed to promote the long-term success of the Company; and
– ensuring that contractual terms on termination, and any payments made, are fair to the individual and the Company, that failure is not rewarded and that the duty to mitigate loss is fully recognised.
Details of the activities of the Remuneration Committee are set out in the remuneration report on pages 46 to 53.
The number of Remuneration Committee meetings and their attendance by the Directors are set out in the table on page 41. In addition, and in accordance with the terms of reference, the members of the Remuneration Committee were also consulted on a range of issues during the year, including specific matters related to recruitment.
Nominations Committee The Nominations Committee comprises three Non-executive Directors, Michael Benson as Chairman, Nick Land and Jonathan Asquith. All Directors served on the Nominations Committee throughout the year.
The terms of reference for the Committee take into account the requirements of the 2010 Code and are available for inspection at the registered office and at the Annual General Meeting and can also be found on the Company website at www.ashmoregroup.com.
The terms of reference for the Nominations Committee include:
– reviewing the structure, size and composition (including the skills, knowledge and experience) of the Board and its committees;
– reviewing annually the time required from each Non-executive Director, using performance evaluation to assess whether the Non-executive Director is giving sufficient commitment to the role;
– giving full consideration to succession planning in the course of its work, taking into account the challenges and opportunities facing the Company and what skills and expertise are needed on the Board in the future; and
– ensuring that on appointment to the Board, Non-executive Directors receive a formal letter of appointment setting out clearly what is expected of them in terms of time commitment, committee service and involvement outside Board meetings.
During the year the activities of the Nominations Committee have included reviewing the requirements for potential independent non-executive candidates for appointment to the Board, proposals for re-election of Directors at the Annual General Meeting, and reviewing its terms of reference. The number of Nominations Committee meetings and their attendance by the Directors are set out in the table on page 41.
42 Ashmore Group plc | Annual Report and Accounts 2012

Relations with shareholders The Company places great importance on communication with its investors and aims to keep shareholders informed by means of regular communication with institutional shareholders, analysts and the financial press throughout the year.
Annual and interim reports and trading updates are widely distributed to other parties who may have an interest in the Group’s performance. These documents are also made available on the Company’s website where formal regulatory information service announcements are also posted. The Chief Executive Officer and Group Finance Director make regular reports to the Board on investor relations and on specific discussions with major shareholders and the Board receives copies of all research published on the Company.
The 2012 Annual General Meeting will be attended by all Directors, and the Chairmen of the Audit and Risk, Nominations and Remuneration Committees will be available to answer questions. Private investors are encouraged to attend the Annual General Meeting.
The Senior Independent Director is available to shareholders if they have concerns which contact through the normal channels of Chairman, Chief Executive Officer or Group Finance Director has failed to resolve or for which such contact is inappropriate. The Company continues to offer major shareholders the opportunity to meet any or all of the Chairman, the Senior Independent Director and any new Directors.
The Group will announce via a regulatory information service the number of proxy votes cast on resolutions at the Annual General Meeting and any other general meetings.
Internal control and risk management In accordance with the principles of the UK Corporate Governance Code 2010, the Board is ultimately responsible for the Group’s risk management and internal control systems and for reviewing their effectiveness. Such systems and their review are designed to manage rather than eliminate the risk of failure to achieve business objectives, and can only provide reasonable and not absolute assurance against material misstatement or loss.
Within the Group’s over-arching corporate governance framework, through which the Board aims to maintain full and effective control over appropriate strategic, financial, operational and compliance issues, an internal control framework has been established, against which the Company is able to assess the effectiveness of its risk management and internal control systems. The Group’s system of internal control is embedded within its routine operations, and a strong control culture is combined with clear management responsibility and accountabilities for individual control. The internal control framework provides an ongoing process for identifying, evaluating and managing the Group’s significant risks, and has been in place for the year under review and up to the date of approval of the annual report and accounts. The process is regularly reviewed by the Board, and accords with the guidance in the document “Internal Control: Revised Guidance for Directors on the Combined Code, October 2005” (“Turnbull Guidance”) published by the Financial Reporting Council.
The Executive Directors oversee the key risks and controls and the risk management process on a day to day basis, and have put in place an organisational structure with clearly defined lines of responsibility and delegation of authority.
The Group’s Risk and Compliance Committee (“RCC”), which meets monthly, is responsible for maintaining a sound risk management and internal control environment and for assessing the impact of the Group’s ongoing activities on its regulatory and operational exposures. The RCC is chaired by the Head of Risk Management and Control – the other members are the Chief Executive, the Group Finance Director, the Head of IT, Operations and Performance Management, the Group Head of Compliance, the Head of Information Technology, the Head of Legal and Transaction Management and the Head of Finance. Responsibility for risk identification is shared amongst these senior management personnel, with each such individual being responsible for day-to-day control of risk in their business area.
There are established policies and procedures to enable the Board, through its regular meetings, to monitor the effectiveness of the risk management and internal control systems, which cover all significant identified internal and external strategic, operational, financial, compliance and other risks, including the Group’s ability to comply with all applicable laws, regulations and clients’ requirements. The Board has continued to receive regular financial and other management information related to the control of expenditure against budget and the making of investments, and for monitoring the Group’s business and its performance, and regular compliance and risk reports.
Through the Audit and Risk Committee, the Board has conducted an annual review and assessment of the effectiveness of the risk management and internal control systems, and has identified no significant failings or weaknesses during this review. In conducting this review, the Board has considered the periodic reports received throughout the year on compliance and risk matters, including reports provided by the internal audit function, and the annual report on risk management and internal control processes from the RCC. The Board is satisfied that appropriate planned actions continue to be effective in improving controls as the Group develops, and its overall assessment of the control framework continues to be satisfactory.
The main features of the Group’s risk management and internal control systems are as follows:
Policies – core values and policies together comprising the Group’s high level
principles and controls, with which all staff are expected to comply;
– manuals of policies and procedures, applicable to all business units, with procedures for reporting weaknesses and for monitoring corrective action;
– a code of business conduct, with procedures for reporting compliance therewith; and
– a defined operational framework and organisational structure with appropriate delegation of authority with accountability that has regard to acceptable levels of risk.
Processes – a planning framework is maintained, which incorporates a Board
approved strategic plan, with objectives for each business unit;
– regular business reviews of the Company and its subsidiaries are performed by senior management, which consider the ongoing effects of change and the short, medium and long-term operational requirements;
– quarterly senior management systems and controls reviews are undertaken by the Group Finance Director with the Group Head of Compliance, and Group Head of Risk Management and Control in which the Chief Executive Officer participates at least annually. These reviews include evaluation of the potential impact and likelihood of identified risks and possible new risk areas;
Ashmore Group plc | Annual Report and Accounts 2012 43
Corporate Governance Report continued
– a matrix of top risks identifies key business, operational, financial and compliance risks, and considers the likelihood of those risks crystallising and the resultant impact. The inherent risk within each business activity has been identified, with the adequacy and mitigating effect of existing processes being assessed to determine a current residual risk level for each such activity. On the basis that further mitigants may be employed over time, a target residual risk for each activity after one to two years has been defined;
– key risk indicator (“KRI”) statistics are reported to and analysed by the RCC. The KRIs indicate trends in the Group’s risk profile, assist in the reduction of errors and potential financial losses and seek to prevent exposure by proactively dealing with a potential risk situation before an event actually occurs;
– there are well-defined procedures governing the appraisal and approval of corporate investments, including seeding of funds and purchase of own shares, with detailed investment and divestment approval procedures, incorporating appropriate levels of authority and regular post-investment reviews;
– the Group has secure information and communication systems capable of capturing relevant and up to date information by relevant personnel, with oversight and direction provided by the Group’s IT Steering Group, which implements the IT strategy, establishing and overseeing the operation of all IT projects;
– strong financial controls are maintained to ensure accurate accounting for transactions, appropriate authorisation limits to contain exposures, and reliability of data processing and integrity of information generated;
– an in-depth annual budget is reviewed and approved by the Board and is regularly subject to update through a formal re-forecasting process;
– oversight and management of the Group’s foreign currency cash flows and balance sheet exposures are the responsibility of the FX Management Committee which determines the appropriate level of hedging required and appropriate accounting treatment;
– Board members receive monthly management accounts and other relevant reports, which highlight actual financial performance against budget/forecast and prior year period;
– detailed investment reports are prepared and discussed at each of the sub-committee meetings of the Group’s investment committee, which take place weekly or monthly depending on investment theme, with follow up actions agreed and implemented within a strict operational framework;
– oversight of the valuation methodologies used for clients’ fund investments that cannot be readily externally priced is the responsibility of the Group’s Pricing Methodology and Valuation Committee (“PMVC”) which meets monthly to review the current valuation methodology for each of these investments and to propose an updated valuation methodology where appropriate;
– the Group Compliance function, whose responsibility is to ensure that the Group at all times meets its regulatory obligations, and to integrate regulatory compliance procedures and best practices within the Group, undertakes an ongoing compliance monitoring programme covering all the relevant areas of the Group’s operations, to seek to identify any breach of compliance with applicable financial services regulation, which includes real-time investment restrictions monitoring of client mandate requirements. Results of the compliance monitoring programme are reported to the RCC in support of the overall risk management framework; and
– the development of new products is an important part of the Group’s business in responding to clients’ needs and changes in the financial markets and is the responsibility of the New Products Committee which approves new product launches.
Verification – The external auditors are engaged to express an opinion on
the annual financial statements, the half year review and also independently and objectively review the approach of management to reporting operating results and financial condition;
– the Board, through the Audit and Risk Committee, receives half-yearly updates from the Group’s external auditors which include any control matters that have come to their attention;
– annual control reports are reviewed independently by the Group’s external auditors pursuant to the International Standards on Assurance Engagements 3402 (“ISAE 3402”);
– the internal audit function undertakes a programme of reviews of systems, processes and procedures as determined by the Board, reporting the results together with their advice and recommendations, and assisting in the presentation of their findings to the Audit and Risk Committee. The internal audit function is currently provided under an outsourcing arrangement by Ernst & Young – this arrangement will be subject to periodic review.
By order of the Board
Michael Perman Company Secretary
10 September 2012
44 Ashmore Group plc | Annual Report and Accounts 2012
Report of the Audit and Risk Committee
The composition and summary terms of reference of the Audit and Risk Committee are set out on pages 41 and 42.
The principal activities of the Audit and Risk Committee through the year were as follows:
Financial statements The Audit and Risk Committee reviewed the 2012 Annual Report, Interim Results, Preliminary Results and reports from the external auditors, KPMG Audit Plc, on the outcome of their reviews and audits in 2012.
External auditors The external auditors attend all meetings of the Committee. During the year the Committee reviewed the scope and findings of the external auditors’ work in connection with the interim review and the annual audit.
The Committee also received a comprehensive presentation from the auditors demonstrating to its satisfaction how their independence and objectivity is maintained when providing non-audit services.
The Committee has agreed the types of permitted and non-permitted non-audit services and those which require explicit prior approval. All contracts for non-audit services in excess of £25,000 must be notified to the Chairman of the Audit and Risk Committee and approved by him.
During the year the value of non-audit services provided by KPMG amounted to £0.5 million (2011: £0.4 million). Whilst non-audit services as a proportion of audit services amount to approximately 125 per cent, the overall quantum of non-audit services is not considered to be material given that Ashmore operates within a highly regulated market and that a significant proportion of the non-audit services provided relate to the following matters:
– reporting on our half year financial statements;
– providing assurance reports to the FSA (as the regulator of Ashmore Investment Management Limited);
– the provision of tax compliance services;
– acting as reporting accountant in appropriate circumstances provided there is no element of valuation work involved; and
– reporting on internal controls as required under ISAE 3402 (formerly SAS 70) pursuant to investment management industry standards.
The Committee considers the assurance provided by the Group auditors on these items to be strictly necessary in the interests of the business and that, by their nature, these services could not easily be provided by another professional auditing firm.
The provision of tax advisory services, due diligence/transaction services and litigation services may be permitted with the Committee’s prior approval. The provision of internal audit services, valuation work and any other activity that may give rise to any possibility of self-review are not permitted under any circumstance. During the year there were no circumstances where KPMG Audit plc was engaged to provide services which might have led to a conflict of interests.
The Committee is satisfied that the external auditors remain independent and has recommended to the Board that a resolution be put to shareholders for the re-appointment of the auditors, and their remuneration and terms of engagement, at the Annual General Meeting of the Company.
From time to time during the year the Non-executives met with the external and internal auditors without the Executive Directors being present so as to provide a forum to raise any matters of concern in confidence. The Committee also received a report from the independent KPMG team responsible for the audits of the Ashmore publicly traded funds.
Internal controls and risk management In September 2011 the terms of reference of the Committee were updated to better reflect its role and responsibilities for Risk related matters. At the same time its name was changed to the Audit and Risk Committee. The Head of Risk attends all meetings of the Committee and provides regular reports and updates on various topics including operational risk, market risk, the valuation methodology for hard to price assets, and counterparty risk.
The Committee received a report on, and conducted a review and evaluation of, the system of internal controls and risk management operated within the Company pursuant to the Turnbull Guidance prior to full review by the Board.
Internal audit Ernst & Young have acted as internal auditors since 1 July 2009 reporting directly to the Committee. The Committee has received reports on its findings and programme of reviews at each of its meetings during the course of the year.
Audit and Risk Committee effectiveness During the year an independently facilitated review of the effectiveness of the Board, its Committees and the Directors was conducted in accordance with provision B.6.2 of the 2010 Code. The review concluded that the Committee and its members were working effectively.
Nick Land Chairman of the Audit and Risk Committee
10 September 2012
Ashmore Group plc | Annual Report and Accounts 2012 45

Remuneration Report
Unaudited information Introduction This report has been prepared on behalf of the Board in accordance with Schedule 8 to the Large and Medium Sized Companies and Groups (Accounts and Reports) Regulations 2008 and the UK Corporate Governance Code. This report sets out the Company’s remuneration policy and gives details of the compensation of Directors for the year ended 30 June 2012.
Remuneration Committee The Remuneration Committee comprises three Non-executive Directors. Throughout the year Jonathan Asquith served as Chairman with Michael Benson and Nick Land as members. Jonathan Asquith has indicated his wish not to stand for re-election at the Annual General Meeting on 31 October 2012 and Nick Land has assumed the role of the Chairman of the Remuneration Committee at the date of this report. The Remuneration Committee meets as often as required to discharge its duties and met four times during the period from 1 July 2011 to 30 June 2012. Details of attendance at all meetings for the financial year under review are contained in the table on page 41 of the Corporate Governance Report. The Chief Executive Officer, Group Finance Director, Company Secretary and the Head of Human Resources attended all or part of the meetings at the invitation of the Remuneration Committee but took no part in the determination of their own remuneration.
The primary role of the Remuneration Committee is to make recommendations to the Board as to the Company’s framework or broad policy for the remuneration of the Chairman, the Executive Directors of the Board, the Company Secretary and employees identified as Code and Control staff for the Financial Services Authority (“FSA”) remuneration code (“Code”). The Code defines Code staff as staff who have a material impact on the firm’s risk profile, including a person who performs a significant influence function for a firm, senior managers (as defined) and risk takers. Control staff are those employed in Control functions such as Compliance, Risk and Internal Audit. The Remuneration Committee decides on total individual remuneration for Code staff and agrees the total individual remuneration for Control staff. In addition the Remuneration Committee is responsible for ensuring that the Company’s remuneration policy for all staff is compliant with the Code.
Remuneration policy The key objectives of the Company’s remuneration policy are to ensure that:
– levels of remuneration are relative to the Company’s market and sufficient to attract and retain Executive Directors and employees of the quality required to run the Company successfully;
– the Executive Directors and employees receive sufficient incentives to motivate enhanced performance;
– Executive Directors and employees are fairly rewarded for their individual contributions to the Company’s overall performance; and
– effective risk management is promoted and encouraged by Executive Directors and employees.
In determining this policy, the Remuneration Committee takes into account a broad range of factors including the interests of the shareholders, the financial and commercial health of the Company and guidance provided by the FSA or other relevant bodies.
In addition, the Heads of Risk and Compliance actively contribute to the annual reviews of all employees, and their feedback is taken into consideration when determining employee remuneration.
The terms of reference of the Remuneration Committee are available on the Company website at www.ashmoregroup.com.
Advisors The Remuneration Committee was advised, when considered appropriate, by Hewitt New Bridge Street (a trading name of Aon Hewitt Limited) throughout the period 1 July 2011 to 30 June 2012. The Company participates in the McLagan Partners compensation survey from which relevant data is provided to the Remuneration Committee.
Neither of the above has any connection with the Company other than providing compensation advice and/or information.
Service agreements Each Executive Director has entered into a service agreement with the Company. The service agreements do not have a fixed term but include provisions for termination on 12 months’ notice by either party. Service agreements contain no contractual entitlement to receive bonus payments or to participate in the Company’s share plans. Participation in these arrangements is discretionary and subject to approval by the Remuneration Committee.
Non-executive Directors are appointed for an initial three year period. Their continued engagement is subject to the requirements of the Company’s Articles relating to the retirement of Directors by rotation.
The Company has maintained directors’ and officers’ liability insurance cover throughout the period.
The table below provides details of the Directors’ service agreements/ letters of appointment for current Directors and Directors who served during the year.
46 Ashmore Group plc | Annual Report and Accounts 2012

Directors’ service contracts Date appointed Director Contract date Notice period Expiry/review date
Executive Directors
Mark Coombs 3 December 1998 21 September 2006 1 year Rolling
Graeme Dell 19 December 2007 3 December 2007 1 year Rolling
Non-executive Directors
Michael Benson – Chairman 3 July 2006 3 July 2009 1 month 3 July 2015
Nick Land 3 July 2006 3 July 2009 1 month 3 July 2015
Jonathan Asquith 1 September 2008 1 September 2011 1 month 1 September 2014
Melda Donnelly 1 July 2009 1 July 2009 1 month 1 July 2015
Simon Fraser 10 February 2012 10 February 2012 1 month 10 February 2015
Executive Directors are permitted to serve as Non-executive Directors of other companies where there is no competition to the Company’s business activities and where these duties do not interfere with the individual’s ability to perform his duties for the Company. In the reporting year neither Mark Coombs nor Graeme Dell held any Non-executive Directorships.
Michael Benson, Nick Land and Melda Donnelly were invited, and agreed, to serve a further three years after their three year periods of appointment expired on 3 July 2012, 3 July 2012 and 1 July 2012 respectively. There are no provisions for compensation of Executive Directors on early termination save as described below:
(a) the contracts for Mr Coombs and Mr Dell contain provisions entitling the Company to terminate employment without notice subject to making 12 monthly payments thereafter equivalent to monthly basic pay and benefits; and
(b) all Directors’ contracts entitle the Company to give pay in lieu of notice.
Executive remuneration components The Company rewards exceptional performance and so emphasises the variable components of the remuneration package.
The pay model adopted for the Executive Directors is similar to that of employees more generally within the Group, and the Remuneration Committee considers the levels and principles applying to the remuneration of other employees of the Group when determining Directors’ remuneration.
All employees are subject to capped salaries and participate in a Group-wide bonus pool. Since performance-related pay is based on the principle of profit sharing, all employees share in the success of the business with remuneration rising and falling as a result of Group profit performance. The extent that each individual shares in the actual profit of the Group varies by individual performance and the role undertaken within the business. Part of individuals’ bonuses are deferred for a period of five years for the majority of employees through participation in the Company’s long-term incentive plans.
Fixed compensation Fixed compensation components comprise basic salary and benefits in kind. Basic salaries are capped, as it is the Company’s policy to maintain its fixed cost base at a low level.
Periodic reviews are undertaken in terms of an appropriate level at which to cap maximum annual salary. Both the Chief Executive Officer and Group Finance Director earn a basic salary of £100,000. There have been no increases to their base salary levels during the year under review.
Variable compensation The Company’s discretionary variable compensation provides for both an annual cash bonus, which is non-pensionable, and deferred share awards. The total variable compensation is determined by reference to the individual’s performance against agreed criteria, the profitability of the Company and the external market. Performance criteria are established appropriate to the individual’s role, to include such measures as growth in assets under management (“AuM”), profitability where appropriate, an assessment of the individual’s adherence to the Company’s risk and compliance principles and culture and other key areas of individual performance.
The Company’s intention is to pay to members of staff an amount in total of up to 25% of earnings before variable compensation, interest and tax (“EBVCIT”) in respect of its total variable compensation comprising cash bonus, including social security obligations thereon, and share-based payments, including fair value and social security costs in this respect. For the financial year ended 30 June 2012 the provision for variable compensation is at 18% of EBVCIT. In view of the stringent salary controls which the Group operates the Remuneration Committee does not consider it necessary or appropriate to set a cap on individual discretionary bonus awards, although such awards will be made within the overall provision for variable compensation as set out above.
40% of any discretionary variable compensation earned by Executive Directors is received in the form of a restricted share or restricted phantom share award (at the prevailing share price without enhancement) which is deferred and vests after a period of five years subject to achieving a relative total shareholder return (“TSR”) performance target. In addition, the opportunity exists to commute up to 50% of the annual cash bonus that would otherwise be earned into the Company’s shares or phantom shares (also at the prevailing share price without enhancement) or to take the entire remaining bonus as cash. If a proportion of bonus is voluntarily commuted, the deferral period is also five years with commuted shares then subject to a matching award that is currently of equal value to the bonus deferred. Matching awards are subject to the same relative TSR performance condition. Full details of share awards and the TSR performance target are set out on page 50.
The Remuneration Committee has considered the final rules on remuneration in financial companies issued by the FSA as applied to the Company as a ‘tier 4’ firm, and in particular its emphasis on the need to ensure that remuneration plans do not incentivise excessive risk taking and short-termism. The Committee believe that the nature of the variable remuneration plans in place have been structured appropriately in light of the Company’s business model and risk profile, the proportion of variable remuneration of Executive Directors and senior staff across the business which is deferred (a minimum of 40% of any bonus earned), the length of the deferral period (five years being ahead of the period required by the FSA for firms in tiers 1-3 and other relevant guidance) and the performance conditions attached to the deferred awards (i.e. the part of the bonus that is converted into a restricted share award and any matching share award
Ashmore Group plc | Annual Report and Accounts 2012 47
Remuneration Report continued
are subject to a TSR performance condition that acts as a form of ‘clawback’ in that the shares will not ultimately vest in full unless the Company’s TSR is at upper quartile measured against other global investment management firms over the five-year deferral period).
In addition, the Remuneration Committee has the authority to clawback part or all of the deferred remuneration of Executive Directors during its five-year restricted period, in the exceptional event that either the remuneration was awarded on the basis of materially misstated results, or an Executive Director commits gross misconduct. The authority to apply clawback applies to remuneration awarded in respect of the 2011-2012 performance year and has been effective from the 2010-2011 performance period.
Where an Executive Director has waived deferred variable compensation in return for the Remuneration Committee considering a contribution to charity, and the Remuneration Committee has approved such a contribution, the Remuneration Committee will not apply clawback to the amount waived to charity, but has the discretion to reduce present or future year variable compensation by equivalent amounts.
Until the year ended 30 June 2009, for reasons related to Rule 9 of the Takeover Code, Mark Coombs chose to waive any shares offered to him as part of his variable remuneration as the issuance of further shares to him would have increased his existing shareholdings to the extent that it would trigger a mandatory bid for all shares. During prior years he therefore asked the Remuneration Committee to consider an appropriate equivalent donation to be made to a charity or charities nominated by him and the Remuneration Committee has agreed to this. Any equivalent donation made to a charity is paid to the charity annually in instalments of one fifth of the value of the award over a period equivalent to the five-year vesting period, which would have otherwise applied to a share award. Ongoing payments to the charity are dependent on Mark Coombs’ continued employment.
Mark Coombs’ performance measures include stretch targets for EBIT and AuM growth as well as the progression of strategic opportunities and operational development. Targets for EBIT, AuM growth and investment performance were not met in certain cases during the period. Measures relating to the progression of strategic opportunities and operational development met the committee’s expectations in most areas in the year ended 30 June 2012. Similar measurements will be applied in the financial year ending 30 June 2013.
Graeme Dell’s performance measurements are a basket of operational, strategic and compliance related targets pertaining to his areas of responsibility, including finance, technology, compliance, operations, Ashmore’s overseas operations and investor relations. While the committee was satisfied with performance in a number of these areas, certain key corporate and management targets were not fully met in the year ended 30 June 2012. Similar performance measures will be applied to the financial year ending 30 June 2013.
The balance between the fixed and variable elements of total compensation for each of the Executive Directors for the year ended 30 June 2012 is shown in the table below prior to any waivers made to charity and prior to any elections made to commute cash bonus into bonus shares or bonus phantom shares.
Total compensation Fixed Variable – cash
Variable – deferred Total
Mark Coombs 3% 58% 39% 100%
Graeme Dell 17% 50% 33% 100%
Mark Coombs has requested to waive 10% of any total bonus that would otherwise be awarded to him. He asked the Remuneration Committee to consider an appropriate equivalent donation to be made to a charity or charities nominated by him and the Remuneration Committee has agreed to this. 50% of the amount waived will be donated to the Ashmore Foundation, more details of which can be found in the corporate social responsibility section of this report on pages 35 to 37, and 50% to a charity or charities of his choice.
Long-term share award plans As a business which is completely reliant upon the intellectual capital of its people, the Board considers it essential to have in place share incentive arrangements which provide a significant element of “at risk” compensation and which are designed to attract, motivate and retain highly qualified executives, investment management professionals, and other key employees who are critical to our long-term success and to align their interests with those of our clients and shareholders.
The overall limits operated under the live plans described below, which were established prior to the listing of the Company, are designed to fulfil these objectives. The number of shares which may be issued in aggregate under any employee share plan of the Company over any 10-year period following Admission is limited to 15% of the Company’s issued share capital at that time. The Company’s obligations under the share plans can be met by newly issued shares in the Company or shares purchased in the market by the trustees of an employee benefit trust (“EBT”). During the period all of the awards that vested were met by shares from the EBT. As detailed in note 21 of the accounts, the EBT continues to make market purchases of shares to satisfy current and future awards.
At 30 June 2012 the Company had issued 3.65% of the Company’s issued share capital under employee share plans to its staff.
The Company operates three share award plans. All employees, including Executive Directors, are eligible to receive awards under the share award plans.
48 Ashmore Group plc | Annual Report and Accounts 2012
The Company Executive Omnibus Incentive Plan (“Omnibus Plan”) This plan was adopted on 11 October 2006.
As described in the variable compensation section above, employees routinely receive a proportion of their remuneration in the form of restricted shares, which vest after five years but qualify for dividends from the date of award. Employees who receive an award of restricted shares under the Omnibus Plan may also be given the opportunity to commute cash bonus that would otherwise be awarded into bonus shares. Should employees take up this option, the Company may match the award with matching shares. Bonus and matching awards are eligible for dividends or equivalent from the date of award. All share awards for employees who remain employed by the Company cliff vest at five years.
In the case of Executive Directors restricted and matching share awards will be subject to Total Shareholder Return (“TSR”) performance conditions. Bonus shares will not be subject to a TSR performance condition as the Executive Directors will have waived cash bonus in order to receive them.
Awards under the Omnibus Plan are subject to good and bad leaver provisions. Should an award holder leave employment for reasons that would categorise them as a bad leaver, all restricted and matching share awards will be forfeited. Should an award holder leave employment for reasons that would categorise them as a good leaver, then restricted and matching share awards would generally vest on a pro-rated basis. Bonus shares will vest and be transferred to the award holder free of restrictions upon termination of employment for any reason other than dismissal for cause or personal bankruptcy.
The Omnibus Plan also allows the issue of option and share awards of different types. No options have been issued under this plan during the year and this is not current policy for Executive Directors.
The Omnibus Plan includes individual limits in respect of option and share awards made to Executive Directors in any annual period, whereby an award will be limited and take effect so that (a) no
participant who is an Executive Director of the Company is granted market value options, discounted options or premium cost options in any annual period over more than 2,000,000 ordinary shares of 0.01 pence each, and (b) no participant who is an Executive Director of the Company is granted restricted share or restricted phantom share awards (or equivalent conditional rights to shares) in any annual period over more than 1,000,000 ordinary shares of 0.01 pence each (such annual limits do not include bonus shares or matching shares). If there are exceptional circumstances that the Remuneration Committee considers justify making awards in excess of these limits, the Remuneration Committee may, in respect of the relevant participant, apply double the limits above. Bonus shares represent mandatorily or voluntarily waived annual bonus entitlement and the Omnibus Plan also contains a limit on the ratio of matching shares to bonus shares of three to one. The match applied to all awards made to date has been one to one and this ratio will be used for awards relating to the year ended 30 June 2012.
The Ashmore First Discretionary Share Option Scheme (“Option Scheme”) This scheme was established on 23 October 2000. Subsequent to the Company’s Admission in October 2006, it is not intended to issue any further options under this scheme.
The Company Approved Share Option Plan (“CSOP”) This plan was adopted on 11 October 2006 and approved by HMRC on 1 June 2007. The CSOP provides for the granting of options up to a market value limit of £30,000 to each individual on the date of grant. No awards have been made under this plan to date.
During the financial year share awards were granted to Graeme Dell from the Omnibus Plan on 21 September 2011 as set forth in the table below and as reported in the remuneration report for the year ended 30 June 2011.
Ashmore Executive Omnibus Incentive Plan
Number of restricted shares*
Number of bonus shares
Number of matching shares* Price of award Date of award Release date
Graeme Dell 121,853 91,390 91,390 393.92 pence 22 September 2011 21 September 2016
* Awards subject to TSR performance measures. Bonus shares relate to a proportion of cash bonus voluntarily commuted into Ashmore shares by the recipient.
During the financial year phantom share awards were granted to Mark Coombs from the Omnibus Plan on 21 September 2011 as set forth in the table below and as reported in the remuneration report for the year ended 30 June 2011.
Ashmore Executive Omnibus Incentive Plan
Number of
phantom restricted shares*
Number of phantom bonus
shares
Number of phantom matching
shares* Price of award Date of award Release date
Mark Coombs 812,348 609,621 609,621 393.92 pence 21 September 2011 19 September 2016
* Awards subject to TSR performance measures. Bonus shares relate to a proportion of cash bonus voluntarily commuted into Ashmore shares by the recipient.
In relation to these awards, Mark Coombs requested to waive 20% of any total bonus awarded to him. He asked the Remuneration Committee to consider an appropriate equivalent donation to be made to a charity or charities nominated by him and this was agreed by the Remuneration Committee. The figures shown are gross of this waiver.
Ashmore Group plc | Annual Report and Accounts 2012 49

Remuneration Report continued
Total Shareholder Return (“TSR”) performance measure Relative TSR is used as the performance measure for long-term incentive awards at Ashmore.
The Remuneration Committee has established a comparator group against which to measure TSR performance in respect of share awards to Executive Directors under CSOP and the Omnibus Plan (for awards of restricted shares, matching shares, restricted phantom shares and matching phantom shares). Share awards will not vest at below median performance. 25 per cent of share awards will vest for median performance rising to full vesting at upper quartile performance, with straight-line proportionate vesting between these two points. The performance period for awards under the Omnibus Plan is five years.
TSR is considered appropriate as a well established and recognised performance measure which aligns the interests of the Executive Directors with those of the shareholders choosing to invest in other similar global investment management firms. In the absence of any other dedicated emerging markets investment management companies, a comparator group of 19 companies has been selected
from global investment management companies of a similar size that are established and actively trading on stock markets.
The Remuneration Committee decided to increase the number of companies used for TSR comparison purposes on 10 September 2009 from the original 16 comparator companies. This was prompted by the suspension from trading or acquisition of three of the original comparator group companies. The Remuneration Committee felt that in order to ensure that a sustainable peer group was selected, the group should be increased for awards made in relation to the year ended 30 June 2009 forward. Since the increase of the comparator group to 19 companies, one has delisted thus reducing the comparator group to 18. There have been no other changes to the comparator group this year.
In measuring the extent to which the Company’s TSR performance has met the relevant targets, the Remuneration Committee instructs its independent remuneration consultants to prepare a report for it to use as the basis for approving vesting of performance related share awards.
TSR performance graph The graph below shows the growth in the Company’s share price since Admission against the FTSE 250 (both on a TSR basis). The graph also shows the FTSE 100 index as the index in which the Company is currently listed.
The chart shows the value by 30 June 2012 of £100 invested in Ashmore Group on 11 October 2006 (the date of listing) compared to the value of £100 invested in either the FTSE 250 index, the FTSE 100 index and a bespoke index composed of the 2012 Peer Group for the Ashmore Executive Omnibus Incentive Plan. The other points are the values at intervening financial year ends. Each point at a financial year end is calculated using an average total shareholder return value over June (i.e. 1 June to 30 June inclusive).
Source: Thomson Reuters
The chart shows the value by 30 June 2012 of £100 invested in Ashmore Group on 30 June 2007 compared to the value of £100 invested in the FTSE 250 index, the FTSE 100 index and a bespoke index composed of the Peer Group for the 2012 awards under the Ashmore Executive Omnibus Incentive Plan. The other points are the values at intervening financial year ends. Each point at a financial year end is calculated using an average total shareholder return value over June (i.e. 1 June to 30 June inclusive).
0
20
40
60
80
100
120
140
160
30 Jun 2007
Ashmore Group
Valu
e of
£10
0 in
vest
ed o
n 30
Jun
e 20
07
30 Jun 2008 30 Jun 2009 30 Jun 2010 30 Jun 2011 30 Jun 2012
FTSE 250 FTSE 100 Peer Group (2009 awards onwards)
£m
Total Return Performance Chart to 30 June 2012
50 Ashmore Group plc | Annual Report and Accounts 2012
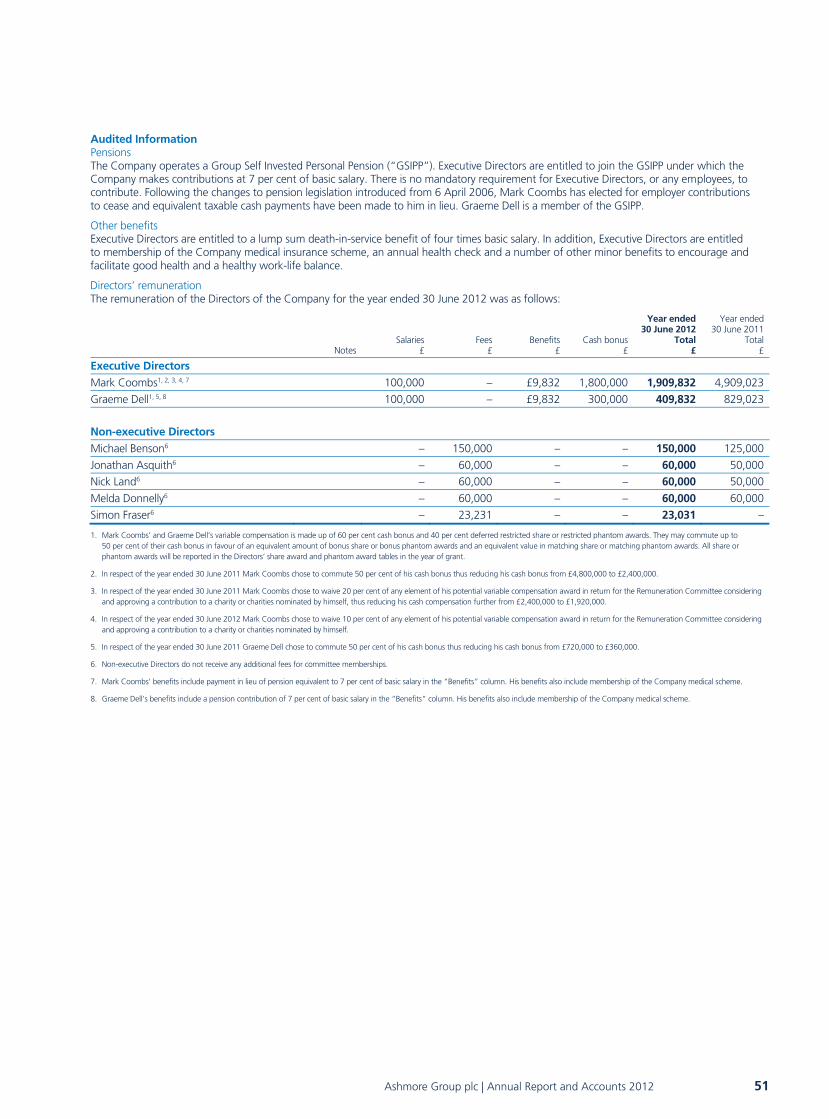
Audited Information Pensions The Company operates a Group Self Invested Personal Pension (“GSIPP”). Executive Directors are entitled to join the GSIPP under which the Company makes contributions at 7 per cent of basic salary. There is no mandatory requirement for Executive Directors, or any employees, to contribute. Following the changes to pension legislation introduced from 6 April 2006, Mark Coombs has elected for employer contributions to cease and equivalent taxable cash payments have been made to him in lieu. Graeme Dell is a member of the GSIPP.
Other benefits Executive Directors are entitled to a lump sum death-in-service benefit of four times basic salary. In addition, Executive Directors are entitled to membership of the Company medical insurance scheme, an annual health check and a number of other minor benefits to encourage and facilitate good health and a healthy work-life balance.
Directors’ remuneration The remuneration of the Directors of the Company for the year ended 30 June 2012 was as follows:
Notes
Salaries£
Fees£
Benefits£
Cash bonus £
Year ended 30 June 2012
Total£
Year ended 30 June 2011
Total£
Executive Directors
Mark Coombs1, 2, 3, 4, 7 100,000 – £9,832 1,800,000 1,909,832 4,909,023
Graeme Dell1, 5, 8 100,000 – £9,832 300,000 409,832 829,023
Non-executive Directors
Michael Benson6 – 150,000 – – 150,000 125,000
Jonathan Asquith6 – 60,000 – – 60,000 50,000
Nick Land6 – 60,000 – – 60,000 50,000
Melda Donnelly6 – 60,000 – – 60,000 60,000
Simon Fraser6 – 23,231 – – 23,031 –
1. Mark Coombs’ and Graeme Dell’s variable compensation is made up of 60 per cent cash bonus and 40 per cent deferred restricted share or restricted phantom awards. They may commute up to 50 per cent of their cash bonus in favour of an equivalent amount of bonus share or bonus phantom awards and an equivalent value in matching share or matching phantom awards. All share or phantom awards will be reported in the Directors’ share award and phantom award tables in the year of grant.
2. In respect of the year ended 30 June 2011 Mark Coombs chose to commute 50 per cent of his cash bonus thus reducing his cash bonus from £4,800,000 to £2,400,000.
3. In respect of the year ended 30 June 2011 Mark Coombs chose to waive 20 per cent of any element of his potential variable compensation award in return for the Remuneration Committee considering and approving a contribution to a charity or charities nominated by himself, thus reducing his cash compensation further from £2,400,000 to £1,920,000.
4. In respect of the year ended 30 June 2012 Mark Coombs chose to waive 10 per cent of any element of his potential variable compensation award in return for the Remuneration Committee considering and approving a contribution to a charity or charities nominated by himself.
5. In respect of the year ended 30 June 2011 Graeme Dell chose to commute 50 per cent of his cash bonus thus reducing his cash bonus from £720,000 to £360,000.
6. Non-executive Directors do not receive any additional fees for committee memberships.
7. Mark Coombs’ benefits include payment in lieu of pension equivalent to 7 per cent of basic salary in the “Benefits” column. His benefits also include membership of the Company medical scheme.
8. Graeme Dell’s benefits include a pension contribution of 7 per cent of basic salary in the “Benefits” column. His benefits also include membership of the Company medical scheme.
Ashmore Group plc | Annual Report and Accounts 2012 51
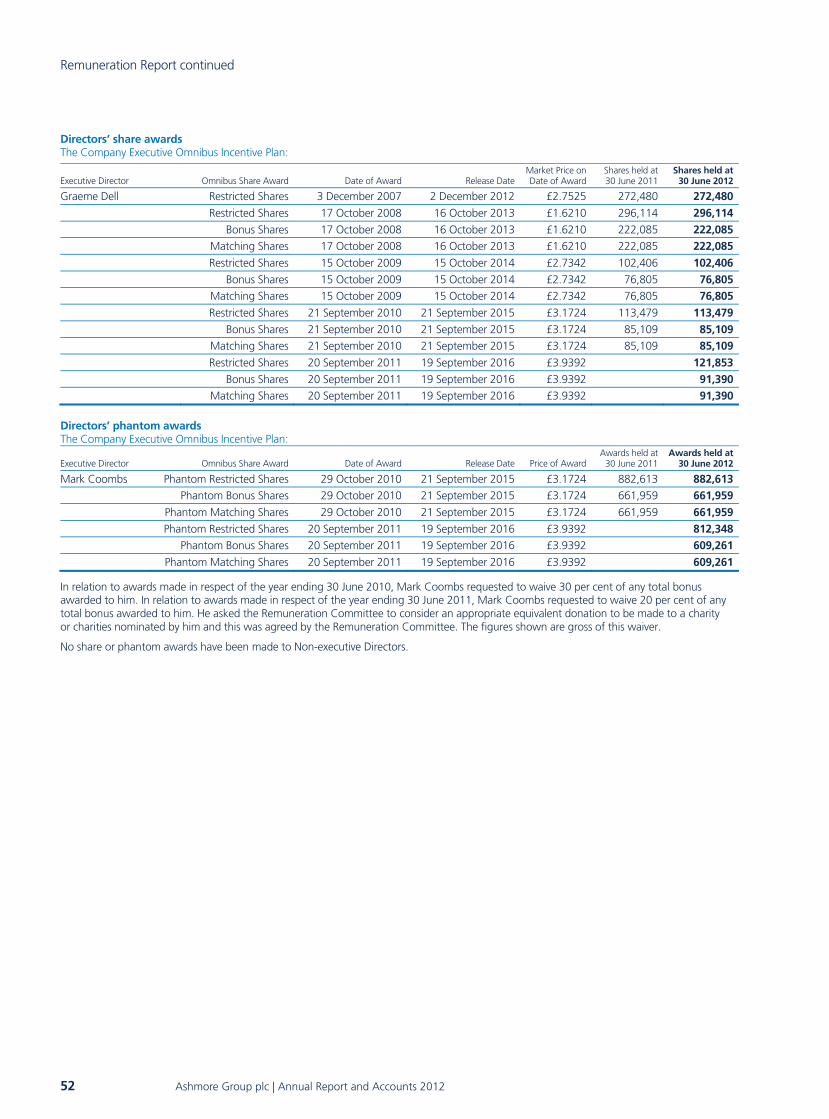
Remuneration Report continued
Directors’ share awards The Company Executive Omnibus Incentive Plan:
Executive Director Omnibus Share Award Date of Award Release Date Market Price on Date of Award
Shares held at 30 June 2011
Shares held at30 June 2012
Graeme Dell Restricted Shares 3 December 2007 2 December 2012 £2.7525 272,480 272,480 Restricted Shares 17 October 2008 16 October 2013 £1.6210 296,114 296,114 Bonus Shares 17 October 2008 16 October 2013 £1.6210 222,085 222,085 Matching Shares 17 October 2008 16 October 2013 £1.6210 222,085 222,085 Restricted Shares 15 October 2009 15 October 2014 £2.7342 102,406 102,406 Bonus Shares 15 October 2009 15 October 2014 £2.7342 76,805 76,805 Matching Shares 15 October 2009 15 October 2014 £2.7342 76,805 76,805 Restricted Shares 21 September 2010 21 September 2015 £3.1724 113,479 113,479 Bonus Shares 21 September 2010 21 September 2015 £3.1724 85,109 85,109 Matching Shares 21 September 2010 21 September 2015 £3.1724 85,109 85,109 Restricted Shares 20 September 2011 19 September 2016 £3.9392 121,853 Bonus Shares 20 September 2011 19 September 2016 £3.9392 91,390 Matching Shares 20 September 2011 19 September 2016 £3.9392 91,390
Directors’ phantom awards The Company Executive Omnibus Incentive Plan:
Executive Director Omnibus Share Award Date of Award Release Date Price of Award Awards held at
30 June 2011 Awards held at
30 June 2012
Mark Coombs Phantom Restricted Shares 29 October 2010 21 September 2015 £3.1724 882,613 882,613 Phantom Bonus Shares 29 October 2010 21 September 2015 £3.1724 661,959 661,959 Phantom Matching Shares 29 October 2010 21 September 2015 £3.1724 661,959 661,959 Phantom Restricted Shares 20 September 2011 19 September 2016 £3.9392 812,348 Phantom Bonus Shares 20 September 2011 19 September 2016 £3.9392 609,261 Phantom Matching Shares 20 September 2011 19 September 2016 £3.9392 609,261
In relation to awards made in respect of the year ending 30 June 2010, Mark Coombs requested to waive 30 per cent of any total bonus awarded to him. In relation to awards made in respect of the year ending 30 June 2011, Mark Coombs requested to waive 20 per cent of any total bonus awarded to him. He asked the Remuneration Committee to consider an appropriate equivalent donation to be made to a charity or charities nominated by him and this was agreed by the Remuneration Committee. The figures shown are gross of this waiver.
No share or phantom awards have been made to Non-executive Directors.
52 Ashmore Group plc | Annual Report and Accounts 2012

Directors’ interests in ordinary shares of Ashmore Group plc 30 June 2012 30 June 2011
Executive Directors
Mark Coombs 295,574,200 298,574,200
Graeme Dell 1,857,110 1,552,477
Non-executive Directors Michael Benson 29,000 29,000
Nick Land 43,000 29,000
Jonathan Asquith – –
Melda Donnelly 20,000 –
Simon Fraser – –
The market price of the Company’s shares as at 30 June 2012 was 348.5 pence. The highest share price during the financial year was 420 pence. The lowest share price was 310.7 pence per share.
By order of the Board
Nick Land Chairman of the Remuneration Committee
10 September 2012
Ashmore Group plc | Annual Report and Accounts 2012 53
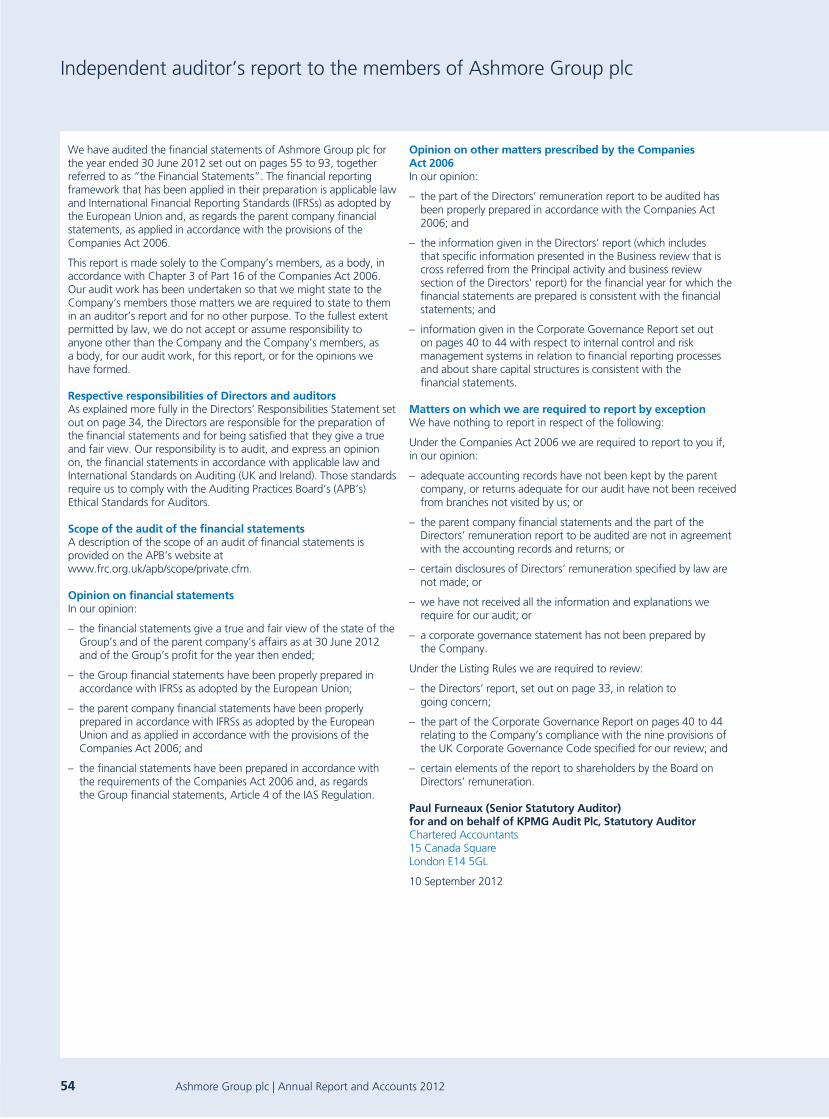
Independent auditor’s report to the members of Ashmore Group plc
We have audited the financial statements of Ashmore Group plc for the year ended 30 June 2012 set out on pages 55 to 93, together referred to as “the Financial Statements”. The financial reporting framework that has been applied in their preparation is applicable law and International Financial Reporting Standards (IFRSs) as adopted by the European Union and, as regards the parent company financial statements, as applied in accordance with the provisions of the Companies Act 2006.
This report is made solely to the Company’s members, as a body, in accordance with Chapter 3 of Part 16 of the Companies Act 2006. Our audit work has been undertaken so that we might state to the Company’s members those matters we are required to state to them in an auditor’s report and for no other purpose. To the fullest extent permitted by law, we do not accept or assume responsibility to anyone other than the Company and the Company’s members, as a body, for our audit work, for this report, or for the opinions we have formed.
Respective responsibilities of Directors and auditors As explained more fully in the Directors’ Responsibilities Statement set out on page 34, the Directors are responsible for the preparation of the financial statements and for being satisfied that they give a true and fair view. Our responsibility is to audit, and express an opinion on, the financial statements in accordance with applicable law and International Standards on Auditing (UK and Ireland). Those standards require us to comply with the Auditing Practices Board’s (APB’s) Ethical Standards for Auditors.
Scope of the audit of the financial statements A description of the scope of an audit of financial statements is provided on the APB’s website at www.frc.org.uk/apb/scope/private.cfm.
Opinion on financial statements In our opinion:
– the financial statements give a true and fair view of the state of the Group’s and of the parent company’s affairs as at 30 June 2012 and of the Group’s profit for the year then ended;
– the Group financial statements have been properly prepared in accordance with IFRSs as adopted by the European Union;
– the parent company financial statements have been properly prepared in accordance with IFRSs as adopted by the European Union and as applied in accordance with the provisions of the Companies Act 2006; and
– the financial statements have been prepared in accordance with the requirements of the Companies Act 2006 and, as regards the Group financial statements, Article 4 of the IAS Regulation.
Opinion on other matters prescribed by the Companies Act 2006 In our opinion:
– the part of the Directors’ remuneration report to be audited has been properly prepared in accordance with the Companies Act 2006; and
– the information given in the Directors’ report (which includes that specific information presented in the Business review that is cross referred from the Principal activity and business review section of the Directors’ report) for the financial year for which the financial statements are prepared is consistent with the financial statements; and
– information given in the Corporate Governance Report set out on pages 40 to 44 with respect to internal control and risk management systems in relation to financial reporting processes and about share capital structures is consistent with the financial statements.
Matters on which we are required to report by exception We have nothing to report in respect of the following:
Under the Companies Act 2006 we are required to report to you if, in our opinion:
– adequate accounting records have not been kept by the parent company, or returns adequate for our audit have not been received from branches not visited by us; or
– the parent company financial statements and the part of the Directors’ remuneration report to be audited are not in agreement with the accounting records and returns; or
– certain disclosures of Directors’ remuneration specified by law are not made; or
– we have not received all the information and explanations we require for our audit; or
– a corporate governance statement has not been prepared by the Company.
Under the Listing Rules we are required to review:
– the Directors’ report, set out on page 33, in relation to going concern;
– the part of the Corporate Governance Report on pages 40 to 44 relating to the Company’s compliance with the nine provisions of the UK Corporate Governance Code specified for our review; and
– certain elements of the report to shareholders by the Board on Directors’ remuneration.
Paul Furneaux (Senior Statutory Auditor) for and on behalf of KPMG Audit Plc, Statutory Auditor Chartered Accountants 15 Canada Square London E14 5GL
10 September 2012
54 Ashmore Group plc | Annual Report and Accounts 2012
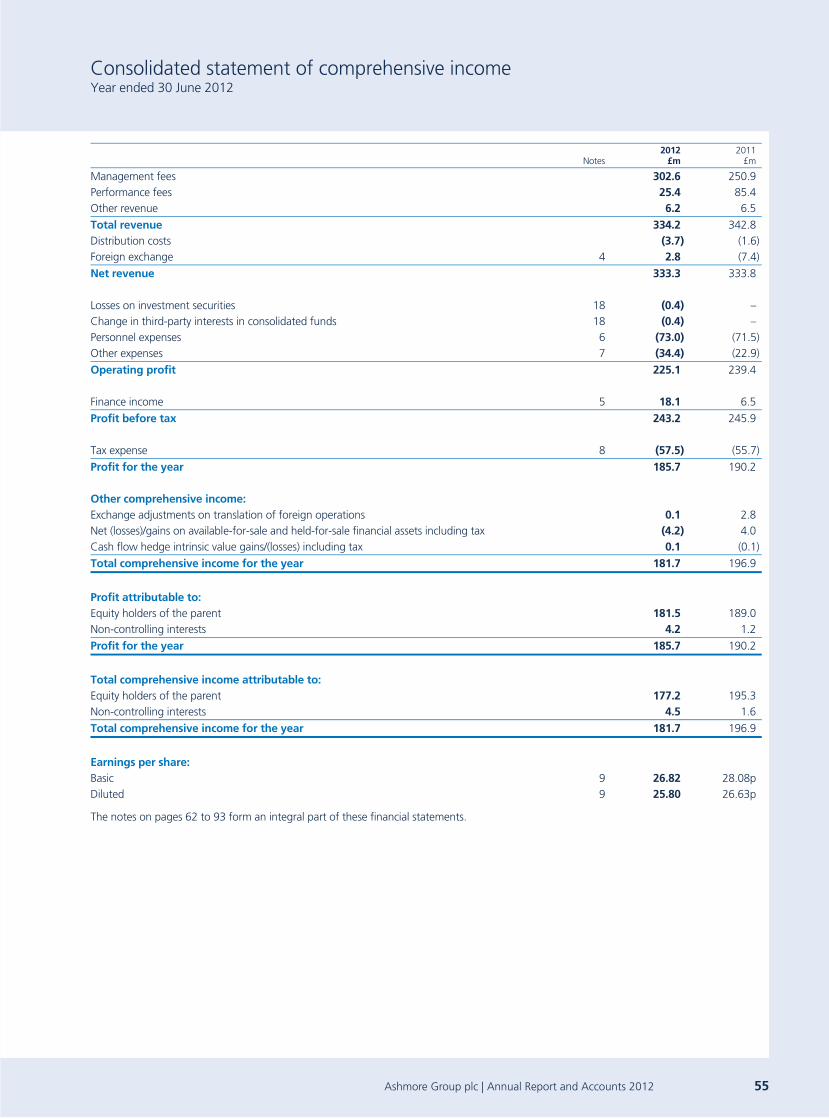
Consolidated statement of comprehensive income Year ended 30 June 2012
Notes 2012
£m 2011
£m
Management fees 302.6 250.9Performance fees 25.4 85.4Other revenue 6.2 6.5
Total revenue 334.2 342.8Distribution costs (3.7) (1.6)Foreign exchange 4 2.8 (7.4)
Net revenue 333.3 333.8 Losses on investment securities 18 (0.4) –Change in third-party interests in consolidated funds 18 (0.4) –Personnel expenses 6 (73.0) (71.5)Other expenses 7 (34.4) (22.9)
Operating profit 225.1 239.4 Finance income 5 18.1 6.5
Profit before tax 243.2 245.9 Tax expense 8 (57.5) (55.7)
Profit for the year 185.7 190.2 Other comprehensive income: Exchange adjustments on translation of foreign operations 0.1 2.8Net (losses)/gains on available-for-sale and held-for-sale financial assets including tax (4.2) 4.0Cash flow hedge intrinsic value gains/(losses) including tax 0.1 (0.1)
Total comprehensive income for the year 181.7 196.9
Profit attributable to: Equity holders of the parent 181.5 189.0Non-controlling interests 4.2 1.2
Profit for the year 185.7 190.2
Total comprehensive income attributable to: Equity holders of the parent 177.2 195.3Non-controlling interests 4.5 1.6
Total comprehensive income for the year 181.7 196.9
Earnings per share: Basic 9 26.82 28.08pDiluted 9 25.80 26.63p
The notes on pages 62 to 93 form an integral part of these financial statements.
Ashmore Group plc | Annual Report and Accounts 2012 55
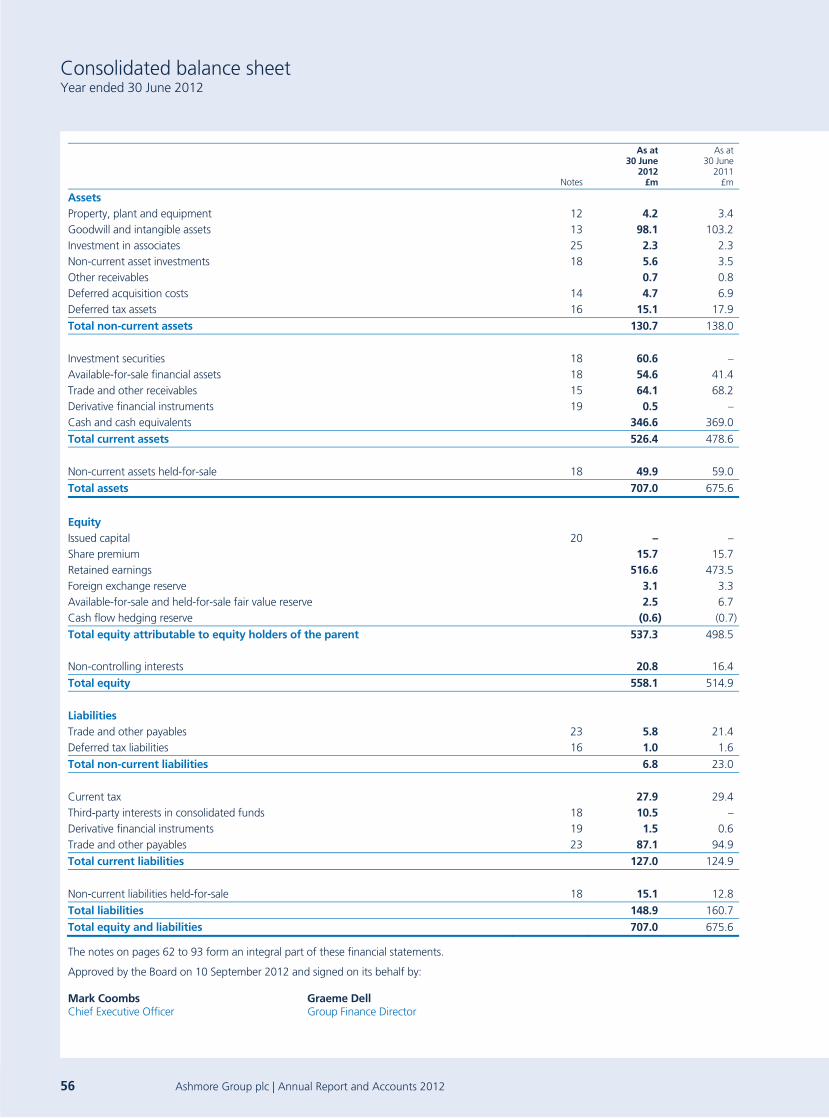
Consolidated balance sheet Year ended 30 June 2012
Notes
As at30 June
2012£m
As at30 June
2011£m
Assets Property, plant and equipment 12 4.2 3.4Goodwill and intangible assets 13 98.1 103.2Investment in associates 25 2.3 2.3Non-current asset investments 18 5.6 3.5Other receivables 0.7 0.8Deferred acquisition costs 14 4.7 6.9Deferred tax assets 16 15.1 17.9
Total non-current assets 130.7 138.0
Investment securities 18 60.6 –Available-for-sale financial assets 18 54.6 41.4Trade and other receivables 15 64.1 68.2Derivative financial instruments 19 0.5 –Cash and cash equivalents 346.6 369.0
Total current assets 526.4 478.6
Non-current assets held-for-sale 18 49.9 59.0
Total assets 707.0 675.6
Equity Issued capital 20 – –Share premium 15.7 15.7Retained earnings 516.6 473.5Foreign exchange reserve 3.1 3.3Available-for-sale and held-for-sale fair value reserve 2.5 6.7Cash flow hedging reserve (0.6) (0.7)
Total equity attributable to equity holders of the parent 537.3 498.5 Non-controlling interests 20.8 16.4
Total equity 558.1 514.9
Liabilities Trade and other payables 23 5.8 21.4Deferred tax liabilities 16 1.0 1.6
Total non-current liabilities 6.8 23.0
Current tax 27.9 29.4Third-party interests in consolidated funds 18 10.5 –Derivative financial instruments 19 1.5 0.6Trade and other payables 23 87.1 94.9
Total current liabilities 127.0 124.9
Non-current liabilities held-for-sale 18 15.1 12.8
Total liabilities 148.9 160.7
Total equity and liabilities 707.0 675.6
The notes on pages 62 to 93 form an integral part of these financial statements.
Approved by the Board on 10 September 2012 and signed on its behalf by:
Mark Coombs Graeme Dell Chief Executive Officer Group Finance Director
56 Ashmore Group plc | Annual Report and Accounts 2012
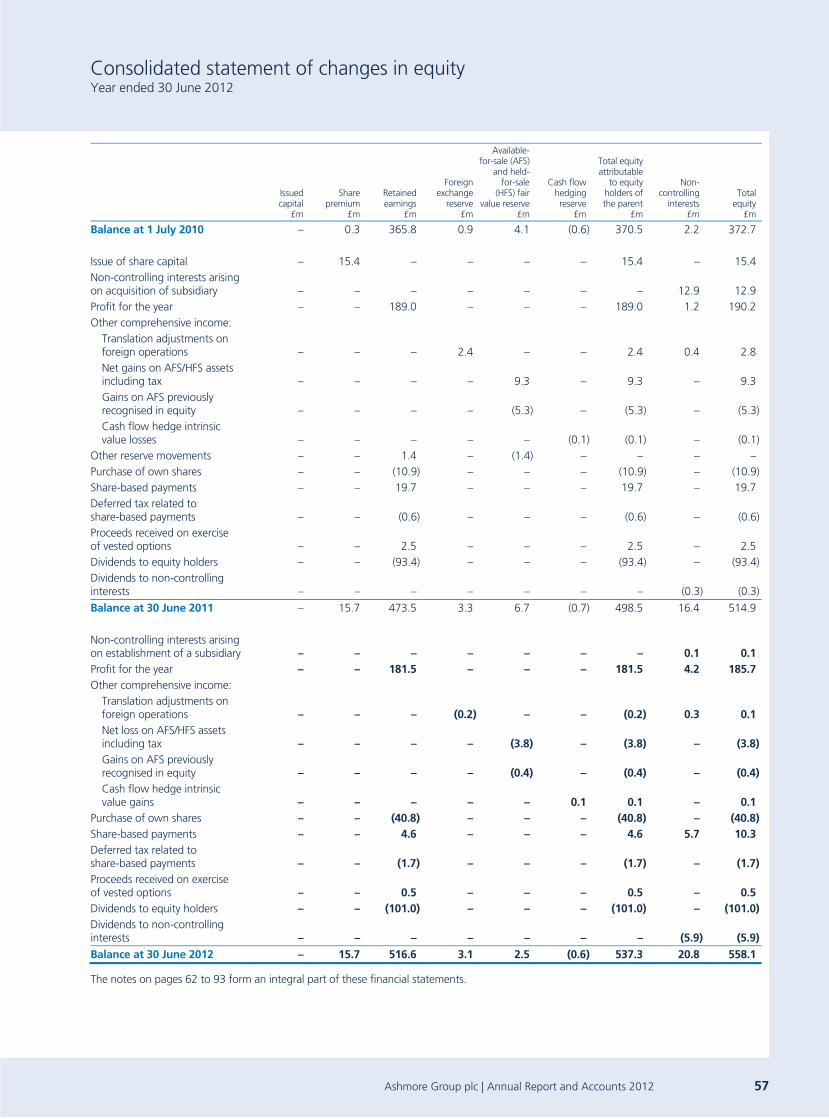
Consolidated statement of changes in equity Year ended 30 June 2012
Issued capital
£m
Share premium
£m
Retained earnings
£m
Foreign exchange
reserve£m
Available-for-sale (AFS)
and held-for-sale
(HFS) fair value reserve
£m
Cash flow hedging reserve
£m
Total equity attributable
to equity holders of the parent
£m
Non-controlling
interests£m
Total equity
£m
Balance at 1 July 2010 – 0.3 365.8 0.9 4.1 (0.6) 370.5 2.2 372.7 Issue of share capital – 15.4 – – – – 15.4 – 15.4Non-controlling interests arising on acquisition of subsidiary – – – – – – – 12.9 12.9Profit for the year – – 189.0 – – – 189.0 1.2 190.2Other comprehensive income:
Translation adjustments on foreign operations – – – 2.4 – – 2.4 0.4 2.8Net gains on AFS/HFS assets including tax – – – – 9.3 – 9.3 – 9.3Gains on AFS previously recognised in equity – – – – (5.3) – (5.3) – (5.3)Cash flow hedge intrinsic value losses – – – – – (0.1) (0.1) – (0.1)
Other reserve movements – – 1.4 – (1.4) – – – –Purchase of own shares – – (10.9) – – – (10.9) – (10.9)Share-based payments – – 19.7 – – – 19.7 – 19.7Deferred tax related to share-based payments – – (0.6) – – – (0.6) – (0.6)Proceeds received on exercise of vested options – – 2.5 – – – 2.5 – 2.5Dividends to equity holders – – (93.4) – – – (93.4) – (93.4)Dividends to non-controlling interests – – – – – – – (0.3) (0.3)
Balance at 30 June 2011 – 15.7 473.5 3.3 6.7 (0.7) 498.5 16.4 514.9 Non-controlling interests arising on establishment of a subsidiary – – – – – – – 0.1 0.1Profit for the year – – 181.5 – – – 181.5 4.2 185.7Other comprehensive income:
Translation adjustments on foreign operations – – – (0.2) – – (0.2) 0.3 0.1Net loss on AFS/HFS assets including tax – – – – (3.8) – (3.8) – (3.8)Gains on AFS previously recognised in equity – – – – (0.4) – (0.4) – (0.4)Cash flow hedge intrinsic value gains – – – – – 0.1 0.1 – 0.1
Purchase of own shares – – (40.8) – – – (40.8) – (40.8)Share-based payments – – 4.6 – – – 4.6 5.7 10.3Deferred tax related to share-based payments – – (1.7) – – – (1.7) – (1.7)Proceeds received on exercise of vested options – – 0.5 – – – 0.5 – 0.5Dividends to equity holders – – (101.0) – – – (101.0) – (101.0)Dividends to non-controlling interests – – – – – – – (5.9) (5.9)Balance at 30 June 2012 – 15.7 516.6 3.1 2.5 (0.6) 537.3 20.8 558.1
The notes on pages 62 to 93 form an integral part of these financial statements.
Ashmore Group plc | Annual Report and Accounts 2012 57

Consolidated cash flow statement Year ended 30 June 2012
2012
£m 2011
£m
Operating activities Cash receipts from customers 329.1 307.7Cash paid to suppliers and employees (90.3) (54.3)
Cash generated from operations 238.8 253.4Taxes paid (58.2) (62.1)
Net cash from operating activities 180.6 191.3
Investing activities Interest received 3.3 1.4Acquisition of subsidiary – (41.2)Changes in upfront consideration relating to acquisitions 0.4 –Purchase of non-current asset investments (10.3) (0.9)Purchase of non-current assets held-for-sale (59.9) (49.0)Purchase of available-for-sale financial assets (5.5) (10.8)Sale of available-for-sale financial assets 13.5 48.2Purchase of investment securities (161.3) –Sale of investment securities 160.0 –Subscriptions to consolidated funds 6.3 –Redemptions from consolidated funds (5.2) –Cash balances arising on the consolidation of seed capital 1.9 –Purchase of property, plant and equipment (2.6) (0.5)
Net cash used in investing activities (59.4) (52.8)
Financing activities Dividends received 0.3 –Dividends paid to equity holders (101.0) (93.4)Dividends paid to non-controlling interests (5.9) (0.3)Purchase of own shares (40.8) (10.9)
Net cash used in financing activities (147.4) (104.6)
Net (decrease)/increase in cash and cash equivalents (26.2) 33.9 Cash and cash equivalents at beginning of year 369.0 344.4 Effect of exchange rate changes on cash and cash equivalents 3.8 (9.3)
Cash and cash equivalents at end of year 346.6 369.0
Cash and cash equivalents comprise: Cash at bank and in hand 346.6 369.0
346.6 369.0
The notes on pages 62 to 93 form an integral part of these financial statements.
58 Ashmore Group plc | Annual Report and Accounts 2012

Company balance sheet Year ended 30 June 2012
Notes
As at30 June
2012£m
As at30 June
2011£m
Assets Property, plant and equipment 12 2.5 2.3Goodwill and intangible assets 13 4.1 4.1Investment in subsidiaries 25 20.1 20.1Loans due from subsidiaries 15 17.3 7.9Deferred tax assets 16 13.7 17.9
Total non-current assets 57.7 52.3
Trade and other receivables 15 215.2 136.0Cash and cash equivalents 210.6 231.2
Total current assets 425.8 367.2
Total assets 483.5 419.5
Equity Issued capital 20 – –Share premium 15.7 15.7Retained earnings 419.5 356.4
Total equity attributable to equity holders of the Company 435.2 372.1
Liabilities Current tax 1.8 –Trade and other payables 23 46.5 47.4
Total current liabilities 48.3 47.4
Total liabilities 48.3 47.4
Total equity and liabilities 483.5 419.5
The notes on pages 62 to 93 form an integral part of these financial statements.
Approved by the Board on 10 September 2012 and signed on its behalf by:
Mark Coombs Graeme Dell Chief Executive Officer Group Finance Director
Ashmore Group plc | Annual Report and Accounts 2012 59

Company statement of changes in equity Year ended 30 June 2012
Issued capital
£m
Share premium
£m
Retained earnings
£m
Total equity attributable to equity holders of the parent
£m
Balance at 1 July 2010 – 0.3 274.2 274.5 Issue of share capital – 15.4 – 15.4Profit for the year – – 164.9 164.9Purchase of own shares – – (10.9) (10.9)Share-based payments – – 19.7 19.7Deferred tax related to share-based payments – – (0.6) (0.6)Proceeds received on exercise of vested options – – 2.5 2.5Dividends to equity holders – – (93.4) (93.4)
Balance at 30 June 2011 – 15.7 356.4 372.1 Profit for the year – – 201.7 201.7Purchase of own shares – – (40.8) (40.8)Share-based payments – – 4.6 4.6Deferred tax related to share-based payments – – (1.9) (1.9)Proceeds received on exercise of vested options – – 0.5 0.5Dividends to equity holders – – (101.0) (101.0)Balance at 30 June 2012 – 15.7 419.5 435.2
The notes on pages 62 to 93 form an integral part of these financial statements.
60 Ashmore Group plc | Annual Report and Accounts 2012

Company cash flow statement Year ended 30 June 2012
2012
£m 2011
£m
Operating activities Cash receipts from customers and other Group companies 66.8 78.2Cash paid to suppliers and employees and other Group companies (54.8) (56.2)
Cash generated from operations 12.0 22.0
Net cash from operating activities 12.0 22.0
Investing activities Interest received 1.2 0.8Loans to subsidiaries (85.5) (73.5)Dividends received from subsidiaries 194.8 170.0Purchase of property, plant and equipment (1.3) (0.1)
Net cash from investing activities 109.2 97.2
Financing activities Dividends paid (101.0) (93.4)Purchase of own shares (40.8) (10.9)
Net cash used in financing activities (141.8) (104.3)
Net (decrease)/increase in cash and cash equivalents (20.6) 14.9 Cash and cash equivalents at beginning of year 231.2 222.0 Effect of exchange rate changes on cash and cash equivalents – (5.7)
Cash and cash equivalents at end of year 210.6 231.2
Cash and cash equivalents comprise: Cash at bank and in hand 210.6 231.2
210.6 231.2
The notes on pages 62 to 93 form an integral part of these financial statements.
Ashmore Group plc | Annual Report and Accounts 2012 61

Notes to the financial statements
1) Significant accounting policies The following accounting policies have been applied consistently where applicable to all years presented in dealing with items which are considered material in relation to the Group and Company financial statements, with the exception of new standards and interpretations which have been adopted with effect from 1 July 2011 as disclosed in policy note (a) below or where noted otherwise.
(a) Basis of preparation – Group and Company The financial information has been prepared in accordance with IFRS as adopted by the EU, and applied in accordance with the provisions of the Companies Act 2006. Based on these adopted IFRS, the Directors have selected the accounting policies to be applied, which are set out below.
The financial information has been prepared under the historical cost convention, except for the measurement at fair value of derivative financial instruments and certain financial assets that are held as available-for-sale.
The Company is taking advantage of the exemption in section 408 of the Companies Act 2006 which allows it not to present its individual statement of comprehensive income and related notes.
New and amended standards and interpretations
• Adopted by the Group The following new and amended IFRSs effective for the first time during the year and relevant to the Group did not have a material impact:
– IFRS 7 Financial Instruments: Disclosures (Amendment): The amendment was part of the IASB’s annual improvement project published in May 2010 and reduced the volume of disclosures regarding collateral held and clarified requirements when carrying amounts of financial assets do not reflect the maximum exposure to credit risk;
– IFRS 7 Financial Instruments: Disclosures (Amendment): The amendment requires additional disclosures relating to transfers of financial assets where an entity retains continuing involvement;
– IAS 1 Presentation of Financial Statements (Amendment): The amendment clarified that an entity may present an analysis of each component of other comprehensive income either in the statement of changes in equity or in the notes to the financial statements;
– IAS 24 Related Party Disclosures (Amendment): This amendment clarified the definition of a related party to simplify the identification of related party relationships.
• Issued but not yet effective The following new standards and amendments issued are effective from 1 January 2013 unless stated otherwise and have not been early adopted:
– Amendment to IAS 1 Presentation of Items of Other Comprehensive Income changes the grouping of items presented in the other comprehensive income based on whether they will be reclassified to profit or loss in future or not. Effective from 1 July 2012;
– Amendment to IAS 32 Financial instruments: Presentation (Effective from 1 January 2014) provides additional guidance for offsetting financial assets and liabilities while amendments to IFRS 7 Financial instruments: Disclosures set out the corresponding new disclosure requirements;
– IAS 19 Employee Benefits (Revised) primarily results in changes to the measurement, recognition and disclosure of post-employment benefit plans and termination costs;
– IAS 27 Separate Financial Statements (Revised) and IAS 28 Investments in Associates and Joint Ventures (Revised) are revised accordingly as they are largely replaced by IFRS 10 and 11, respectively;
– IFRS 9 Financial Instruments: Classification and Measurement replaces the current models for classification and measurement of financial instruments. Financial assets are to be classified into two measurement categories: those measured as at fair value and those measured at amortised cost. Classification depends on an entity’s business model and the contractual cash flow characteristics of the instrument. Financial liabilities are not affected by the changes. Effective from 1 January 2015;
– IFRS 10 Consolidated Financial Statements revises the concept of control to relate it to whether an investor has exercisable power over an investee and consequently has exposure or rights to variable returns. Consolidation procedures remain unchanged;
– IFRS 11 Joint Arrangements requires joint ventures to be accounted for using the equity accounting method while joint operations are accounted for based on the rights and obligations of each party in the arrangement;
– IFRS 12 Disclosure of Interests in Other Entities consolidates and enhances disclosure requirements relating to interests of an entity in other entities;
– IFRS 13 Fair Value Measurement provides guidance on how to measure fair value where fair value is required or permitted under IFRS and enhances disclosures requirements.
Adoption of IFRS 9, 10, 11, 12 and 13 could have a significant effect on the Group’s financial statements the impact of which is still being considered by management.
(b) Basis of consolidation (i) Subsidiaries Subsidiaries are entities controlled by the Company. Control exists when the Company has the power, directly or indirectly, to govern the financial and operating policies of an entity so as to obtain benefits from its activities. In assessing control, potential voting rights that presently are exercisable or convertible are taken into account. The financial statements of subsidiaries are included in the consolidated financial statements from the date that control commences until the date that control ceases. The results of subsidiaries acquired during the year are included in the consolidated statement of comprehensive income from the effective date of acquisition.
(ii) Transactions eliminated on consolidation Intragroup balances and any unrealised gains and losses or income and expenses arising from intragroup transactions, are eliminated in preparing the consolidated financial statements.
(iii) Associates Associates are entities over which the Group has significant influence. Significant influence exists when the Group has the power to participate in the financial and operating policy decisions of the investee but does not control those policies.
Associates are accounted for using the equity method as described under IAS 28, whereby the investment is initially recognised at cost and adjusted thereafter for the post-acquisition change in the Company’s share of net assets of the investee.
(iv) Employee Benefit Trust An Employee Benefit Trust (“EBT”) acts as an agent for the purpose of the employee share-based compensation plans. Accordingly, the EBT is included within the Group and Company financial statements.
(c) Business combinations Under the requirements of IFRS 3 Business Combinations, all business combinations are accounted for using the purchase method (acquisition accounting). The cost of a business combination is the aggregate of the fair values, at the date of exchange, of assets given, liabilities incurred or assumed and equity instruments issued by the acquirer. The fair value of a business combination is calculated at the acquisition date by recognising the acquiree’s identifiable assets,
62 Ashmore Group plc | Annual Report and Accounts 2012
liabilities and contingent liabilities that satisfy the recognition criteria, at their fair values at that date. The acquisition date is the date on which the acquirer effectively obtains control of the acquiree. The cost of a business combination in excess of the fair value of net identifiable assets or liabilities acquired, including intangible assets identified, is recognised as goodwill. Costs of issuing debt or equity instruments are accounted for under IAS 32 and IAS 39. All other costs associated with acquisitions are expensed.
(d) Foreign currency translation The Group’s financial statements are presented in Pounds Sterling (“Sterling”), which is the Company’s functional and presentation currency. Items included in the financial statements of each of the Group’s entities are measured using the currency of the primary economic environment in which the entity operates (the functional currency).
(i) Foreign currency transactions Transactions in foreign currencies are translated at the foreign exchange rate ruling at the date of the transaction. Monetary assets and liabilities denominated in foreign currencies at the balance sheet date are translated at the prevailing exchange rate. Foreign exchange differences arising on translation are recognised in the statement of comprehensive income. Non-monetary assets and liabilities that are measured in terms of historical cost in a foreign currency are translated using the exchange rate at the date of the transaction.
(ii) Financial statements of foreign operations The assets and liabilities of foreign operations, including goodwill and fair value adjustments arising on consolidation, are translated into Sterling at the foreign exchange rates ruling at the balance sheet date. The revenues and expenses of foreign operations are translated into Sterling at rates approximating to the foreign exchange rates ruling at the dates of the transactions. Foreign exchange differences arising on translation are recognised directly in other comprehensive income.
(e) Financial instruments Financial assets and liabilities are recognised when the Group becomes party to the contractual provisions of an instrument, initially at fair value plus transactions costs except for financial assets classified at fair value through profit or loss. Purchases or sales of financial assets are recognised on the trade date, being the date that the Group commits to purchase or sell the asset. Financial assets are derecognised when the rights to receive cash flows from the investments have expired or been transferred or when the Group has transferred substantially all risks and rewards of ownership. Financial liabilities are derecognised when the obligation under the liability has been discharged or cancelled or expires.
The Group’s accounting policy on fair value measurements is in accordance with IFRS 7 Financial Instruments: Disclosures and is discussed in note 17.
(i) Investment securities Investment securities represent securities held by consolidated seed investments. Securities listed on a recognised stock exchange or dealt on any other regulated market that operates regularly, recognised and open to the public, are valued at the last known available closing bid price. If such a price is not available, a closing mid price (the mean of the listed closing bid and asking prices) may be taken as a basis for the valuation. If a security is traded on several actively traded and organised financial markets, the valuation is made on the basis of the last known bid price on the main market on which the securities are traded. In the case of securities for which trading on an actively traded and organised financial market is not significant, but which are bought and sold on a secondary market with regulated trading among security dealers (with the effect that the price is set on a market basis), the valuation may be based on this secondary market.
Where investments are not listed on any stock exchange or not traded on any regulated markets, these investments will be valued by independent valuation agents.
Investments in open-ended funds are valued on the basis of last available NAV of the units or shares of such funds.
The Group’s share of the results of the comprehensive income for each of the consolidated seed investments is included in the Group’s total comprehensive income.
(ii) Derivatives Derivatives include foreign exchange forward contracts and options used by the Group to manage its foreign currency exposures and those held in consolidated seed funds.
Derivatives are initially recognised at fair value on the date on which a derivative contract is entered and subsequently remeasured at fair value. Transaction costs are recognised immediately in the statement of comprehensive income. The fair value of the derivatives is their quoted market price at the balance sheet date. All derivatives are carried as financial assets when the fair value is positive and as financial liabilities when the fair value is negative.
Any gains or losses arising from changes in the fair value of derivatives are taken directly to the statement of comprehensive income, except for the effective portion of cash flow hedges, which is recognised in other comprehensive income.
(iii) Financial assets The Group may, from time to time, invest in funds where an Ashmore Group subsidiary is the Investment Manager or an Advisor (‘seeding’). Where the holding in such investments is deemed to represent a controlling stake and is acquired exclusively with a view to subsequent disposal through sale or dilution, these seed investments are recognised as non-current assets held-for-sale in accordance with IFRS 5. The Group recognises 100% of the investment in the fund as a “held-for-sale” asset and the interest held by other parties as a “liability held-for-sale”. Where control is not deemed to exist, and the assets are readily realisable, they are recognised as available-for-sale financial assets. Where the assets are not readily realisable, they are recognised as non-current asset investments. If a seed investment remains under control of the Group for more than one year from the original investment date, it is consolidated line by line.
Ashmore Group plc | Annual Report and Accounts 2012 63

Notes to the financial statements continued
1) Significant accounting policies continued The recognition policy for the three categories of financial assets are set out below:
• Non-current asset investments Non-current asset investments, relating to closed-end funds, are classified as financial assets at fair value through profit or loss. Fair value is assessed by taking account of the extent to which potential dilution of gains or losses may arise as a result of additional investors subscribing to the fund where the final close of a fund has not occurred.
• Financial assets held as non-current assets held-for-sale Non-current assets held-for-sale are measured at the lower of their carrying amount and fair value less costs to sell except where measurement and re-measurement is outside the scope of IFRS 5. Where investments that have initially been recognised as non-current assets held-for-sale, because the Group has been deemed as holding a controlling stake, are subsequently disposed of or diluted such that the Group’s holding is no longer deemed a controlling stake, the investment will subsequently be classified as an available-for-sale financial asset. Subsequent movements will be recognised in accordance with the Group’s accounting policy for the newly adopted classification.
• Financial assets held as available-for-sale For available-for-sale financial assets, gains and losses arising from changes in their fair value are recognised in other comprehensive income, until the asset is disposed of or impaired, at which time the cumulative gain or loss previously recognised in other comprehensive income is included in profit for the year as part of comprehensive income.
(iv) Trade and other receivables and payables Trade and other receivables and payables are initially recorded at fair value plus transaction costs. The fair value on acquisition is normally the cost. Impairment losses with respect to the estimated irrecoverable amount are recognised through the statement of comprehensive income when there is appropriate evidence that trade and other receivables are impaired. However, if a longer-term loan or receivable carries no interest, the fair value is estimated as the present value of all future cash payments or receipts discounted using the Group’s weighted average cost of capital. The resulting adjustment is recognised as interest expense or interest income. Subsequent to initial recognition these assets and liabilities are measured at amortised cost less any impairment.
(v) Hedge accounting The Group applies cash flow hedge accounting when the transactions meet the specified hedge accounting criteria. To qualify, the following conditions must be met:
– formal documentation of the relationship between the hedging instrument(s) and hedged item(s) must exist at inception;
– the hedged cash flows must be highly probable and must present an exposure to variations in cash flows that could ultimately affect profit and loss;
– the effectiveness of the hedge can be reliably measured; and
– the hedge must be highly effective, with effectiveness assessed on an ongoing basis.
For qualifying cash flow hedges, the change in fair value of the effective hedging instrument is initially recognised in other comprehensive income and is released to profit for the year as part of comprehensive income in the same period during which the relevant financial asset or liability affects profit or loss.
Where the hedge is highly effective overall, any ineffective portion of the hedge is immediately recognised in profit and loss. Where the instrument ceases to be highly effective as a hedge, or is sold, terminated or exercised, hedge accounting is discontinued.
(f) Cash and cash equivalents Cash and cash equivalents comprise cash at bank and in hand and short-term deposits with an original maturity of three months or less. For the purposes of the cash flow statement, cash and cash equivalents consist of cash and cash equivalents as defined above.
(g) Property, plant and equipment Property, plant and equipment includes office equipment and is stated at cost less accumulated depreciation and impairment losses.
Depreciation is charged to the statement of comprehensive income on a straight-line basis over the estimated useful lives of each part of an item of property, plant and equipment. The useful life of office equipment is estimated to be five years. The residual values and useful lives of assets are reviewed at least annually.
(h) Intangible assets • Goodwill Goodwill represents the difference between the cost of the acquisition and the fair value of the net identifiable assets acquired and is stated at cost less any accumulated impairment losses. Goodwill has an indefinite useful life, is not subject to amortisation and is tested annually for impairment. Goodwill and intangible assets held by subsidiaries and denominated in a foreign currency are translated at the closing balance sheet rate. Any gain or loss on translation is included in other comprehensive income.
IFRS 3 and IAS 36 require goodwill to be allocated to cash-generating units for the purpose of impairment testing. The Group is considered to have one cash-generating unit and all goodwill has been allocated to this cash-generating unit.
• Other intangibles The cost of intangible assets, such as management contracts and trade names, acquired as part of a business combination are their fair value as at the date of acquisition. The fair value at the date of acquisition is calculated using the discounted cash flow methodology and represents the valuation of the net residual revenue stream arising from the management contracts and brand name in place at the date of acquisition. Following initial recognition, intangible assets are carried at cost less any accumulated amortisation and impairment losses. Intangible assets are amortised, if appropriate, over their useful lives which have been assessed as being between 31 months and 10 years.
Other intangible assets held by subsidiaries and denominated in a foreign currency are retranslated at the closing balance sheet rate. Any gain or loss on translation is included in other comprehensive income.
(i) Deferred acquisition costs Costs that are directly attributable to securing an investment management contract are deferred if they can be identified separately and measured reliably and it is probable that they will be recovered. Deferred acquisition costs represent the contractual right to benefit from providing investment management services and are charged as the related revenue is recognised.
(j) Impairment The carrying amounts of the Group’s assets are reviewed at each balance sheet date to determine whether there is any indication of impairment. If any such indication exists, the asset’s recoverable amount is estimated. For goodwill, the recoverable amount is estimated at each balance sheet date. An impairment loss is recognised whenever the carrying amount of an asset exceeds its recoverable amount. Impairment losses are recognised in the statement of comprehensive income.
64 Ashmore Group plc | Annual Report and Accounts 2012

The recoverable amount of assets is the greater of their fair value less costs to sell and value in use. In assessing value in use, the estimated future cash flows are discounted to their present value using the Group’s weighted average cost of capital. For an asset that does not generate largely independent cash inflows, the recoverable amount is determined for the cash-generating unit to which the asset belongs.
An impairment loss in respect of goodwill is not reversed. In respect of other assets, an impairment loss is reversed if there has been a change in the estimates used to determine the recoverable amount. An impairment loss is reversed only to the extent that the asset’s carrying amount does not exceed the carrying amount that would have been determined, net of depreciation or amortisation, if no impairment loss had been recognised.
(k) Dividends payable Dividends are recognised when the shareholders’ rights to receive payments have been established.
(l) Employee benefits Obligations for contributions to defined contribution pension plans are recognised as an expense in the statement of comprehensive income when payable in accordance with the scheme particulars.
(m) Share-based payments The Group issues share awards to its employees under share-based compensation plans. The awards are accounted for in line with IFRS 2 Share-Based Payment. Phantom awards are classified as cash settled under IFRS 2. All other awards are classified as equity settled.
For equity settled awards the fair value of the amounts payable to employees is recognised as an expense with a corresponding increase in equity. The fair value is measured at grant date and spread over the vesting period. The fair value of equity settled awards is measured using an appropriate valuation model, taking into account the terms and conditions upon which the instruments were granted.
For cash settled awards the fair value of the amounts payable to employees is recognised as an expense with a corresponding liability on the Group’s balance sheet. The fair value is measured at the end of each reporting period and spread over the vesting period. The fair value of cash settled awards is measured using an appropriate valuation model, taking into account the terms and conditions upon which the instruments were granted.
(n) Equity shares The Company’s ordinary shares of 0.01 pence each are classified as equity instruments. Ordinary shares issued by the Company are recorded at the fair value of the consideration received or the market price at the day of issue. Direct issue costs, net of tax, are deducted from equity through share premium. When share capital is repurchased, the amount of consideration paid, including directly attributable costs, is recognised as a change in equity.
(o) Own shares Own shares are held by the EBT. The holding of the EBT comprises own shares that have not vested unconditionally to employees of the Group. In both the Group and Company, own shares are recorded at cost and are deducted from retained earnings.
(p) Treasury shares Treasury shares are recognised in equity and are measured at cost. Consideration received for the sale of such shares is also recognised in equity, with any difference between the proceeds from the sale and original cost being taken to retained earnings.
(q) Revenue Revenue comprises management fees, performance fees and other revenue. Revenue is recognised in the statement of comprehensive income as and when the related services are provided. Revenue is recognised to the extent that it is probable that the economic benefits will flow to the Group and the revenue can be reliably measured. Specific revenue recognition policies are:
(i) Management fees Management fees net of rebates are accrued over the period for which the service is provided. Where management fees are received in advance these are recognised over the period of the provision of the asset management service, which is estimated based on experience of average holding periods for investments.
(ii) Performance fees Performance fees net of rebates relate to the performance of funds managed during the period and are recognised at the balance sheet date when the quantum of the fee can be estimated reliably and it is probable that the fee will crystallise. This is usually at the end of the performance period.
(iii) Other revenue Other revenue includes transaction, structuring and administration fees, and reimbursement by funds of costs incurred by the Group. This revenue is recognised when the related services are provided.
(r) Distribution costs Distribution costs are cost of sales payable to third parties and are recognised over the period for which the service is provided.
(s) Operating leases Payments payable under operating leases are recognised in the statement of comprehensive income on a straight-line basis over the term of the lease. Lease incentives received are recognised on a straight-line basis over the lease term and are recorded as a reduction in premises costs.
(t) Finance income Finance income includes interest receivable on the Group’s cash and cash equivalents and gains on available-for-sale/held-for-sale assets. Gains and losses on available-for-sale/held-for-sale assets recognised in the year arose either as a result of crystallisation on the disposal of an available-for-sale asset or upon reclassification of financial assets previously held as non-current assets held-for-sale as described in policy note (e)(ii).
Finance income also includes adjustments in relation to the Group’s contingent consideration liabilities related to acquisitions and charges in respect of unwinding of net present value discounts.
(u) Taxation Tax on the profit or loss for the year comprises current and deferred tax. Tax is recognised in the statement of comprehensive income except to the extent that it relates to items recognised directly in equity, in which case it is recognised in equity.
(i) Current tax Current tax is the expected tax payable on the taxable income for the year, using tax rates enacted or substantively enacted at the balance sheet date, and any adjustment to tax payable in respect of previous years.
Ashmore Group plc | Annual Report and Accounts 2012 65

Notes to the financial statements continued
1) Significant accounting policies continued (ii) Deferred tax Deferred tax is provided using the balance sheet liability method, providing for temporary differences between the carrying amounts of assets and liabilities for financial reporting purposes and the amounts used for taxation purposes. The following differences are not provided for:
– goodwill not deductible for tax purposes; and
– differences relating to investments in subsidiaries to the extent that they will probably not reverse in the foreseeable future.
The amount of deferred tax provided is based on the expected manner of realisation or settlement of the carrying amount of assets and liabilities, using tax rates enacted or substantively enacted at the balance sheet date.
A deferred tax asset is recognised only to the extent that it is probable that future taxable profits will be available against which the asset can be utilised. Deferred tax assets are reduced to the extent that it is no longer probable that the related tax benefit will be realised.
(v) Accounting estimates and judgements The preparation of financial statements in conformity with IFRS requires management to make judgements, estimates and assumptions that affect the application of policies and reported amounts of assets and liabilities, income and expenses. The estimates and associated assumptions are based on historical experience and various other factors that are believed to be reasonable under the circumstances, the results of which form the basis of making the judgements about carrying values of assets and liabilities that are not readily apparent from other sources. Actual results may differ from these estimates.
The estimates and underlying assumptions are reviewed on an ongoing basis. Revisions to accounting estimates are recognised in the period in which the estimate is revised if the revision affects only that period, or in the period of the revision and future periods if the revision affects both current and future periods.
Judgements made by management in the application of IFRS that have significant effect on the financial statements and estimates with a significant risk of material adjustment are described in note 29.
(w) Segmental information Key management information, including revenues, margins, investment performance, distribution costs and AuM flows, which is relevant to the operation of Group, is reviewed on the basis of the investment management business as a whole and, hence, the Group’s management regards the Group’s services as comprising one business segment (being provision of investment management services) and that its operations are not run on a discrete geographic basis.
Company In addition to the above accounting policies, the following specifically relate to the Company.
(x) Investment in subsidiaries Subsidiaries are entities controlled by the Company. Control exists when the Company has the power, directly or indirectly, to govern the financial and operating policies of an entity so as to obtain benefits from its activities. In assessing control, potential voting rights that presently are exercisable or convertible are taken into account.
Investments in subsidiaries are stated at cost less, where appropriate, provisions for impairment.
(y) Financial guarantees Where the Company enters into financial guarantee contracts to guarantee the indebtedness of other companies within its group, the Company considers these to be insurance arrangements, and accounts for them as such. In this respect, the Company treats the guarantee contract as a contingent liability until such time as it becomes probable that the Company will be required to make a payment under the guarantee or that guarantee expires for any reason.
66 Ashmore Group plc | Annual Report and Accounts 2012
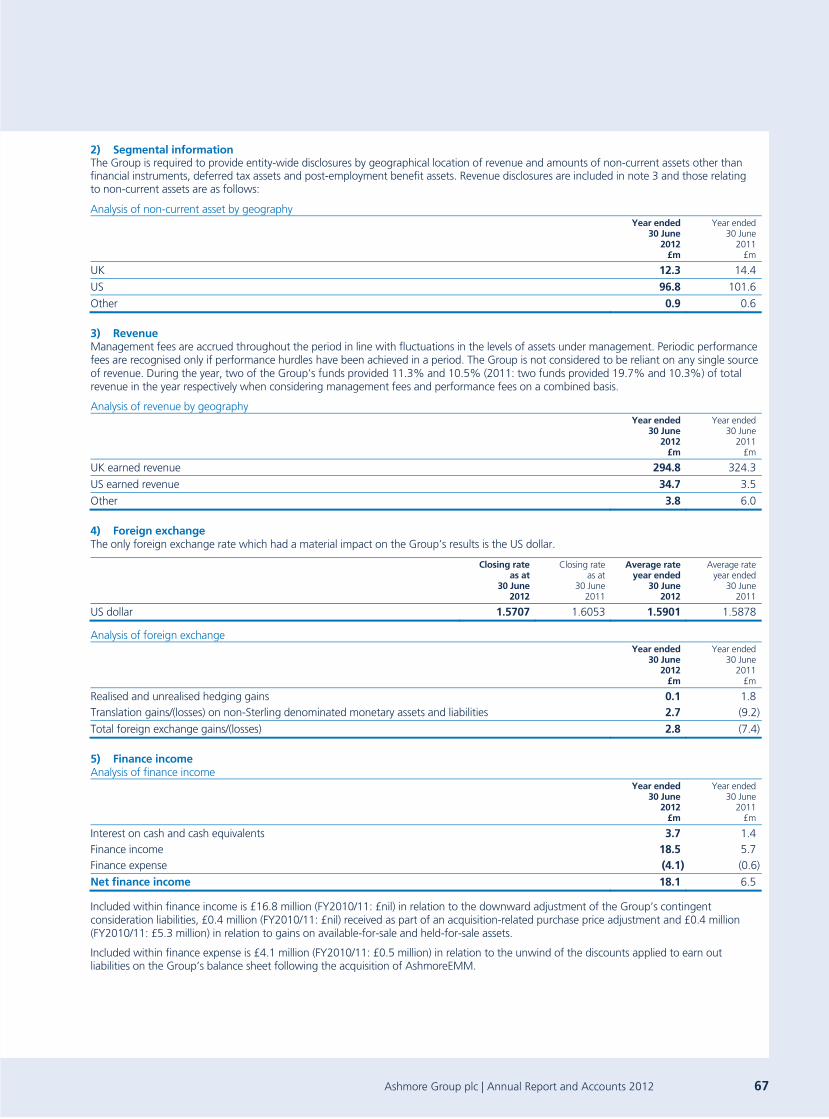
2) Segmental information The Group is required to provide entity-wide disclosures by geographical location of revenue and amounts of non-current assets other than financial instruments, deferred tax assets and post-employment benefit assets. Revenue disclosures are included in note 3 and those relating to non-current assets are as follows:
Analysis of non-current asset by geography
Year ended30 June
2012£m
Year ended30 June
2011£m
UK 12.3 14.4
US 96.8 101.6
Other 0.9 0.6 3) Revenue Management fees are accrued throughout the period in line with fluctuations in the levels of assets under management. Periodic performance fees are recognised only if performance hurdles have been achieved in a period. The Group is not considered to be reliant on any single source of revenue. During the year, two of the Group’s funds provided 11.3% and 10.5% (2011: two funds provided 19.7% and 10.3%) of total revenue in the year respectively when considering management fees and performance fees on a combined basis.
Analysis of revenue by geography
Year ended30 June
2012£m
Year ended30 June
2011£m
UK earned revenue 294.8 324.3
US earned revenue 34.7 3.5
Other 3.8 6.0
4) Foreign exchange The only foreign exchange rate which had a material impact on the Group’s results is the US dollar.
Closing rateas at
30 June 2012
Closing rate as at
30 June 2011
Average rateyear ended
30 June 2012
Average rateyear ended
30 June 2011
US dollar 1.5707 1.6053 1.5901 1.5878
Analysis of foreign exchange
Year ended30 June
2012£m
Year ended30 June
2011£m
Realised and unrealised hedging gains 0.1 1.8Translation gains/(losses) on non-Sterling denominated monetary assets and liabilities 2.7 (9.2)
Total foreign exchange gains/(losses) 2.8 (7.4)
5) Finance income Analysis of finance income
Year ended30 June
2012£m
Year ended30 June
2011£m
Interest on cash and cash equivalents 3.7 1.4Finance income 18.5 5.7Finance expense (4.1) (0.6)
Net finance income 18.1 6.5
Included within finance income is £16.8 million (FY2010/11: £nil) in relation to the downward adjustment of the Group’s contingent consideration liabilities, £0.4 million (FY2010/11: £nil) received as part of an acquisition-related purchase price adjustment and £0.4 million (FY2010/11: £5.3 million) in relation to gains on available-for-sale and held-for-sale assets.
Included within finance expense is £4.1 million (FY2010/11: £0.5 million) in relation to the unwind of the discounts applied to earn out liabilities on the Group’s balance sheet following the acquisition of AshmoreEMM.
Ashmore Group plc | Annual Report and Accounts 2012 67
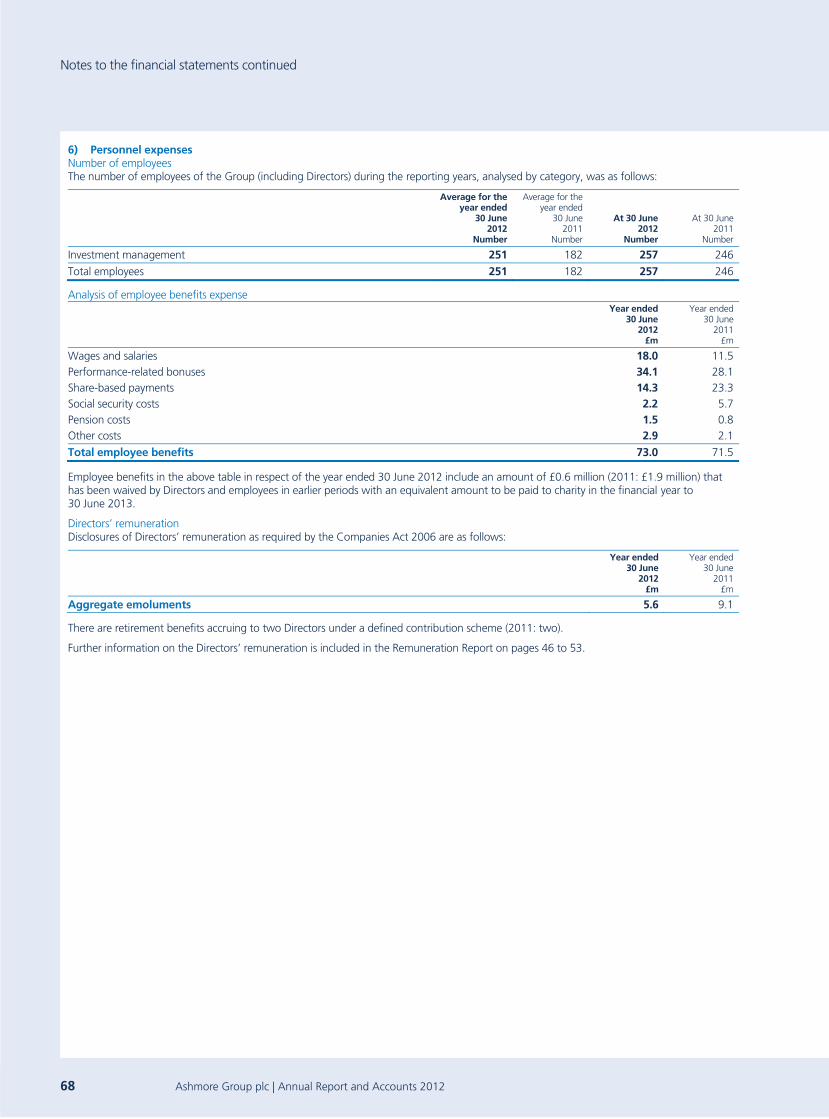
Notes to the financial statements continued
6) Personnel expenses Number of employees The number of employees of the Group (including Directors) during the reporting years, analysed by category, was as follows:
Average for the year ended
30 June2012
Number
Average for the year ended
30 June 2011
Number
At 30 June2012
Number
At 30 June2011
Number
Investment management 251 182 257 246
Total employees 251 182 257 246
Analysis of employee benefits expense
Year ended30 June
2012£m
Year ended30 June
2011£m
Wages and salaries 18.0 11.5Performance-related bonuses 34.1 28.1Share-based payments 14.3 23.3Social security costs 2.2 5.7Pension costs 1.5 0.8Other costs 2.9 2.1
Total employee benefits 73.0 71.5
Employee benefits in the above table in respect of the year ended 30 June 2012 include an amount of £0.6 million (2011: £1.9 million) that has been waived by Directors and employees in earlier periods with an equivalent amount to be paid to charity in the financial year to 30 June 2013.
Directors’ remuneration Disclosures of Directors’ remuneration as required by the Companies Act 2006 are as follows:
Year ended30 June
2012£m
Year ended30 June
2011 £m
Aggregate emoluments 5.6 9.1
There are retirement benefits accruing to two Directors under a defined contribution scheme (2011: two).
Further information on the Directors’ remuneration is included in the Remuneration Report on pages 46 to 53.
68 Ashmore Group plc | Annual Report and Accounts 2012

7) Other expenses
Year ended30 June
2012£m
Year ended30 June
2011£m
Travel 5.9 4.7Professional fees 4.0 5.5Information technology and communications 4.3 2.7Deferred acquisition costs (note 14) 2.1 2.2Amortisation of intangible assets (note 13) 6.2 0.5Impairment of intangible assets (note 13) 1.2 –Operating leases 2.8 2.5Premises-related costs 1.7 1.1Insurance 0.9 0.6Auditors’ remuneration 0.9 0.6Depreciation of property, plant and equipment (note 12) 1.6 1.3Other expenses 2.8 1.2
Total other expenses 34.4 22.9
Auditors’ remuneration
Year ended30 June
2012£m
Year ended30 June
2011£m
Statutory audit services: – Fees payable to the Company’s auditor for the audit of the Group’s accounts 0.2 0.1– Fees payable to the Company's auditor and its associates for the audit of the Company's subsidiaries pursuant to legislation 0.2 0.1 Non-audit services: – Fees payable to the Company's auditor and its associates for tax services 0.2 0.2– Fees payable to the Company’s auditor and its associates for other services 0.3 0.2
Total services 0.9 0.6
Ashmore Group plc | Annual Report and Accounts 2012 69
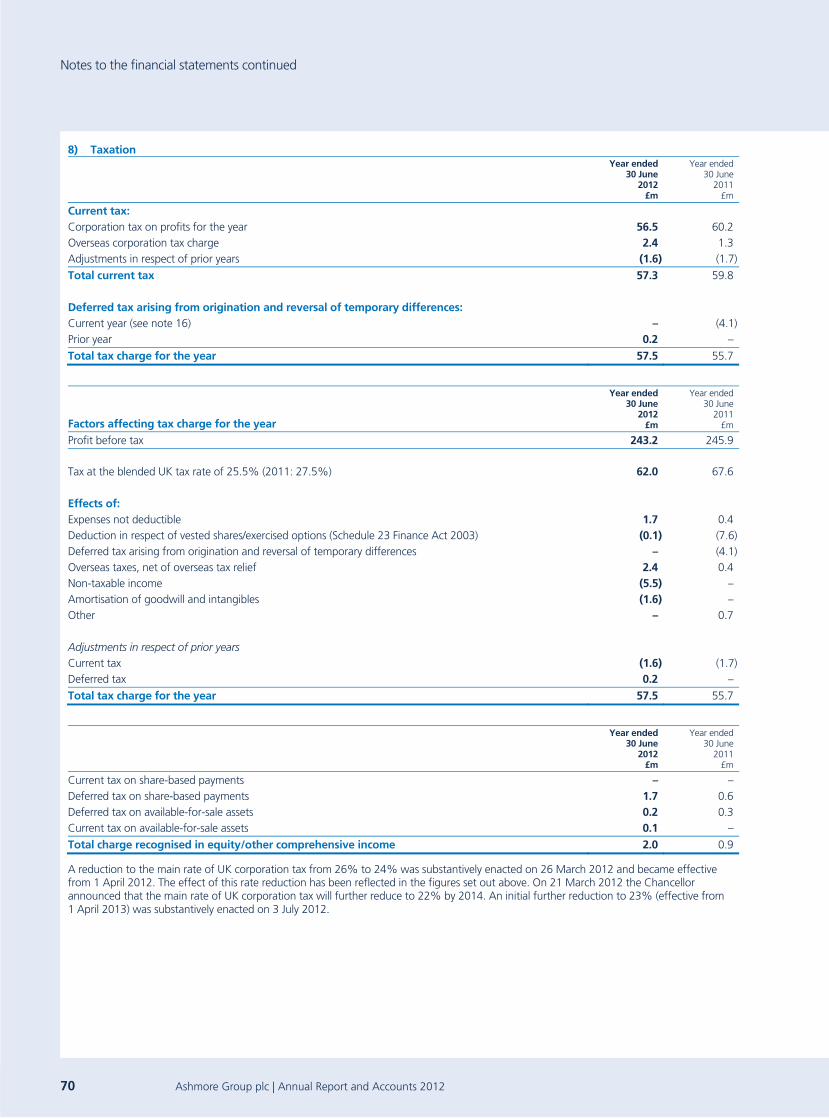
Notes to the financial statements continued
8) Taxation
Year ended30 June
2012£m
Year ended30 June
2011£m
Current tax: Corporation tax on profits for the year 56.5 60.2Overseas corporation tax charge 2.4 1.3Adjustments in respect of prior years (1.6) (1.7)
Total current tax 57.3 59.8 Deferred tax arising from origination and reversal of temporary differences: Current year (see note 16) – (4.1)Prior year 0.2 –
Total tax charge for the year 57.5 55.7
Factors affecting tax charge for the year
Year ended30 June
2012£m
Year ended30 June
2011£m
Profit before tax 243.2 245.9
Tax at the blended UK tax rate of 25.5% (2011: 27.5%) 62.0 67.6 Effects of: Expenses not deductible 1.7 0.4Deduction in respect of vested shares/exercised options (Schedule 23 Finance Act 2003) (0.1) (7.6)Deferred tax arising from origination and reversal of temporary differences – (4.1)Overseas taxes, net of overseas tax relief 2.4 0.4Non-taxable income (5.5) –Amortisation of goodwill and intangibles (1.6) –Other – 0.7 Adjustments in respect of prior years Current tax (1.6) (1.7)Deferred tax 0.2 –
Total tax charge for the year 57.5 55.7
Year ended30 June
2012£m
Year ended30 June
2011£m
Current tax on share-based payments – –Deferred tax on share-based payments 1.7 0.6Deferred tax on available-for-sale assets 0.2 0.3Current tax on available-for-sale assets 0.1 –
Total charge recognised in equity/other comprehensive income 2.0 0.9
A reduction to the main rate of UK corporation tax from 26% to 24% was substantively enacted on 26 March 2012 and became effective from 1 April 2012. The effect of this rate reduction has been reflected in the figures set out above. On 21 March 2012 the Chancellor announced that the main rate of UK corporation tax will further reduce to 22% by 2014. An initial further reduction to 23% (effective from 1 April 2013) was substantively enacted on 3 July 2012.
70 Ashmore Group plc | Annual Report and Accounts 2012

9) Earnings per share Basic earnings per share is calculated by dividing the profit after tax for the financial year attributable to equity holders of the parent of £181.5 million (2011: £189.0 million) by the weighted average number of ordinary shares in issue during the year.
Diluted earnings per share is calculated as for basic earnings per share with an adjustment to the weighted average number of ordinary shares to reflect the effects of all dilutive potential ordinary shares. There is no difference between the profit for the financial year attributable to equity holders of the parent used in the basic and diluted earnings per share calculations.
Reconciliation of the figures used in calculating basic and diluted earnings per share:
Year ended30 June
2012
Year ended30 June
2011
Weighted average number of ordinary shares used in calculation of basic earnings per share 676,460,821 673,317,931Effect of dilutive potential ordinary shares – share options/awards 26,845,937 36,585,155
Weighted average number of ordinary shares used in calculation of diluted earnings per share 703,306,758 709,903,086
10) Share-based payments The total share-based payments-related cost recognised by the Group in the statement of comprehensive income is shown below:
Group
Year ended30 June
2012£m
Year ended30 June
2011£m
Omnibus Plan 8.9 23.3
Related to compensation plans 8.9 23.3Related to acquisition of AshmoreEMM 5.4 –
Total expense 14.3 23.3
Group and Company share-based compensation plans The following share-based compensation plans were in operation during the reporting year.
The Ashmore First Discretionary Share Option Scheme (“Option Scheme”) The Option Scheme was set up in October 2000. Options issued under the Option Scheme typically have a life of ten years and vest after five years from date of grant. The pro rata proportion of the fair value of options at each reporting year end has been accounted for on an equity-settled basis. No further options will be issued under the Option Scheme.
The Executive Omnibus Incentive Plan (“Omnibus Plan”) The Omnibus Plan was introduced prior to the Company listing in October 2006 and provides for the grant of share awards, market value options, premium cost options, discounted options, linked options, phantoms and/or nil cost options to employees. The Plan will also allow bonuses to be deferred in the form of share awards with or without matching shares. These elements can be used singly or in combination. Awards granted under the Omnibus plan typically vest after five years from date of grant, with the exception of bonus awards which vest after the shorter of five years from date of grant or on the date of termination of employment. Awards under the Omnibus Plan are accounted for as equity settled, with the exception of phantoms which are classified as cash settled.
The Approved Company Share Option Plan (“CSOP”) The CSOP was also introduced prior to the Company listing in October 2006 and is an option scheme providing for the grant of market value options to employees with the aggregate value of outstanding options not exceeding £30,000 per employee. The CSOP qualifies as a UK tax approved company share option plan and approval thereto has been obtained from HMRC. To date, there have been no awards made under the CSOP.
The share-based payments relating to the Omnibus Plan represent the combined cash and equity settled payments.
Group and Company Year of grant
Year ended30 June
2012£m
Year ended30 June
2011£m
2007 (2.4) 1.82008 (1.1) 2.12009 0.5 1.42010 1.7 5.62011 (2.1) 12.42012 12.3 –
Total expense 8.9 23.3
Ashmore Group plc | Annual Report and Accounts 2012 71
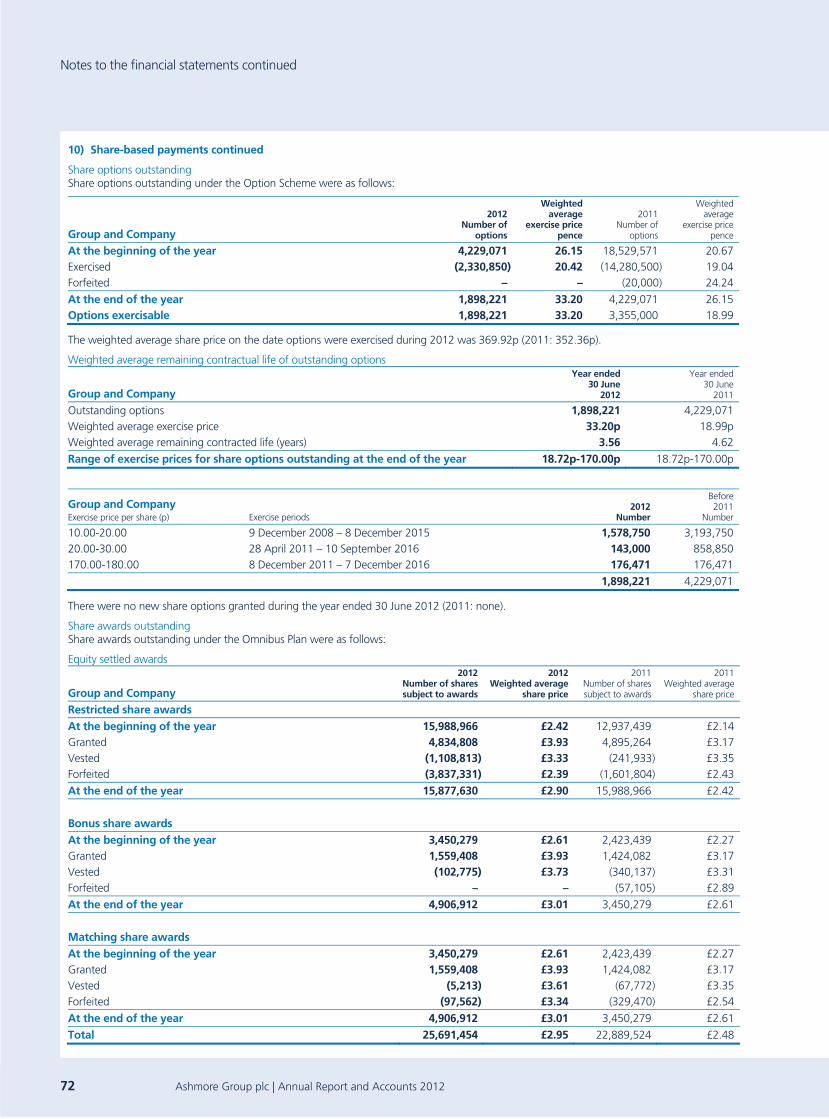
Notes to the financial statements continued
10) Share-based payments continued
Share options outstanding Share options outstanding under the Option Scheme were as follows:
Group and Company
2012Number of
options
Weighted average
exercise price pence
2011Number of
options
Weighted average
exercise pricepence
At the beginning of the year 4,229,071 26.15 18,529,571 20.67Exercised (2,330,850) 20.42 (14,280,500) 19.04Forfeited – – (20,000) 24.24
At the end of the year 1,898,221 33.20 4,229,071 26.15Options exercisable 1,898,221 33.20 3,355,000 18.99
The weighted average share price on the date options were exercised during 2012 was 369.92p (2011: 352.36p).
Weighted average remaining contractual life of outstanding options
Group and Company
Year ended 30 June
2012
Year ended30 June
2011
Outstanding options 1,898,221 4,229,071Weighted average exercise price 33.20p 18.99pWeighted average remaining contracted life (years) 3.56 4.62
Range of exercise prices for share options outstanding at the end of the year 18.72p-170.00p 18.72p-170.00p
Group and Company Exercise price per share (p) Exercise periods
2012
Number
Before2011
Number
10.00-20.00 9 December 2008 – 8 December 2015 1,578,750 3,193,75020.00-30.00 28 April 2011 – 10 September 2016 143,000 858,850170.00-180.00 8 December 2011 – 7 December 2016 176,471 176,471
1,898,221 4,229,071
There were no new share options granted during the year ended 30 June 2012 (2011: none).
Share awards outstanding Share awards outstanding under the Omnibus Plan were as follows:
Equity settled awards
Group and Company
2012Number of shares subject to awards
2012Weighted average
share price
2011 Number of shares subject to awards
2011Weighted average
share price
Restricted share awards
At the beginning of the year 15,988,966 £2.42 12,937,439 £2.14Granted 4,834,808 £3.93 4,895,264 £3.17Vested (1,108,813) £3.33 (241,933) £3.35Forfeited (3,837,331) £2.39 (1,601,804) £2.43
At the end of the year 15,877,630 £2.90 15,988,966 £2.42
Bonus share awards
At the beginning of the year 3,450,279 £2.61 2,423,439 £2.27Granted 1,559,408 £3.93 1,424,082 £3.17Vested (102,775) £3.73 (340,137) £3.31Forfeited – – (57,105) £2.89
At the end of the year 4,906,912 £3.01 3,450,279 £2.61
Matching share awards
At the beginning of the year 3,450,279 £2.61 2,423,439 £2.27Granted 1,559,408 £3.93 1,424,082 £3.17Vested (5,213) £3.61 (67,772) £3.35Forfeited (97,562) £3.34 (329,470) £2.54
At the end of the year 4,906,912 £3.01 3,450,279 £2.61
Total 25,691,454 £2.95 22,889,524 £2.48
72 Ashmore Group plc | Annual Report and Accounts 2012

Cash settled awards
Group and Company
2012Number of shares subject to awards
2012 Weighted
average share price
2011Number of shares subject to awards
2011Weighted average
share price
Restricted share awards At the beginning of the year 1,265,622 £2.92 – –Granted 908,239 £3.93 1,265,622 £2.92Vested (108,225) £3.29 – –Forfeited (259,568) £2.54 – –
At the end of the year 1,806,068 £3.54 1,265,622 £2.92
Bonus share awards At the beginning of the year 700,151 £3.15 – –Granted 638,116 £3.93 700,151 £3.15Vested – – – –Forfeited (38,192) £2.70 – –
At the end of the year 1,300,075 £3.55 700,151 £3.15
Matching share awards At the beginning of the year 700,151 £3.15 – –Granted 638,116 £3.93 700,151 £3.15Vested – – – –Forfeited (38,192) £2.70 – –
At the end of the year 1,300,075 £3.55 700,151 £3.15
Total 4,406,218 £3.55 2,665,924 £3.04
Total awards
Group and Company
2012Number of shares subject to awards
2012 Weighted
average share price
2011Number of shares subject to awards
2011Weighted average
share price
Restricted share awards At the beginning of the year 17,254,588 £2.46 12,937,439 £2.14Granted 5,743,047 £3.93 6,160,886 £3.12Vested (1,217,038) £3.33 (241,933) £3.35Forfeited (4,096,899) £2.40 (1,601,804) £2.43
At the end of the year 17,683,698 £2.96 17,254,588 £2.46
Bonus share awards At the beginning of the year 4,150,430 £2.70 2,423,439 £2.27Granted 2,197,524 £3.93 2,124,233 £3.16Vested (102,775) £3.73 (340,137) £3.31Forfeited (38,192) £2.70 (57,105) £2.89
At the end of the year 6,206,987 £3.12 4,150,430 £2.70
Matching share awards At the beginning of the year 4,150,430 £2.70 2,423,439 £2.27Granted 2,197,524 £3.93 2,124,233 £3.16Vested (5,213) £3.61 (67,772) £3.35Forfeited (135,754) £3.16 (329,470) £2.54
At the end of the year 6,206,987 £3.12 4,150,430 £2.70
Total 30,097,672 £3.04 25,555,448 £2.54
The fair value of awards granted under the Omnibus Plan is determined by the average Ashmore Group plc share price for the five business days prior to grant.
Ashmore Group plc | Annual Report and Accounts 2012 73

Notes to the financial statements continued
10) Share-based payments continued Where the grant of restricted and matching share awards is linked to the annual bonus process the fair value of the awards is spread over a period including the current financial year and the subsequent five years to their release date when the grantee becomes unconditionally entitled to the underlying shares. Of the total outstanding share awards of 30,097,672 as at 30 June 2012 (25,555,448 as at 30 June 2011) the amount of 23,890,685 (2011: 19,630,824) were restricted and matching shares granted as part of the Group’s variable compensation process. The fair value of the remaining awards is spread over the period from date of grant to the release date.
Acquisition of AshmoreEMM On acquisition of AshmoreEMM, employees and management held unvested shares representing 17.9% of its partnership shares. These awards, which vest after five years depending on the satisfaction of service conditions, are accounted for as equity settled share-based payments in accordance with IFRS 2 which results in an annual charge to the income statement during the period of vesting. Upon vesting, the holders are entitled to receive AshmoreEMM shares which may be exchanged for shares in Ashmore Group plc or cash at the discretion of the Group. The grant date fair value was based on the intrinsic value proportionate with the value implied from the purchase consideration paid by the Group to acquire AshmoreEMM.
No awards were granted or vested (2011: none) during the year. 25,097 awards (2011: none) were forfeited during the year and 2,294,453 (2011: 2,300,000) awards are outstanding as at year end.
11) Dividends An analysis of dividends is as follows:
Group and Company 2012 2011
Dividends declared/proposed in respect of the year: Interim dividend declared per share (p) 4.25 4.16Final dividend proposed per share (p) 10.75 10.34
Dividends paid in the year: Interim dividend paid (£m) 29.4 29.1Interim dividend per share (p) 4.25 4.16 Final dividend paid (£m) 71.6 64.3Final dividend per share (p) 10.34 9.34
In addition to the £101.0 million (2011: £93.4 million) of dividends paid to equity holders of the parent, the Group also paid £5.9 million (2011: £0.3 million) of dividends to non-controlling interests.
On 10 September 2012 the Board proposed a final dividend of 10.75p per share for the year ended 30 June 2012. This has not been recognised as a liability of the Group at the year end as it has not yet been approved by shareholders. Based on the number of shares in issue at the year end which qualify to receive a dividend, the total amount payable would be £73.7 million (2011: £72.2 million).
12) Property, plant and equipment
Group
2012Fixtures, fittings and equipment
£m
2011Fixtures, fittings and equipment
£m
Cost At the beginning of the year 8.1 6.3Additions 2.6 0.5Acquisitions – 1.3Disposals (0.3) –
At the end of the year 10.4 8.1
Accumulated depreciation At the beginning of the year 4.7 2.5Depreciation charge for the year (note 7) 1.6 1.3Acquisitions – 0.9Disposals (0.1) –
At the end of the year 6.2 4.7
Net book value at 30 June 4.2 3.4
74 Ashmore Group plc | Annual Report and Accounts 2012
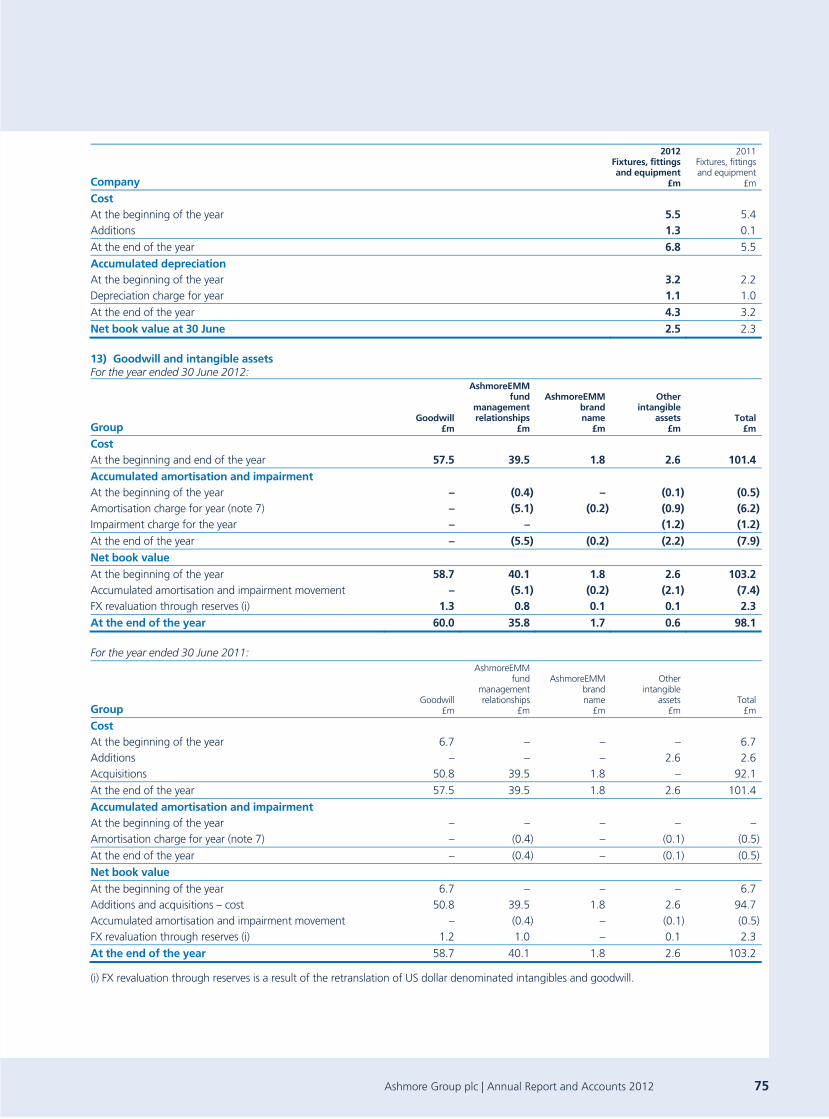
Company
2012Fixtures, fittings and equipment
£m
2011Fixtures, fittings and equipment
£m
Cost At the beginning of the year 5.5 5.4Additions 1.3 0.1
At the end of the year 6.8 5.5
Accumulated depreciation At the beginning of the year 3.2 2.2Depreciation charge for year 1.1 1.0
At the end of the year 4.3 3.2
Net book value at 30 June 2.5 2.3
13) Goodwill and intangible assets For the year ended 30 June 2012:
Group Goodwill
£m
AshmoreEMM fund
management relationships
£m
AshmoreEMM brand name
£m
Other intangible
assets£m
Total£m
Cost
At the beginning and end of the year 57.5 39.5 1.8 2.6 101.4Accumulated amortisation and impairment At the beginning of the year – (0.4) – (0.1) (0.5)Amortisation charge for year (note 7) – (5.1) (0.2) (0.9) (6.2)Impairment charge for the year – – (1.2) (1.2)At the end of the year – (5.5) (0.2) (2.2) (7.9)Net book value At the beginning of the year 58.7 40.1 1.8 2.6 103.2Accumulated amortisation and impairment movement – (5.1) (0.2) (2.1) (7.4)FX revaluation through reserves (i) 1.3 0.8 0.1 0.1 2.3At the end of the year 60.0 35.8 1.7 0.6 98.1 For the year ended 30 June 2011:
Group Goodwill
£m
AshmoreEMM fund
management relationships
£m
AshmoreEMM brand name
£m
Other intangible
assets£m
Total£m
Cost
At the beginning of the year 6.7 – – – 6.7Additions – – – 2.6 2.6Acquisitions 50.8 39.5 1.8 – 92.1
At the end of the year 57.5 39.5 1.8 2.6 101.4
Accumulated amortisation and impairment At the beginning of the year – – – – –Amortisation charge for year (note 7) – (0.4) – (0.1) (0.5)
At the end of the year – (0.4) – (0.1) (0.5)
Net book value
At the beginning of the year 6.7 – – – 6.7Additions and acquisitions – cost 50.8 39.5 1.8 2.6 94.7Accumulated amortisation and impairment movement – (0.4) – (0.1) (0.5)FX revaluation through reserves (i) 1.2 1.0 – 0.1 2.3
At the end of the year 58.7 40.1 1.8 2.6 103.2
(i) FX revaluation through reserves is a result of the retranslation of US dollar denominated intangibles and goodwill.
Ashmore Group plc | Annual Report and Accounts 2012 75
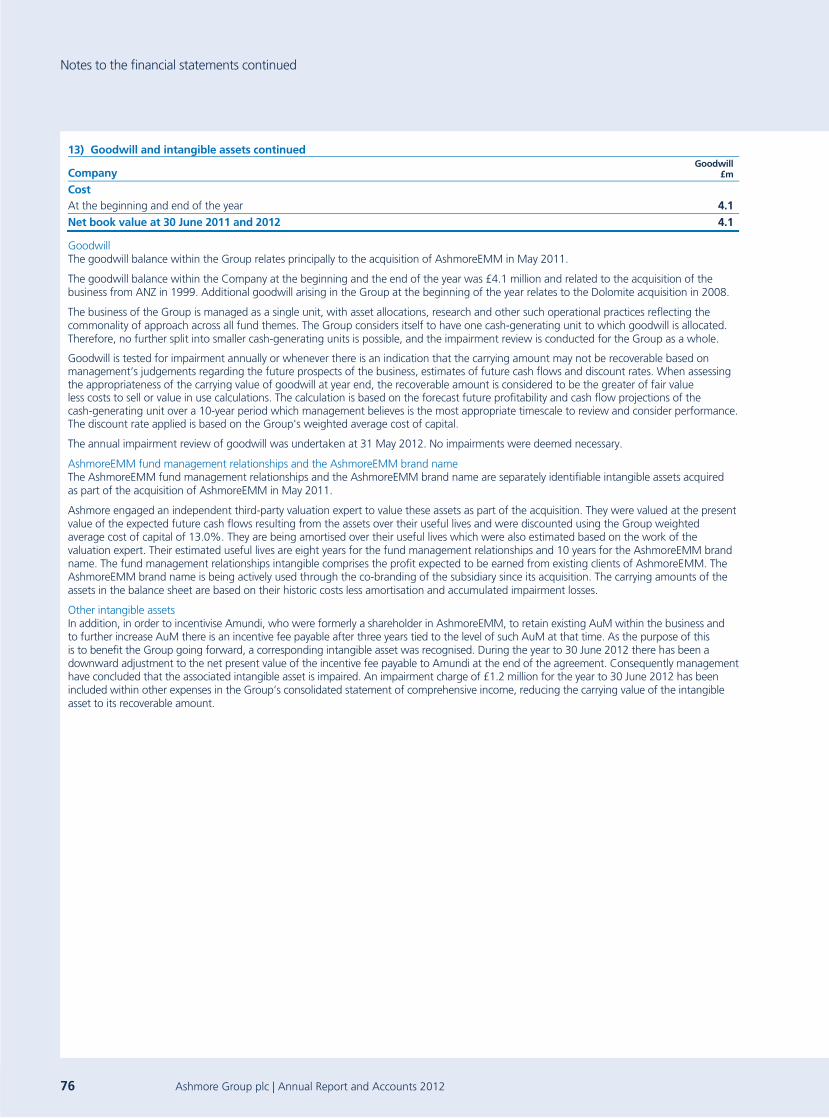
Notes to the financial statements continued
13) Goodwill and intangible assets continued
Company Goodwill
£m
Cost At the beginning and end of the year 4.1Net book value at 30 June 2011 and 2012 4.1
Goodwill The goodwill balance within the Group relates principally to the acquisition of AshmoreEMM in May 2011.
The goodwill balance within the Company at the beginning and the end of the year was £4.1 million and related to the acquisition of the business from ANZ in 1999. Additional goodwill arising in the Group at the beginning of the year relates to the Dolomite acquisition in 2008.
The business of the Group is managed as a single unit, with asset allocations, research and other such operational practices reflecting the commonality of approach across all fund themes. The Group considers itself to have one cash-generating unit to which goodwill is allocated. Therefore, no further split into smaller cash-generating units is possible, and the impairment review is conducted for the Group as a whole.
Goodwill is tested for impairment annually or whenever there is an indication that the carrying amount may not be recoverable based on management’s judgements regarding the future prospects of the business, estimates of future cash flows and discount rates. When assessing the appropriateness of the carrying value of goodwill at year end, the recoverable amount is considered to be the greater of fair value less costs to sell or value in use calculations. The calculation is based on the forecast future profitability and cash flow projections of the cash-generating unit over a 10-year period which management believes is the most appropriate timescale to review and consider performance. The discount rate applied is based on the Group's weighted average cost of capital.
The annual impairment review of goodwill was undertaken at 31 May 2012. No impairments were deemed necessary.
AshmoreEMM fund management relationships and the AshmoreEMM brand name The AshmoreEMM fund management relationships and the AshmoreEMM brand name are separately identifiable intangible assets acquired as part of the acquisition of AshmoreEMM in May 2011.
Ashmore engaged an independent third-party valuation expert to value these assets as part of the acquisition. They were valued at the present value of the expected future cash flows resulting from the assets over their useful lives and were discounted using the Group weighted average cost of capital of 13.0%. They are being amortised over their useful lives which were also estimated based on the work of the valuation expert. Their estimated useful lives are eight years for the fund management relationships and 10 years for the AshmoreEMM brand name. The fund management relationships intangible comprises the profit expected to be earned from existing clients of AshmoreEMM. The AshmoreEMM brand name is being actively used through the co-branding of the subsidiary since its acquisition. The carrying amounts of the assets in the balance sheet are based on their historic costs less amortisation and accumulated impairment losses.
Other intangible assets In addition, in order to incentivise Amundi, who were formerly a shareholder in AshmoreEMM, to retain existing AuM within the business and to further increase AuM there is an incentive fee payable after three years tied to the level of such AuM at that time. As the purpose of this is to benefit the Group going forward, a corresponding intangible asset was recognised. During the year to 30 June 2012 there has been a downward adjustment to the net present value of the incentive fee payable to Amundi at the end of the agreement. Consequently management have concluded that the associated intangible asset is impaired. An impairment charge of £1.2 million for the year to 30 June 2012 has been included within other expenses in the Group’s consolidated statement of comprehensive income, reducing the carrying value of the intangible asset to its recoverable amount.
76 Ashmore Group plc | Annual Report and Accounts 2012
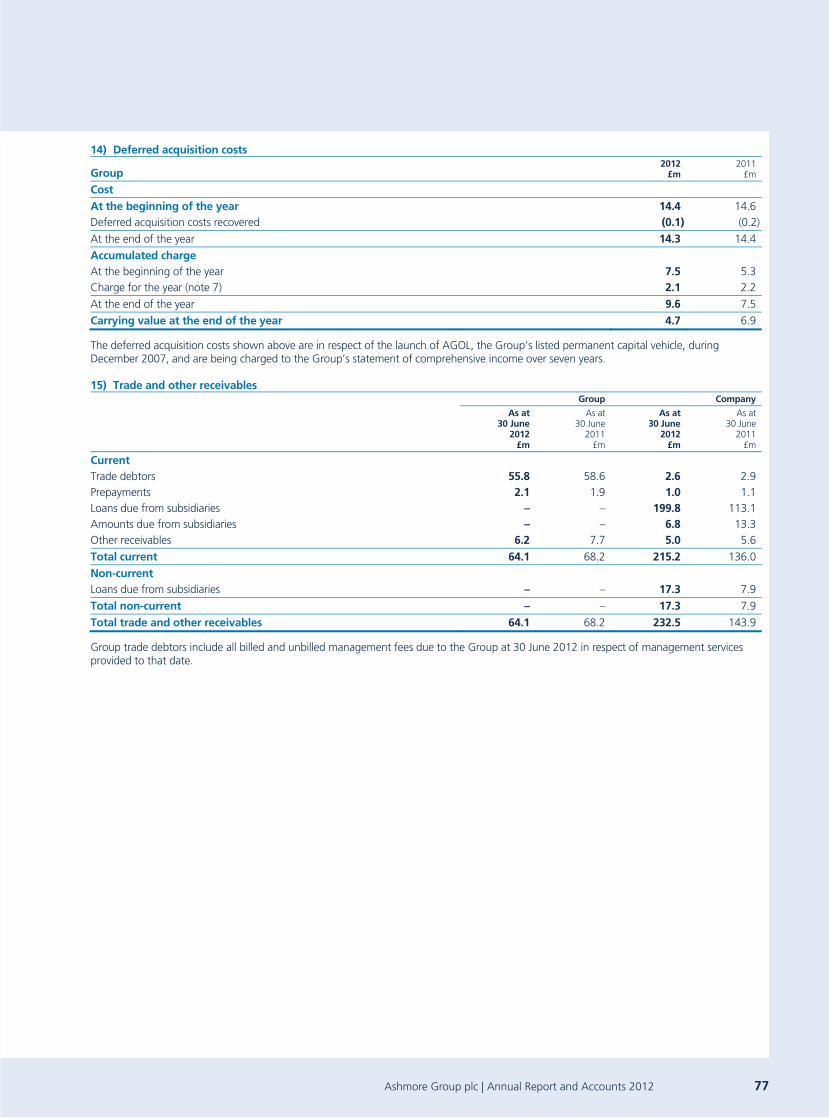
14) Deferred acquisition costs
Group 2012
£m 2011
£m
Cost At the beginning of the year 14.4 14.6Deferred acquisition costs recovered (0.1) (0.2)
At the end of the year 14.3 14.4
Accumulated charge At the beginning of the year 7.5 5.3Charge for the year (note 7) 2.1 2.2
At the end of the year 9.6 7.5
Carrying value at the end of the year 4.7 6.9
The deferred acquisition costs shown above are in respect of the launch of AGOL, the Group’s listed permanent capital vehicle, during December 2007, and are being charged to the Group’s statement of comprehensive income over seven years.
15) Trade and other receivables Group Company
As at30 June
2012£m
As at 30 June
2011 £m
As at30 June
2012£m
As at30 June
2011£m
Current Trade debtors 55.8 58.6 2.6 2.9Prepayments 2.1 1.9 1.0 1.1Loans due from subsidiaries – – 199.8 113.1Amounts due from subsidiaries – – 6.8 13.3Other receivables 6.2 7.7 5.0 5.6
Total current 64.1 68.2 215.2 136.0
Non-current Loans due from subsidiaries – – 17.3 7.9
Total non-current – – 17.3 7.9
Total trade and other receivables 64.1 68.2 232.5 143.9
Group trade debtors include all billed and unbilled management fees due to the Group at 30 June 2012 in respect of management services provided to that date.
Ashmore Group plc | Annual Report and Accounts 2012 77

Notes to the financial statements continued
16) Deferred taxation Deferred tax assets and liabilities recognised by the Group and Company are attributable to the following:
Group
Other temporary differences
£m
Share-based payments
£m Total
£m
At 30 June 2011 (Assets) – (17.9) (17.9)Liabilities 1.6 – 1.6
Net 1.6 (17.9) (16.3)
At 30 June 2012 (Assets) (1.4) (13.7) (15.1)Liabilities 1.0 – 1.0Net (0.4) (13.7) (14.1)
Company
Other temporary differences
£m
Share-based payments
£m Total
£m
At 30 June 2011 (Assets) – (17.9) (17.9)
Net – (17.9) (17.9)
At 30 June 2012 (Assets) – (13.7) (13.7)Net – (13.7) (13.7)
Movement in temporary differences between the balance sheet dates has been reflected in equity or the statement of comprehensive income as follows:
Group
Other temporary differences
£m
Share-based payments
£m Total
£m
At 1 July 2010 1.3 (14.4) (13.1)Credited to the consolidated statement of comprehensive income – (4.1) (4.1)Charged to equity 0.3 0.6 0.9
At 30 June 2011 1.6 (17.9) (16.3)(Credited)/charged to the consolidated statement of comprehensive income (2.2) 2.5 0.3Charged to equity 0.2 1.7 1.9At 30 June 2012 (0.4) (13.7) (14.1)
Company
Other temporary differences
£m
Share-based payments
£m Total
£m
At 1 July 2010 0.2 (14.4) (14.2)Credited to the statement of comprehensive income (0.2) (4.1) (4.3)Charged to equity – 0.6 0.6
At 30 June 2011 – (17.9) (17.9)Charged to the statement of comprehensive income – 2.3 2.3Charged to equity – 1.9 1.9At 30 June 2012 – (13.7) (13.7)
A reduction to the main rate of UK corporation tax from 26% to 24% was substantively enacted on 26 March 2012 and became effective from 1 April 2012. The rate reduction is reflected in the value of deferred tax assets and liabilities included in the figures above. The 2012 Budget on 21 March 2012 announced that the UK corporation tax rate is set to reduce further to 22% by 2014.
Whilst a reduction to a rate of 22% has not yet been substantively enacted, a further reduction to a rate of 23% (effective from 1 April 2013) was substantively enacted on 3 July 2012. The overall effect of a further tax reduction from 24% to 23%, if applied to the deferred tax balance above as at 30 June 2012, would be to further decrease the Group deferred tax assets by approximately £0.6 million and the Company deferred tax assets by £0.6 million.
78 Ashmore Group plc | Annual Report and Accounts 2012
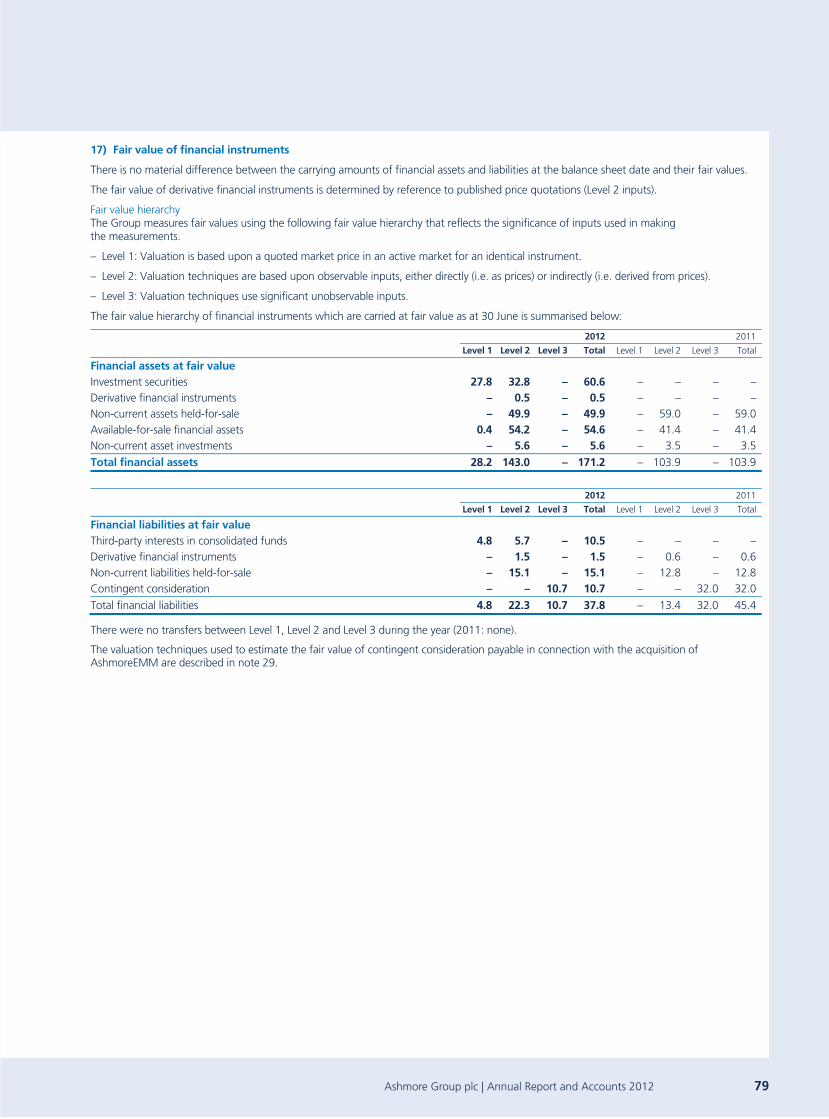
17) Fair value of financial instruments
There is no material difference between the carrying amounts of financial assets and liabilities at the balance sheet date and their fair values.
The fair value of derivative financial instruments is determined by reference to published price quotations (Level 2 inputs).
Fair value hierarchy The Group measures fair values using the following fair value hierarchy that reflects the significance of inputs used in making the measurements.
– Level 1: Valuation is based upon a quoted market price in an active market for an identical instrument.
– Level 2: Valuation techniques are based upon observable inputs, either directly (i.e. as prices) or indirectly (i.e. derived from prices).
– Level 3: Valuation techniques use significant unobservable inputs.
The fair value hierarchy of financial instruments which are carried at fair value as at 30 June is summarised below:
2012 2011
Level 1 Level 2 Level 3 Total Level 1 Level 2 Level 3 Total
Financial assets at fair value Investment securities 27.8 32.8 – 60.6 – – – –Derivative financial instruments – 0.5 – 0.5 – – – –Non-current assets held-for-sale – 49.9 – 49.9 – 59.0 – 59.0Available-for-sale financial assets 0.4 54.2 – 54.6 – 41.4 – 41.4Non-current asset investments – 5.6 – 5.6 – 3.5 – 3.5
Total financial assets 28.2 143.0 – 171.2 – 103.9 – 103.9
2012 2011
Level 1 Level 2 Level 3 Total Level 1 Level 2 Level 3 Total
Financial liabilities at fair value Third-party interests in consolidated funds 4.8 5.7 – 10.5 – – – –Derivative financial instruments – 1.5 – 1.5 – 0.6 – 0.6Non-current liabilities held-for-sale – 15.1 – 15.1 – 12.8 – 12.8Contingent consideration – – 10.7 10.7 – – 32.0 32.0
Total financial liabilities 4.8 22.3 10.7 37.8 – 13.4 32.0 45.4
There were no transfers between Level 1, Level 2 and Level 3 during the year (2011: none).
The valuation techniques used to estimate the fair value of contingent consideration payable in connection with the acquisition of AshmoreEMM are described in note 29.
Ashmore Group plc | Annual Report and Accounts 2012 79

Notes to the financial statements continued
18) Seed capital investments a) Non-current assets and non-current liabilities held-for-sale Where Group companies inject seed capital into funds operated and controlled by the Group, the fund is classified as being held-for-sale.
2012
£m 2011
£m
Non-current assets held-for-sale 49.9 59.0Non-current liabilities held-for-sale (15.1) (12.8)
Seed capital classified as being held-for-sale 34.8 46.2
Typically, if the fund remains under the control of the Group for more than one year from the original investment date it will cease to be classified as held-for-sale, and will be consolidated line by line after considering the proximity of loss of control, and the extent to which consolidation of the fund on a line by line basis would be material to the presentation of the Group’s financial statements.
Investments cease to be classified as held-for-sale when they are no longer controlled by the Group. A loss of control may happen either through sale of the investment and/or dilution of the Group’s holding. When investments cease to be classified as held-for-sale they are classified as available-for-sale financial assets in accordance with IAS 39 (see below).
b) Consolidated funds Consolidated funds represent seed capital investments where the Group has held its position for a period greater than one year and its interest represents a controlling stake in the fund. These funds are consolidated line by line.
2012
£m 2011
£m
Investment securities 60.6 –Cash and cash equivalents 2.6 –Net derivative financial instruments 0.3Other 0.9 –Third-party interests in consolidated funds (10.5) –
Consolidated seed capital 53.9 –
Investment securities include listed and unlisted equities and debt securities. Other includes trade receivables, trade payables and accruals.
Included within the consolidated statement of comprehensive income is a net gain of £0.5 million (FY2010/11: £nil) relating to the Group’s share of the results of the individual statements of comprehensive income for each of the consolidated funds. This is made up of finance income of £1.3 million partially offset by a £0.4 million loss on investment securities and by £0.4 million allocated to third-party interests in consolidated funds.
As of 30 June 2012, the Group’s consolidated funds were domiciled in Brazil, Luxembourg and the USA.
c) Available-for-sale financial assets Investments at fair value
2012
£m 2011
£m
Equities – listed 0.4 –Equity funds – unlisted 3.0 7.5Debt funds – unlisted 51.2 33.9
Seed capital classified as being available-for-sale 54.6 41.4
d) Non-current asset investments
2012
£m 2011
£m
Non-current asset investments at fair value 5.6 3.5
Non-current asset investments relate to the Group’s holding in closed-end funds and are classified as financial assets at fair value through profit or loss. Fair value is assessed by taking account of the extent to which potential dilution of gains or losses may arise as a result of additional investors subscribing to the fund where the final close of a fund has not occurred.
Included within finance income is £0.7 million of unrealised gains on the Group’s non-current asset investments.
80 Ashmore Group plc | Annual Report and Accounts 2012
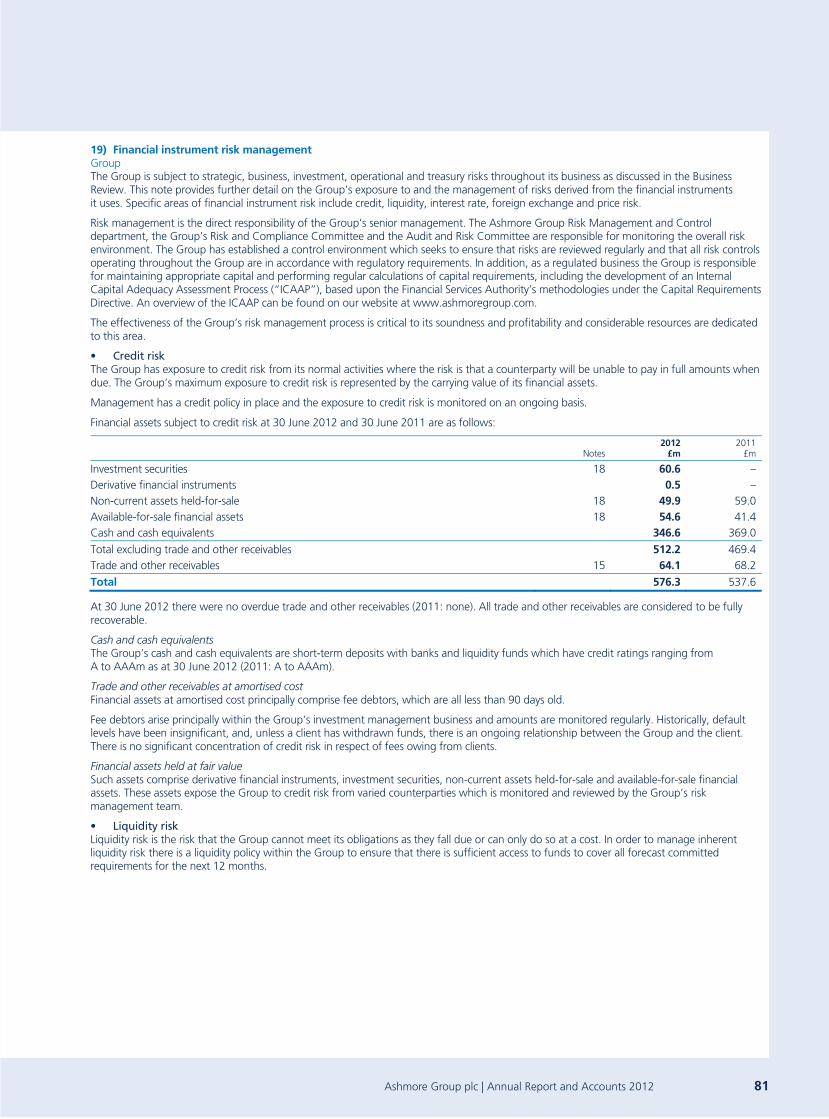
19) Financial instrument risk management Group The Group is subject to strategic, business, investment, operational and treasury risks throughout its business as discussed in the Business Review. This note provides further detail on the Group’s exposure to and the management of risks derived from the financial instruments it uses. Specific areas of financial instrument risk include credit, liquidity, interest rate, foreign exchange and price risk.
Risk management is the direct responsibility of the Group’s senior management. The Ashmore Group Risk Management and Control department, the Group’s Risk and Compliance Committee and the Audit and Risk Committee are responsible for monitoring the overall risk environment. The Group has established a control environment which seeks to ensure that risks are reviewed regularly and that all risk controls operating throughout the Group are in accordance with regulatory requirements. In addition, as a regulated business the Group is responsible for maintaining appropriate capital and performing regular calculations of capital requirements, including the development of an Internal Capital Adequacy Assessment Process (“ICAAP”), based upon the Financial Services Authority’s methodologies under the Capital Requirements Directive. An overview of the ICAAP can be found on our website at www.ashmoregroup.com.
The effectiveness of the Group’s risk management process is critical to its soundness and profitability and considerable resources are dedicated to this area.
• Credit risk The Group has exposure to credit risk from its normal activities where the risk is that a counterparty will be unable to pay in full amounts when due. The Group’s maximum exposure to credit risk is represented by the carrying value of its financial assets.
Management has a credit policy in place and the exposure to credit risk is monitored on an ongoing basis.
Financial assets subject to credit risk at 30 June 2012 and 30 June 2011 are as follows:
Notes 2012
£m 2011
£m
Investment securities 18 60.6 –Derivative financial instruments 0.5 –Non-current assets held-for-sale 18 49.9 59.0Available-for-sale financial assets 18 54.6 41.4Cash and cash equivalents 346.6 369.0
Total excluding trade and other receivables 512.2 469.4Trade and other receivables 15 64.1 68.2
Total 576.3 537.6
At 30 June 2012 there were no overdue trade and other receivables (2011: none). All trade and other receivables are considered to be fully recoverable.
Cash and cash equivalents The Group’s cash and cash equivalents are short-term deposits with banks and liquidity funds which have credit ratings ranging from A to AAAm as at 30 June 2012 (2011: A to AAAm).
Trade and other receivables at amortised cost Financial assets at amortised cost principally comprise fee debtors, which are all less than 90 days old.
Fee debtors arise principally within the Group’s investment management business and amounts are monitored regularly. Historically, default levels have been insignificant, and, unless a client has withdrawn funds, there is an ongoing relationship between the Group and the client. There is no significant concentration of credit risk in respect of fees owing from clients.
Financial assets held at fair value Such assets comprise derivative financial instruments, investment securities, non-current assets held-for-sale and available-for-sale financial assets. These assets expose the Group to credit risk from varied counterparties which is monitored and reviewed by the Group’s risk management team.
• Liquidity risk Liquidity risk is the risk that the Group cannot meet its obligations as they fall due or can only do so at a cost. In order to manage inherent liquidity risk there is a liquidity policy within the Group to ensure that there is sufficient access to funds to cover all forecast committed requirements for the next 12 months.
Ashmore Group plc | Annual Report and Accounts 2012 81

Notes to the financial statements continued
19) Financial instrument risk management continued The maturity profile of the Group’s contractual undiscounted financial liabilities is as follows:
As at 30 June 2012: Liability maturity date (£m)
<1 year 1-5 years >5years Total
Third-party interests in consolidated funds 10.5 – – 10.5Derivative financial instruments 1.5 – – 1.5Non-current liabilities held-for-sale 15.1 – – 15.1Trade and other payables 85.7 – – 85.7Non-current trade and other payables – 7.2 – 7.2Total financial liabilities 112.8 7.2 – 120.0As at 30 June 2011:
Liability maturity date (£m)
<1 year 1-5 years >5years Total
Third-party interests in consolidated funds – – – –Derivative financial instruments 0.6 – – 0.6Non-current liabilities held-for-sale 12.8 – – 12.8Trade and other payables 94.9 – – 94.9Non-current trade and other payables – 21.4 – 21.4
Total financial liabilities 108.3 21.4 – 129.7
Details on leases and other commitments are provided in notes 24 and 27.
• Interest rate risk Interest rate risk is the risk that the fair value or future cash flows of financial instruments will fluctuate because of changes in market interest rates.
The principal interest rate risk is the risk that the Group will sustain a reduction in interest revenue through adverse movements in interest rates. This relates to bank deposits held in the ordinary course of business. This exposure is monitored by management on a continuing basis.
At 30 June 2012, if interest rates over the year had been 50 basis points higher or 50 basis points lower (2011: 200 basis points higher or 40 basis points lower) with all other variables held constant, post-tax profit for the year would have been £1.7 million higher/£1.7 million lower (2011: £7.5 million higher/£1.5 million lower), mainly as a result of higher/lower interest on cash balances.
The assumption that the fair value of assets and liabilities will not be affected by a change in interest rates was used in the model to calculate the effect on post-tax profits.
Effective interest rates applicable to financial instruments are as follows:
Year ended30 June
2012%
Year ended30 June
2011%
Deposits with banks and liquidity funds 0.79 0.40
Year ended30 June
2012£m
Year ended30 June
2011£m
Items repricing within one year or less: Deposits with banks and liquidity funds 346.6 369.0
The Group is also exposed to interest rate risk through debt securities held in consolidated seed funds. The following table provides a summary of fixed and floating rate interest exposures in these funds: As at 30 June 2012:
Fixed rate
£m Floating rate
£m Other
£m Total
£m
Financial assets Investment securities 43.4 3.7 13.5 60.6Total 43.4 3.7 13.5 60.6
No seed investment funds were consolidated on a line by line basis as at 30 June 2011.
82 Ashmore Group plc | Annual Report and Accounts 2012

• Foreign exchange risk Foreign exchange risk is the risk that the fair value or future cash flows of financial instruments will fluctuate because of changes in foreign exchange rates.
The Group’s revenue is almost entirely denominated in US dollars, whilst the majority of the Group’s cost are Sterling-based. Consequently, the Group has an exposure to movements in the US$/£ exchange rate. In addition, the Group operates globally which means that it may enter into contracts and other arrangements denominated in local currencies in various geographic areas.
The Group’s policy is to hedge significant foreign exchange exposures by using a combination of forward foreign exchange contracts and/or options for up to two years forward. The Group also sells US dollars at spot rates when opportunities arise.
The Group’s financial assets and liabilities are denominated in the following currencies:
As at 30 June 2012:
Notes Sterling
£m US dollar
£m Brazilian Real
£m Other
£m Total
£m
Financial assets Investment securities 18 0.3 8.9 21.8 29.6 60.6Derivative financial instruments – 0.5 – – 0.5Non-current assets held-for-sale 18 – 49.9 – – 49.9Available-for-sale financial assets 18 – 54.6 – – 54.6Trade and other receivables 15 8.7 52.4 1.5 1.5 64.1Cash and cash equivalents 239.3 100.8 1.3 5.2 346.6Total financial assets 248.3 267.1 24.6 36.3 576.3
Notes Sterling
£m US dollar
£m Brazilian Real
£m Other
£m Total
£m
Financial liabilities Third-party interests in consolidated funds 18 – 1.5 3.7 5.3 10.5Derivative financial instruments – 1.5 – – 1.5Non-current liabilities held-for-sale 18 – 15.1 – – 15.1Trade and other payables 23 45.8 39.6 0.5 1.2 87.1Non-current trade and other payables 23 – 5.8 – – 5.8Total financial liabilities 45.8 63.5 4.2 6.5 120.0
As at 30 June 2011:
Notes Sterling
£m US dollar
£m Brazilian Real
£m Other
£m Total
£m
Financial assets Non-current assets held-for-sale 18 – 41.4 17.6 – 59.0Available-for-sale financial assets 18 – 41.4 – – 41.4Trade and other receivables 15 10.5 54.6 1.7 1.4 68.2Cash and cash equivalents 302.0 63.9 – 3.1 369.0
Total financial assets 312.5 201.3 19.3 4.5 537.6
Notes Sterling
£m US dollar
£m Brazilian Real
£m Other
£m Total
£m
Financial liabilities Derivative financial instruments – 0.6 – – 0.6Non-current liabilities held-for-sale 18 – 7.1 5.7 – 12.8Trade and other payables 23 46.8 47.2 – 0.9 94.9Non-current trade and other payables 23 – 21.4 – – 21.4
Total financial liabilities 46.8 76.3 5.7 0.9 129.7
At 30 June 2012, if the US dollar had strengthened/weakened by 10 cents against Sterling with all other variables held constant, profit before tax for the year would have increased/decreased by £7.4 million/£6.5 million respectively (2011: £3.5million/£3.1 million).
The Group also holds a number of seed capital investments which are denominated mainly in either US dollars or Brazilian Real. Any such seed investments give rise to foreign exchange risk.
At 30 June 2012, if the Brazilian Real, US dollar and other currencies had, in aggregate, strengthened/weakened by one per cent against Sterling with all other variables held constant, the impact on net assets as a result of the Group’s seed capital positions would have been an increase/decrease of £1.4 million/£1.4 million (2011: £0.9 million/£0.9million). The impact on profit before tax would have been an increase/decrease of £0.5 million/£0.5 million (2011: £nil).
Ashmore Group plc | Annual Report and Accounts 2012 83

Notes to the financial statements continued
19) Financial instrument risk management continued • Price risk Price risk is the risk that the fair value or future cash flows of financial instruments will fluctuate because of market changes.
The Group’s direct exposure to price risk is primarily in respect of seed capital investments. Seed capital interests classified as available-for-sale or non-current asset investments are held at fair value and are directly impacted by market price movements whilst those classified as held-for-sale or investment securities, derivative financial instruments and other assets and liabilities expose the Group to market changes indirectly either through line by line consolidation of underlying financial performance and positions or potential impairments when fair value less costs to sell are less than carrying amounts.
At 30 June 2012, a 5% movement in the fair value of these investments would have had a £7.3 million (2011: £4.4 million) impact on net assets. The impact on profit before tax would have been £3.3 million (2011: nil).
There is also indirect price risk in connection with the Group’s management fees which are based on a percentage of value of AuM and fees based on performance. Movements in market prices, exchange and interest rates could cause the AuM to fluctuate which in turn could affect fees earned. However, these fees are diversified across a range of investment themes and are not measurably correlated to any single market indices in Emerging Markets. Based on the year end assets under management of US$63.7 billion, and the year’s average net management fee rate of 74bps, a 5% movement in assets under management would have a US$23.6 million impact on management fee revenues (2011: based on assets under management of $65.8 billion and an average net management fee rate of 80bps, a 5% movement in assets under management would have had a US$26.3 million impact on management fee revenues). Performance fee revenues could be reduced in severe market conditions, however, throughout Ashmore’s history the policy of having funds with year ends staged throughout the financial year has meant that in periods of steep market decline, some performance fees have still been recorded. The profitability impact is likely to be less than this, as cost mitigation actions would apply, including the reduction of the variable compensation paid to employees.
• Hedging activities The Group uses forward exchange contracts and options to hedge its exposure to foreign currency risk. These hedges protect a proportion of the Group’s revenue cash flows from foreign exchange movements and occur consistently throughout the year.
The options and forward contracts have been assessed as effective cash flow hedges as at 30 June 2012. When hedges are assessed as effective, intrinsic value gains and losses are initially recognised in other comprehensive income and later reclassified to comprehensive income as the corresponding hedged cash flows crystallise. A £0.1 million intrinsic gain (2011: £0.1 million loss) on the Group’s hedges has been recognised through other comprehensive income and no intrinsic value (2011: £nil) was reclassified from equity to the statement of comprehensive income in the year. The cumulative fair value of the outstanding foreign exchange hedges liability at 30 June 2012 was £1.3 million (2011: £0.6 million) and is included within the Group’s derivative financial instrument liabilities.
Time value in relation to the Group’s hedges is excluded from being part of the hedging item and, as a result, the net unrealised loss related to the time value of the hedges is recognised in the consolidated statement of comprehensive income for the year.
Included within the realised and unrealised hedging gains of £0.1 million (note 4) recognised at 30 June 2012 (£1.8 million gain at 30 June 2011) are:
– a £0.5 million loss in respect of foreign exchange hedges covering net management fee income for the financial year ending 30 June 2013 (2011: £1.3 million gain in respect of foreign exchange hedges covering net management fee income for the financial year ended 30 June 2012); and
– a £0.6 million gain in respect of crystallised foreign exchange contracts (2011: £0.5 million gain).
84 Ashmore Group plc | Annual Report and Accounts 2012

The maturity profile of the Group’s outstanding hedges is shown below.
As at 30 June 2012: Notional amount with maturity date (£m)
Within 6 months 6 – 12 months >12 months Total
Foreign exchange option collars 34.3 30.2 9.3 73.8Forward contracts 13.6 13.6 3.1 30.3Total foreign exchange hedges 47.9 43.8 12.4 104.1
As at 30 June 2011: Notional amount with maturity date (£m)
Within 6 months 6 – 12 months >12 months Total
Foreign exchange option collars 36.8 35.5 24.0 96.3Forward contracts 14.6 13.7 9.3 37.6
Total foreign exchange hedges 51.4 49.2 33.3 133.9
2012 2011
Notional amount
£m
Fair value assets/(liabilities)
£m
Notionalamount
£m
Fair valueassets/(liabilities)
£m
Cash flow hedges Foreign exchange nil cost option collars 73.8 (0.7) 96.3 0.1Foreign exchange forward contracts 30.3 (0.6) 37.6 (0.7)
Total foreign exchange hedges 104.1 (1.3) 133.9 (0.6)
• Capital management Equity, as referred to in the Group’s balance sheet, is the capital for the business. There are no other assets managed which are considered capital of the Group. As referred to above, the Group monitors its regulatory capital in order to meet the financial resources requirements of the Financial Services Authority.
Company The risk management processes of the Company are aligned with those of the Group as a whole. The Company’s specific risk exposures are explained below.
• Credit risk The Company has exposure to credit risk from its normal activities where the risk is that a counterparty will be unable to pay in full amounts when due. The Company’s maximum exposure to credit risk is represented by the carrying value of its financial assets.
Financial assets subject to credit risk as at 30 June 2012 are as follows:
Note 2012
£m 2011
£m
Financial assets Trade and other receivables 15 232.5 143.9Cash and cash equivalents 210.6 231.2
Total financial assets 443.1 375.1
At 30 June 2012 there were nil overdue trade and other receivables (2011: none). All trade and other receivables are considered to be fully recoverable.
The Company’s cash and cash equivalents are short-term deposits with banks or liquidity funds which have credit ratings ranging from A to AAAm as at 30 June 2012 (2011: A to AAAm).
• Liquidity risk Liquidity risk is the risk that the Company cannot meet its obligations as they fall due or can only do so at a cost. The liquidity policy is to ensure that the Company has sufficient access to funds to cover all forecast committed requirements for the next 12 months.
Ashmore Group plc | Annual Report and Accounts 2012 85
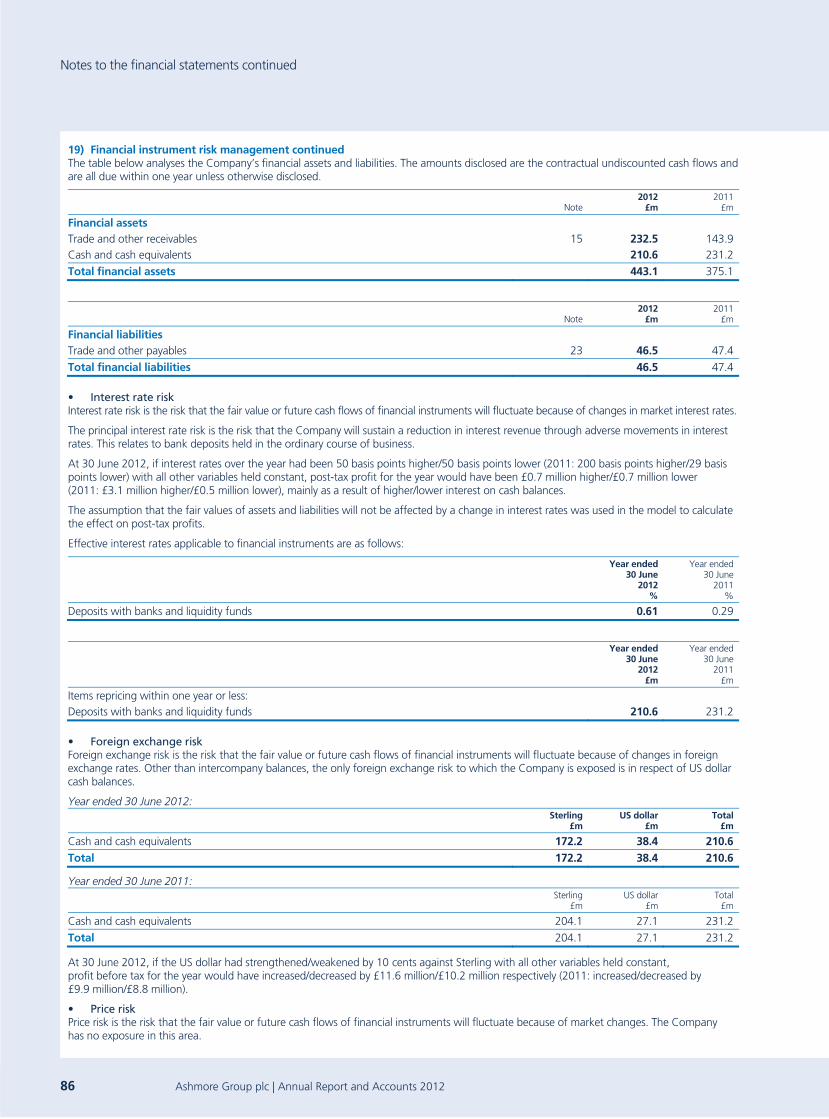
Notes to the financial statements continued
19) Financial instrument risk management continued The table below analyses the Company’s financial assets and liabilities. The amounts disclosed are the contractual undiscounted cash flows and are all due within one year unless otherwise disclosed.
Note 2012
£m 2011
£m
Financial assets Trade and other receivables 15 232.5 143.9Cash and cash equivalents 210.6 231.2
Total financial assets 443.1 375.1
Note 2012
£m 2011
£m
Financial liabilities Trade and other payables 23 46.5 47.4
Total financial liabilities 46.5 47.4
• Interest rate risk Interest rate risk is the risk that the fair value or future cash flows of financial instruments will fluctuate because of changes in market interest rates.
The principal interest rate risk is the risk that the Company will sustain a reduction in interest revenue through adverse movements in interest rates. This relates to bank deposits held in the ordinary course of business.
At 30 June 2012, if interest rates over the year had been 50 basis points higher/50 basis points lower (2011: 200 basis points higher/29 basis points lower) with all other variables held constant, post-tax profit for the year would have been £0.7 million higher/£0.7 million lower (2011: £3.1 million higher/£0.5 million lower), mainly as a result of higher/lower interest on cash balances.
The assumption that the fair values of assets and liabilities will not be affected by a change in interest rates was used in the model to calculate the effect on post-tax profits.
Effective interest rates applicable to financial instruments are as follows:
Year ended30 June
2012%
Year ended30 June
2011%
Deposits with banks and liquidity funds 0.61 0.29
Year ended30 June
2012£m
Year ended30 June
2011£m
Items repricing within one year or less: Deposits with banks and liquidity funds 210.6 231.2
• Foreign exchange risk Foreign exchange risk is the risk that the fair value or future cash flows of financial instruments will fluctuate because of changes in foreign exchange rates. Other than intercompany balances, the only foreign exchange risk to which the Company is exposed is in respect of US dollar cash balances.
Year ended 30 June 2012:
Sterling
£m US dollar
£m Total
£m
Cash and cash equivalents 172.2 38.4 210.6Total 172.2 38.4 210.6
Year ended 30 June 2011:
Sterling
£m US dollar
£m Total
£m
Cash and cash equivalents 204.1 27.1 231.2
Total 204.1 27.1 231.2
At 30 June 2012, if the US dollar had strengthened/weakened by 10 cents against Sterling with all other variables held constant, profit before tax for the year would have increased/decreased by £11.6 million/£10.2 million respectively (2011: increased/decreased by £9.9 million/£8.8 million).
• Price risk Price risk is the risk that the fair value or future cash flows of financial instruments will fluctuate because of market changes. The Company has no exposure in this area.
86 Ashmore Group plc | Annual Report and Accounts 2012
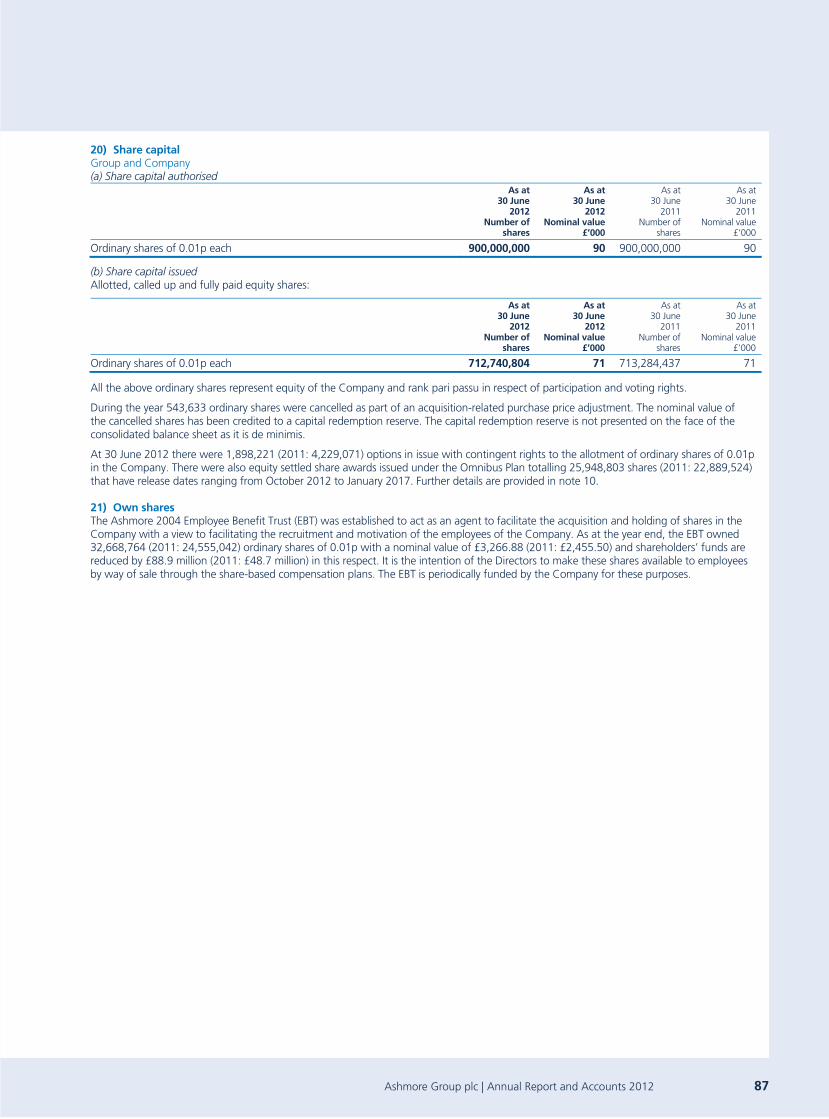
20) Share capital Group and Company (a) Share capital authorised
As at30 June
2012Number of
shares
As at 30 June
2012 Nominal value
£’000
As at30 June
2011Number of
shares
As at30 June
2011Nominal value
£’000
Ordinary shares of 0.01p each 900,000,000 90 900,000,000 90
(b) Share capital issued Allotted, called up and fully paid equity shares:
As at30 June
2012 Number of
shares
As at 30 June
2012 Nominal value
£’000
As at30 June
2011Number of
shares
As at30 June
2011Nominal value
£’000
Ordinary shares of 0.01p each 712,740,804 71 713,284,437 71
All the above ordinary shares represent equity of the Company and rank pari passu in respect of participation and voting rights.
During the year 543,633 ordinary shares were cancelled as part of an acquisition-related purchase price adjustment. The nominal value of the cancelled shares has been credited to a capital redemption reserve. The capital redemption reserve is not presented on the face of the consolidated balance sheet as it is de minimis.
At 30 June 2012 there were 1,898,221 (2011: 4,229,071) options in issue with contingent rights to the allotment of ordinary shares of 0.01p in the Company. There were also equity settled share awards issued under the Omnibus Plan totalling 25,948,803 shares (2011: 22,889,524) that have release dates ranging from October 2012 to January 2017. Further details are provided in note 10.
21) Own shares The Ashmore 2004 Employee Benefit Trust (EBT) was established to act as an agent to facilitate the acquisition and holding of shares in the Company with a view to facilitating the recruitment and motivation of the employees of the Company. As at the year end, the EBT owned 32,668,764 (2011: 24,555,042) ordinary shares of 0.01p with a nominal value of £3,266.88 (2011: £2,455.50) and shareholders’ funds are reduced by £88.9 million (2011: £48.7 million) in this respect. It is the intention of the Directors to make these shares available to employees by way of sale through the share-based compensation plans. The EBT is periodically funded by the Company for these purposes.
Ashmore Group plc | Annual Report and Accounts 2012 87

Notes to the financial statements continued
22) Treasury shares
Treasury shares held by Ashmore Group plc 2012
£m 2011
£m
Ashmore Group plc ordinary shares 6.9 6.9
Number Number
Ashmore Group plc ordinary shares 5,368,331 5,368,331
Reconciliation of treasury shares Number Number
At the beginning of the year 5,368,331 5,368,331Purchase of own shares – –
At the end of the year 5,368,331 5,368,331
Market value of treasury shares £m £m
Ashmore Group plc 18.7 21.4
23) Trade and other payables
GroupAs at
30 June2012
£m
Group As at
30 June 2011
£m
CompanyAs at
30 June2012
£m
CompanyAs at
30 June2011
£m
Current Trade and other payables 29.6 27.7 26.3 27.6Accruals and deferred income 52.6 55.5 18.4 19.1Amounts due to subsidiaries – – 1.8 0.7Contingent consideration 4.9 11.7 – –
Total current 87.1 94.9 46.5 47.4
Non-current Contingent consideration 5.8 20.3 – –Other non-current liabilities – 1.1 – –
Total non-current 5.8 21.4 – –
Total trade and other payables 92.9 116.3 46.5 47.4
88 Ashmore Group plc | Annual Report and Accounts 2012

Contingent consideration The Group’s contingent consideration liabilities comprise amounts payable in future periods subject to achievement of agreed milestone targets by the relevant maturity dates of 31 May 2012, 2013 and 2014. Of the total contingent consideration liability of £10.7 million, £4.9 million is considered to be payable in less than one year and is classified as a current liability. The remaining £5.8 million is payable after a period greater than 12 months and is classified as a non-current liability.
The movement of contingent consideration during the year is shown below:
Contingent consideration
£m
At 30 June 2010 –Liabilities arising on acquisition of subsidiary 28.1Liabilities arising on the purchase of intangible assets 2.6Net present value discount unwind 0.5FX revaluation 0.8
At 30 June 2011 32.0Net present value discount unwind 4.1Fair value adjustment (16.8)Consideration that crystallised during the year (9.5)FX revaluation 0.9At 30 June 2012 10.7
The contingent consideration payable following the acquisition of AshmoreEMM was adjusted at the end of the period, in line with accounting standards, to reflect its fair value. Such a movement in fair value is driven principally by the levels of equities AuM managed by AshmoreEMM at 30 June 2012, compared with the levels forecast when the fair values of the contingent consideration liabilities were established on the completion date and retested at the end of the previous financial year. The reduction in equities AuM – principally through negative investment performance in line with the falls in global equity indices – created a fall in the fair value of the contingent consideration.
The fall in the fair value of the Group’s contingent consideration liabilities at 30 June 2012 resulted in a downward adjustment to the 30 June 2012 closing balance of £16.8 million (2011: £nil). The reduction of the discounted liability, reported within finance income, reflects a reduction in the Group’s expected payments as a result of performance against contingent consideration milestones to date.
The potential undiscounted value of all future payments that the Group could be required to make under contingent consideration arrangements is between nil and a maximum of £65.3 million/US$102.5 million (2011: nil and £86.7 million/US$139.1 million). The fair value of the contingent consideration was calculated by reference to possible scenarios, weighted according to management’s estimates of their probabilities and discounted using the Group’s weighted average cost of capital of 13.0%. The scenarios and assumptions are therefore reviewed on a regular basis to assess the potential sensitivities and impact on the Group. The undiscounted value of the estimated payments was £12.5 million/US$19.7 million (2011: £37.9 million/US$ 60.9 million). At maturity, contingent consideration will be settled using a combination of cash and new Ashmore ordinary shares at the prevailing market price. Ashmore has the option to pay up to £3.0 million/US$4.7 million (2011: £8.6 million/US$13.8 million) of the current estimate of the undiscounted contingent consideration amount that will ultimately become payable as equity.
The discount applied to the contingent consideration will unwind until the time when the final payment is made in May 2014.
Ashmore Group plc | Annual Report and Accounts 2012 89

Notes to the financial statements continued
24) Leases Operating leases The Group has entered into certain property leases. The leases have no escalation clauses or renewal or purchase options, and no restrictions imposed on them.
The obligations under these non-cancellable operating leases fall due as follows:
Group
As at30 June
2012£m
As at30 June
2011£m
Within one year 2.9 2.9Over one year but not more than five years 9.2 6.5Over five years 7.9 8.6
Total 20.0 18.0
Company
As at30 June
2012£m
As at30 June
2011£m
Within one year 1.2 1.2Over one year but not more than five years 4.6 4.6Over five years 7.5 8.6
Total 13.3 14.4
25) Subsidiaries and associates Company
Investment in subsidiaries
As at30 June
2012£m
As at30 June
2011 £m
Cost 20.1 20.1
There were no significant movements in the year.
Ashmore Group plc is the ultimate parent company of the Group.
The directly held subsidiary of the parent company is as follows:
Country of incorporation/formation and principal
place of operation
As at30 June
2012% owned
Ashmore Investments (UK) Limited England 100.00
90 Ashmore Group plc | Annual Report and Accounts 2012
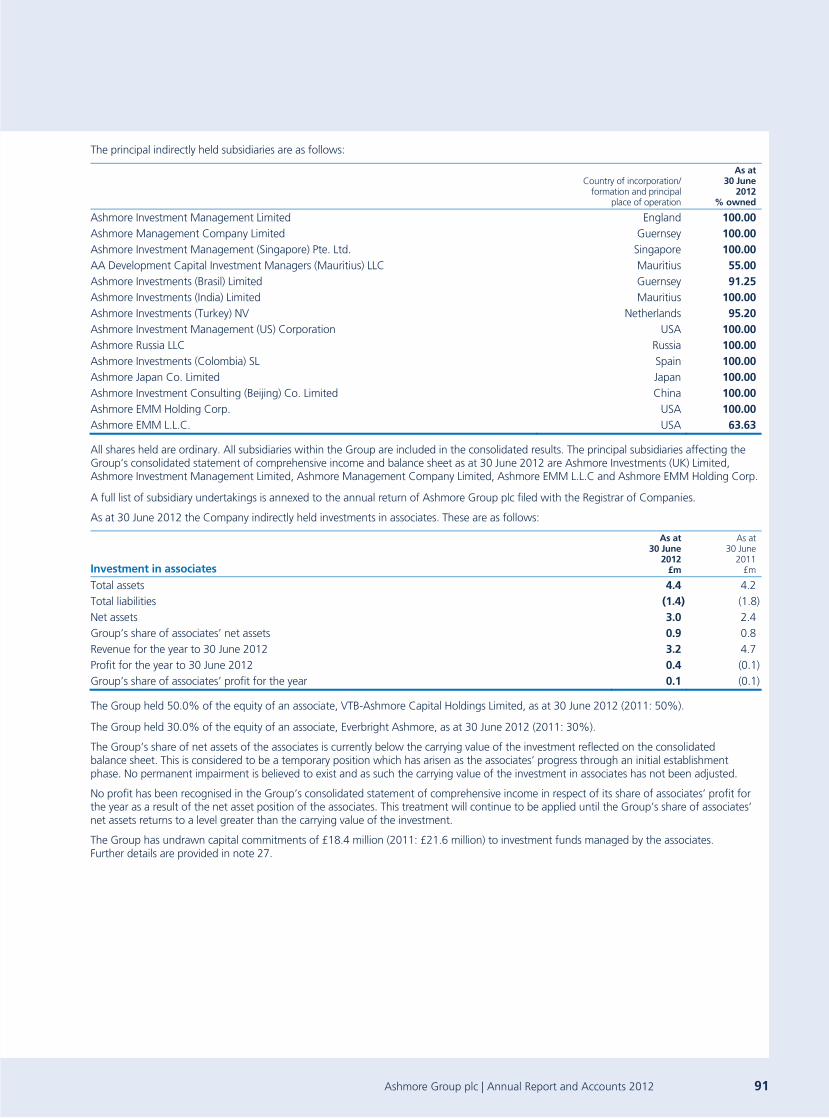
The principal indirectly held subsidiaries are as follows:
Country of incorporation/formation and principal
place of operation
As at30 June
2012% owned
Ashmore Investment Management Limited England 100.00Ashmore Management Company Limited Guernsey 100.00Ashmore Investment Management (Singapore) Pte. Ltd. Singapore 100.00AA Development Capital Investment Managers (Mauritius) LLC Mauritius 55.00Ashmore Investments (Brasil) Limited Guernsey 91.25Ashmore Investments (India) Limited Mauritius 100.00Ashmore Investments (Turkey) NV Netherlands 95.20Ashmore Investment Management (US) Corporation USA 100.00Ashmore Russia LLC Russia 100.00Ashmore Investments (Colombia) SL Spain 100.00Ashmore Japan Co. Limited Japan 100.00Ashmore Investment Consulting (Beijing) Co. Limited China 100.00Ashmore EMM Holding Corp. USA 100.00Ashmore EMM L.L.C. USA 63.63
All shares held are ordinary. All subsidiaries within the Group are included in the consolidated results. The principal subsidiaries affecting the Group’s consolidated statement of comprehensive income and balance sheet as at 30 June 2012 are Ashmore Investments (UK) Limited, Ashmore Investment Management Limited, Ashmore Management Company Limited, Ashmore EMM L.L.C and Ashmore EMM Holding Corp.
A full list of subsidiary undertakings is annexed to the annual return of Ashmore Group plc filed with the Registrar of Companies.
As at 30 June 2012 the Company indirectly held investments in associates. These are as follows:
Investment in associates
As at30 June
2012£m
As at30 June
2011£m
Total assets 4.4 4.2 Total liabilities (1.4) (1.8)Net assets 3.0 2.4Group’s share of associates’ net assets 0.9 0.8Revenue for the year to 30 June 2012 3.2 4.7Profit for the year to 30 June 2012 0.4 (0.1) Group’s share of associates’ profit for the year 0.1 (0.1)
The Group held 50.0% of the equity of an associate, VTB-Ashmore Capital Holdings Limited, as at 30 June 2012 (2011: 50%).
The Group held 30.0% of the equity of an associate, Everbright Ashmore, as at 30 June 2012 (2011: 30%).
The Group’s share of net assets of the associates is currently below the carrying value of the investment reflected on the consolidated balance sheet. This is considered to be a temporary position which has arisen as the associates’ progress through an initial establishment phase. No permanent impairment is believed to exist and as such the carrying value of the investment in associates has not been adjusted.
No profit has been recognised in the Group’s consolidated statement of comprehensive income in respect of its share of associates’ profit for the year as a result of the net asset position of the associates. This treatment will continue to be applied until the Group’s share of associates’ net assets returns to a level greater than the carrying value of the investment.
The Group has undrawn capital commitments of £18.4 million (2011: £21.6 million) to investment funds managed by the associates. Further details are provided in note 27.
Ashmore Group plc | Annual Report and Accounts 2012 91

Notes to the financial statements continued
26) Related party transactions Transactions with key management personnel – Group and Company Related party transactions are in respect of relationships with key management personnel. The compensation of key management personnel was as follows:
Year ended30 June
2012£m
Year ended30 June
2011£m
Short-term employee benefits 2.7 6.0Share-based payment benefits 2.6 2.3
Total 5.3 8.3
Share-based payment benefits represents the fair value charge to the statement of comprehensive income of share awards.
Details of the remuneration of Directors are given in the Remuneration Report on pages 46 to 53.
During the year, there were no other transactions entered into with key management personnel (2011: one transaction).
Transactions with subsidiaries – Company Details of transactions between the Company and its subsidiaries, which are related parties of the Company, are shown below:
Year ended30 June
2012£m
Year ended30 June
2011£m
Management fees received 65.4 76.6Net dividends received 194.8 170.0
As at30 June
2012£m
As at30 June
2011£m
Due from subsidiaries Loans 217.1 121.0Other 6.8 13.3
Due to subsidiaries Other 1.8 0.7
Transactions with Ashmore Funds Group During the year, the Group received £270.4 million gross management fees and performance fees (2011: £397.3 million) from the 72 funds (30 June 2011: 81 funds) it manages and which are classified as related parties. As at 30 June the Group has receivables due from funds of £50.3 million (2011: £41.5 million).
Transactions with the Ashmore Employee Benefit Trust (EBT) – Group and Company The EBT, which acts as an agent for the purpose of the employee share-based compensation plans, has been provided a loan facility to allow it to acquire Ashmore shares in order to satisfy outstanding unvested shares. The EBT is included within the results of the Group and the Company. As at year end the loan outstanding was £82.7 million (2011: £43.2million).
Transaction with the Ashmore Foundation – Group and Company The Ashmore Foundation is a related party to the Group. The foundation was set up to provide financial grants to worthwhile causes within the Emerging Markets geographies in which Ashmore operates with a view to putting something back into the countries and communities in which the Group invests and which contribute to Ashmore’s income and profitability. There were no related party transactions with the foundation during the year (2011: none).
27) Capital commitments Group Company
Undrawn investment commitments 2012
£m 2011
£m 2012
£m 2011
£m
VTBC-Ashmore Real Estate Partners I, L.P. 3.4 5.0 – –Everbright Ashmore China Real Estate Fund 6.2 16.6 – –Ashmore I – FCP Colombia Infrastructure Fund 8.8 9.7 – –
The Company has undrawn loan commitments to other Group entities totalling £18.4 million (2011: £31.3 million) to support their investment activities.
28) Post-balance sheet events There were no post-balance sheet events that required adjustment of or disclosure in the financial statements for the year ended 30 June 2012.
92 Ashmore Group plc | Annual Report and Accounts 2012
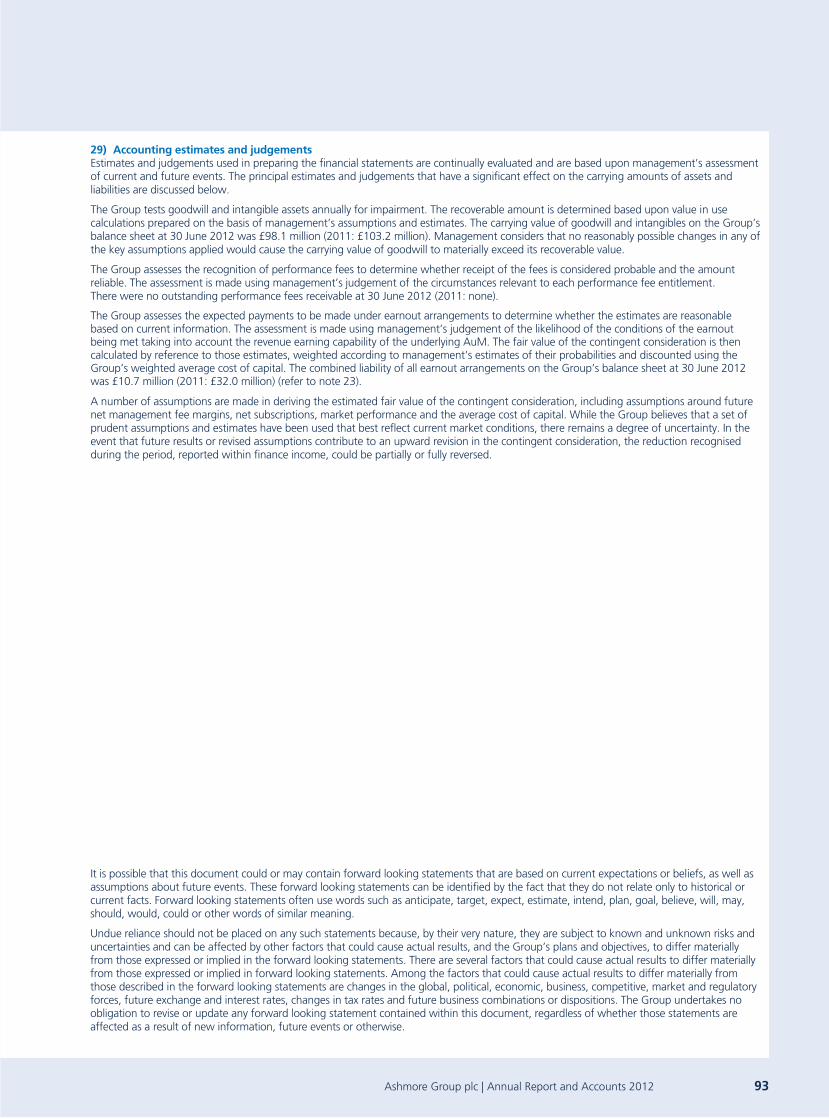
29) Accounting estimates and judgements Estimates and judgements used in preparing the financial statements are continually evaluated and are based upon management’s assessment of current and future events. The principal estimates and judgements that have a significant effect on the carrying amounts of assets and liabilities are discussed below.
The Group tests goodwill and intangible assets annually for impairment. The recoverable amount is determined based upon value in use calculations prepared on the basis of management’s assumptions and estimates. The carrying value of goodwill and intangibles on the Group’s balance sheet at 30 June 2012 was £98.1 million (2011: £103.2 million). Management considers that no reasonably possible changes in any of the key assumptions applied would cause the carrying value of goodwill to materially exceed its recoverable value.
The Group assesses the recognition of performance fees to determine whether receipt of the fees is considered probable and the amount reliable. The assessment is made using management’s judgement of the circumstances relevant to each performance fee entitlement. There were no outstanding performance fees receivable at 30 June 2012 (2011: none).
The Group assesses the expected payments to be made under earnout arrangements to determine whether the estimates are reasonable based on current information. The assessment is made using management’s judgement of the likelihood of the conditions of the earnout being met taking into account the revenue earning capability of the underlying AuM. The fair value of the contingent consideration is then calculated by reference to those estimates, weighted according to management’s estimates of their probabilities and discounted using the Group’s weighted average cost of capital. The combined liability of all earnout arrangements on the Group’s balance sheet at 30 June 2012 was £10.7 million (2011: £32.0 million) (refer to note 23).
A number of assumptions are made in deriving the estimated fair value of the contingent consideration, including assumptions around future net management fee margins, net subscriptions, market performance and the average cost of capital. While the Group believes that a set of prudent assumptions and estimates have been used that best reflect current market conditions, there remains a degree of uncertainty. In the event that future results or revised assumptions contribute to an upward revision in the contingent consideration, the reduction recognised during the period, reported within finance income, could be partially or fully reversed.
It is possible that this document could or may contain forward looking statements that are based on current expectations or beliefs, as well as assumptions about future events. These forward looking statements can be identified by the fact that they do not relate only to historical or current facts. Forward looking statements often use words such as anticipate, target, expect, estimate, intend, plan, goal, believe, will, may, should, would, could or other words of similar meaning.
Undue reliance should not be placed on any such statements because, by their very nature, they are subject to known and unknown risks and uncertainties and can be affected by other factors that could cause actual results, and the Group’s plans and objectives, to differ materially from those expressed or implied in the forward looking statements. There are several factors that could cause actual results to differ materially from those expressed or implied in forward looking statements. Among the factors that could cause actual results to differ materially from those described in the forward looking statements are changes in the global, political, economic, business, competitive, market and regulatory forces, future exchange and interest rates, changes in tax rates and future business combinations or dispositions. The Group undertakes no obligation to revise or update any forward looking statement contained within this document, regardless of whether those statements are affected as a result of new information, future events or otherwise.
Ashmore Group plc | Annual Report and Accounts 2012 93

Five-year summary
2008
£m 2009
£m 2010
£m 2011
£m 2012
£m
Management fees 186.7 186.8 192.1 250.9 302.6Performance fees 44.7 52.5 82.9 85.4 25.4Other revenue 10.1 6.4 6.4 6.5 6.2Total revenue 241.5 245.7 281.4 342.8 334.2Distribution costs (4.7) (3.6) (2.2) (1.6) (3.7)Foreign exchange 3.2 (38.6) 7.0 (7.4) 2.8Net revenue 240.0 203.5 286.2 333.8 333.3Loss on investment securities – – – – (0.4)Change in third-party interests in consolidated funds – – – – (0.4)Personnel expenses (7.4) (11.5) (12.8) (15.3) (23.6)Variable compensation (40.3) (24.5) (46.0) (56.2) (49.4)Other operating expenses (11.1) (16.9) (18.1) (22.9) (34.4)Total operating expenses (58.8) (52.9) (76.9) (94.4) 108.2Operating profit 181.2 150.6 209.3 239.4 225.1Finance income 15.0 9.2 7.9 6.5 18.1Profit before tax 196.2 159.8 217.2 245.9 243.2Tax expense (55.2) (44.3) (56.6) (55.7) (57.5)Profit for the year 141.0 115.5 160.6 190.2 185.7
EPS (basic) 21.0p 17.1p 23.9p 28.1p 26.8p Other operating data (unaudited) AuM at period end (US$bn) 37.5 24.9 35.3 65.8 63.7AuM at period end (£bn) 18.8 15.1 23.6 41.0 40.6Average AuM (£bn) 17.7 17.3 19.8 29.0 40.2Average £/US$ exchange rate for the year 2.01 1.60 1.58 1.59 1.59Period end £/US$ exchange rate for the year 1.99 1.65 1.49 1.61 1.57
94 Ashmore Group plc | Annual Report and Accounts 2012

Information for Shareholders
Ashmore Group plc Registered in England and Wales. Company No. 3675683
Registered office 61 Aldwych London WC2B 4AE Tel: +44 (0) 20 3077 6000 Fax: +44 (0) 20 3077 6001
Principal UK trading subsidiary Ashmore Investment Management Limited
Registered in England and Wales, Company No. 3344281.
Business address and registered office as above.
Further information on Ashmore Group plc can be found on the Company’s website: www.ashmoregroup.com.
Financial calendar Announcement of results for year ended 30 June 2012 11 September 2012 First quarter interim management statement 11 October 2012 Annual General Meeting 31 October 2012 Ex-dividend date 7 November 2012 Record date 9 November 2012 Final dividend payment date 7 December 2012 Second quarter AuM statement January 2013 Announcement of unaudited interim results for the six months ended 31 December 2012 February 2013 Third quarter interim management statement April 2013 Announcement of results for the year ended 30 June 2013 September 2013
Registrar Equiniti Registrars Aspect House Spencer Road West Sussex BN99 6DA
UK shareholder helpline: 0871 384 2812 (Calls to this number cost 8p per minute from a BT landline, other providers’ costs may vary. Lines are open 8.30am to 5.30pm, Monday to Friday.)
International shareholder helpline: +44 121 415 7047
Further information about the Registrar is available on their website www.equiniti.com.
Up-to-date information about current holdings on the register is also available at www.shareview.co.uk.
Shareholders will need their reference number (account number) and postcode to view information on their own holding.
.
Share price information Share price information can be found at www.ashmoregroup.com or through your broker.
Share dealing Shares may be sold through a stockbroker or share dealing service. There are a variety of services available. Equiniti Registrars offer a secure, free and easy-to-use internet-based share dealing service known as Shareview Dealing.
You can log on at www.shareview.co.uk/dealing to access this service, or contact the helpline on 0845 603 7037 to deal by telephone.
You may also use the Shareview service to access and manage your share investments and view balance movements, indicative share prices, information on recent dividends, portfolio valuation and general information for shareholders.
Shareholders must register at www.shareview.co.uk entering the shareholder reference on the share certificate and other personal details.
Having selected a personal PIN, a user ID will be issued by the Registrar.
Electronic copies of the 2012 Annual Report and financial statements and other publications Copies of the 2012 Annual Report and financial statements, the Notice of Annual General Meeting, other corporate publications, press releases and announcements are available on the Company’s website at www.ashmoregroup.com.
Sharegift Shareholders with only a small number of shares whose value makes them uneconomic to sell may wish to consider donating to charity through Sharegift, an independent charity share donation scheme.
For further information, please contact either the Registrar or see the Sharegift website at www.sharegift.org.
Frequent shareholder enquiries Enquiries and notifications concerning dividends, share certificates or transfers and address changes should be sent to the Registrar; the Company’s governance reports, corporate governance guidelines and the terms of reference of the Board committees can be found on the Company’s website at www.ashmoregroup.com.
Notifying the Company of a change of address You should notify Equiniti Registrars in writing.
If you hold shares in joint names, the notification to change address must be signed by the first-named shareholder. You may choose to do this online, by logging on to www.shareview.co.uk. You will need your shareholder reference number to access this service – this can be found on your share certificate or from a dividend counterfoil.
You will be asked to select your own PIN and a user ID will be posted to you.
Notifying the Company of a change of name You should notify Equiniti Registrars in writing of your new name and previous name. You should attach a copy of your marriage certificate or your change of name deed, together with your share certificates and any un-cashed dividend cheques in your old name, so that the Registrar can reissue them.
Ashmore Group plc | Annual Report and Accounts 2012 95

Information for Shareholders continued
Dividend payments directly into bank or building society accounts We recommend that all dividend payments are made directly into a bank or building society account. Dividends are paid via BACS, providing tighter security and access to funds more quickly. To apply for a dividend mandate form, contact the Registrar, or you can find one by logging on to www.shareview.co.uk (under Frequently Asked Questions) or by calling the helpline on 0871 384 2812 (calls to this number cost 8p per minute from a BT landline, other providers’ costs may vary. Lines are open 8.30am to 5.30pm, Monday to Friday).
International shareholder helpline: +44 121 415 7047
Transferring Ashmore Group plc shares Transferring some or all of your shares to someone else (for example your partner or a member of your family) requires completion of a share transfer form, which is available from Equiniti Registrars. The form should be fully completed and returned with your share certificate representing at least the number of shares being transferred. The Registrar will then process the transfer and issue a balance share certificate to you if applicable. The Registrar will be able to help you with any questions you may have.
Lost share certificate(s) Shareholders who lose their share certificate(s) or have their certificate(s) stolen should inform Equiniti Registrars immediately by calling the shareholder helpline on 0871 384 2812 (calls to this number cost 8p per minute from a BT landline, other providers’ costs may vary. Lines are open 8.30am to 5.30pm, Monday to Friday).
International shareholder helpline: +44 121 415 7047
Disability helpline For shareholders with hearing difficulties a special text phone number is available: +44 (0)871 384 2255.
96 Ashmore Group plc | Annual Report and Accounts 2012

This report is printed on Hello Fat Matt paper. This paper is composed of virgin wood fibre from well-managed forests independently certified according to the rules of the Forest Stewardship Council (FSC). It is manufactured at a mill that is certified to ISO14001 and EMAS environmental standards. The mill used pulps that are elemental chlorine free (ECF) and the inks in printing this report are all vegetable-based.
Printed at Principal Colour, ISO14001, FSC certified and CarbonNeutral®
Designed and produced by Black Sun Plc

Ashmore Group plc61 AldwychLondon WC2B 4AEUnited Kingdom
www.ashmoregroup.com