annual report - dipl.nt.gov.au springs projects 21 tennant creek projects 24 katherine projects 25...
TRANSCRIPT
Annual Report
D E PA RT M E N T O F I N F R A S T R U C T U R E
2013 – 2014
Dep
artmen
t of In
frastructu
re An
nu
al Rep
ort 2013–2014

Published by the Department of Infrastructure © Northern Territory Government 2014 Apart from any use permitted under the Copyright Act, no part of this document may be reproduced without prior written permission from the Northern Territory Government through the Department of Infrastructure. ISSN: 2203 – 6091 Department of Infrastructure Highway House, Palmerston Circuit, Palmerston NT 0830PO Box 61, Palmerston NT 0831 Telephone: + 61 8 8999 5511Website: www.infrastructure.nt.gov.au
Letter to the MinisterThe Hon Peter Styles MLA Minister for Infrastructure Parliament House Darwin NT 0800
Dear Minister,
I am very pleased to present you with the annual report of the Department of Infrastructure for the financial year ended 30 June 2014. The report describes the performance and key achievements of each of the department’s output groups, as required by section 28 of the Public Sector Employment and Management Act.
I advise, to the best of my knowledge and belief, that:
a. proper records of all transactions affecting the department are kept, and employees under my control observe the provisions of the Financial Management Act, its regulations and applicable Treasurer’s Directions
b. procedures within the department afford proper internal control and a current description of such procedures is recorded in the accounting and property manual, which has been prepared in accordance with the requirements of the Financial Management Act
c. no breach of legislation or delegation, major error in, or omission from, the accounts and records exists
d. in accordance with section 15 of the Financial Management Act, I advise that as at 30 June 2014, the department had adequate internal audit capacity and the results of all internal audit matters have been reported to me
e. the financial statements included in the annual report have been prepared from proper accounts and records and in accordance with the Treasurer’s Directions
f. all Employment Instructions issued by the Commissioner for Public Employment have been satisfied.
Yours sincerely
David McHugh Chief Executive 9 October 2014
Published by the Department of Infrastructure © Northern Territory Government 2014 Apart from any use permitted under the Copyright Act, no part of this document may be reproduced without prior written permission from the Northern Territory Government through the Department of Infrastructure. ISSN: 2203 – 6091 Department of Infrastructure Highway House, Palmerston Circuit, Palmerston NT 0830PO Box 61, Palmerston NT 0831 Telephone: + 61 8 8999 5511Website: www.infrastructure.nt.gov.au
1Department of Infrastructure Annual Report 2013–2014
Purpose of the ReportThis annual report provides a record of the activities and achievements of the Department of Infrastructure and its Government Business Division for 2013–14.
It aims to inform the Legislative Assembly, Territorians and other stakeholders of:
O primary functions and responsibilities of the department
O significant activities undertaken during the year, highlighting specific achievements against budgeted outputs
O the department’s fiscal management and performance.
The department, in delivering the Northern Territory Government’s infrastructure program, is a major facilitator for achievement of the strategic priorities set by the Northern Territory Government.
The 2013–14 Annual Report is divided into five key sections. A summary of the various sections of the report is as follows:
The Agency introduces the department, its purpose, objectives and functions and provides an overview of each of the sections of the department.
Projects and Achievements provides a detailed summary of the department’s major project achievements throughout the 2013–14 period. An output performance table reports on the department’s performance in terms of the measures published in Budget Paper No. 3.
Corporate Governance outlines the department’s corporate governance arrangements including performance of the four corporate governance committees.
Our People provides an overview of the department’s people and details human resource management and fulfilment of corporate social responsibilities.
Financial Performance provides financial statements for the Department of Infrastructure and the Construction Division.
Department of Infrastructure Annual Report 2013–20142
3Department of Infrastructure Annual Report 2013–2014
ContentsLetter to the Minister 1
Purpose of the Report 2
Chief Executive’s Message 5
The Agency 6
Purpose and Role 7
Focus Priorities 7
Organisation Chart 8
Branch Functions 9
Chief Executive 9
Corporate Communications 9
Building Services 10
Civil Services 10
Housing Projects 10
Major Projects and Assurance Services 11
Corporate Services 11
Regional Services 12
Sponsorship 13
Projects and Achievements 14
Preface 15
Darwin Projects 15
Alice Springs Projects 21
Tennant Creek Projects 24
Katherine Projects 25
East Arnhem Projects 25
Performance Reporting 27
Corporate Governance 28
Preface 29
Corporate Governance Framework 30
Boards and Committees 31
Audit and Risk Management 34
Work Health and Safety 34
Legislation, Statutory Boards and Authorities 35
4 Department of Infrastructure Annual Report 2013–2014
Our People 38
Overview of Human Resource Services 39
Workforce Development 39
Worklife Balance 43
Health and Wellbeing 43
Staff Engagement, Recognition and Induction 44
CDU/NTG Partnership Agreement 46
Financial Performance 48
2013–14 Financial Statements – Department of Infrastructure 48
2013–14 Financial Statements – Construction Division 88
Abbreviations – Appendix 1 125
Chief Executive’s Message The Department of Infrastructure delivers and contributes to economic opportunities through the Northern Territory Government’s infrastructure program, delivering quality infrastructure assets across the Territory for Government departments.
In the May 2014 Budget, it was announced that the operating environment would change and the Department would be the informed purchaser and centralised construction authority responsible for delivering the Territory’s infrastructure programs.
The department is focused on delivering the Government’s infrastructure program and working with our clients and stakeholders to develop a forward works program to support a growing Territory. Developing this program will improve planning for infrastructure development, better inform government on strategic asset management and provide cost benefits for government in the future.
Over the past year the department has awarded more than 750 contracts, achieving expenditure on projects of more than $650 million, with $90 million for housing, $214 million on roads and $351 million on infrastructure across the Northern Territory, providing a consistent pipeline of work for small to medium enterprises.
The department has continued to work collaboratively with industry and the private sector on large scale infrastructure projects including the Northern Territory Government’s $495 million Secure Facility, $110 million Marine Supply Base and the $103 million extension of Tiger Brennan Drive, which has contributed to growth in the Territory’s economy.
The department’s Building Services team works collaboratively with government departments to progress projects from concepts, through design, procurement and into construction.
The department’s Civil Services team delivers the Department of Transport’s programs, which included expenditure of $90.6 million on repairs and maintenance, $5.3 million on disaster maintenance and $127 million on capital and minor new works.
The Northern Territory Government has committed to increasing Indigenous employment and engagement. The department is partnering with Indigenous Business Enterprises (IBEs) to maximise Indigenous employment in delivering infrastructure programs across the regions. A full-time Indigenous Engagement Officer has been employed to work with IBEs to help develop their capacity and capabilities.
Through the Whole of Government Procurement Reforms, local development and value adding (LDVA) requirements have been reviewed to ensure local development is a priority in the delivery of the Government’s works programs. The department continues to improve its tender assessment processes to achieve better regional local development opportunities. The department has further enhanced the LDVA questions to rationalise tender responses to achieve a regionally based LDVA response.
5Department of Infrastructure Annual Report 2013–2014
The AgencyPurpose and Role 7 Focus Priorities 7Organisation Chart 8Branch Functions 9
Chief Executive 9 Corporate Communications 9 Building Services 10 Civil Services 10 Housing Projects 10 Major Projects and Assurance Services 11 Corporate Services 11 Regional Services 12
Sponsorship 13

Purpose and RoleThe Department of Infrastructure is the lead provider of public infrastructure across the Northern Territory. The department employs staff in professional, technical and administrative positions.
Operating in alignment with the Northern Territory Government’s strategic priorities, the department’s three core functions are to:
O manage and deliver infrastructure projects ranging from capital works projects to minor new works and ongoing maintenance
O provide advice, support and expertise to allow clients to forward plan effectively for their infrastructure programs
O provide creative and innovative infrastructure delivery options to government that demonstrate value for money.
The department plays a lead role across government in disaster preparedness and recovery.
Within the department, a Government Business Division (GBD) operated on commercial principles. The GBD calls for tenders from industry for all construction work to ensure the best value for money is achieved for its clients.
The Department of Infrastructure supports local industry by providing an annual sponsorship program to help core industry associations, collaborates on training and development opportunities and fosters sustained local employment.
The department engages with industry and other key stakeholders through a wide range of forums and meetings to ensure that the key benefits of government projects managed by the department are well communicated and understood.
Focus PrioritiesNorthern Territory Government’s Strategic Priorities
O contribute to economic development by delivering works program
O preserve and protect the environment during project delivery
Stakeholder satisfaction
O action plan, communication plan and service level agreement
O value for money (capital works and repairs and maintenance)
O strong client focus
O enhance stakeholder relationships
7Department of Infrastructure Annual Report 2013–2014
Successful project outcomes
O project managers trained with certification
O set and meet commitments
O single point accountability
O communications and reporting
O third party certification for quality, safety and environmental management systems
O managing within a changing operating environment
O Indigenous employment.
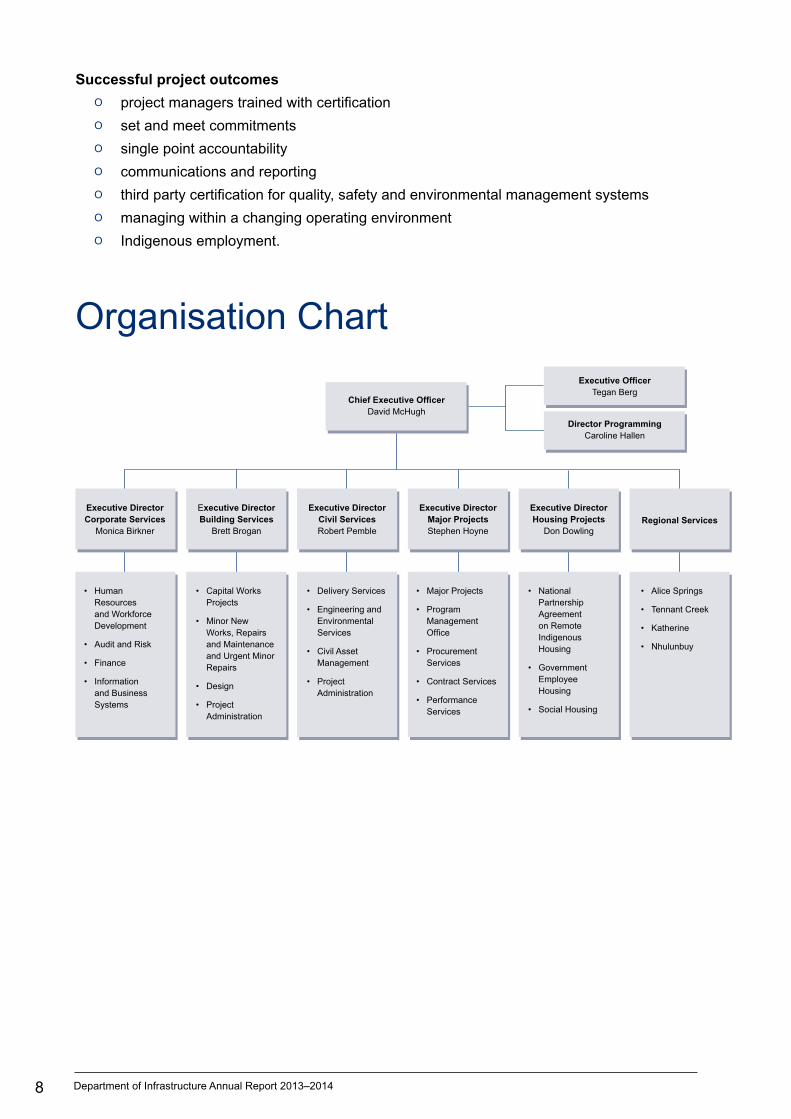
Organisation Chart
Chief Executive OfficerDavid McHugh
Executive DirectorCorporate Services
Monica Birkner
Executive DirectorBuilding Services
Brett Brogan
Executive DirectorCivil Services Robert Pemble
Executive DirectorMajor Projects Stephen Hoyne
Executive DirectorHousing Projects
Don DowlingRegional Services
Executive OfficerTegan Berg
Director ProgrammingCaroline Hallen
• Human Resources and Workforce Development
• Audit and Risk
• Finance
• Information and Business Systems
• Capital Works Projects
• Minor New Works, Repairs and Maintenance and Urgent Minor Repairs
• Design
• Project Administration
• Delivery Services
• Engineering and Environmental Services
• Civil Asset Management
• Project Administration
• Major Projects
• Program Management Office
• Procurement Services
• Contract Services
• Performance Services
• National Partnership Agreement on Remote Indigenous Housing
• Government Employee Housing
• Social Housing
• Alice Springs
• Tennant Creek
• Katherine
• Nhulunbuy
8 Department of Infrastructure Annual Report 2013–2014
Branch FunctionsChief Executive Secretariat Unit liaises between the Minister’s office and the Department of Infrastructure. The unit processes and maintains records of ministerial correspondence, provides advice on preparing, handling and procedures for ministerial, Cabinet and parliamentary documents and supports the Chief Executive and executives.
In addition the Secretariat Unit coordinates:
O Departmental Cabinet submissions
O Budget Cabinet submissions
O comments on other department Cabinet submissions
O Legislative Assembly briefings
O Estimates Committee briefings
O quarterly forecasting of Cabinet business
O Cabinet decision implementation
O election commitments.
Programming Unit is responsible for managing, reporting and advice on capital works, minor works and repairs and maintenance for most departments in the Northern Territory Government.
Corporate Communications The Department of Infrastructure’s Corporate Communications services are provided through a Communications Hub, hosted by the Department of Lands, Planning and the Environment. The hub also services the Department of Transport.
Key services provided in the past 12 months include:
O media management and ministerial liaison in relation to media and communications strategies
O media forecasting
O crisis communications and media management
O communications strategy development and implementation
O writing and some design services
O whole of government project management
O advertising production and management
O sponsorship management
O event management.
9Department of Infrastructure Annual Report 2013–2014
10
Building Services Capital and Minor New Works provides the full suite of project management services to deliver the capital and minor new works program for a range of Northern Territory Government clients. It provides the single point of client contact for program management.
Repairs and Maintenance manages the repairs and maintenance infrastructure program for Northern Territory Government clients including urgent minor repairs.
Design Office is made up of professionals in the disciplines of architecture, mechanical engineering, structural engineering and quantity surveying. It works across the department to provide fit for purpose design solutions for infrastructure projects.
Building Asset Management Systems maintains building asset information to effectively enable departments to manage property portfolios, ensuring a consistent, systematic and independent building asset management service across government.
Project Administration provides critical administrative support to the project teams.
Civil Services Delivery Services provide services to construct roads (Darwin region), bridges and transport assets for Territory-wide projects including project management for capital works, minor new works and specific maintenance programs. This group also provide support services for counter disaster planning and response within the Darwin region.
Engineering and Environmental Services provide services such as project development and planning, design and documentation, estimates, environmental management and approvals, cultural clearances, work health and safety, geotechnical services and programming for civil works throughout the Northern Territory.
Civil Asset Management ensures efficient and effective work practices are used to deliver repairs and maintenance programs for roads and transport facilities in the Darwin region. A number of specialist areas include road maintenance, road operations and inspections. The traffic group and a specialist bituminous surfacing team deliver programs in partnership with industry. This group is central to delivering counter disaster services and flood damage rectification works.
Project Administration provides critical administrative support to the project teams including managing the road reporting service.
Housing Projects National Partnership Agreement on Remote Indigenous Housing Capital Works provide the single point of client contact for the National Partnership Agreement for Remote Indigenous Housing (NPARIH) program. The group provides project management and program delivery services on the NPARIH program across the Northern Territory.
10 Department of Infrastructure Annual Report 2013–2014
11
Government Employee Housing and Social Housing Capital Works provide the single point of client contact for the Government Employee Housing (GEH) Program and Social Housing Program. It provides project management and program delivery services for the GEH and Social Housing programs across the Northern Territory.
Major Projects and Assurance Services Major Projects deliver a diverse and complex portfolio of infrastructure projects on behalf of the Northern Territory Government. Projects are assigned to Major Projects on the basis of cost, uniqueness, complexity and risk profile. The team manages projects as diverse as bridges, roads and bulk material handling to ports, public housing and land development.
Project Management Office enables the department to improve and ensure consistency in its project management services.
Procurement Services provide operational support and procurement advice to the Department of Infrastructure through tendering, evaluation and contract management processes.
Contracts Office came into existence in January 2014 and the focus includes:
O providing guidance on contractor matters and disputes
O providing mentor officers in contract management
O establishing training protocols and facilitate related courses
O reviewing contract documentation.
They provide recommendations to improve documents and reduce risks to the Northern Territory Government.
Corporate Services Finance and Office Services provides financial services, budgeting support and compliance reporting to the Department of Infrastructure to facilitate responsible financial management and ensure a standard approach to financial issues and high level corporate governance practices. Office Services provides property and facility services, fleet vehicle services, local field purchase orders and simple accounts payable activities for uniforms and personal protective equipment (PPE) purchases.
Human Resources and Workforce Development partner with business units to promote best practice human resource management and workforce development, providing high level advice and support on recruitment, case management, training and development and organisational process and policy.
Audit and Risk Management Service provides independent and objective assessments to improve the efficiency and effectiveness of governance, risk management and internal control processes within the department.
11Department of Infrastructure Annual Report 2013–2014
Information and Business Systems provides contemporary information and communication technology (ICT) solutions that meet the department’s business outcomes by using appropriate tools and techniques. They coordinate and process freedom of information and privacy requests within the legislative timeframes and ensure compliance across all government ICT directions and procedures.
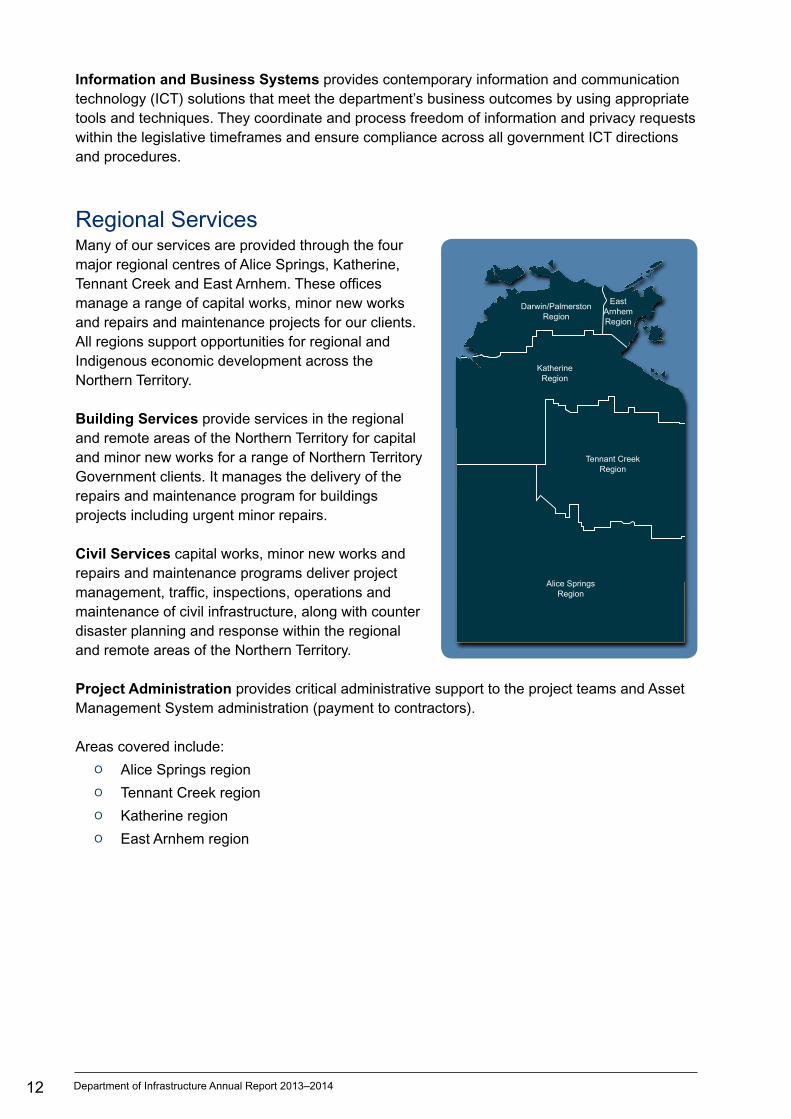
Regional Services Many of our services are provided through the four major regional centres of Alice Springs, Katherine, Tennant Creek and East Arnhem. These offices manage a range of capital works, minor new works and repairs and maintenance projects for our clients. All regions support opportunities for regional and Indigenous economic development across the Northern Territory.
Building Services provide services in the regional and remote areas of the Northern Territory for capital and minor new works for a range of Northern Territory Government clients. It manages the delivery of the repairs and maintenance program for buildings projects including urgent minor repairs.
Civil Services capital works, minor new works and repairs and maintenance programs deliver project management, traffic, inspections, operations and maintenance of civil infrastructure, along with counter disaster planning and response within the regional and remote areas of the Northern Territory.
Project Administration provides critical administrative support to the project teams and Asset Management System administration (payment to contractors).
Areas covered include:
O Alice Springs region
O Tennant Creek region
O Katherine region
O East Arnhem region
Alice Springs Region
Tennant Creek Region
Katherine Region
Darwin/PalmerstonRegion
East Arnhem Region
12 Department of Infrastructure Annual Report 2013–2014

Sponsorship The Department of Infrastructure maintains key sponsorship commitments with a focus on encouraging development across industry, training and collaboration to share knowledge and expertise.
The department supports the following organisations in recognising high achievement in the Construction Industry.
O Engineers Australia, Northern Division, Engineer Excellence Awards
O Australian Institute of Project Management NT Awards
O Civil Contractors Federation NT Earth Awards and Training Awards
O Australian Institute of Architects NT Architecture Awards
O Master Builders NT Excellence in Building and Construction Awards.
The department regularly collaborates with local and national industry groups through:
O Industry Information Sessions for civil contractors between the department and Civil Contractors Federation NT
O presenting projects at Australian Institute of Project Management information sessions
O mentoring students at Darwin High School through the Australian Institute of Architects and the department’s design group
O participating in industry association events and committees
O entering department projects in relevant awards.
Department of Infrastructure Annual Report 2013–2014 13
14 Department of Infrastructure Annual Report 2013–2014
Projects and AchievementsPreface 15Projects 15 Darwin 15 Alice Springs 21 Tennant Creek 24 Katherine 25 East Arnhem 25Performance Reporting 27

15Department of Infrastructure Annual Report 2013–2014
PrefaceThe overall purpose of the Department of Infrastructure is to ensure that the Northern Territory Government’s built assets are fit for purpose, consider life cycle costs and represent value for money.
This section reports on the department’s performance in delivering outputs and details are provided on key projects and achievements during the year.
Darwin ProjectsNT Secure Facility$495 millionOne of the largest construction projects in the Northern Territory is due to be completed in 2014.
The NT Secure Facility is being built on a 289 hectare site at Holtze, approximately 29 kilometres from Darwin city.
The facility includes a 1000-bed correctional facility, 48-bed prisoner work village and a 30-bed secure, forensic mental health and behavioural management unit.
Despite initial concerns of a labour shortage, the project has benefited from a large local workforce with 75 per cent of workers involved from the Northern Territory.
Marine Supply Base$110 millionDarwin is closer to becoming the oil and gas hub of Northern Australia with the Marine Supply Base completed at the East Arm Wharf.
The specialised facility will service existing and future oil and gas support industries and operators will function 24 hours, seven days a week to an international standard.
The facility includes a wharf, berthing and mooring facilities, vessel loading area, bulk storage, office and warehouse buildings.
A wide range of government, service and private business stakeholders were involved in the project.
NT Secure Facility
16 Department of Infrastructure Annual Report 2013–2014
Tiger Brennan DriveDinah Beach Road to Woolner Road$8.4 millionCommuters are already enjoying a quicker drive into Darwin city with the new lanes open on Tiger Brennan Drive between Dinah Beach and Woolner Road.
This stage of the duplication of the busy main arterial road into the city has had its challenges after the contract was awarded in June 2013.
The 1.4 kilometre stretch of road from Dinah Beach Road to Woolner Road experienced delays after 1800 cubic metres of acid sulphate soils were discovered during the road works.
The soil, which turns acidic once exposed to oxygen, had to be removed and treated off site, which delayed the project into the wet season. Traffic control proved another challenge with the traffic numbers on the busy city road reaching 19 000 vehicles a day.
To improve safety and access for residents and businesses in Tipperary Waters, new traffic lights and a pedestrian crossing were installed at the intersection of Tiger Brennan Road and Gonzales Drive. Turning lanes were also lengthened for the Gonzales Road intersection. To enhance the road corridor area, landscaping works and irrigation systems were installed to incorporate the Darwin Urban Arterial Landscaping Strategy.
Working after hours was restricted to reduce noise impact on nearby residents.
The two new inbound lanes were added and finished in early May 2014.
Woolner Road to Berrimah Road$88 millionThe next phase for duplicating Tiger Brennan Drive is in the design stage and once built will shave crucial minutes off the drive into town.
The design stage is nearing completion for the section between Woolner Road and Berrimah Road. This section will link up to the Tiger Brennan Drive extension, which was opened in 2010. With traffic into the city on this main arterial road reaching up to 19,000 vehicles per day, the new lanes will save even more time for city commuters.
This stage includes upgrading the existing intersections at Woolner Road and Amy Johnson Road, as well as new signalised intersections at Benison Road and Bowen Street. Access to Hidden Valley will be upgraded with an additional bridge for inbound traffic.
This stage faces some challenges, such as putting in and compacting infill over mangrove mud along the Winnellie section.

17Department of Infrastructure Annual Report 2013–2014
Royal Darwin Hospital Theatres$20 millionTwo new theatres and a short stay recovery unit are being built at the Royal Darwin Hospital as part of an upgrade to surgery services.
The new theatres will add to the capacity of the existing seven theatres and a 12-bed short stay unit will be created so nine existing beds used for recovery can be converted to Emergency Department beds. New medical stations and offices will be built to support the two new theatres.
The challenges of building in a busy, working hospital has meant construction work has to be staged to avoid disrupting operating schedules. A project team is stationed on site full time to help the job run smoothly with continual liaison with theatre staff.
Construction on the project began in July 2013 and is expected to be finished in March 2015.
Stuart Highway/Howard Springs Road/Lambrick Avenue Intersection Upgrade Including Duplication of Howard Springs Road from Whitewood Road to Stuart Highway $12.7 millionUpgrading a major intersection with Stuart Highway while two of the largest construction projects were underway nearby was a big challenge.
The project to upgrade the intersection of Howard Springs Road and the Stuart Highway initially experienced delays as water, sewerage and telecommunication services were being installed through the site to service the nearby NT Secure Facility and Manigurr-ma Village for INPEX.
To maintain access to these facilities, no traffic diversions were put in place which added to some of the delays during the project. The industry body, Civil Contractors Federation NT also played a major role by reducing the number of road trains and ensuring industry compliance.
The road works included duplicating Howard Springs Road from the Stuart Highway to Whitewood Road and upgrading the intersection with the highway and Lambrick Avenue. Additional work included creating a new access road to the Palmerston Indigenous village and moving the access road for the Howard Springs dump.
Work started on the project in August 2012 and it was finished in December 2013.
A project control group was set up to ensure good communications with all contractors on the busy site, which contributed to the success of the project.
Howard Springs intersection
18 Department of Infrastructure Annual Report 2013–2014
Resurfacing Stuart Highway, Bagot Road and Flyover and Trower Road$4.5 millionWorking on three of the busiest roads in Darwin has proved an interesting challenge.
This year the urban road rehabilitation program involved two stages. The first included resurfacing sections of the Stuart Highway, inbound and outbound from Geranium Street to Parap, near Darwin city, as well as the inbound lanes of Trower Road between Parer Drive and Rothdale Road.
The second stage included resurfacing the outbound lanes of Bagot Road from the Stuart Highway to Bagot community, as well as the Bagot Road intersection with the Stuart Highway and Bagot Flyover bridge.
The road pavement was more than 20 years old, had potholes and was starting to crack, so the roads were included in the program as a priority.
While the logistics took three months to plan, the first stage of the road works was completed in October 2013 and the second stage finished in June 2014, without a hitch. The Bagot Road intersection with the highway was resurfaced in only eight days while the Flyover was closed for 12 hours on a weekend and traffic diverted onto Stuart Highway and Dick Ward Drive.
Traffic management was a big challenge with more than 10 000 vehicles going over the Flyover and 26 000 vehicles driving down the Stuart Highway every day. The civil team worked with the communication team to ensure people were forewarned before all the road closures, which was a critical part of the works.
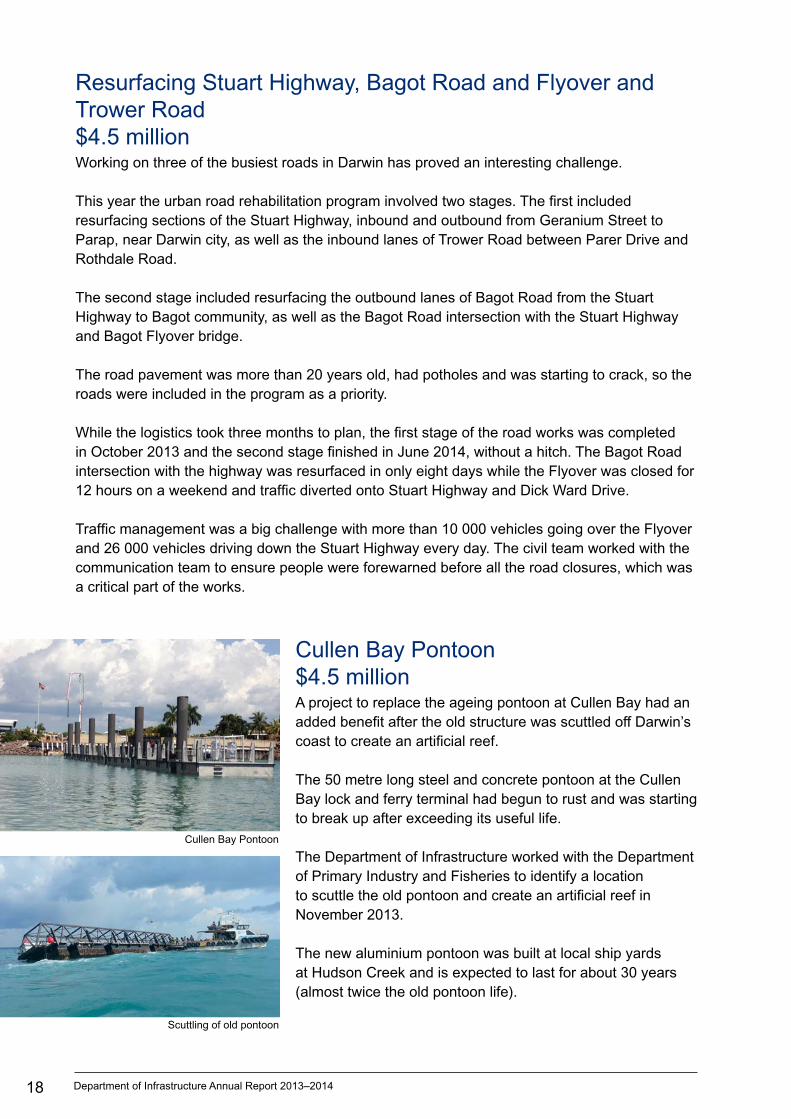
Cullen Bay Pontoon$4.5 millionA project to replace the ageing pontoon at Cullen Bay had an added benefit after the old structure was scuttled off Darwin’s coast to create an artificial reef.
The 50 metre long steel and concrete pontoon at the Cullen Bay lock and ferry terminal had begun to rust and was starting to break up after exceeding its useful life.
The Department of Infrastructure worked with the Department of Primary Industry and Fisheries to identify a location to scuttle the old pontoon and create an artificial reef in November 2013.
The new aluminium pontoon was built at local ship yards at Hudson Creek and is expected to last for about 30 years (almost twice the old pontoon life).
Cullen Bay Pontoon
Scuttling of old pontoon
19Department of Infrastructure Annual Report 2013–2014
A site was found five kilometres off Lee Point and the pontoon was towed to the location before it was sunk in 12 metres of water, where it was secured.
The new 61.5 metre long pontoon has diesel and petrol bowser facilities at the end of the pontoon, which is serviced by a key card. One of the challenges was to secure the fuel, power, water and communication services through a sliding joint that could cope with height changes caused by tides of up to eight metres.
The new pontoon provides safer access for daily commuters, school children, commercial and industrial operators.
The new ferry operator and fishing tour guides are very happy with the new facility, which was also built to accommodate an ambulance during emergencies.
Police Operations Centre $4.5 millionA new operations centre has been built for Northern Territory Police at the Peter McAulay Centre.
The facility includes a firearms training room, which is used for simulation tactical training, as well as a tactical training gym.
A new watch house was constructed with a charge counter, cells and space for breath analysis, finger printing, interview rooms and a secure entry. The technology fit-out included a Computer Simulation Training System, Cells and CCTV System.
Construction began in August 2013 and the new facility was handed over to NT Police in May 2014.
Gunbalanya Child and Family Centre$5.2 millionA new child and family centre built at a remote Top End community was designed to meet the needs of the local community and has received a great response.
The Gunbalanya Child and Family Centre is a combined child care and health centre and is designed to suit the needs of clinical staff and education purposes. The design team engaged with the community to incorporate their needs into the design, and a soft fall turtle in the playground was one of the features built at the new facility.
The new centre now caters for 60 children at the Arnhem Land community, which is 330 kilometres east of Darwin.
20 Department of Infrastructure Annual Report 2013–2014
Palmerston Child and Family Centre$4.6 millionThe growing city of Palmerston was chosen for the site of one of five new child and family centres across the Northern Territory.
Construction on the Palmerston Child and Family Centre began in December 2013 and the centre will provide 50 child care places as well as maternal and child health services, child health checks and vaccinations.
The centre was carefully designed around the separate functions of child care, education and health, with services operating independently of each other.
The building was designed to capture natural light through high level windows to reduce electricity usage.
NT Open Education Centre$12 millionThe Department of Infrastructure and Department of Education have established a Project Control Group for this project, which included a representative from INPEX who are joint funding this project.
The education centre, which is being relocated to a purpose-built facility at Darwin High School, needs to cater for a range of educational needs for students spread over a number of regional and remote communities across the Northern Territory.
Members of the design team were able to visit some of the students who study distance education through the Open Education Centre to get inspiration for the design of the secondary school facility. Further visits are planned to ensure the final design provides the best solutions for improving distance education outcomes.
The design is expected to be awarded in July 2014 with construction to start in 2015. The three-storey building will cater for 60 staff and will be built adjacent to the Darwin High School library building at Bullocky Point.
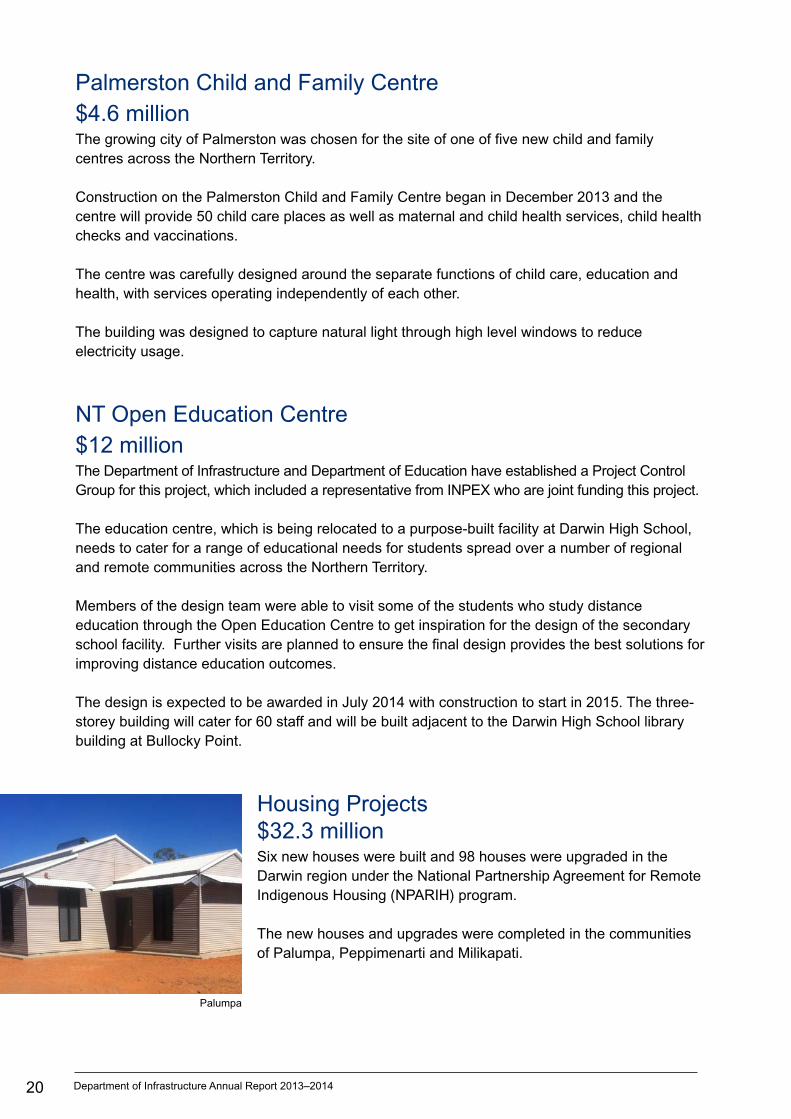
Housing Projects $32.3 millionSix new houses were built and 98 houses were upgraded in the Darwin region under the National Partnership Agreement for Remote Indigenous Housing (NPARIH) program.
The new houses and upgrades were completed in the communities of Palumpa, Peppimenarti and Milikapati.
Palumpa
21Department of Infrastructure Annual Report 2013–2014
Another 20 houses were built in the Darwin region under the Government Employee Housing (GEH) program, including new homes at Gunbalanya, Maningrida, Wadeye and Warruwi.
A total of 23 houses were built under the Public Housing program including six new houses in Darwin and 17 new homes were built in Palmerston.
Alice Springs ProjectsRailway Overpass$24 millionA railway overpass is being designed to increase safety and ease traffic flows on the Stuart Highway near Alice Springs.
The overpass will be constructed on the highway over an existing rail crossing 12 kilometres south of the town, towards the airport.
The rail overpass is being designed to improve road safety by reducing the risk of crashes and improve traffic flow on the Stuart Highway, which is the main road leading to the Central Australian town. It is also a major corridor for heavy vehicle traffic between the Northern Territory and South Australia.
Once designed, construction on the project is expected to begin in July 2014 and is scheduled to be finished in June 2015. A 40.3 metre long bridge will be built as part of the project, with 700 metre approaches constructed on either side of the bridge.
Due to the heavy use of the road, a two lane road detour will be built around the site to allow a smooth flow of traffic during the 42-week construction period. Some of the challenges include finding enough soil to build up the embankments and building a temporary rail crossing for vehicles along the detour alignment.
Red Centre Way$4.6 millionThe Red Centre Way in Central Australia is complete with the last section on Namatjira Drive now sealed.
The Red Centre Way is an 1 135 kilometre tourist drive out of Alice Springs, which takes in West MacDonnell Ranges, Watarrka/Kings Canyon and Uluru-Kata Tjuta National Park.
Challenges with re-sealing the last remaining six kilometre section of road included the location of sacred sites and trees and land tenure in the area.
22 Department of Infrastructure Annual Report 2013–2014
The road works were on Namatjira Drive, west of Alice Springs near the communities of Hermannsburg, Papunya and Areyonga. Work on the project began in June 2013 and was completed in December 2013.
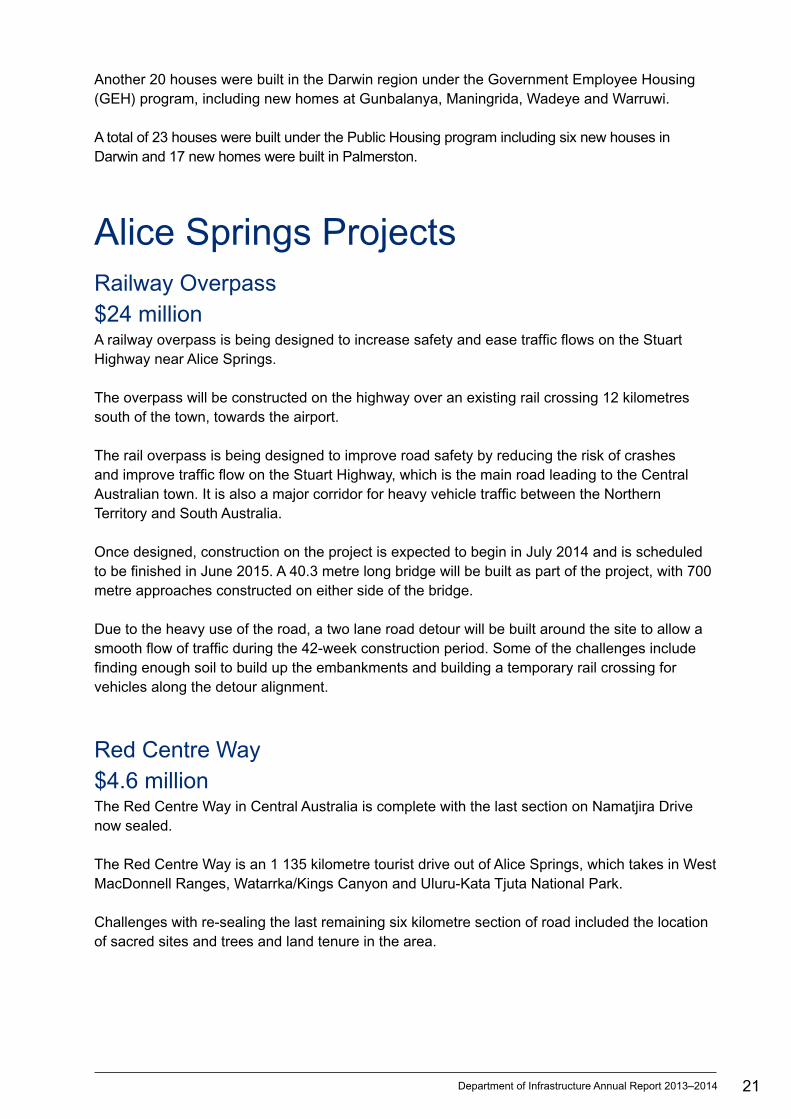
ANZAC Oval$3 millionWorking within a tight timeframe to refurbish and expand a sporting venue used by local clubs was a big challenge in Alice Springs.
With a count down on for the NRL pre-season match between the Parramatta Eels and Wests Tigers at ANZAC Oval, there was a 30-week timeframe to upgrade the facility before the big game on 8 February 2014.
The project included building new grandstands to seat 500 spectators, kiosk, VIP area and renovate the club house, change rooms and administration centre. The venue had to be shut down during the project, but it was opened in time for the popular NRL match.
Alice Springs Youth and Community Centre$2.5 million People of all ages are enjoying new community facilities in Central Australia after the Alice Springs Youth and Community Centre was expanded.
A new multipurpose hall, administration centre, refurbished entry, forecourt, links to the existing car park and landscaping were included in the project, which was finished in January 2014.
A new gymnasium was relocated to the centre, which is now called the Agnes East Gymnasium after one of the founders of the youth centre, and features a huge 12 metre by 12 metre spring floor.
Green Well Building$3 millionA new central office was created for several Northern Territory Government departments in Alice Springs after the Green Well Building was refurbished.
ANZAC Oval
Department of Infrastructure Annual Report 2013–2014 23
Four tenants of the Greatorex Building were relocated to the new central office on Bath Street.
The design challenge included incorporating the different needs of the Department of Infrastructure, Department of Transport, Department of Business and Department of Lands, Planning and Environment.
Each department had its own office requirements and a front counter with public access was designed for the Department of Lands, Planning and Environment and Territory Business Office. A number of interview rooms were also set up on the ground floor to be used by all tenants.
After the complex design brief was satisfied, there was a tight construction timeframe of only seven weeks to complete the refurbishment.
Sealing Tanami Road$2 millionA key road that services many remote communities as well as the tourism and mining industries in Central Australia was being sealed.
Work started on the 3.2 kilometre section of the Tanami Road, west of Alice Springs, near the remote community of Yuendumu in May 2013, and was finished in December 2013.
The weather proved challenging for the project as part of this section of the Tanami Road is below the natural surface and flooded during the wet season.
Housing Projects $8.2 millionNew houses were built and existing houses upgraded in three remote communities in the Alice Springs region under the NPARIH program.
Eleven new homes were built and 80 homes upgraded in the three communities of Papunya, Pmara Jutunta and Ampilatwatja.
The GEH program saw seven new homes built in Arlparra, Harts Range and Yuendumu in the Alice Springs region.
24 Department of Infrastructure Annual Report 2013–2014
Tennant Creek ProjectsTruck Bay and Fatigue Project – Stuart and Barkly Highways $2.4 millionTravelling along two of the Northern Territory’s major highways just got easier for truck drivers after a truck bay and fatigue management program was completed.
The project saw specialised truck bays built on the roadside which included concrete pads to cater for transportable weigh bridges, slip lanes so trucks can enter and exit the new truck bays, and sealed and compacted parking areas.
Five of the truck bays were built to offer a safer refuge for drivers who need to stop for a rest or check their vehicle. Two of the bays were built on the Barkly Highway and three were built in the northern section of the Stuart Highway between Elliott and Tennant Creek.
Combined with roadhouses, the truck bays mean truck drivers now get the opportunity to rest in a safe area every 100 kilometres, rather than driving for hundreds of kilometres to find a sturdy area of road verge to pull off on.
Construction began on the bays in April 2013 and finished in June 2014, with the work also including an upgrade to the Barkly Homestead intersection on the Barkly Highway.
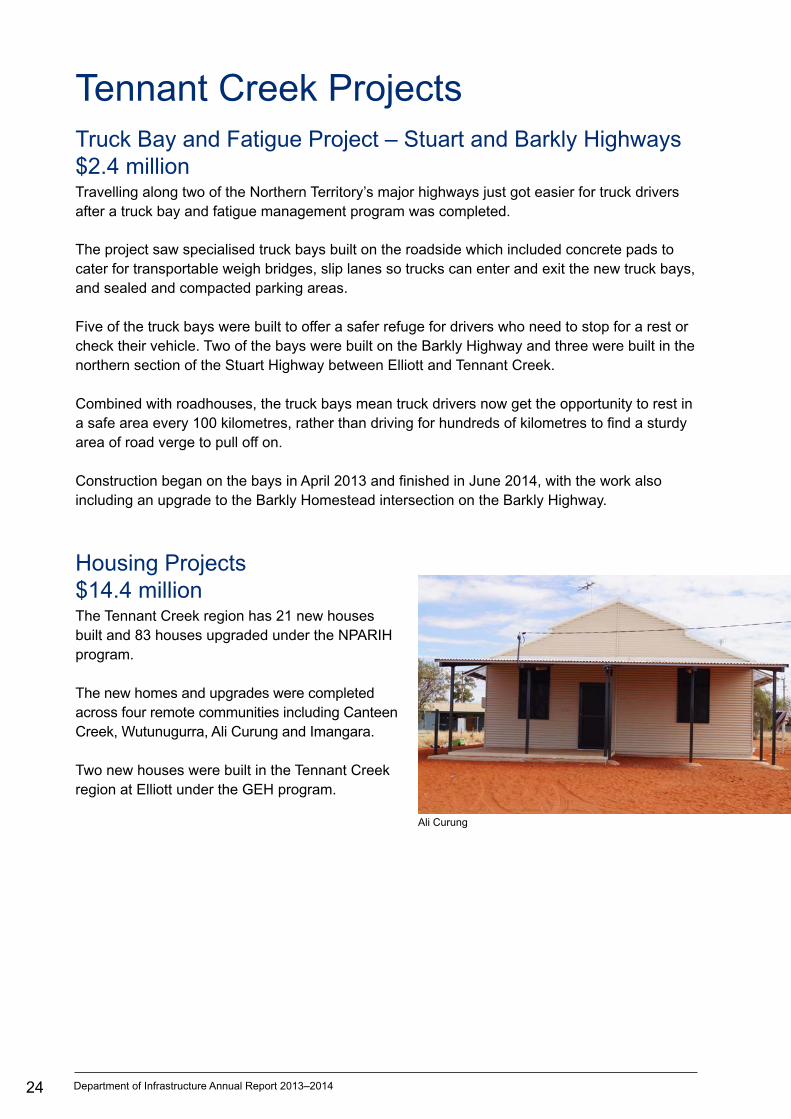
Housing Projects $14.4 millionThe Tennant Creek region has 21 new houses built and 83 houses upgraded under the NPARIH program.
The new homes and upgrades were completed across four remote communities including Canteen Creek, Wutunugurra, Ali Curung and Imangara.
Two new houses were built in the Tennant Creek region at Elliott under the GEH program.
Ali Curung
Department of Infrastructure Annual Report 2013–2014 25
Katherine ProjectsBorroloola Police Station Upgrade$3.7 million A key challenge for the project to refurbish the Borroloola Police Station was trying to maintain a fully operational station during the renovation.
As a result, a mobile police station was relocated from Katherine to Borroloola temporarily so the existing station could be expanded and asbestos removed during the project.
A new toilet, shower and disabled toilets were built as well as a new muster and interview, secure room reception area, undercover carports and a connecting walkway to the cell room block.
The project involved demolition, a new internal floor lay out and new external cladding.
Housing Projects $19 millionA total of 27 new houses were built and 95 homes upgraded in the Katherine region under the NPARIH program. The new homes and upgrades were completed in the remote communities of Beswick, Barunga, Bulman, Eva Valley and Weemol.
Six more houses were built in the remote communities of Kalkarindji and Ngukurr in the Katherine region under the GEH program.
East Arnhem ProjectsNew Bridges for Goyder and Donydji Rivers$29 millionResidents living in the remote areas of Arnhem Land will no longer be cut off by floods for months at a time after a bridge building project on the Central Arnhem Road.
Two rivers created a number of issues during the wet season when floodwater cut off large sections of the road, which is the only access to the main town of Nhulunbuy.
The project saw three single lane bridges built over the Goyder River on the Central Arnhem Road, about 350 kilometre from the Stuart Highway turnoff. The new bridges and 14 kilometres of new road alignment now means that section of the vital road is only cut off by flood waters for about five weeks a year instead of five months.
26 Department of Infrastructure Annual Report 2013–2014
A second section of the Central Arnhem road that was vulnerable to floodwaters was at the Donydji River, on the other side of the Goyder River, about 60 kilometres closer to Nhulunbuy. One single lane bridge and about one kilometre of new alignment was built to reduce the impact of floodwaters.
Maningrida Child and Family Centre$4 millionThere are now 50 more child care places in Maningrida after a new child and family centre was built in the community this year.
Work started on the dual education and health facility in August 2013 and was completed in June 2014 to increase child and maternal health and education services in the community.
The centre is built on the same site as the Maningrida School and designed so the child care and health centre functions can operate independently of each other as well as having separate access to toilet facilities.
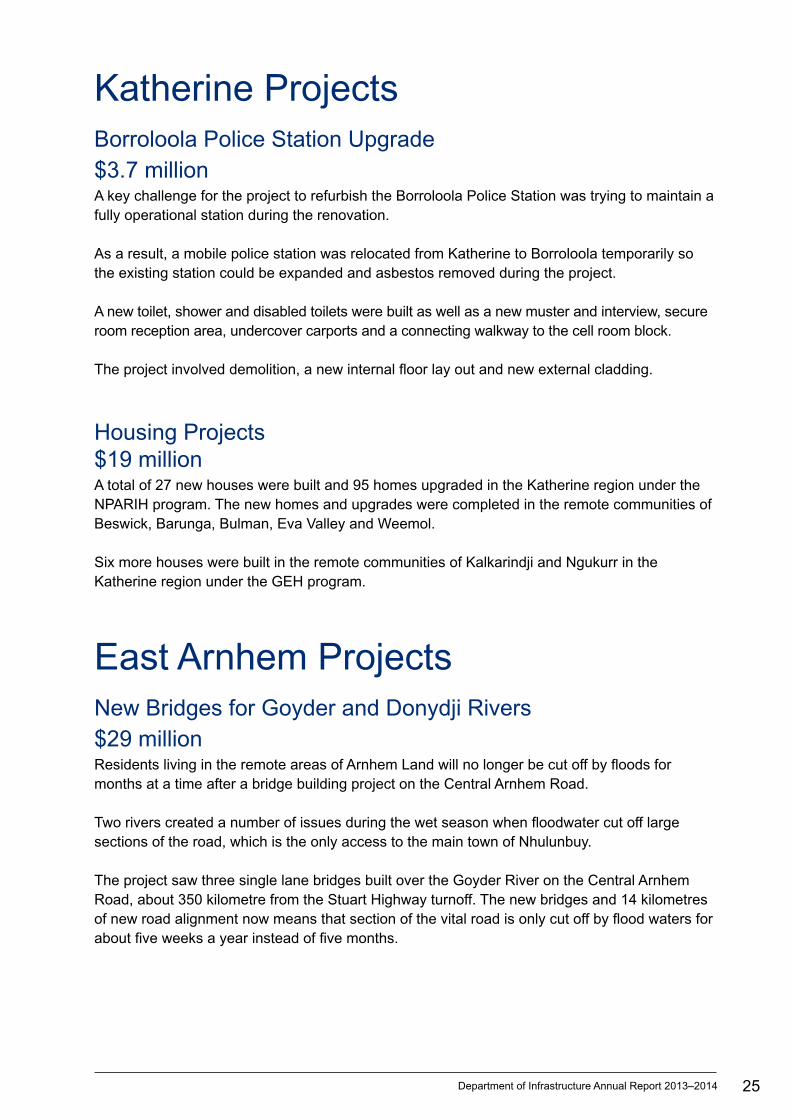
Housing Projects $16.5 millionEighteen new houses were built and 71 homes upgraded in the East Arnhem region under the NPARIH program. The new homes and upgrades were completed at remote communities of Yirrkala and Gunyangara.
The GEH program saw six new houses constructed in the East Arnhem communities of Ramingining and Galiwinku.
Yirkala
27Department of Infrastructure Annual Report 2013–2014
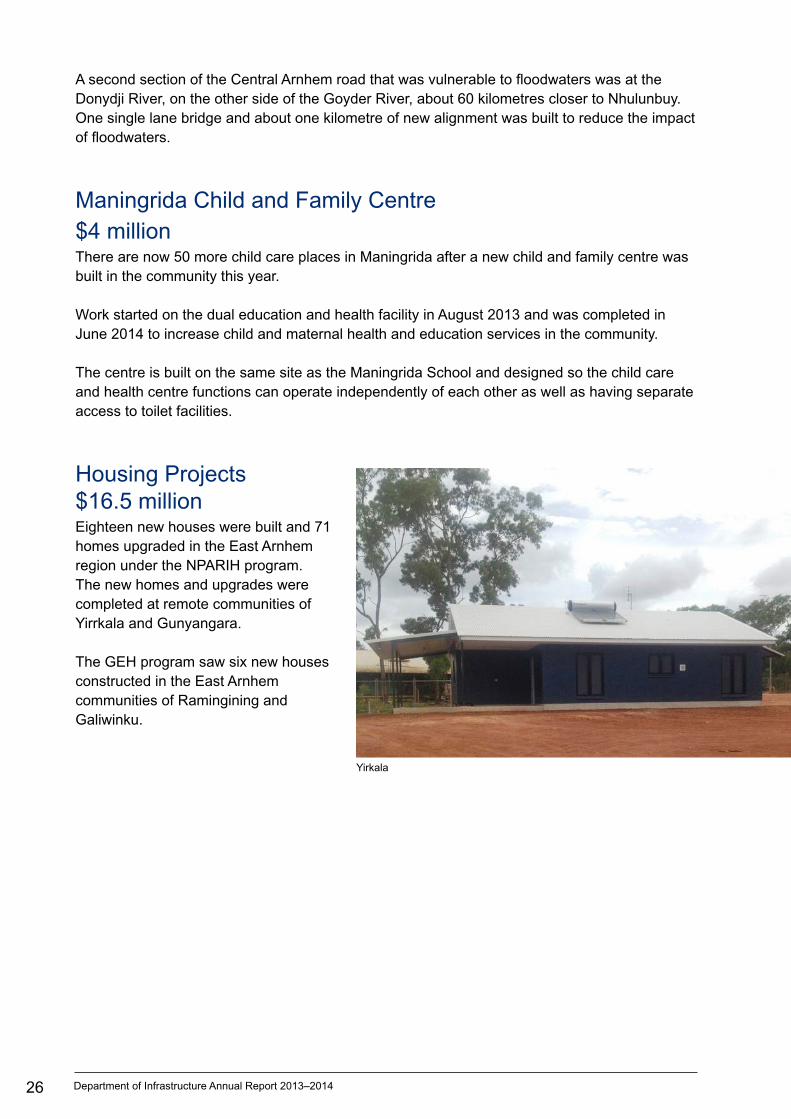
Performance ReportingTechnical SpecificationsKey Deliverables 2013–14 Budget 2013–14 Actual
Technical plans and specifications registered 16 500 18 522
Technical plans and specifications processed 7 000 10 076
Specification and design standards developed and maintained
170 168
Construction DivisionKey Deliverables 2013–14 Budget 2013–14
Manage the capital works and repairs and maintenance programs on behalf of client agencies
$1.038B $1.042B
Delivery of projects within expenditure targets 90% 96%
Delivery of projects within timeframes 85%
Program ManagementKey Deliverables 2013–14 Budget 2013–14 Actual
Capital Works program delivery $22M $24.8M
Department of Infrastructure Annual Report 2013–2014
Corporate GovernancePreface 29 Corporate Governance Framework 30Boards and Committees 31 Audit and Risk Management 34 Work Health and Safety 34 Legislation and Statutory Boards and Authorities 35 Access to Information 36Procurement 36
29Department of Infrastructure Annual Report 2013–2014
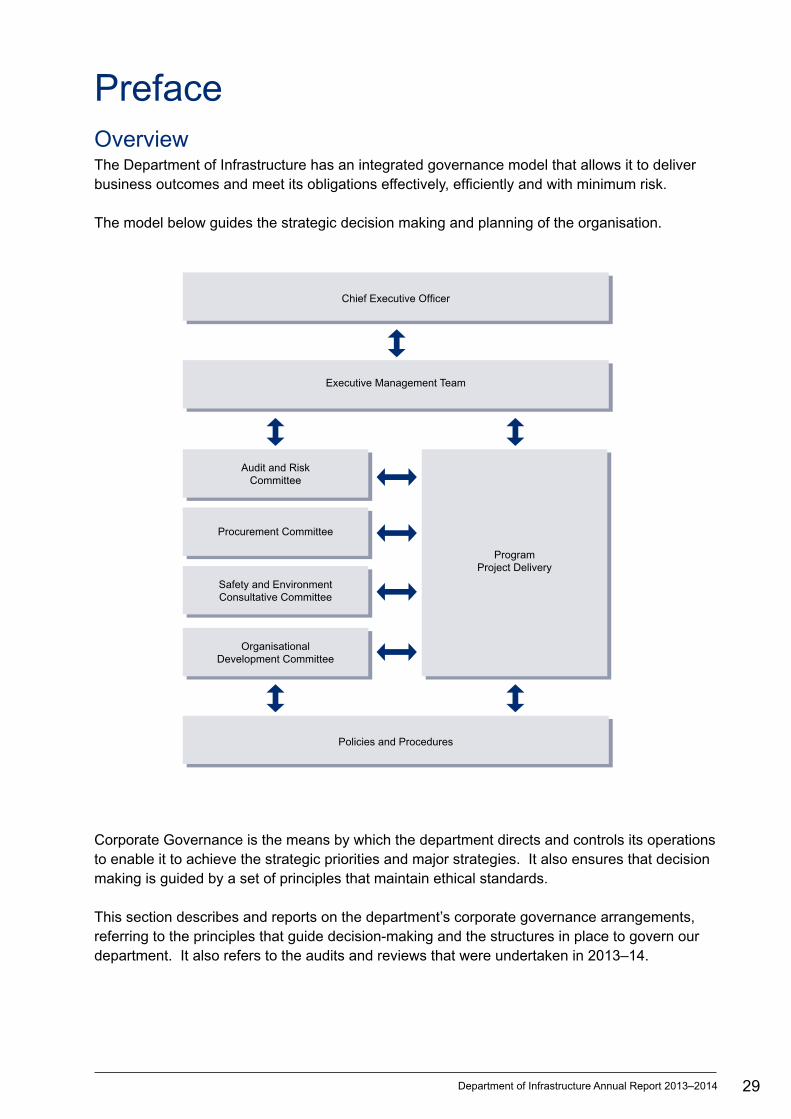
PrefaceOverview The Department of Infrastructure has an integrated governance model that allows it to deliver business outcomes and meet its obligations effectively, efficiently and with minimum risk.
The model below guides the strategic decision making and planning of the organisation.
Corporate Governance is the means by which the department directs and controls its operations to enable it to achieve the strategic priorities and major strategies. It also ensures that decision making is guided by a set of principles that maintain ethical standards.
This section describes and reports on the department’s corporate governance arrangements, referring to the principles that guide decision-making and the structures in place to govern our department. It also refers to the audits and reviews that were undertaken in 2013–14.
Audit and RiskCommittee
ProgramProject Delivery
Safety and EnvironmentConsultative Committee
OrganisationalDevelopment Committee
Procurement Committee
Chief Executive Officer
Executive Management Team
Policies and Procedures
30 Department of Infrastructure Annual Report 2013–2014
Corporate Governance FrameworkValues
The Department of Infrastructure’s values are underpinned by ethical practice, respect and a commitment to service. The staff are accountable for their actions and decisions and take responsibility for their work and behaviour. The department recognises the dedication and expertise of its employees and supports diversity in the workplace.
Corporate Governance Principles
Governance within the Department of Infrastructure is guided by the following principles:
Service Delivery: Professional, responsive and continuous improvement approach to service delivery.
Ethical and responsible decision making: Ethical behaviour expectations communicated across all levels to perform official duties with skill, impartiality, professionalism and integrity.
Stakeholder engagement/Client service: Strong and regular engagement with clients and stakeholders.
Leadership and management: Robust governance structure and strong executive leadership.
Recognise and manage risk: Improve risk management practices and support a risk management environment across the department.
Physical and financial resource management: Responsible and effective planning and management of all resources by complying with legislation and Northern Territory Government policies and internal procedures.
Strategic Objectives
The Department of Infrastructure strives to provide:
• a break even financial focus – implementing value for money strategies and delivering a consistent service.
• successful project outcomes – being the single point of accountability for client agencies and delivering projects that meet client requirements within time and on budget.
• a capable and sustainable organisation – the staff are engaged and are provided with opportunities for further development. The department is diverse, positive and safe.
• client satisfaction – ensuring that we are providing a value for money and service delivery on projects and achieve a consistent quality of services to all clients.

31Department of Infrastructure Annual Report 2013–2014
Boards and Committees Audit and Risk Management Committee RoleThe Audit and Risk Committee is responsible for overseeing internal review and quality assurance relating to financial management, risk management and fraud control and considering how these can potentially impact on the Department of Infrastructure.
2013–14 PerformanceIn 2013–14, the Audit and Risk Committee:
O reviewed the 41 recommendations made in five audit reports
O endorsed a risk based audit plan for 2014–15
O reviewed a performance assessment report of the committee prepared by an independent consultant
O supported increased committee membership from four to five members during the year, with three internal and two external to the department.
2014–15 PrioritiesDuring the 2014–15, the Risk and Audit Committee’s priorities are to:
O undertake a review of the risk and audit function with the aim of identifying efficiencies and streamlining processes
O endorse a risk based audit plan for 2015–16
O review the reports from approved audits
O review the department’s financial reports and end of year statements
O review progress of implementation of all audit recommendations
O review the strategic risk register.
Procurement Committee RoleThe role of the Procurement Committee is to monitor agency performance against established performance indications and to provide direction on the implementation of Northern Territory Government-wide procurement initiatives within the department. The committee also evaluates the effectiveness of the governance of procurement in the department.
2013–14 PerformanceIn 2013–14, the Procurement Committee:
O implemented a Complaints Policy Framework
O continued with the Tender Evaluation Team to ensure better outcomes for industry with tender assessments
32 Department of Infrastructure Annual Report 2013–2014
O defined local development within the regions
O continued to ensure better compliance with policies and procedures
O participated in better Indigenous outcomes for Indigenous Business Enterprise’s (IBE) and Indigenous stakeholders
O reviewed Apprentice/Trainees Procedure to make it more effective, removing the 10 per cent for apprentices out of local development and value adding (LDVA) to make it fair and consistent for industry
O implemented an Excel Spreadsheet (Schedule of Rates) to be included in all tenders and quotes to make it easier and more efficient for industry
O reviewed existing panel and period contracts for better results for industry
O reviewed the debriefing process to give better results for industry
O reviewed process and procedures, mainly in the lower levels to make it easier for industry.
2014–15 PrioritiesIn 2014–15, the procurement priorities for the department are to:
O establish a Department of Infrastructure Procurement Review Board, with the Board to hold its inaugural meeting in the 2014–15 financial year
O review and align contractor performance reporting to align with industry feedback
O implement an Indigenous policy to partner with IBEs to deliver and train Indigenous Territorians in the delivery of infrastructure programs
O continue to review procurement policies and procedures to ensure the processes are efficient and effective and reduce red tape.
Safety and Environment Consultative Committee Role The Safety and Environment Consultative Committee provides a forum to consult and communicate with employees to ensure their views are considered in all matters related to work health, safety and environment. The committee helps develop, review and distribute work health and safety and environment related practices, procedures and policies. In addition, the committee helps develop and monitor measures to ensure a safe, healthy environment and welfare at work.
2013–14 PerformanceIn 2013–14, the Safety and Environmental Safety Committee:
O established an interagency reporting framework between NT Worksafe and the department for all project safety matters
O helped develop the corporate training budget regarding the inclusion of work health and safety (WHS) related training
O successfully proposed a redrafted Department of Infrastructure Protective Items Policy which aligns to the requirements of the harmonised WHS Legislation
33Department of Infrastructure Annual Report 2013–2014
O further developed internal reporting mechanisms for notifiable incidents allowing the Executive Management Team to demonstrate due diligence
O promoted WHS consultation within the department and developed WHS skills and knowledge.
2014–15 PrioritiesIn 2014–15, the Safety and Environmental Safety Committee’s priorities are to:
O continue to promote staff consultation through support to local WHS committees and regional workgroups
O make recommendations via formal submission to the Executive Management Team, identifying improvements to environment and safety performance in the department across all aspects of the business
O contribute to the development of competency based training for project and general staff to develop skills and knowledge regarding environment and WHS compliance on our projects
O improve the department’s design risk assessment process to better communicate the environmental aspects and safety hazards present in the design phase.
Organisational Development Committee RoleThe Organisational Development Committee provides a forum for business units to influence and progress the department’s Human Resources Strategic Plan and ensures the department’s workforce is skilled and able to deliver on corporate objectives, now and into the future.
The committee strategically assesses the workforce and organisational development needs, taking a lead role in implementing the Human Resources Strategic and Corporate Plans. The committee presents discussion items and makes recommendations to the Executive Management Team, providing a collaborative approach to disseminating information across the department.
2013–14 PerformanceIn 2013–14, the Organisational Development Committee:
O oversaw tendering for and commencement of Certificate IV in Project Management training for 17 employees
O oversaw delivery of Certificate IV in Government (Procurement) training to 20 employees
O oversaw the delivery of contract management training to 80 employees
O progressed the department’s Indigenous Employment and Career Development Strategy, resulting in approval to employ 10 participants in the Department of Corporate Information Service Indigenous Employment Program to undertake a technical program – the first for the Northern Territory Government
O reviewed the department’s Quarterly Recognition Awards to align with and support the Northern Territory Public Sector values.
34 Department of Infrastructure Annual Report 2013–2014
2014–15 PrioritiesIn 2014–15, the Organisational Development Committee’s priorities are to:
O increase Indigenous employment and retention
O up-skill our workforce to meet key agency competencies by continuing to deliver accredited training in procurement and project management
O work on improving the department’s culture through a staff survey
O continue enhancing the Early Careers Program to meet the changing needs of the department
O identify relevant training priorities and allocate the Corporate Training Budget accordingly to ensure the department is getting the best possible return on investment.
Audit and Risk Management Audit and risk management is independent and provides objective assurance designed to add value and improve how the Department of Infrastructure operates. Audit and risk management aims to help the department accomplish its objectives by using a systematic, disciplined approach to evaluate and improve the effectiveness of governance, risk management and control processes.
Internal audit and risk activities are based on the International Professional Practices Framework issued by the Institute of Internal Auditors.
Audits and Reviews Internal The Department of Infrastructure conducted seven internal audits covering a range of matters including projects and internal control processes.
Probity specialist reports were engaged on 11 civil and building projects.
External The Northern Territory Auditor General conducted an audit of the financial statements for the Construction Division.
Work Health and Safety The Department of Infrastructure Executive Management Team and staff are committed to developing, implementing and maintaining a work health and safety system to help eliminate work related injury or illness. Safety objectives are an integral component of the work health and safety (WHS) management system.

35Department of Infrastructure Annual Report 2013–2014
The Department of Infrastructure 2011–2014 Corporate Plan and associated branch business plans inform the safety objectives for the department. The process for defining objectives, targets and programs coincides with the annual strategic business planning cycle. These objectives are monitored at Executive Management Team meetings and reviewed for continuing relevance each year through organisational self-assessment.
The department maintains a risk management methodology to identify and, where possible, eliminate or mitigate safety risks as far as reasonably practicable. This is supported by documented procedures to regularly identify hazards, analyse risks, implement controls, monitor risks and review controls.
To comply with legislation, the department documents all actions to identify and access legal and other requirements that directly apply to work health and safety issues relating to its activities and services.
First, second and third party audits of the department’s WHS processes, reviews of incident/ action reports, and inspection and site reports all contribute to evaluating compliance to legislative and other requirements.
To help the department maintain its legal obligations, the Executive Management Team approved the formation of the Safety and Environment Consultative Committee in May 2012.
The committee helps consult and communicate with workers so they can be represented in all matters relating to work health, safety and environment. The committee allows the department to demonstrate legislative compliance and satisfy the criteria for integrated systems of management under current Australian standards.
The committee’s focus is ensuring safety and environment are factors included in all department decisions, taking into account the integrated nature of the department’s management systems.
Legislation, Statutory Boards and Authorities Part of the Department of Infrastructure’s core business is to manage road closures, vehicle restrictions and other road related activities on behalf of the Department of Transport. This includes the Construction Division holding delegated powers under the Control of Roads Act and Traffic Act.
The department does not manage any other legislation, statutory boards or authorities on behalf of the Northern Territory Government.
36 Department of Infrastructure Annual Report 2013–2014
Legal Services The ability to access professional legal advice is critical to the Department of Infrastructure’s business. The Northern Territory Government’s legal service is provided through the Department of the Attorney-General and Justice and involves lawyers reviewing and drafting legal documentation, participating in negotiations and referring matters to private law firms where specific expertise or services are required.
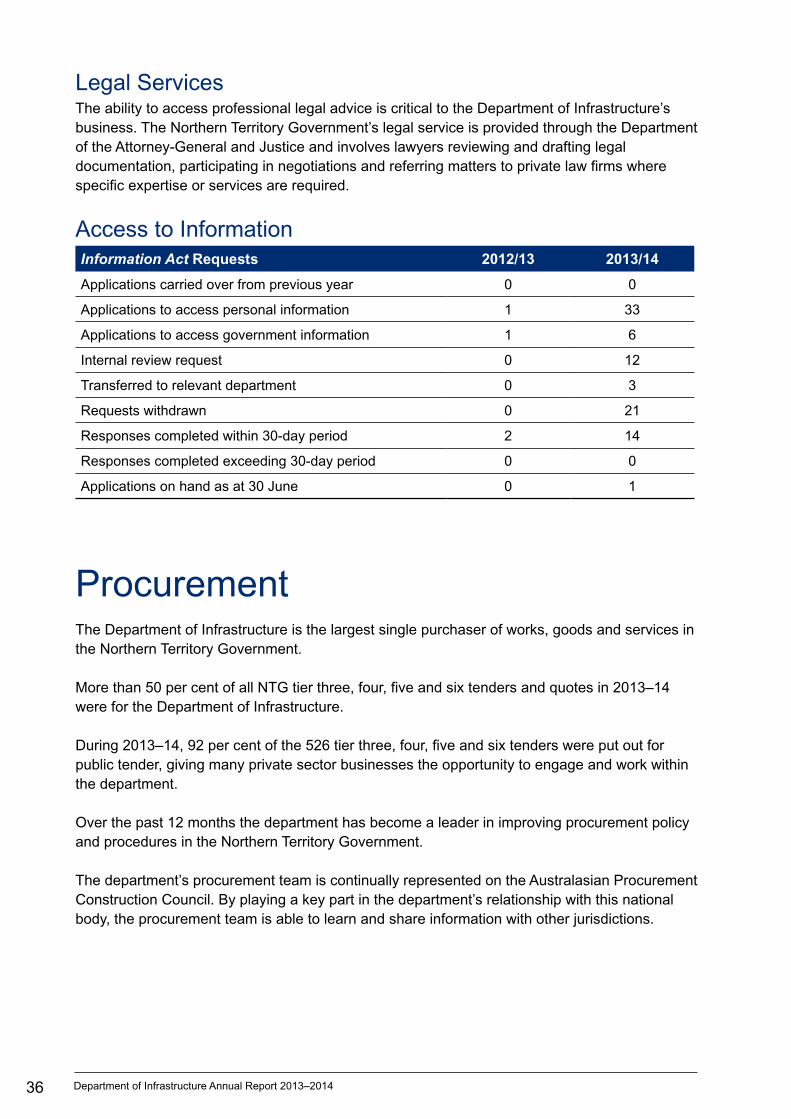
Access to InformationInformation Act Requests 2012/13 2013/14
Applications carried over from previous year 0 0
Applications to access personal information 1 33
Applications to access government information 1 6
Internal review request 0 12
Transferred to relevant department 0 3
Requests withdrawn 0 21
Responses completed within 30-day period 2 14
Responses completed exceeding 30-day period 0 0
Applications on hand as at 30 June 0 1
Procurement The Department of Infrastructure is the largest single purchaser of works, goods and services in the Northern Territory Government.
More than 50 per cent of all NTG tier three, four, five and six tenders and quotes in 2013–14 were for the Department of Infrastructure.
During 2013–14, 92 per cent of the 526 tier three, four, five and six tenders were put out for public tender, giving many private sector businesses the opportunity to engage and work within the department.
Over the past 12 months the department has become a leader in improving procurement policy and procedures in the Northern Territory Government.
The department’s procurement team is continually represented on the Australasian Procurement Construction Council. By playing a key part in the department’s relationship with this national body, the procurement team is able to learn and share information with other jurisdictions.
37Department of Infrastructure Annual Report 2013–2014
Key achievements for the procurement team during 2013–14 include:
O maximising local development and value adding to support local businesses in the regions
O developing and improving tender assessments across the department
O revising and updating the Department of Infrastructure Procurement Policy to streamline and improve procurement processes
O reviewing the Contractor Performance Reporting System to enable greater compliance and enhance availability of information for future tender assessments
O reviewing processes to ensure greater compliance to improve transparency and provide greater consistency in tender documentation
O providing internal staff training on key procurement reforms.
Department of Infrastructure Annual Report 2013–2014
Our PeopleOverview of Human Resource Services 39Workforce Development 39Worklife Balance 43 Health and Wellbeing 43 Staff Engagement, Recognition and Induction 44 CDU/NTG Partnership Agreement 46

39Department of Infrastructure Annual Report 2013–2014
Overview of Human Resource Services Human Resource (HR) Services promotes best practice HR management and provides business units with high level advice and support on recruitment, case management and training and development.
The Department of Infrastructure aims to be an employer of choice, ensuring it is attractive to prospective employees by providing opportunity and development for both new and existing staff. The department is building a diverse workforce with the capability to deliver its strategic objectives.
The department strives to maintain a workplace environment that is free from bullying, harassment and discriminatory practices and HR Services have implemented a policy, toolkit and training program to support these objectives.
HR Services helps the department maintain a positive work culture by developing policy and providing advisory services using its knowledge and experience in best practice human resource management. This advice minimises risks by ensuring compliance with statutory requirements.
Workforce DevelopmentThe Department of Infrastructure recognises the value of investing in the personal and professional development of staff. Training opportunities and programs allow the department to grow an appropriately skilled workforce to deliver our corporate objectives now and into the future.
Career Development Human Resource Services regularly coordinate training for all staff within the Department of Infrastructure to enhance skills and meet needs as they are identified. For example, training is introduced to help staff with new technology and software programs, departmental policies, corporate initiatives and other relevant business related topics as they become available.
The Building Our Managers’ Capacity Program was developed and implemented to strengthen and enhance the skills and knowledge of our leaders and managers, to ensure quality leadership within the department. In 2013, 74 senior staff participated in the program. In 2014, this program was extended to all staff under the Building Our Employees’ Capacity banner (Train2Develop), and a calendar of workshops were made available to staff to build awareness and understanding on a range of topics and services offered and provided by the department.
Early Careers The Department of Infrastructure employment programs target entry level recruits including engineering scholarship holders, graduates and trainees.
In conjunction with Charles Darwin University, the department supports a four and a half year scholarship program in engineering. The program has been designed to entice the
40 Department of Infrastructure Annual Report 2013–2014
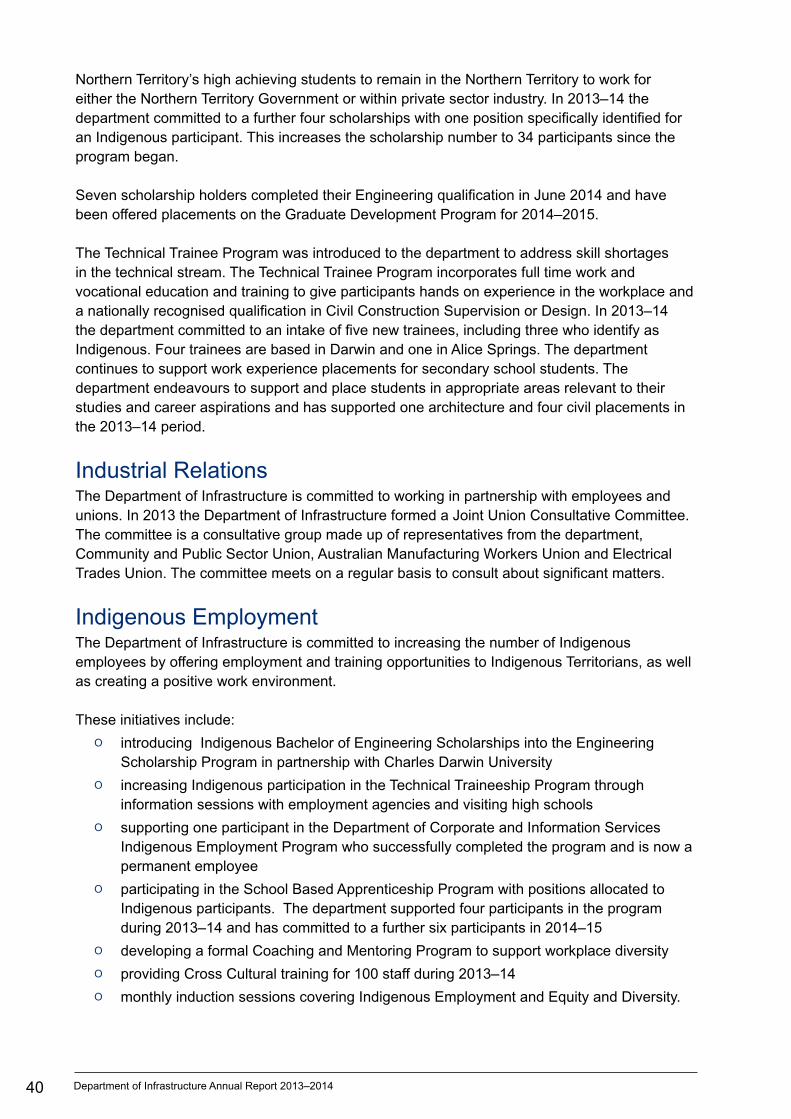
Northern Territory’s high achieving students to remain in the Northern Territory to work for either the Northern Territory Government or within private sector industry. In 2013–14 the department committed to a further four scholarships with one position specifically identified for an Indigenous participant. This increases the scholarship number to 34 participants since the program began.
Seven scholarship holders completed their Engineering qualification in June 2014 and have been offered placements on the Graduate Development Program for 2014–2015.
The Technical Trainee Program was introduced to the department to address skill shortages in the technical stream. The Technical Trainee Program incorporates full time work and vocational education and training to give participants hands on experience in the workplace and a nationally recognised qualification in Civil Construction Supervision or Design. In 2013–14 the department committed to an intake of five new trainees, including three who identify as Indigenous. Four trainees are based in Darwin and one in Alice Springs. The department continues to support work experience placements for secondary school students. The department endeavours to support and place students in appropriate areas relevant to their studies and career aspirations and has supported one architecture and four civil placements in the 2013–14 period.
Industrial Relations The Department of Infrastructure is committed to working in partnership with employees and unions. In 2013 the Department of Infrastructure formed a Joint Union Consultative Committee. The committee is a consultative group made up of representatives from the department, Community and Public Sector Union, Australian Manufacturing Workers Union and Electrical Trades Union. The committee meets on a regular basis to consult about significant matters.
Indigenous Employment The Department of Infrastructure is committed to increasing the number of Indigenous employees by offering employment and training opportunities to Indigenous Territorians, as well as creating a positive work environment.
These initiatives include:
O introducing Indigenous Bachelor of Engineering Scholarships into the Engineering Scholarship Program in partnership with Charles Darwin University
O increasing Indigenous participation in the Technical Traineeship Program through information sessions with employment agencies and visiting high schools
O supporting one participant in the Department of Corporate and Information Services Indigenous Employment Program who successfully completed the program and is now a permanent employee
O participating in the School Based Apprenticeship Program with positions allocated to Indigenous participants. The department supported four participants in the program during 2013–14 and has committed to a further six participants in 2014–15
O developing a formal Coaching and Mentoring Program to support workplace diversity
O providing Cross Cultural training for 100 staff during 2013–14
O monthly induction sessions covering Indigenous Employment and Equity and Diversity.
41Department of Infrastructure Annual Report 2013–2014
Key Statistics/Early Careers Program
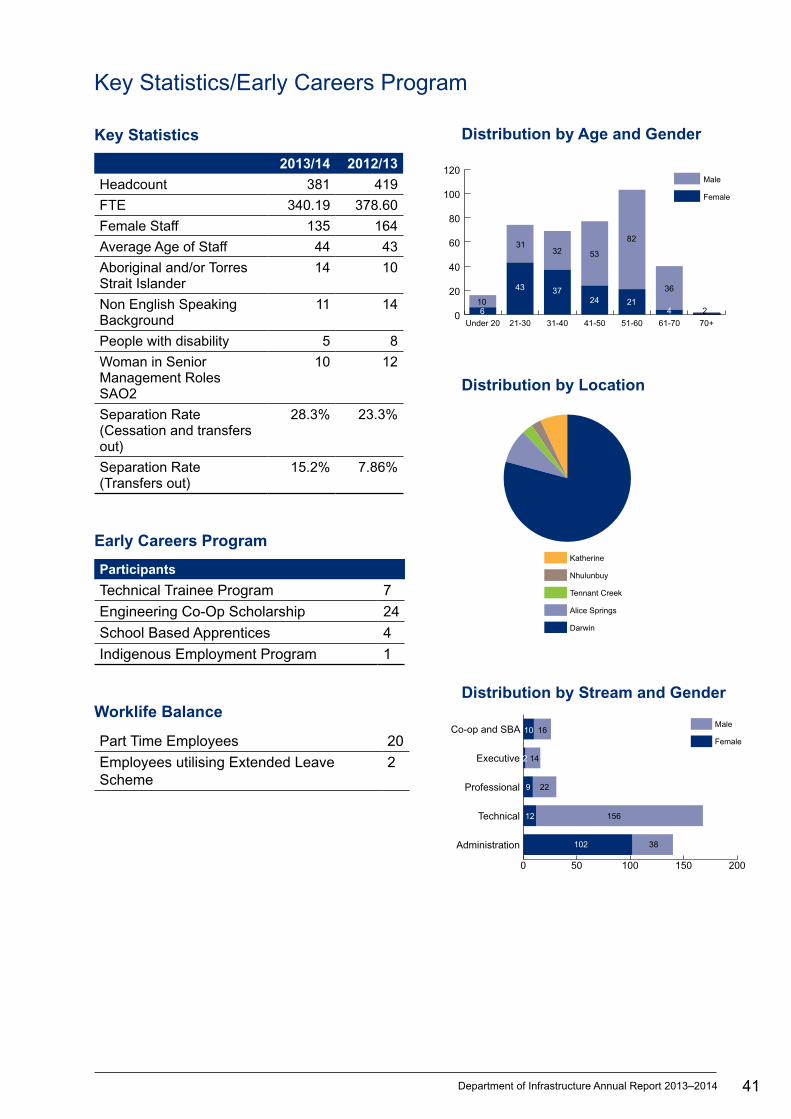
Key Statistics
2013/14 2012/13
Headcount 381 419
FTE 340.19 378.60
Female Staff 135 164
Average Age of Staff 44 43
Aboriginal and/or Torres Strait Islander
14 10
Non English Speaking Background
11 14
People with disability 5 8
Woman in Senior Management Roles SAO2
10 12
Separation Rate (Cessation and transfers out)
28.3% 23.3%
Separation Rate (Transfers out)
15.2% 7.86%
Early Careers Program
Participants
Technical Trainee Program 7
Engineering Co-Op Scholarship 24
School Based Apprentices 4
Indigenous Employment Program 1
Worklife Balance
Part Time Employees 20
Employees utilising Extended Leave Scheme
2
0 50 100 150 200
Male
Female
Administration
Technical
Professional
Executive
Co-op and SBA
0
20
40
60
80
100
120Male
Female
70+61-7051-6041-5031-4021-30Under 20 Katherine
Nhulunbuy
Tennant Creek
Alice Springs
Darwin
10
2
9 22
102 38
12 156
106
3132 53
82
36
2
14
16
43 3724 21
4
0 50 100 150 200
Male
Female
Administration
Technical
Professional
Executive
Co-op and SBA
0
20
40
60
80
100
120Male
Female
70+61-7051-6041-5031-4021-30Under 20 Katherine
Nhulunbuy
Tennant Creek
Alice Springs
Darwin
10
2
9 22
102 38
12 156
106
3132 53
82
36
2
14
16
43 3724 21
4
0 50 100 150 200
Male
Female
Administration
Technical
Professional
Executive
Co-op and SBA
0
20
40
60
80
100
120Male
Female
70+61-7051-6041-5031-4021-30Under 20 Katherine
Nhulunbuy
Tennant Creek
Alice Springs
Darwin
10
2
9 22
102 38
12 156
106
3132 53
82
36
2
14
16
43 3724 21
4
Distribution by Location
Distribution by Stream and Gender
Distribution by Age and Gender

42 Department of Infrastructure Annual Report 2013–2014
During 2013–14, the Department of Infrastructure supported staff to achieve qualifications that align to its core business objectives and strategic direction. This included the following qualifica-tions in:
O Certificate IV in Civil Construction Supervision
O Certificate IV in Civil Design
O Certificate IV in Government (Procurement and Contracting)
O Contract Management
O Occupational Health and Safety
O Project Management
O Engineering.
In line with the department’s commitment to provide a safe working environment for its staff, the department invested in essential safety training during 2013–14 for staff to obtain white cards and work zone traffic management qualifications. The department also delivered four-wheel drive and first aid training.
The Human Resources Strategic PlanThe Department of Infrastructure’s Human Resources Strategic Plan 2013–2017 aims to ensure the department has adequate human resources to meet the strategic goals and operational plans of the organisation. The plan recognises that our people are our most valuable asset and prioritises actions in three key areas to improve workforce capacity that delivers significantly better outcomes for the department and the broader Northern Territory Public Sector (NTPS).
Human Resources Strategic Plan working group
43Department of Infrastructure Annual Report 2013–2014
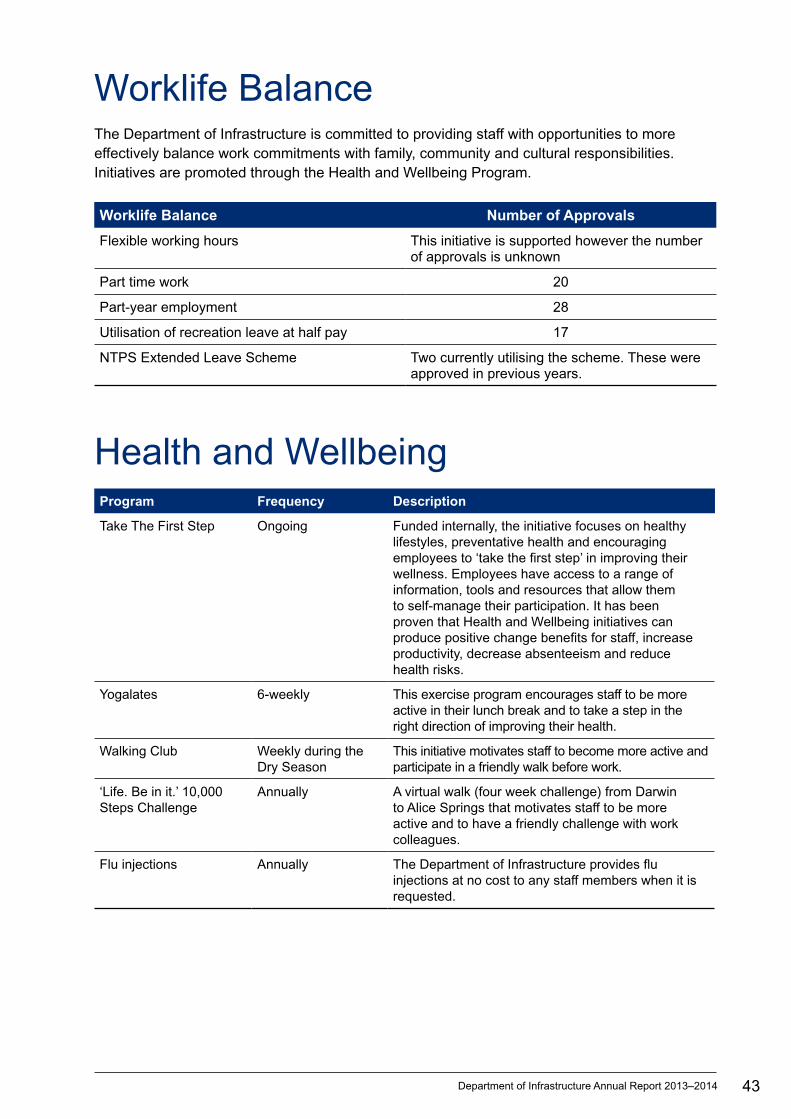
Worklife BalanceThe Department of Infrastructure is committed to providing staff with opportunities to more effectively balance work commitments with family, community and cultural responsibilities. Initiatives are promoted through the Health and Wellbeing Program.
Worklife Balance Number of Approvals
Flexible working hours This initiative is supported however the number of approvals is unknown
Part time work 20
Part-year employment 28
Utilisation of recreation leave at half pay 17
NTPS Extended Leave Scheme Two currently utilising the scheme. These were approved in previous years.
Health and WellbeingProgram Frequency Description
Take The First Step Ongoing Funded internally, the initiative focuses on healthy lifestyles, preventative health and encouraging employees to ‘take the first step’ in improving their wellness. Employees have access to a range of information, tools and resources that allow them to self-manage their participation. It has been proven that Health and Wellbeing initiatives can produce positive change benefits for staff, increase productivity, decrease absenteeism and reduce health risks.
Yogalates 6-weekly This exercise program encourages staff to be more active in their lunch break and to take a step in the right direction of improving their health.
Walking Club Weekly during the Dry Season
This initiative motivates staff to become more active and participate in a friendly walk before work.
‘Life. Be in it.’ 10,000 Steps Challenge
Annually A virtual walk (four week challenge) from Darwin to Alice Springs that motivates staff to be more active and to have a friendly challenge with work colleagues.
Flu injections Annually The Department of Infrastructure provides flu injections at no cost to any staff members when it is requested.
44 Department of Infrastructure Annual Report 2013–2014
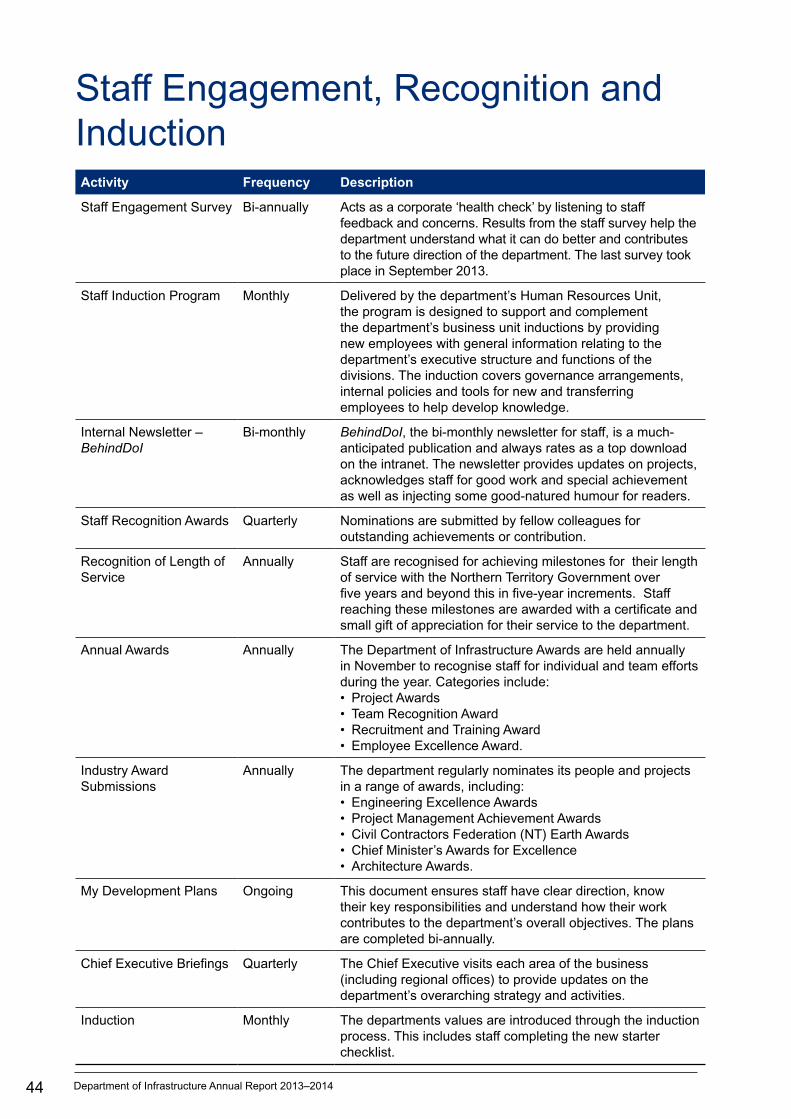
Staff Engagement, Recognition and InductionActivity Frequency Description
Staff Engagement Survey Bi-annually Acts as a corporate ‘health check’ by listening to staff feedback and concerns. Results from the staff survey help the department understand what it can do better and contributes to the future direction of the department. The last survey took place in September 2013.
Staff Induction Program Monthly Delivered by the department’s Human Resources Unit, the program is designed to support and complement the department’s business unit inductions by providing new employees with general information relating to the department’s executive structure and functions of the divisions. The induction covers governance arrangements, internal policies and tools for new and transferring employees to help develop knowledge.
Internal Newsletter – BehindDoI
Bi-monthly BehindDoI, the bi-monthly newsletter for staff, is a much-anticipated publication and always rates as a top download on the intranet. The newsletter provides updates on projects, acknowledges staff for good work and special achievement as well as injecting some good-natured humour for readers.
Staff Recognition Awards Quarterly Nominations are submitted by fellow colleagues for outstanding achievements or contribution.
Recognition of Length of Service
Annually Staff are recognised for achieving milestones for their length of service with the Northern Territory Government over five years and beyond this in five-year increments. Staff reaching these milestones are awarded with a certificate and small gift of appreciation for their service to the department.
Annual Awards Annually The Department of Infrastructure Awards are held annually in November to recognise staff for individual and team efforts during the year. Categories include: • Project Awards • Team Recognition Award• Recruitment and Training Award • Employee Excellence Award.
Industry Award Submissions
Annually The department regularly nominates its people and projects in a range of awards, including: • Engineering Excellence Awards • Project Management Achievement Awards• Civil Contractors Federation (NT) Earth Awards • Chief Minister’s Awards for Excellence • Architecture Awards.
My Development Plans Ongoing This document ensures staff have clear direction, know their key responsibilities and understand how their work contributes to the department’s overall objectives. The plans are completed bi-annually.
Chief Executive Briefings Quarterly The Chief Executive visits each area of the business (including regional offices) to provide updates on the department’s overarching strategy and activities.
Induction Monthly The departments values are introduced through the induction process. This includes staff completing the new starter checklist.

45Department of Infrastructure Annual Report 2013–2014
Employment Instruction and Annual Reporting requirements
Agency Action in 2013–14
Number 1 – Filling Vacancies For the 2013–14 financial year the Department of Infrastructure had 58 positions advertised (permanent and temporary). The department had 57 staff commence/transfer in and 108 separations/transfers out. There were no promotion appeals lodged for the financial year.
Number 2 – Probation The department has a current Probation Policy and flow chart consistent with the Public Sector Management Act and relevant awards. New employees in the department are advised of the probation process during induction and provided information about their responsibilities. The manager monitors probationary reports and timeframes.
Number 3 – Natural Justice The principles of natural justice are communicated to all employees. Natural justice is adhered to in all dealings with employees and reflected in internal policies and procedures.
Number 4 – Employee Performance Management and Development Systems
The department’s performance management system, My Development Plan (MyDP), aligns with the department’s Corporate Plan and objectives.
Number 5 – Medical Examinations One employee was directed to attend examinations by health practitioners for the 2013–14 financial year.
Number 6 – Employee Performance and Inability
Human Resource staff support managers dealing with under-performance issues and help managers and staff to improve performance.
Number 7 – Discipline The department’s discipline policy and procedure is available to all staff on the intranet. One disciplinary action was taken during 2013–14.
Number 8 – Internal Agency Complaints and Section 59 Grievance Reviews
The department’s grievance policy and procedure is available to all staff on the intranet. Human Resources provide advice and support to managers and staff to deal with grievances. The department received no grievances for the 2013–14 financial year.
Number 9 – Employment Records The Department of Business stores all personnel files. The department complies with the Department of Business policy regarding access to these files. Any requests to access employee records are made through the Director of Human Resources. No requests were lodged for employee information under the Freedom of Information Act in 2013–14.
Number 10 – Equality of Employment Opportunity Programs
The department’s Equal Employment Opportunity Management Policy was developed and implemented in September 2011.

46 Department of Infrastructure Annual Report 2013–2014
Employment Instruction and Annual Reporting requirements
Agency Action in 2013–14
Number 11 – Occupational Health and Safety Standards Programs
The Department of Infrastructure has implemented an Integrated Management System which is the framework to meet the requirements of AS/ NZS 4801:2001 (Occupational Health and Safety Management Systems) and ISO 14001 (Environmental Management Systems). The department has the appropriate Work Health and Safety (WHS) Committees to ensure WHS compliance. The details of the WHS activities are reported in the annual report. Current obligations, policies and procedures are available to all staff on the intranet.
Number 12 – Code of Conduct New staff are given the Northern Territory Public Sector Code of Conduct booklet during corporate induction as part of their commencement package and it is available on the intranet site. In-house training sessions of Appropriate Workplace Behaviours promote compliance with the Code of Conduct.
Number 13 – Appropriate Workplace Behaviour
The department is committed to providing all employees with a safe and healthy workplace, free from inappropriate behaviours such as bullying, harassment and discrimination. Appropriate Workplace Behaviour training is mandatory for all staff on an annual basis. The workshop provides useful tools and resources for staff to use if faced with inappropriate behaviours. 73 per cent of staff attended this financial year.
CDU/NTG Partnership AgreementThe Department of Infrastructure continues to benefit from and develop local professionals at Charles Darwin University (CDU) as part of an ongoing Partnership Agreement with the Northern Territory Government.
The strong relationship between the Department of Infrastructure and CDU School of Engineering and Information Technology continued in 2013–14 and the department has extended its three-year sponsorship of the Chair of Structural Engineering, David Lilley.
The department benefits from Professor David Lilley’s wealth of experience where he spends one day per week based in the Palmerston office.
The department helped pay for a structural load testing facility at CDU, which was officially opened on 8 May 2014. The facility was welcomed by students and local industry.
The department is sponsoring four Engineering Scholarships in 2014. The program has been in place since 2009 and seven students are expected to complete their degree in July 2014, with a number of these students joining the department’s two-year graduate program.

47Department of Infrastructure Annual Report 2013–2014 47
This page has been left blank intentionally.

Financial Performance2013–14 Financial Statements – 48Department of Infrastructure
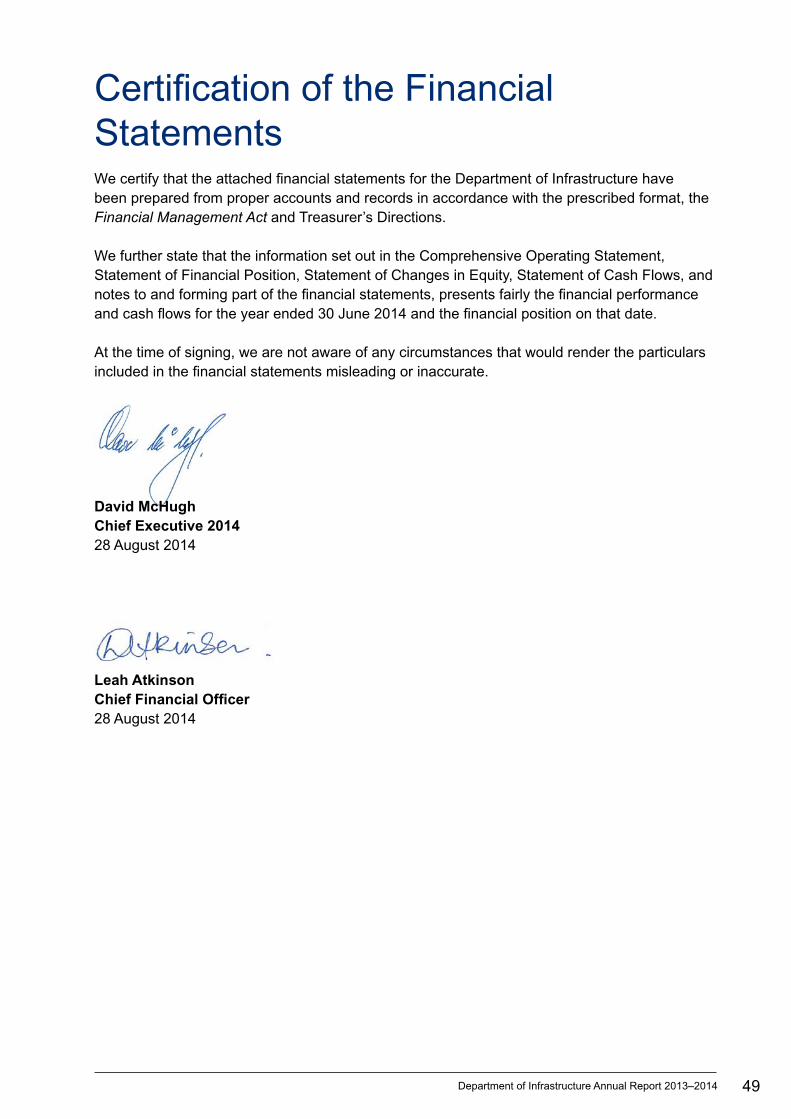
49Department of Infrastructure Annual Report 2013–2014
Certification of the Financial StatementsWe certify that the attached financial statements for the Department of Infrastructure have been prepared from proper accounts and records in accordance with the prescribed format, the Financial Management Act and Treasurer’s Directions.
We further state that the information set out in the Comprehensive Operating Statement, Statement of Financial Position, Statement of Changes in Equity, Statement of Cash Flows, and notes to and forming part of the financial statements, presents fairly the financial performance and cash flows for the year ended 30 June 2014 and the financial position on that date.
At the time of signing, we are not aware of any circumstances that would render the particulars included in the financial statements misleading or inaccurate.
David McHughChief Executive 201428 August 2014
Leah AtkinsonChief Financial Officer28 August 2014

50 Department of Infrastructure Annual Report 2013–2014
Comprehensive Operating StatementFor the year ended 30 June 2014
Note 2014 2013
$000 $000
INCOME
Appropriation
Output 10,417 32,452
Sales of Goods and Services 8,388 9,030
Goods and Services Received Free of Charge 4 873 1,000
Other Income 65 78
TOTAL INCOME 19,743 42,560
EXPENSES
Employee Expenses 6,630 9,726
Administrative Expenses
Purchases of Goods and Services 5 5,298 24,430
Repairs and Maintenance 11,070 6,946
Property Management 741 744
Depreciation and Amortisation 8 1,524 2,568
Other Administrative Expenses1 866 1,001
Grants and Subsidies Expenses
Current 400 400
Capital 1,770 0
Interest Expenses 19 0
TOTAL EXPENSES 28,318 45,815
NET DEFICIT (8,575) (3,255)
TOTAL OTHER COMPREHENSIVE INCOME 0 0
COMPREHENSIVE RESULT (8,575) (3,255)
1. Includes DCIS service charges.
The Comprehensive Operating Statement is to be read in conjunction with the notes to the financial statements.
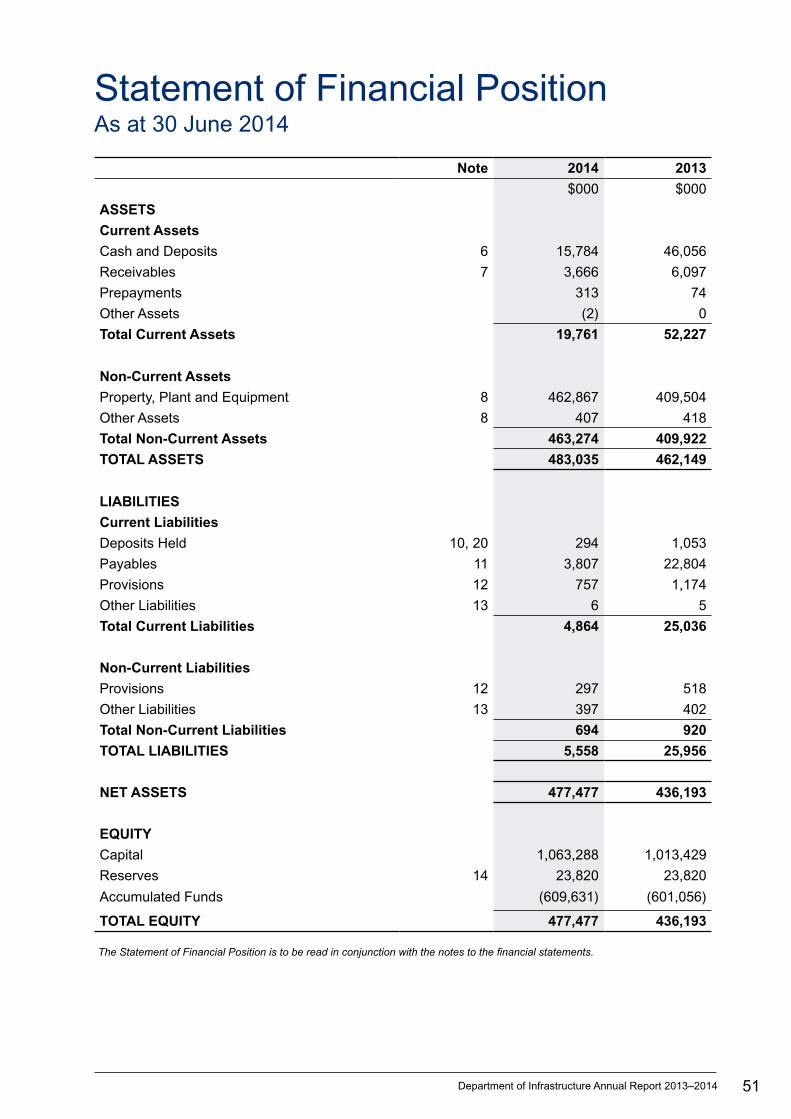
51Department of Infrastructure Annual Report 2013–2014
Statement of Financial PositionAs at 30 June 2014
Note 2014 2013
$000 $000
ASSETS
Current Assets
Cash and Deposits 6 15,784 46,056
Receivables 7 3,666 6,097
Prepayments 313 74
Other Assets (2) 0
Total Current Assets 19,761 52,227
Non-Current Assets
Property, Plant and Equipment 8 462,867 409,504
Other Assets 8 407 418
Total Non-Current Assets 463,274 409,922
TOTAL ASSETS 483,035 462,149
LIABILITIES
Current Liabilities
Deposits Held 10, 20 294 1,053
Payables 11 3,807 22,804
Provisions 12 757 1,174
Other Liabilities 13 6 5
Total Current Liabilities 4,864 25,036
Non-Current Liabilities
Provisions 12 297 518
Other Liabilities 13 397 402
Total Non-Current Liabilities 694 920
TOTAL LIABILITIES 5,558 25,956
NET ASSETS 477,477 436,193
EQUITY
Capital 1,063,288 1,013,429
Reserves 14 23,820 23,820
Accumulated Funds (609,631) (601,056)
TOTAL EQUITY 477,477 436,193
The Statement of Financial Position is to be read in conjunction with the notes to the financial statements.
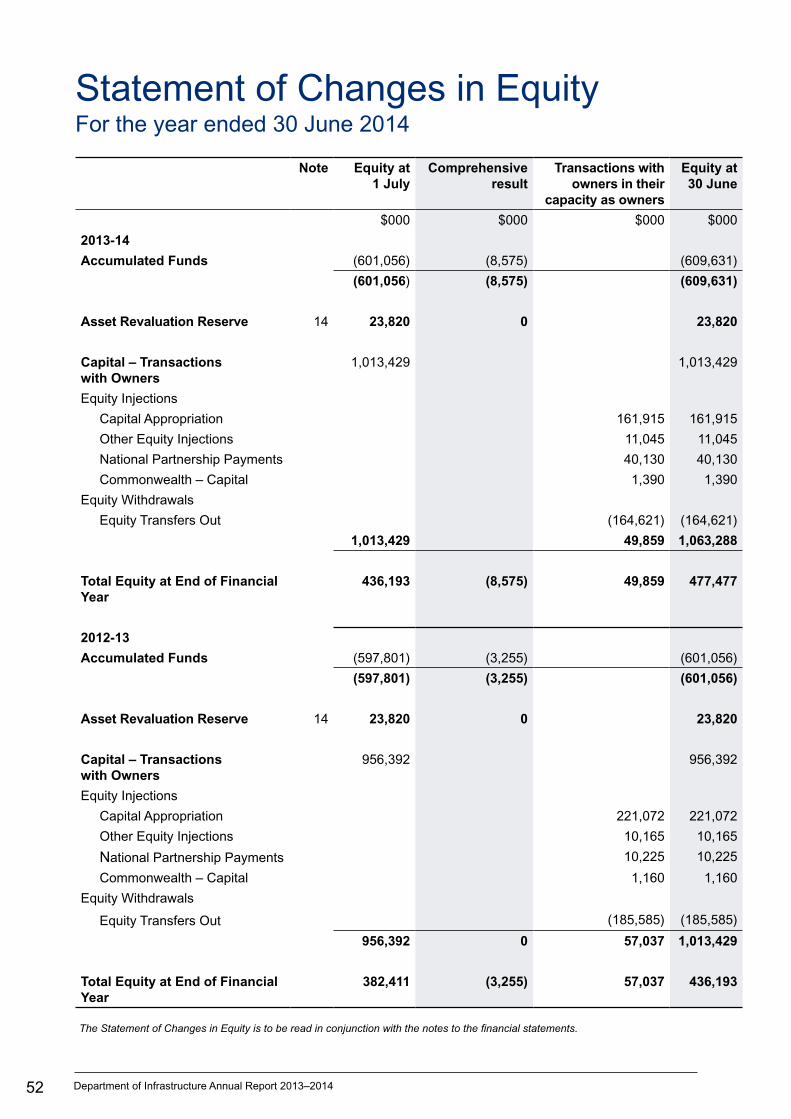
52 Department of Infrastructure Annual Report 2013–2014
Statement of Changes in EquityFor the year ended 30 June 2014
Note Equity at 1 July
Comprehensive result
Transactions with owners in their
capacity as owners
Equity at 30 June
$000 $000 $000 $000
2013-14
Accumulated Funds (601,056) (8,575) (609,631)
(601,056) (8,575) (609,631)
Asset Revaluation Reserve 14 23,820 0 23,820
Capital – Transactions with Owners
1,013,429 1,013,429
Equity Injections
Capital Appropriation 161,915 161,915
Other Equity Injections 11,045 11,045
National Partnership Payments 40,130 40,130
Commonwealth – Capital 1,390 1,390
Equity Withdrawals
Equity Transfers Out (164,621) (164,621)
1,013,429 49,859 1,063,288
Total Equity at End of Financial Year
436,193 (8,575) 49,859 477,477
2012-13
Accumulated Funds (597,801) (3,255) (601,056)
(597,801) (3,255) (601,056)
Asset Revaluation Reserve 14 23,820 0 23,820
Capital – Transactions with Owners
956,392 956,392
Equity Injections
Capital Appropriation 221,072 221,072
Other Equity Injections 10,165 10,165
National Partnership Payments 10,225 10,225
Commonwealth – Capital 1,160 1,160
Equity Withdrawals
Equity Transfers Out (185,585) (185,585)
956,392 0 57,037 1,013,429
Total Equity at End of Financial Year
382,411 (3,255) 57,037 436,193
The Statement of Changes in Equity is to be read in conjunction with the notes to the financial statements.
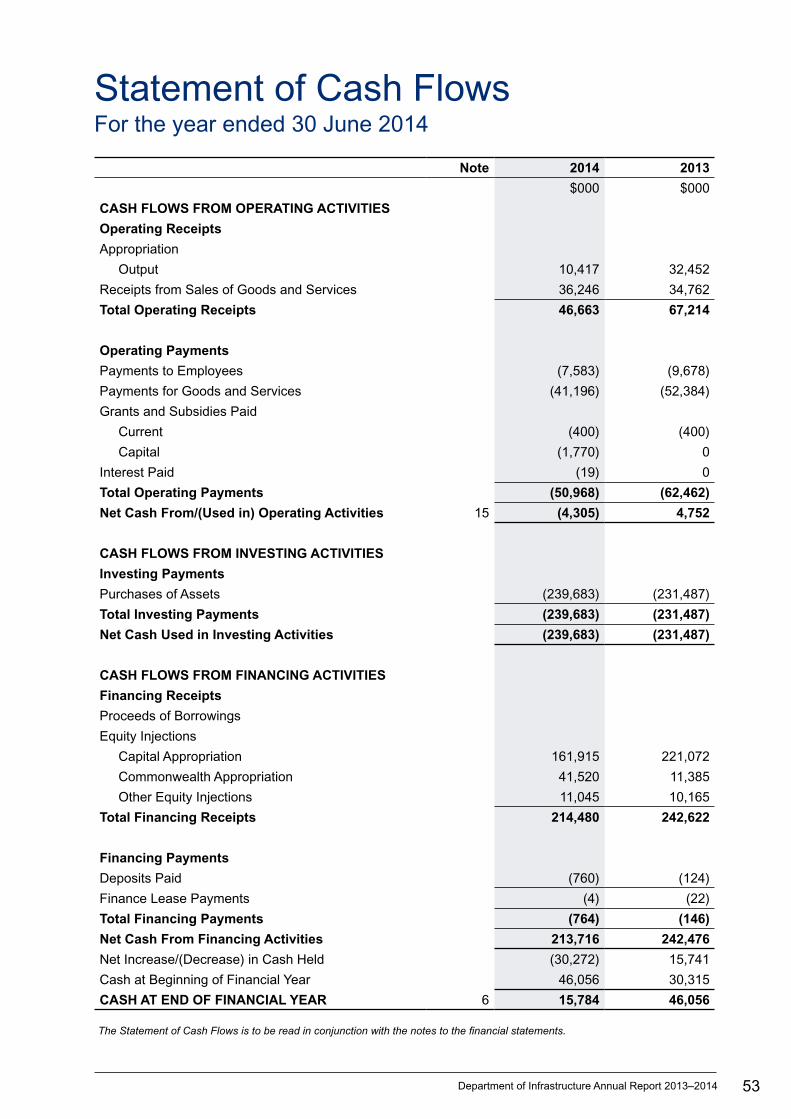
53Department of Infrastructure Annual Report 2013–2014
Statement of Cash Flows For the year ended 30 June 2014
Note 2014 2013
$000 $000
CASH FLOWS FROM OPERATING ACTIVITIES
Operating Receipts
Appropriation
Output 10,417 32,452
Receipts from Sales of Goods and Services 36,246 34,762
Total Operating Receipts 46,663 67,214
Operating Payments
Payments to Employees (7,583) (9,678)
Payments for Goods and Services (41,196) (52,384)
Grants and Subsidies Paid
Current (400) (400)
Capital (1,770) 0
Interest Paid (19) 0
Total Operating Payments (50,968) (62,462)
Net Cash From/(Used in) Operating Activities 15 (4,305) 4,752
CASH FLOWS FROM INVESTING ACTIVITIES
Investing Payments
Purchases of Assets (239,683) (231,487)
Total Investing Payments (239,683) (231,487)
Net Cash Used in Investing Activities (239,683) (231,487)
CASH FLOWS FROM FINANCING ACTIVITIES
Financing Receipts
Proceeds of Borrowings
Equity Injections
Capital Appropriation 161,915 221,072
Commonwealth Appropriation 41,520 11,385
Other Equity Injections 11,045 10,165
Total Financing Receipts 214,480 242,622
Financing Payments
Deposits Paid (760) (124)
Finance Lease Payments (4) (22)
Total Financing Payments (764) (146)
Net Cash From Financing Activities 213,716 242,476
Net Increase/(Decrease) in Cash Held (30,272) 15,741
Cash at Beginning of Financial Year 46,056 30,315
CASH AT END OF FINANCIAL YEAR 6 15,784 46,056
The Statement of Cash Flows is to be read in conjunction with the notes to the financial statements.
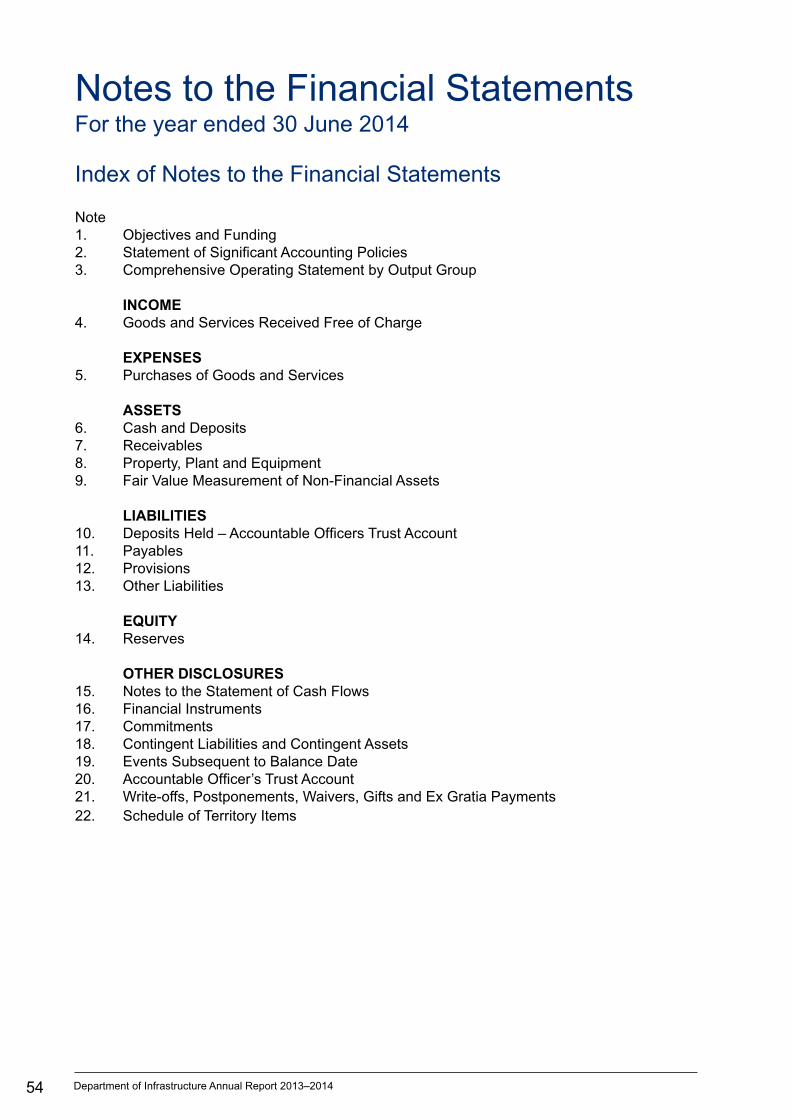
54 Department of Infrastructure Annual Report 2013–2014
Notes to the Financial StatementsFor the year ended 30 June 2014
Index of Notes to the Financial Statements
Note1. Objectives and Funding2. Statement of Significant Accounting Policies 3. Comprehensive Operating Statement by Output Group
INCOME4. Goods and Services Received Free of Charge
EXPENSES5. Purchases of Goods and Services
ASSETS6. Cash and Deposits7. Receivables8. Property, Plant and Equipment9. Fair Value Measurement of Non-Financial Assets
LIABILITIES10. Deposits Held – Accountable Officers Trust Account11. Payables12. Provisions13. Other Liabilities
EQUITY14. Reserves
OTHER DISCLOSURES15. Notes to the Statement of Cash Flows 16. Financial Instruments17. Commitments18. Contingent Liabilities and Contingent Assets19. Events Subsequent to Balance Date20. Accountable Officer’s Trust Account21. Write-offs, Postponements, Waivers, Gifts and Ex Gratia Payments22. Schedule of Territory Items

55Department of Infrastructure Annual Report 2013–2014
1. Objectives and FundingThe Department of Infrastructure’s (DoI) vision is to be recognised as the experts in government, achieving best practice infrastructure programming, procurement and construction, whilst maximising the use of Territory business and resources.
DoI is predominantly funded by, and is dependent on, the receipt of Parliamentary appropriations. The financial statements encompass all funds through which the agency controls resources to carry on its functions and deliver outputs. For reporting purposes, outputs delivered by the agency are summarised into output groups. Note 3 provides summary financial information in the form of a Comprehensive Operating Statement by output group.
2. Statement of Significant Accounting Policiesa) Basis of AccountingThe financial statements have been prepared in accordance with the requirements of the Financial Management Act and related Treasurer’s Directions. The Financial Management Act requires the Department of Infrastructure to prepare financial statements for the year ended 30 June 2014 based on the form determined by the Treasurer. The form of agency financial statements is to include:
i. a Certification of the Financial Statements;
ii. a Comprehensive Operating Statement;
iii. a Statement of Financial Position;
iv. a Statement of Changes in Equity;
v. a Statement of Cash Flows; and
vi. applicable explanatory notes to the financial statements.
The financial statements have been prepared using the accrual basis of accounting, which recognises the effect of financial transactions and events when they occur, rather than when cash is paid out or received. As part of the preparation of the financial statements, all intra-agency transactions and balances have been eliminated.
Except where stated, the financial statements have also been prepared in accordance with the historical cost convention.
The form of the agency financial statements is also consistent with the requirements of Australian Accounting Standards. The effects of all relevant new and revised Standards and Interpretations issued by the Australian Accounting Standards Board (AASB) that are effective for the current annual reporting period have been evaluated. The Standards and Interpretations and their impacts are;
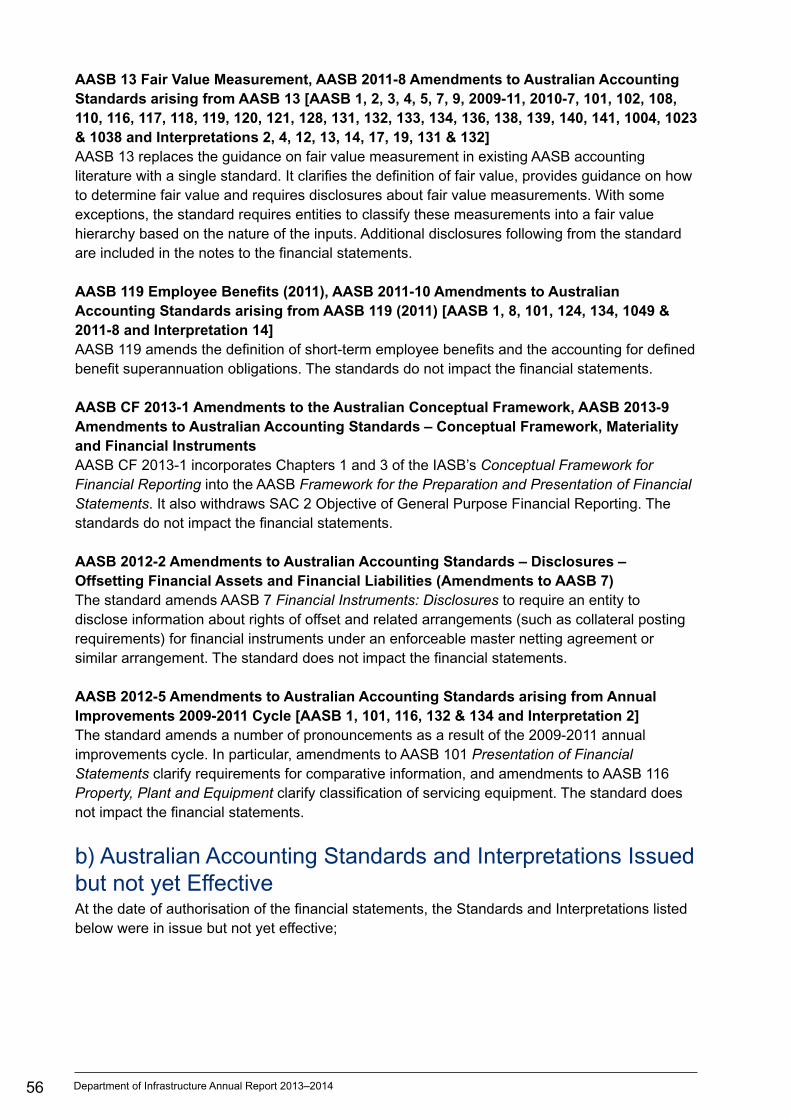
56 Department of Infrastructure Annual Report 2013–2014
AASB 13 Fair Value Measurement, AASB 2011-8 Amendments to Australian Accounting Standards arising from AASB 13 [AASB 1, 2, 3, 4, 5, 7, 9, 2009-11, 2010-7, 101, 102, 108, 110, 116, 117, 118, 119, 120, 121, 128, 131, 132, 133, 134, 136, 138, 139, 140, 141, 1004, 1023 & 1038 and Interpretations 2, 4, 12, 13, 14, 17, 19, 131 & 132] AASB 13 replaces the guidance on fair value measurement in existing AASB accounting literature with a single standard. It clarifies the definition of fair value, provides guidance on how to determine fair value and requires disclosures about fair value measurements. With some exceptions, the standard requires entities to classify these measurements into a fair value hierarchy based on the nature of the inputs. Additional disclosures following from the standard are included in the notes to the financial statements.
AASB 119 Employee Benefits (2011), AASB 2011-10 Amendments to Australian Accounting Standards arising from AASB 119 (2011) [AASB 1, 8, 101, 124, 134, 1049 & 2011-8 and Interpretation 14] AASB 119 amends the definition of short-term employee benefits and the accounting for defined benefit superannuation obligations. The standards do not impact the financial statements.
AASB CF 2013-1 Amendments to the Australian Conceptual Framework, AASB 2013-9 Amendments to Australian Accounting Standards – Conceptual Framework, Materiality and Financial Instruments AASB CF 2013-1 incorporates Chapters 1 and 3 of the IASB’s Conceptual Framework for Financial Reporting into the AASB Framework for the Preparation and Presentation of Financial Statements. It also withdraws SAC 2 Objective of General Purpose Financial Reporting. The standards do not impact the financial statements.
AASB 2012-2 Amendments to Australian Accounting Standards – Disclosures – Offsetting Financial Assets and Financial Liabilities (Amendments to AASB 7) The standard amends AASB 7 Financial Instruments: Disclosures to require an entity to disclose information about rights of offset and related arrangements (such as collateral posting requirements) for financial instruments under an enforceable master netting agreement or similar arrangement. The standard does not impact the financial statements.
AASB 2012-5 Amendments to Australian Accounting Standards arising from Annual Improvements 2009-2011 Cycle [AASB 1, 101, 116, 132 & 134 and Interpretation 2] The standard amends a number of pronouncements as a result of the 2009-2011 annual improvements cycle. In particular, amendments to AASB 101 Presentation of Financial Statements clarify requirements for comparative information, and amendments to AASB 116 Property, Plant and Equipment clarify classification of servicing equipment. The standard does not impact the financial statements.
b) Australian Accounting Standards and Interpretations Issued but not yet EffectiveAt the date of authorisation of the financial statements, the Standards and Interpretations listed below were in issue but not yet effective;
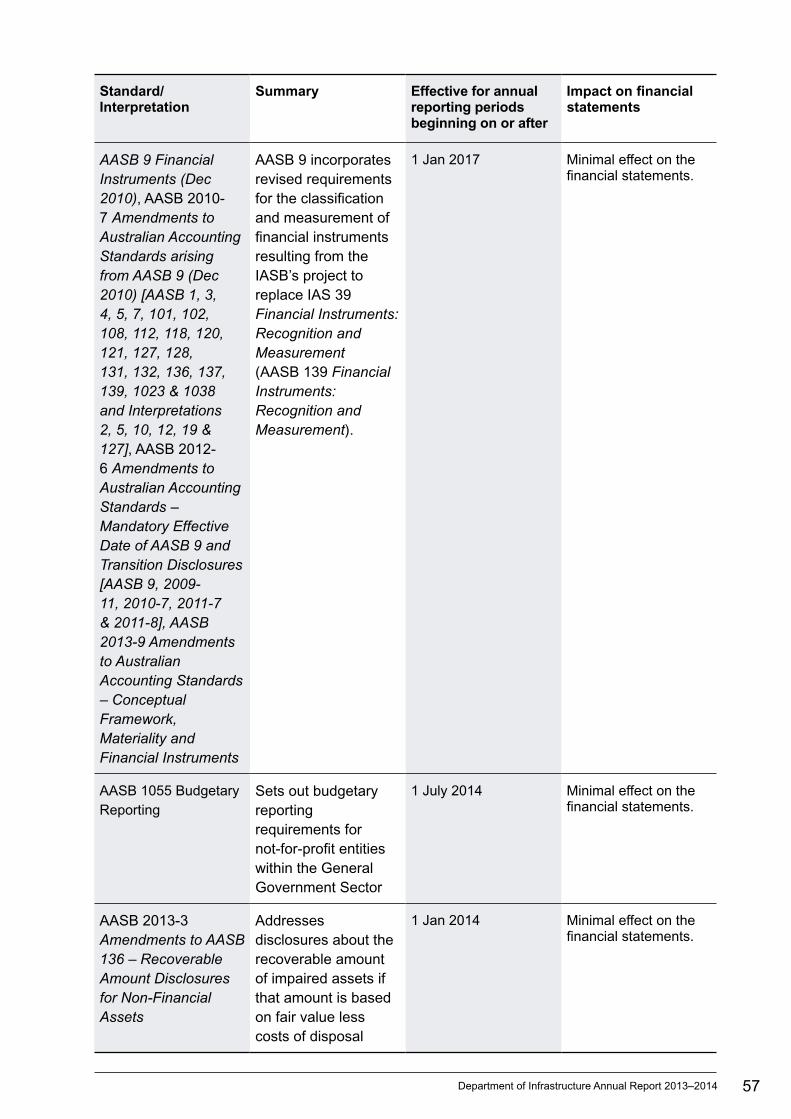
57Department of Infrastructure Annual Report 2013–2014
Standard/Interpretation
Summary Effective for annual reporting periods beginning on or after
Impact on financial statements
AASB 9 Financial Instruments (Dec 2010), AASB 2010-7 Amendments to Australian Accounting Standards arising from AASB 9 (Dec 2010) [AASB 1, 3, 4, 5, 7, 101, 102, 108, 112, 118, 120, 121, 127, 128, 131, 132, 136, 137, 139, 1023 & 1038 and Interpretations 2, 5, 10, 12, 19 & 127], AASB 2012-6 Amendments to Australian Accounting Standards – Mandatory Effective Date of AASB 9 and Transition Disclosures [AASB 9, 2009-11, 2010-7, 2011-7 & 2011-8], AASB 2013-9 Amendments to Australian Accounting Standards – Conceptual Framework, Materiality and Financial Instruments
AASB 9 incorporates revised requirements for the classification and measurement of financial instruments resulting from the IASB’s project to replace IAS 39 Financial Instruments: Recognition and Measurement (AASB 139 Financial Instruments: Recognition and Measurement).
1 Jan 2017 Minimal effect on the financial statements.
AASB 1055 Budgetary Reporting
Sets out budgetary reporting requirements for not-for-profit entities within the General Government Sector
1 July 2014 Minimal effect on the financial statements.
AASB 2013-3 Amendments to AASB 136 – Recoverable Amount Disclosures for Non-Financial Assets
Addresses disclosures about the recoverable amount of impaired assets if that amount is based on fair value less costs of disposal
1 Jan 2014 Minimal effect on the financial statements.
58 Department of Infrastructure Annual Report 2013–2014
c) Agency and Territory ItemsThe financial statements of the Department of Infrastructure (DoI) include income, expenses, assets, liabilities and equity over which DoI has control (Agency items). Certain items, while managed by the agency, are controlled and recorded by the Territory rather than the agency (Territory items). Territory items are recognised and recorded in the Central Holding Authority as discussed below.
Central Holding AuthorityThe Central Holding Authority is the ‘parent body’ that represents the Government’s ownership interest in Government-controlled entities.
The Central Holding Authority also records all Territory items, such as income, expenses, assets and liabilities controlled by the Government and managed by agencies on behalf of the Government. The main Territory item is Territory income, which includes taxation and royalty revenue, Commonwealth general purpose funding (such as GST revenue), fines, and statutory fees and charges.
The Central Holding Authority also holds certain Territory assets not assigned to agencies as well as certain Territory liabilities that are not practical or effective to assign to individual agencies such as unfunded superannuation and long service leave.
The Central Holding Authority recognises and records all Territory items, and as such, these items are not included in the agency’s financial statements. However, as the agency is accountable for certain Territory items managed on behalf of Government, these items have been separately disclosed in Note 22 – Schedule of Territory Items.
d) ComparativesWhere necessary, comparative information for the 2012-13 financial year has been reclassified to provide consistency with current year disclosures.
e) Presentation and Rounding of AmountsAmounts in the financial statements and notes to the financial statements are presented in Australian dollars and have been rounded to the nearest thousand dollars, with amounts of $500 or less being rounded down to zero.
f) Changes in Accounting PoliciesThere have been no changes to accounting policies adopted in 2013-14 as a result of management decisions.
g) Accounting Judgments and Estimates The preparation of the financial report requires the making of judgments and estimates that affect the recognised amounts of assets, liabilities, revenues and expenses and the disclosure of contingent liabilities. The estimates and associated assumptions are based on historical experience and various other factors that are believed to be reasonable under the
59Department of Infrastructure Annual Report 2013–2014
circumstances, the results of which form the basis for making judgments about the carrying values of assets and liabilities that are not readily apparent from other sources. Actual results may differ from these estimates.
The estimates and underlying assumptions are reviewed on an ongoing basis. Revisions to accounting estimates are recognised in the period in which the estimate is revised if the revision affects only that period, or in the period of the revision and future periods if the revision affects both current and future periods.
Judgments and estimates that have significant effects on the financial statements are disclosed in the relevant notes to the financial statements. Notes that include significant judgments and estimates are:
O Employee Benefits – Note 2(s) and Note 12: Non-current liabilities in respect of employee benefits are measured as the present value of estimated future cash outflows based on the appropriate Government bond rate, estimates of future salary and wage levels and employee periods of service.
O Contingent Liabilities – Note 18: The present value of material quantifiable contingent liabilities are calculated using a discount rate based on the published 10-year Government bond rate.
O Allowance for Impairment Losses – Note 2(p), Note 7: Receivables and Note 16 : Financial Instruments.
O Depreciation and Amortisation – Note 2(k) and Note 8: Property, Plant and Equipment.
h) Goods and Services TaxIncome, expenses and assets are recognised net of the amount of Goods and Services Tax (GST), except where the amount of GST incurred on a purchase of goods and services is not recoverable from the Australian Tax Office (ATO). In these circumstances the GST is recognised as part of the cost of acquisition of the asset or as part of the expense.
Receivables and payables are stated with the amount of GST included. The net amount of GST recoverable from, or payable to, the ATO is included as part of receivables or payables in the Statement of Financial Position.
Cash flows are included in the Statement of Cash Flows on a gross basis. The GST components of cash flows arising from investing and financing activities, which are recoverable from, or payable to, the ATO are classified as operating cash flows. Commitments and contingencies are disclosed net of the amount of GST recoverable or payable unless otherwise specified.
i) Income RecognitionIncome encompasses both revenue and gains.
Income is recognised at the fair value of the consideration received, exclusive of the amount of GST. Exchanges of goods or services of the same nature and value without any cash consideration being exchanged are not recognised as income.
60 Department of Infrastructure Annual Report 2013–2014
Grants and Other ContributionsGrants, donations, gifts and other non-reciprocal contributions are recognised as revenue when the agency obtains control over the assets comprising the contributions. Control is normally obtained upon receipt.
Contributions are recognised at their fair value. Contributions of services are only recognised when a fair value can be reliably determined and the services would be purchased if not donated.
AppropriationOutput appropriation is the operating payment to each agency for the outputs they provide and is calculated as the net cost of agency outputs after taking into account funding from agency income. It does not include any allowance for major non-cash costs such as depreciation.
Commonwealth appropriation follows from the Intergovernmental Agreement on Federal Financial Relations, resulting in Specific Purpose Payments (SPPs) and National Partnership (NP) payments being made by the Commonwealth Treasury to state treasuries, in a manner similar to arrangements for GST payments. These payments are received by the Department of Treasury and Finance on behalf of the Central Holding Authority and then on-passed to the relevant agencies as Commonwealth appropriation.
Revenue in respect of appropriations is recognised in the period in which the agency gains control of the funds.
Sale of GoodsRevenue from the sale of goods is recognised (net of returns, discounts and allowances) when:
O the significant risks and rewards of ownership of the goods have transferred to the buyer;
O the agency retains neither continuing managerial involvement to the degree usually associated with ownership nor effective control over the goods sold;
O the amount of revenue can be reliably measured;
O it is probable that the economic benefits associated with the transaction will flow to the agency; and
O the costs incurred or to be incurred in respect of the transaction can be measured reliably.
Rendering of ServicesRevenue from rendering services is recognised by reference to the stage of completion of the contract. The revenue is recognised when:
O the amount of revenue, stage of completion and transaction costs incurred can be reliably measured; and
O it is probable that the economic benefits associated with the transaction will flow to the entity.
61Department of Infrastructure Annual Report 2013–2014
Goods and Services Received Free of ChargeGoods and services received free of charge are recognised as revenue when a fair value can be reliably determined and the resource would have been purchased if it had not been donated. Use of the resource is recognised as an expense.
Disposal of AssetsA gain or loss on disposal of assets is included as a gain or loss on the date control of the asset passes to the buyer, usually when an unconditional contract of sale is signed. The gain or loss on disposal is calculated as the difference between the carrying amount of the asset at the time of disposal and the net proceeds on disposal.
Contributions of AssetsContributions of assets and contributions to assist in the acquisition of assets, being non-reciprocal transfers, are recognised, unless otherwise determined by Government, as gains when the agency obtains control of the asset or contribution. Contributions are recognised at the fair value received or receivable.
j) Repairs and Maintenance ExpenseFunding is received for repairs and maintenance works associated with agency assets as part of output revenue. Costs associated with repairs and maintenance works on agency assets are expensed as incurred.
k) Depreciation and Amortisation ExpenseItems of property, plant and equipment, including buildings but excluding land, have limited useful lives and are depreciated or amortised using the straight-line method over their estimated useful lives.
Amortisation applies in relation to intangible non-current assets with limited useful lives and is calculated and accounted for in a similar manner to depreciation.
The estimated useful lives for each class of asset are in accordance with the Treasurer’s Directions and are determined as follows:
2014 2013
Buildings 20 - 50 years 20 - 50 years
Plant and Equipment 4 - 15 years 4 - 15 years
Computer Software 10 years 10 years
Aboriginal Land Under Finance Lease 40 years 40 years
Assets are depreciated or amortised from the date of acquisition or from the time an asset is completed and held ready for use.
62 Department of Infrastructure Annual Report 2013–2014
l) Interest ExpenseInterest expenses include interest and finance lease charges. Interest expenses are expensed in the period in which they are incurred.
m) Cash and DepositsFor the purposes of the Statement of Financial Position and the Statement of Cash Flows, cash includes cash on hand, cash at bank and cash equivalents. Cash equivalents are highly liquid short-term investments that are readily convertible to cash. Cash at bank includes monies held in the Accountable Officer’s Trust Account (AOTA) that are ultimately payable to the beneficial owner – refer also to Note 20.
n) ReceivablesReceivables include accounts receivable and other receivables and are recognised at fair value less any allowance for impairment losses.
The allowance for impairment losses represents the amount of receivables the agency estimates are likely to be uncollectible and are considered doubtful. Analyses of the age of the receivables that are past due as at the reporting date are disclosed in an aging schedule under credit risk in Note 16 Financial Instruments. Reconciliation of changes in the allowance accounts is also presented.
Accounts receivable are generally settled within 30 days.
o) Property, Plant and EquipmentAcquisitionsAll items of property, plant and equipment with a cost, or other value, equal to or greater than $10 000 are recognised in the year of acquisition and depreciated as outlined below. Items of property, plant and equipment below the $10 000 threshold are expensed in the year of acquisition.
The construction cost of property, plant and equipment includes the cost of materials and direct labour, and an appropriate proportion of fixed and variable overheads.
Complex AssetsMajor items of plant and equipment comprising a number of components that have different useful lives, are accounted for as separate assets. The components may be replaced during the useful life of the complex asset.
Subsequent Additional CostsCosts incurred on property, plant and equipment subsequent to initial acquisition are capitalised when it is probable that future economic benefits in excess of the originally assessed performance of the asset will flow to the agency in future years. Where these costs represent separate components of a complex asset, they are accounted for as separate assets and are separately depreciated over their expected useful lives.
63Department of Infrastructure Annual Report 2013–2014
Construction (Work in Progress)As part of the financial management framework, the Department of Infrastructure (DoI) is responsible for managing general government capital works projects on a whole of Government basis. Therefore appropriation for most agency capital works is provided directly to the DoI and the cost of construction work in progress is recognised as an asset of this Department. Once completed, capital works assets are transferred to the relevant agency.
p) Revaluations and ImpairmentRevaluation of AssetsSubsequent to initial recognition, assets belonging to the following classes of non-current assets are revalued with sufficient regularity to ensure that the carrying amount of these assets does not differ materially from their fair value at reporting date:
O land; and
O buildings.
Plant and equipment are stated at historical cost less depreciation, which is deemed to equate to fair value.
Impairment of AssetsAn asset is said to be impaired when the asset’s carrying amount exceeds its recoverable amount.
Non-current physical and intangible agency assets are assessed for indicators of impairment on an annual basis. If an indicator of impairment exists, the agency determines the asset’s recoverable amount. The asset’s recoverable amount is determined as the higher of the asset’s depreciated replacement cost and fair value less costs to sell. Any amount by which the asset’s carrying amount exceeds the recoverable amount is recorded as an impairment loss.
Impairment losses are recognised in the Comprehensive Operating Statement. They are disclosed as an expense unless the asset is carried at a revalued amount. Where the asset is measured at a revalued amount, the impairment loss is offset against the asset revaluation surplus for that class of asset to the extent that an available balance exists in the asset revaluation surplus.
In certain situations, an impairment loss may subsequently be reversed. Where an impairment loss is subsequently reversed, the carrying amount of the asset is increased to the revised estimate of its recoverable amount. A reversal of an impairment loss is recognised in the Comprehensive Operating Statement as income, unless the asset is carried at a revalued amount, in which case the impairment reversal results in an increase in the asset revaluation surplus. Note 14 provides additional information in relation to the asset revaluation surplus.
q) Leased AssetsLeases under which the agency assumes substantially all the risks and rewards of ownership of an asset are classified as finance leases. Other leases are classified as operating leases.
64 Department of Infrastructure Annual Report 2013–2014
Finance LeasesFinance leases are capitalised. A lease asset and lease liability equal to the lower of the fair value of the leased property and present value of the minimum lease payments, each determined at the inception of the lease, are recognised.
Lease payments are allocated between the principal component of the lease liability and the interest expense.
Operating LeasesOperating lease payments made at regular intervals throughout the term are expensed when the payments are due, except where an alternative basis is more representative of the pattern of benefits to be derived from the leased property. Lease incentives under an operating lease of a building or office space is recognised as an integral part of the consideration for the use of the leased asset. Lease incentives are to be recognised as a deduction of the lease expenses over the term of the lease.
r) PayablesLiabilities for accounts payable and other amounts payable are carried at cost, which is the fair value of the consideration to be paid in the future for goods and services received, whether or not billed to the agency. Accounts payable are normally settled within 30 days.
s) Employee Benefits Provision is made for employee benefits accumulated as a result of employees rendering services up to the reporting date. These benefits include wages and salaries and recreation leave. Liabilities arising in respect of wages and salaries, recreation leave and other employee benefit liabilities that fall due within twelve months of reporting date are classified as current liabilities and are measured at amounts expected to be paid. Non-current employee benefit liabilities that fall due after twelve months of the reporting date are measured at present value, calculated using the Government long-term bond rate.
No provision is made for sick leave, which is non-vesting, as the anticipated pattern of future sick leave to be taken is less than the entitlement accruing in each reporting period.
Employee benefit expenses are recognised on a net basis in respect of the following categories:
O wages and salaries, non-monetary benefits, recreation leave, sick leave and other leave entitlements; and
O other types of employee benefits.
As part of the financial management framework, the Central Holding Authority assumes the long service leave liabilities of Government agencies, including the Department of Infrastructure and as such no long service leave liability is recognised in agency financial statements.
65Department of Infrastructure Annual Report 2013–2014
t) SuperannuationEmployees’ superannuation entitlements are provided through the:
O Northern Territory Government and Public Authorities Superannuation Scheme (NTGPASS);
O Commonwealth Superannuation Scheme (CSS); or
O non-government employee-nominated schemes for those employees commencing on or after 10 August 1999.
The agency makes superannuation contributions on behalf of its employees to the Central Holding Authority or non-government employee-nominated schemes. Superannuation liabilities related to government superannuation schemes are held by the Central Holding Authority and as such are not recognised in agency financial statements.
u) Contributions by and Distributions to GovernmentThe agency may receive contributions from Government where the Government is acting as owner of the agency. Conversely, the agency may make distributions to Government. In accordance with the Financial Management Act and Treasurer’s Directions, certain types of contributions and distributions, including those relating to administrative restructures, have been designated as contributions by, and distributions to, Government. These designated contributions and distributions are treated by the agency as adjustments to equity.
The Statement of Changes in Equity provides additional information in relation to contributions by, and distributions to, Government.
v) CommitmentsDisclosures in relation to capital and other commitments, including lease commitments are shown at Note 17.
Commitments are those contracted as at 30 June where the amount of the future commitment can be reliably measured.
w) Financial InstrumentsA financial instrument is a contract that gives rise to a financial asset of one entity and a financial liability or equity instrument of another entity. Financial assets and liabilities are recognised on the Statement of Financial Position when the agency becomes a party to the contractual provisions of the financial instrument. The agency’s financial instruments include cash and deposits; receivables; finance leases; deposits held; and payables.
Exposure to interest rate risk, foreign exchange risk, credit risk, price risk and liquidity risk arise in the normal course of activities. The agency’s investments, loans and placements, and borrowings are predominantly managed through the NTTC and TIO adopting strategies to minimise the risk. Derivative financial arrangements are also utilised to manage financial risks inherent in the management of these financial instruments. These arrangements include swaps,
66 Department of Infrastructure Annual Report 2013–2014
forward interest rate agreements and other hedging instruments to manage fluctuations in interest or exchange rates.
Classification of Financial InstrumentsAASB 7 Financial Instruments: Disclosures requires financial instruments to be classified and disclosed within specific categories depending on their nature and purpose.
Financial assets are classified into the following categories:
O financial assets at fair value through profit or loss;
O held-to-maturity investments;
O loans and receivables; and
O available-for-sale financial assets.
Financial liabilities are classified into the following categories:
O financial liabilities at fair value through profit or loss (FVTPL); and
O financial liabilities at amortised cost.
Financial Assets or Financial Liabilities at Fair Value through Profit or LossFinancial instruments are classified as at FVTPL when the instrument is either held for trading or is designated as at FVTPL.
An instrument is classified as held for trading if it is:
O acquired or incurred principally for the purpose of selling or repurchasing it in the near term with an intention of making a profit; or
O part of a portfolio of identified financial instruments that are managed together and for which there is evidence of a recent actual pattern of short-term profit-taking; or
O a derivative that is not a financial guarantee contract or a designated and effective hedging instrument.
A financial instrument may be designated as at FVTPL upon initial recognition if:
O such designation eliminates or significantly reduces a measurement or recognition inconsistency that would otherwise arise; or
O the instrument forms part of a group of financial instruments, which is managed and its performance is evaluated on a fair value basis, in accordance with a documented risk management or investment strategy, and information about the grouping is provided internally on that basis; or
O it forms part of a contract containing one or more embedded derivatives, and AASB 139 Financial Instruments: Recognition and Measurement permits the contract to be designated as at FVTPL.
Held-to-Maturity InvestmentsNon-derivative financial assets with fixed or determinable payments and fixed maturity dates that the entity has the positive intent and ability to hold to maturity are classified as held-to-maturity investments. Held-to-maturity investments are recorded at amortised cost using the effective interest method less impairment, with revenue recognised on an effective yield basis.
67Department of Infrastructure Annual Report 2013–2014
Loans and ReceivablesFor details refer to Note 2 (n).
Available-for-Sale Financial AssetsAvailable-for-sale financial assets are those non-derivative financial assets, principally equity securities that are designated as available-for-sale or are not classified as any of the three preceding categories. After initial recognition available-for-sale securities are measured at fair value with gains or losses being recognised as a separate component of equity until the investment is derecognised or until the investment is determined to be impaired, at which time the cumulative gain or loss previously reported in equity is recognised in the Comprehensive Operating Statement.
Financial Liabilities at Amortised CostAmortised cost is calculated using the effective interest method.
DerivativesThe agency enters into a variety of derivative financial instruments to manage its exposure to interest rate risk. The agency does not speculate on trading of derivatives.
Derivatives are initially recognised at fair value on the date a derivative contract is entered in to and are subsequently remeasured at their fair value at each reporting date. The resulting gain or loss is recognised in the Comprehensive Operating Statement immediately unless the derivative is designated and qualifies as an effective hedging instrument, in which event, the timing of the recognition in the Comprehensive Operating Statement depends on the nature of the hedge relationship. Application of hedge accounting will only be available where specific designation and effectiveness criteria are satisfied.
Netting of Swap TransactionsThe agency, from time to time, may facilitate certain structured finance arrangements, where a legally recognised right to set-off financial assets and liabilities exists, and the Territory intends to settle on a net basis. Where these arrangements occur, the revenues and expenses are offset and the net amount is recognised in the Comprehensive Operating Statement.
Note 16 provides additional information on financial instruments.
x) Fair Value MeasurementFair value is the price that would be received to sell an asset or paid to transfer a liability in an orderly transaction between market participants at the measurement date.
Fair value measurement of a non-financial asset takes into account a market participant’s ability to generate economic benefits by using the asset in its highest and best use or by selling it to another market participant that would use the asset in its highest and best use. The highest and best use takes into account the use of the asset that is physically possible, legally permissible and financially feasible.
68 Department of Infrastructure Annual Report 2013–2014
When measuring fair value, the valuation techniques used maximise the use of relevant observable inputs and minimise the use of unobservable inputs. Unobservable inputs are used to the extent that sufficient relevant and reliable observable inputs are not available for similar assets/liabilities.
Observable inputs are publicly available data that are relevant to the characteristics of the assets/liabilities being valued. Observable inputs used by the agency include, but are not limited to, published sales data for land and general office buildings.
Unobservable inputs are data, assumptions and judgments that are not available publicly, but are relevant to the characteristics of the assets/liabilities being valued. Such inputs include internal agency adjustments to observable data to take account of particular and potentially unique characteristics/functionality of assets/liabilities and assessments of physical condition and remaining useful life.
All assets and liabilities for which fair value is measured or disclosed in the financial statements are categorised within the following fair value hierarchy based on the inputs used:
Level 1 – inputs are quoted prices in active markets for identical assets or liabilities;
Level 2 – inputs are inputs other than quoted prices included within Level 1 that are observable for the asset or liability, either directly or indirectly; and
Level 3 – inputs are unobservable.
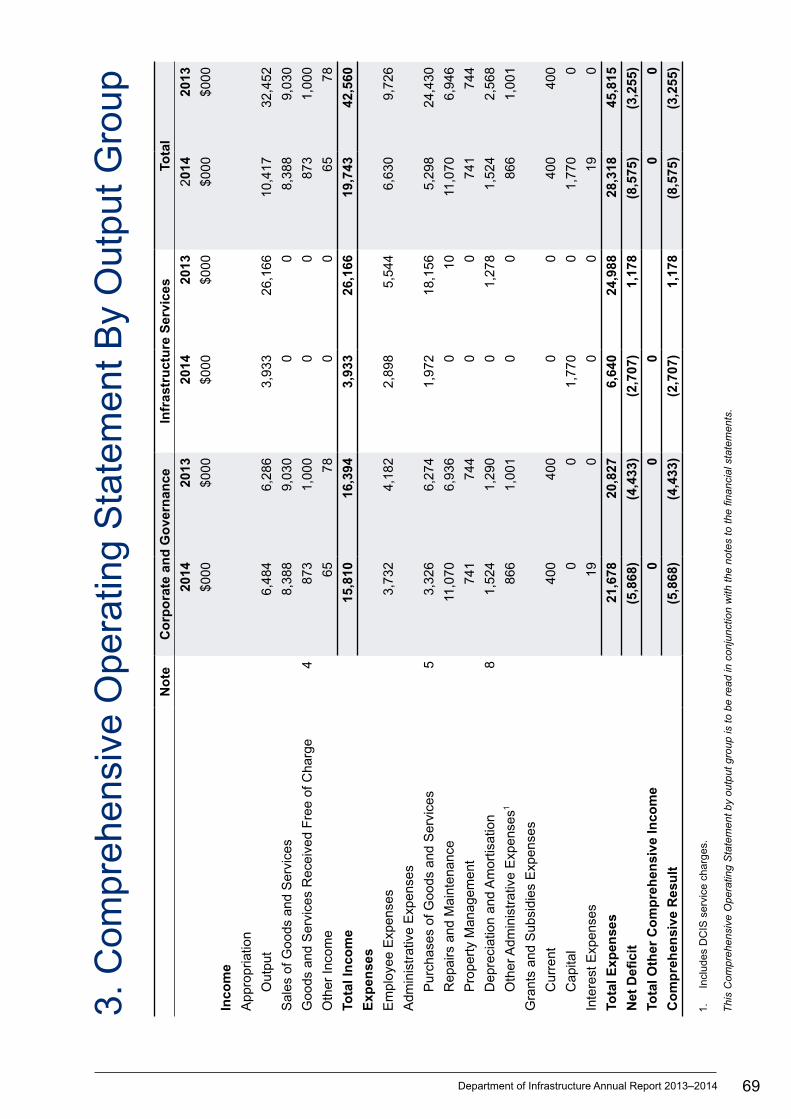
69Department of Infrastructure Annual Report 2013–2014
3. C
ompr
ehen
sive
Ope
ratin
g S
tate
men
t By
Out
put G
roup
No
teC
orp
ora
te a
nd
Go
vern
ance
Infr
astr
uct
ure
Ser
vice
sTo
tal
2014
2013
2014
2013
2014
2013
$0
00$0
00$0
00$0
00$0
00$0
00
Inco
me
App
ropr
iatio
n
Out
put
6,48
46,
286
3,93
326
,166
10,4
1732
,452
Sal
es o
f Goo
ds a
nd S
ervi
ces
8,38
89,
030
00
8,38
8 9,
030
Goo
ds a
nd S
ervi
ces
Rec
eive
d F
ree
of C
harg
e4
873
1,00
00
087
3 1,
000
Oth
er In
com
e 65
780
065
78
Tota
l In
com
e 15
,810
16,3
943,
933
26,1
66
19,7
43
42,5
60
Exp
ense
s
Em
ploy
ee E
xpen
ses
3,73
24,
182
2,89
85,
544
6,63
0 9,
726
Adm
inis
trat
ive
Exp
ense
s
Pur
chas
es o
f Goo
ds a
nd S
ervi
ces
53,
326
6,27
41,
972
18,1
565,
298
24,4
30
Rep
airs
and
Mai
nten
ance
11,0
706,
936
010
11,0
70
6,94
6
Pro
pert
y M
anag
emen
t74
174
40
074
174
4
Dep
reci
atio
n an
d A
mor
tisat
ion
81,
524
1,29
00
1,27
81,
524
2,56
8
Oth
er A
dmin
istr
ativ
e E
xpen
ses1
866
1,00
10
086
6 1,
001
Gra
nts
and
Sub
sidi
es E
xpen
ses
Cur
rent
400
400
00
400
400
Cap
ital
00
1,77
00
1,77
0 0
Inte
rest
Exp
ense
s19
00
019
0
Tota
l Exp
ense
s21
,678
20,8
27
6,64
0 24
,988
28
,318
45
,815
Net
Defi
cit
(5,8
68)
(4,4
33)
(2,7
07)
1,17
8 (8
,575
)(3
,255
)
Tota
l Oth
er C
om
pre
hen
sive
Inco
me
00
00
0
Co
mp
reh
ensi
ve R
esu
lt(5
,868
)(4
,433
)(2
,707
)1,
178
(8,5
75)
(3,2
55)
1.
Incl
udes
DC
IS s
ervi
ce c
harg
es.
Thi
s C
ompr
ehen
sive
Ope
ratin
g S
tate
men
t by
outp
ut g
roup
is to
be
read
in c
onju
nctio
n w
ith th
e no
tes
to th
e fin
anci
al s
tate
men
ts.

70 Department of Infrastructure Annual Report 2013–2014
4. Goods and Services Received Free of ChargeGoods and services received free of charge 2014 2013
$000 $000
Corporate and Information Services 873 1,000
873 1,000
5. Purchases of Goods and ServicesThe net deficit has been arrived at after charging the following expenses:
Goods and services expenses 2014 2013
$000 $000
Consultants1 683 12,254
Marketing and Promotion2 33 95
Document Production 11 26
Legal Expenses3 1,800 4,493
Recruitment Expenses4 2 8
Information Technology Charges 540 1,335
Agent Service Arrangements 1,567 5,051
Communications 112 124
IT Software and Hardware 4 12
Motor Vehicle Expenses 52 167
Training and Study 107 347
Travelling Allowance 6 8
Official Duty Fares 25 62
Other 356 448
5,298 24,430
1. Includes marketing, promotion and IT consultants.
2. Includes advertising for marketing and promotion but excludes marketing and promotion consultants’ expenses, which are incorporated in the consultants’ category.
3. Includes legal fees, claim and settlement costs.
4. Includes recruitment-related advertising costs.
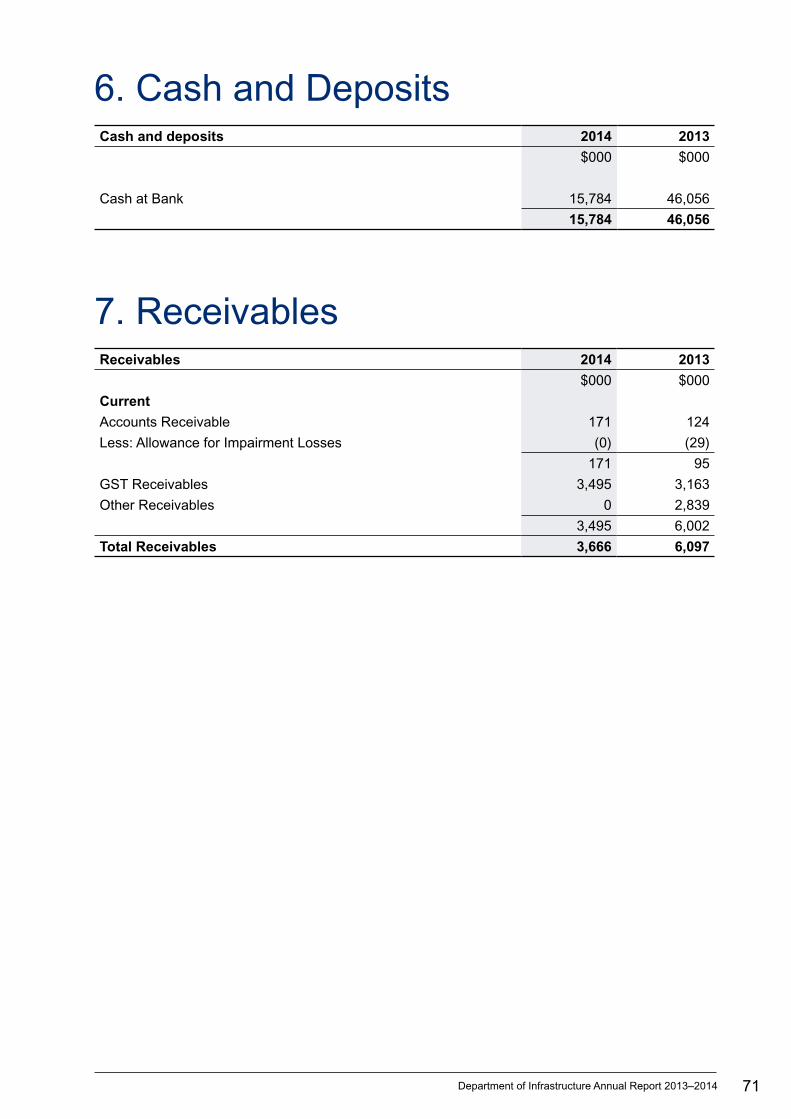
71Department of Infrastructure Annual Report 2013–2014
6. Cash and DepositsCash and deposits 2014 2013
$000 $000
Cash at Bank 15,784 46,056
15,784 46,056
7. ReceivablesReceivables 2014 2013
$000 $000
Current
Accounts Receivable 171 124
Less: Allowance for Impairment Losses (0) (29)
171 95
GST Receivables 3,495 3,163
Other Receivables 0 2,839
3,495 6,002
Total Receivables 3,666 6,097
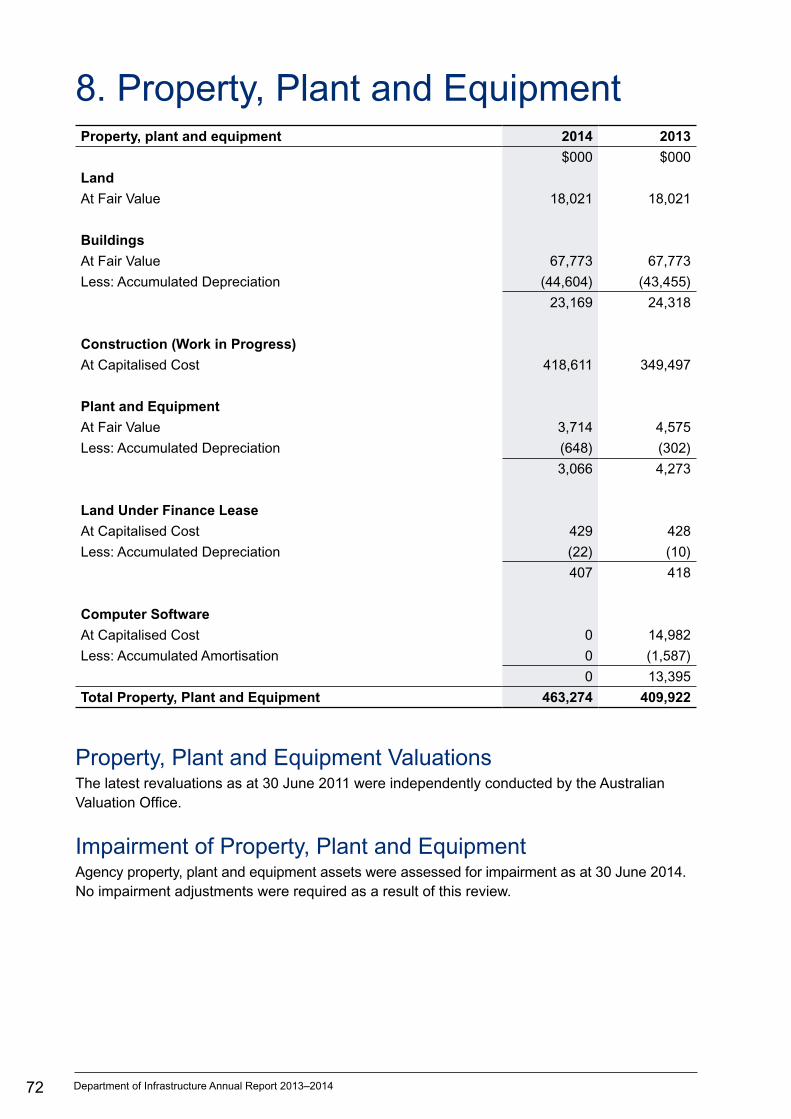
72 Department of Infrastructure Annual Report 2013–2014
8. Property, Plant and EquipmentProperty, plant and equipment 2014 2013
$000 $000
Land
At Fair Value 18,021 18,021
Buildings
At Fair Value 67,773 67,773
Less: Accumulated Depreciation (44,604) (43,455)
23,169 24,318
Construction (Work in Progress)
At Capitalised Cost 418,611 349,497
Plant and Equipment
At Fair Value 3,714 4,575
Less: Accumulated Depreciation (648) (302)
3,066 4,273
Land Under Finance Lease
At Capitalised Cost 429 428
Less: Accumulated Depreciation (22) (10)
407 418
Computer Software
At Capitalised Cost 0 14,982
Less: Accumulated Amortisation 0 (1,587)
0 13,395
Total Property, Plant and Equipment 463,274 409,922
Property, Plant and Equipment ValuationsThe latest revaluations as at 30 June 2011 were independently conducted by the Australian Valuation Office.
Impairment of Property, Plant and EquipmentAgency property, plant and equipment assets were assessed for impairment as at 30 June 2014. No impairment adjustments were required as a result of this review.
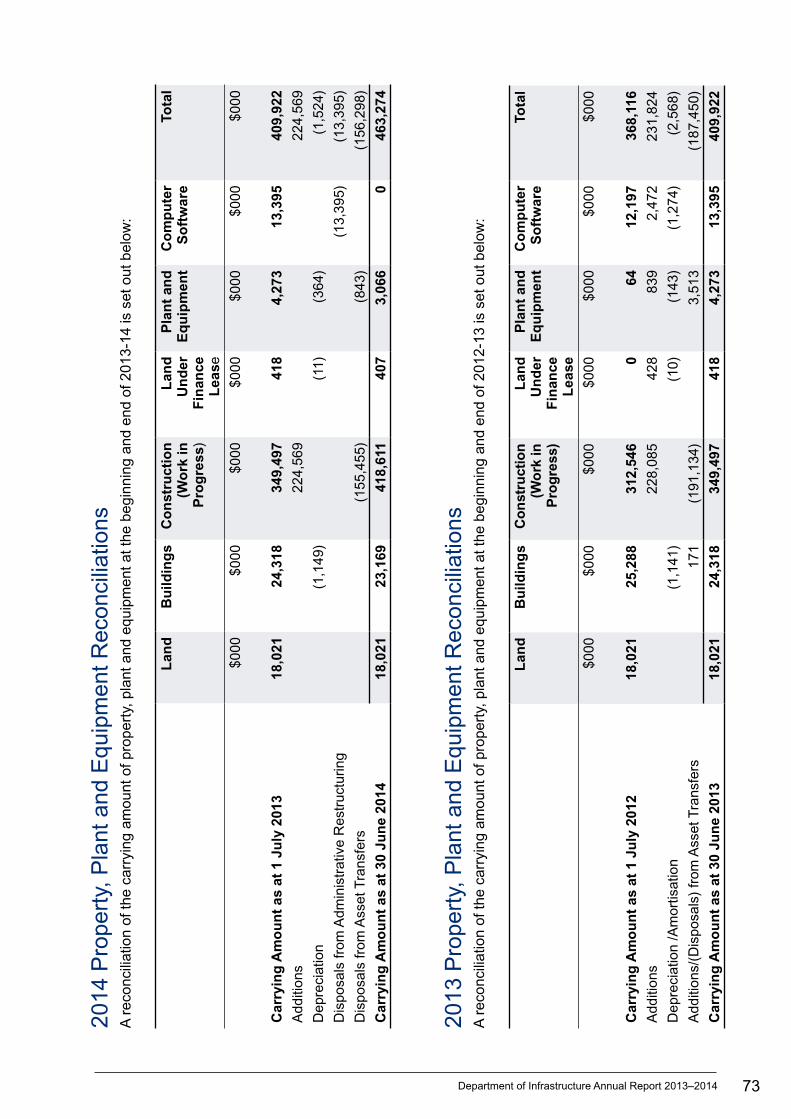
73Department of Infrastructure Annual Report 2013–2014
2014
Pro
pert
y, P
lant
and
Equ
ipm
ent R
econ
cilia
tions
A r
econ
cilia
tion
of th
e ca
rryi
ng a
mou
nt o
f pro
pert
y, p
lant
and
equ
ipm
ent a
t the
beg
inni
ng a
nd e
nd o
f 201
3-14
is s
et o
ut b
elow
:
Lan
dB
uild
ing
sC
on
stru
ctio
n
(Wo
rk in
P
rog
ress
)
Lan
d
Un
der
F
inan
ce
Lea
se
Pla
nt
and
E
qu
ipm
ent
Co
mp
ute
r S
oft
war
eTo
tal
$0
00$0
00$0
00$0
00$0
00$0
00$0
00
Car
ryin
g A
mo
un
t as
at
1 Ju
ly 2
013
18,0
2124
,318
349,
497
418
4,27
313
,395
409,
922
Add
ition
s22
4,56
922
4,56
9
Dep
reci
atio
n (1
,149
)(1
1)(3
64)
(1,5
24)
Dis
posa
ls fr
om A
dmin
istr
ativ
e R
estr
uctu
ring
(13,
395)
(13,
395)
Dis
posa
ls fr
om A
sset
Tra
nsfe
rs
(155
,455
)(8
43)
(156
,298
)
Car
ryin
g A
mo
un
t as
at
30 J
un
e 20
1418
,021
23,1
6941
8,61
140
73,
066
046
3,27
4
2013
Pro
pert
y, P
lant
and
Equ
ipm
ent R
econ
cilia
tions
A r
econ
cilia
tion
of th
e ca
rryi
ng a
mou
nt o
f pro
pert
y, p
lant
and
equ
ipm
ent a
t the
beg
inni
ng a
nd e
nd o
f 201
2-13
is s
et o
ut b
elow
:
Lan
dB
uild
ing
sC
on
stru
ctio
n
(Wo
rk in
P
rog
ress
)
Lan
d
Un
der
F
inan
ce
Lea
se
Pla
nt
and
E
qu
ipm
ent
Co
mp
ute
r S
oft
war
eTo
tal
$000
$000
$000
$000
$000
$000
$000
Car
ryin
g A
mo
un
t as
at
1 Ju
ly 2
012
18,0
2125
,288
312,
546
064
12,1
9736
8,11
6
Add
ition
s22
8,08
542
883
92,
472
231,
824
Dep
reci
atio
n /A
mor
tisat
ion
(1,1
41)
(10)
(143
)(1
,274
)(2
,568
)
Add
ition
s/(D
ispo
sals
) fr
om A
sset
Tra
nsfe
rs
171
(191
,134
)3,
513
(187
,450
)
Car
ryin
g A
mo
un
t as
at
30 J
un
e 20
1318
,021
24,3
1834
9,49
741
84,
273
13,3
9540
9,92
2
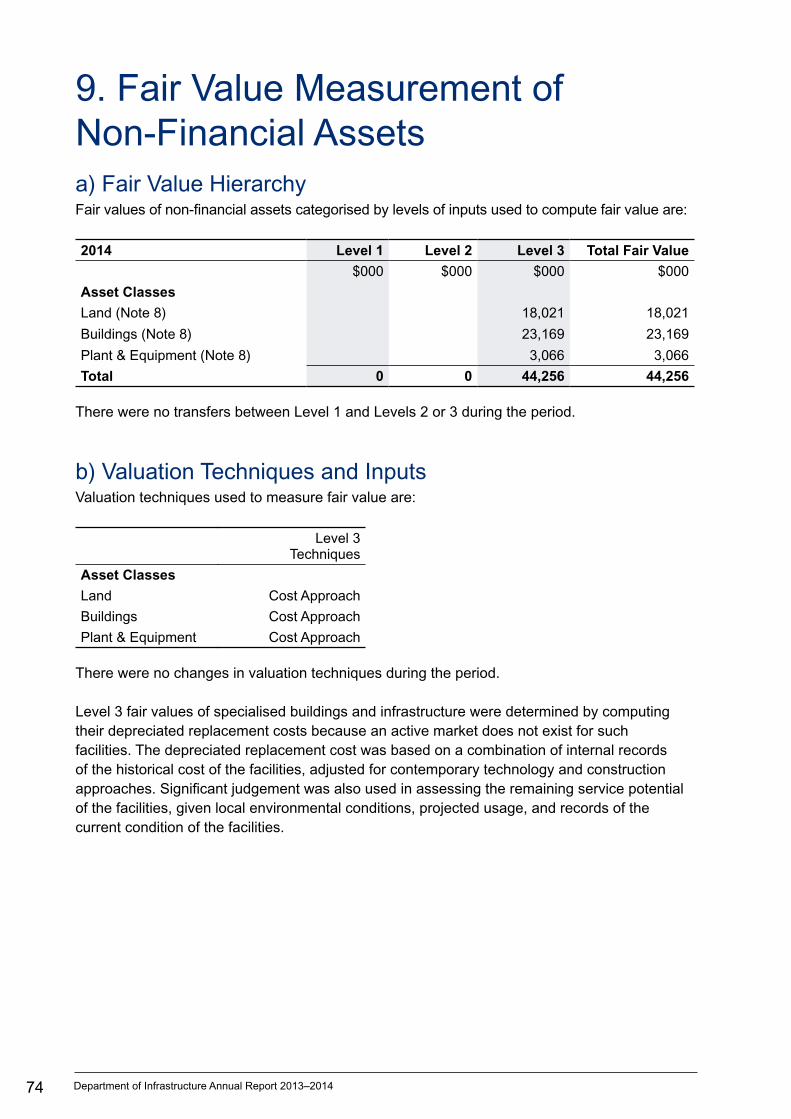
74 Department of Infrastructure Annual Report 2013–2014
9. Fair Value Measurement of Non-Financial Assetsa) Fair Value HierarchyFair values of non-financial assets categorised by levels of inputs used to compute fair value are:
2014 Level 1 Level 2 Level 3 Total Fair Value
$000 $000 $000 $000
Asset Classes
Land (Note 8) 18,021 18,021
Buildings (Note 8) 23,169 23,169
Plant & Equipment (Note 8) 3,066 3,066
Total 0 0 44,256 44,256
There were no transfers between Level 1 and Levels 2 or 3 during the period.
b) Valuation Techniques and InputsValuation techniques used to measure fair value are:
Level 3 Techniques
Asset Classes
Land Cost Approach
Buildings Cost Approach
Plant & Equipment Cost Approach
There were no changes in valuation techniques during the period.
Level 3 fair values of specialised buildings and infrastructure were determined by computing their depreciated replacement costs because an active market does not exist for such facilities. The depreciated replacement cost was based on a combination of internal records of the historical cost of the facilities, adjusted for contemporary technology and construction approaches. Significant judgement was also used in assessing the remaining service potential of the facilities, given local environmental conditions, projected usage, and records of the current condition of the facilities.
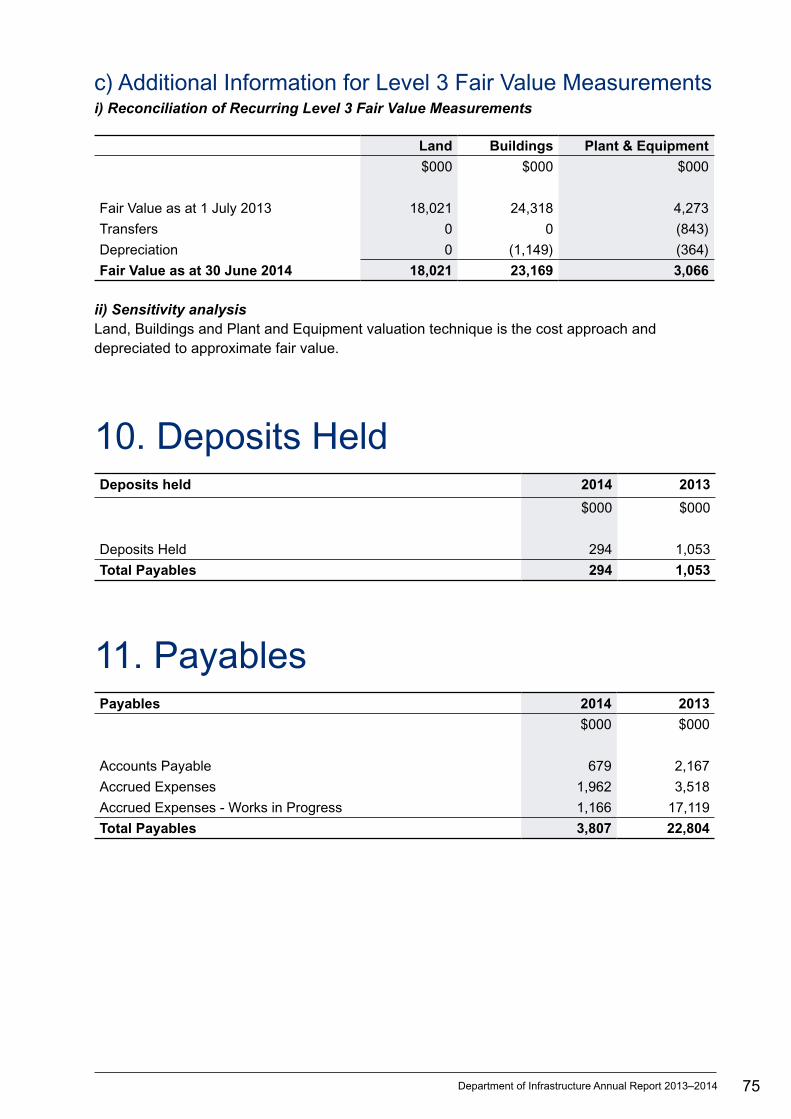
75Department of Infrastructure Annual Report 2013–2014
c) Additional Information for Level 3 Fair Value Measurementsi) Reconciliation of Recurring Level 3 Fair Value Measurements
Land Buildings Plant & Equipment
$000 $000 $000
Fair Value as at 1 July 2013 18,021 24,318 4,273
Transfers 0 0 (843)
Depreciation 0 (1,149) (364)
Fair Value as at 30 June 2014 18,021 23,169 3,066
ii) Sensitivity analysis Land, Buildings and Plant and Equipment valuation technique is the cost approach and depreciated to approximate fair value.
10. Deposits HeldDeposits held 2014 2013
$000 $000
Deposits Held 294 1,053
Total Payables 294 1,053
11. PayablesPayables 2014 2013
$000 $000
Accounts Payable 679 2,167
Accrued Expenses 1,962 3,518
Accrued Expenses - Works in Progress 1,166 17,119
Total Payables 3,807 22,804
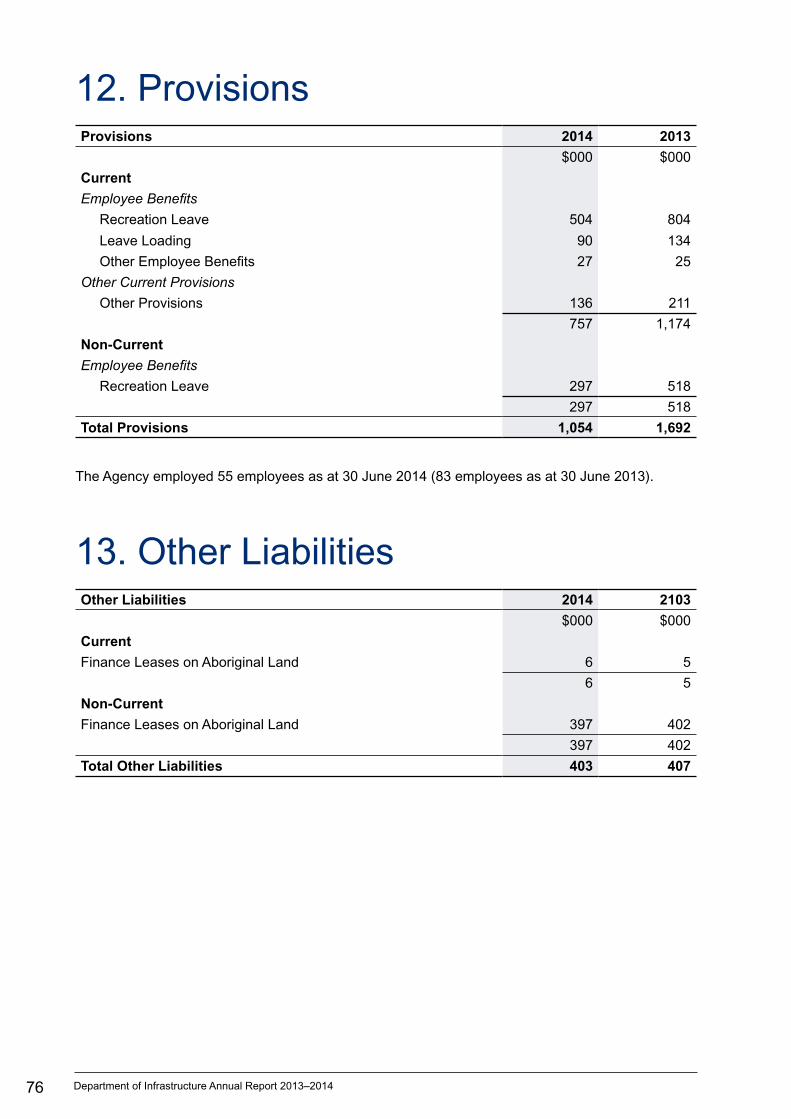
76 Department of Infrastructure Annual Report 2013–2014
12. ProvisionsProvisions 2014 2013
$000 $000
Current
Employee Benefits
Recreation Leave 504 804
Leave Loading 90 134
Other Employee Benefits 27 25
Other Current Provisions
Other Provisions 136 211
757 1,174
Non-Current
Employee Benefits
Recreation Leave 297 518
297 518
Total Provisions 1,054 1,692
The Agency employed 55 employees as at 30 June 2014 (83 employees as at 30 June 2013).
13. Other LiabilitiesOther Liabilities 2014 2103
$000 $000
Current
Finance Leases on Aboriginal Land 6 5
6 5
Non-Current
Finance Leases on Aboriginal Land 397 402
397 402
Total Other Liabilities 403 407
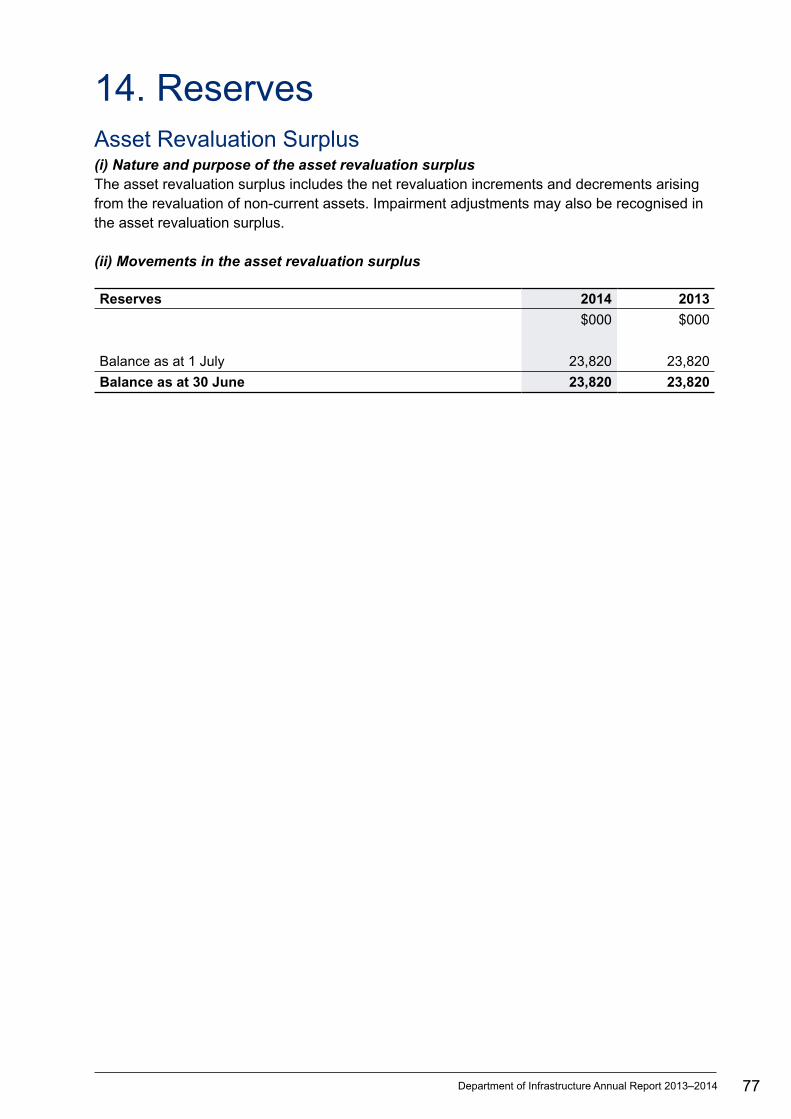
77Department of Infrastructure Annual Report 2013–2014
14. ReservesAsset Revaluation Surplus (i) Nature and purpose of the asset revaluation surplus The asset revaluation surplus includes the net revaluation increments and decrements arising from the revaluation of non-current assets. Impairment adjustments may also be recognised in the asset revaluation surplus.
(ii) Movements in the asset revaluation surplus
Reserves 2014 2013
$000 $000
Balance as at 1 July 23,820 23,820
Balance as at 30 June 23,820 23,820

78 Department of Infrastructure Annual Report 2013–2014
15. Notes to the Statement of Cash FlowReconciliation of CashThe total of agency ‘Cash and Deposits’ of $15,783,568 recorded in the Statement of Financial Position is consistent with that recorded as ‘Cash’ in the Statement of Cash Flows.
Reconciliation of Net Deficit to Net Cash from Operating Activities
2014 2013
$000 $000
Net Deficit (8,575) (3,255)
Non-cash items:
Depreciation and Amortisation 1,524 2,568
Bad Debts Write-Offs 23 0
Repairs & Maintenance/Minor New Works 4,233 1,865
Changes in assets and liabilities:
Decrease in Receivables 2,406 1,006
Decrease/(Increase) in Prepayments (238) 5
Decrease in other assets 2 0
(Decrease)/Increase in Payables (3,042) 2,527
(Decrease)/Increase in Provision for Employee Benefits (563) 25
(Decrease)/Increase in Other Provisions (75) 11
Net Cash from Operating Activities (4,305) 4,752
Non-Cash Financing and Investing ActivitiesFinance Lease TransactionsDuring the financial year the Department of Infrastructure did not acquire plant and equipment/computer equipment and software by means of finance leases.

79Department of Infrastructure Annual Report 2013–2014
16. Financial InstrumentsA financial instrument is a contract that gives rise to a financial asset of one entity and a financial liability or equity instrument of another entity. Financial instruments held by the Department of Infrastructure include cash and deposits, receivables, payables, deposits held and finance leases. The Department of Infrastructure has limited exposure to financial risks as discussed below.
a) Categorisation of Financial InstrumentsThe carrying amounts of the Department of Infrastructure financial assets and liabilities by category are disclosed in the table below.
2014 2013
$000 $000
Financial Assets
Cash and Deposits 15,784 46,056
Receivables 171 2,934
Financial Liabilities
Other Financial Liabilities
Amortised Cost
Payables 3,807 22,804
Deposits Held 294 1,053
Finance Leases 403 407
b) Credit RiskThe agency has limited credit risk exposure (risk of default). In respect of any dealings with organisations external to Government, the agency has adopted a policy of only dealing with credit worthy organisations and obtaining sufficient collateral or other security where appropriate, as a means of mitigating the risk of financial loss from defaults.
The carrying amount of financial assets recorded in the financial statements, net of any allowances for losses, represents the agency’s maximum exposure to credit risk without taking account of the value of any collateral or other security obtained.
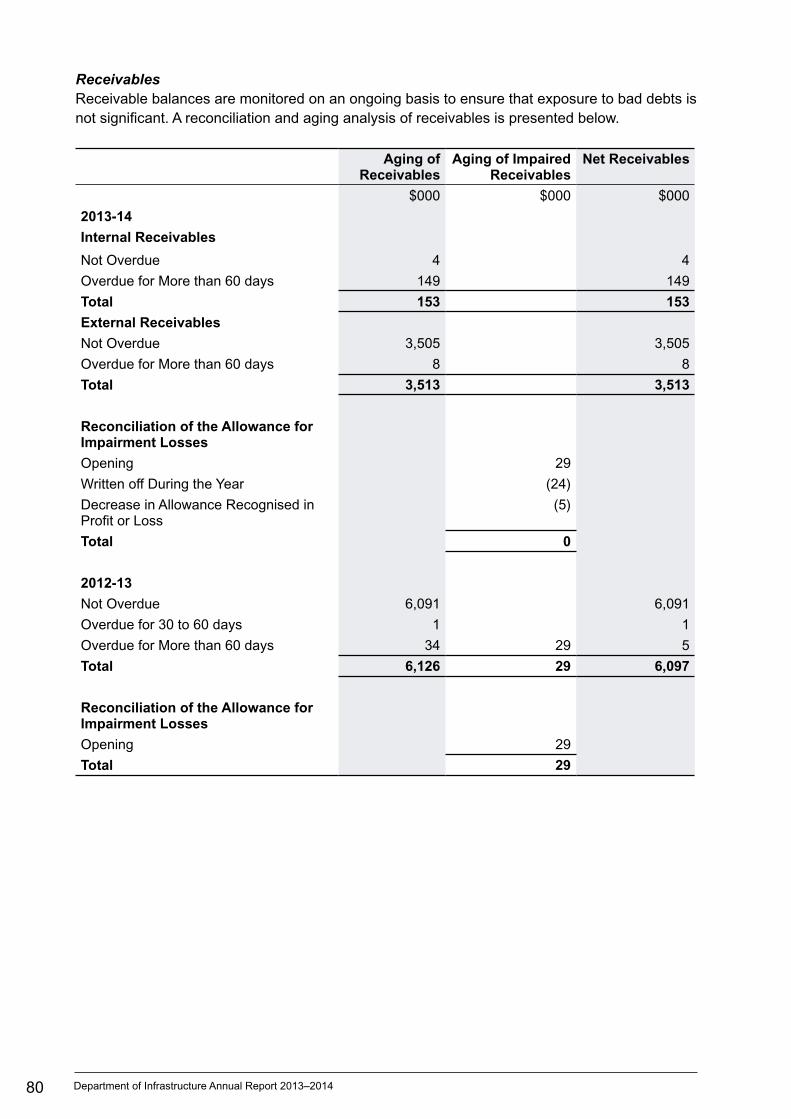
80 Department of Infrastructure Annual Report 2013–2014
ReceivablesReceivable balances are monitored on an ongoing basis to ensure that exposure to bad debts is not significant. A reconciliation and aging analysis of receivables is presented below.
Aging of Receivables
Aging of Impaired Receivables
Net Receivables
$000 $000 $000
2013-14
Internal Receivables
Not Overdue 4 4
Overdue for More than 60 days 149 149
Total 153 153
External Receivables
Not Overdue 3,505 3,505
Overdue for More than 60 days 8 8
Total 3,513 3,513
Reconciliation of the Allowance for Impairment Losses
Opening 29
Written off During the Year (24)
Decrease in Allowance Recognised in Profit or Loss
(5)
Total 0
2012-13
Not Overdue 6,091 6,091
Overdue for 30 to 60 days 1 1
Overdue for More than 60 days 34 29 5
Total 6,126 29 6,097
Reconciliation of the Allowance for Impairment Losses
Opening 29
Total 29
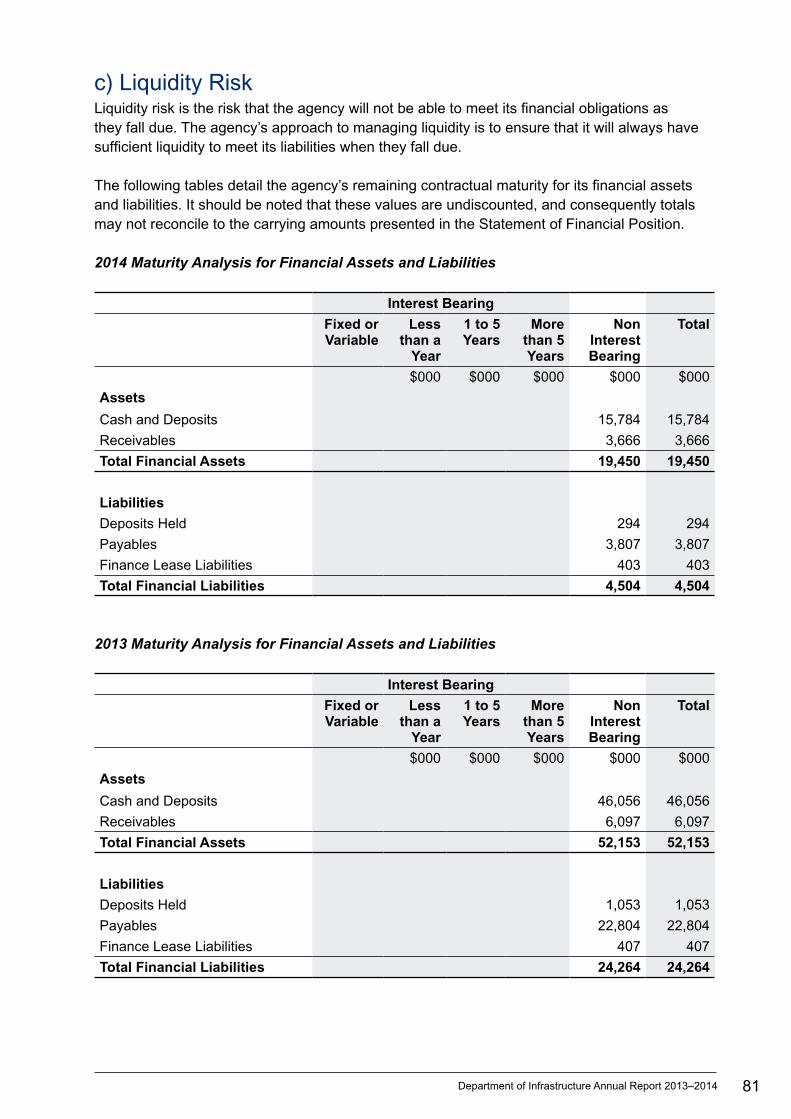
81Department of Infrastructure Annual Report 2013–2014
c) Liquidity RiskLiquidity risk is the risk that the agency will not be able to meet its financial obligations as they fall due. The agency’s approach to managing liquidity is to ensure that it will always have sufficient liquidity to meet its liabilities when they fall due.
The following tables detail the agency’s remaining contractual maturity for its financial assets and liabilities. It should be noted that these values are undiscounted, and consequently totals may not reconcile to the carrying amounts presented in the Statement of Financial Position.
2014 Maturity Analysis for Financial Assets and Liabilities
Interest Bearing
Fixed or Variable
Less than a
Year
1 to 5 Years
More than 5 Years
Non Interest Bearing
Total
$000 $000 $000 $000 $000
Assets
Cash and Deposits 15,784 15,784
Receivables 3,666 3,666
Total Financial Assets 19,450 19,450
Liabilities
Deposits Held 294 294
Payables 3,807 3,807
Finance Lease Liabilities 403 403
Total Financial Liabilities 4,504 4,504
2013 Maturity Analysis for Financial Assets and Liabilities
Interest Bearing
Fixed or Variable
Less than a
Year
1 to 5 Years
More than 5 Years
Non Interest Bearing
Total
$000 $000 $000 $000 $000
Assets
Cash and Deposits 46,056 46,056
Receivables 6,097 6,097
Total Financial Assets 52,153 52,153
Liabilities
Deposits Held 1,053 1,053
Payables 22,804 22,804
Finance Lease Liabilities 407 407
Total Financial Liabilities 24,264 24,264
82 Department of Infrastructure Annual Report 2013–2014
d) Market RiskMarket risk is the risk that the fair value of future cash flows of a financial instrument will fluctuate because of changes in market prices. It comprises interest rate risk, price risk and currency risk.
(i) Interest Rate RiskThe Department of Infrastructure is not exposed to interest rate risk as agency financial assets and financial liabilities, with the exception of Land Under Finance Leases which are non-interest bearing. Finance lease arrangements are established on a fixed interest rate and as such do not expose the Department of Infrastructure to interest rate risk.
(ii) Price RiskThe Department of Infrastructure is not exposed to price risk as it does not hold units in unit trusts.
(iii) Currency RiskThe Department of Infrastructure is not exposed to currency risk as it does not hold borrowings denominated in foreign currencies or transactional currency exposures arising from purchases in a foreign currency.

83Department of Infrastructure Annual Report 2013–2014
e) Net Fair ValueFair values of financial instruments categorised by level of inputs used to measure fair value are:
Total Carrying Amount
Net Fair Value
Level 1
Net Fair Value
Level 2
Net Fair Value
Level 3
Net Fair Value Total
$000 $000 $000 $000 $000
2014
Financial Assets
Cash and Deposits 15,784 15,784 15,784
Receivables 3,666 3,666 3,666
Total Financial Assets 19,450 19,450 19,450
Financial Liabilities
Deposits Held 294 294 294
Payables 3,807 3,807 3,807
Finance Lease Liabilities 403 403 403
Total Financial Liabilities 4,504 4,101 403 4,504
2013
Financial Assets
Cash and Deposits 46,056 46,056 46,056
Receivables 6,097 6,097 6,097
Total Financial Assets 52,153 52,153 52,153
Financial Liabilities
Deposits Held 1,053 1,053 1,053
Payables 22,804 22,804 22,804
Finance Lease Liabilities 407 407 407
Total Financial Liabilities 24,264 23,857 407 24,264
The net fair value of Department of Infrastructure financial assets and financial liabilities recorded in financial statements approximates their respective net fair value. Where differences exist, these are not material.
There were no changes in valuation techniques during the period.
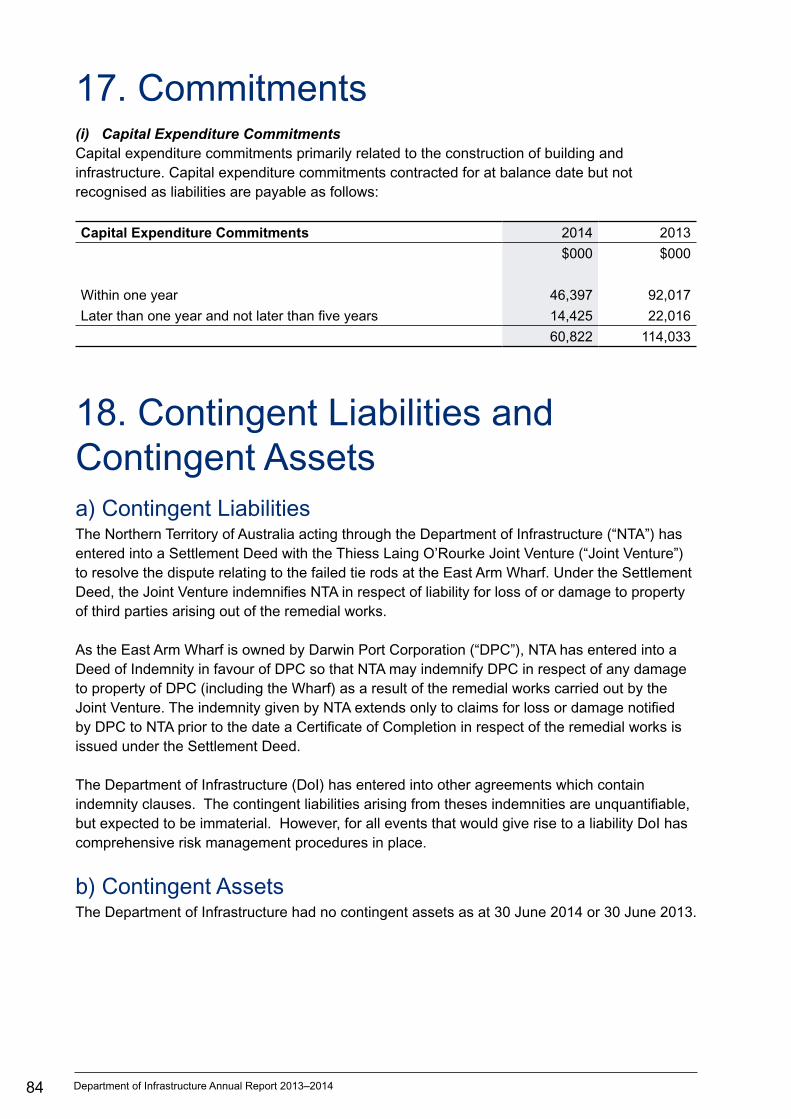
84 Department of Infrastructure Annual Report 2013–2014
17. Commitments(i) Capital Expenditure CommitmentsCapital expenditure commitments primarily related to the construction of building and infrastructure. Capital expenditure commitments contracted for at balance date but not recognised as liabilities are payable as follows:
Capital Expenditure Commitments 2014 2013
$000 $000
Within one year 46,397 92,017
Later than one year and not later than five years 14,425 22,016
60,822 114,033
18. Contingent Liabilities and Contingent Assetsa) Contingent LiabilitiesThe Northern Territory of Australia acting through the Department of Infrastructure (“NTA”) has entered into a Settlement Deed with the Thiess Laing O’Rourke Joint Venture (“Joint Venture”) to resolve the dispute relating to the failed tie rods at the East Arm Wharf. Under the Settlement Deed, the Joint Venture indemnifies NTA in respect of liability for loss of or damage to property of third parties arising out of the remedial works.
As the East Arm Wharf is owned by Darwin Port Corporation (“DPC”), NTA has entered into a Deed of Indemnity in favour of DPC so that NTA may indemnify DPC in respect of any damage to property of DPC (including the Wharf) as a result of the remedial works carried out by the Joint Venture. The indemnity given by NTA extends only to claims for loss or damage notified by DPC to NTA prior to the date a Certificate of Completion in respect of the remedial works is issued under the Settlement Deed.
The Department of Infrastructure (DoI) has entered into other agreements which contain indemnity clauses. The contingent liabilities arising from theses indemnities are unquantifiable, but expected to be immaterial. However, for all events that would give rise to a liability DoI has comprehensive risk management procedures in place.
b) Contingent AssetsThe Department of Infrastructure had no contingent assets as at 30 June 2014 or 30 June 2013.
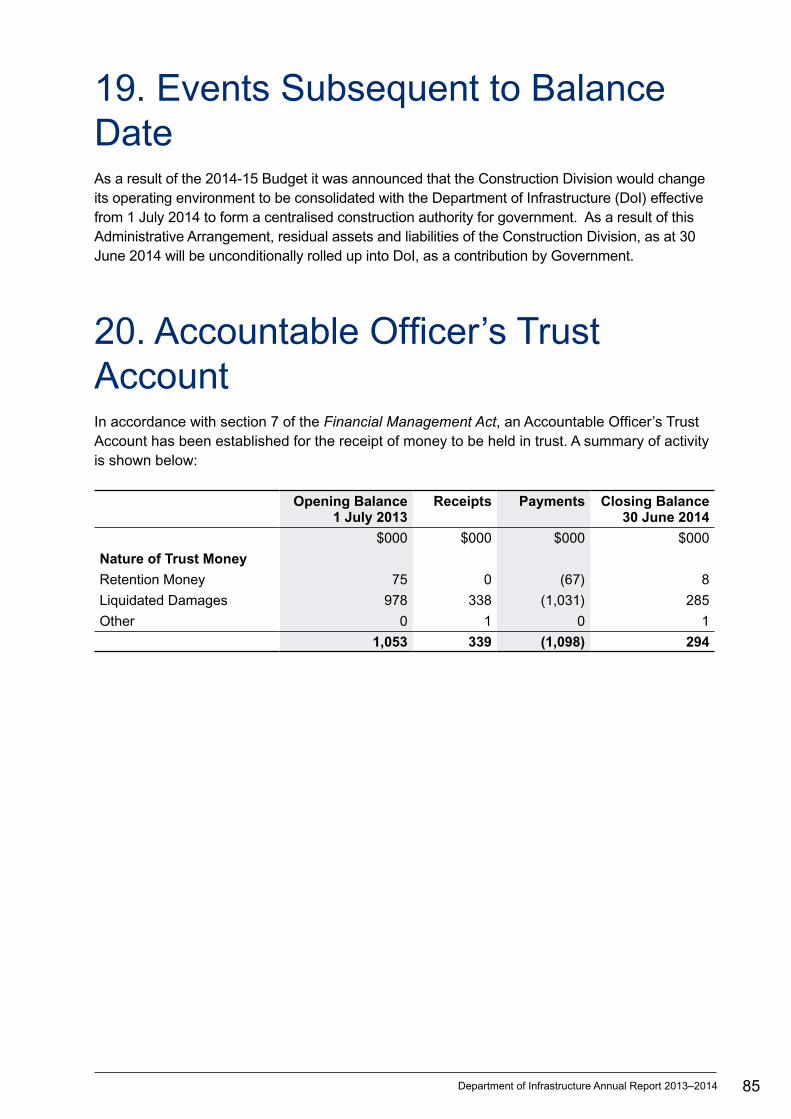
85Department of Infrastructure Annual Report 2013–2014
19. Events Subsequent to Balance DateAs a result of the 2014-15 Budget it was announced that the Construction Division would change its operating environment to be consolidated with the Department of Infrastructure (DoI) effective from 1 July 2014 to form a centralised construction authority for government. As a result of this Administrative Arrangement, residual assets and liabilities of the Construction Division, as at 30 June 2014 will be unconditionally rolled up into DoI, as a contribution by Government.
20. Accountable Officer’s Trust AccountIn accordance with section 7 of the Financial Management Act, an Accountable Officer’s Trust Account has been established for the receipt of money to be held in trust. A summary of activity is shown below:
Opening Balance 1 July 2013
Receipts Payments Closing Balance 30 June 2014
$000 $000 $000 $000
Nature of Trust Money
Retention Money 75 0 (67) 8
Liquidated Damages 978 338 (1,031) 285
Other 0 1 0 1
1,053 339 (1,098) 294

86 Department of Infrastructure Annual Report 2013–2014
21. W
rite-
Offs
, Pos
tpon
emen
ts, W
aive
rs, G
ifts
and
Ex
Gra
tia P
aym
ents
Ag
ency
Ag
ency
Terr
ito
ry It
ems
Terr
ito
ry It
ems
2014
No
. of
Tran
s.20
13N
o. o
f Tr
ans.
2014
No
. of
Tran
s.20
13N
o. o
f Tr
ans.
$0
00$0
00$0
00$0
00
Wri
te-o
ffs,
Po
stp
on
emen
ts a
nd
Wai
vers
Un
der
th
e F
inan
cial
Man
agem
ent A
ct24
130
00
00
0
Rep
rese
nted
by:
Am
ount
s w
ritte
n of
f, po
stpo
ned
and
wai
ved
by D
eleg
ates
Irre
cove
rabl
e am
ount
s pa
yabl
e to
the
Terr
itory
or
an a
genc
y w
ritte
n of
f5
10
Loss
es o
r de
ficie
ncie
s of
mon
ey w
ritte
n of
f
Pub
lic p
rope
rty
writ
ten
off
Wai
ver
or p
ostp
onem
ent o
f rig
ht to
rec
eive
or
reco
ver
mon
ey o
r pr
oper
ty
Tota
l Wri
tten
Off
, Po
stp
on
ed a
nd
Wai
ved
by
Del
egat
es5
100
00
00
0
Am
ount
s w
ritte
n of
f, po
stpo
ned
and
wai
ved
by th
e Tr
easu
rer
Irre
cove
rabl
e am
ount
s pa
yabl
e to
the
Terr
itory
or
an a
genc
y w
ritte
n of
f19
3
Loss
es o
r de
ficie
ncie
s of
mon
ey w
ritte
n of
f
Pub
lic p
rope
rty
writ
ten
off
Wai
ver
or p
ostp
onem
ent o
f rig
ht to
rec
eive
or
reco
ver
mon
ey o
r pr
oper
ty
Tota
l Wri
tten
Off
, Po
stp
on
ed a
nd
Wai
ved
by
the
Trea
sure
r19
30
00
00
0
Wri
te-o
ffs,
Po
stp
on
emen
ts a
nd
Wai
vers
Au
tho
rise
d U
nd
er O
ther
Leg
isla
tio
n0
00
00
00
0
Gif
ts U
nd
er t
he
Fin
anci
al M
anag
emen
t Act
00
00
00
00
Gif
ts A
uth
ori
sed
Un
der
Oth
er L
egis
lati
on
00
00
00
00
Ex
Gra
tia
Pay
men
ts U
nd
er t
he
Fin
anci
al M
anag
emen
t Act
00
00
00
00
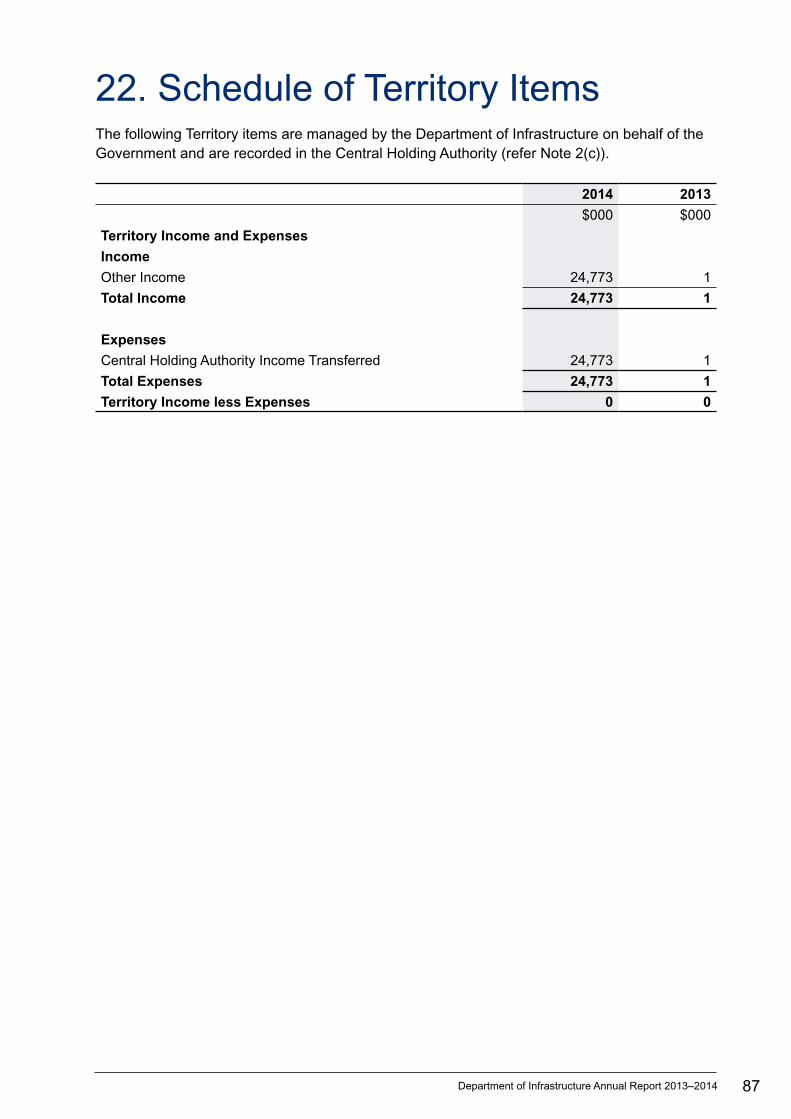
87Department of Infrastructure Annual Report 2013–2014
22. Schedule of Territory ItemsThe following Territory items are managed by the Department of Infrastructure on behalf of the Government and are recorded in the Central Holding Authority (refer Note 2(c)).
2014 2013
$000 $000
Territory Income and Expenses
Income
Other Income 24,773 1
Total Income 24,773 1
Expenses
Central Holding Authority Income Transferred 24,773 1
Total Expenses 24,773 1
Territory Income less Expenses 0 0

Financial Performance2013–14 Financial Statements – 88Construction Division
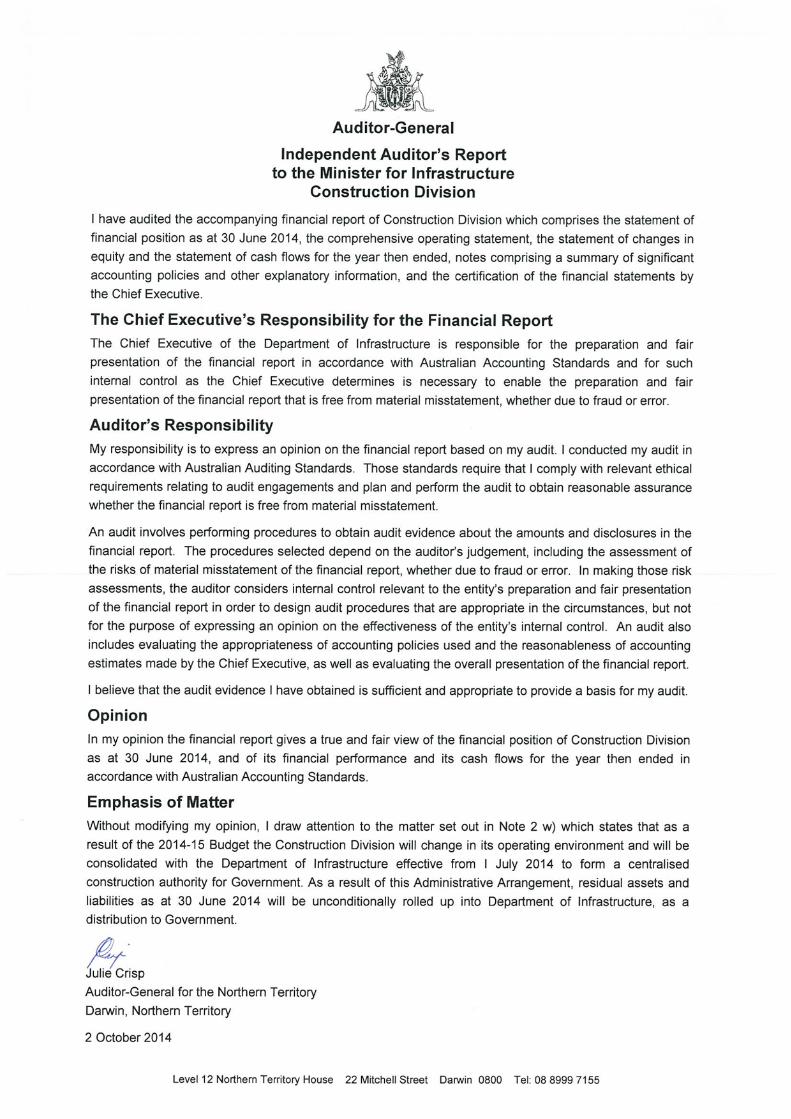

This page has been left blank intentionally
90 Department of Infrastructure Annual Report 2013–2014
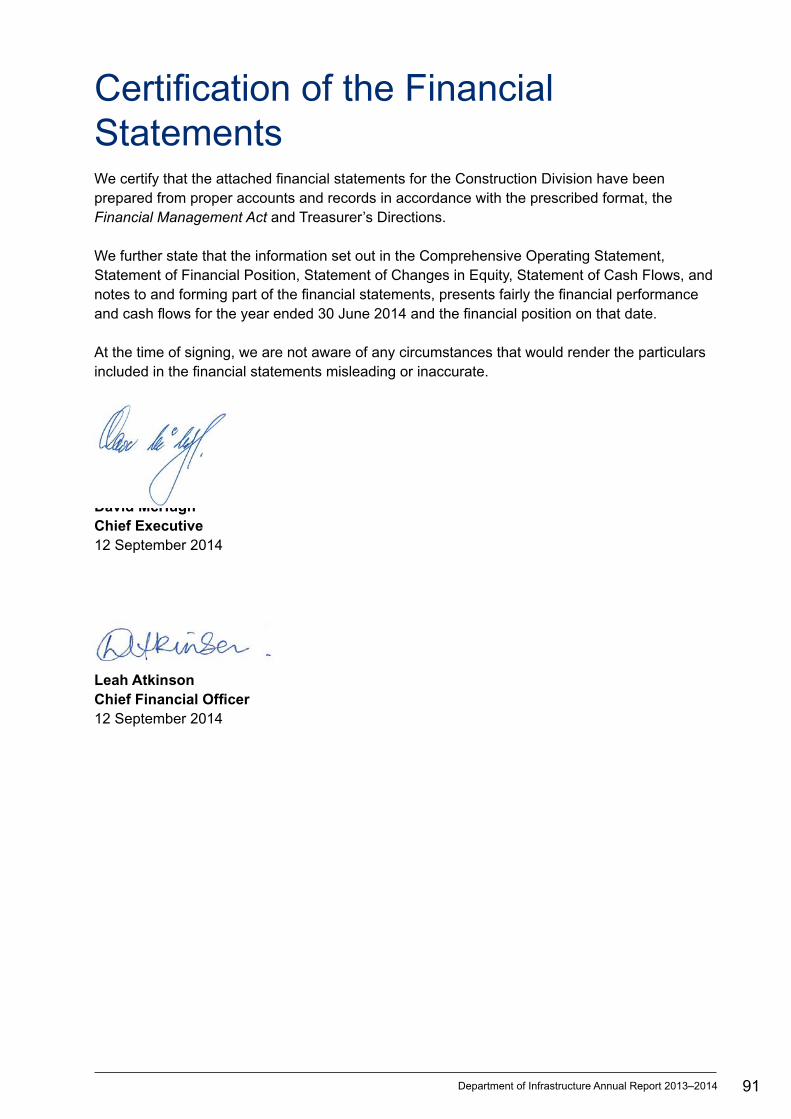
91Department of Infrastructure Annual Report 2013–2014
Certification of the Financial StatementsWe certify that the attached financial statements for the Construction Division have been prepared from proper accounts and records in accordance with the prescribed format, the Financial Management Act and Treasurer’s Directions.
We further state that the information set out in the Comprehensive Operating Statement, Statement of Financial Position, Statement of Changes in Equity, Statement of Cash Flows, and notes to and forming part of the financial statements, presents fairly the financial performance and cash flows for the year ended 30 June 2014 and the financial position on that date.
At the time of signing, we are not aware of any circumstances that would render the particulars included in the financial statements misleading or inaccurate.
David McHughChief Executive12 September 2014
Leah AtkinsonChief Financial Officer12 September 2014

92 Department of Infrastructure Annual Report 2013–2014
Comprehensive Operating StatementFor the year ended 30 June 2014
Note 2014 2013
$000 $000
INCOME
Sales of Goods and Services 77,623 73,612
Interest Revenue 350 0
Gain on Disposal of Assets 3 0 2
Other Income 213 200
TOTAL INCOME 78,186 73,814
EXPENSES
Employee Expenses 31,257 31,625
Administrative Expenses
Purchases of Goods and Services 5 40,620 41,841
Depreciation and Amortisation 8 79 80
Other Administrative Expenses (12) 47
TOTAL EXPENSES 71,944 73,593
SURPLUS 4 6,242 221
Income Tax Expense 4 1,827 0
NET SURPLUS 14 4,415 221
TOTAL OTHER COMPREHENSIVE INCOME 0 0
COMPREHENSIVE RESULT 4,415 221
The Comprehensive Operating Statement is to be read in conjunction with the notes to the financial statements.

93Department of Infrastructure Annual Report 2013–2014
Statement of Financial PositionAs at 30 June 2014
Note 2014 2013
$000 $000
ASSETS
Current Assets
Cash and Deposits 6 40,523 4,087
Receivables 7 1,503 33,987
Prepayments 70 86
Other Assets (7) 0
Total Current Assets 42,089 38,160
Non-Current Assets
Property, Plant and Equipment 8 271 350
Total Non-Current Assets 271 350
TOTAL ASSETS 42,360 38,510
LIABILITIES
Current Liabilities
Deposits Held 10 3,367 6,533
Payables 11 3,802 2,708
Provisions 12 7,791 3,937
Total Current Liabilities 14,960 13,178
Non-Current Liabilities
Provisions 12 1,423 1,563
Total Non-Current Liabilities 1,423 1,563
TOTAL LIABILITIES 16,383 14,741
NET ASSETS 25,977 23,769
EQUITY
Capital 13 16,530 16,530
Accumulated Funds 13 9,447 7,239
TOTAL EQUITY 25,977 23,769
The Statement of Financial Position is to be read in conjunction with the notes to the financial statements.

94 Department of Infrastructure Annual Report 2013–2014
Statement of Changes in EquityFor the year ended 30 June 2014
Note Equity at 1 July
Comprehensive result
Transactions with owners in their
capacity as owners
Equity at 30 June
$000 $000 $000 $000
2013-14
Accumulated Funds 7,240 4,415 11,655
Divided Provided (2,208) (2,208)
13 7,240 4,415 (2,208) 9,447
Capital – Transactions with Owners
13 16,530 16,530
Total Equity at End of Financial Year
23,770 4,415 (2,208) 25,977
2012-13
Accumulated Funds 13 7,018 221 7,239
Capital – Transactions with Owners
7,530 7,530
Equity Injections
Other Equity Injections 0 9,000 9,000
13 7,530 0 9,000 16,530
Total Equity at End of Financial Year
14,548 221 9,000 23,769
The Statement of Financial Position is to be read in conjunction with the notes to the financial statements.
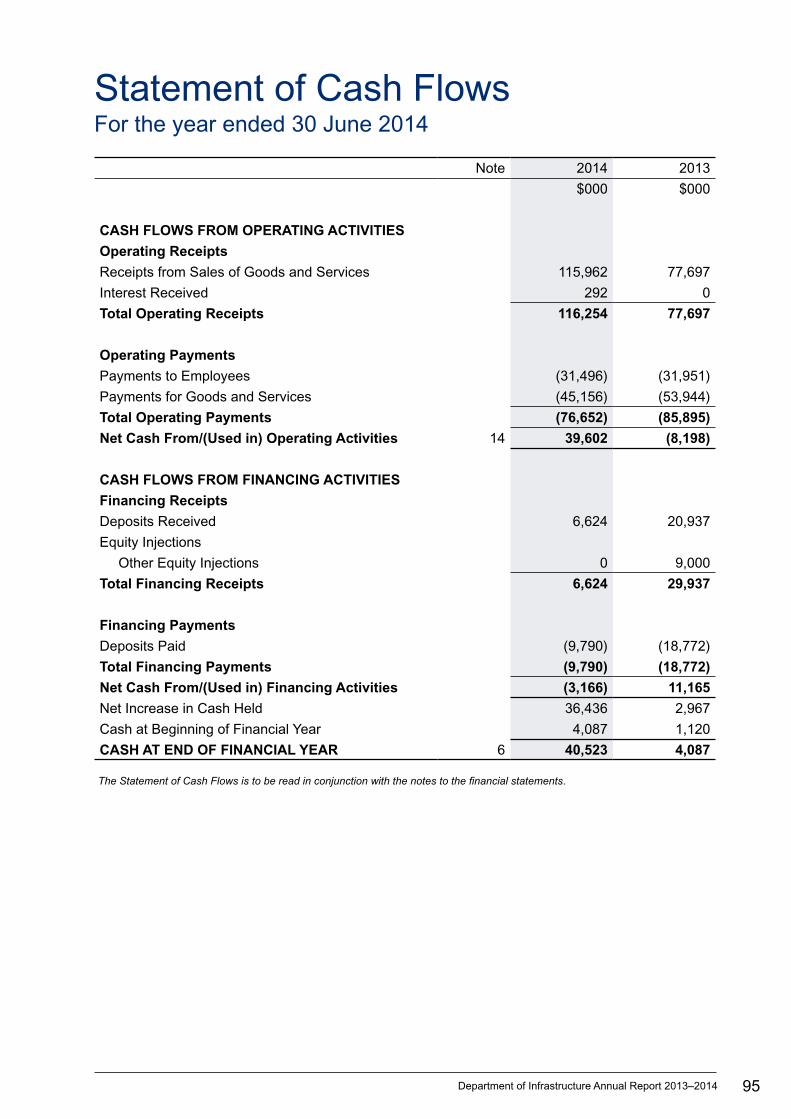
95Department of Infrastructure Annual Report 2013–2014
Statement of Cash Flows For the year ended 30 June 2014
Note 2014 2013
$000 $000
CASH FLOWS FROM OPERATING ACTIVITIES
Operating Receipts
Receipts from Sales of Goods and Services 115,962 77,697
Interest Received 292 0
Total Operating Receipts 116,254 77,697
Operating Payments
Payments to Employees (31,496) (31,951)
Payments for Goods and Services (45,156) (53,944)
Total Operating Payments (76,652) (85,895)
Net Cash From/(Used in) Operating Activities 14 39,602 (8,198)
CASH FLOWS FROM FINANCING ACTIVITIES
Financing Receipts
Deposits Received 6,624 20,937
Equity Injections
Other Equity Injections 0 9,000
Total Financing Receipts 6,624 29,937
Financing Payments
Deposits Paid (9,790) (18,772)
Total Financing Payments (9,790) (18,772)
Net Cash From/(Used in) Financing Activities (3,166) 11,165
Net Increase in Cash Held 36,436 2,967
Cash at Beginning of Financial Year 4,087 1,120
CASH AT END OF FINANCIAL YEAR 6 40,523 4,087
The Statement of Cash Flows is to be read in conjunction with the notes to the financial statements.
96 Department of Infrastructure Annual Report 2013–2014
Notes to the Financial StatementsFor the year ended 30 June 2014
Index of notes to the financial statements
Note1. Objectives and Funding2. Statement of Significant Accounting Policies
INCOME3. Gain on Disposal of Assets
EXPENSES4. Income Tax Expense5. Purchases of Goods and Services
ASSETS6. Cash and Deposits7. Receivables8. Property, Plant and Equipment9. Fair Value Measurement of Non-Financial Assets
LIABILITIES10. Deposits Held11. Payables12. Provisions
EQUITY13. Equity
OTHER DISCLOSURES14. Notes to the Statement of Cash Flows15. Financial Instruments16. Commitments17. Contingent Liabilities and Contingent Assets18. Events Subsequent to Balance Date19. Write-offs, Postponements, Waivers, Gifts and Ex Gratia Payments
97Department of Infrastructure Annual Report 2013–2014
1. Objectives and FundingConstruction Division has been determined by the Treasurer to be a Government Business Division (GBD) as specified in the Financial Management Act. Construction Division provides project management for the design, procurement, and supervision of construction and maintenance of Northern Territory Government built assets. Unlike general government agencies Construction Division does not receive direct appropriation for its commercial activities. Instead, operating revenue is primarily generated from fees charged to other NT Government Agencies for its project management activities.
From 1 July 2014, Construction Division will cease to operate as above, refer note 2(w) and note 18.
2. Statement of Significant Accounting Policiesa) Basis of AccountingThe financial statements have been prepared in accordance with the requirements of the Financial Management Act and related Treasurer’s Directions. The Financial Management Act requires the Construction Division to prepare financial statements for the year ended 30 June 2014 based on the form determined by the Treasurer. The form of agency financial statements is to include:
i. a Certification of the Financial Statements;
ii. a Comprehensive Operating Statement;
iii. a Statement of Financial Position;
iv. a Statement of Changes in Equity;
v. a Statement of Cash Flows; and
vi. applicable explanatory notes to the financial statements.
The financial statements have been prepared using the accrual basis of accounting, which recognises the effect of financial transactions and events when they occur, rather than when cash is paid out or received. As part of the preparation of the financial statements, all intra-agency transactions and balances have been eliminated.
Except where stated, the financial statements have also been prepared in accordance with the historical cost convention.
The form of the agency financial statements is also consistent with the requirements of Australian Accounting Standards. The effects of all relevant new and revised Standards and Interpretations issued by the Australian Accounting Standards Board (AASB) that are effective for the current annual reporting period have been evaluated. The Standards and Interpretations and their impacts are;

98 Department of Infrastructure Annual Report 2013–2014
AASB 13 Fair Value Measurement, AASB 2011-8 Amendments to Australian Accounting Standards arising from AASB 13 [AASB 1, 2, 3, 4, 5, 7, 9, 2009-11, 2010-7, 101, 102, 108, 110, 116, 117, 118, 119, 120, 121, 128, 131, 132, 133, 134, 136, 138, 139, 140, 141, 1004, 1023 & 1038 and Interpretations 2, 4, 12, 13, 14, 17, 19, 131 & 132] AASB 13 replaces the guidance on fair value measurement in existing AASB accounting literature with a single standard. It clarifies the definition of fair value, provides guidance on how to determine fair value and requires disclosures about fair value measurements. With some exceptions, the standard requires entities to classify these measurements into a fair value hierarchy based on the nature of the inputs. Additional disclosures following from the standard are included in the notes to the financial statements.
AASB 119 Employee Benefits (2011), AASB 2011-10 Amendments to Australian Accounting Standards arising from AASB 119 (2011) [AASB 1, 8, 101, 124, 134, 1049 & 2011-8 and Interpretation 14] AASB 119 amends the definition of short-term employee benefits and the accounting for defined benefit superannuation obligations. The standards do not impact the financial statements.
AASB CF 2013-1 Amendments to the Australian Conceptual Framework, AASB 2013-9 Amendments to Australian Accounting Standards – Conceptual Framework, Materiality and Financial Instruments AASB CF 2013-1 incorporates Chapters 1 and 3 of the IASB’s Conceptual Framework for Financial Reporting into the AASB Framework for the Preparation and Presentation of Financial Statements. It also withdraws SAC 2 Objective of General Purpose Financial Reporting. The standards do not impact the financial statements.
AASB 2012-2 Amendments to Australian Accounting Standards – Disclosures – Offsetting Financial Assets and Financial Liabilities (Amendments to AASB 7) The standard amends AASB 7 Financial Instruments: Disclosures to require an entity to disclose information about rights of offset and related arrangements (such as collateral posting requirements) for financial instruments under an enforceable master netting agreement or similar arrangement. The standard does not impact the financial statements.
AASB 2012-5 Amendments to Australian Accounting Standards arising from Annual Improvements 2009-2011 Cycle [AASB 1, 101, 116, 132 & 134 and Interpretation 2] The standard amends a number of pronouncements as a result of the 2009-2011 annual improvements cycle. In particular, amendments to AASB 101 Presentation of Financial Statements clarify requirements for comparative information, and amendments to AASB 116 Property, Plant and Equipment clarify classification of servicing equipment. The standard does not impact the financial statements.
b) Australian Accounting Standards and Interpretations Issued but not yet EffectiveAt the date of authorisation of the financial statements, the Standards and Interpretations listed below were in issue but not yet effective;

99Department of Infrastructure Annual Report 2013–2014
Standard/Interpretation
Summary Effective for annual reporting periods beginning on or after
Impact on financial statements
AASB 9 Financial Instruments (Dec 2010), AASB 2010-7 Amendments to Australian Accounting Standards arising from AASB 9 (Dec 2010) [AASB 1, 3, 4, 5, 7, 101, 102, 108, 112, 118, 120, 121, 127, 128, 131, 132, 136, 137, 139, 1023 & 1038 and Interpretations 2, 5, 10, 12, 19 & 127], AASB 2012-6 Amendments to Australian Accounting Standards – Mandatory Effective Date of AASB 9 and Transition Disclosures [AASB 9, 2009-11, 2010-7, 2011-7 & 2011-8], AASB 2013-9 Amendments to Australian Accounting Standards – Conceptual Framework, Materiality and Financial Instruments
AASB 9 incorporates revised requirements for the classification and measurement of financial instruments resulting from the IASB’s project to replace IAS 39 Financial Instruments: Recognition and Measurement (AASB 139 Financial Instruments: Recognition and Measurement).
1 Jan 2017 Minimal effect on the financial statements.
AASB 1055 Budgetary Reporting
Sets out budgetary reporting requirements for not-for-profit entities within the General Government Sector
1 July 2014 Minimal effect on the financial statements.
AASB 2013-3 Amendments to AASB 136 – Recoverable Amount Disclosures for Non-Financial Assets
Addresses disclosures about the recoverable amount of impaired assets if that amount is based on fair value less costs of disposal
1 Jan 2014 Minimal effect on the financial statements.
100 Department of Infrastructure Annual Report 2013–2014
c) Agency and Territory ItemsThe financial statements of the Construction Division include income, expenses, assets, liabilities and equity over which the Construction Division has control (Agency items). Certain items, while managed by the agency, are controlled and recorded by the Territory rather than the agency (Territory items). Territory items are recognised and recorded in the Central Holding Authority as discussed below.
Central Holding AuthorityThe Central Holding Authority is the ‘parent body’ that represents the Government’s ownership interest in Government-controlled entities.
The Central Holding Authority also records all Territory items, such as income, expenses, assets and liabilities controlled by the Government and managed by agencies on behalf of the Government. The main Territory item is Territory income, which includes taxation and royalty revenue, Commonwealth general purpose funding (such as GST revenue), fines, and statutory fees and charges.
The Central Holding Authority also holds certain Territory assets not assigned to agencies as well as certain Territory liabilities that are not practical or effective to assign to individual agencies such as unfunded superannuation and long service leave.
d) ComparativesWhere necessary, comparative information for the 2012-13 financial year has been reclassified to provide consistency with current year disclosures.
e) Presentation and Rounding of AmountsAmounts in the financial statements and notes to the financial statements are presented in Australian dollars and have been rounded to the nearest thousand dollars, with amounts of $500 or less being rounded down to zero.
f) Changes in Accounting PoliciesThere have been no changes to accounting policies adopted in 2013-14 as a result of management decisions.
g) Accounting Judgments and Estimates The preparation of the financial report requires the making of judgments and estimates that affect the recognised amounts of assets, liabilities, revenues and expenses and the disclosure of contingent liabilities. The estimates and associated assumptions are based on historical experience and various other factors that are believed to be reasonable under the circumstances, the results of which form the basis for making judgments about the carrying values of assets and liabilities that are not readily apparent from other sources. Actual results may differ from these estimates.
101Department of Infrastructure Annual Report 2013–2014
The estimates and underlying assumptions are reviewed on an ongoing basis. Revisions to accounting estimates are recognised in the period in which the estimate is revised if the revision affects only that period, or in the period of the revision and future periods if the revision affects both current and future periods.
Judgments and estimates that have significant effects on the financial statements are disclosed in the relevant notes to the financial statements. Notes that include significant judgments and estimates are:
O Employee Benefits – Note 2(r) and Note 12: Non-current liabilities in respect of employee benefits are measured as the present value of estimated future cash outflows based on the appropriate Government bond rate, estimates of future salary and wage levels and employee periods of service.
O Contingent Liabilities – Note 17: The present values of material quantifiable contingent liabilities are calculated using a discount rate based on the published 10-year Government bond rate.
O Allowance for Impairment Losses – Note 2(o), Note 7: Receivables and Note 15 : Financial Instruments.
O Depreciation and Amortisation – Note 2(j) and Note 8: Property, Plant and Equipment.
h) Goods and Services TaxIncome, expenses and assets are recognised net of the amount of Goods and Services Tax (GST), except where the amount of GST incurred on a purchase of goods and services is not recoverable from the Australian Tax Office (ATO). In these circumstances the GST is recognised as part of the cost of acquisition of the asset or as part of the expense.
Receivables and payables are stated with the amount of GST included. The net amount of GST recoverable from, or payable to, the ATO is included as part of receivables or payables in the Statement of Financial Position.
Cash flows are included in the Statement of Cash Flows on a gross basis. The GST components of cash flows arising from investing and financing activities, which are recoverable from, or payable to, the ATO are classified as operating cash flows. Commitments and contingencies are disclosed net of the amount of GST recoverable or payable unless otherwise specified.
i) Income RecognitionIncome encompasses both revenue and gains.
Income is recognised at the fair value of the consideration received, exclusive of the amount of GST. Exchanges of goods or services of the same nature and value without any cash consideration being exchanged are not recognised as income.
102 Department of Infrastructure Annual Report 2013–2014
Grants and Other ContributionsGrants, donations, gifts and other non-reciprocal contributions are recognised as revenue when the agency obtains control over the assets comprising the contributions. Control is normally obtained upon receipt.
Contributions are recognised at their fair value. Contributions of services are only recognised when a fair value can be reliably determined and the services would be purchased if not donated.
Sale of GoodsRevenue from the sale of goods is recognised (net of returns, discounts and allowances) when:
O the significant risks and rewards of ownership of the goods have transferred to the buyer;
O the agency retains neither continuing managerial involvement to the degree usually associated with ownership nor effective control over the goods sold;
O the amount of revenue can be reliably measured;
O it is probable that the economic benefits associated with the transaction will flow to the agency; and
O the costs incurred or to be incurred in respect of the transaction can be measured reliably.
Rendering of ServicesRevenue from rendering services is recognised by reference to the stage of completion of the contract. The revenue is recognised when:
O the amount of revenue, stage of completion and transaction costs incurred can be reliably measured; and
O it is probable that the economic benefits associated with the transaction will flow to the entity.
Interest RevenueInterest revenue is recognised as it accrues, taking into account the effective yield on the financial asset.
Disposal of AssetsA gain or loss on disposal of assets is included as a gain or loss on the date control of the asset passes to the buyer, usually when an unconditional contract of sale is signed. The gain or loss on disposal is calculated as the difference between the carrying amount of the asset at the time of disposal and the net proceeds on disposal. Refer also to note 3.
Contributions of AssetsContributions of assets and contributions to assist in the acquisition of assets, being non-reciprocal transfers, are recognised, unless otherwise determined by Government, as gains when the agency obtains control of the asset or contribution. Contributions are recognised at the fair value received or receivable.
103Department of Infrastructure Annual Report 2013–2014
j) Depreciation and Amortisation ExpenseItems of property, plant and equipment, including buildings but excluding land, have limited useful lives and are depreciated or amortised using the straight-line method over their estimated useful lives.
Amortisation applies in relation to intangible non-current assets with limited useful lives and is calculated and accounted for in a similar manner to depreciation.
The estimated useful lives for each class of asset are in accordance with the Treasurer’s Directions and are determined as follows:
2014 2013
Buildings 10 years 10 years
Plant and Equipment 3 - 15 years 3 - 15 years
Computer Equipment and Software 3 - 5 years 3 - 5 years
Assets are depreciated or amortised from the date of acquisition or from the time an asset is completed and held ready for use.
k) Interest ExpenseInterest expenses include interest and finance lease charges. Interest expenses are expensed in the period in which they are incurred.
l) Cash and DepositsFor the purposes of the Statement of Financial Position and the Statement of Cash Flows, cash includes cash on hand, cash at bank and cash equivalents. Cash equivalents are highly liquid short-term investments that are readily convertible to cash. Cash at bank includes Deposits Held monies that are ultimately payable to the beneficial owner – refer also to Note 10.
m) ReceivablesReceivables include accounts receivable and other receivables and are recognised at fair value less any allowance for impairment losses.
Analyses of the age of the receivables that are past due as at the reporting date are disclosed in an aging schedule under credit risk in Note 15 Financial Instruments. Reconciliation of changes in the allowance accounts is also presented.
Accounts receivable are generally settled within 30 days and other receivables within 30 days.
104 Department of Infrastructure Annual Report 2013–2014
n) Property, Plant and EquipmentAcquisitionsAll items of property, plant and equipment with a cost, or other value, equal to or greater than $10 000 are recognised in the year of acquisition and depreciated as outlined below. Items of property, plant and equipment below the $10 000 threshold are expensed in the year of acquisition.
The construction cost of property, plant and equipment includes the cost of materials and direct labour, and an appropriate proportion of fixed and variable overheads.
Complex AssetsMajor items of plant and equipment comprising a number of components that have different useful lives, are accounted for as separate assets. The components may be replaced during the useful life of the complex asset.
Subsequent Additional CostsCosts incurred on property, plant and equipment subsequent to initial acquisition are capitalised when it is probable that future economic benefits in excess of the originally assessed performance of the asset will flow to the agency in future years. Where these costs represent separate components of a complex asset, they are accounted for as separate assets and are separately depreciated over their expected useful lives.
o) Revaluations and ImpairmentRevaluation of AssetsSubsequent to initial recognition, buildings are revalued with sufficient regularity to ensure that the carrying amount of these assets does not differ materially from their fair value at reporting date.
Plant and equipment are stated at historical cost less depreciation, which is deemed to equate to fair value.
Impairment of AssetsAn asset is said to be impaired when the asset’s carrying amount exceeds its recoverable amount.
Non-current physical and intangible agency assets are assessed for indicators of impairment on an annual basis. If an indicator of impairment exists, the agency determines the asset’s recoverable amount. The asset’s recoverable amount is determined as the higher of the asset’s depreciated replacement cost and fair value less costs to sell. Any amount by which the asset’s carrying amount exceeds the recoverable amount is recorded as an impairment loss.
Impairment losses are recognised in the Comprehensive Operating Statement. They are disclosed as an expense unless the asset is carried at a revalued amount. Where the asset is measured at a revalued amount, the impairment loss is offset against the asset revaluation surplus for that class of asset to the extent that an available balance exists in the asset revaluation surplus.
105Department of Infrastructure Annual Report 2013–2014
In certain situations, an impairment loss may subsequently be reversed. Where an impairment loss is subsequently reversed, the carrying amount of the asset is increased to the revised estimate of its recoverable amount. A reversal of an impairment loss is recognised in the Comprehensive Operating Statement as income, unless the asset is carried at a revalued amount, in which case the impairment reversal results in an increase in the asset revaluation surplus.
p) Leased AssetsLeases under which the agency assumes substantially all the risks and rewards of ownership of an asset are classified as finance leases. Other leases are classified as operating leases.
Finance LeasesFinance leases are capitalised. A lease asset and lease liability equal to the lower of the fair value of the leased property and present value of the minimum lease payments, each determined at the inception of the lease, are recognised.
Lease payments are allocated between the principal component of the lease liability and the interest expense.
Operating LeasesOperating lease payments made at regular intervals throughout the term are expensed when the payments are due, except where an alternative basis is more representative of the pattern of benefits to be derived from the leased property. Lease incentives under an operating lease of a building or office space are recognised as an integral part of the consideration for the use of the leased asset. Lease incentives are to be recognised as a deduction of the lease expenses over the term of the lease.
q) PayablesLiabilities for accounts payable and other amounts payable are carried at cost, which is the fair value of the consideration to be paid in the future for goods and services received, whether or not billed to the agency. Accounts payable are normally settled within 30 days.
r) Employee Benefits Provision is made for employee benefits accumulated as a result of employees rendering services up to the reporting date. These benefits include wages and salaries and recreation leave. Liabilities arising in respect of wages and salaries, recreation leave and other employee benefit liabilities that fall due within twelve months of reporting date are classified as current liabilities and are measured at amounts expected to be paid. Non-current employee benefit liabilities that fall due after twelve months of the reporting date are measured at present value, calculated using the Government long-term bond rate.
No provision is made for sick leave, which is non-vesting, as the anticipated pattern of future sick leave to be taken is less than the entitlement accruing in each reporting period.
106 Department of Infrastructure Annual Report 2013–2014
Employee benefit expenses are recognised on a net basis in respect of the following categories:
O wages and salaries, non-monetary benefits, recreation leave, sick leave and other leave entitlements; and
O other types of employee benefits.
As part of the financial management framework, the Central Holding Authority assumes the long service leave liabilities of Government agencies, including Construction Division and as such no long service leave liability is recognised in agency financial statements.
s) SuperannuationEmployees’ superannuation entitlements are provided through the:
O Northern Territory Government and Public Authorities Superannuation Scheme (NTGPASS);
O Commonwealth Superannuation Scheme (CSS); or
O non-government employee-nominated schemes for those employees commencing on or after 10 August 1999.
The agency makes superannuation contributions on behalf of its employees to the Central Holding Authority or non-government employee-nominated schemes. Superannuation liabilities related to government superannuation schemes are held by the Central Holding Authority and as such are not recognised in agency financial statements.
t) Contributions by and Distributions to GovernmentThe agency may receive contributions from Government where the Government is acting as owner of the agency. Conversely, the agency may make distributions to Government. In accordance with the Financial Management Act and Treasurer’s Directions, certain types of contributions and distributions, including those relating to administrative restructures, have been designated as contributions by, and distributions to, Government. These designated contributions and distributions are treated by the agency as adjustments to equity.
The Statement of Changes in Equity provides additional information in relation to contributions by, and distributions to, Government.
u) CommitmentsDisclosures in relation to capital and other commitments, including lease commitments are shown at Note 16.
Commitments are those contracted as at 30 June where the amount of the future commitment can be reliably measured.
v) Income Tax and DividendsThe Construction Division (CD) is subject to the Accounting Profits Model as the basis for the
107Department of Infrastructure Annual Report 2013–2014
determination of their income tax equivalents liability under the Income Tax Equivalents Regime. The taxable Income is equivalent to the accounting profit of CD. The taxable income for a particular year may be reduced by all or part of a prior year accounting loss.
CD is required to remit a dividend in accordance with the Northern Territory Government’s Dividend Policy which is 50 per cent of net profit after tax.
w) Government Business Division StatusAs a result of the 2014-15 Budget it was announced that the Construction Division will change in its operating environment and will be consolidated with the Department of Infrastructure (DoI) effective from 1 July 2014 to form a centralised construction authority for government. The most significant change is that Program Delivery Fees will no longer be charged. As a result of this Administrative Arrangement, residual assets and liabilities as at 30 June 2014 will be unconditionally rolled up into DoI, as a distribution to Government. DoI will receive a contribution by Government.
x) Prior Year ErrorCurrent year expenditure is overstated by $352,248 as a result of prior year invoice reversals and consequently, the surplus for the year is understated by the same amount. Had previous year’s revenue not been reversed in 2013/14, the Construction Division’s (CD’s) profit before tax would be $6,594,607.
Receivables and accumulated funds were overstated by $352,248 in the 2012/13 financial year.
If the adjustment had been made in 2011/12 financial year, CD’s sales of goods and service would decrease by $352,248 and the net deficit would have increased to $725,459. Receivables and accumulated funds were overstated by $352,248 in the same year.
y) Financial InstrumentsA financial instrument is a contract that gives rise to a financial asset of one entity and a financial liability or equity instrument of another entity. Financial assets and liabilities are recognised on the Statement of Financial Position when the Construction Division (CD) becomes a party to the contractual provisions of the financial instrument. CD’s financial instruments include cash and deposits; receivables; deposit held; and payables.
Exposure to interest rate risk, foreign exchange risk, credit risk, price risk and liquidity risk arise in the normal course of activities. The agency’s investments, loans and placements, and borrowings are predominantly managed through the Northern Territory Treasury Corporation and Territory Insurance Office adopting strategies to minimise the risk.
Classification of Financial InstrumentsAASB 7 Financial Instruments: Disclosures requires financial instruments to be classified and disclosed within specific categories depending on their nature and purpose.
108 Department of Infrastructure Annual Report 2013–2014
Financial assets are classified into the following categories:
O financial assets at fair value through profit or loss;
O held-to-maturity investments;
O loans and receivables; and
O available-for-sale financial assets.
Financial liabilities are classified into the following categories:
O financial liabilities at fair value through profit or loss (FVTPL); and
O financial liabilities at amortised cost.
Financial Assets or Financial Liabilities at Fair Value through Profit or LossFinancial instruments are classified as at FVTPL when the instrument is either held for trading or is designated as at FVTPL.
An instrument is classified as held for trading if it is:
O acquired or incurred principally for the purpose of selling or repurchasing it in the near term with an intention of making a profit; or
O part of a portfolio of identified financial instruments that are managed together and for which there is evidence of a recent actual pattern of short-term profit-taking; or
O a derivative that is not a financial guarantee contract or a designated and effective hedging instrument.
A financial instrument may be designated as at FVTPL upon initial recognition if:
O such designation eliminates or significantly reduces a measurement or recognition inconsistency that would otherwise arise; or
O the instrument forms part of a group of financial instruments, which is managed and its performance is evaluated on a fair value basis, in accordance with a documented risk management or investment strategy, and information about the grouping is provided internally on that basis; or
O it forms part of a contract containing one or more embedded derivatives, and AASB 139 Financial Instruments: Recognition and Measurement permits the contract to be designated as at FVTPL.
Held-to-Maturity InvestmentsNon-derivative financial assets with fixed or determinable payments and fixed maturity dates that the entity has the positive intent and ability to hold to maturity are classified as held-to-maturity investments. Held-to-maturity investments are recorded at amortised cost using the effective interest method less impairment, with revenue recognised on an effective yield basis.
Loans and ReceivablesFor details refer to Note 2 (m).
109Department of Infrastructure Annual Report 2013–2014
Available-for-Sale Financial AssetsAvailable-for-sale financial assets are those non-derivative financial assets, principally equity securities that are designated as available-for-sale or are not classified as any of the three preceding categories. After initial recognition available-for-sale securities are measured at fair value with gains or losses being recognised as a separate component of equity until the investment is derecognised or until the investment is determined to be impaired, at which time the cumulative gain or loss previously reported in equity is recognised in the Comprehensive Operating Statement.
Financial Liabilities at Amortised CostAmortised cost is calculated using the effective interest method.
z) Fair Value MeasurementFair value is the price that would be received to sell an asset or paid to transfer a liability in an orderly transaction between market participants at the measurement date.
Fair value measurement of a non-financial asset takes into account a market participant’s ability to generate economic benefits by using the asset in its highest and best use or by selling it to another market participant that would use the asset in its highest and best use. The highest and best use takes into account the use of the asset that is physically possible, legally permissible and financially feasible.
When measuring fair value, the valuation techniques used maximise the use of relevant observable inputs and minimise the use of unobservable inputs. Unobservable inputs are used to the extent that sufficient relevant and reliable observable inputs are not available for similar assets/liabilities.
Observable inputs are publicly available data that are relevant to the characteristics of the assets/liabilities being valued. Observable inputs used by the agency include, but are not limited to, published sales data for land and general office buildings.
Unobservable inputs are data, assumptions and judgments that are not available publicly, but are relevant to the characteristics of the assets/liabilities being valued. Such inputs include internal agency adjustments to observable data to take account of particular and potentially unique characteristics/functionality of assets/liabilities and assessments of physical condition and remaining useful life.
All assets and liabilities for which fair value is measured or disclosed in the financial statements are categorised within the following fair value hierarchy based on the inputs used:
Level 1 – inputs are quoted prices in active markets for identical assets or liabilities;
Level 2 – inputs are inputs other than quoted prices included within Level 1 that are observable for the asset or liability, either directly or indirectly; and
Level 3 – inputs are unobservable.

110 Department of Infrastructure Annual Report 2013–2014
3. Gain on Disposal of Assets
Gain on Disposal of Assets 2014 2013
$000 $000
Proceeds from Sale of Minor Assets 0 2
Total Gain on Disposal of Assets 0 2
4. Income Tax ExpenseThe prima facie income tax expense on pre-tax accounting surplus from operations reconciles to the income tax expense in the financial statements as follows:
Income Tax Expense 2014 2013
$000 $000
Net Surplus Before Income Tax 6,242 221
Net Deficit from 2012 0 (373)
Balance of Net Deficit Carried Forward (152) (152)
Income Tax Expense Calculated at 30% (1,827) 0
Income Tax Expense 1,827 0
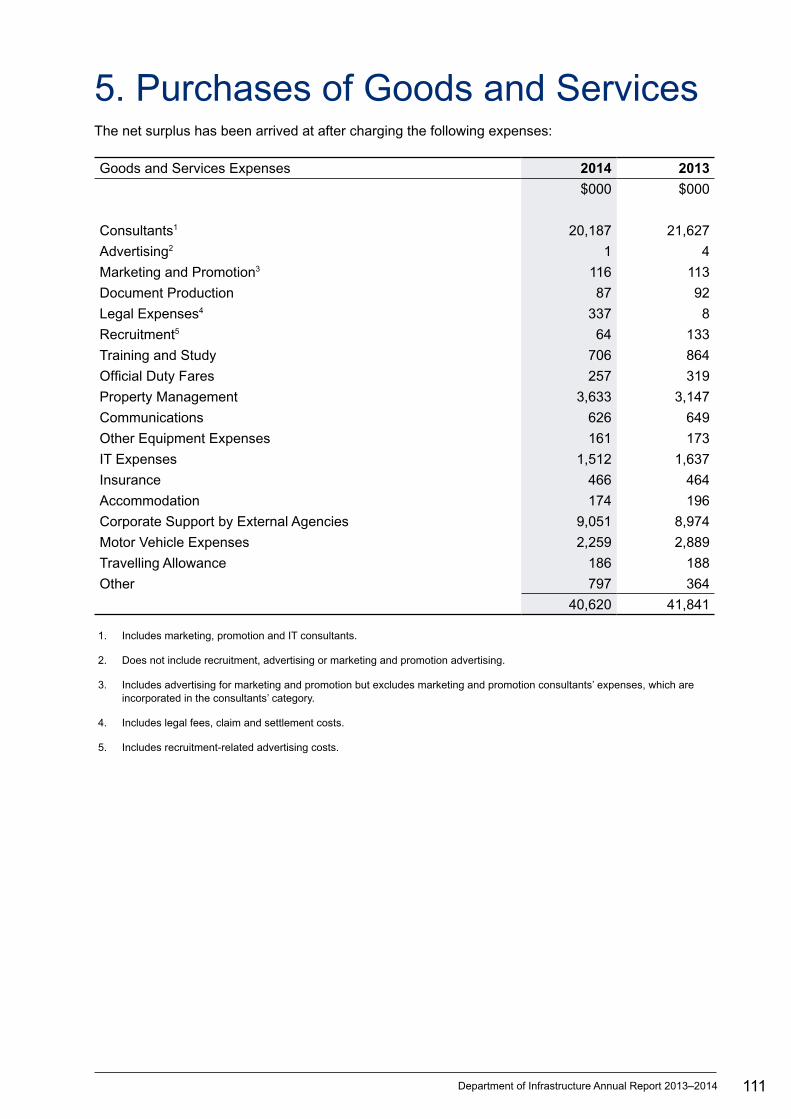
111Department of Infrastructure Annual Report 2013–2014
5. Purchases of Goods and ServicesThe net surplus has been arrived at after charging the following expenses:
Goods and Services Expenses 2014 2013
$000 $000
Consultants1 20,187 21,627
Advertising2 1 4
Marketing and Promotion3 116 113
Document Production 87 92
Legal Expenses4 337 8
Recruitment5 64 133
Training and Study 706 864
Official Duty Fares 257 319
Property Management 3,633 3,147
Communications 626 649
Other Equipment Expenses 161 173
IT Expenses 1,512 1,637
Insurance 466 464
Accommodation 174 196
Corporate Support by External Agencies 9,051 8,974
Motor Vehicle Expenses 2,259 2,889
Travelling Allowance 186 188
Other 797 364
40,620 41,841
1. Includes marketing, promotion and IT consultants.
2. Does not include recruitment, advertising or marketing and promotion advertising.
3. Includes advertising for marketing and promotion but excludes marketing and promotion consultants’ expenses, which are incorporated in the consultants’ category.
4. Includes legal fees, claim and settlement costs.
5. Includes recruitment-related advertising costs.
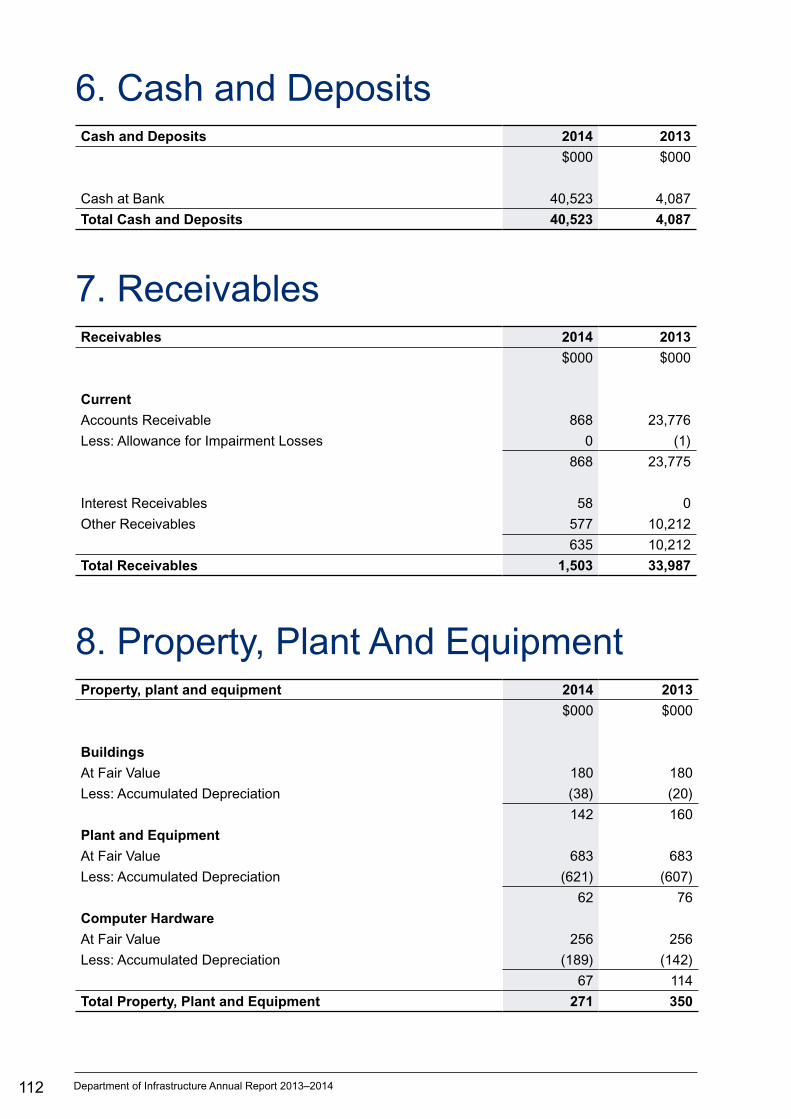
112 Department of Infrastructure Annual Report 2013–2014
6. Cash and DepositsCash and Deposits 2014 2013
$000 $000
Cash at Bank 40,523 4,087
Total Cash and Deposits 40,523 4,087
7. ReceivablesReceivables 2014 2013
$000 $000
Current
Accounts Receivable 868 23,776
Less: Allowance for Impairment Losses 0 (1)
868 23,775
Interest Receivables 58 0
Other Receivables 577 10,212
635 10,212
Total Receivables 1,503 33,987
8. Property, Plant And EquipmentProperty, plant and equipment 2014 2013
$000 $000
Buildings
At Fair Value 180 180
Less: Accumulated Depreciation (38) (20)
142 160
Plant and Equipment
At Fair Value 683 683
Less: Accumulated Depreciation (621) (607)
62 76
Computer Hardware
At Fair Value 256 256
Less: Accumulated Depreciation (189) (142)
67 114
Total Property, Plant and Equipment 271 350
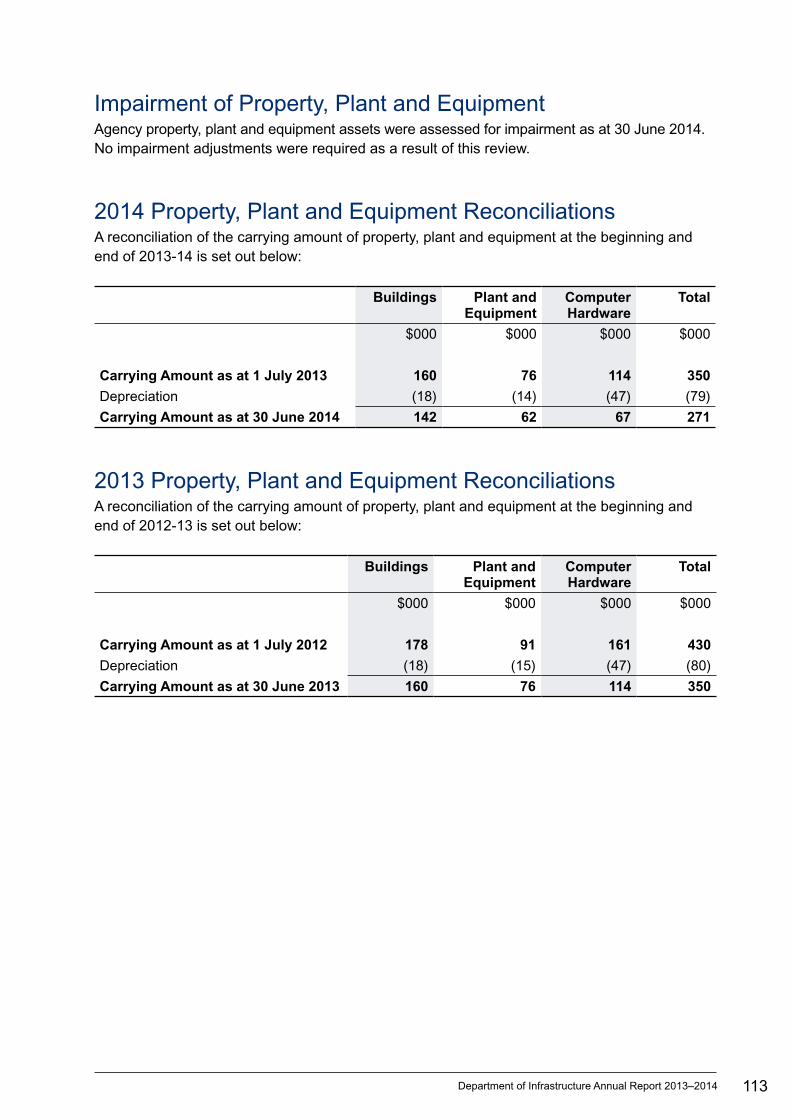
113Department of Infrastructure Annual Report 2013–2014
Impairment of Property, Plant and EquipmentAgency property, plant and equipment assets were assessed for impairment as at 30 June 2014. No impairment adjustments were required as a result of this review.
2014 Property, Plant and Equipment ReconciliationsA reconciliation of the carrying amount of property, plant and equipment at the beginning and end of 2013-14 is set out below:
Buildings Plant and Equipment
Computer Hardware
Total
$000 $000 $000 $000
Carrying Amount as at 1 July 2013 160 76 114 350
Depreciation (18) (14) (47) (79)
Carrying Amount as at 30 June 2014 142 62 67 271
2013 Property, Plant and Equipment ReconciliationsA reconciliation of the carrying amount of property, plant and equipment at the beginning and end of 2012-13 is set out below:
Buildings Plant and Equipment
Computer Hardware
Total
$000 $000 $000 $000
Carrying Amount as at 1 July 2012 178 91 161 430
Depreciation (18) (15) (47) (80)
Carrying Amount as at 30 June 2013 160 76 114 350
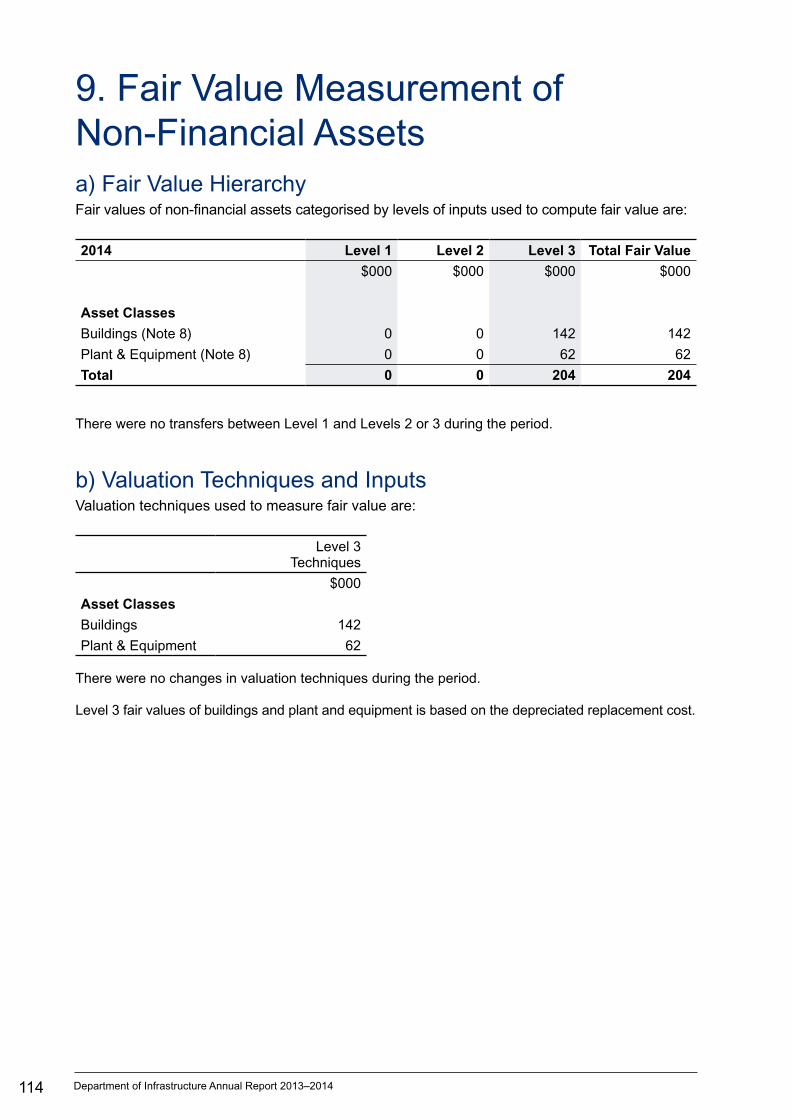
114 Department of Infrastructure Annual Report 2013–2014
9. Fair Value Measurement of Non-Financial Assetsa) Fair Value HierarchyFair values of non-financial assets categorised by levels of inputs used to compute fair value are:
2014 Level 1 Level 2 Level 3 Total Fair Value
$000 $000 $000 $000
Asset Classes
Buildings (Note 8) 0 0 142 142
Plant & Equipment (Note 8) 0 0 62 62
Total 0 0 204 204
There were no transfers between Level 1 and Levels 2 or 3 during the period.
b) Valuation Techniques and InputsValuation techniques used to measure fair value are:
Level 3 Techniques
$000
Asset Classes
Buildings 142
Plant & Equipment 62
There were no changes in valuation techniques during the period.
Level 3 fair values of buildings and plant and equipment is based on the depreciated replacement cost.
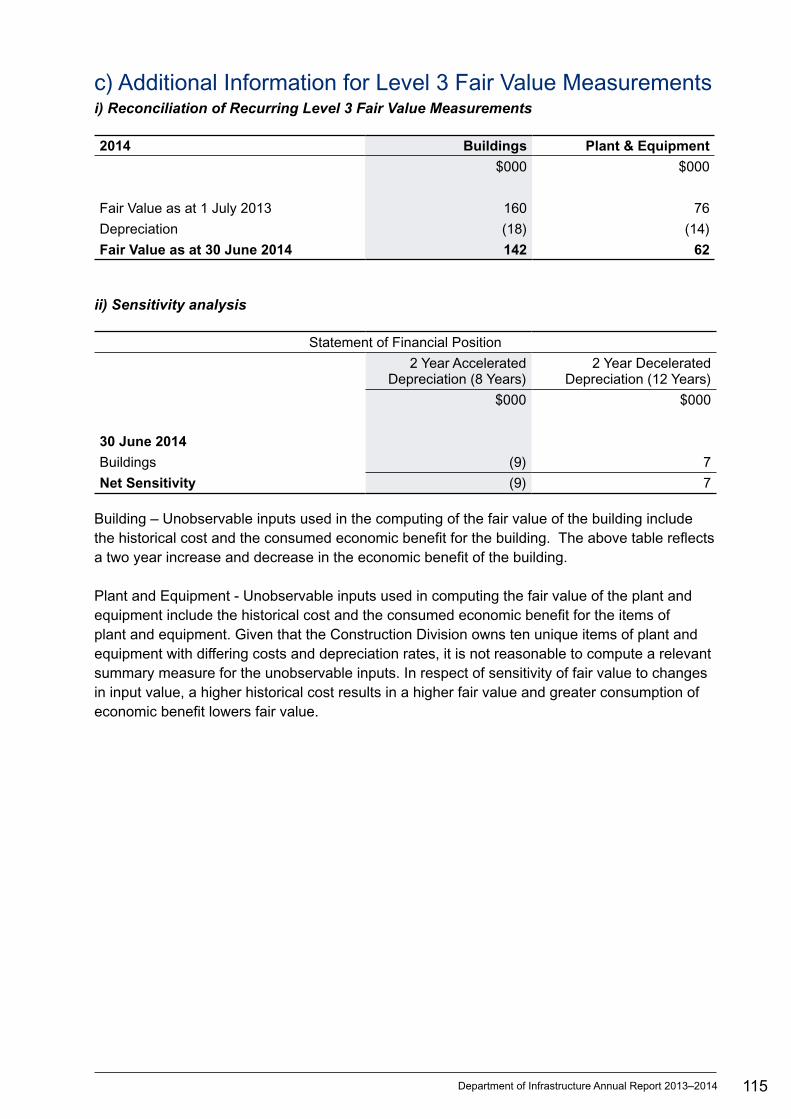
115Department of Infrastructure Annual Report 2013–2014
c) Additional Information for Level 3 Fair Value Measurementsi) Reconciliation of Recurring Level 3 Fair Value Measurements
2014 Buildings Plant & Equipment
$000 $000
Fair Value as at 1 July 2013 160 76
Depreciation (18) (14)
Fair Value as at 30 June 2014 142 62
ii) Sensitivity analysis
Statement of Financial Position
2 Year Accelerated Depreciation (8 Years)
2 Year Decelerated Depreciation (12 Years)
$000 $000
30 June 2014
Buildings (9) 7
Net Sensitivity (9) 7
Building – Unobservable inputs used in the computing of the fair value of the building include the historical cost and the consumed economic benefit for the building. The above table reflects a two year increase and decrease in the economic benefit of the building.
Plant and Equipment - Unobservable inputs used in computing the fair value of the plant and equipment include the historical cost and the consumed economic benefit for the items of plant and equipment. Given that the Construction Division owns ten unique items of plant and equipment with differing costs and depreciation rates, it is not reasonable to compute a relevant summary measure for the unobservable inputs. In respect of sensitivity of fair value to changes in input value, a higher historical cost results in a higher fair value and greater consumption of economic benefit lowers fair value.
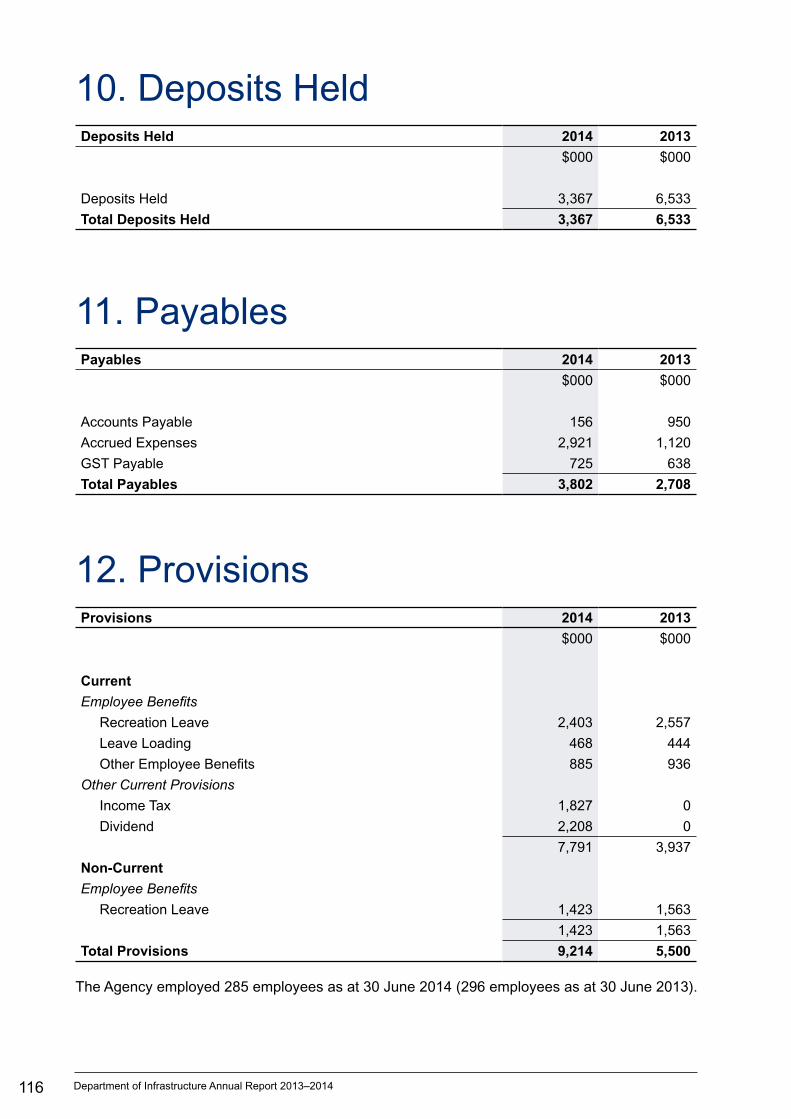
116 Department of Infrastructure Annual Report 2013–2014
10. Deposits HeldDeposits Held 2014 2013
$000 $000
Deposits Held 3,367 6,533
Total Deposits Held 3,367 6,533
11. PayablesPayables 2014 2013
$000 $000
Accounts Payable 156 950
Accrued Expenses 2,921 1,120
GST Payable 725 638
Total Payables 3,802 2,708
12. ProvisionsProvisions 2014 2013
$000 $000
Current
Employee Benefits
Recreation Leave 2,403 2,557
Leave Loading 468 444
Other Employee Benefits 885 936
Other Current Provisions
Income Tax 1,827 0
Dividend 2,208 0
7,791 3,937
Non-Current
Employee Benefits
Recreation Leave 1,423 1,563
1,423 1,563
Total Provisions 9,214 5,500
The Agency employed 285 employees as at 30 June 2014 (296 employees as at 30 June 2013).
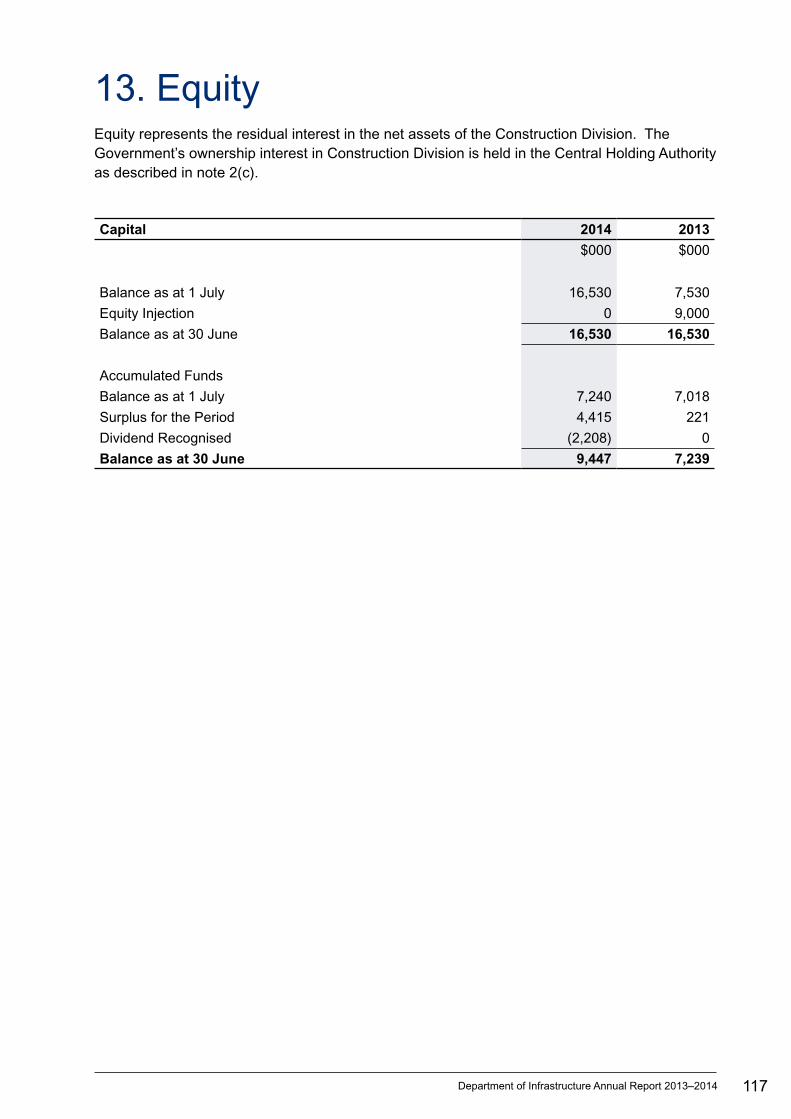
117Department of Infrastructure Annual Report 2013–2014
13. EquityEquity represents the residual interest in the net assets of the Construction Division. The Government’s ownership interest in Construction Division is held in the Central Holding Authority as described in note 2(c).
Capital 2014 2013
$000 $000
Balance as at 1 July 16,530 7,530
Equity Injection 0 9,000
Balance as at 30 June 16,530 16,530
Accumulated Funds
Balance as at 1 July 7,240 7,018
Surplus for the Period 4,415 221
Dividend Recognised (2,208) 0
Balance as at 30 June 9,447 7,239
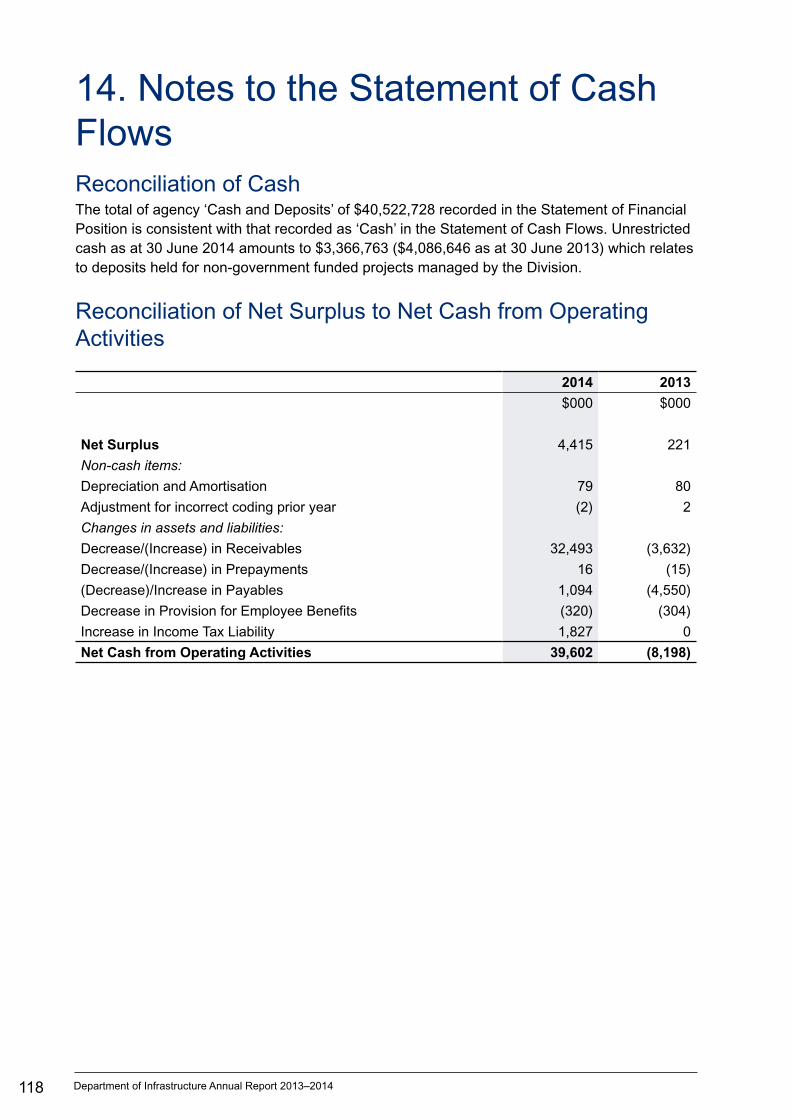
118 Department of Infrastructure Annual Report 2013–2014
14. Notes to the Statement of Cash FlowsReconciliation of CashThe total of agency ‘Cash and Deposits’ of $40,522,728 recorded in the Statement of Financial Position is consistent with that recorded as ‘Cash’ in the Statement of Cash Flows. Unrestricted cash as at 30 June 2014 amounts to $3,366,763 ($4,086,646 as at 30 June 2013) which relates to deposits held for non-government funded projects managed by the Division.
Reconciliation of Net Surplus to Net Cash from Operating Activities
2014 2013
$000 $000
Net Surplus 4,415 221
Non-cash items:
Depreciation and Amortisation 79 80
Adjustment for incorrect coding prior year (2) 2
Changes in assets and liabilities:
Decrease/(Increase) in Receivables 32,493 (3,632)
Decrease/(Increase) in Prepayments 16 (15)
(Decrease)/Increase in Payables 1,094 (4,550)
Decrease in Provision for Employee Benefits (320) (304)
Increase in Income Tax Liability 1,827 0
Net Cash from Operating Activities 39,602 (8,198)

119Department of Infrastructure Annual Report 2013–2014
15. Financial InstrumentsA financial instrument is a contract that gives rise to a financial asset of one entity and a financial liability or equity instrument of another entity. Financial instruments held by the Construction Division (CD) include cash and deposits, receivables, and payables. CD has limited exposure to financial risks as discussed below.
a) Categorisation of Financial InstrumentsThe carrying amounts of the Construction Division’s financial assets and liabilities by category are disclosed in the table below.
2014 2013
$000 $000
Financial Assets
Cash and Deposits 40,523 4,087
Receivables 1,503 33,987
Financial Liabilities
Other Financial Liabilities
Amortised Cost 6,444 8,603
Payables 3,077 2,070
Deposits Held 3,367 6,533
b) Credit RiskThe agency has limited credit risk exposure (risk of default). In respect of any dealings with organisations external to Government, the agency has adopted a policy of only dealing with credit worthy organisations and obtaining sufficient collateral or other security where appropriate, as a means of mitigating the risk of financial loss from defaults.
The carrying amount of financial assets recorded in the financial statements, net of any allowances for losses, represents the agency’s maximum exposure to credit risk without taking account of the value of any collateral or other security obtained.

120 Department of Infrastructure Annual Report 2013–2014
ReceivablesReceivable balances are monitored on an ongoing basis to ensure that exposure to bad debts is not significant. A reconciliation and aging analysis of receivables is presented below.
Aging of Receivables
Aging of Impaired
Receivables
Net Receivables
$000 $000 $000
2013-14
Internal Receivables
Not Overdue 1,246 0 1,246
Overdue for Less than 30 Days 2 0 2
Overdue for 30 to 60 Days 0 0 0
Overdue for More than 60 Days 4 0 4
Total 1,252 0 1,252
External Receivables
Not Overdue 102 0 102
Overdue for Less than 30 Days 32 0 32
Overdue for 30 to 60 Days 0 0 0
Overdue for More than 60 Days 117 0 117
Total 251 0 251
Reconciliation of the Allowance for Impairment Losses
Opening 1
Decrease in Allowance Recognised in Profit or Loss
(1)
Total 0
2012-13
Not Overdue 25,290 0 25,290
Overdue for Less than 30 Days 517 0 517
Overdue for 30 to 60 Days 803 0 803
Overdue for More than 60 Days 7,378 1 7,377
Total 33,988 1 33,987
Reconciliation of the Allowance for Impairment Losses
Opening 7
Written off During the Year (6)
Total 1
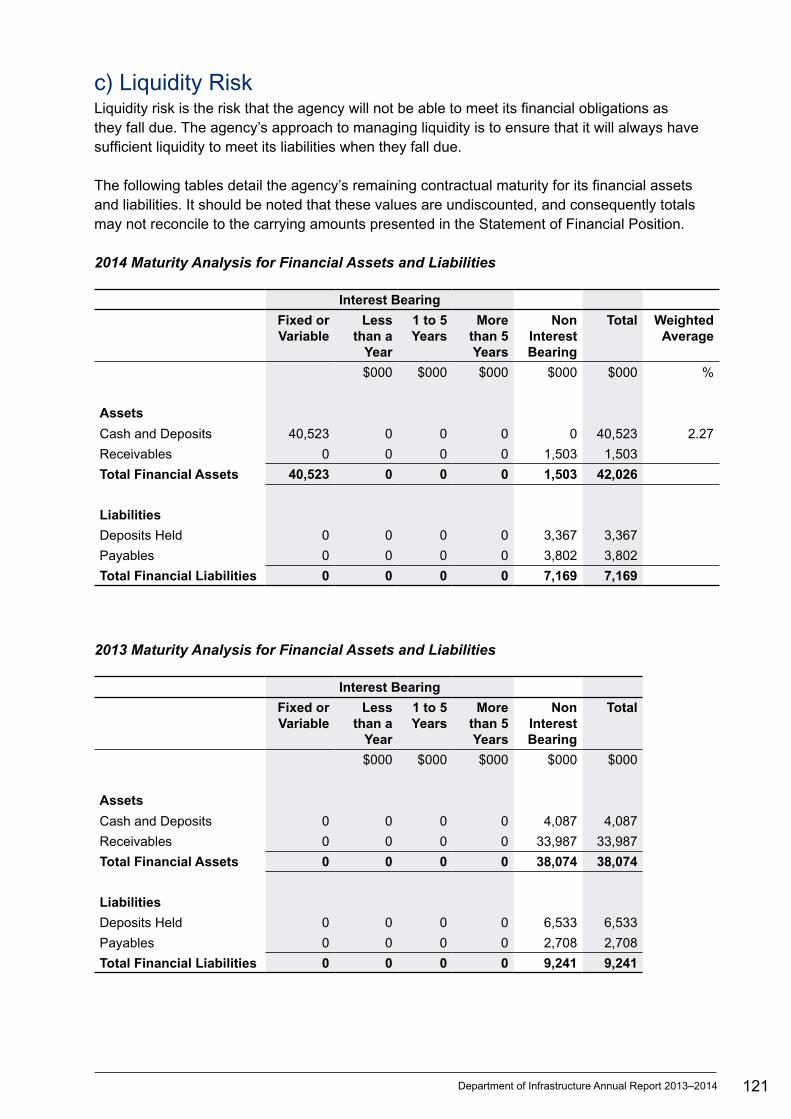
121Department of Infrastructure Annual Report 2013–2014
c) Liquidity RiskLiquidity risk is the risk that the agency will not be able to meet its financial obligations as they fall due. The agency’s approach to managing liquidity is to ensure that it will always have sufficient liquidity to meet its liabilities when they fall due.
The following tables detail the agency’s remaining contractual maturity for its financial assets and liabilities. It should be noted that these values are undiscounted, and consequently totals may not reconcile to the carrying amounts presented in the Statement of Financial Position.
2014 Maturity Analysis for Financial Assets and Liabilities
Interest Bearing
Fixed or Variable
Less than a
Year
1 to 5 Years
More than 5 Years
Non Interest Bearing
Total Weighted Average
$000 $000 $000 $000 $000 %
Assets
Cash and Deposits 40,523 0 0 0 0 40,523 2.27
Receivables 0 0 0 0 1,503 1,503
Total Financial Assets 40,523 0 0 0 1,503 42,026
Liabilities
Deposits Held 0 0 0 0 3,367 3,367
Payables 0 0 0 0 3,802 3,802
Total Financial Liabilities 0 0 0 0 7,169 7,169
2013 Maturity Analysis for Financial Assets and Liabilities
Interest Bearing
Fixed or Variable
Less than a
Year
1 to 5 Years
More than 5 Years
Non Interest Bearing
Total
$000 $000 $000 $000 $000
Assets
Cash and Deposits 0 0 0 0 4,087 4,087
Receivables 0 0 0 0 33,987 33,987
Total Financial Assets 0 0 0 0 38,074 38,074
Liabilities
Deposits Held 0 0 0 0 6,533 6,533
Payables 0 0 0 0 2,708 2,708
Total Financial Liabilities 0 0 0 0 9,241 9,241
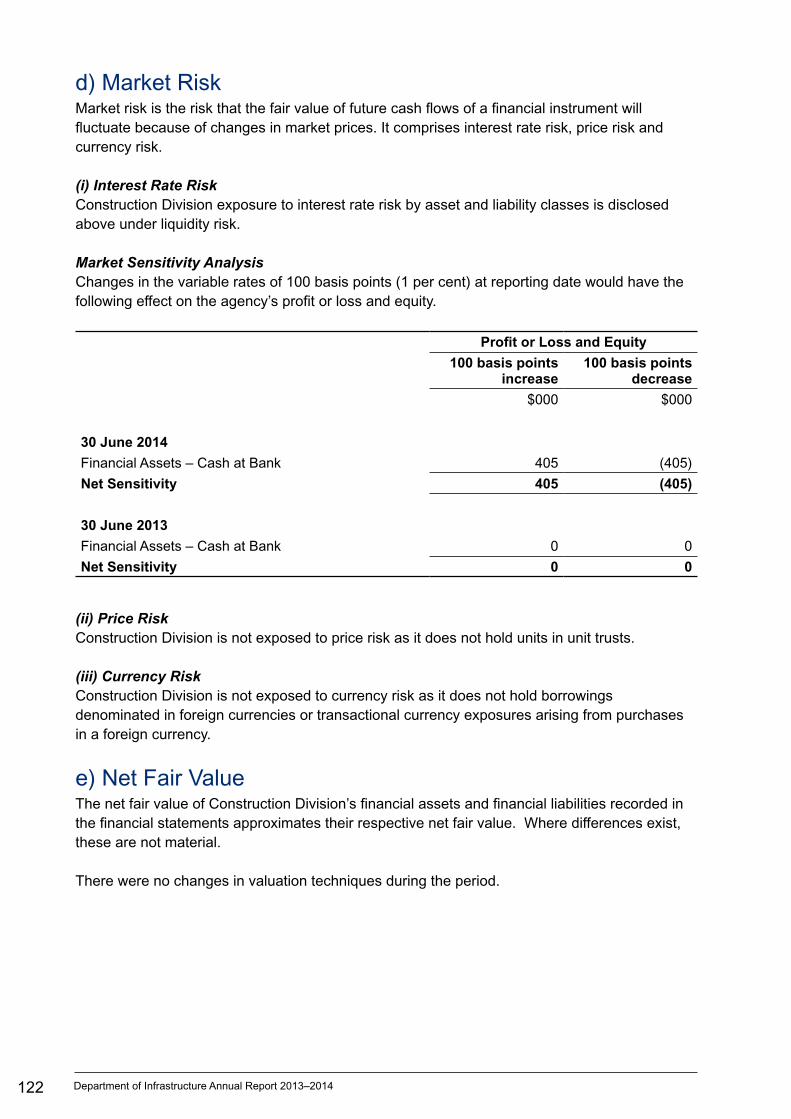
122 Department of Infrastructure Annual Report 2013–2014
d) Market RiskMarket risk is the risk that the fair value of future cash flows of a financial instrument will fluctuate because of changes in market prices. It comprises interest rate risk, price risk and currency risk.
(i) Interest Rate RiskConstruction Division exposure to interest rate risk by asset and liability classes is disclosed above under liquidity risk.
Market Sensitivity AnalysisChanges in the variable rates of 100 basis points (1 per cent) at reporting date would have the following effect on the agency’s profit or loss and equity.
Profit or Loss and Equity
100 basis points increase
100 basis points decrease
$000 $000
30 June 2014
Financial Assets – Cash at Bank 405 (405)
Net Sensitivity 405 (405)
30 June 2013
Financial Assets – Cash at Bank 0 0
Net Sensitivity 0 0
(ii) Price RiskConstruction Division is not exposed to price risk as it does not hold units in unit trusts.
(iii) Currency RiskConstruction Division is not exposed to currency risk as it does not hold borrowings denominated in foreign currencies or transactional currency exposures arising from purchases in a foreign currency.
e) Net Fair ValueThe net fair value of Construction Division’s financial assets and financial liabilities recorded in the financial statements approximates their respective net fair value. Where differences exist, these are not material.
There were no changes in valuation techniques during the period.
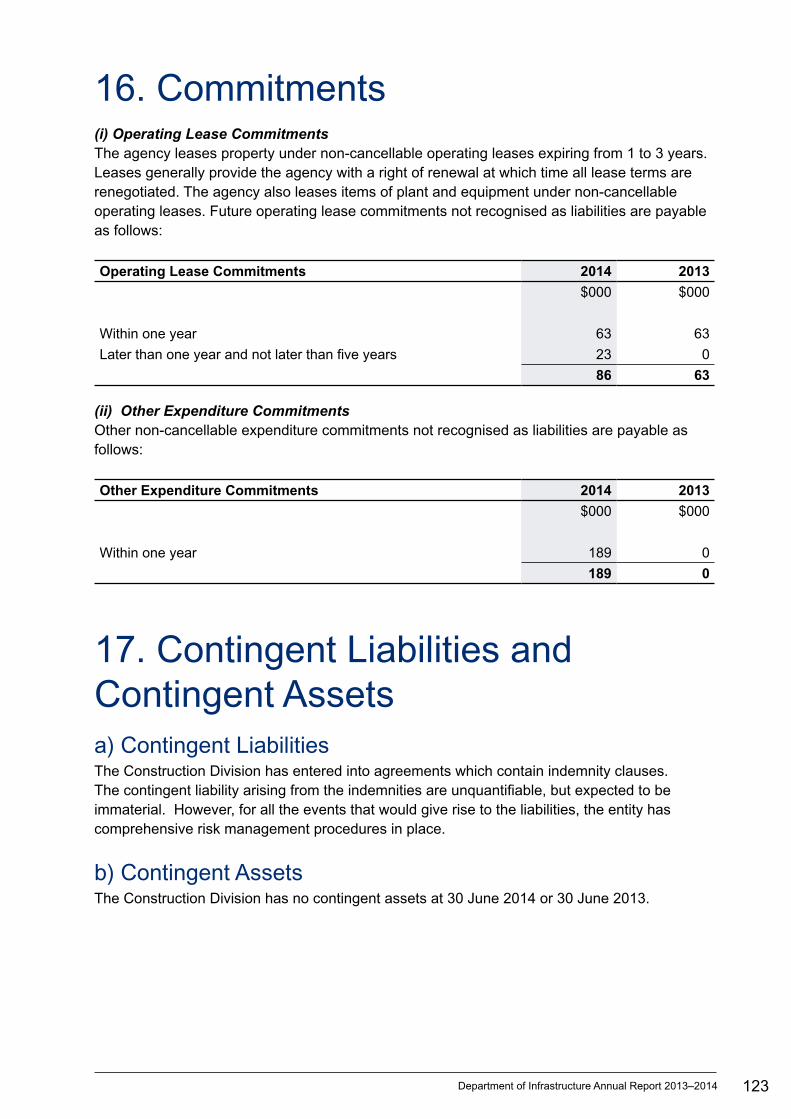
123Department of Infrastructure Annual Report 2013–2014
16. Commitments(i) Operating Lease CommitmentsThe agency leases property under non-cancellable operating leases expiring from 1 to 3 years. Leases generally provide the agency with a right of renewal at which time all lease terms are renegotiated. The agency also leases items of plant and equipment under non-cancellable operating leases. Future operating lease commitments not recognised as liabilities are payable as follows:
Operating Lease Commitments 2014 2013
$000 $000
Within one year 63 63
Later than one year and not later than five years 23 0
86 63
(ii) Other Expenditure CommitmentsOther non-cancellable expenditure commitments not recognised as liabilities are payable as follows:
Other Expenditure Commitments 2014 2013
$000 $000
Within one year 189 0
189 0
17. Contingent Liabilities and Contingent Assetsa) Contingent LiabilitiesThe Construction Division has entered into agreements which contain indemnity clauses. The contingent liability arising from the indemnities are unquantifiable, but expected to be immaterial. However, for all the events that would give rise to the liabilities, the entity has comprehensive risk management procedures in place.
b) Contingent AssetsThe Construction Division has no contingent assets at 30 June 2014 or 30 June 2013.
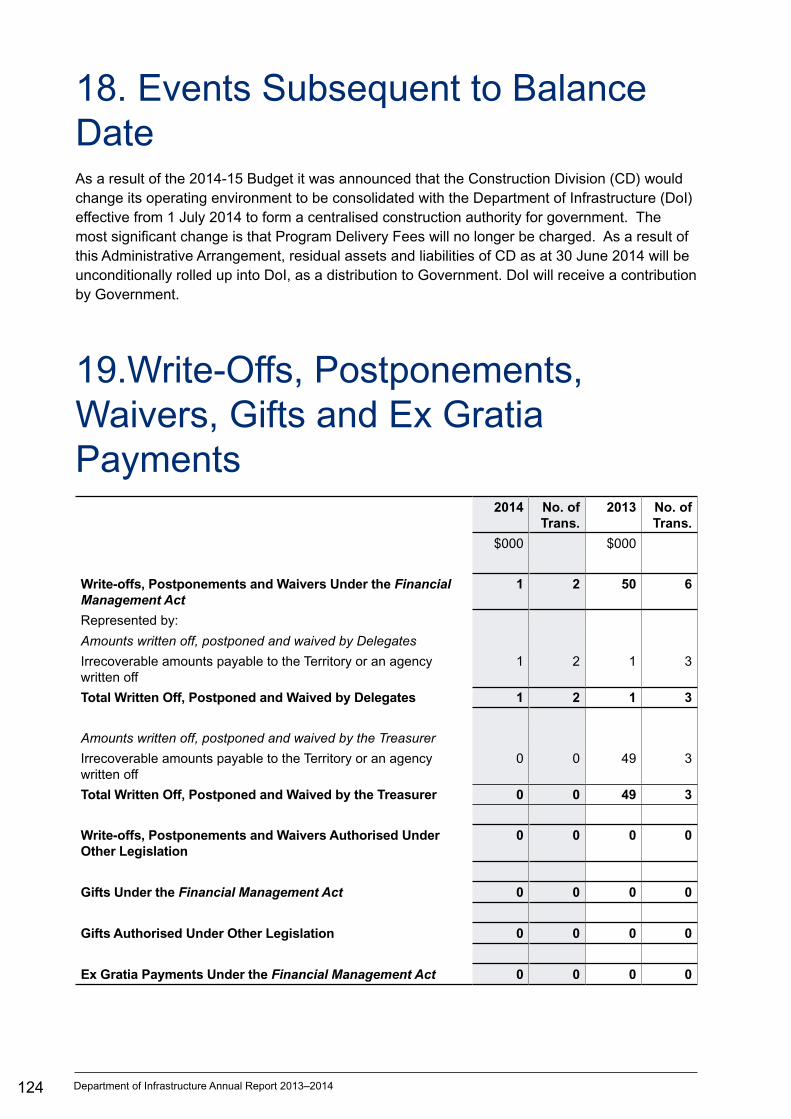
124 Department of Infrastructure Annual Report 2013–2014
18. Events Subsequent to Balance DateAs a result of the 2014-15 Budget it was announced that the Construction Division (CD) would change its operating environment to be consolidated with the Department of Infrastructure (DoI) effective from 1 July 2014 to form a centralised construction authority for government. The most significant change is that Program Delivery Fees will no longer be charged. As a result of this Administrative Arrangement, residual assets and liabilities of CD as at 30 June 2014 will be unconditionally rolled up into DoI, as a distribution to Government. DoI will receive a contribution by Government.
19.Write-Offs, Postponements, Waivers, Gifts and Ex Gratia Payments
2014 No. of Trans.
2013 No. of Trans.
$000 $000
Write-offs, Postponements and Waivers Under the Financial Management Act
1 2 50 6
Represented by:
Amounts written off, postponed and waived by Delegates
Irrecoverable amounts payable to the Territory or an agency written off
1 2 1 3
Total Written Off, Postponed and Waived by Delegates 1 2 1 3
Amounts written off, postponed and waived by the Treasurer
Irrecoverable amounts payable to the Territory or an agency written off
0 0 49 3
Total Written Off, Postponed and Waived by the Treasurer 0 0 49 3
Write-offs, Postponements and Waivers Authorised Under Other Legislation
0 0 0 0
Gifts Under the Financial Management Act 0 0 0 0
Gifts Authorised Under Other Legislation 0 0 0 0
Ex Gratia Payments Under the Financial Management Act 0 0 0 0
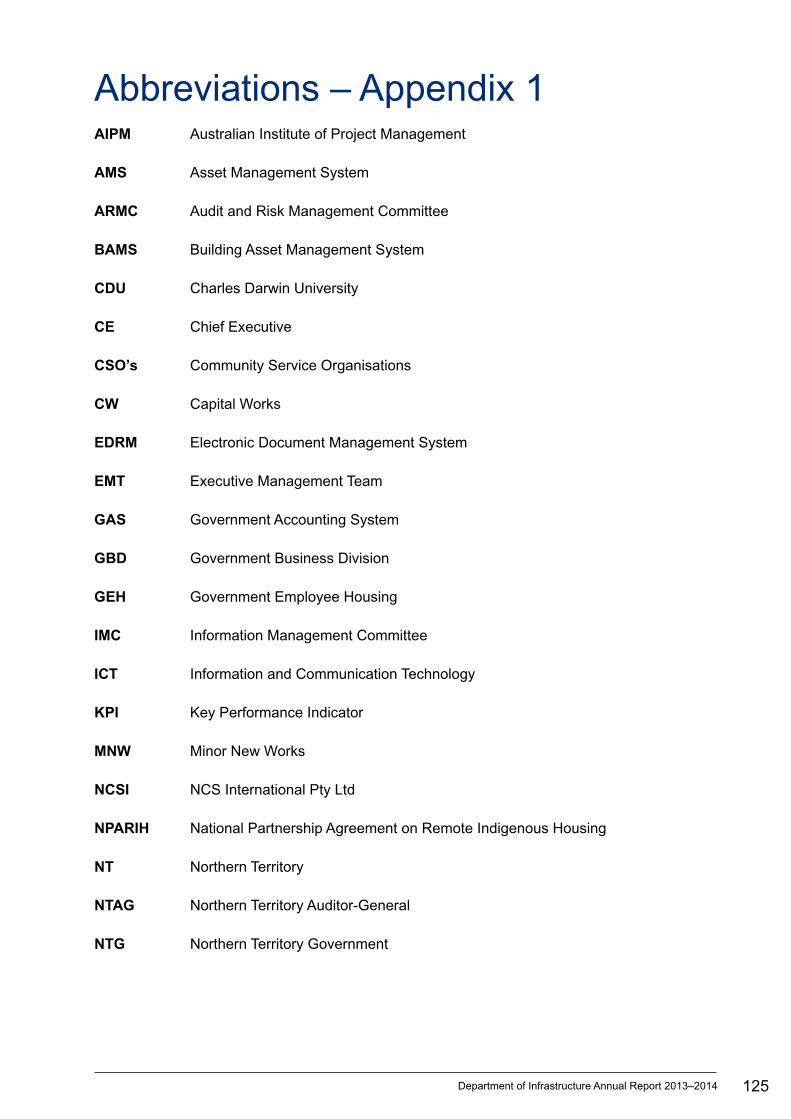
Abbreviations – Appendix 1AIPM Australian Institute of Project Management
AMS Asset Management System
ARMC Audit and Risk Management Committee
BAMS Building Asset Management System
CDU Charles Darwin University
CE Chief Executive
CSO’s Community Service Organisations
CW Capital Works
EDRM Electronic Document Management System
EMT Executive Management Team
GAS Government Accounting System
GBD Government Business Division
GEH Government Employee Housing
IMC Information Management Committee
ICT Information and Communication Technology
KPI Key Performance Indicator
MNW Minor New Works
NCSI NCS International Pty Ltd
NPARIH National Partnership Agreement on Remote Indigenous Housing
NT Northern Territory
NTAG Northern Territory Auditor-General
NTG Northern Territory Government
125Department of Infrastructure Annual Report 2013–2014
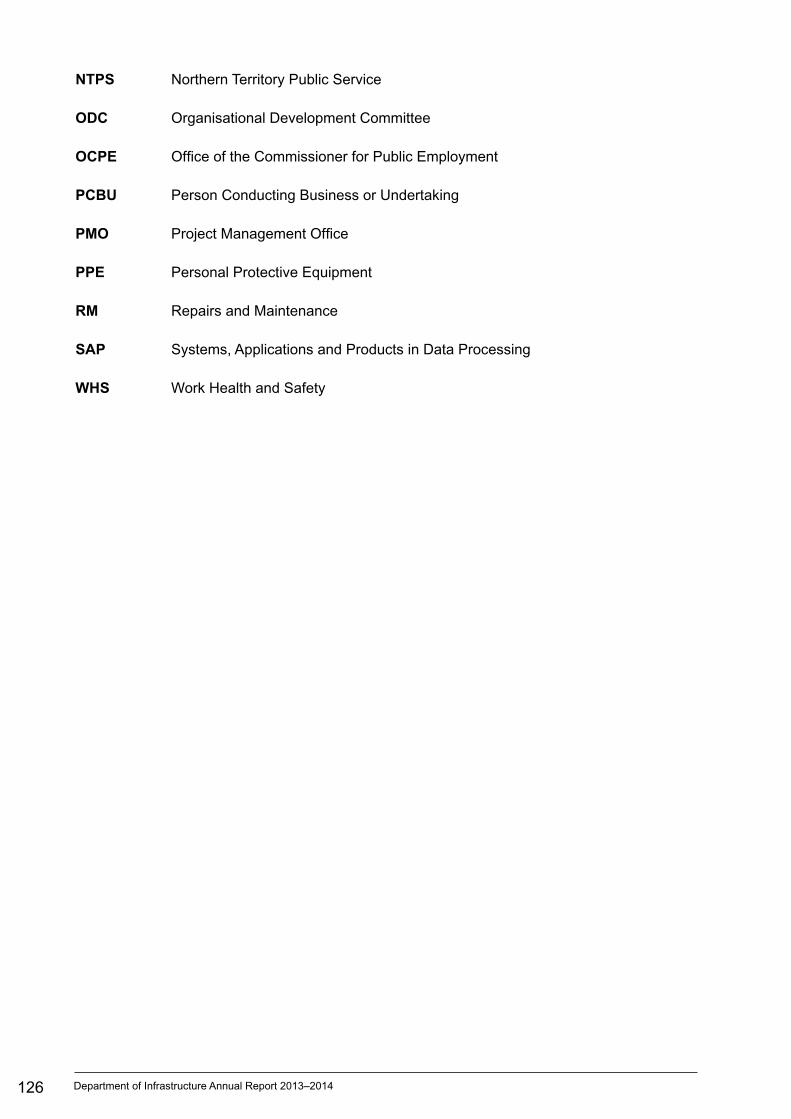
NTPS Northern Territory Public Service
ODC Organisational Development Committee
OCPE Office of the Commissioner for Public Employment
PCBU Person Conducting Business or Undertaking
PMO Project Management Office
PPE Personal Protective Equipment
RM Repairs and Maintenance
SAP Systems, Applications and Products in Data Processing
WHS Work Health and Safety
126 Department of Infrastructure Annual Report 2013–2014


Annual Report
D E PA RT M E N T O F I N F R A S T R U C T U R E
2013 – 2014
Dep
artmen
t of In
frastructu
re An
nu
al Rep
ort 2013–2014