antioxidant properties and color of hibiscus sabdariffa
TRANSCRIPT

crop production
Cien. Inv. Agr. 39(1):79-90. 2012www.rcia.uc.cl
Introduction
Roselle (Hibiscus sabdariffa L.), also known as Jamaica flower, Abyssinia, and Hibiscus, belongs to the Malvaceae family. This species is native to Africa and flowers annually; its flowers consist of a purple-red calyx and corolla. Roselle is cultivated in
tropical regions around the world, such as India, The Philippines, Malaysia, Senegal, Ethiopia, and Mexico (Domínguez-López et al., 2008). The calyces, which dry naturally in sun light and air (Meza-Jiménez et al., 2009), contain organic acids (tartaric, citric, malic, and hibiscic), glucoside compounds, and phenolic compounds, such as anthocyanins (Stuart, 1987; Wong et al., 2002). The most common use of Roselle calyces is for the extraction of soluble solids with hot water to obtain an aromatic infusion that is
research paper
Antioxidant properties and color of Hibiscus sabdariffa extracts
Claudia Salazar-González1, Fidel T. Vergara-Balderas1, Ana E. Ortega-Regules2, and José Á. Guerrero-Beltrán1
1Depto. Ing. Química, Alimentos y Ambiental, Universidad de las Américas Puebla, Cholula, Puebla 72820, México.
2Depto. Ciencias Químico Biológicas, Universidad de las Américas Puebla, Cholula, Puebla 72820, México.
Abstract
C. Salazar-González, F.T. Vergara-Balderas, A.E. Ortega-Regules, and J.Á. Guerrero-Beltrán. 2012. Antioxidant properties and color of Hibiscus sabdariffa extracts. Cien. Inv. Agr. 39(1): 79-90. Liquid extracts of dried Roselle (Hibiscus sabdariffa) calyces obtained using ethanol:water (50:50 and 70:30%, v/v), water, ethanol:1.5 N HCl (85:25%, v/v), and ethanol (96%) to evaluate selected antioxidant characteristics (phenolic compounds and antioxidant capacity), color parameters (L, a, and b), and anthocyanins (delphinidin-3-O-sambubioside, delphinidin-3-O-glucoside (myrtillin), and cyanidin-3-O-sambubioside) by high performance liquid chromatography (HPLC). The total monomeric anthocyanin content was also assessed using the differential pH technique. The phenolic compound content ranged from 1,067±22 (in ethanol) to 2,649±96 (in ethanol:water 70:30%) mg of gallic acid.100 g-1 of dehydrated calyces, and the antioxidant capacity ranged from 3.11±0.50 (in ethanol) to 8.0±0.2 mmoles of trolox.100 g-1 of calyces. The total monomeric anthocyanin content (209±21 mg.100 g-1) was similar to that obtained using the HPLC technique (215±31 mg.100 g-1) when extracting the calyces with the 50:50% (v/v) ethanol:water solution. The deepest red-purple (Hue = 62.50±0.34) colored solution was observed when extracting the calyces with ethanol. The antioxidant and color properties of Roselle calyces make the extracts ideal for use in foods as a natural extract, concentrate, or powder.
Key words: Anthocyanins, antioxidant capacity, cyanidin-3-O-sambubioside, delphinidin-3-O-sambubioside, delphinidin-3-O-glucoside, myrtillin, Hibiscus sabdariffa, Roselle calyces.
Received: January 19, 2011. Accepted August 10, 2011.Corresponding author: [email protected]
ciencia e investigación agraria80
deep red-purple in color. The extracts are also used as a flavoring for sauces, jellies, marmalades, and soft drinks and as a colorant for foods (Simonetti, 1991). In the medical-health area, the infusion is used for its diuretic, astringent, and digestive properties and also to treat different types of cancer, to reduce blood pressure, to deliver renal stones, and to treat high cholesterol (Büyükbalci and El, 2008). Roselle also contains vitamins (thiamine, riboflavin, niacin, and ascorbic acid) and minerals (Ca, P, and Fe).
Phenolic compounds (PCs) are secondary me-tabolites obtained from leaves, seeds, flowers, and bark. PCs are water-soluble chemical compounds possessing an aromatic ring, and the combination of a number of hydroxyl groups and one molecule of sugar, attached to the aromatic ring, form the different types of glycosides (Muchuweti et al., 2007; Vattem et al., 2005). The function of PCs appear to be involved in protecting plants against biological and environmental stresses, as they are synthesized by plants in response to insects, bacteria, fungi, and viruses and also protect plants from UV radiation (Johnson, 2003). Phenolic compounds are associated with the prevention of illnesses generated by oxidative stress, such as cardiovascular problems and cancer; therefore, PCs may protect organisms due to their antioxidant capacity (Faudale et al., 2008).
Anthocyanins, classified as flavonoids, are water-soluble natural pigments (Giusti and Wrolstad, 2001). These compounds are relatively unstable and may be degraded during food processing and storage (Durst and Wrolstad, 2001). Indeed, temperature (Garzón, 2008), pH (Giusti and Wrolstad, 2001), light (Rein, 2005), oxygen (Garzón, 2008), metals (Poo, 2005), organic acids (Garzón, 2008), sugars (Rein, 2005), enzymes (López-Munguía et al., 2002), and co-pigmentation (Rein, 2005) may affect both the structure and stability of anthocyanins.
Antioxidants are strong scavengers of free radicals, which are unstable chemical species that react rapidly (Venereo, 2002) with other chemical species in a biological system. Reactive species, such as
superoxides (O2•- and OOH•), hydroxyl (OH•), and peroxyl (ROO•) radicals, can attack stable molecules in a healthy organism and produce illnesses (Faudale et al., 2008). Antioxidants, including flavonoids, acids, tocopherols, carotenoids, and vitamin C (Howard et al., 2003), may neutralize the oxidative effect of free radicals (Yanishlieva-Maslarova, 2001), and there are several methods based on the capture of free radicals to assess antioxidant capac-ity. The total radical-trapping parameter (TRAP) (Wayner et al., 1985), capture of superoxide anion (CSA) (Kanner and German, 1987), 2,2-diphenyl-1-picryl-hydrazyl (DPPH) radical (Kanner and German, 1987), ferric-reducing antioxidant power (FRAP) (Benzie and Strain, 1996), oxygen radical absorbance capacity (ORAC) (Cao et al., 1997), 2,2’azino-bis(3-ethylbenzo-thiazoline-6-sulfonic acid) diammonium salt (~98%) reagent (ABTS) (Re et al., 1999), and N,N-dimethyl-p-phenylendiamine (DMPD) (González et al., 2001) are methods used to determine the antioxidant capacity of plant extracts. The ABTS method has been used to assess the antioxidant capacity of plant extracts with hydrophilic or lipophilic characteristics: the colored, artificially synthesized ABTS+ radical is trapped by antioxidants from plant extracts, whereby the disappearance of the color of the radical indicates the antioxidant capacity of the extract. This method has been positively validated because it is economical in comparison with other methods (Kuskoski et al., 2004).
The aim of this study was to evaluate the anti-oxidant and color properties of Roselle extracts using different extraction agents.
Materials and methods
Materials
Dehydrated Roselle calyces, dried at 30±2 °C us-ing solar drying, were obtained from Chiautla de Tapia, Puebla, Mexico, and maintained in glass jars under refrigerated conditions (3±1 °C) until used for the analysis.
81VOLUME 39 Nº1 JANUARY - APRIL 2012
Physicochemical analysis
The Roselle calyces were ground using a household blender. The moisture content of the resulting powder was assessed according to the 925.40 AOAC (2000) method. To evaluate the pH, 5 g of Roselle powder was mixed with 5 milliliters of distilled water, stirred for 30 minutes, and filtered through Whatman paper No. 1. The pH was measured using a Jemway 3310 pH meter (Staffordshire, UK). The total soluble solids (°Bx) were measured using a hand-held refractometer (Atago Co. LTD, Tokyo, Japan). The titratable acidity (reported as malic acid equivalents) was evaluated using an acid-base titration procedure and a Jemway 3310 pH meter until reaching pH 8.2 (phenolphthalein color change). All of the analyses were preformed in triplicate.
Liquid extracts
Roselle liquid extracts were obtained according to the Ersus and Yurdagel (2006) method, with modifications. Ethanol:water solutions (50:50 and 70:30%, v/v), water, ethanol:1.5 N HCl (85:15%, v/v), and ethanol (96%) were used for the extrac-tions. Roselle powder (2.5 g) was placed in glass beakers, and 25 mL of the extracting agent was added. The beakers were protected from light with aluminum foil, and the mixture was stirred for 2 h. The supernatant was filtered through What-man paper No. 2 and placed in 25 mL spherical flasks. After the volume was adjusted, the phenolic compounds, antioxidant capacity, anthocyanin content, and color were immediately analyzed. The extractions were performed twice for the color and antioxidant characteristic analyses.
Phenolic compounds
The phenolic compounds were evaluated using the Folin and Ciocalteu’s phenol method (Singleton and Rossi, 1965). Roselle extract (50 µL) was placed in a 50 mL volumetric flask, and 2.5 mL of Folin and
Ciocalteu’s phenol reagent (Sigma-Aldrich, Toluca, Mexico) was added and mixed well. The mixture was allowed to stand at room temperature for 3 min, and then 5 mL of a 20% sodium carbonate solution was added and mixed. The volume was adjusted of 50 mL with distilled water, and the solution was mixed completely. The mixture was allowed to stand at room temperature for 30 minutes, and the absorbance of the mixture was measured at 765 nm using a Cary 100 UV-visible spectro-photometer (Varian, Inc., Palo Alto, CA, USA). A blank was prepared using 50 µL of distilled water instead of an unknown sample (Roselle extract) for the instrument calibration. A standard curve was prepared using 50 µL of solutions containing up to 5.0 mg of gallic acid (GA).L-1. The concentration of gallic acid, as a function of the absorbance, was recorded and plotted to obtain, by linear regression, the slope (0.126 L.mg-1 GA), the intercept (-0.018), and the correlation coefficient (R² = 0.996).
Antioxidant capacity
Radical formation. The antioxidant capacity was evaluated according to the Re et al. (1999) method, as modified by Kuskoski et al. (2004), which is based on the formation of the ABTS+ radical. To this end, 3.3 mg of potassium persulfate and 19.4 mg of ABTS (2,2’azino-bis(3-ethylbenzo-thiazoline-6-sulfonic acid) diammonium salt (~98%)) reagent was placed in a small glass beaker, and five mL distilled water was added and mixed well. The solution was protected from light and allowed to stand for 16 h at room temperature for radical formation. The ABTS+ radical-solution (150 µL) was mixed with 15 mL of absolute ethanol in a glass beaker (radical-ethanol solution, RES), mixed completely, and protected from light.
Roselle extract dilutions. Dilutions of 1:13, 1:12, 1:11, 1:12, and 1:11 (v/v) were prepared for the water, ethanol, 50:50% ethanol-water, 70:30% ethanol-water, and ethanol:HCl Roselle extracts, respectively, with absolute ethanol to obtain between 20 and 80% inhibition of the radical reaction.

ciencia e investigación agraria82
Antioxidant capacity. The RES (980 µL) was placed in a 1 cm quartz cell and allowed to reach an absorbance of 0.7 ± 0.02 at 754 nm in a Cary 100 UV-visible spectrophotometer (Varian, Inc., Palo Alto, CA, USA). This initial absorbance (Ainitial) was recorded. Then, 20 µL of the Roselle extract-ethanol solution was added, mixed well, and allowed to react for 7 min. The final absor-bance (Afinal) was recorded. The following equation was used to obtain the percentage of inhibition:
100*(%)initial
finalinitial
AAA
Inhibition−
=
Standard curve. Micromolar solutions of trolox (6–hydroxy-2,5,7,8-tetramethylchroman-2-carbox-ylic acid) (~97%) up to 15 µM were prepared to generate the standard curve. The linear equation (R² = 0.999) was as follows: Inhibition (%) = 5.045 (µM-1) * trolox concentration (µM) + 2.363. The same procedure was used for testing the anti-oxidant capacity of the Roselle extracts and was calculated using the linear standard parameters.
Total monomeric anthocyanins
The total monomeric anthocyanins (TMAs) were evaluated according to the Giusti and Wrolstad (2001) method, with modifications. A 7 mL aliquot of buffer solution at pH 1 and 4.5 were placed into separate glass tubes, and two hundred µL of Roselle extract was added and mixed well. The absorbance (A) was measured at 520 and 700 nm using a Cary 100 UV-visible spectrophotometer (Varian, Inc., Palo Alto, CA, USA). Distilled water was used as the blank. The total monomeric anthocyanins were calculated as follows:
5.47005200.1700520 )()( == −−−= pHpH AAAAA
lFMWALmgTMA
*1000***)/(
ε=
where A is the difference of the absorbances measured at the two different pH values, MW is the molecular weight (449.2 g.mole-1 for cyanidin-3-O-glucoside), ε
is the molar absorptivity (26,900 L.mole-1.cm-1), F is the dilution factor (total volume/volume of extract), and l is the light path through the quartz cell (1 cm). The results were reported as mg equivalents of cyanidin-3-O-glucoside.100 g-1 of Roselle calyces.
Characterization of anthocyanins
Anthocyanin purification. Roselle extracts were purified according to the Rodríguez-Saona, and Wrolstad (2001) method, with modifications. Roselle extract (12.5 mL) was concentrated using a Büchi evaporator (Rotavapor RE 111, Büchi 461, Apeldoorn-Zuid, Switzerland) at 35 °C and a vacuum of 56 cm Hg. Each Roselle concentrate was mixed with double-distilled water to adjust the volume to 12.5 mL, and the solution was passed through C18 cartridges (C18 matrix attached to silica: Sep-Pak® of 300 mg) (Waters Corp., Milford, Massachusetts, USA) for the purification of the anthocyanins. The cartridges were conditioned before being used by passing two volumes of 3 mL of methanol and then three volumes of diluted hydrochloride acid (0.01%). Afterward, 250 µL of each reconstituted Roselle extract was loaded onto the cartridge, and the anthocyanins were eluted by applying two volumes of 3 mL of diluted hydrochloride acid (0.01%) and two volumes of acidified methanol (0.01%). The final acidified methanol-anthocyanin solution was recovered in a spherical flask and concentrated using a Büchi evaporator. The anthocyanin residues were recov-ered with 500 µL of HPLC-grade water, filtered through a membrane with pores of 45 µm, and analyzed using HPLC chromatography.
Anthocyanin characterization. The anthocya-nins were quantified according to the Lee and Wrolstad (2004) method, with modifications. A Waters HPLC, model 600 (Milford, MA, USA), was used for the anthocyanin characterization, and an Empowers 2TM system was used for con-trolling the anthocyanin separation. A 25x0.4 cm reverse-phase C18 column (LiCrospher 100 RP-18, Germany), with a particle size of 5 mm in diameter,
83VOLUME 39 Nº1 JANUARY - APRIL 2012
was used. Purified Roselle extract (50 µL) was injected into the column and eluted in an isocratic manner using acetonitrile:formic acid (4.5%) HPLC-grade solutions. The acetonitrile:formic acid mixtures were applied in a rate of 1.5 mL.min-1 at proportions of 10:90, 13:87, and 100:0 during 0, 11, and 21 minutes, respectively, and measured at 520 nm. A standard solution (0.2 mg.mL-1) of cyanidin-3-O-glucoside chloride, suspended in ethanol:water (50:50), was injected to evaluate the area under the curve corresponding to 0.2 mg.mL-1 of anthocyanin. This area was used to correlate the three areas observed on the chromatogram to calculate the amount of each anthocyanin corre-sponding to cyanidin-3-O-glucoside chloride. The anthocyanin quantity was calculated according to the following equation:
S
Sample
AUCDFmLmgAUC
mLmgnAnthocyanitandard
100**)/(*2.0*)100/( =
where AUCSample is the area under the curve of the samples, AUCStandard is the area under the curve of the standard prepared at a 0.2 mg of anthocyanin.
mL-1, and DF is the dilution factor (2).
Color
Luminosity (L, white-black), green-red (a), and blue-yellow (b) color parameters, Hunter scale, were measured using a Colorgard® System 05 colorimeter (Gardner, Germany). Roselle extract (20 mL) was placed in a rectangular (10 x 53.5 x 54.7 mm) quartz cell, and the color was measured in the transmittance mode. The purity and tone (H) were calculated as follows:
22 baC +=
= −
abH 1tan
Statistical analysis
The averages and standard deviations of repli-cates were measured using the Excel program (Microsoft Corp., Redmond, WA, USA), and an
analysis of variance was performed using the Minitab 14 (Minitab, Inc., PA, USA) program. A p value of 0.05 indicated significant differences among the data for the different physicochemi-cal analyses.
Results and discussion
Physicochemical characteristics
Roselle calyces contain organic acids (4.42±0.23% malic acid, p/p), a low pH (2.10±0.02), a low moisture content (11.08±0.13%, p/p), and mod-erate total water-soluble solids (5.45±0.02%, p/p) (°Bx). These chemical characteristics make the Roselle dry calyces a very stable product when maintained under dry storage conditions. In addition, the moisture content and total soluble solids are important param-eters to quantify the antioxidant properties per 100 g of dry material.
Phenolic compounds
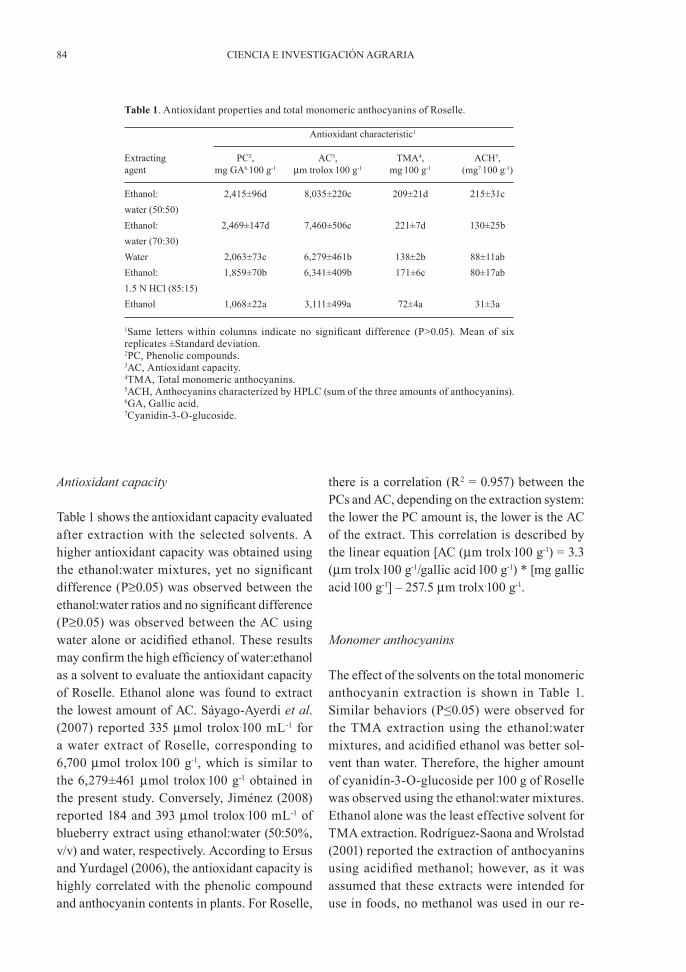
The phenolic compound quantity of the Roselle calyces obtained using different solvent systems is presented in Table 1. The ethanol-water com-binations resulted in a very high extraction of PCs, as high quantities of PC were observed. In contrast, water proved to be a better extrac-tion agent in comparison with ethanol alone or acidified ethanol. No significant difference (P≥0.05) was observed for the quantity of phe-nolic compounds extracted using the ethanol-water mixtures. Sáyago-Ayerdi et al. (2007) reported 66.1 mg GA.100 mL-1 of an aqueous extract (a 1:20 calyces:water ratio) after boiling for 5 minutes. Therefore, the extraction method and solvent could be important variables for the extraction of PCs. Additionally, factors such as the cultivar, growth conditions, soil moisture, and growth temperature may affect the amount of chemical compounds in plants (Ottai et al., 2004).
ciencia e investigación agraria84
Antioxidant capacity
Table 1 shows the antioxidant capacity evaluated after extraction with the selected solvents. A higher antioxidant capacity was obtained using the ethanol:water mixtures, yet no significant difference (P≥0.05) was observed between the ethanol:water ratios and no significant difference (P≥0.05) was observed between the AC using water alone or acidified ethanol. These results may confirm the high efficiency of water:ethanol as a solvent to evaluate the antioxidant capacity of Roselle. Ethanol alone was found to extract the lowest amount of AC. Sáyago-Ayerdi et al. (2007) reported 335 µmol trolox.100 mL-1 for a water extract of Roselle, corresponding to 6,700 µmol trolox.100 g-1, which is similar to the 6,279±461 µmol trolox.100 g-1 obtained in the present study. Conversely, Jiménez (2008) reported 184 and 393 µmol trolox.100 mL-1 of blueberry extract using ethanol:water (50:50%, v/v) and water, respectively. According to Ersus and Yurdagel (2006), the antioxidant capacity is highly correlated with the phenolic compound and anthocyanin contents in plants. For Roselle,
there is a correlation (R2 = 0.957) between the PCs and AC, depending on the extraction system: the lower the PC amount is, the lower is the AC of the extract. This correlation is described by the linear equation [AC (µm trolx.100 g-1) = 3.3 (µm trolx.100 g-1/gallic acid.100 g-1) * [mg gallic acid.100 g-1] – 257.5 µm trolx.100 g-1.
Monomer anthocyanins
The effect of the solvents on the total monomeric anthocyanin extraction is shown in Table 1. Similar behaviors (P≤0.05) were observed for the TMA extraction using the ethanol:water mixtures, and acidified ethanol was better sol-vent than water. Therefore, the higher amount of cyanidin-3-O-glucoside per 100 g of Roselle was observed using the ethanol:water mixtures. Ethanol alone was the least effective solvent for TMA extraction. Rodríguez-Saona and Wrolstad (2001) reported the extraction of anthocyanins using acidified methanol; however, as it was assumed that these extracts were intended for use in foods, no methanol was used in our re-
Table 1. Antioxidant properties and total monomeric anthocyanins of Roselle.
Antioxidant characteristic1
Extracting PC2, AC3, TMA4, ACH5,agent mg GA6.100 g-1 µm trolox.100 g-1 mg.100 g-1 (mg7.100 g-1) Ethanol: 2,415±96d 8,035±220c 209±21d 215±31cwater (50:50)Ethanol: 2,469±147d 7,460±506c 221±7d 130±25bwater (70:30)Water 2,063±73c 6,279±461b 138±2b 88±11abEthanol: 1,859±70b 6,341±409b 171±6c 80±17ab1.5 N HCl (85:15)Ethanol 1,068±22a 3,111±499a 72±4a 31±3a
1Same letters within columns indicate no significant difference (P>0.05). Mean of six replicates ±Standard deviation.2PC, Phenolic compounds.3AC, Antioxidant capacity.4TMA, Total monomeric anthocyanins.5ACH, Anthocyanins characterized by HPLC (sum of the three amounts of anthocyanins).6GA, Gallic acid.7Cyanidin-3-O-glucoside.

85VOLUME 39 Nº1 JANUARY - APRIL 2012
search because of its toxic characteristics. This improvement of the extraction of TMA could be due to the polarity of the ethanol:water combi-nation instead of using ethanol or water alone. Deepa et al. (2007) indicated that the polarity of the combination of ethanol:water is similar to the polarity of anthocyanins; therefore, the extraction of the TMA could be improved using different ethanol:water ratios.
Color
Table 2 illustrates the effect of the type of solvent on the color of the Roselle extract. The ethanol extract presented a higher luminosity value, indicating a lighter liquid in comparison with the other solvents. No significant difference (P≥0.05) was observed for the luminosity values of the ethanol:HCl and water solvents, whereas the luminosity of the other extracting agents was significantly different (P≤0.05). A darker red-purple extract was observed when using the 50:50% (v/v) ethanol:water blend. All of the Roselle extracts exhibited a red-purple color, with the ethanol extract displaying the most color, with an a value of 60.71. No significant difference (P≥0.05) with regard to the a color parameter was observed for water or ethanol:water in a ratio of 70:30% v/v; however, these values were smaller than the a value obtained for ethanol alone. Regarding the b color parameter, all of the values were localized
on the yellow color segment of the L, a, and b color space. All of the b values for the five Roselle extracts were significantly different (P≤0.05), and the ethanol and water extracts presented the lowest and highest b values, respectively. The tone (C) was similar for the five Roselle extracts, whereas the color purity (H) was different for all of the solvents. The extract obtained using ethanol presented the highest purity (62.50 ± 0.34); however, this extract contained the low-est amount of TMA. Conversely, the Roselle extract obtained using 50:50% ethanol:water showed the lowest purity (some opacity) but the highest amount of TMA. These results could be due to the effect of the solvent on color, called “bathochromic shift”, which is the displacement of 10 - 20 nm from the maximum wavelength of the sample on the red region of the visible zone and is related to the polarity of the solvent. Nieves et al. (2006) indicated that a higher polarity of the solvent results in a higher displacement from the maximum wavelength. This “bathochromic shift” may modify the relationship between the color and anthocyanin concentration; thus, it is necessary to use an analytical technique to evalu-ate the anthocyanin content in samples obtained using different extracting agents. Regarding the pH, all of the extracts exhibited an acidic pH because most of the soluble solids in Roselle are organic acids. The acidic environment in the extracts causes the anthocyanins to retain their colored flavylium conformation.
Table 2. Effect of the solvent type on the Roselle calyces extract color1.
Color parameters2
Solvent L a b C3 H4 pH
Ethanol: 17.16±0.03a 37.76±0.04a 9.39±0.05a 0.24±0.00 38.91±0.03 2.55±0.01Water5
Ethanol: 21.28±0.02b 45.08±0.15b 12.14±0.05b 0.26±0.00 46.68±0.13 2.70±0.01Water6
Water 22.83±0.14c 45.61±0.08b 13.59±0.11c 0.29±0.00 47.59±0.11 2.08±0.01Ethanol: 23.59±0.50c 48.98±0.06c 14.32±0.04d 0.28±0.00 51.03±0.07 1.94±0.01HCl7
Ethanol : 36.35±0.18d 60.71±0.34d 14.87±0.03e 0.24±0.00 62.50±0.34 2.31±0.011Same letters within column indicate no significant difference (P > 0.05). 2Mean±standard deviation of six replicates.3C, Tone. 4H, Purity.550:50% (v/v). 670:30% (v/v).71.5 N (85:15%, v/v).

ciencia e investigación agraria86
Anthocyanin characterization (ACH)
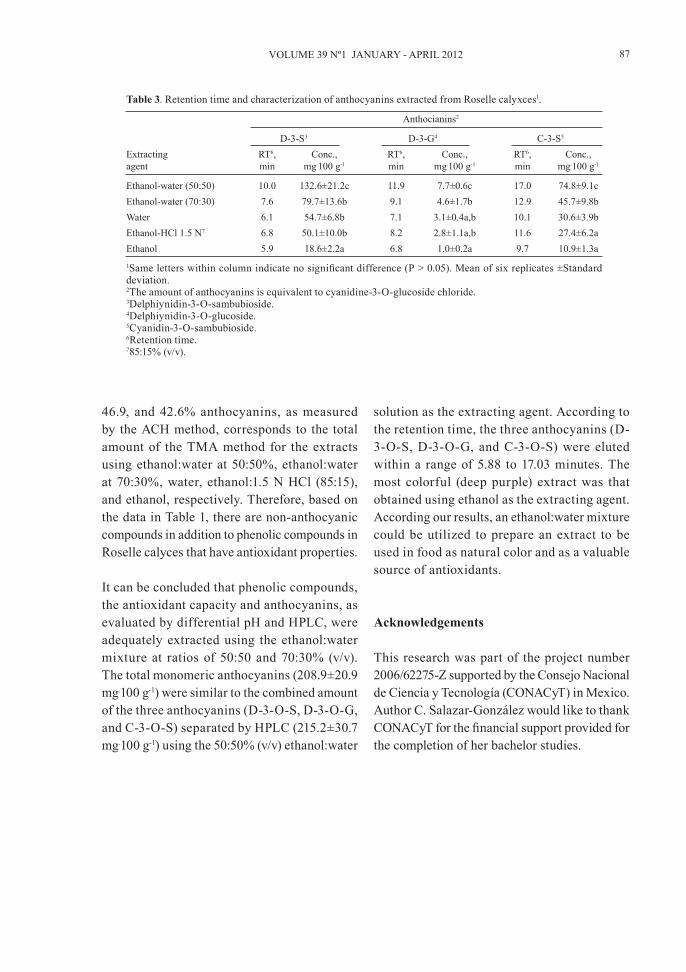
Figure 1 illustrates the anthocyanin separation by HPLC, which occurred in the following order: delphinidin-3-O-sambubioside, delphinidin-3-O-glucoside, and cyanidin-3-O-sambubioside. Hong and Wrolstad (1990) and Hsieh et al. (2008) reported chromatograms similar to that depicted in Figure 1, suggesting that delphinidin-3-O-sambubioside, delphinidin-3-O-glucoside, and cyanidin-3-O-sambubioside are the three mayor anthocyanins in Roselle calyces. An area of 22,962,409 units was obtained for the standard cyanidin-3-O-glucoside chloride sus-pended in ethanol:water (50:50) after the HPLC analysis performed at 520 nm. The retention times were 10.04, 11.92, and 17.03 min, for the three anthocyanins, respectively. The pattern of anthocyanin separation observed in Figure 1 was similar for all of the extractions; however, the retention times depended on the solvent or blend used (Table 3).
Table 3 depicts the retention time and concen-trations of the anthocyanins extracted using the different solvents. The mixture of ethanol:water in a ratio of 50:50% (v/v) was the best system to extract the three types of anthocyanins, fol-lowed by the ethanol:water ratio of 70:30%. No significant difference (P≥0.05) was observed for the concentrations of the three anthocyanins
obtained using the 70:30% (v/v) ethanol:water blend, water or acidified ethanol; ethanol alone extracted the lowest amount of the three types of anthocyanins.
A summary of the quantities of the three types of anthocyanins characterized by HPLC, listed in Table 3, is reported in Table 1 for comparison purposes with the TMA measured using dif-ferential pH. As shown, ethanol:water at a ratio of 50:50% (v/v) produced the highest amount of the three anthocyanins, with the total amount of anthocyanins (Table 1) being significantly different (P≤0.05) from the amounts obtained using the other extracting agents. Furthermore, the total amount of the three anthocyanins (215.2 mg.100 g-1) was similar to the amount measured as the total monomeric anthocyanins (208.9 mg.100 g-1). Regarding the total amount of an-thocyanins of the 70:30% ethanol:water blend, a higher amount of anthocyanins was observed with the TMA method (221.2 mg.100 g-1) ver-sus the ACH method. However, no significant difference (P≥0.05) was observed between the anthocyanin amount extracted using both the 50:50 and 70:30% ethanol:water ratios with the TMA method. The amount of anthocyanins evaluated in the ethanol alone extract was the smallest in comparison with the other of the extracting systems by both the ACH and TMA methods. As a comparison, 103.0, 58.8, 64.0,
Figure 1. Major anthocyanins in an ethanol: water (50:50%, v/v) extract of Roselle, as evaluated by HPLC at 520 nm. A) delphinidin-3-O-sambubioside, B) delphinidin-3-O-glucoside, and C) cyanidin-3-O-sambubioside.
87VOLUME 39 Nº1 JANUARY - APRIL 2012
46.9, and 42.6% anthocyanins, as measured by the ACH method, corresponds to the total amount of the TMA method for the extracts using ethanol:water at 50:50%, ethanol:water at 70:30%, water, ethanol:1.5 N HCl (85:15), and ethanol, respectively. Therefore, based on the data in Table 1, there are non-anthocyanic compounds in addition to phenolic compounds in Roselle calyces that have antioxidant properties.
It can be concluded that phenolic compounds, the antioxidant capacity and anthocyanins, as evaluated by differential pH and HPLC, were adequately extracted using the ethanol:water mixture at ratios of 50:50 and 70:30% (v/v). The total monomeric anthocyanins (208.9±20.9 mg.100 g-1) were similar to the combined amount of the three anthocyanins (D-3-O-S, D-3-O-G, and C-3-O-S) separated by HPLC (215.2±30.7 mg.100 g-1) using the 50:50% (v/v) ethanol:water
solution as the extracting agent. According to the retention time, the three anthocyanins (D-3-O-S, D-3-O-G, and C-3-O-S) were eluted within a range of 5.88 to 17.03 minutes. The most colorful (deep purple) extract was that obtained using ethanol as the extracting agent. According our results, an ethanol:water mixture could be utilized to prepare an extract to be used in food as natural color and as a valuable source of antioxidants.
Acknowledgements
This research was part of the project number 2006/62275-Z supported by the Consejo Nacional de Ciencia y Tecnología (CONACyT) in Mexico. Author C. Salazar-González would like to thank CONACyT for the financial support provided for the completion of her bachelor studies.
Table 3. Retention time and characterization of anthocyanins extracted from Roselle calyxces1.
Anthocianins2
D-3-S3 D-3-G4 C-3-S5
Extracting RT6, Conc., RT6, Conc., RT6, Conc.,agent min mg.100 g-1 min mg.100 g-1 min mg.100 g-1
Ethanol-water (50:50) 10.0 132.6±21.2c 11.9 7.7±0.6c 17.0 74.8±9.1cEthanol-water (70:30) 7.6 79.7±13.6b 9.1 4.6±1.7b 12.9 45.7±9.8bWater 6.1 54.7±6.8b 7.1 3.1±0.4a,b 10.1 30.6±3.9bEthanol-HCl 1.5 N7 6.8 50.1±10.0b 8.2 2.8±1.1a,b 11.6 27.4±6.2aEthanol 5.9 18.6±2.2a 6.8 1.0±0.2a 9.7 10.9±1.3a1Same letters within column indicate no significant difference (P > 0.05). Mean of six replicates ±Standard deviation.2The amount of anthocyanins is equivalent to cyanidine-3-O-glucoside chloride.3Delphiynidin-3-O-sambubioside.4Delphiynidin-3-O-glucoside.5Cyanidin-3-O-sambubioside.6Retention time.785:15% (v/v).
ciencia e investigación agraria88
References
AOAC. 2000. Official Methods of Analysis. 16th edi-tion. Association of Official Analytical Chemists (AOAC). Gaithersburg, Maryland, USA.
Benzie, I., and J. Strain. 1996. The ferric reducing ability of plasma (FRAP) as a measure of anti-oxidant power: the FRAP assay. Analytical Bio-chemistry 239: 70-76.
Büyükbalci, A., and S.N. El. 2008. Determination of in vitro anti diabetic effects, antioxidant activi-ties and phenol contents of some herbal tea. Plant Foods and Human Nutrition 63: 27-33.
Cao, G., E. Sofic, and R. Prior. 1997. Antioxidant and prooxidant behavior of flavonoids: Structure-activity relationships. Free Radical Biological Medicine 22: 749-760.
Deepa, N., C. Kaur, B. George, B. Singh, and H.C. Kapoor. 2007. Antioxidant constituents in some sweet pepper (Capsicum annuum L.) genotypes during maturity. Journal of Food Science and Technology 40: 121-129.
Domínguez-López, G.E. Remondetto, and S. Navar-ro-Galindo. 2008. Thermal kinetics degradation of anthocyanins in a Roselle (Hibiscus sabdariffa L. cv. ‘Criollo’) infusion. International Journal of Food Science and Technology 43: 322-325.
Durst, R., and R. Wrosltad. 2001. Separation and characterization of anthocyanins by HPLC. In: R.E. Wrolstad, T.E. Acree, E.A. Decker, M.H. Penner, D.S. Reid, S.J. Schwart, C.F. Shoemaker, D.M. Smith, and P. Sporns (eds.). Current Proto-cols in Food Analytical Chemistry. John Wiley and Sons, Inc., USA. p. F1.3.1.
Ersus, S., and U. Yurdagel. 2006. Microencapsula-tion of anthocyanins pigments of black carrot (Daucus carota) by spray drier. Journal of Food Engineering 80: 805-812.
Faudale, M., F. Viladomat, J. Bastida, F. Poli, and C. Codina. 2008. Antioxidant activity and phe-nolic composition of wild, edible, and medicinal fennel from different Mediterranean countries. Journal of Agricultural and Food Chemistry 56: 1912-1920.
Resumen
C. Salazar-González, F.T. Vergara-Balderas, A.E. Ortega-Regules y J.Á. Guerrero-Beltrán. 2011. Propiedades antioxidantes y color de extractos de Hibiscus sabdariffa. Cien. Inv. Agr. 39(1): 79-90. Se obtuvieron extractos líquidos de cálices secos de flor de Jamaica (Hibiscus sabdariffa) usando etanol:agua (en proporciones de 50:50 y 70:30%, v/v), agua, etanol:HCl 1.5 N (85:25%, v/v), y etanol (96%), para evaluar algunas características antioxidantes (compuestos fenólicos y capacidad antioxidante), parámetros de color (L, a, and b), antocianinas (delfinidin-3-O-sambubiosido, delfinidin-3-O-glucósido (mirtillin) y cianidin-3-O-sambubiosido), por cromatografía líquida de alta resolución (HPLC), y antocianinas monoméricas totales, por el método de pH diferencial. Los compuestos fenóli-cos se encontraron en un intervalo de 1.067±22 (en etanol) a 2.649±96 (en etanol:agua 70:30%, v/v) mg of ácido gálico 100 g-1 de cálices secos de flor de Jamaica. La capacidad antioxidante se encontró en un rango de 3,11±0,50 (en etanol) a 8,04±0,22 mmoles de trolox 100 g-1 de cálices secos de flor de Jamaica. El contenido de antocianinas monoméricas totales (209±21 mg 100-1 g), evaluado por el método de pH diferencial, resultó similar al obtenido por el método de HPLC (215±31 mg 100 g-1) al usar la solución de etanol:agua al 50:50% (v/v) como agente de extracción. La solución de color rojo más intenso (Tono = 62,50±0,34) fue la obtenida con etanol. Las propiedades antioxidantes y de color de flor de Jamaica hacen que los extractos de esta flor sean de importancia primordial para ser usados en alimentos como extractos naturales, en forma concentrada o en polvo.
Palabras clave: Antocianinas, capacidad antioxidante, cianidin-3-O-sambubiosido, delfinidin-3-O-sambubiosido, delfinidin-3-O-glucosido, flor de Jamaica, Hibiscus sabdariffa, mirtillin.
89VOLUME 39 Nº1 JANUARY - APRIL 2012
Garzón, G. 2008. Las antocianinas como coloran-tes naturales y compuestos bioactivos: revisión. Acta Biológica Colombiana 13(3): 27-36.
Giusti, M., and R. Wrolstad. 2001. Characteriza-tion and measurement of anthocyanins by UV-Visible Spectroscopy. In: R.E. Wrolstad, T.E. Acree, E.A. Decker, M.H. Penner, D.S. Reid, S.J. Schwart, C.F. Shoemaker, D.M. Smith, and P. Sporns (eds.). Current Protocols in Food Ana-lytical Chemistry. John Wiley and Sons, Inc., USA. p. F1.2.1.
González, M.L., P. Rodríguez, and V. Valls. 2001. Actividad antioxidante de la cerveza: estudios in vitro e in vivo). Centro de información de Cer-veza y Salud 8: 4-57.
Hong, V, and R.E. Wrolstad. 1990. Use of HPLC sep-aration/photodiode array detection for character-ization of anthocyanins. Journal of Agricultural and Food Chemistry 38: 708-715.
Howard, L., J. Clark, and C. Brownmiller. 2003. Antioxidant capacity and phenolic content in blueberries as affected by genotype and growing season. Journal of the Science of Food and Agri-culture 83: 1238-1247.
Hsieh, B.-C., R. Matsuura, H. Moriyama, R.L.C. Cen, T. Shimamura, and H. Ukeda. 2008. Char-acterization of superoxide anion scavenging compounds in Roselle (Hibiscus sabdariffa L.) extract by Electron Spin Resonance and LC/MS. Food Science and Technology Research 14: 383-388.
Jiménez, D.M. 2008. Extracción, caracterización y es-tabilización de antocianinas de mora (Vaccinium ashei) mediante encapsulado-secado por asper-sión. Tesis de Maestría. Instituto Tecnológico de Celaya. Celaya, Guanajuato, México. 164 pp.
Johnson, I.T. 2003. Antioxidants and antitumour properties. In: J. Pokorny, N. Yanishlieva, and M. Gordon (eds.). Antioxidants in Foods: Practi-cal Applications. Woodhead Publishing Limited, Cambridge, England. p. 100-123.
Kanner, J. and J. German. 1987. Initiation of lipid peroxidation in biological systems. Critical Re-view in Food Science and Nutrition 25: 317-364.
Kuskoski, M., A. Asuero, M. García-Parrilla, A. Troncoso, and R. Fett. 2004. Actividad antioxi-
dante de pigmentos antociánicos. Ciencia e Tec-nología de Alimentos, Campiñas 24: 691-693.
Lee, J., and R. Wrolstad. 2004. Extraction of antho-cyanins and polyphenolics from blueberry pro-cessing waste. Journal of Food Science 7(69): 564-573.
López-Munguía, A., M. García, and R. Quintero. 2002. Biotecnología Alimentaria. Editorial Li-musa. México, D.F. México. 635 pp.
Meza-Jiménez, J., J. Ramírez-Ruiz, G. Luna-Solano, and I. Andrade-González. 2009. Low-cost solar thermodynamics drying system for the dehydra-tion of Roselle (Hibiscus sabdariffa L.). Drying Technology 27: 621-624.
Muchuweti, M., E. Kativu, C.H. Mupure, C. Chide-we, A.R. Ndhala, and M.A.N. Benhura. 2007. Phenolic composition and antioxidant properties of some spices. American Journal of Food Tech-nology 2: 414-420.
Nieves, A., J.A. Bárcena, R. Fernández, A. Galván, J. Jorrín, J. Peinado, Meléndez-T. Valdéz, and I. Túñez. 2006. Espectrofotometría: Espectros de absorción y cuantificación colorimétrica de biomoléculas. Available online at: www.uco.es/organiza/departamentos/bioquimicabiolmol/pdfs/08_Espectrofotometría.pdf (Website ac-cessed: April 27, 2009).
Ottai, M., A. Abdel-Moniem, and R.A. El-Mer-gawi. 2004. Effect of variety and location on growth and yield components of Roselle, Hi-biscus sabdariffa L. and its infestation with the spiny bollworm Earias insulana (Boisduval). Archives of Phytopathology and Plant Protec-tion 37: 215-231.
Poo, S.M. 2005. Concentración de antocianinas en jugo de cranberries (Vaccinium macrocarpon Ait.) mediante nanofiltración. Tesis de Maestría. Universidad Austral de Chile, Chile. 62 pp.
Re, R., N. Pellegrini, A. Proteggente, A. Annala, M. Yang, and C. Rice-Evans. 1999. Antioxidant ac-tivity applying an improved ABTS radical cation decolorization assay. Free Radical Biology Med-icine 26: 1231-1237.
Rein, M. 2005. Copigmentation reactions and color stability of berry anthocyanins. Master Degree Thesis. University of Helsinki. Finland. 87 pp.
ciencia e investigación agraria90
Rodríguez-Saona, L., and R. Wrolstad. 2001. In: R.E. Wrolstad, T.E. Acree, E.A. Decker, M.H. Penner, D.S. Reid, S.J. Schwart, C.F. Shoemaker, D.M. Smith, and P. Sporns (eds.). Current Protocols in Food Analytical Chemistry. John Wiley and Sons, Inc., USA. p. F1.1.
Sáyago-Ayerdi, S., S. Arranz, J. Serrano, and I. Goñi. 2007. Dietary fiber content and associated anti-oxidant compounds in Roselle flower (Hibiscus sabdariffa L.) beverage. Journal of Agricultural and Food Chemistry 55: 7886-7890.
Simonetti, G. 1991. Simon and Schuster´s guide of herbs and species. Simon and Schuster Inc. New York, USA. 256 pp.
Singleton, V.L., and J.A. Rossi. 1965. Colorimetry of total phenolics with phosphomolybdic-phos-fhotungstic acid reagents. American Journal of Enology and Viticulture 16(3): 144-158.
Stuart, M. 1987. The Encyclopedia of herbs and herbalism. Crescent. USA. 304 pp.
Vattem, D.A., R. Ghaedian, and S. Kalidas. 2005. En-hancing health benefits of berries through phenolic antioxidant enrichment: focus on cranberry. Asia Pacific Journal of Clinical Nutrition 14: 120-130.
Venereo, G.J.R. 2002. Daño oxidativo, radicales li-bres y antioxidantes. Revista Cubana Médica Militar 31: 126-133.
Wayner, D., G. Burton, and K. Ingold. 1985. Quan-titative measure of the total peroxyl radical-trap-ping capacity of human blood plasmas by con-trolled peroxidation. FEBS Letters 187: 33-37.
Wong, P., S. Yusof, H.M. Ghazali, and Y.B. Che-Man. 2002. Physico-chemical characteristics of Roselle (Hibiscus sabdariffa L.). Nutrition and Food Science 32: 68-73.
Yanishlieva-Maslarova, N.V. 2001. Inhibiting oxi-dation. In: J. Pokorny, N. Yanishlieva, and M. Gordon (eds.). Antioxidants in Foods: Practical Applications. Woodhead Publishing Limited, Cambridge, England. p. 22-70.