antonino p. milone
TRANSCRIPT

Antonino P. Milone
Stellar spectroscopy
A. P. Milone Stellar Populations University of Padova, 2021

Homework Homework (by Monday)(by Monday)::– Derive age, distance and reddening of Horologium I*.– Compare your results with those by Brown et al. (2014) based on six UFDs.
– Try to address the following ‘big questions’:
Do true-fossil galaxies exist ?
Is the UFD ‘Horologium I’ a true-fossil galaxy?
Data on more UFDs available on our web pageData on more UFDs available on our web page
Application: Ages from the MS knee
A. P. Milone Stellar Populations University of Padova, 2021
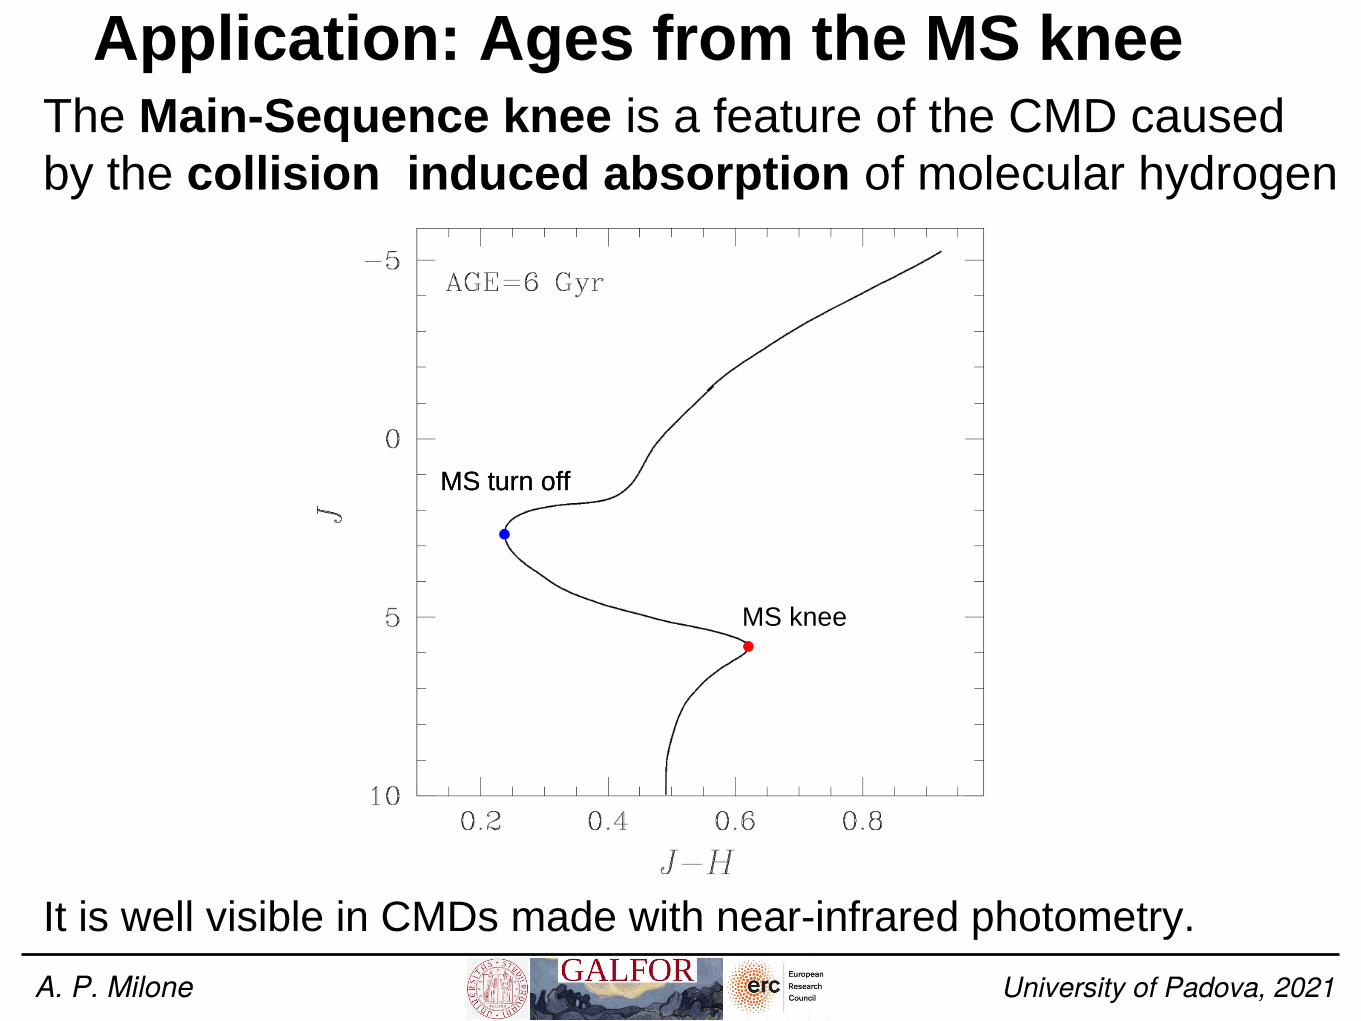
The Main-Sequence knee is a feature of the CMD caused by the collision induced absorption of molecular hydrogen
It is well visible in CMDs made with near-infrared photometry.
MS turn offMS turn off
MS knee

Ages from the MS knee
A. P. Milone Stellar Populations University of Padova, 2021
The magnitude difference between the Main-Sequence turn-off and the Main-Sequence knee is used to infer the age of star clusters.

Ages from the MS knee
A. P. Milone Stellar Populations University of Padova, 2021
The magnitude difference between the Main-Sequence turn-off and the Main-Sequence knee is used to infer the age of star clusters.

Ages from the MS knee
A. P. Milone Stellar Populations University of Padova, 2021
Advantages:
– Not dependent on cluster distance
– Not dependent on cluster extinction
– Not dependent on photometric calibration
– large number of stars

Ages from the MS knee
A. P. Milone Stellar Populations University of Padova, 2021
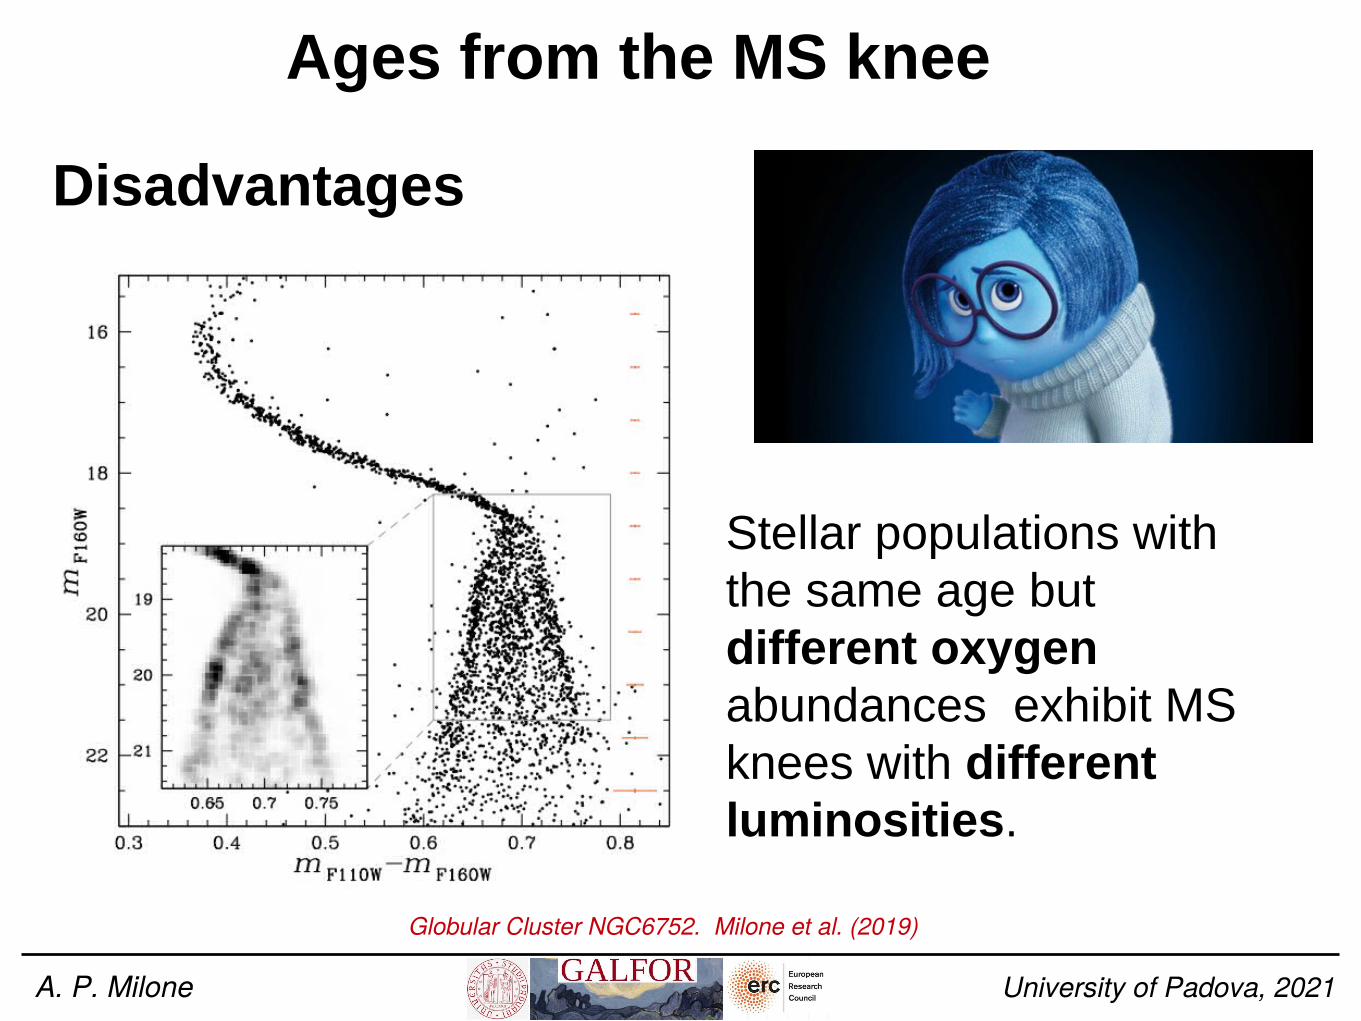
Disadvantages
– MS-knee stars have often faint luminosities– The luminosity of the MS knee is strongly affected by oxygen abundance.
O-richO-poor
Milone et al. (2012)
Ages from the MS knee
A. P. Milone Stellar Populations University of Padova, 2021
Globular Cluster NGC6752. Milone et al. (2019)
Stellar populations with the same age but different oxygen abundances exhibit MS knees with different luminosities.
Disadvantages

Stellar parameters, abundancesand where to find them
Spectroscopic approach

Most-relevant stellar parameters

Measuring elemental abundances

Measuring abundances: equivalent width
The equivalent width for an absorption/emission line is defined as the width of a rectangle – whose height is equal to the height of the continuous and – whose area is qual to the integrated area of the line.
The equivalent width indicates the strength of a line.The equivalent width is independent of the shape of the lineand of the instrumentation.

Measuring abundances: equivalent widthThe curve of growth describes the equivalent width of a spectral line as a function of the column density of the material from which the spectral line is observed.
It is used to infer the abundance of the gas making up the stellar atmosphere.

A. P. Milone Stellar Populations University of Padova, 2021
– Weak lines: Linear part.
– Saturation: Plateau.
– Strong lines: Wings dominate
Measuring abundances: equivalent width
Measuring abundances: equivalent width
Obviouly, one only gets the abundance of the particular ionization state and excitation level that produces the line.
The Boltzmann and Saha equations need to be applied then and the pressure and the temperature of the gas known to derive an abundance of the element (i.e. of all ionization states and excitation levels).
A. P. Milone Stellar Populations University of Padova, 2021

Temperature determination: Spectroscopy.
* Boltzmann’s equation under LTE conditions. Source Letarte

log(g) determination: Spectroscopy.
Ionization balance:
Lines of different ionization stages (e.g. FeI, FeII) have different sensitivity to log(g).
E.g. in cool stars:FeI, the dominant species:
FeII, the minority species:
As a consequence, log(g) can be obtained by enforcing the same abundance is obtained from different ionization stages.

log(g) determination: Spectroscopy.
Strong linesThe wings of strong lines con depend on the atmospheric Pressure and thus on the surface gravity log(g).
Note that the strength of wings depends also on effective temperature and on the abundance.

Spectra synthesis
– In real life, spectra are affected by crowding and
blends. – These represent major challenges for equivalent width determination...
Allende Prieto, Lambert & Asplund (2001)
Simulated spectrum of Arcturus (Resolution=UVES)Source: F. Primas

Spectral synthesis
Elemental abundances are often inferred by comparing the observed spectra with grids of simulated spectra with different chemical composition.
Full spectral synthesis is required.
Marino et al. (2019)

Uncertainties in parameters
The typical uncertainties in the estimated stellar parameters for late-type stars are:
– Teff ~100-300 K (absolute error) ~10-50 K (relative error)
– log(g) ~0.1-0.3 dex (strong lines) ~0.1-1.0 dex (ionization balance)
– [Fe/H] ~0.1-0.5 dex

Relative abundances
The comparison between spectra of stars with the same atmospheric parameters allows us to detect very-small abundance differences.
Spectra of two couple of stars in the Globular Cluster M22 with similar atmospheric parameters. Marino et al. (2009)

Relative abundances.An application on exoplanets

Exoplanets
A. P. Milone Stellar Populations University of Padova, 2021
More than 5,700 extrasolarplanets known (updated as in March 2021):
– Pulsar timing– Radial velocity– Transits– Microlensing– Direct imaging
Mayor & Queloz (1995)

Exoplanets
A. P. Milone Stellar Populations University of Padova, 2021
More than 4,100 extrasolarplanets known (updated as in March 2020):
– Pulsar timing– Radial velocities– Transits– Microlensing– Direct imaging
Charbonneau et al. (2000)
Is there any signature inchemical composition due tothe presence of planets?

Exoplanets

Exoplanets
A. P. Milone Stellar Populations University of Padova, 2021
Planets hosts are more metal-rich than average (e.g. Gonzales et al. 1997).
Udry & Santos (2007)

Exoplanets
A. P. Milone Stellar Populations University of Padova, 2021
Planets hosts are more metal-rich than average
Exoplanets
Melendez et al. (2009)
The ingredients:
High-resolution Mike-Magellan spectroscopy of 11 solar twins and the Sun

Exoplanets
Melendez et al. (2009)
The ingredients:
High-resolution Mike-Magellan spectroscopy of 11 solar twins and the Sun
R=65,000S/N ˜450Δtteff <75KΔtlog(g)<0.1Δt[Fe/H]Fe/H]]< 0.1

Exoplanets
Precision in stellar spectroscopy is better than 0.01 dex in [X/Fe] and [X/H].
Melendez et al. (2009)

Highly-significant correlation with condensation temperature. Elements that easily form dust (with high condensation temperature, i.e., refractories) are underabundant in the Sun.The Sun unusual !!
Exoplanets
Melendez et al. (2009)

In the Sun planet formation locked up refractaries but less of volatiles during the accretion phase.
In the solar twins there was less planet formation and thus more refractaries than Sun.
Exoplanets
Stellar parameters, abundancesand where to find them
Photometric approach

Multi-band photometry
++ =
A. P. Milone Stellar Populations University of Padova, 2021

A. P. Milone Stellar Populations University of Padova, 2021
Multi-band photometry