ap42 chapter 5 reference - united states … file name "ref02_c01s02.pdf" would mean the...
TRANSCRIPT


APTD-1352 a
BACKGROUND INFORMATION FOR PROPOSED NEW SOURCE PERFORMANCE STANDARDS:
Asphalt Concrete Plants Petroleum Refineries Storage Vessels Secondary Lead Smelters and Refineries Brass or Bronze Ingot Production Plants Iron and Steel Plants Sewage Treatment Plants
Volume I, MAIN TEXT
U. S. ENVIRONMENTAL PROTECTION AGENCY Office of Air and Water Programs
Office of Air Quality Planning and Slandards Research Triangle Park, North Carolina 27711
June 1973

The APTD (Air Pollution Technical Data) series of reports is issued by the Office of Air Quality Planning and Standards, Office of Air and Water Programs, Environmental Protection Agency, to
report technical data of interest to a limited number of readers. Copies of APTD reports are
available free of charge to Federal employees, current contractors and grantees, and nonprofit organizations as supplies permit from the Air Pollution Technical Information Center, Environmental Protection Agency, Research Triangle Park, North Carolina 27711 or may be
obtained, for a nominal cost, from the National Technical Information Service, 5285 Port Royal Road, Springfield, Virginia 22151.
Publication No. APTD-1352 a

NATIONAL AIR POLLUTION CONTROL TECHNIQUES ADVISORY COMMITTEE
Chairman h4r. Donald F. Waiters
Office of Air and Water Programs Office of Air Quality Planning and Standards
Environmental Protection Agency Research Triangle Park, N.C. 27711
Mr. John W. Blanton, General Manage
r
Advanced Technology Programs Dept.
General Electric Company Mail"•rop E206 Jimson Road Evendale, Ohio 45213
Mr. Charles M. Copley, Jr. Commissioner, Division of Air
Pollution Control City of St. Louis Room 419 City Hall St. Louis, Missouri 63103
Mr. Rafael Cruz-Perez Amapola #750, Round Hill Trujillo Alto, Puerto Rico 00926
Mr. Arthur R. Dammkoehler Air Pollution Control Officer Pudget Sound Air Pollution Control
Agency 410 W. Harrison Street Seattle, Washington 98119
Mr. George P. Ferreri Acting Director Bureau of Air Quality Conkrol Maryland State Dept. of Health-
and Mental Hygiene 610 N. Howard street, Baltimore, Maryland 21201
iii
Mr. Charles M. Heinen Executive Engineer Materials Engineering Chrysler Corporation Box 1118, Dept. 5000 Highland Park, Michigan 48231
Mr. William Munroe Chie$• Bureau of Air Pollution
Control New Jersey State Bureau. of Air
Pollution Control Department of Environmental
Protection P.O. Box 1390 Trenton, New Jersey 08625
Dr. Robert W. Scott Coordinator for Conservation
Technology Esso Research & Engineering Co. P.O. Box 215 Linden, New Jersey 07036
Dr. R• S, Sholtes Environmental ,,Engineer Envir0nmenta• Engineering Inc. 2324 Southwest 34th Street Gainesville, Flo/-Fda 32601
Mr. W. M. Smith Director, Environmental Control National Steel Corpbration Box 431, Room 159, General Office Weirton, West Virginia 26062
Dr. Aaron J. Teller, President Teller Environmental Systems, Inc. 295 5th Avenue New York, N.Y. 10016
Mr. A. J. yon Frank Director, Air and Watdr Pollution
Control Allied Chemical Corporation P.O. Box I057R Morristown, New •[ersey 07960
Mr. Benjamin F. Wake Administrator, Environmental
Sciences Division Montana State Dept. of Health
and Environmental Sciences Cogswell Building Helena, Montana 59601
Dr. Ruth F. Weiner Chairman, Dept. of Physical
Sciences Florida Internati6nal University Tamiami Trail Miami, Florida 33144
Mr. Raymond L. Wiggins Manager, Systems Development Auto- Trol Corporation Arvada, Colorado 8000Z

FEDERAL AGENCY LIAISON COMMITTEE
Mr. Donald F. Walters Office of Air and Water Programs
Office of Air Quality Planning and Standards Environmental Protection Agency
Research Triangle Park, N. C. 27711
DEPARTMENT OF AGRICULTURE Dr. Theodore C. Byerly Assistant Director of Science and
Education Office of the Secretary U.S. Department of Agriculture Washington, D.C. 20250
NATIONAL AERONAUTICS AND SPACE ADMINISTRATION
Mr. Ralph E. Cushman Special Assistant Office of Administration National Aeronautics and Space
Administration
DEPARTMENT OF COMMERCE Dr. James R. McNesby Room A361, Materials Building National Bureau of Standards Washington, D.C. 20234
DEPARTMENT OF TREASURY Mr. Gerard Brannon Dire=tot, Office of Tax Analysis Room 4217 MT Department of the Treasury 15th and Pennsylvania Ave. N.W. Washington, D.C. 20220
NATIONAL SCIENCE FOUNDATION Dr. O.W. Adams Program Director for Structural
Chemistry Division of Mathematical and
Physical Sciences National Science Foundation 1800 G Street, N.W. Washington, D.C. 20550
FEDERAL POWER COMMISSION Mr. T.A. Philips Chief, Bureau of Power Federal .Power Commission Room 301] 411G Street, N. W. Washington, D.C. 20426
GENERAL SERVICES ADMINIS TRA TION
Mr. Harold •. Pavel Director, Repair & /rnprovement
Division Public Building Service General Services Administration 9th and D Street, S. W. Washington, D.C.
TENNESSEE VALLEY AUTHORITY Dr. F.E. Gartrell Director of Environmental Research
and Development Tennessee Valley Authority 715 Edney Building Chattanooga, Tennessee 37401
ATOMIC ]ENERGY COMMISSION Dr. Martin B. Biles Director, Division of Operational
Safety U.S. Atomic Energy Commission Washington, D.C. 20545

VETERANS ADMINISTRATION Mr. Gerald M. Hollander, P.E.
Director of Architecture and Engineering
Office of Construction Veterans Administration
Room 619 Lafayette Building 811 Vermont Avenue N.W, Washington, D. C. 204Z0
DEPAI•TMENT OF JUSTICE Mr. Walter Kiechel, It. Land and Natural Resources Div.
Department of Justice Room Z139 10th and Constitution Avenue, N.W. Washington, D. C. 20530
DEPARTMENT OF LABOR Mr. Robert D. Gidel Deputy Director, Bureau of Labor
Standards Department of Labor Room 401, Railway Labor Building 400 ist Street, N.W. Washington, D. C. 20210
DEPARTMENT OF DEFENSE Harvey A. Falk, Commander, USN Office of the Assistant Secretary
of Defense Washington, D. C. 20301
AIR FORCE ENVIRONMENTAL QUALITY OFFICE Colonel Herbert E. Bell Hq. USAF (PREV) Room 5E425, Pentagon Washington, D. C. 20330
DEPARTMENT OF HOUSING AND
URBAN DEVELOPMENT Mr. Richard H. Brown Deputy Director Office of Col•nmunity and Environ-
mental Standards Community Planning and Management Department of Housing and Urban
Development 451 7th Street, S. W. Washington, D. C. 20410
POSTAL SERVICE Mr. Robert Powell Assistant Program Manager U.S. Postal Service Room 4419 ii00 Z Street Washington, D.C. 20260
DEPARTMENT OF TRANSPORTATION
Dr. Richard L. Strombotne Office of the Assistant Secretary
for Systems Development and
Technology Department of Transportation 400 7th Street, S. W. Washington, D. C. 20591
DEPARTMENT OF THE INTERIOR
Mr. Harry Moffet Deputy Assistant Secretary Minerals and Energy Policy Department of Interior Washington, D. C. 20240
DEPARTMENT OF HEALTH, EDUCATION, AND WELFARE Dr. Ian A. Mitchell Special Assistant to the Assistant
Secretary for Health and
Scientific Affairs
Department of Health, Education, and Welfare
Room 5620N, North HEW Building 330 IndependenCe Avenue, S.W. Washington, D. C. 20201

TABLE OF CONTENTS
Section Page
LIST OF FIGURES x
LIST OF TABLES xi
ABSTRACT :. xi•
CONVERSION FACTORS, BRITISH TO METRIC UNITS x• i
INTRODUCTION Special Note General Considerations 2
Development Procedures 2 Limits in Terms of Concentration Compliance Testing and Instrumentation 3 Use of Alternative Methods 3 Waiver of Compliance Test 4 Comparisons with State and Local Regulations 4 Environmental Impact 5 Economic Impact 5 Provisions for Startup, Shutdown, and
Malfunction 5 Nomenclature 5
Abbreviations 7 Definitions 7 Code Methods
'.. 7 Control Equipment 8
TECHNICAL REPORT NO. 6 ASPHALT CONCRETE PLANTS 9 Summary of Proposed Standards 9 Emissions from Asphalt Concrete Plants 9 Rationale for Proposed Standards 10
Section Page
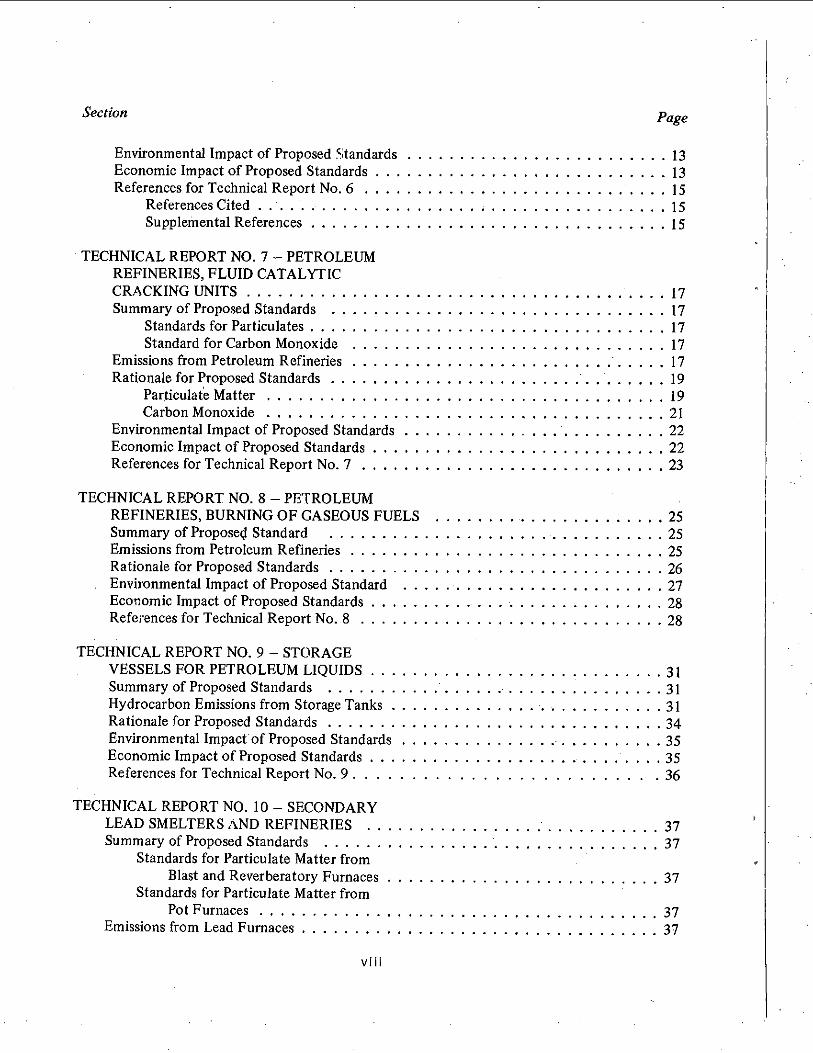
Environmental Impact of Proposed 5;tandards 13 Economic Impact of Proposed Standards 13 References for Technical Report No. 6 15
References Cited 15 Supplemental References 15
TECHNICAL REPORT NO. 7 PETROLEUM REFINERIES, FLUID CATALYTIC CRACKING UNITS 17 Summary of Proposed Standards 17
Standards for Particulates 17 Standard for Carbon Monoxide 17
Emissions from Petroleum Refineries 17 Rationale for Proposed Standards 19
Par•iculat'e Matter 19 Carbon Monoxide 21
Environmental Impact of Proposed Standards 22 Economic Impact of Proposed Standards 22 References for Technical Report No. 7 23
TECHNICAL REPORT NO. 8 PETROLEUM REFINERIES, BURNING OF GASEOUS FUELS 25 Summary of Propose•l Standard 25 Emissions from Petroleum Refineries 25 Rationale for Proposed Standards 26 Environmental Impact of Proposed Standard 27 Economic Impact of Proposed Standards 28 References for Technical Report No. 8 28
TEcHNIcAL REPORT NO. 9 STORAGE VESSELS FOR PETROLEUM LIQUIDS 31 Summary of Proposed Standards 31 Hydrocarbon Emissions from Storage Tanks 31 Rationale for Proposed Standards 34 Environmental Impact of Proposed Standards 35 Economic Impact of Proposed Standards 35 References for Technical Report No. 9 36
TECHNICAL REPORT NO. 10 SECONDARY LEAD SMELTERS AND REFINERIES 37 Summary of Proposed Standards 37
Standards for Particulate Matter from Blast and Reverberatory Furnaces 37
Standards for Particulate Matter from Pot Furnaces 37
Emissions from Lead Furnaces 37
Section Page
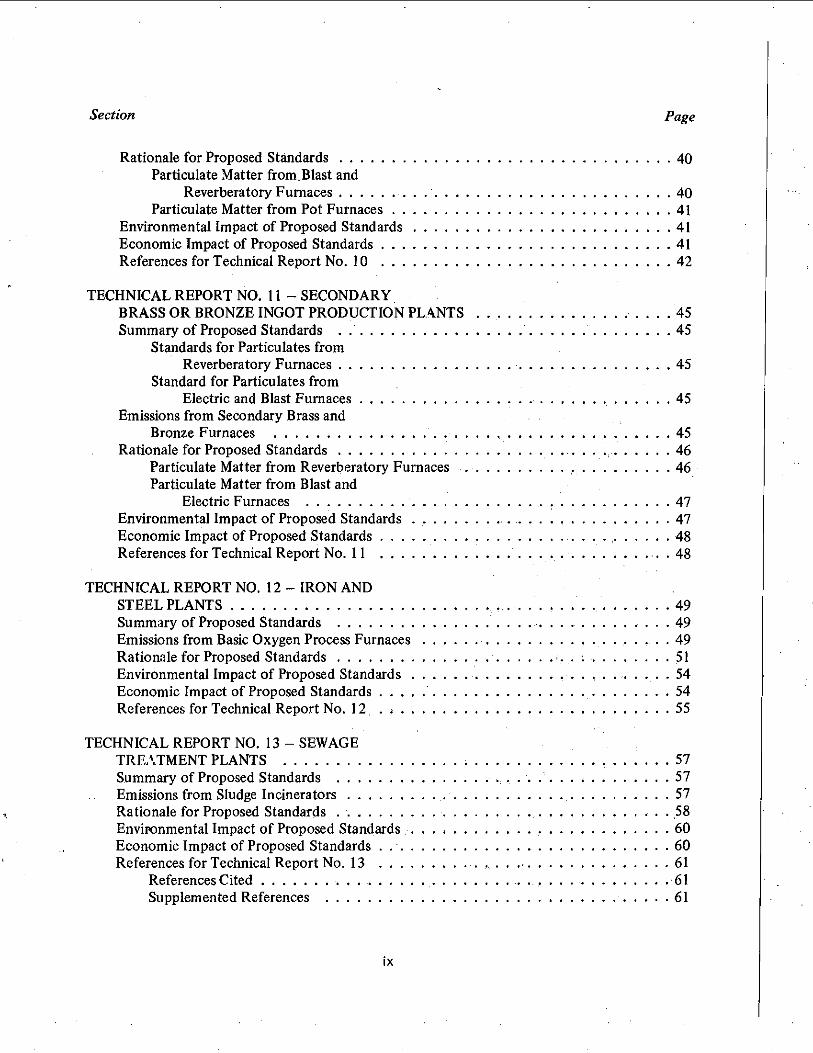
Rationale for Proposed Standards 40 Particulate Matter from.Blast and
Reverberatory Furnaces 40 Particulate Matter from Pot Furnaces 41
Environmental Impact of Proposed Standards 41 Economic Impact of Proposed Standards 41 References for Technical Report No. 10 42
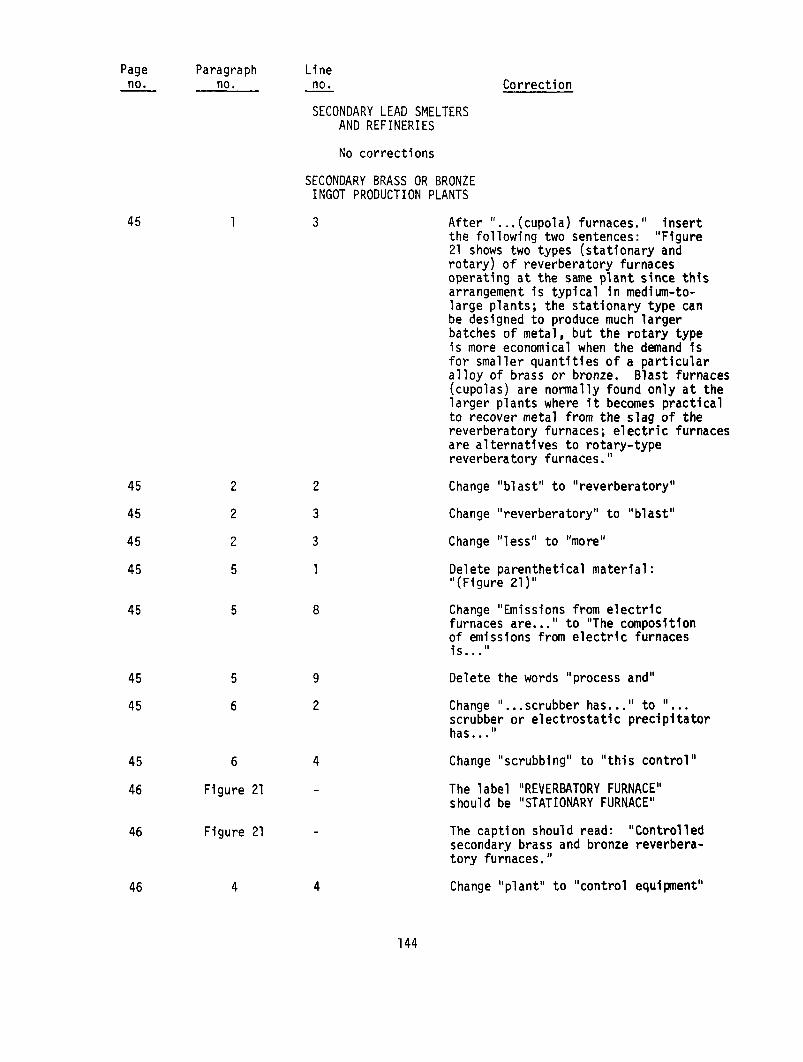
TECHNICAL REPORT NO. 11 SECONDARY. BRASS OR BRONZE INGOT PRODUCTION PL.•.NTS 45 Summary of Proposed Standards . 45
Standards for Particulates from Reverberatory Furnaces 45
Standard for Particulates from Electric and Blast Furnaces 45
Emissions from Secondary Brass and Bronze Furnaces 45
Rationale for Proposed Standards 46 Particulate Matter from Reverberatory Furnaces 46 Particulate Matter from Blast and
Electric Furnaces 47 Environmental Impact of Proposed Standards 47 Economic Impact of Proposed Standards 48 References for Technical Report No. 11 .: 48
TECHNICAL REPORT NO. 12 IRON AND STEEL PLANTS 49 Summary of Proposed Standards 49 Emissions from Basic Oxygen Process Furnaces 49 Rationale for Proposed Standards 51 Environmental Impact of Proposed Standards 54 Economic Impact of Proposed Standards 54 References for Technical Report No. 12 55
TECHNICAL REPORT NO. 13 SEWAGE TREATMENT PLANTS 57 Summary of Proposed Standards 57 Emissions from Sludge Incinerators 57 Rationale for Proposed Standards 158 Environmental Impact of Proposed Standards 60 Economic Impact of Proposed Standards . 60 References for Technical Report No. 13 61
References Cited 61 Supplemented References 61

LIST OF FIGURES
Figure Page
Uncontrolled Hot-mix Asphalt Concrete Plant 9 2 Controlled !tot-mix Asphalt Concrete Plant . . •.. 10
,3 Particulate Emissions from Asphalt Concrete Plants, Combined Dryer and Scavenger Exhausts
. . .' 11
4 Petroleum Refinery Fluid Catalytic Cracking Unit with Control System :...
. :. 18 5 Fluid Catalytic Cracking Unit Regenerator
with Carbon Monoxide Boiler and Electrostatic Precipitator :.'. 18
6 Particulate Emissions from Petroleum Refineries, • Fluid Catalytic Cracking Units 20 17 Carbon Monoxide Emissions from Petroleum Refineries,
Fluid Catalytic Cracking Units . .'. 21 8 Petroleum Refinery Process Gas System 26 9" Petroleum Refinery Process Gas Treating Unit. •'. 27 i0 Fixed-roof (Cone-roof) Storage Vessel .... .... 32
Single-deck Floating-roof Storage Vessel '. .. ".. 32 12 Double-deck Floating-roof Storage Vessel 32 13 Covered Floating-roof Storage Vessel
with Internal Floating Cover 33 14 Seals for Floating-roof Storage Vessels
.... 33
i5 Storage Vessel Vapor Recovery System .. •. 34 •16 Secondary Lead Smelter Process 38 ;17 Controlled Lead Blast Furnace,
Afterburner and Baghouse 38 18 Controlled Lead Reverberatory Furnace, Baghouse 39 19 Controlled Lead Pot and Ventilation System, Baghouse 39 20 Particulate Emissions from Secondary Lead
Smelters and Refineries, Blast and Reverberatory Furnaces 40
Controlled Secondary Brass and Bronze Furnaces :..' 46 Particulate Emissions from Secondary Brass and Bronze
Ingot Production Industry, Reverberatory and Blast Furnaces ..... 47
23' Iron and Steel Process System . .... .:.. 49 24 Controlled Basic Oxygen Furnace, OpenHood with
Scrubber or Electrostatic Precipitator 51
21 :22
X

Figure Page
25 Controlled Basic Oxygen Furnace, Closed Hood with Scrubber 51
26 Particulate Emissions from Iron and Steel Industry, Basic Oxygen Process Furnaces 52
27 Controlled Multiple-hearth Furnace, Scrubber 58 28 Controlled Fluidized Bed Reactor, Scn•bber 58 29 Particulate Emissions from Sewage Treatment Plant,
Sludge Incinerator 59
LIST OF TABLES
8
9
Table Page
2 3 4 5 6
Representative Data from Process Weight Curve 4 Summary of Cost Estimates 6 Control Costs for Typical Asphalt Concrete Plants 14 Control Costs for Catalytic Cracking Units 23 Control Costs for Petroleum Storage Tanks .:. 36 Control Costs of Meeting Performance Standard foi"
Typical Secondary Lead Plants 42 Control Costs of Me•ting Performance Standard for
Reverberatory Furnaces ..,
48 Control Costs 9f Meeting Performance Standard for
Typical New Two-vessel Basic Oxygen Process Furnaces ; 55
Control Cost for Typical Sewage Sludge Incinerator 61
xi
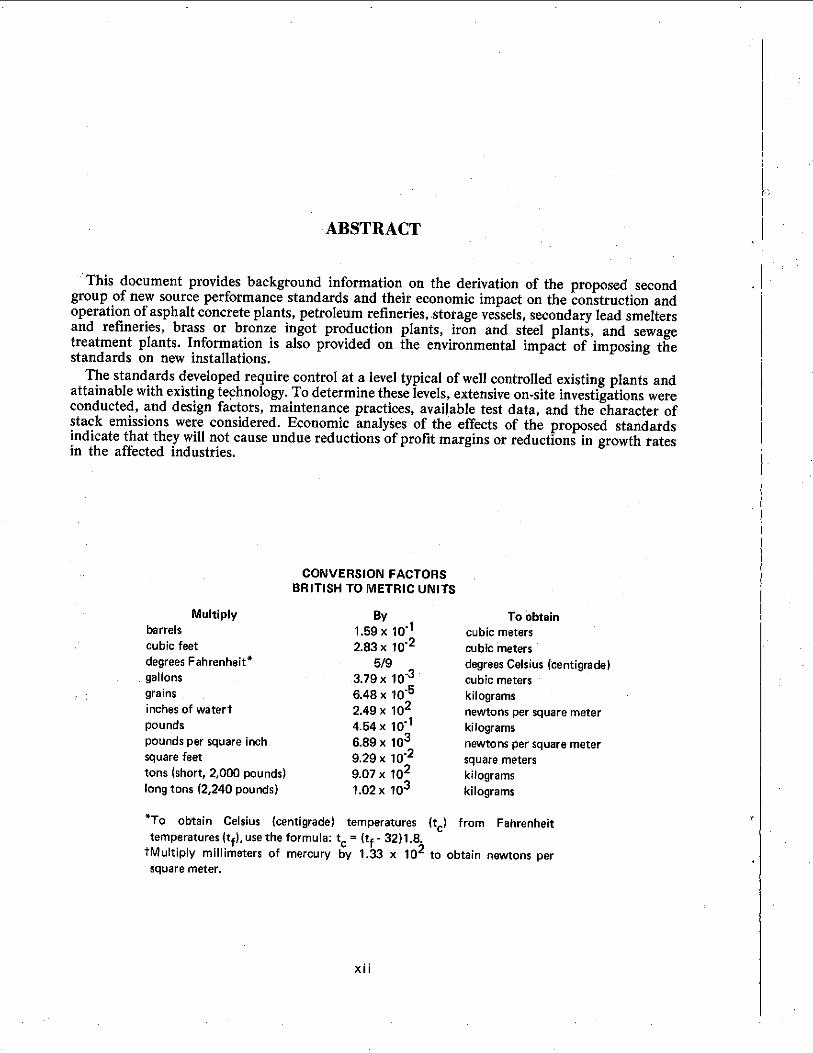
ABSTRACT
This document provides background information on the derivation of the proposed second group of new source performance standards and their economic impact on the construction and operation of asphalt concrete plants, petroleum refineries, .storage vessels, secondary lead smelters and refineries, brass or bronze ingot production plants, iron and steel plants, and sewage treatment plants, Information is also provided on the environmental impact of imposing the standards on new installations.
The standards developed require control at a level typical of well controlled existing plants and attainable with existing te.chnolog),. To determine these levels, extensive on-site investigations were conducted, and design factors, maintenance practices, available test data, and the character of stack emissions were considered. Economic analyses of the effects of the proposed standards indicate that they will not cause undue reductions of profit margins or reductions in growth rates in the affected industries.
CONVERSION FACTORS BRITISH TO METRIC UNITS
Multiply By To Obtain barrels 1.59 x 10 "1 cubic meters cubic feet 2.83 x 10 -2 cubic meters degrees Fahrenheit* 5/9 degrees Celsius (centigrade) gallons 3.79x 10 -3 cubic meters grains 6;48 x 10 .5 kilograms inches of
Watert 2.49 x
102 newtons per square meter
pounds 4.54 x 10 "1 kilograms pounds per square inch 6.89 x
103 newtons per square meter
square feet 9.29 x 10 -2 square meters tons (short, 2,000 pounds) 9.07 x
102 kilograms long tons (2,240 pounds) 1.02 x
103 kilograms
*To obtain Celsius (centigrade) temperatures (tc) from Fahrenheit temperatures (tf), use the formula: t
c (tf 32)1.8.
•'Multiply millimeters of mercury by 1.33 x 10²
to obtain newtons per square meter.
xii

BACKGROUND INFORMATION .
FOR PROPOSED
NEW SOURCE PERFORMANCE STANDARDS
INTRODUCTION
This document provides background information on the derivation of the proposed second group of new source performance standards and their economic impact on the construction and operation of asphalt concrete plants, petroleum refineries, storage vessels, secondary lead smelters, and bronze ingot production plants, iron and steel plants, and sewage treatment plants. The regulation for the proposed standards, published in the Federal Register Under Title 40 CFR Part 60, is being distributed concurrently with this document. The information presented herein was prepared for the purpose of facilitating review and comment by owners and operators of affected facilities, environmentalists, and other concerned parties prior to promulgation of the standards.
Information concerning the source categories is provided in Technical Reports 6 through 13. In the case of petroleum refineries, there are reports covering two affected facilities--catalyst regenerators and gaseous fuel burning. Technical Reports 1 through 5were published in 1971 with the first group of new source performance standards.
The performance standards were developed after consultation with plant owners and operators, appropriate advisory committees, trade associations, eqmpment designers, independent experts. and Federal departments and agencies. Review meetings were held with the Federal Agency Liaison Committee and the National Air Pollution Control Techniques Advisory Committee. The proposed standards reflect consideration of comments provided by these committees and by other individuals having knowledge regarding the control of pollution from the subject source categories.
The National Air Pollution Control Techniques Advisory Committee consists of 16 persons who are knowledgeable concerning air quality, air pollution sources, and technology for the control of air pollutants. The membership includes State and local control officials, industrial representatives, and engineering consultants. Members are appointed by the Administrator of the Environmental Protection Agency (EPA) pursuant to Section l17(d). (e). and (f) of the Clean Air Act Amendments of 1970, Public Law 91-604. In addition, persons with expertise in the respective source categories participated in the meeting of the Advisory Committee.
The Federal Agency Liaison Committee includes persons with knowledge of air pollution control practices as they affect Federal facilities and the nation's commerce. The committee is composed of representatives of 19 Federal agencies.
The promulgation of standards of performance for new stationary sources under Section 111 of the Clean Air Act does not prevent State or local jurisdiction• from adopting more stringent emission limitations for these same sources. In heavily polluted areas, more restrictive standards, including a complete ban on construction, may be necessary in order to achieve National Ambient Air Quality Standards. Section 116 of the Act provides specific authorization to States and other political subdivisions to enact such standards and limitations.
SPECIAL NOTE
Subsequent to the development of this document, the Environmental Proteciion Agency adopted a'policy of expressing standards in the metric rather than the English system. Consistent with the proposed standards, emission limits •re listed herein in metric units, but English equivalents are also provided. Due to the complexities involved in recalcu!ating test resultsi d•/ta'in this document have not been converted from the English to the metric system. A table of conversion

factors is presented in the preliminary pages, however. To allow comparison with test data, the standards are frequently referenced in terms of English units.
GENERAL CONSIDERATIONS
The proposed second group of new source standards includes emission limits for particulates (including visible emissions), as well as sulfur dioxide, carbon monoxide, and hydrocarbons. In addition, revisions have been incorporated into the General Provisions that were published with the first group of standards under Title 40 CFR 60. Methods for determining compliance with particulate and sulfur dioxide limits are published in the Appendix of 40 CFR 60. Methods for measuring carbon monoxid e and hydrogen sulfide are.published with the proposed standards. Development Procedures
The Procedures used tO develop the standards were similar for all source categories. In every case, a screening process was followed to appraise existing technology and to determine the locations of well controlled sources. Extensive on-site investigations were conducted to identify sources that appeai'ed to be the best controlled and amenable to stack testing. Design features, maintenance practices, available test data, and the character of stack emissions were conside•'ed. Where particulate emissions were contemplated, appreciable weight wa s given to the opacity of stack gases. In most instances, the facilities chosen for testing were those that exhibited little or not visible emissions and had a sufficient length of straight ductwork downstream of the collector to obtain representative source samples.
Observations of stack gases during the screening process and during stack tests furnished the basis for the proposed visible emission limits. For most of the six particulate standards, several sites that met the proposed visible emission limits were identified. Mass emissions from many Of them could not be measured because the Stack configurations precluded accurate testing. Those sources that met the proposed mass particulate limits also met the visible emission limits. Thus, visible emissions in excess of th e proposed limits indicate that the mass particulate standards are also being exceeded.
Condensed water vapor is not: considered a visible emission for purposes for this regulation. Wl•.er.e the presence of uncombined water is the only reason for failure to meet the standards, such em•sslons shall not be considered a violation.
This volume contains sufficient data from the tests conducted to support the discussions. Detailedtest data are given in Volume 2 of this document, which was prepared in a limited edition but is available to those who need the data. The second volume can be obtained from the Emission Standards and Engineering Division, Environmental Protection Agency, Research Triangle Park, North Carolina 27711, Attention: Mr. Don R. Goodwin.
Limits in Terms of Concentration
Most of the emission limits included in this group of standards are being proposed in terms of pollutant concentration. Particulate limits, for example, are being proposed in terms of milligrams per normal cubic meter of undiluted exhaust gases. This is a deviation from the first group of performance standards, wherein most of the limits were promulgated in terms of mass per unit of production, feedstock, or fuel input. The change to concentration units is a result of discussions with control officials, representatives of affected industries, and others knowledgeable in the field. Its purpose is to facilitate compliance testing and enforcement of new source performance standards. Establishing standards in this form obviates the need to determine such things as productio n rates and burning rates, which often cannot be ascertained with the same degree of accuracy as can the pollutant concentration. In some future standards, a pollutant concentration limit may not be feasible, and other types of standards may be used.
In proposing concentration limits, it is implicit that compliance cannot be achieved by merely diluting exhaust gases with ambient air. Emission limits are to be achieved through the application
2

of process changes or remedial equipment that will limit the discharge of pollutants to the atmosphere. The concentration limits proposed in these regulations will apply to exhaust gas streams as they are discharged from control equipment. If there is any dilution prior to measurement, suitable corrections •ill be made in determining compliance. Provisions have been incorporated in each standard that preclude dilution as a means of achieving the standard.
The provisions regarding circumvention by dilution, for example, 60.94(c), apply equally to mass limits and visible emission limits. Where dilution gases are added downstream of air pollution control devices, owners or operators will be required to demonstrate that the visible emissions would not constitute a violation of the standard if they were not diluted.
Compliance Testing and Instrumentation
As with the first group of new source performance standards, particulate limits in the proposed regulation are based on material collected in the probe and filter of the EPA sampling train (see "Test Methods" section). Impingers, as described in the original proposal for Group 1 source categories (40 CFR 60), may be utilized; however, the material collected in the impingers is not considered particnlate for purposes of the proposed regulations.
Emissions of hydrocarbons from storage vessels for petroleum liquids will not be measured directly. This standard is established in terms of emission limitations that can be accomplished with readily available and standardized control equipment, i.e., floating-roof tanks, vapor recovery systems, and conservation vents. The standard specifies that these devices or any other device equally effective for hydrocarbon control shall be utilized. The actual emissions from any specific storage vessel can be determined by utilizing suitable empirical relationships developed by the industry.
While the limits for refinery fuel gases are designed to prevent the release of sulfur dioxide, it is expected that, in essentially all cases, compliance will be determined by analyzing the hydrogen sulfide content of the fuel gases before they are burned.
The carbon monoxide measurement technique is based on an instrumental method of analyses of exhaust gases. Instruments specified in the proposed regulations or instruments of essentially the same type may be utilized to satisfy this requirement. Owners and operators of petroleum catalyst regenerators may monitor either carbon monoxide or two other significant parameters, oxygen content and temperature. If they can show by monitoring that there is sufficient oxygen in the gas stream to provide the necessary degree of carbon monoxide combustion at the firebox temperature, carbon monoxide monitoring will not be required.
In addition to instruments for the measurement of carbon monoxide and the sulfur' content of fuel, instruments will be required, where feasible, to measure emissions directly or indirectly.
Instruments for recording visible emissions will be required for two source categories for which particulate limits are proposed.
Use of Alternative Test Methods
A provisioia has been added whereby the Administrator may accept performance tests conducted with alternative methods that are not entirely equivalent to the reference method but are suf- ficiently reliable that they may be used for certain applications. For example, an alternative test method that does not require traversing during sampling for particulate matter may be approved if such method includes a suitable correction factor designed to account for the error that may result from failing to traverse, or if it can be demonstrated in a specific case that failure to traverse does not affect the accuracy of the test. Similarly, use of an in-stack filter for particulate sampling may be approvable as an alternative method if the method otherwise employs provisions designed to result in precision similar to the compliance method, and a suitable correction factor is included to account for variation between results expected due to filter location. In cases where determination of compliance using an alternative method is disputed, use of the reference method or its equivalent shall be required by the Administrator.
3
Waiver of Compliance Test
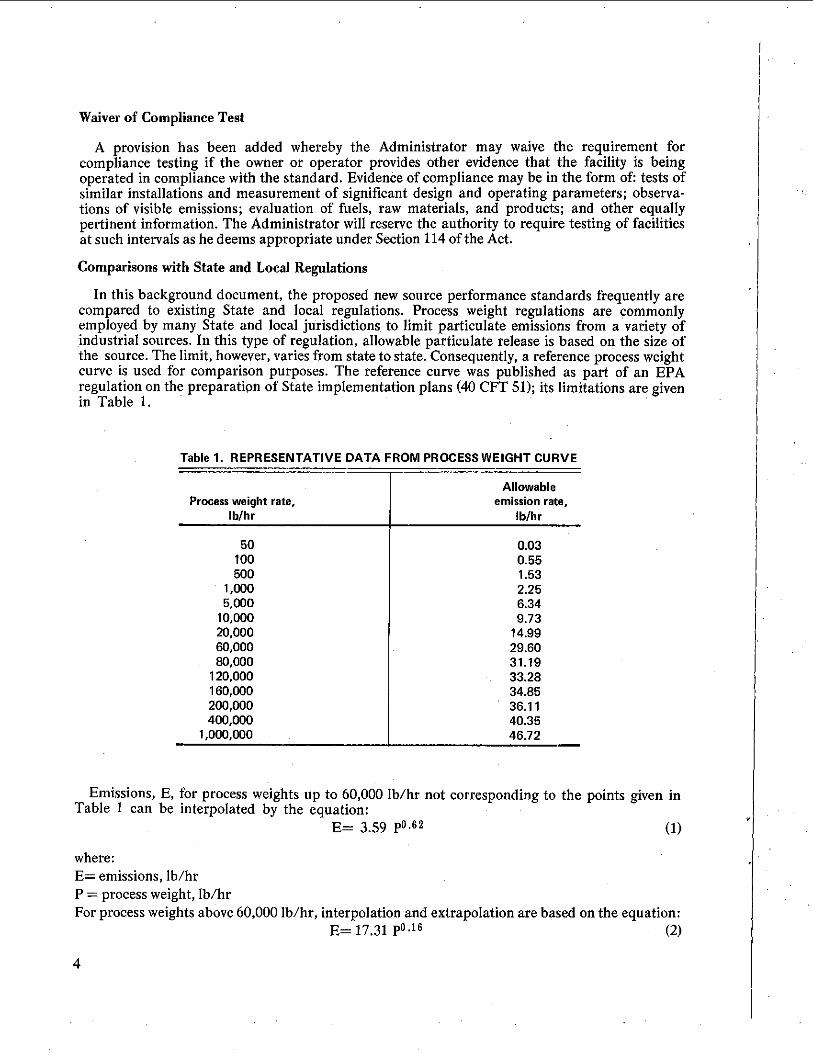
A provision has been added whereby the Administrator may waive the requirement for compliance testing if the owner or operator provides other evidence that the facility is being operated in compliance with the standard. Evidence of compliance may be in the form of: tests of similar installations and measurement of significant design and operating parameters; observa- tions of visible emissions; evaluation of fuels, raw materials, and products; and other equally pertinent information. The Administrator will reserve the authority to require testing of facilities at such intervals as he deems appropriate under Section 114 of the Act.
Comparisons with State and Local Regulations In this background document, the proposed new so•rce performance standards frequently are
compared to existing State and local regulations. Process weight regulations are commonly employed by many State and local jurisdictions to limit particulate emissions from a variety of industrial sources. In this type of regulation, allowable particulate release is based on the size of the source. The limit, however, varies from state to state. Consequently, a reference process weight curve is used for comparison purposes. The reference curve was published as part of an EPA regulation on the preparation of State implementation plans (40 CFT 51); its limitations ar e given in Table 1.
Table 1. REPRESENTATIVE DATA FROM PROCESS WEIGHT CURVE
Allowable Process weight rate, emission rate,
Ib/hr Ib/hr
50 100 500
1,000 5,000
I0,000 20,000 60,000 80,000
120,000 160,000 200,000 400,000
1,000,000
0.03 0.55 1.53 2.25 6.34 9.73
14.99 29.60 31.19 33.28 34.85 36.11 40.35 46.72
Emissions• E, for process weights up to 60,000 lb/hr not corresponding to the points given in Table 1 can be interpolated by the equation:
E= 3.59 p0.62 (1)
where: E= emissions, lb/hr P process weight, lb/hr For process weights above 60,000 lb/hr, interpolation and extrapolation are based on the equation:
E= 17.31 p0.16 (2)

Environmental Impact All of the proposed standards have the effect of reducing emlssions of air pollutants to the
atmosphere. They may also cause an increase in the generation of solid wastes and in some instances produce liquid wastes.
Six of the standards require control of particulate matter that thereby becomes a potential solid waste. Nonetheless, it is significant that all six source categories are required by existing State and local regulations to control particulates to some degree. The effect of the proposed standards is to require the installation of higher efficiency dust collectors and thus to increase the quantity of collected solids. In no case is a new type of solid waste created. Some of these collected particu- lates, e.g., those from secondary lead furnaces and many asphalt concrete plants, can be recycled back to the system. In others, such as steel furnaces and sludge incinerators, the material mlrst be disposed of, usually in landfills. None of the materials collected from these facilities are of such nature that they cannot be successfully handled by landfill.
It is expected that most of the devices installed to meet the proposed standards will collect the material in the dry state. Dry collection is advantageous because (1) it greatly 'reduces the pos- sibility of water pollution and (2)the collected material is more likely to be acceptable for recycle to the process. Dry dust collectors are feasible with all six source categories, but scrubbers are more likely to be utilized for basic oxygen process steel furnaces (BOPF) and sewage sludge incinerators. In addition, some owners and operators of asphalt concrete plants and secondary lead smelters may choose to utilize wet scrubbing systems rather than dry dust collectors. Since wet scrubbers have been used extensively in the steel industry and for asphalt concrete plants and sewage sludge incinerators, techniques ate available for recycle of water and for acceptable disposal of solid wastes. The proposed standards will not require the use of any solid waste or water treatment practices that are not already utilized to a wide degree. It may increase the complexity and cost of liquid and solids handling because of the greater quantities of particulate collected.
The proposed standards also require the collection of hydrocarbons and sulfur compounds. There are no potential adverse effects of the hydrocarbon storage regulation since all hydrocarbons are retained as product or recycled to petroleum refineries.
Sulfur compounds are recovered as.salable by-products, usually elemental sulfur or sulfuric acid. The most common process generates a liquid waste for which acceptable disposal methods are available. The process has been in use for many years in the petroleum and natural gas industry. Economic Impact
For each of the designated source categories, information is provided on the expected economic impact of the standard on the industry. Capital and annualized costs (including operating costs) have been e•timated. In addition, the incremental costs of air pollution control on the typical product have been determined. A summary of pertinent cost items for typical affected
source categories is provided in Table 2.
Provisions for Startup, Shutdown, and Malfunction
Independent of this proposal, the Administrator published on May 2, 1973, a proposed amend- ment to 40 CFR 60, Subpart A--General Provisions, whereby consideration will be given to condi- tions that may cause emissions to exceed new source standards during startup, shutdown, and malfunction. T.he new provisions are tentative pending a review of the comments and promulgation of the resulting provision.
NOMENCLATURE
The following lists of abbreviations, definitions, test methods, and control equipment should help clarify the terms used in the background document text and graphs.

Table 2. SUMMARY OF COST ESTIMATES
Proposed standard Estimated
Asphalt
Petroleum
refineries
H•drocarbon storage
Secondary lead
Brass and
bronze
Iron and
steel
Affected Performance
facility standard
Entire 70 mg/_Nm 3
icarbon
Units 230 mg/l•m 3
Furnace 50 mg/Nm 3
1501ons/hr
300 [ons/br
20,000 bbl/day
65,000 bbl/day
80.000 bbl
50-ton/day reverber atory lurnace
50.ton/day blast furnac•
50 ton/dav
140 tons/melt
880 tons/melt
10 ton/day
Basis for analysis
Control Investment
equil)ment cos•, $
Fabric bller 63.000
scrubber 56.000
Fabric lilter 92,b00
scrubber 95,000
Precipitator 700,000
Precipitator 1,150,000
Floating-roof 27,000 tank (incremeFlal)
fixed roof)
Fabric filter 88,100
scrubber 125,200
Fabric filter 156,600
scrubber plus 123.200
Fabric filter 110.000
Open-hood 5,720,000 scrubbing Precipitator 5.580,000 Closed-hood 6,760.000 scrubbing Open-hood 7,400,000 scrubbing Precipitator 8,000,000 Closed-hood 8,400.000 scrubbing Venturi 60,000 scrubber (low energy)
18.000
21,000
26.000
36.000
225,000
3.800
50,600
35,600
50,600
79,700
20,070
1,946,000
2,139,000
2,139,000
2,025,000 2,791,000
11,700
$0.16/ton of
S0.12/ton of
$0.16/ton of
$0.022/bbl of
Iresh feed
$0.010/bblof
Gasoline-
($tl,100/yr) Jet naptha- S1,000/yr Crude oil-
($5,200/yr)
product $2.85/ton of
$4.05/ton of
$1,17 $1.67/
ton of steel
$0.89 to $1.22/
ton of sleel
$0.12/person•yr
aEstimatsd product prices: (1) asphalt concrete-$6/ton, (2) brass and bronze--S1100 to $1200/ton, (3) iron and steel-$220/ton (price of
finished steel products for typical mill product mix). (4) secondary lead-$320/ton. bCarbon monoxide boilers have attractive economic payout, and, result, most units would be built with such boilers
without the proposed standards. clt is commonly accepted and necessary practice to treat the various refinery gas and liquid streams for product quality control
Conseduentlv, there is 2 to 5 percent increase in investment cost but discernable difference in operating costs between current
industry practice and the requirements for standards. dFIoating.roof tanks required for storage of liquids with vapor pressures between 1.52 and 11.1 psia. S•orage of liquids wltb vapor
pressures above 11.1 psia requires of recovery equivalent. eFigures shown are;net costs and include credit for recovered materials. Figures in parenthesis indicate savings.
Abbreviations
acf acfm
dscf dscfm
F ft 2 gal
g/_Nm •
gr hr lh
min OU
ppm psia scf
scfm
actual cubic feet; volume of gas at stack conditions actual cubic feet per minute barrels dry standard cubic feet dry standard cubic feet per minute degrees Fahrenheit square feet gallons grams per normal cubic meter grains hours pounds minutes odor units parts per million by volume pounds per square inch absolute standard cubic feet standard cubic feet per miJmte
.Definitions
Front half
Back half
Total EPA train Average
Material captured in probe and filter of EPA train (see test method 2). Also called "dry filterable particulate." Material captured in the impinger portion of the EPA train. Also called "condensables." Front half plus back half catch (see test method 1). Arithmetic average of the individual runs.
Code Methods
The following code methods are referred to by number in the technical reports: 1. EPA train with impingers--Isokinetic sampling and traversing of the stack, with analysis of
the probe washings, filter catch, impinger washings, organic extraction, and impinger water. 2. EPA method 5 (as described in the December 23, 1971, FederalRegister)--lsokinetic sampling
and traversing of the stack; analysis includes only probe washings and filter catch (also called "front-half catch," "solids," or "dry filterable particulates").
3. Same as code method 1 except that sampling is conducted at a point of average velocity. 4. Same as code method 2 except that sampling is conducted at a point of average velocity. 5. Isokinetic sampling at point of average velocity with impingers (two containing distilled water,
one dry) followed by Whatman* paper thimble. Gas-meter upstream of pump. Result includes material collected on the filter and in the impingers (soluble and insoluble) except sulfuric acid bihydrate.
6. Alundum thimble packed with glass wool followed by a Gelman type A filter. Both thimble and filter inside stack during test.
7. San Francisco Bay Area Air Pollution Control District Regulation 2 method--Particulate collected by glass tubes filled with wool located in stack. Gas velocity predetermined by separate pitot tube and assumed constant throughout test. Samples collected at two to three of the points of measured velocity during each test.
*Mention of commercial products or company names does not constitute endorsement by the Environmental Protection Agency.
7
8. EPA equipment, including impingers, is used, but probe and impinger acetone washings are combined. Results include washings and filter catch and are therefore higher than those of code method 2 (filter catch and probe washings only).
9. Adjusted EPA train with impinger results--Data obtained using code method 1 was adjusted by multiplying it by the average value of the ratio of code method 2 to code method 1 for two secondary lead blast furnaces.
10. Alundum thimble in stack, packed with glass wool and followed by impingers. Impinger liquid is filtered and filtrate is included as particulate. Probe is washed and material in washings is included as particulate.
11. Nondirect infrared test for carbon monoxide--Will appear in the Federal Register as Method 10---Determination of Carbon Monoxide Emissions from Stationary Sources.
12. Cadmium salt test for hydrogen sulfide•Will appear in the Federal Register as Method ll-- Determination of Hydrogen Sulfide Emissions from Stationary Sources.
13. Samples evacuated by air ejector through an in-stack alundum thimble and four impingers (two containing distilled water). Result consists of material from filter and soluble and insoluble material collected in impingers.
14. Samples using impingers followed by a Gelman type A glass fiber filter. Result includes filter and impinger catches.
Control Equipment
Listed below are symbols used in the background document for various types of control devices. If more than one are used, the order of the letters indicates the arrangement of the control devices, starting with the one farthest upstream.
s scrubber v venturi scrubber b baghouse e electrostatic precipitator a afterburner h open hood g closed hood c cyclone m carbon monoxide boiler p-- plate scrubber
TECHNICAL REPORT NO. 6-
ASPHALT CONCRETE PLANTS
SUMMARY OF PROPOSED STANDARDS
Standards of performance are being proposed for new hot mix asphalt concrete production plants. The proposed standards would limit emissions of particulates (including visible emissions) from the following sources: dryer; hot aggregate elevators; screening (classifying) equipment; hot aggregate storage equipment; hot aggregate weighing equipment; asphalt concrete mixing equipment; mineral filler loading, transfer, and storage equipment; and loading, transfer, and storage equipment that handles the dust collected by the emission control system.
The standards apply at the point(s) where undiluted gases are discharged from the air pollution control system or from the affected facility if no air pollution control system is utilized. If air or other dilution gases are added prior to the measurement point(s), the owner or operator must provide a means of accurately determining the amount of dilution and correcting the pollutant concentration to the undiluted basis.
The proposed standards would limit particulate emissions to the atmosphere as follows: 1. No more than 70 mg/_Nm 3, (undiluted) or 0.03 gr/dscf. 2. No more than 10 percent opacity.
EMISSIONS FROM ASPHALT CONCRETE PLANTS
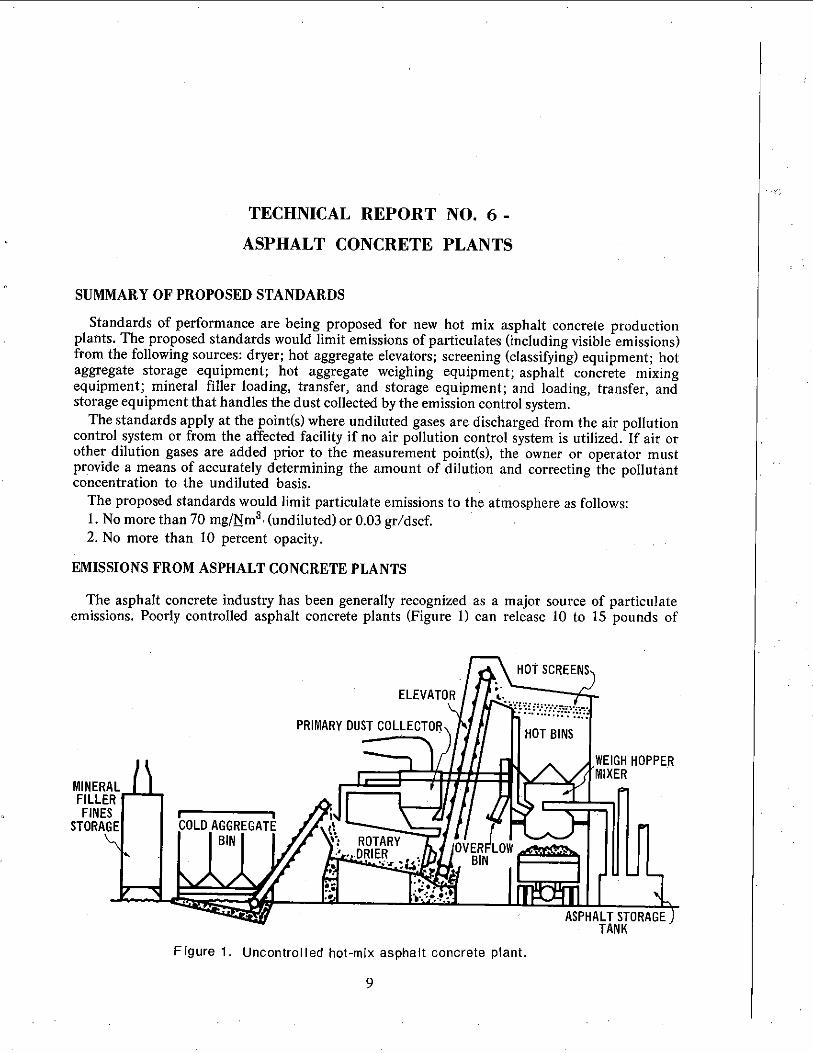
The asphalt concrete industry has been generally recognized as a major source of particulate emissions. Poorly controlled asphalt concrete plants (Figure 1) can release 10 to 15 pounds of
MINERAL FILLER FINES
STORAGE BIN
X ROTARY
) •/
ASPHALT STORAGE ) TANK
Figure 1. Uncontrolled hot-mix asphalt concrete plant.
9

particulates to the atmosphere per ton of asphalt concrete product} A 200-ton/hr installation, equipped with only dry centrifugal dust collectors, would emit 2000 to 3000 pounds of particulate each hour of operation. Because of the large number of plants (approximately 4800), their collective emissions constitute a significant portion of the total particulate from all industries. EPA has conservatively estimated that total particulate emissions from this industry were 243,000 tons in 1967 and would increase to 403,000 tons in 1977 if the 1967 control level of 95 percent were maintained. 2 According to A.E. Vandergrift, et al., the asphalt industry is the eleventh largest source of particulate emissions in the nation. 3
In order to reduce emissions by about 99.7 percent, as required by the proposed standard, fabric filters or medium energy venturi scrubbers, normally preceded by a cyclone or multiple cyclone, are used to collect dust from the dryer (Figure 2). Fugitive dust from the hot aggregate conveyor,
EMISSIONS
'/ti II HOTBINS WEIGH IF--li IIINERAL • I /JL •"-• J•PPER
COLLECTEDI / •FILLER FINES• II li FINES •
[ • COLD AGGREGATE /[•i• • A BIN • ROTARY
B •HOUSE DRIER SEAEED
STACK• II J •[ • • BIN v u I:g FA, • ASPHALT STORAGe)
TANK
Figure 2. Controlled hot-mix asphalt concrete plant.
screening, mixing, and other process equipment is normally controlled by enclosing these sources and ducting the dust-laden gases to the dust collection system. The collected dust is normally recycled to the plant, thereby increasing product yield.
Most State and local regulations limit particulate emissions from asphalt concrete plants, either on the basis of stack gas concentration or through process weight regulations. The most stringent State regulation, 0.03 gr/dscf (based O n samples collected with both the filter and impingers), would permit the typical 200-ton/hr plant to emit 5.1 lb/hr of particulate. The reference process weight regulation (Table 1) would restrict emissions from this typical asphalt plant to 40 lb/hr, which is approximately 0.23 gr/dscf. RATIONALE FOR PROPOSED STANDARDS
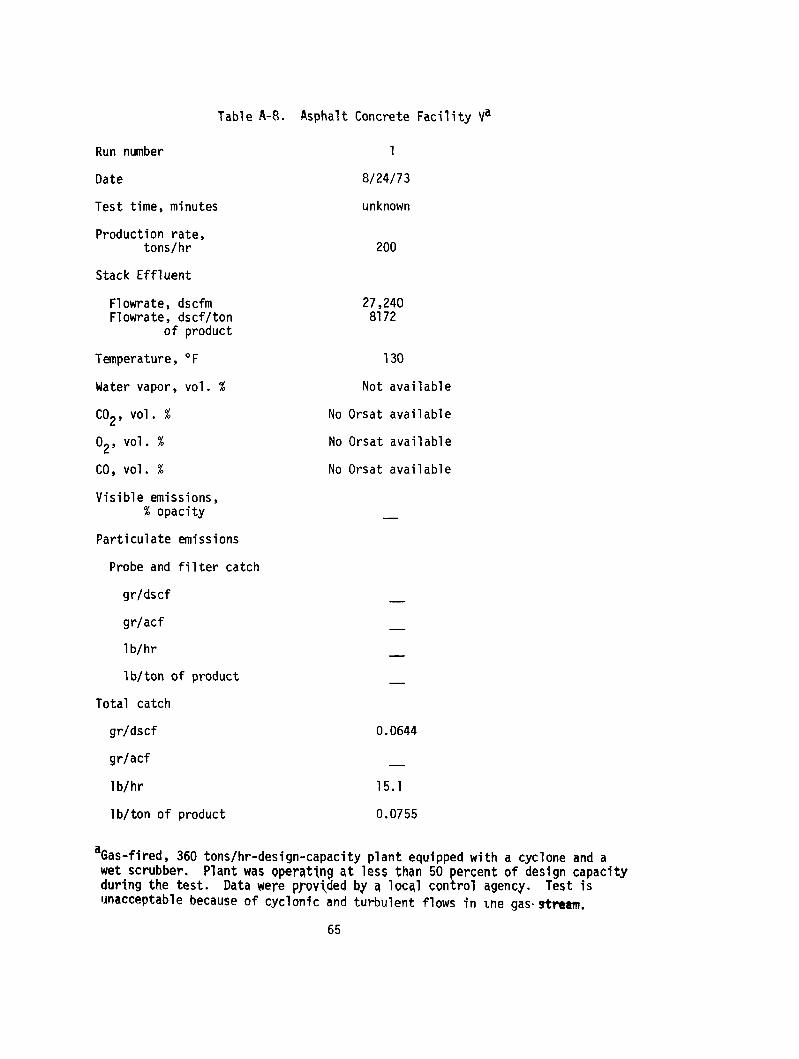
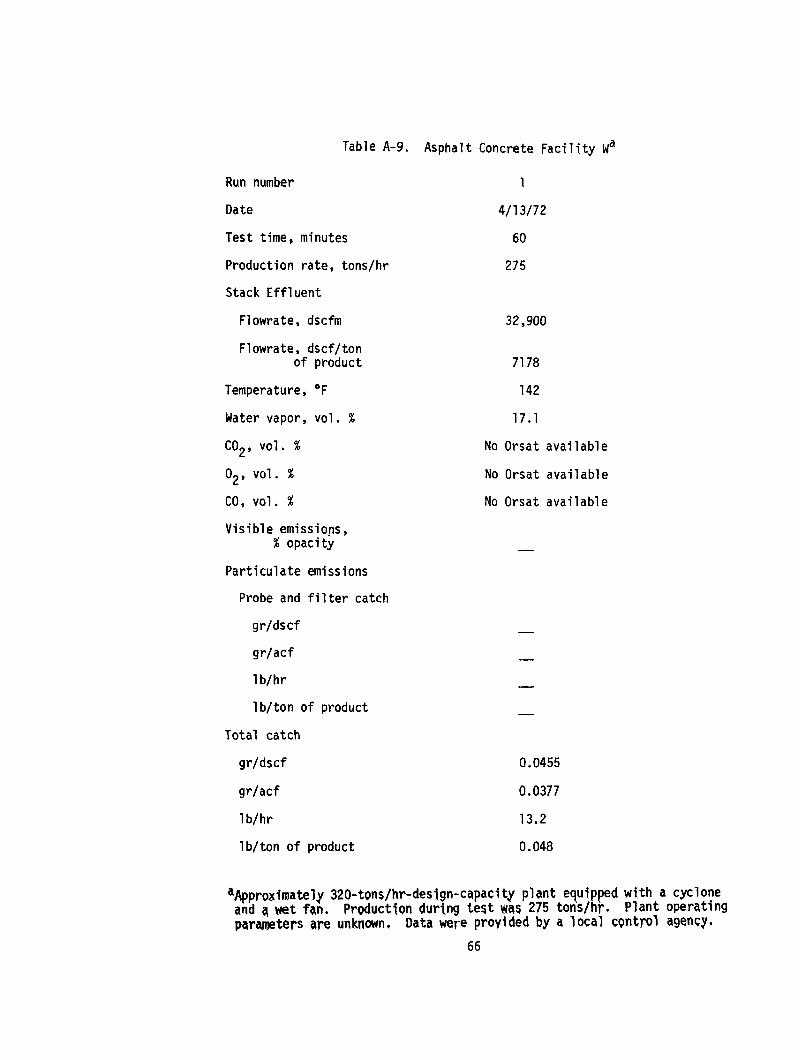
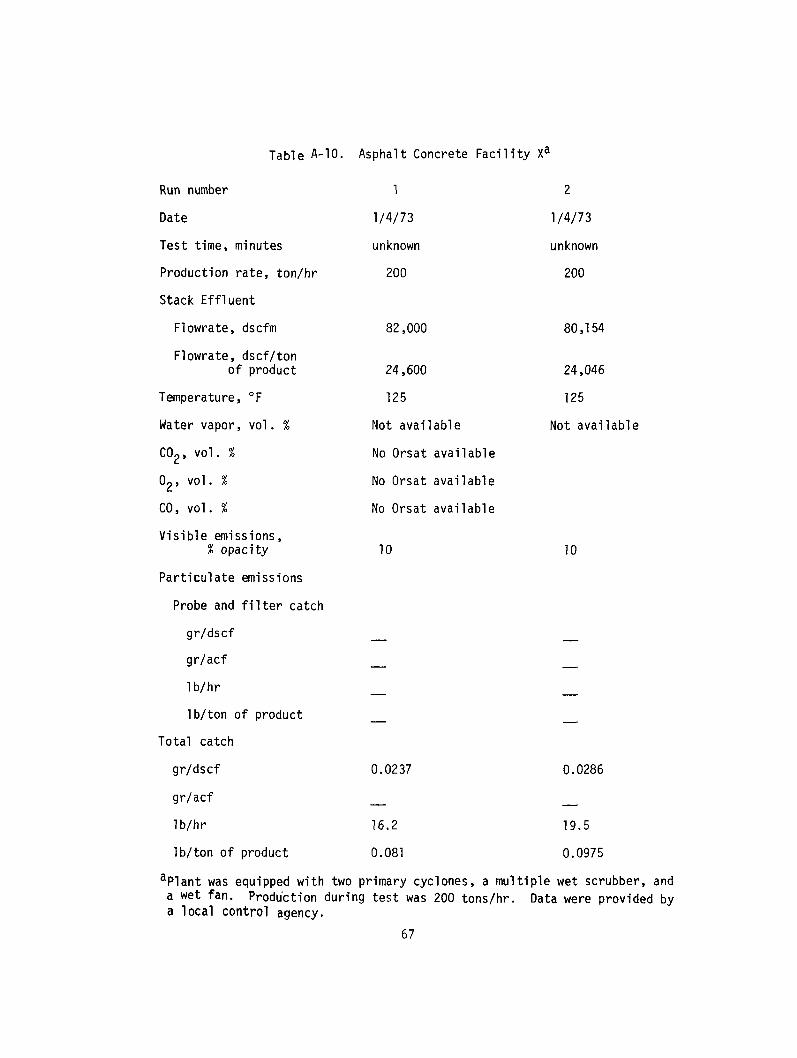
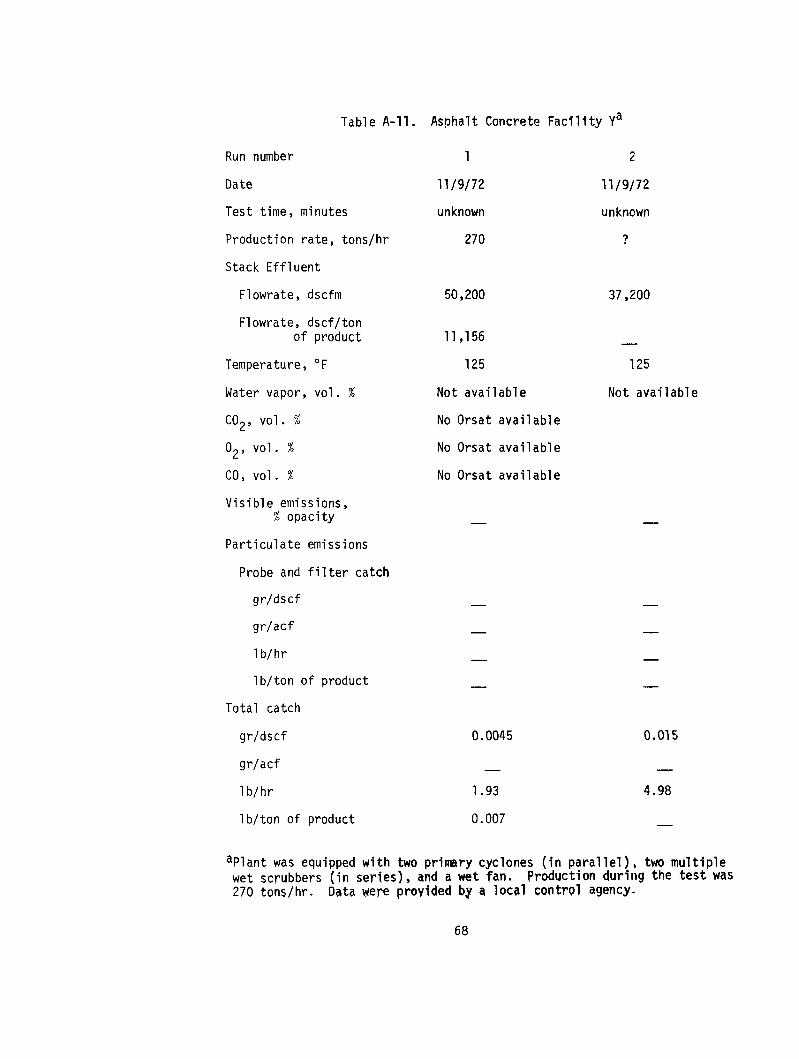
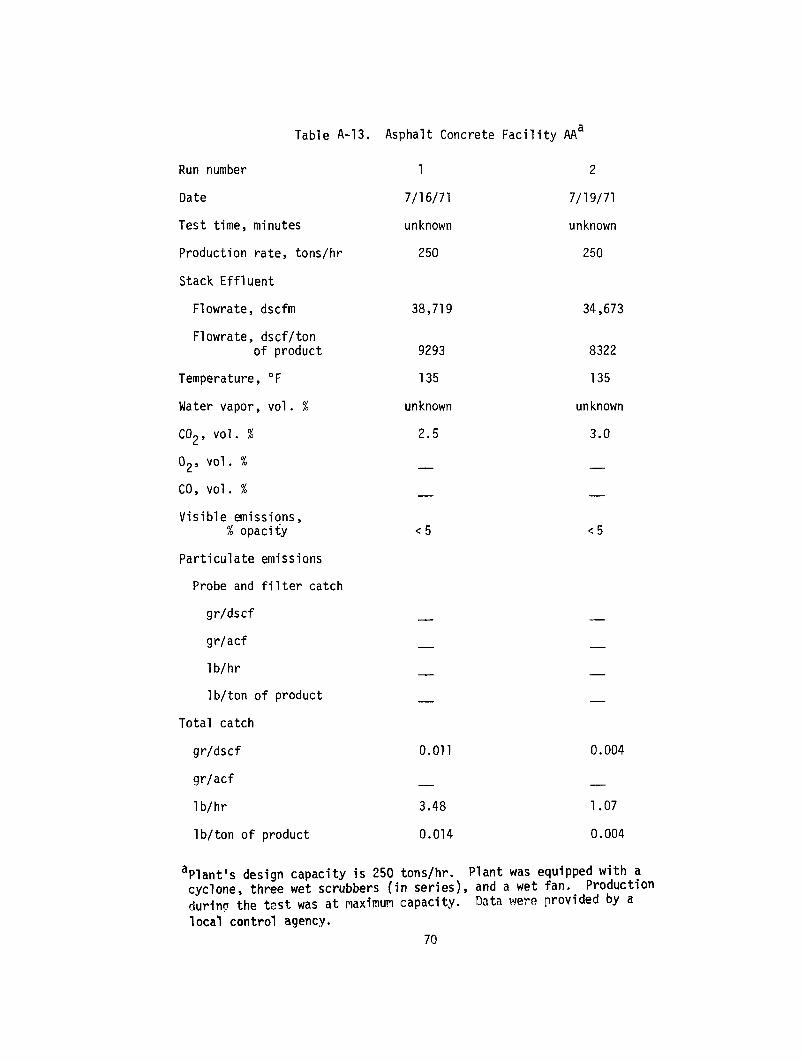
The proposed standard of 70 mg/_Nm 3 (0.031 dscf) is based on 11 tests of plant emissions performed by EPA on four asphalt concrete plants. Three of these plants were controlled with fabric filters, which ranged from 1 to 4 years in age, and one was controlled by a venturi scrubber. Other data that support the level of the standard were obtained from tests conducted by State and local agencies and the National Asphalt Pavement Association. The size of plants tested ranged from 80 to 350 tons/hr. Preliminary investigations by EPA revealed the location of several reportedly well controlled plants. Sixty-four were visited, visible emissions were evaluated, and information was obtained on the process and control equipment. Fifty-two were determined
10

unsatisfactory because of inadequate maintenance or design, often evidenced by excessive visible emissions, or because the equipment was not suitable for testing (e.g., a pressure-type baghouse without a stack). Eight of the remaining 12 plants were eliminated because of planned shutdowns for the winter season. Stack tests were conducted at four locations.
During the initial plant surveys, 12 plants with fabric filter control equipment exhibited no
visible stack emissions other than uncombined water vapor. Nine of these plants were not tested for reasons listed above.
Results of the four tests (three samples per test) conducted by EPA (Figure. 3) reveal that emissions from the three plants with fabric filter controls (Plants A, B, and D) averaged 0.007,
CODE METHOD NUMBER 2 EPA METHOD 5 3 EPA METHOD 5 PLUS IMPINGERS:
SAMPLED AT POINT OF AVERAGE VELOCITY
5-IMPINGERS PLUS FILTER
0,0: N MAXIMUM N •AVERAGE•A •
2
• EPA OTHER
= 0.04
_o b BAGHOUSE v VENTURI SCRUBBER
2
0.02
• 2
2
2
PLANT (CONTROL EQUIPMENT)
Figure 3. Particulate emissions from asphalt concrete plants, combined dryer and scavenger exhausts.
..
11.

0.008, and 0.018 gr/dscf. Individual sample results ranged from 0.005 to 0.024 gr/dscfi The plant controlled by a venturi scrubber (Plant H1 ) emitted 0.031 gr/dscf, with individual tests ranging from 0.029:to 0.034 gr/dscf. The same plant while operating at a higher scrubber energy con-
sumption, was retested by a State agency (Plant H2 ), and emissions were 0.011 gr/dscf. Included in Figure 3 are State and local agency test data, which also support the proposed
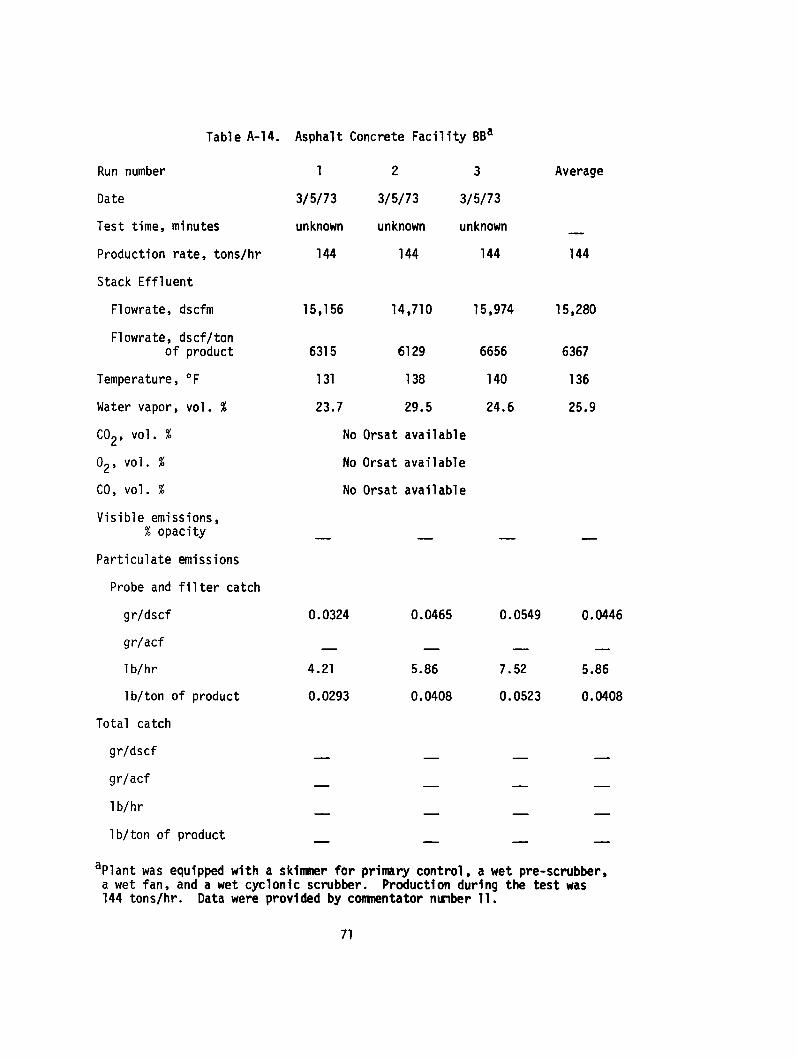
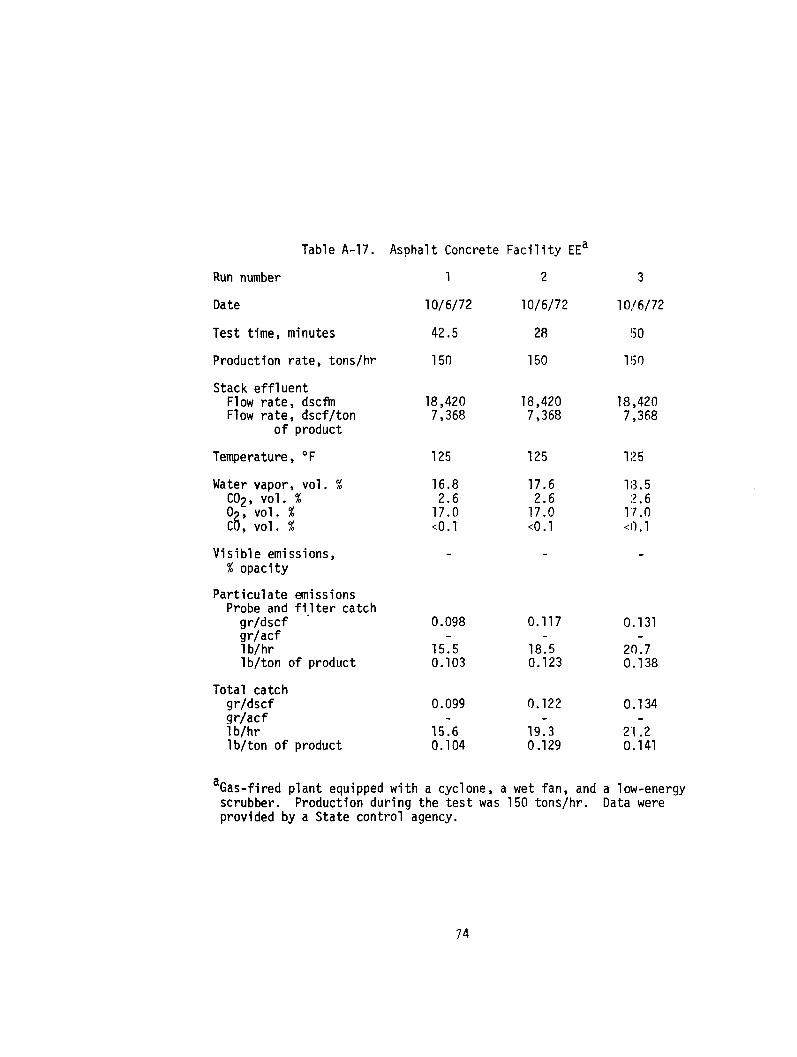
standard. Three of the plants tested were controlled by venturi scrubbers (Plants C, G, and I) and three by fabric filters (Plants E, F, and J). Measured emission rates from the three scrubber installations ranged from 0.012 to 0.025 gr/dscf and averaged 0.017, 0.015, and 0.025 gr/dscf. Emissions from the three baghouse installations averaged 0.006, 0,010, and 0.019 gr/dscf with individual tests ranging from 0.005 to 0.023 gr/dscf. Four of these tests were performed in accordance with EPA test procedures. The others, although performed with the basic EPA train, incorporated minor modifications.
A manufacturer of control equipment measured emissions for a prototype baghouse collector installed at an actual asphalt plant for continuing pilot tests. Results of these 0.012 gr/dscf tests, are well below the standard.
Additional support for the standard has been provided by the National Asphalt Pavement Association from tests of four asphalt concrete plants (Plants A2, K, L, and M). The four plants, which used fabric filter collectors, had average emissions of 0.007, 0.012, 0.043, and 0.108 gr/dscf. The two latter values are not considered representative of good maintenance and operation. In both cases, the dust collectors were inspected by an EPA engineer or by the manufacturer prior to the test. 4 Evidence of poor collector maintenance or operation made the efficiency of the control equipment suspect. 5
Letters on file from three manufacturers of fabric filter collectors and one manufacturer of venturi scrubbers guarantee emission levels to meet a standard of 0.030 gr/dscf if equipment is properly installed, operated, and maintained. At least two other manufacturers (one of fabric filters and one of venturi scrubbers) are guaranteeing an emission level to meet 0.030-gr/dscf State and local codes.
Two of the three fabric filter installations tested by EPA had recently substituted fuel oil for the natural gas normally fired in the dryer burner (Plants A and B). The third was burning natural gas. The replacement of natural gas with fuel oil has been reported to increase particulate mass emission by 20 to 30 percent. 1 Consequently, the emissions measured for the plants using oil for fuel would probably have been smaller if the tests had been conducted before the change in fuels.
All EPA tests were performed in the fall, near the end of the asphalt production season, when the plant is most likely to be in poor repair. The winter months are utilized for maintenance. Thus, the control devices were tested immediately prior to the annual maintenance cycle. Of the three fabric filter collectors tested, two had been in service for one season and one for four seasons without changing the bags. Obviously the control devices were not operating under optimum conditions; i.e., the filters were not new.
A factor that can affect control equipment performance is the particle size of dust released from these systems. Since asphalt concrete plants are installed throughout the nation, a wide variety of aggregate is processed in dryers. In developing the standard, it was necessary to determine the 6haracteristics of these aggregates and to ascertain that available dust collectors could meet the proposed emission limits. Particle size has a significantly greater effect on the performance of high-energy scrubbers than on fabric filters. Particulate emissions from high-energy •crubbers tend to increase with decreasing particle size. 1,5 -9 Where there are large fractions of fines, scrubbers may require greater energy input. On the other hand, the performance of fabric filter collectors is relatively unaffected by the size distribution of particulates, such that emission levels from baghouses are nearly the same over a wide variety of aggregate feedstocks. 8 -1 • T,his is further evidenced by the test report of a laboratory study sponsored by the National Asphalt Pavement Association, in which it is concluded that there is no correlation between particle size and the capture efficiency of a fabric filter. 5
12

There is no evidence that rapid changes in the amount of fine material and transient conditions during startup and shutdown increase emissions from a fabric filter collector and preclude plants from achieving the proposed standard. The National Asphalt Pavement Association-supported laboratory test, 5 which did not duplicate actual operating conditions, was partly devoted to studying the effect on collection efficiency of sudden changes in the airflow through a filter without appreciable cake. It was found that when asphalt concrete aggregate was used as the test particu- late, exit concentration varied only from 0.00054 to 0.00012 gr/dscf, a factor of only 4.5:1. If, in fact, transient conditions during startup and shutdown did affect fabric filter collection efficiency, such an effect would not preclude plants from achieving the proposed standard. Performance tests do not begin until the effluent gas temperature stabilizes after plant startup, and tests are terminated at plant shutdown. Furthermore, Section 60.8 of 40 CFR Part 60, which specifies that performance tests be conducted during periods of representative performance and consist of three repetitions of the applicable test method, precludes the possibility that performance tests would be unduly influenced by routine shutdowns and startups.
The fines content of the process aggregates is reflected in the fraction of-200-mesh material (less than 74 micrometers). Investigations indicate that 3 to 5 percent of -200-mesh material is typical for aggregates utilized in asphalt concrete plants. 8,14 To assure that EPA tests were representative, each plant Operator was requested to schedule production of a product mix containing a large fraction of -200-mesh materials. During the four tests conducted by EPA, the actual fines content of the aggregate ranged from 2 to 7 percent by weight.
The proposed standard of 0.031 gr/dscf is supported by measured emissions from 13 of the 15 source tests presented in Figure 3. Results from 2 of these 15 source tests cannot be considered representative, since evidence of poor collection, maintenance, and operation' made efficiency of the control equipment suspec t. The standard will require installation and proper maintenance of equipment representative of the best technology demonstrated (considering cost) for the industry.
ENVIRONMENTAL IMPACT OF PROPOSED STANDARDS
Potential adverse environmental effects from implementing the proposed standard include disposal of collected materials and handling of scrubber liquor to prevent water pollution. At a typical 200-ton/hr plant from 1 to 1.5 tons/hr of particulate will be collected in either dry or wet dust collectors. When fabric filters are used, the material is collected dry and can be recycled or disposed of in that form. In many plants, the collected material is recycled to produce asphalt concrete. Settling ponds are used in conjunction with scrubbers to separate entrained solids. Water is recycled, usually in a closed loop, and collected solids are removed from the pond as necessary. These settled solids are essentially rock and sand and can be safely landfilled. If high-sulfur fuel is used to fire the aggregate dryer, the scrubbing water will e•entually become acidic and require neutralization to prevent leaching and equipment corrosion. The small quantity of soluble salts that will be produced as a result of the neutralization should not present a problem. Washing techniques are available to minimize soluble salt carryover in collected solids.
ECONOMIC IMPACT OF PROPOSED STANDARDS
The production of asphalt concrete has increased at an annual rate of 10 percent over the past several years. Although growth has been cyclical, it is expected that this average rate will persist through the near future. To meet increase demand, it is anticipated that 200 new plants will be constructed each year. In addition, the industry estimates that some 50 obsolete plants will be re- placed annually. Approximately 250 new plants each year are estimated to be subject to a new
source perforinance standard. For a new asphalt concrete plant rated at 150 tons/hr (average on-stream time of 50 percent,
annual production of 112,500 tons) and also for a plant rated at 300 tons/hr (average on-stream time of 50 percent, annual production of 225,000 tons), three abatement alternatives were analyzed. Table 3 summarizes the results of these analyses. The objective of the analyses was to compare the cost effects of two standards: the reference process weight standard and the proposed
13

Table 3. CONTROL COSTS FOR TYPICAL ASPHALT CONCRETE PLANTS a
Annual
cost per Plant size, Required Control Annual unit of tons/hr Emission control investment, cost, production, (acfm), standard equipment $ $/•/r S/ton 150 Proposed Fabric filter 63,000 18,000 0.16
(26,000) performance standard Venturi scrubber 56,000 21,000 0.19
0.031 •'/dscf Reference Low-energy 44,000 16,000 0.14
process weight scrubber standard 0.30 gr/dscf
300 Proposed Fabric filter 92,000 26,000 0.12 (50,000) performance
standard= Venturi scrubber 95,000 36,000 0.16 0.031 gr/dscf Reference Low-energy 75,000 27,000 0.12
process weight scrubber standard=
0.18 gr/dsc•
aModel plant assumptions: (1) 1500 hours on-strear• annually, (2) production averages 50 percent of capacity, (3) 10-year straight-line depreciation, (4) 50 percent Of retained fines, valued at $9/ton, recycled, and (5) average product I•rice of $6/ton.
new source performance standard. Estimating the cost to achieve the •/W0 standards provides a
measure not only of the total cost but also the incremental cost of control. Either the fabric filter or the venturi scrubber will enable a new plant to comply with the pro- posed standard, and the capital costs for these devices do not appear to be significantly different
for either size plant (300 tons/hr or 150 tons/hr). On an annualized cost basis, it appears that the fabric filter is the lesser-cost device for both plant sizes. The key element is that the fabric filter collects the particulate material in a useful form, while the material collected bythe scrubber must be disposed, of at the operator's expense. An independent study states that in the case of asphalt concrete plants, properly designed, operated, and maintained fabric filter collectors can be a
r 15 p ofitable investment and not an add-on cost. This study concluded that even for a small plant
(100 tons/hr), use of fabric filter collectors is more economical than wet collector systems. 1• Thus, it may be assumed that most new plants would favor a fabric filter control system on an economic basis when selecting a control system to comply with the proposed standard.
The installation of a fabric filter on the smaller plant necessitates an increase in capital investment of 24 percent over the base-plant investment. H6wever, the incremental investment required to equip the plant with a fabric filter rather than a low-energy scrubber (to comply with referen'ce process weight curve) is 6 percent. Similarly for the larger plant the additionaIcapital investment required by the fabric filter over the base-plant investment is 28 percent while the incremental investment over equipping the plant with a low-energy scrubber is 4 percent
The incremental investment required by the proposed standard above that required by State standards is not anticipated to create any serious additional financing problems for new asphalt concretg plants.
Since the control cost for a new plant meeting the proposed standard approximates the cost for an existing plant meeting a less stringent standard, the management of new plant should find that the ,market, price is sufficient to recover much, if not all, of the cost of complying with the pro- posed standard, As a result, there should be little or no reduction in earnings for the new plant.
14

REFERENCES FOR TECHNICAL REPORT NO.6
References Cited
1. Air Pollution Engineering M£nual. Danielson, J.A. (ed.). National Center for Air Pollution Control, Public Health Service, U.S. Department of Health, Education, and Welfare. Cincinnati, Ohio. PHS Publication No. 999-AP-40. 1967.
2. The Economics of Clean Air. Annual Report of the Administrator of the Environmental Protection Agency to the Congress of the United States in compliance with Public Law 91-604, the Clean Air Act, As Amended. p. 4-27. March 1972.
3. Vandergrift, A.E., L.J. Shannon, E.E. Sallee, P.G. Gorman, and W.R. Park. Particulate Air Pollution .in the United States. J. Air Pollut. Contr. Assoc. 21(6):321-328, June 1971.
4. Zenach, L.D. Personal c•mmunication to F. Kloiber, National Asphalt Pavement Association, Riverdale, Md. Micropul Division, Slick Corporation, Summit, N.J. August 4 and 24, 1972.
5. Rylander, H.G. and J.O. Ledbetter. Bench Model Filter Tests. University of Texas. Dallas, Texas. (Sponsored by the National Asphalt Pavement Association) 1972.
6. Jacobson, S. Air Pollution Control for Industry--High Efficiency Venturi Scrubbers for Hot Mix Asphalt Plants. Poly Con Corporation. (Presented at Air Pollution Control Seminar of the Asphaltic Concrete Producers Association. Oakland, Calif. May 27, 1971).
7. Environmental Protection Control at Hot Mix Asphalt Plants. The National Asphalt Pavement Association. Riverdale, Md. Information Series No. 27.
8. Guide for Air Pollution of Hot Mix Asphalt Plants. The National Asphalt Pavement Association. Riverdale, Md. Information Series No. 17.
9. Friedrick, H.E. Air Pollution Control Practices--Hot Mix Asphalt Paving Batch Plants. J. Air Pollut. Contr. Assoc. 19: 928, December 1969.
10. Control Techniques for Particulate Air Pollutants. National Air Pollution Control Administration, Public Health Service, U.S. Department of Health, Education, and Welfare. Washington, D.C. NAPCA Publication No. AP-51. January 1969.
11. Billings, C.E. and J. Wilder. Handbook of Fabric Filter Technology. In: Fabric Filter System Study (Vol. I). GCA Corporation, GCA Technology Division. Bedford, Mass. Contract No. CPA 22-69-38. December 1970.
12. Skinner, C.F. New Use for Baghouse Filter Handling Hot Effluent. Plant Engineering. 23(13):57-59, June 26, 1969.
13. Frey, R. Personal communication to Ken Durkee, U.S. Environmental Protection Agency, Research Triangle Park, N.C. Micropul Division, Slick Corporation, Summit, N.J. January 28, 1972.
14. Study by American Air Filter Company, Louisville, Kentucky. Conducted for the Plant Mix Asphalt Industry of Kentucky, Incorporated, Frankfort, Kentucky. 1967.
15. Ashman, R. Filters for Asphalt and Coating Plants. Quarry Managers J. 54(12):433, December 1970.
Supplemental References
16. The Asphalt Handbook. The Asphalt Institute. College Park, Md. Manual Series No. 4. April 1965.
17. Asphalt Plant Manual (3rd Ed.). The Asphalt Institute. College Park, Md. Manual Series No. 3. March 1967.
18. Atmospheric Emissions from the Manufacture of Portland Cement. National Center for Air Pollution Control, Public Health Service, U.S. Department of Health, Education, and Welfare. Cincinnati, Ohio. PHS Publication No. 999-AP-17. 1967.
19. Bituminous Construction Handbook. Barber-Greene Company. Aurora, Illinois. 1963.
20. Maintenance and Operation Instructions for Ccdarrapids Equipment. Iowa Manufacturing Company. Cedar Rapids, Iowa. IMCO-038 DRIERS. 1967.
15

21. Maintenance and Operation Instructions for Cedarrapids Equipment Asphalt Mixing Plant Model "HC" Series. Iowa Manufacturing Company. Cedar Rapids, Iowa. IMCO-098. 1967.
22. Mix Design Methods for Asphalt Concrete and Other Hot-Mix Types (3rd Ed.). The Asphalt Institute: College Park, Md. Manual Series No. 2. October 1969.
6¸

TECHNICAL REPORT NO. 7-
PETROLEUM REFINERIES, FLUID CATALYTIC CRACKING UNITS
SUMMARY OF PROPOSED STANDARDS
Proposed standards of performance for petroleum refineries will limit emissions of partJcuhtes (including visible emissions) and carbon monoxide from new or modified catalyst regenerators on fluid catalytic cracking units. Standards for Particulates
The proposed standards will limit particulate emissions to the atmosphere as follows: 1. No more than 50 mg/_Nm 3 (undiluted), or 0.022 gr/dscf. 2. No more than 20 percent opacity except for 3 minutes in any 1 hour. The proposed visible emission standard is compatible with the mass emission limit; if
particulate emissions are at or below 50 mg/Nm 3, visible emissions will be below 20 percent opacity.
Standard for Carbon Monoxide
The proposed standard will limit carbon monoxide emissions to no more than 0.0S0 percent by volume, dry basis.
The proposed carbon monoxide standard can be met by incineration. The most common device is an incinerator/waste heat boiler, which is normally fired with refinery fuel gas. In the units tested, only gas was used to supplement the combustion of carbon monoxide. Fuel oil can be used as the auxiliary fuel, but greater concentrations of particulate would be expected. No emissions data are available for well controlled units using fuel oil.
The availability of refinery fuel gas and boiler maintenance considerations minimize the use of fuel oil. For these reasons provisions added to the regulations allow the particulate matter generated by firing fuel oil to be subtracted from the total particulate matter measured by the compliance test method. Owners and operators will be required to meet the visible emission standard regardless of the type of auxiliary fuels burned.
EMISSIONS FROM PETROLEUM REFINERIES
An uncontrolled fluid catalytic cracking unit can release over 300 lb/hr of catalyst dustfl Such installations are equipped only with internal centrifugal dust collectors, which primarily serve to
recycle the catalyst. The proposed standards will require owners and operators of new facilities to reduce the level of particulate emissions about 93 percent below the level of an uncontrolled unit. In addition, an uncontrolled unit can release over 15 pounds of carbon monoxide per barrel of petroleum feedstock processed) For a unit processing 40,000 barrels per day (bbl/day), about 20 tons/hr of carbon monoxide would be released. The proposed standard will require owners and operators of new facilities to reduce carbon monoxide emissions 99.5 percent below those of an uncontrolled .unit.
At many modern petroleum refineries, an electrostatic precipitator is used to control dust from the fluid catalytic cracking unit catalyst regenerator. A waste heat boiler fired with auxiliat;y fuel is used to control carbon monoxide from the units (see Figures 4 and 5):
The reference process weight regulation (Table 1) is less stringent than tile proposed standard for units of a practical size (less than 150,000 bbl/day). The most stringent State or lbCal regulations restrict emissions to 30 lb/hr.
17

FRACTIOHATOR CARBON MONOXIDE BOILER
ELECTROSTATIC PRECIPITATOR
STACK
HEAVY CYCLE OIL
BOTTOMS •
F•ED •)I•AI
H
Figure 4. Petroleum refinery fluid catalytic cracking unit with control system. POWER RECOVERY (OPTIONAL) i•-.•.. I•-" .,•.• II EMISSIONS
II // • II
,f" q-J ,'
II '\ k ELECTROSTATIC • .•_.__
'i I•f PRECIPITATOR STACK
I.
CARBON MONOXIDE BOILER
Figure 5. Fluid catalytic cracking unit regenerator with carbon monoxide boiler and electro- static precipitator. New units will range in size from 10,000 to 100,000 bbl/day of fresh feed, with gas flow rates varying from 20,000 to 350,000 dscfm, respectively. The proposed standard will allow 3 to 60 pounds of particulates per hour. For a
typim .1 unit rated at 50,000 bbl/day of fresh feed at a gas flow rate of 150,000 dscfm, the proposed standard will allow an emissions of 25.7 lb/hr of
DUST
18
particulate matter. The reference process weight regulation will limit emissions to 64 lb/hr based on a catalyst recirculation rate of 50 tons/min.
State or local regulations are comparable with the EPA-proposed standard for carbon monoxide, but are generally framed in different language. Nonfederal standards usually require the combustion of carbon monoxide for 0.3 second at a temperature above 1300°F. The same type of control equipment (carbon monoxide boilers) is required in most cases to meet the proposed standards. For certain types of catalyst regenerators, the boiler may not be required because the carbon monoxide is combusted in the regenerator itself. In either case, the proposed standard requires a 99.5 percent reduction in carbon monoxide emissions over an uncontrolled unit.
RATIONALE FOR PROPOSED STANDARDS
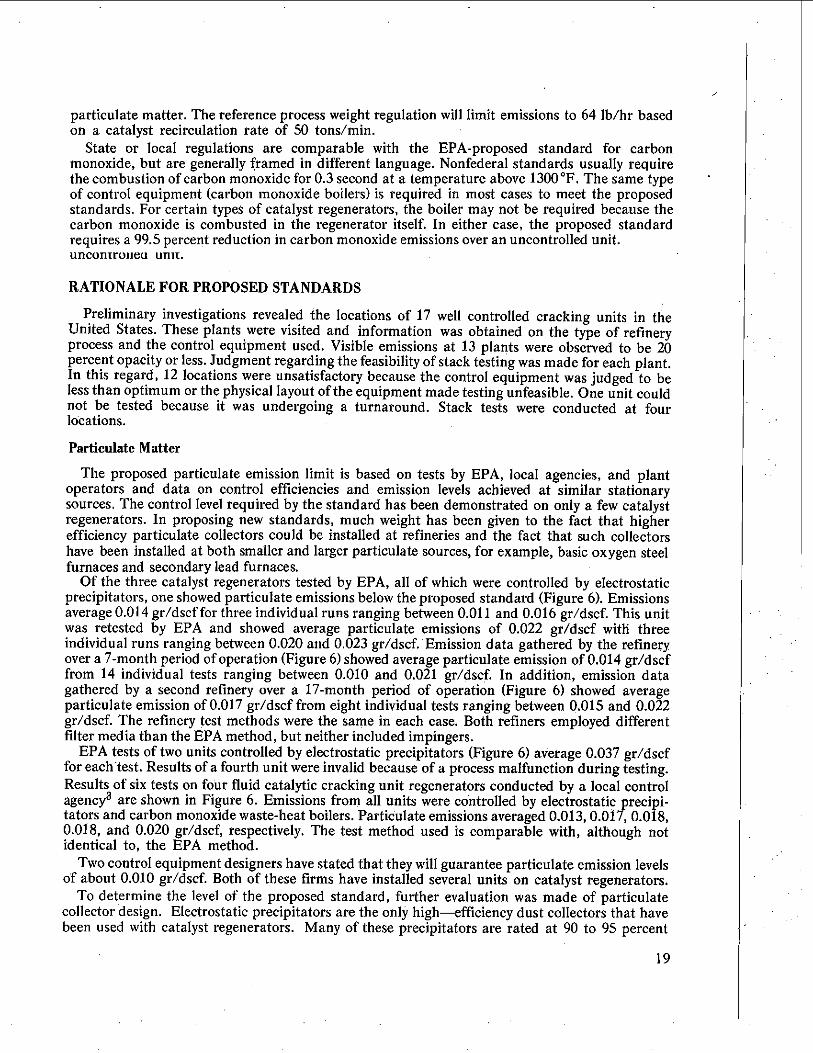
Preliminary investigations revealed the locations of 17 well controlled cracking units in the United States. These plants were visited and information was obtained on the type of refinery process and the control equipment used. Visible emissions at 13 plants were observed to be 20 percent opacity or less. Judgment regarding the feasibility of stack testing was made for each plant. In this regard, 12 locations were unsatisfactory because the control equipment was judged to be less than optimum or the physical layout of the equipment made testing unfeasible. One unit could not be tested because it was undergoing a turnaround. Stack tests were conducted at four locations.
Particulate Matter
The proposed particulate emission limit is based on tests by EPA, local agencies, and plant operators and data on control efficiencies and emission levels achieved at similar stationary sources. The control level required by the standard has been demonstrated on only a few catalyst regenerators. In proposing new standards, much weight has been given to the fact that higher efficiency particulate collectors could be installed at refineries and the fact that such collectors have been installed at both smaller and larger particulate sources, for example, basic oxygen steel furnaces and secondary lead furnaces.
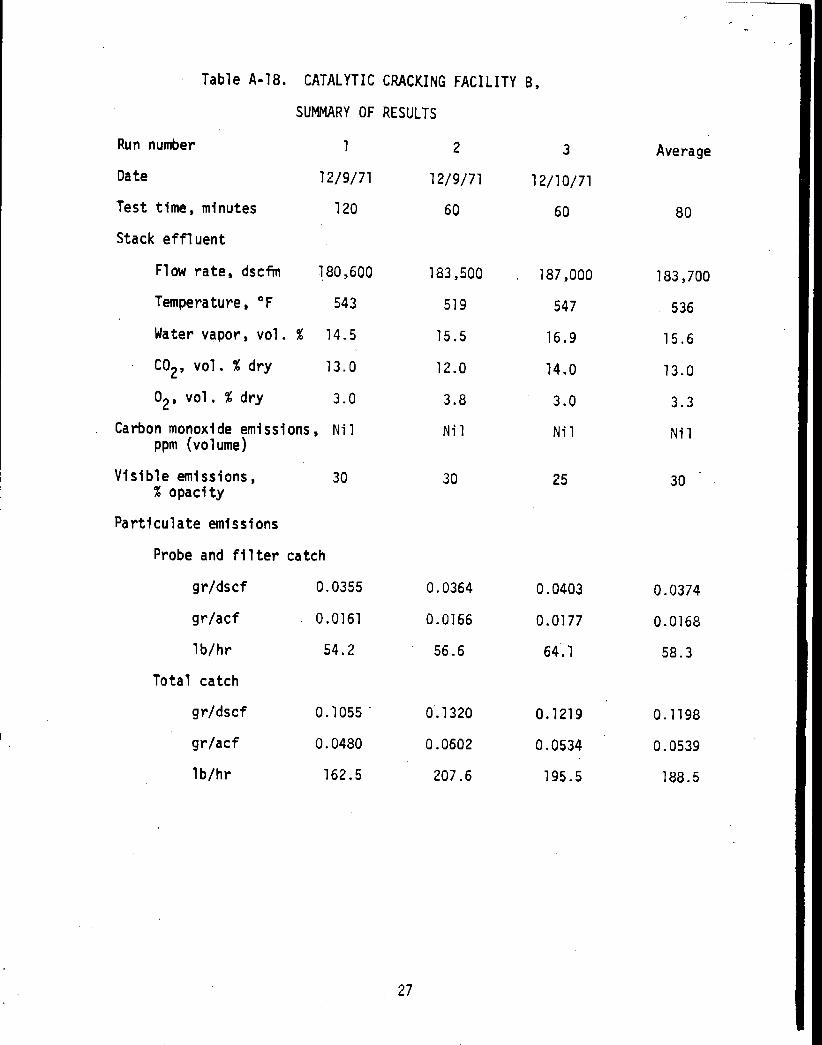
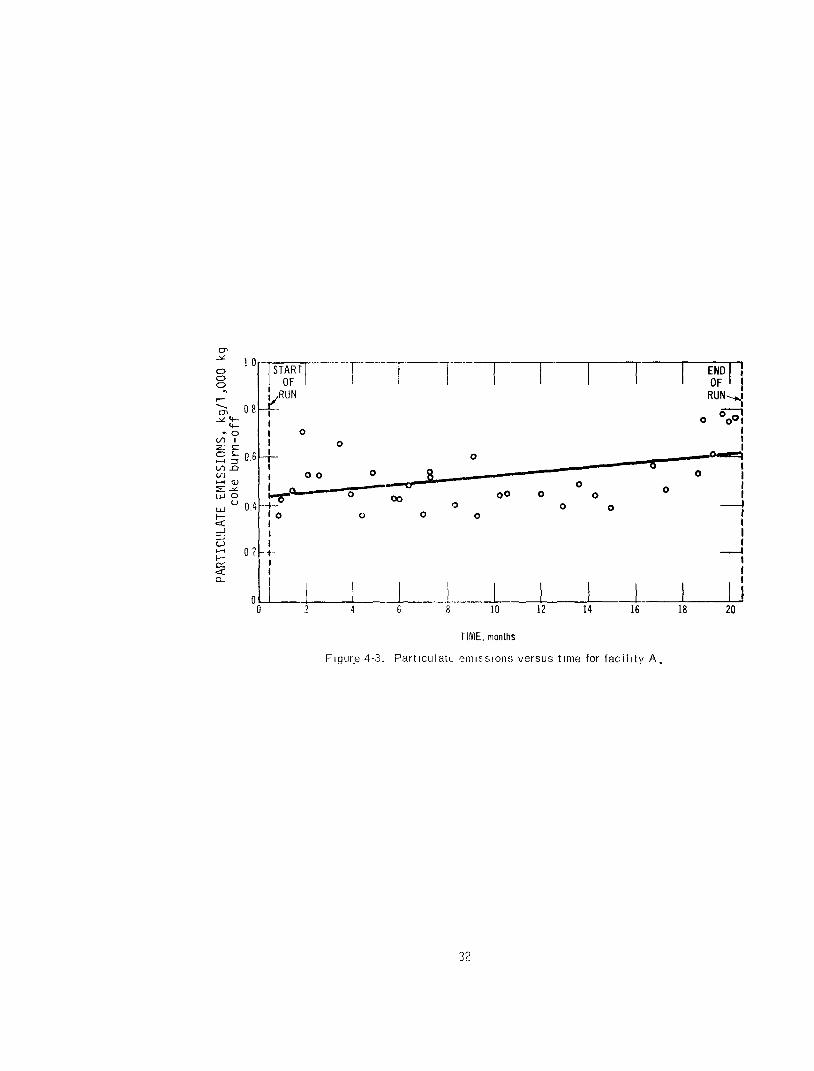
Of the three catalyst regenerators tested by EPA, all of which were controlled by electrostatic precipitators, one showed particulate emissions below the proposed standard (Figure 6). Emissions average 0.014 gr/dscf for three individual runs ranging between 0.011 and 0.016 gr/dscf. This unit was retested by EPA and showed average particulate emissions of 0.022 gr/dscf with three individual runs ranging between 0.020 and 0.023 gr/dscf. Emission data gathered by the refinery over a 7-month period of operation (Figure 6) showed average particulate emission of 0.014 gr/dscf from 14 individual tests ranging between 0.010 and 0.021 gr/dscf. In addition, emission data gathered by a second refinery over a 17-month period of operation (Figure 6) showed average particulate emission of 0.017 gr/dscf from eight individual tests ranging between 0.015 and 0.022 gr/dscf. The refinery test methods were the same in each case. Both refiners employed different filter media than the EPA method, but neither included impingers.
EPA tests of two units controlled by electrostatic precipitators (Figure 6) average 0.037 gr/dscf for eachtest. Results of a fourth unit were invalid because of a process malfunction during testing. Results of six tests on four fluid catalytic cracking unit regenerators conducted by a local control agency • are shown in Figure 6. Emissions from all units were controlled by electrostatic precipi- tators and carbon monoxide waste-heat boilers. Particulate emissions averaged 0.013, 0.017, 0.018, 0.018, and 0.020 gr/dscf, respectively. The test method used is comparable with, although not identical to, the EPA method.
Two control equipment designers have stated that they will guarantee particulate emission levels Of about 0.010 gr/dscf. Both of these firms have installed several units on catalyst regenerators.
To determine the level of the proposed standard, further evaluation was made of particulate collector design. Electrostatic precipitators are the only high---efficiency dust collectors that have been used with catalyst regenerators. Many of these precipitators are rated at 90 to 95 percent
19

0.04
0.03
0.02
0.01
CODE METHOD NUMBER 2 EPA METHOD 5 5 IMPINGERS PLUS PAPER THIMBLE 6 ALUNDUM THIMBLE; GELMAN "A" FILTER
13 ALUNDUM THIMBLE PLUS IMPINGERS •.• MAXIMUM • AVERAGE
MINIMUM EPA OTHER
e ELECTROSTATIC PRECIPITATOR 6 m CARBON MONOXIDE BOILER
5
5 5 13 e•',•4 5 •
5
Al(em A2(em) A3(ern) B(me) C(me) E(em) F(me)G(em)H(em)l(em)J(me)K(em) PLANT (CONTROL EQUIPMENT)
Figure 6. Particulate emissions from petroleum refineries, fluid catalytic cracking units.
efficiency for oil refinery emissions, as compared with the 98 to 99+ percent range encountered in other industries; however, the exit concentrations at refineries are not as low as with some other sources. For instance, an electrostatic precipitator cited in Report No. 12 for iron and steel plants was found to achieve a level of 0.007 gr/scf when applied to a basic oxygen steel furnace. The efficiency of this precipitator was considerably greater because there was a much greater inlet loading to the precipitator than is encountered with catalyst regenerators at oil refineries.
Several parameters affect the performance of an electrostatic precipitator, and it is not within the scope of this document to discuss them all. Other parameters being equal, however, collector efficiency tends to increase with plate area. It is significant that:
1. The electrostatic precipitator that exhibited the lowest exit concentration during the EPA tests has considerably greater plate area (250 ft 2/1000 acfm of gases) than the other electrostatic precipitators (175 and 190 ft •/1000 acfm) tested by EPA.
2. The previously mentioned precipitator serving a basic oxygen steel furnace has a plate area of 375 ft •/1000 acfm..
3. Precipitators with collection plate areas from 250 to more than 400 ft •/1000 acfm have been installed at steel furnaces, cement kilns, municipal incinerators, and other sources.
Based on these considerations, it is concluded that exit concentrations of 0.020 gr/dscf can be achieved with electrostatic precipitators of the same general design as, but with greater plate area than, those that have already been installed by refiners. In addition, it will probably be necessary that the precipitators be constructed in modules so that maintenance and repair operations can be
20

conducted while the unit remains in service. Catalyst regenerators frequently are kept on-stream for 2 years or longer with few shutdowns that would allow time to conduct repairs and maintenance.
Visible emissions of less than 20 percent opacity were observed at all three of the units tested by EPA. Ten additional units were observed by EPA engineers to have visible emission levels that meet the proposed standard. The proposed standard can be exceeded for 3 minutes in any 1 hour to allow the blowing of soot from the tubes of the carbon monoxide waste-heat boiler. Carbon Monoxide
In addition to particulate matter, carbon monoxide concentrations were determined during the EPA tests of well Controlled cracking units. The four units, each controlled by a carbon monoxide incinerator/waste heat boiler, showed carbon monoxide emissions well below the proposed standard (Figure 7). Carbon monoxide emissions from three tests on two units averaged 5, 10, and 25 ppm (25 ppm is 0.0025 percent by volume). No measurable carbon monoxide emissions occurred at the two remaining units tested.
Figure 7.
40
11
11 TEST METHOD NUMBER 11 11 NDIR i.• MAXIMUM
AVERAGE MINIMUM
I- -I e ELECTROSTATIC PRECIPITATOR- m CARBON MONOXIDE BOILER
Al(em) A2(em) B(me) C(me) D(em)l
PLANT (CONTROL EQUIPMENT) Carbon monoxide emissions from petroleum refineries, fluid Catalytic cracking units.
The proposed carbon monoxide standard will reqt•ire the use of either an incinerator/waste heat boiler or a regenerator that is capable of the almost complete burning of carbon and carbon monoxide to carbon dioxide. Burning carbon monoxide in the regenerator (in situ)4 is a relatively recent innovation that was developed along with improvements in catalytic cracking technology, which significantly increase the yield of gasoline. In recognition of the more effective use of natural resources, the standard is being proposed at a level that can be achieved with in situ combustion even though incinerator/waste heat boilers would provide greater reductions in carbon monoxide emissions.
21

ENVII{ONMENTAL I •PACI OF PROPOSEI) STANDARI)S
Thc dispusal of collected catalyst dust presents a potential adverse environn•cntal effect, as
would thc disposal of scrubber liquor if scrubbers were utilizcd with []uid catalytic cracking units. Nevertheless, it is cxpcctcd that electrostatic prccipitatnrs will contim•c to hc the principal collection device used in the uear futurc.
Crystalline zeolite (nmlccular sicvc) catalysts ai'c now in prcdominaut usc in the industry. The
htdk of collected particnlatcs is catalyst dust caused by atlrition. It has [iltlc catalytic cracking wduc and is seldom returned to the cracking system.. Collected l)articulales iuclndc zcolitcs. tl•hurllcd carbon, trace metals, suJt'a•: compounds, silicates, and alumina, none hi" which have app!:cciablc solubility. The usual method of disposal is by landfill.
ECONOMIC' IMPACT OF PROPOSED STA N DARDS
The growth in catalytic cracking capacity is estimated to be about 685,000 bbl/day of fresh feed
over the next S-year period. Currently, about 80 percent of existing capacity is operated hy "major" petroleum refiners and 20 percent is operated by "independent" petroleum refiners. The trend in new refinery construction is to install processing units of increased capacity. For the
purposes of this analysis, it is assnnaed that about 80 percent of new capacity will he from construction of large (65,000 bbl/day of fi'esh t•ed) units by the major refiners and the remaining 20 percent from construction of small units (20,000 bbl/day of fresh t•ed) by the independent refiners. Over the next 5 years, then, it is estimated that nine large units and six small units will he constructed, or about two large units and one small unit a•ntlally.
The costs required to meet the proposed emission standards are proportionately less on larger sized units. The investment costs tbr a carbon monoxide boiler and an electrostatic precipitator installed on a 65,000-bbl/day fi'esh-I•ed unit and on a 20,000-bbl/day fresh-t•ed uuit rauge f'rom about 25 to 36 percent of the basic process equipment investment cost, respectively. This cnst is not
all unproductive investment, however. The cost savings generated from steam pruductiot• in the carbon monoxide boiler more than offset the annual cost of the electrostatic prccipitatbr and carbon monoxide boiler. The value of the stream to the refiner depends on his alternate fuel cost; and, because the price of natural gas and other fuels is likely to keep rising, the valuc uf the stream
produced will increase in the future. The carbon monoxide boiler investment costs and annual savings are:
Unit size Investment Annual savings 20,000 bbl/day $1,800,000 $ 235,000 65,000 bbl/day $3,000,000 $1,250,000
Because the carbon monoxide boiler has an attractive economic payout, most new units would be built with carbon monoxide boilers even without the requirements of the proposed standards. The increase in process unit investment that is necessary to install an electrostatic precipitator on a 65,000-bbl/day unit and a 20,000-bbl/day unit, with the carbon monoxide boiler investment cost included as basic process equipment Cost, ranges from about 6 to 8 percent. The increase in annual operating cost ranges from about 6.2 to 9 percent.
The investment and annualized costs required to meet the new source perlbrmance standard and the reference process weight regulation are shown in Table 4. These costs are based on the use of electrostatic precipitators as the paniculate control device. The basic units were assumed to have two-stage internal cyclones.
22

Table 4. CONTROL COSTS FOR CATALYTIC CRACKING UNITS
EQUIPPED WITH ELECTROSTATIC PRECIPITATORS
Plant size, bbl/day
20,000
65,000
Emission standard
Proposed performance
standard 0.022 gr/dscf Reference
process weight standard
equivalent to
0.09 gr/dsef Proposed
performance standard
0.022 gr/dscf Reference
process weight standard
equivalent to
0.035 gr/dscf
Control investment,
$
700,000
470,000
1,150,000
1,050,000
Annual
cost, $/yr
150,000
110,000
225,O00
205,000
Annual cost
per unit of
throughput, ¢/bbl
2.2
1.6
1.0
0.9
REFERENCES FOR TECHNICAL REPORT NO. 7
1. National Emission Standards Study; A Report to the Congress of the United States by the Secretary of Health, Education, and Welfare (Appendix--Vol. I). National Air Pollution Control Administration, Public Health Service, U.S. Department of Health, Education, and Welfare. Washington, D.C. March 1970. p. E-S4.
2. Control Techniques for Carbon Monoxide Emissions from Stationary Sources. National Air Pollution Control Administration, Public Health Service, U.S. Department of Health, Education, and Welfare. Washington, D.C. NAPCA Publication No. AP-65. 1970.
3. Murray, R.C., H.E. Chatfield, E.E. Larsson, and M.C. Lawrence. A Report of Source Tests on Emissions fi'om Catalytic Cracking Unit Regenerators, County of Los Angeles Air Pollution Control District. U.S. Environmental Protection Agency. Research Triangle Park, N.C. Order No. 2PO-68-02-332. 1972. 88p.
4. Air Pollution Engineering Manual. Danielson, J.A. (ed.). National Center for Air Pollution Control, Public Health Service, U.S. Department of Health, Education, and Welfare. Cincinnati, Ohio. PHS Publication No. 99-AP-40. 1967. p. 647-649.
23


TECHNICAL REPORT NO. 8-
PETROLEUM REFINERIES, BURNING OF GASEOUS FUELS
SUMMARY OF PROPOSED STANDARD
The proposed standard of performance for petroelum refineries will limit emissions of sulfur dioxide from process heaters, boilers, and waste gas disposal systems that burn process gas generated in the refinery. The proposed standard does not apply to extraordinary situations, such as emergency gas releases, or to the burning of liquid or solid fuels in the same heaters and boilers.
The proposed standard will limit sulfur dioxide emissions to the atmosphere from heaters, boilers, and flares by specifying that the fuel gas burned shall contain no more than 230 mg/_Nm 3 of hydrogen sulfide, or 0.10 gr/dscf, unless resultant combustion gases are treated in a manner equally effective in preventing the release of sulfur dioxide to the atmosphere.
Compliance with the standard is based upon measurement of the hydrogen sulfide concen- tration in the fuel gas or the sulfur dioxide concentration in the exit gases. The proposed standard is equivalent to a sulfur dioxide content of approximately 20 gr/100 scf of fuel gas burned. Burning such lhel will result in a concentration of 15 to 20 ppm of sulfur dioxide in the combustion products.
The regulation would have the effect of requiring hydrogen sulfide removal from all refinery° generated fuel gases used to fire new boilers and heaters. The extracted sulfur compounds cannot be burned in flares, heaters, or any other sources unless the control devices used (for example, flue gas scrubbers) are equally effective as fuel desulfurization.
EMISSIONS FROM PETROLEUM REFINERIES
Refinery processes, such as distillation and fluid catalytic cracking, produce substantial quantities of "process gas" (Figure 8) that may contain more than S percent hydrogen sulfide by volume. If this untreated gas is burned in heaters, boilers, or flares, substantial quantities of sulfur dioxide will be emitted to the atmosphere. Monoethanolamine (MEA) and diethanolamine (DEA) scrubbing units (Figure 9) are widely used to remove the hydrogen sulfide from both refinery process gases and natural gas. In addition, new processes that employ other scrubbing media are
being applied to refinery process gases. The proposed standard will require owners and operators of new facilities to reduce the hydrogen sulfide content of refinery-derived fuel gases to levels that are consistent with these technologies. For most such gases, the proposed limit represents a
reduction of more than 99 percent in sulfide levels. For a fuel gas equivalent to methane, the resultant emission of 16 ppm sulfur dioxide is roughly equivalent to the burning of fuel oil containing 0.04 percent sulfur by weight.
Approximately million tons of sulfur charged to U.S. refineries could not be accounted for in 1970. The majority of this sulfur was probably burned and emitted to the atmosphere as sulfur dioxide. If all sources were controlled to the level of the standard, these emissions would be reduced by 95 percent. (Most of the difference between the 99+ percent mentioned in the preceding paragraph and 95 percent is the result of losses in conversion of the recovered gases into sulfur or sulfuric acid.)
25

At the present time, only one local regulation restricts sulfur dioxide emissions from the burning of refinery process gas. Some State and local agencies have proposed regulations with limits ranging from 10 to S0 grains of hydrogen sulfide per I00 scf of fuel gas burned (19 to 94 grains of sulfur dioxide per 100 scf).
GAS GAS COMPRESSION
PROCESS GAS
NAPTNA.• HYORO] REATER
PROCESS GAS SOUR PROCESS GA•
LTO AMINE TREATING
GAS OILS CATALYTIC CRACKING
ATMOSPHERIC TOWER
VACUUM TOWER
CAS
q CAS COMPRESSION ABSORPTION &
FRACTION UNIT
SOUR PROCESS GAS TO AMINE TREATING
Figure 8. Petroleum refinery process gas system.
RATIONALE FOR PROPOSED STANDARD
The proposed sulfur dioxide standard is consistent with the capability of a well designed and properly operated amine treating unit that is used to scrub typical refinery process gases at the moderate pressures available in the refinery. 2"4 Amine treating teclmology is well demonstrated and has been widely used to reduce hydrogen solfide concentrations in gas streams to levels less than that required to meet the proposed standard.
Three refineries •vere visited by EPA representatives, and inlbrmation was obtained on the Operation of amihe systems. All systems were stated to be operating with exit gas concentrations of less than 13 grains of hydrogen sulfide per 100 scf: Diethanolamine (DEA) and monoethanolamiue (MEA) scrubbers are fbond in almost every U.S. refinery, and hundreds are operated in natural gas fields throughout the country. Amine treating is used to reduce the hydrogen sulfide conteut of natural gas to the pipeline specification level of 0.25 gr/100 scf. It would be difficnlt, however, to consistently achieve this level in a refinery where treating pressures are lower than in natural gus
26

SOUR PROCESS GAS
•I TREATED PROCESS GAS
ABSORBER STRIPPER WATER
A•IINE
Figure 9. Petroleum refinery process gas treating unit.
fields, since higher treating pressures favor hydrogen sulfide removal. The refinery gases also contain unsaturated hydrocarbons not usually found in natural gas. These unsaturates tend to accelerate fouling of the amine solutions and to reduce scrubbing efficiency. There is no discernible difference in plant hardware or design operating parameters for an amine treating unit designed to treat refinery process gas to 10, 50, or 100 grains of hydrogen sulfide per 100 scf. •-4 Exit gas levels are apparently associated with operating practices; a standard equivalent to 13 grains of hydrogen sulfide per 100 scf requires good operating practice and has, therefore, been chosen as the basis for the standard.
The proposed standard is expressed in terms of hydrogen sulfide, but can be measured as either hydrogen sulfide in the fuel gas or total sulfur compounds in stack gases. Process gas streams also contain small amounts of other sulfur compounds, which are not removed by the amine scrubbing system. These materials would be included in the total sulfur compounds measured.
ENVIRONMENTAL IMPACT OF PROPOSED STANDARD
Due to thermal and chemical degradation, amine solutions require periodic replacement or
treatment. In MEA treating systems, it is common practice to send a continuous slipstream of amine solution to a heated reclaimer. The•e, caustic soda is added and MEA is disassociated from complex salts, distilled, and returned to the regenerator tower. As the salt content in the reclaimer increases, it is necessary to purge the salts and recharge the reclaimer. For a typical200,000- bbl/day refinery producing 30 x 10 a dscf of process gas, about 2000 lb/month of waste salts may be formed. Water is added to reduce the viscosity of salt slurry before disposal by incineration or landfill.
Diethanolamine has a higher boiling point than MEA and cannot be similarly treated. Usual practice is to continue operating until the solution is spent and the hydrogen sulfide content of treated gas reaches undesirable levels. The entire solution is then replaced with fresh solution. In the typical refinery cited above, approximately .50,000 gallons of solution containing 20 percent DEA and 10 percent complex salts would have to be removed annually.
27

ECONOMIC IMPACT OF PROPOSED STANDARD
Treatment of the various refinery gas and liquid streams to control product quality is a commonly accepted and necessary practice. Consultation with several engineering companies that design amine absorption systgms, which are the most commonly used control devices, indicates that there could be a 2 to 5 percent increase in investment cost, but no discernable difference in operating costs, between a new plant designed to meet the equivalent of 13 grains of hydrogen sulfide per 100 scf and a new one designed to meet 100 grains of hydrogen sulfide per 100 scf (typical current practice). Therefore, there is a small increase in amine treating cost to refiners as a result of the proposed standard. In addition, increased operator effort and attention may be required to maintain the design efficiency of the process during actual operation. Because this cost factor is quite variable depending on the individual company's present operating practice and should be of minor consequence, it has not been quantified. If the refiner chooses to run an increased volume of gas through an existing amine absorption system, he may incur costs in upgrading the existing system to meet the proposed standard. Because each system must be examined individually to determine the cost of upgrading, no attempt has been made to give costs for this type of modification.
It is the intent of the proposed Standard that hydrogen-sulfide-rich gases exiting the amine regenerator be directed to an appropriate recovery facility, such as a Claus sulfur plant. A medium- size refinery that processes crude oil containing 0.92 weight percent sulfur, the na•tional average in 1968, would have an emission potential of over 100 tons/day of sulfur dioxide (50 tons/day of sulfur) from the amine regenerator. The annualized cost was calculated for a range of Claus plant sizes. A discontinuity occurs in the cost-capacity curve at about 10 long tons/day. The reason for the discontinuity is that for plants up to about 10 long tons/day, less costly prefabricated package units can be used. Units producing more than 10 long tons/day are generally field-erected and considerably more expensive.
For each size unit, the required sulfur sales price to break even was calculated. At a sales price of $20/long ton, the break-even size for package Claus units is about 5 long tons/day. The plant investment for a 5-long-ton/day package Claus unit is about $90,000 exclusive of possible future investment for control of the sulfur dioxide in the tail gas. The break-even size (at a sulfur price of $20/Iong ton) for field-erected Claus units is about 15 long tons/day, which represents an investment of about $350,000.
No data are presented to show the cost that refineries would incur if their hydrogen sulfide removal systems were required to meet the 0.25 gr/100 scf achieved by plants processing natural gas. There are several reasons why one should not compare natural gas processing plants with refinery fuel gas systems. The natural gas plant processes gas at a high pressure, with a stable gas composition, and with low levels of impurities. These conditions allow better hydrogen sulfide absorption. Refinery gas is at lower pressure, has a variable composition, and has a variety of impurities that reduce the ability of an absorption system to reach the low levels of hydrogen sulfide achieved in a natural gas plant. The refinery gas pressure could be increased at a high cost, .but other limitations would still prevent the absorption system from achieving the low levels found in natural gas plants.
Cost data have not been developed for higher pressure absorption systems, but the small incremental reduction in hydrogen sulfide would make such a system highly questionable from a cost-effective point of view.
REFERENCES FOR TECHNICAL REPORT NO. 8
1. Kohl, A.L. and F.C. Riesenfeld. Ethanolamines for Hydrogen Sulfide and Carbon Dioxide Removal. In: Gas Purification. New York, McGraw Hill Company, Inc., 1960.
2. Thompson, H.L. Private communication to R.K. Burr, U.S. Environmental Protection Agency, Research Triangle Park, N.C. UOP, Process Division, Des Plaines, Ill. November 1S, 1971.
28

3. Parnell, D.C. Private communication to R.K. Burr, U.S. Environmental Protection Agency, Research Triangle Park, N.C. Ford, Bacon and Davis Texas, Garland, Texas. January 4, 1972.
4. Mayes, J.R. Private communication to R.K. Burr, U.S. Environmental Protection Agency, Research Triangle Park, N.C. Graff Engineering Corporation, Dallas, Texas. January 6, 1972.
29
TECHNICAL REPORT NO. 9-
STORAGE VESSELS FOR PETROLEUM LIQUIDS
SUMMARY OF PROPOSED STANDARDS
Standards of performance are being proposed for new storage vessels that have capacities greater than 245,000 liters, or 65,000 gallons, and that are used for the storage of gasoline, crude oil, or petroleum distillates.
The proposed standards will limit hydrocarbon emissions from any storage vessel that contains any petroleum product having a true vapor pressure, at actual storage conditions, as follows:
1. No more than 78 mm Hg, or 1.52 psia: the storage vessel must be equipped with a conservation vent or equivalent.
2. More than 78 mm Hg but not more than 570 mm Hg, or 11.1 psia: the vessel must be equipped with a floating roof or equivalent.
3. More than 570 mm Hg: the vessel must be equipped with a vapor recovery system or equivalent.
In contrast to other new source performance standards, the standards for storage vessels are not proposed in terms of allowable hydrocarbon emissions. Nevertheless, the Standards do limit emissions to specific levels, and hydrocarbon release rates can be calculated from empirical relationships developed for such equipment. Any device capable of providing comparable control of hydrocarbon emissions may be used in lieu of the specified device.
HYDROCARBON EMISSIONS FROM STORAGE TANKS 1
Hydrocarbon emissions from storage vessels depend on three basic mechanisms: breathing loss, working loss, and standing storage loss. Breathing and working losses are associated with cone-
roof tanks 2 (Figure 10), and standing storage losses are associated with floating-roof tanks (Figures 11, 12, and 13).
Breathing losses are hydrocarbon vapors expelled from the vessel by expansion of existing vapors due to increases in temperature or decreases in barometric pressure. Working losses are
hydrocarbon vapors expelled from the vessel during emptying or filling operations. Emptying losses result ti'om vapor expansion caused by vaporization after product withdrawal. Filling losses
are the amount of vapor (approximately equal to the volume of input liquid) vented to the atmosphere by displacement.
Breathing and emptying losses are usually restricted to fixed-roof tanks vented at what is essentially atmospheric pressure. Filling losses are experienced in fixed-roof tanks and low-
pressure storage tanks vented to the atmosphere. Both working losses and breathing losses can be
significant and are therefore taken into consideration when proposing the standards.
Standing storage losses are hydrocarbon emissions from floating-roof tanks. They are caused by the escape of vapors through the seal system between the floating roof and the tank wall (Figure 14), the hatches, glands, valves, fittings, and other openings.
31

CONSERVATION,'-"• (PRESSURE-VACUUM)
VENT __• GAUGE\
•ZZLE MANHOLE
Figure •0. Fixed-roef (cene-roo•) storage vessel.
•L HATCH PONTOON PONTOON SE•I •i c_-_ .a_2--£-• 3=TZ•?• •- .
• -_ : •- :• _: // •,•-
NOZZLE /• DRAIN MANHpLI /
-, • •HOSE •ROUNDLEVEL •
Figure 11, Single-deck floating-roof storage vessel.
SEAL NATCH• SUPPORT DRAIN VENT. GUIDE• SEAL
PARTITIONS NOZZLE IV]ANH•
Figure i2. Double-deck floating-roof storage vessel.
32

Gulf Coast of the United States. Vapor pressures greater than 11.1 psia would probably occur in such an area over a very short period in the fall when winter-grade gasolines are accumulated in storage for shipment north. During this period, Gulf Coast ambient temperatures remain high. However, data obtained from Gulf Coast refineries, where the worst climatic conditions are likely to be encountered, show that essentially all gasolines and most blending components can be stored in floating-roof tanks in any part of the country if the proposed standard is used. This is contingent upon using water cooling system• designed and properly operated to ensure adequate cooling of the product prior to storage.
Beyond a true vapor pressure of 11.1 psia, losses from a floating-roof tank increase very rapidly, and surface boiling, with concurrent high losses, is likely to occur. Accordingly, storage of materials having a true vapor pressure greater than 11.1 psia at actual storage conditions should be controlled by vapor recovery systems, pressure storage, refrigeration, or combinations thereof.
Vapor recovery systems have been used to a small extent to control hydrocarbon emissions from large tank farms and bulk terminals, and were considered as a possible means of controlling emissions from the storage of all liquids with high true vapor pressures. However, they have not been demonstrated to be reliable in all areas of the country. These systems have generally been reliable in regions of moderate climate where excessive, long-term vapor loads on the system caused by high summer temperatures are minimized. In addition, when a vapor recovery system is shut down by compressor failure or for maintenance, no controls exist for the entire tank farm.
ENVIRONMENTAL IMPACT OF PROPOSED STANDARDS
:A substantial portion of the hydrocarbon emissions from storage tanks are compounds that react in the atmosphere to form photochemical oxidants. Typical emissions from gasoline storage tanks are C 4 through C
6 paraffins, C
4 and C5 olefins, and small quantities of propane. Available information indicates that all of these compounds, with the exception of propane, are photochemically reactive. NO adverse environmental effects will occur as a result of meeting the requirements of the proposed standard. Floating-roof tanks and conservation vents increase and preserve the yield of
salable products. Hydrocarbons collected in vapor recovery systems are normally recycled to the refinery. In no case will the standard cause the generation of solid or liquid wastes.
ECONOMIC IMPACT OF PROPOSED STANDARDS
Over the next 5 years, approximately 175 new gasoline storage tanks and 420 new crude oil storage tanks will be constructed annually in the United States. The number of new storage tanks depends on the growth rate of the etude oil refining industry, on gasoline production, and on the actual size of the tanks constructed. The estimated annual growth rate for both etude oil refining and gasoline production is 4 percent. This growth rate will require storage for approximately 20,900,000 barrels of crude oil and 12,500,000 barrels of gasoline annually. The growth in prod uction of military jet naphtha, the least volatile material covered by the proposed standards, is uncertain but will probably be small. For this reason national investment-cost projections have not been made.
Tanks storing crude oil, gasoline, and petroleum distillates having a true vapor pressure greater than 1.52 psia require a floating roof to meet the proposed standard. The increased investment cost over a cone roof is 12 to 25 percent, depending on size. However, the savings from the product recovered exceeds the annualized cost of the floating-roof installation when storing gasoline or when storing crude oil in tanks greater than 20,000-barrel capacity. For an 80,000-barrel jet- naphtha-fuel tank under average storage conditions, the annual cost is estimated at $1,000, or 0.1 cent per barrel of throughput. Costs for two sizes of tanks are shown in Table S.
35

Table 5. CONTROL COSTS FOR PETROLEUM STORAGE TANKS
Tank capacity, bbl
20,000
8o,oo0
Incremental investment cost above cone-
roof tank, $
20,000
27,000
Material
stored Annual cost,
$
Gasoline Crude oil Jet naphtha Gasoline Crude oil Jet naphtha
savings 1,140 a
480 2,100
savings 11,100 savings 5,200
1,000
aSavings from the product recovered exceed the annualized cost.
Vapor recovery systems are required for some of the materials covered by the standard. These systems are considerably more costly than floating roofs. For some products (for example, winter- grade northern gasolines and gasoline-blending stocks) having a true vapor pressure greater than 11.1 psia, the incremental recovery over a floating-roof tank with a capacity of 50,000 barrels is 7 percent. If the increase in control costs for the vapor recovery system is divided by the increased product recovered, the cost per barrel is about 20 times the average control cost per barrel for the floating-roof system. However, proper cooling at the production unit will keep the true vapor pressure of these materials below 11.1 psia at actual storage conditions.
Other materials with a true vapor pressure greater than 11.1 psia at actual storage conditions must be stored in vessels controlled by vapor recovery systems, or their equivalents, regardless of cost in order to prevent excessive losses caused by surface boiling.
REFERENCES FOR TECHNICAL REPORT NO. 9
1. Evaporation Loss in the Petroleum Industry, Causes and Control. American Petroleum Institute, Division of Refining. •Vashington, D.C. API Bulletin 2513. 1959.
2. Evaporation Loss from Fixed Roof Tanks. American Petroleum Institute, Division of Refining. Washington, D.C. API Bulletin 2518. 1962. 3. Evaporation Loss from Floating Roof Tanks. American Petroleum Institute, Division of Refining. Washington, D.C. API Bulletin 2517. 1962, 4. Hydrocarbon Pollutant Systems Study; Volume I--Stationary Sources, Effects and Control.
MSA Research Corporation. Evans City, Pa. 1972. 5. U.S. Petroleum Inventories and Storage Capacity, National Petroleum Council. Washington,
D.C. 1970. 6. 1967 Census of Business, Wholesale Trade, Petroleum Bulk Stations and Terminal. Bureau of
Census. Washington, D.C. 1968.
36
TECHNICAL REPORT NO. 10- SECONDARY LEAD SMELTERS AND REFINERIES
SUMMARY OF PROPOSED STANDARDS
Standards of performance being proposed for new secondary lead smelters and refineries would limit emissions of particulate matter (including visible emissions) from blast (cupola) and reverberatory furnaces. Pot furnaces with a charging capacity of more than 250 kilograms (550 pounds) would be subject to visible emission limitations only. Standards for Particulate Matter from Blast and Reverberatory Furnaces
The proposed standards would limit particulate emissions from blast and reverberatory furnaces to the atmosphere as follows:
1. No more than 50 mg/Nm 3 (undiluted), or 0.022 gr/dscf. 2. No more than 20 percent opacity. The proposed visible emission standard is compatible with the mass emission limit for blast and reverberatory furnaces; if particulate emissions are at or below 50 mg/Nm3, visible emissions will be below 20 percent opacity. Observations of pot furnaces have shown that visible emissions will be less than 10 percent opacity if commonly used dust equipment is installed and properly maintained.
Standard for Particulate Matter from Pot Furnaces The proposed standard for pot furnaces will limit visible emissions to less than 10 percent opacity.
EMISSIONS FROM LEAD FURNACES
A poorly controlled (80 to 85 percent collection efficiency) secondary lead furnace can release 30 to 40 pounds of dust and fume per ton of lead produced/ Such installations are likely to be equipped with centrifugal dust collectors,, settling chambers, or low-energy scrubbers. The approach results in a loss of valuable product,2 since average smelter dust is estimated to be 63 percent lead,3 and the dust can amount to 2 percent of the lead product. On the basis of this poorly controlled emission rate, a collection efficiency of about 97 percent is required to meet the particulate standards.
At well controlled secondary lead smelters (Figure 16), either baghouses or high-energy scrubbers are used to collect dust and fumes from the furnace• When fabric filters are used to control blast furnace emissions, they are normally preceded by an afterburner (Figure 17) to incinerate oily and sticky materials to avoid blinding the fabric. This afterburner has the added advantage of converting carbon monoxide to carbon dioxide. An afterburner is not needed in the reverberatory furnace (Figure 18) since the excess air and temperature are sufficient to incinerate carbon monoxide and hydrocarbons.
Emissions from blast and reverberatory furnaces are normally released into the atmosphere through stacks with an average height of 150 feet; however, stack heights may range from a few feet above the top of the control device (about 30 feet above ground level) to 300 feet.
37
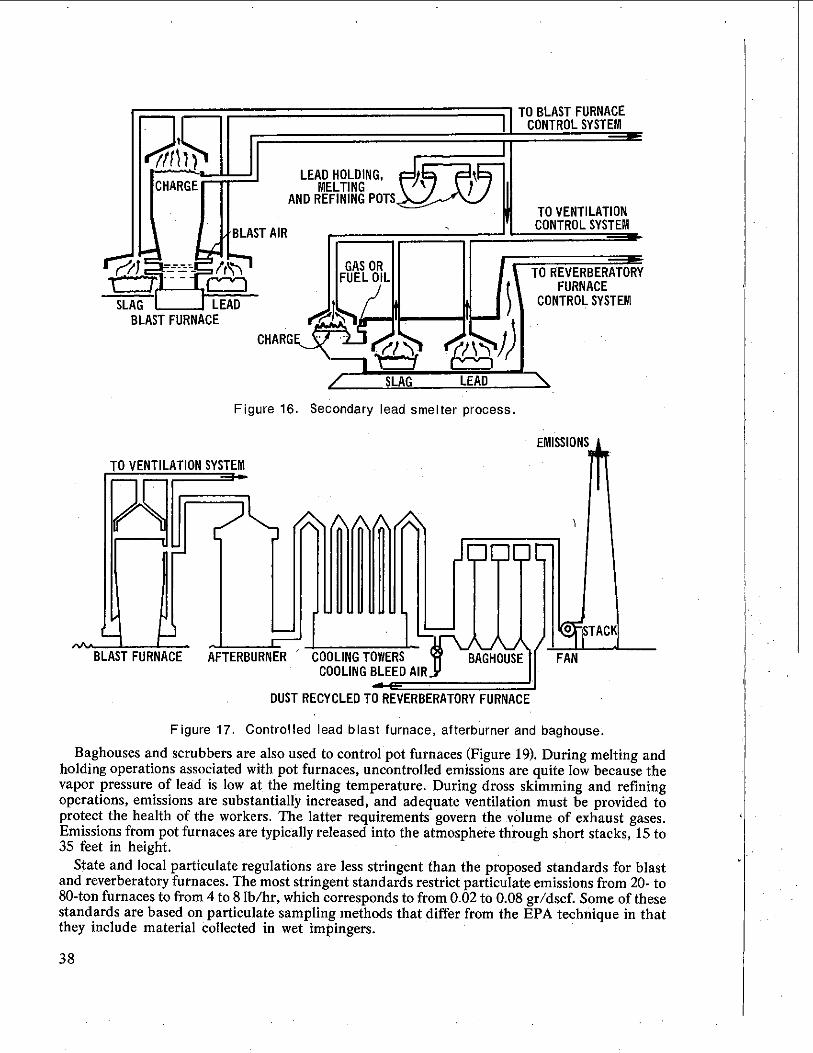
Figure 16.
TO VENTILATION SYSTEr•
GA
SLAG LEAD
Secondary lead smelter process.
B,ASTFOR.ACE AFTERDUNN,N C O0 L . %
TO VENTILATION CONTROL SYSTEM
TO REVERBERATORY FURNACE
CONTROLSYSTEM
EMISSIONS•t • BAGHOUSE FAN
DUST RECYCLED TO REVERBERATORY FURNACE
Figure 17. Controlled lead blast furnace, afterb•,rner and baghouse:
Baghouses and scrubbers are also used to control pot furnaces (Figure 19). During melting and holding operations associated with pot furnaces, uncontrolled emissions are quite low because the vapor pressure of lead is low at the melting temperature. During dross skimming and refining operations, emissions are substantially increased, and adequate ventilation must be provided to protect the health of the workers. The latter requirements govern the volume of exhaust gases. Emissions from pot furnaces are typically released into the atmosphere through short stacks, 15 to 35 feet in height.
State and local particulate regulations are less stringent than the proposed standards for blast and reverberatory furnaces. The most stringent standards restrict particulate emissions from 20- to 80-ton furnaces to from 4 to 8 lb/hr, which corresponds to from 0.02 to 0.08 gr/dscf. Some of these standards are based on particulate sampling methods that differ from the EPA technique in that they include material Collected in wet impingers.
38

-T
URNACE
TO VENTILATION SYSTEM
COOLING BLEED AIR., • OUSE/"
DUST RECYCLE
EMISSIONS
FAN
Figure 18. Controlled lead reverberatory furnace, baghouse.
FROM FURNACES STACK-
HOLDING, LEAD MELTING, t | AND REFINING POTS 'J BAGHOUSE
OUST RECYCLED TO
• •
• FAN
EMISSIONS
Figure 19. Controlled lead pot and ventilation system, baghouse.
For a typical blast (cupola) furnace rated at 50 tons/day at a flow rate of 15,000 dscf, the proposed standard will allow the furnace to emit 2.6 Ib/hr of particulate matter. The reference process weight regulation (Table 1) will limit emissions to 7.7 lb/hr for a charging rate of 6900 lb/hr. New furnaces will range in size from 20 to 80 tons/day in ingot production, with respective gas flow rates of 10,000 to 40,000 dscfm.
39

RATIONALE FOR PROPOSED STANDARDS
Particulate Matter from Blast and Reverberatory Furnaces
Preliminary investigations revealed the location of 11 well controlled plants. These plants were visited, and information was obtained on the process and control equipment. Visible emissions at the plants were observed to be less than 10 percent opacity. The feasibility of stack testing was determined in each case. Six locations were unsatisfactory for testing because control equipment was inadequate or because the physical layout of the equipment made testing unfeasible. Stack tests were conducted at five locations, including three blast and two reverberatory furnaces.
All furnaces tested showed average particulate emissions below the proposed standard (Figure 20). The blasl furnaces were controlled by (1) an afterburner and baghouse; (2) an afterburner, baghouse, and venturi scrubber; and (3) a venturi scrubber. Particulate emissions averaged, respectively, 0.003, 0.009, and 0.015 gr/dscf. The reverberatory furnaces were controlled by baghouses, with particulate emissions averaging 0.004 gr/dscfin both cases.
0.04
CODE METHOD NUMBER 2 EPA METHOD 5 9 TOTAL EPA TRAIN;
ADJUSTED RESULTS 0.03 1•4 MAXIMUM AVERAGE •
"• EPA OTHER • 2 a AFTERBURNER
b BAGHOUSE •=• 0.02 v VENTURI SCRUBBER
uJ 2
A(ab) B(abv) C(v) D(ab) E(ab) F(ab) G(b) H(b) fib)
• BLAST PLANT (CONTROL EQUIPMENT)
REVERBERATORY FURNACE • FURNACE
--'• Figure 20. Particulate emissions from secondary lead smelters and refineries, blast and rever- beratory furnaces.
Previous tests on three blast furnaces and a reverberatory furnace conducted by a local control agency 4
are also shown in Figure 20. The blast furnaces were controlled by an afterburner and a baghouse; the reverberatory furnace was controlled by a baghouse. Particulate emissions averaged, respectively, 0.001, 0.005, 0.012, and 0.003 gr/dscf. The test method is considered comparable to the EPA method.
40
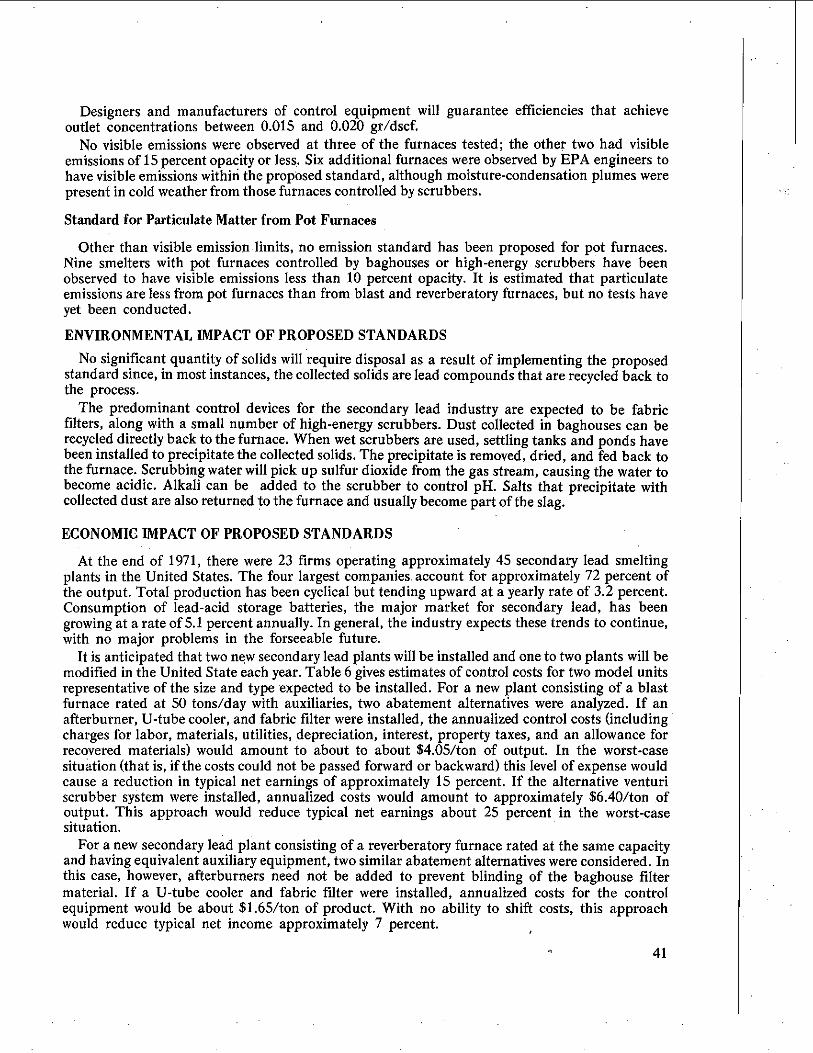
Designers and manufacturers of control equipment will guarantee efficiencies that achieve outlet concentrations between 0.015 and 0.020 gr/dscf.
No visible emissions were observed at three of the furnaces tested; the other two had visible emissions of 15 percent opacity or less. Six additional furnaces were observed by EPA engineers to have visible emissions withiri the proposed standard, although moisture-condensation plumes were
present in cold weather from those furnaces controlled by scrubbers.
Standard for Particulate Matter from Pot Furnaces
Other than visible emission limits, no emission standard has been proposed for pot furnaces. Nine smelters with pot furnaces controlled by baghouses or high-energy scrubbers have been observed to have visible emissions less than 10 percent opacity. It is estimated that particulate emissions are less from pot furnaces than from blast and reverberatory furnaces, but no tests have yet been conducted.
ENVIRONMENTAL IMPACT OF PROPOSED STANDARDS
No significant quantity of solids will require disposal as a result of implementing the proposed standard since, in most instances, the collected solids are lead compounds that are recycled back to the process.
The predominant control devices for the secondary lead industry are expected to be fabric filters, along with a small number of high-energy scrubbers. Dust collected in baghouses can be recycled directly back to the furnace. When wet scrubbers are used, settling tanks and ponds have been installed to precipitate the collected solids. The precipitate is removed, dried, and fed back to the furnace. Scrubbing water will pick up sulfur dioxide from the gas stream, causing the water to become acidic. Alkali can be added to the scrubber to control pH. Salts that precipitate with collected dust are also returned •o the furnace and usually become part of the slag.
ECONOMIC IMPACT OF PROPOSED STANDARDS
At the end of 1971, there were 23 firms operating approximately 45 secondary lead smelting plants in the United States. The four largest companies account for approximately 72 percent of the output. Total production has been cyclical but tending upward at a yearly rate of 3.2 percent. Consumption of lead-acid storage batteries, the major market for secondary lead, has been growing at a rate of 5.1 percent annually. In general, the industry expects these trends to continue, with no major problems in the forseeable future.
It is anticipated that two new secondary lead plants will be installed and one to two plants will be modified in the United State each year. Table 6 gives estimates of control costs for two model units representative of the size and type expected to be installed. For a new plant consisting of a blast furnace rated at S0 tons/day with auxiliaries, two abatement alternatives were analyzed. If an afterburner, U-tube cooler, and fabric filter were installed, the annualized control costs (including charges for labor, materials, utilities, depreciation, interest, property taxes, and an allowance for recovered materials) would amount to about to about $4.05/ton of output. In the worst-case situation (that is, if the costs could not be passed forward or backward) this level of expense would cause a reduction in typical net earnings of approximately 15 percent. If the alternative venturi scrubber system were installed, annualized costs would amount to approximately $6.40/ton of output. This approach would reduce typical net earnings about 25 percent in the worst-case situation.
For a new secondary lead plant consisting of a reverberatory furnace rated at the same capacity and having equivalent auxiliary equipment, two similar abatement alternatives were considered. In this case, however, afterburners need not be added to prevent blinding of the baghouse filter material. If a U-tube cooler and fabric filter were installed, annualized costs for the control equipment would be about $1.65/ton of product. With no ability to shift costs, this approach would reduce typical net income approximately 7 percent.
41

Table 6. CONTROL COSTS OF MEETING PERFORMANCE STANDARD (0.022 gr/dscf) FOR TYPICAL SECONDARY LEAD PLANTS a
Plant type
Blast furnace, 50 tons/day
Reverberatory furnace, 50 tons/day
Required contml
equipment
Afterburner, U-tube cooler, fabric filter Afterburner, water quench, venturi scrubber U-tube cooler, fabric filter Water quench, venturi scrubber
Control investment,
$
157,000
123,000
188,000
125,000
Annual
$/yr
51,000
80,000
21,000
36,000
Annual cost per unit of
production, S/ton
4.08
6.40
1.65
2.86
aMajor assumptions: (1) production rate, 4,000 Ib/hr; (2) annual production, 12,500 tons; (3) recoverable dust is recycled at a value of 2.25 cents/Ib, except for reverberatory dust recovered from fabric filters at value of 4.5 cents/Ib; (4) fabric filter systems depreciated straight-line, 15-year life; (5) venturi scrubber systems depreciated straight-line, 10-year life; and (6) estimated average product price $320/ton.
If the alternative control system, consisting of a water quench and venturi scrubber, were installed, the annualized control costs would be approximately $2.86/ton of output and would reduce typical net income about 12 percent.
The costs shown in Table 6 are total in the sense that they account for complete control Systems added to new, uncontrolled plants. The incremental control costs to meet the proposed standard beyond those required to meet the reference process weight standard are minimal. Many State and local agencies presently have regulations for secondary lead smelters that require the same types of dust-control equipment necessary under the proposed standards. The industry has also practiced relatively effective control in the past in order to minimize occupational health hazards.
It is estimated that the 1967 level of control for the industry was 90 percent. New secondary lead facilities will be introduced into a market situation in which the price of the product or the prices paid for raw material scrap already reflect, to some degree, the increased expenses from air pollution control. Since the incremental control costs for a new plant versus an existing unit are minimal, profitability at least equaling that of existing industry should be achievable for a new unit.
Secondary producers compete with their primary counterparts and are subject to the cyclical nature of the lead industry as a whole. Total control costs for the secondary facilities are small in absolute terms and in relation to the expected control Costs for the primary producers. Control costs for the primary facilities are on the order of $0.022/1b, or $447ton. Costs for new secondary plants are in the range of $2/ton to $6/ton. With full implementation by both types of producers, secondary lead producers should not be placed at a competitive disadvantage.
REFERENCES FOR TECHNICAL REPORT NO. 10
1. Control Techniques for Lead Emissions. U.S. Department of Health, Education and Welfare, Public Health Service, Environmental Health Services. Washington, D.C. September 1970.
42

2. Brainbridge, C.A. Fume Control and Recovery in Lead Smelting Furnaces. Chemical and Process Engineering. August 1960.
3. Bray, J.L. Non-Ferrous Production Metallurgy (2nd Ed.). New York, John Wiley and Sons, Inc. 1953.
4. Williamson, J.E., J.F. Nenzell, and W.E. Zwiacher. A Study of Five Source Tests on Emissions from Secondary Lead Smelters. County of Los Angeles Air Pollution Control District. Los Angeles, Calif. Order No. 2PO-68-02-3326. 1972. 45p.
43


TECHNICAL REPORT NO. 11
SECONDARY BRASS OR BRONZE INGOT PRODUCTION PLANTS
SUMMARY OF PROPOSED STANDARDS
The proposed performance standards for new secondary brass or bronze ingot production plants will limit particulate emissions (including visible emissions) from reverberatory furnaces and will limit visible emissions from electric and blast (cupola) furnaces. The standards will apply to batch furnaces with a capacity of 1000 kilograms (2205 pounds) or greater per heat, and to continuous (blast) furnaces capable of producing 250 kilograms (550 pounds) or more of metal per hour. The standards do not apply to the manufacture of brass or bronze from virgin metals or to brass or bronze foundry operations. Furthermore, the standards apply to particulate emissions from furnaces only. Other sources of particulate emissions may exist in plants affected by the proposed standards, but further study will be required to delineate such sources and to recommend appropriate levels of control.
No mass standard is proposed for electric and blast furnaces because (1) 95 percent of the production is carried out in reverberatory furnaces, (2) the emissions from blast furnaces are about the same as those from reverberatory furnaces and far less than those from electric furnaces, (3) well controlled blast and electric furnaces can meet the visible emission standard, (4) the expenditure of EPA resources for the testing needed to support a specific mass standard is not warranted, and (5) the visible emission standard is an adequate enforcement criterion and can be met only by well controlled units.
Standards for P•rticulates from Reverberatory Furnaces
The proposed standards will limit emissions to the atmosphere as follows: 1. No more than 50 mg/__Nm :• (undiluted), or 0.022 gr/dscf. 2. No more than 10 percent opacity.
Standard for Particulates from Electric and Blast Furnaces
The opacity of visible emissions shall be no more than 10 percent.
EMISSIONS FROM SECONDARY BRASS AND BRONZE FURNACES
Particulate emissions from brass and bronze furnaces (Figure 21) vary with the content of the all•y .being produced, and with the presence of impurities in the scrap feed. Most of the particulate emissions are metal oxides, predominantly zinc oxides (45 to 77 percent) and lead oxides (1 to 13 percent). Uncontrolled reverberatory furnaces can emit as much as 80 pounds of particulate matter per ton of ingot produced. The level of emissions from blast furnaces (cupolas) is approximately equal to that from reverberatory furnaces; the level of emissions from electric furnaces is typically far lower. 1,•,3 The composition of emissions from blast furnaces is similar to that from reverberatory furnaces. 1,2 Emissions from electric furnaces are also expected to be similar because the process and raw materials are identical.
Fabric filters are extensively used to control emissions from all three types of furnace; only recently have electrostatic precipitators been adopted as control devices. Although no scrubber has yet been used to control emissions to the level of the proposed standard, such levels are within the capability of scrubbing technology.
45

GAS OR OIL
AIR FLUX
METAL PRODUCT CONTROL DEVICE INGOT MOLD
REVERSATORY FURNACE COOLING SURFACE
INDUSTRIAL SCRAP
SLAG SLAG
FABRIC COLLECTOR OR ELECTROSTATIC PRECIPITATOR
EMISSIONS
FUEL, ROTARY FURNACE
(GAS OR OIL) FINES
FAN
AiR METAL PRODUCT TO INGOT MOLD
Figure 21. Controlled secondary brass and bronze furnaces.
No State or local agency now has an emission standard specifically for the brass and bronze' industry. General restrictions applied to this industry are based on the process weight regulation• or on emission concentrations. These concentration restrictions range from 0.05 to 0.3 gr/sef. Some restrictions are based on particulate sampling methods that differ from EPA method 5 because they include material collected in a wet impinger.
The reference process weight regulation (Table 1) would restrict emissions from a typical 25-ton brass furnace (24-hour cycle) to 3.6 lb/hr. The proposed mass standard is more restrictive than any existing process weight curve for furnace sizes appropriate to the brass and bronze industry. The standard will limit these emissions to between 1.0 and 1.5 Ib/hr.
Lead emissions during production of a 5 percent lead alloy comprised 4 to 7 percent of the total particulate matter emitted. Production of alloys with a higher lead content would probably increase the lead content of the total emissions. Because there is no known control technique specific for lead, the maximum possible control of lead emissions can be obtained by using the most effective particulate collectors.
RATIONALE FOR PROPOSED STANDARDS Ba•ed on the results of preliminary screening, eight plants were inspected as candidates for
source testing. Visits to these plants revealed that five plants operated with no visible emissions. Four of these five were selected for source testing, and three plants were successfully tested. The fourth test was aborted because plant malfunctions during testing rendered the test results invalid.
Particulate Matter from Reverberatory Furnaces
All furnaces tested by EPA showed average particulate emission rates below the proposed standard. Emission rates from the reverberatory furnaces, all controlled by fabric filters, averaged 0.001, 0.006, and 0.008 gr/dscf.
At least three heats were tested at each plant. The tests began when the first scra•was charged into the furnace and ended when the pouring of ingots began. The pouring phase of the heats was
not tested because none of the facilities adequately collected the emissions from this phase of the heat. During some of the tests, individual samples were collected during different phases of the
46
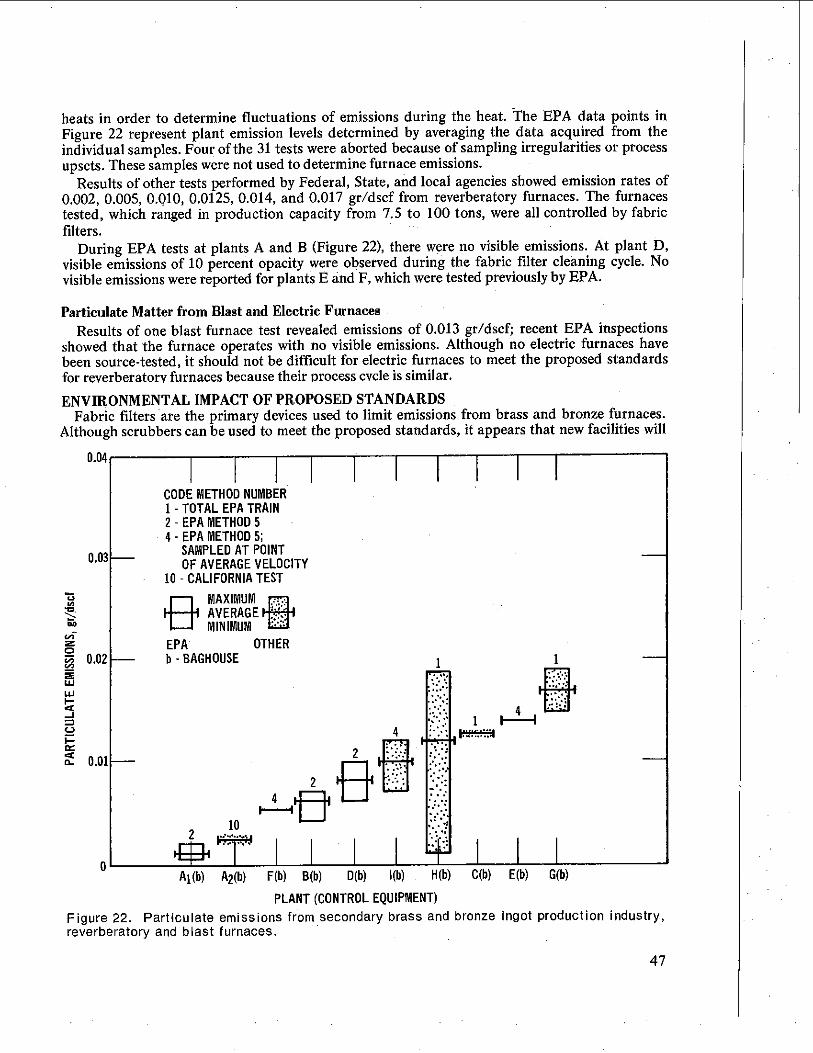
heats in order to determine fluctuations of emissions during the heat. The EPA data points in Figure 22 represent plant emission levels determined by averaging the data acquired from the individual samples. FOU r of the 31 tests were aborted because of sampling irregularities or process upsets. These samples were not used to determine furnace emissions.
Results of other tests performed by Federal, State, and local agencies showed emission rates of 0.002, 0.005, 0.010, 0.0125, 0.014, and 0.017 gr/dscf from reverberatory furnaces. The furnaces tested, which ranged in production capacity from 7.5 to 100 tons, were all controlled by fabric filters.
During EPA tests at plants A and B (Figure 22), there were no visible emissions. At plant D,
visible emissions of 10 percent opacity were observed during the fabric filter cleaning cycle. No visible emissions were reported for plants E •nd F, which were tested previously by EPA.
Particulate Matter from Blast and Electric Furnaces
Results of one blast furnace test revealed emissions of 0.013 gr/dscf; recent EPA inspections showed that the furnace operates with no visible emissions. Although no electric furnaces have been source-tested, it should not be difficult for electric furnaces to meet the proposed standards for reverberatorv furnaces because their orocess cycle is similar.
ENVIRONMENTAL IMPACT OF PROPOSED STANDARDS Fabric filters are the primary devices used to limit emissions from brass and bronze furnaces.
Although scrubbers can be used to meet the proposed standards, it appears that new facilities will
0.04
0.03
0.02
0.01
CODE METHOD NUMBER TOTAL EPA TRAIN
2 EPA METHOD 5 4 EPA METHOD 5;
SAMPLED AT POINT OF AVERAGE VELOCITY
10 CALIFORNIA TEST IF• MAXIMUM • AVERAGE • MINIMUM •
EPA OTHER b BAGHOUSE
I0
At(b) A2(b)
1 1
F(b) B(b) D(b) l(b) H(b) C(b) E(b) G(b)
PLANT (CONTROL EQUIPMENT) Figure 22. Particulate emissions from secondary brass and bronze ingot production industry, reverberatory and blast furnaces.
47

continue to use fabric filters. There is now only one brass and bronze facility that uses a wet scrubber (low efficiency). This facility utilizes settling ponds to separate collected solids and recycles the water in a closed-loop system.
Until recently, the particulate matter collected from brass and bronze furnaces was marketable; however, this market has been declining, and an excess of collected zinc and lead oxides now exists. Several methods of disposal are being used, some of which are: bagging, 55-gallon drums, open piles, and landfills. Techniques are available to prevent leaching and water contamination due to the storage of water-goluble solid wastes. For example, it is common practice in the chemical processing industry to use plastic-lined, watertight disposal pits in order to prevent leaching or runoff. Since the total annual tonnages involved in the brass and bronze industry are small (about 10,000 tons/yr for the entire industry), this disposal technique can be used if necessary. ECONOMIC IMPACT OF PROPOSED STANDARDS
Brass and bronze ingot production has grown at an average annual rate of 1.2 percent over the last 10 years. Production reached a peak in 1965 and 1966 and has declined somewhat since that time. For this reason, it is believed that excess capacity exists in the industry and few, if any, new plants will be constructed in the next few years. It is probable, however, that some obsolete furnaces will need to be replaced. Such replacements are expected at a rate of one or two furnaces per year; these new furnaces will be required to comply with the new source performance standards.
Although there are a few wet scrubbers and electrostatic precipitators in use in the industry, the fabric filter has been the most common control device used in the past. The fabric filter will most likely be the control device used to meet the proposed new source performance standards. Control cost for different sizes of reverberatory furnaces are shown in Table 7
It is possible to channel the exhaust from several furnaces into a common control system, and thus achieve the economy of a large-scale system. The extent that this economy can be realized will depend on the characteristics of the individual plant in which the furnace replacement is made.
The proposed standard is not likely to require expenditures above those already required by existing State or local standards.
Table 7. CONTROL COSTS OF MEETING PERFORMANCE STANDARD (0.022 gr/dscf) FOR REVERBERATORY FURNACES
Annual cost per Furnace Inve•ment, Annualcost, ton of product,
capacity, tons/day $ $ $
20 74,000 13,000 6.52 50 110,000 20,070 4.01 75 130,000 34,300 3.24
REFERENCES FOR TECHNICAL REPORT NO. 11 1. Air Pollution Aspects of Brass and Bronze Smelting and Refining Industry. National Air
Pollution Control Administration, Public Health Service, U.S. Department of Health, Education, and Welfare. Raleigh, N.C. NAPCA Publication No. AP-58. November 1969. 63 p.
2. Air Pollution Engineering Manual. Danielson, J.A. (ed.). Natioaaal Center for Air Pollution Control, Public Health Service, U.S. Department of Health, Education, and Welfare. Cincinqati, Ohio. PHS Publication No. 999-AP-40. 1967.
3. Compilation of Air Pollutant Emission Factors (Revised). U.S. Environmental Protection Agency. Research Triangle Park, N.C. Office of Air Programs Publication No. AP-42. February 1972.
4. A Compilation of Selected Air Pollution Emission Control Regulations and Ordinances. National Center for Air Pollution Control, Public Health Service, U.S. Department of Health, Education, and Welfare. Washington, D.C. PHS Publication No. 99-AP-43. 1968. 146 p.
48

TECHNICAL REPORT NO. 12
IRON AND STEEL PLANTS
SUMMARY OF PROPOSED STANDARDS
Standards of performance being proposed for the iron and steel industry wilI limit emissions of particulates, including visible emissions, from new basic oxygen process furnaces (BO F s).
I. No more than 50 mg/Nm a (undiluted), or 0.022 gr/dscf. 2. No more than 10 percent opacity. The proposed standard for visible emissions is compatible with the 50-mg/Nm a
mass emission limit. The proposed particulate limits can be achieved with highrenergy venturi scrubbers
or
electrostatic precipitators.
EMISSIONS FROM BASIC OXYGEN PROCESS FURNACES
In the steel industry, there are several processes that are major sources of particulate emissions if not properly controlled. These processes include the basic oxygen process; operation of open hearth, blast, and electric furnaces; and operation of coke ovens and sintering plants (Figure 23).
IRON ORE •
• •
/ BLAST
/ SINT
E'•" / FURNAGE
HOT METAL HOLDER
SCRAP
BASIC OXYGEN FURNACE
CONTINUOUS CASTING
STEEL INGOT TEEMING
OPEN HEARTH FURNACE
ELECTRIC FURNACE
Figure 23. Iron and steel process system.
49

The proposed standards would apply only to basic oxygen process furnaces. Other pollutant sources in this industry will be covered by standards to be developed at a later date.
The BOPF is a vertical cylindrical container that is open at one end. During the steel-making process, oxygen at high velocity is directed at the surface of the molten mix, violently agitating the mix and causing a large quantity of particulate matter and carbon monoxide to be emitted through the open end of the furnace. As much as 40 pounds of particulate matter is emitted per ton of steel. The emissions are drawn into a hood, which is similar to that used with kitchen stoves to draw off steam and cooking odors. From the hood, the hot, dirty air is ducted to cleaning devices, usually electrostatic precipitators or high-pressure venturi scrubbers, which remove much of the particulate matter before the air is vented to the outside.
There are two different hood systems used to capture the BOPF emissions. One system uses an
open (or combustion) hood, which has 1.5 to 2 feet of clearance above the furnace rim. The other system uses a retractable closed hood, which fits rather closely around the top of the furnace and prevents additional air from being drawn into the exhaust system.
The closed hood was designed to minimize the exhaust volume and to reclaim carbon monoxide. In many countries, this carbon monoxide is collected for use as a fuel or as a feed gas for petrochemical processing operations; however, in the two plants in the United States using cl6sed hoods, the exhaust gases are currently flared with no heat recovery.
From an air pollution standpoint, there are two factors pertinent to closed hoods: (1) the high concentrations of combustible carbon monoxide make the hot gases potentially too hazardous to clean in the arcing electric field of an electrostatic precipitator (in the open hood, oxygen in the air reacts with carbon monoxide to form nonexplosive carbon dioxide) and (2) the rate of the volumetric flow (cubic feet of gas per minute) through the cleaning system and out the stack is less than 20 percent of the rate of flow in an open-hood system. The first factor limits the choice of cleaning equipment to a single type, the high-energy venturi scrubber. The second factor leads to lower stack emissions per unit time (pounds per hour) than with an open hood. This is true because the venturi scrubber achieves about the same degree of cleanliness (0.02 grain of particulate matter per cubic foot of air) whether it is fed extremely dirty air or moderately dirty air. (The extremely dirty air from the closed hood comes out just as dean as the moderately dirty air from the open hood.) The amount of particulate matter coming out of the stack per unit time (pounds per hour) is dependent, therefore, upon how many cubic feet of air come out of the stack per unit time. As previously mentioned, the air flow in a closed system is less than one-fifth that of the open system, and the emission of pa•rticulate matter would be correspondingly lower.
Both open and dosed hoods allow some air contaminants to escape through the roof ventilators to the atmosphere during charging, turn down, tilting, tapping, and ladle additions. Because the closed hood may be withdrawn to the up position during these operations, it is less efficient in collecting resultant emissions. During the oxygen blow, a small portion of the particulate matter also escapes to the building ventilation system, regardless of the collection device used. Collectively, these uncaptured emissions are estimated to be only a small percentage of the total quantity from BOPFrs.
In the United States, BOPF's range from 100 to 325
tons in capacity. Emission volumes vary from 200,000 to 600,000 dscfm for open-hood systems. A typical 250-ton furnace has a gas volume of 200,000 to 500,000 dscfm. With a 90 percent yield and a particulate concentration of 0.022 gr/dscf, the furnace would produce 470 tons of steel and emit between 36 and 90 pounds of particulate per hour, depending on the quantity of excess air permitted to enter the combustion hood.
The requirements of existing State and local regulations that are specifically for BOPF facilities range from 0.1 to 0.2 lb/1000 lb of stack gas. This limitation is equivalent to 0.045 to 0.090 gr/scf. Such regulations would permit the furnace in the example given above to emit 77 to 386 pounds of particulate per hour. State limitations submitted pursuant to Section 110 of the Clean Air Act will require control only slightly less stringent than the new source standard.
5O
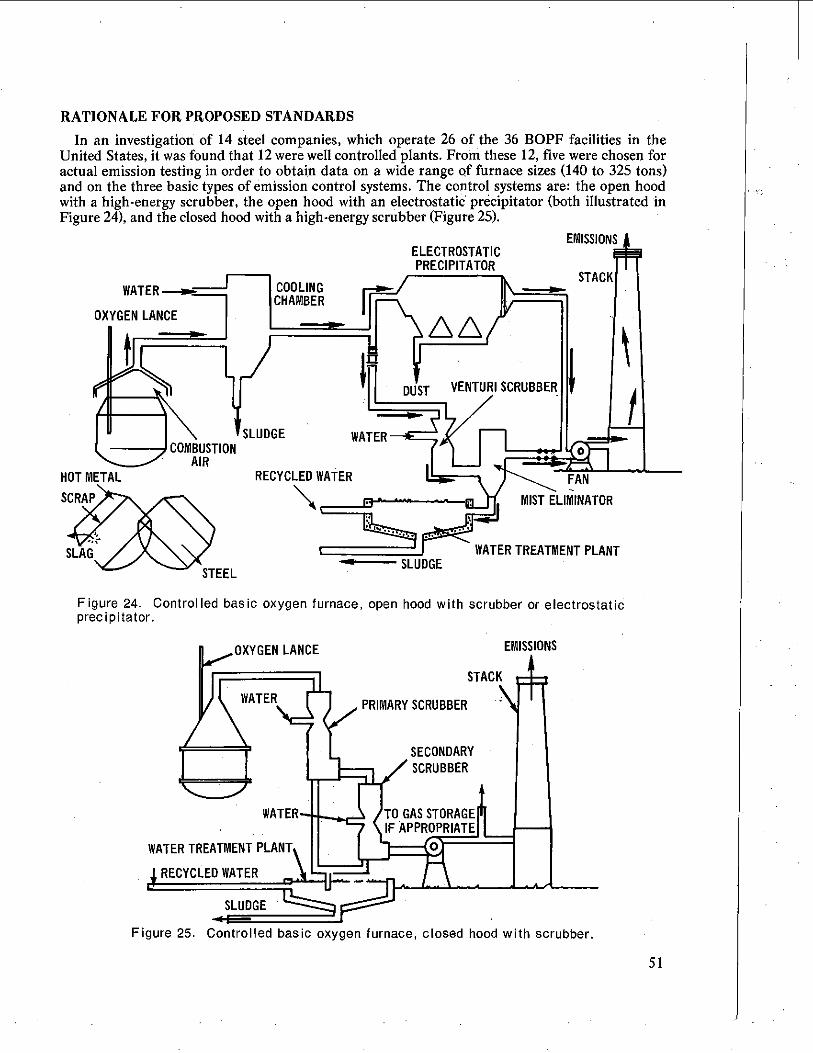
RATIONALE FOR PROPOSED STANDARDS
In an investigation of 14 steel companies, which operate 26 of the 36 BOPF facilities in the United States, it was found that 12 were well controlled plants. From these 12, five were chosen for actual emission testing in order to obtain data on a wide range of furnace sizes (140 to 32S tons) and on the three basic types of emission control systems. The control systems are: the open hood with a high-energy scrubber, the open hood with an electrostatic' pr6cipitator (both illustrated in Figure 24), and the closed hood with a high-energy scrubber (Figure 25).
ELECTROSTATIC EMISSIONS•
PRECIPITATOR • COOLING
•
STACK WAT E R .•-•,,---- OHAM
• I•
TI
HOT ME.TAL RECYCLED wATER • "•"-•'--"•- •:AI•
SL•.G. / • •'X..•'TEEL• •
SLUDG'I E
WATERTREATI•ENT PLANT
Figure 24. Controlled basic oxygen furnace, open hood with scrubber or electrostatic precipitator.
•,...... OXY G EN LANCE EMISSIONS
t "1 STACK
L SECONDARY I • • SCRUBBER I WATER•)TOGAS
STORAGE |
Figure 25. Gontrolle6 basic oxygen furnace, closed boo6 w•th scrubber.
51
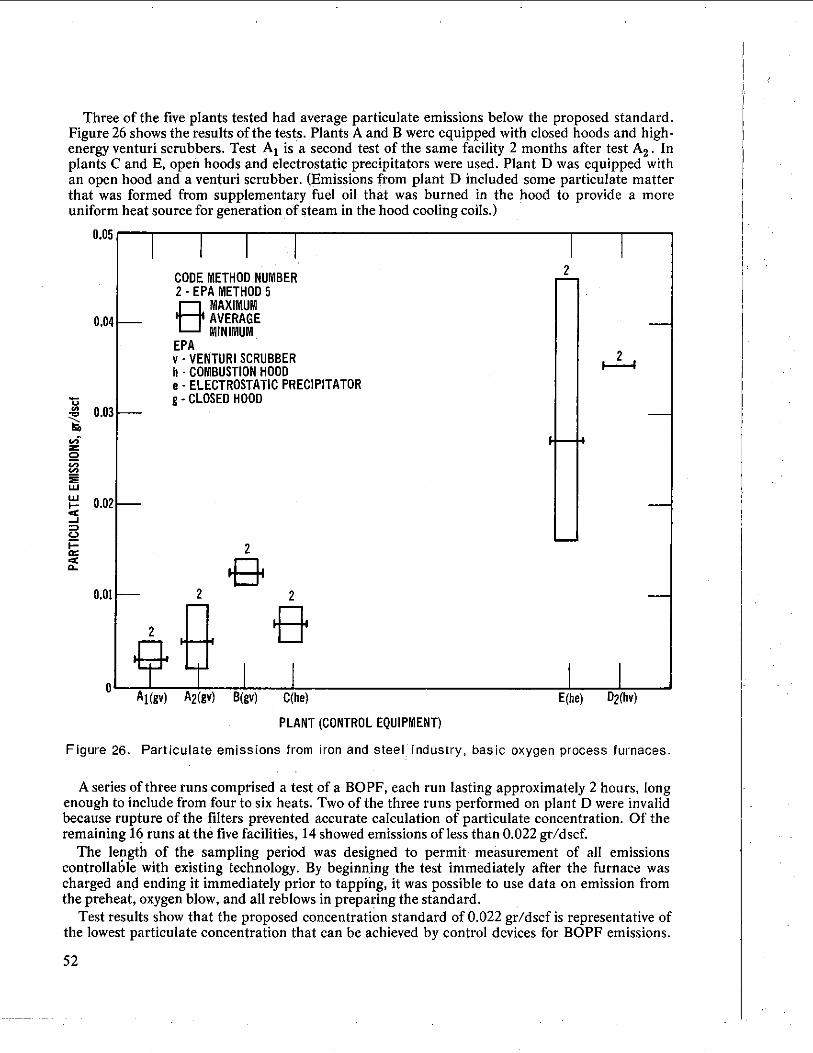
Three of the five plants tested had average particulate emissions below the proposed standard. Figure 26 shows the results of the tests. Plants A and B were equipped with closed hoods and high- energy venturi scrubbers. Test A
1 isa second test of the same facility 2 months after test A
2 In
plants C and E, open hoods and electrostatic precipitators were used. Plant D was equipped with an open hood and a venturi scrubber. (Emissions from plant D included some particulate matter that was formed from supplementary fuel oil that was burned in the hood to provide a more uniform heat source for generation of steam in the hood cooling coils.)
0.04
0.03
0.02
0.01
Al(gV)
CODE METHOD NUMBER 2 EPA METHOD 5 MAXIMUM
AVERAGE MINIMUM
EPA v VENTURI SCRUBBER h COMBUSTION HOOD e ELECTROSTATIC PRECIPITATOR • CLOSED HOOD
2
2
A2(gv) B(gv) C(he) E(he) D2(hv)
PLANT (CONTROL EQUIPMENT)
Figure 26. Particulate emissions from iron and steel industry, basic oxygen process furnaces.
A series of three runs comprised a test of a BOPF, each run lasting approximately 2 hours, long enough to include from four to six heats. Two of the three runs performed on plant D were invalid because rupture of the filters prevented accurate calculation of particulate concentration. Of the remaining 16 runs at the five facilities, 14 showed emissions of less than 0.022 gr/dscf.
The length of the sampling period was designed to .permit measurement of all emissions controlla61e with existing technology. By beginning the test immediately after the furnace was charged and ending it immediately prior to tapping, it was possible to use data on emission from the preheat, oxygen blow, and all reblows in prepa(ing the standard.
Test results show that the proposed concentration standard of 0.022 gr/dscf is representative of the lowest particulate concentration that can be achieved by control devices for BOPF emissions.
52
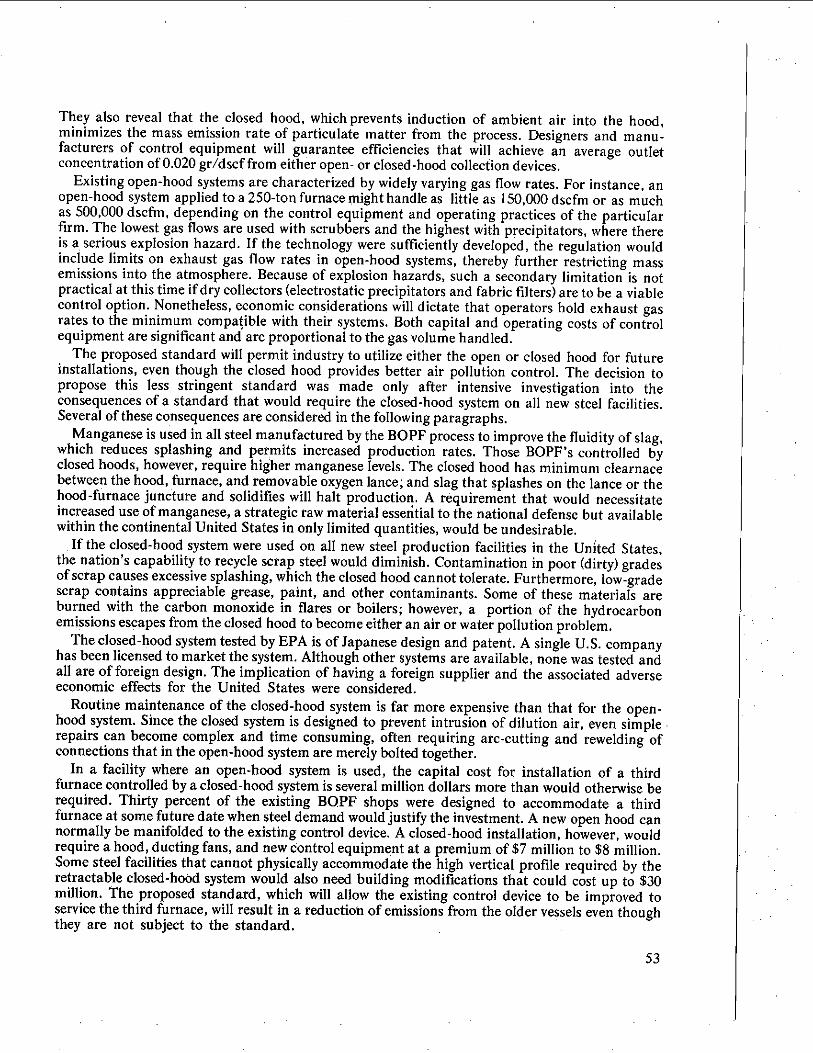
They also reveal that the closed hood, which prevents induction of ambient air into the hood, minimizes the mass emission rate of particulate matter from the process. Designers and manu- facturers of control equipment will guarantee efficiencies that will achieve an average outlet concentration of 0.020 gr/dscf from either open- or closed-hood collection devices.
Existing open-hood systems are characterized by widely varying gas flow rates. For instance, an open-hood system applied to a 250-ton furnace might handle as little as 150,000 dscfm or as much as 500,000 dscfm, depending on the control equipment and operating practices of the particular firm. The lowest gas flows are used with scrubbers and the highest with precipitators, where there is a serious explosion hazard. If the technology were sufficiently developed, the regulation would include limits on exhaust gas flow rates in open-hood systems, thereby further restricting mass emissions into the atmosphere. Because of explosion hazards, such a secondary limitation is not practical at this time if dry collectors (electrostatic precipitators and fabric filters) are to be a viable control option. Nonetheless, economic considerations will dictate that operators hold exhaust gas rates to the minimum compat, ible with their systems. Both capital and operating costs of control equipment are significant and are proportional to the gas volume handled.
The proposed standard will permit industry to utilize either the open or closed hood for future installations, even though the closed hood provides better air pollution control. The decision to propose this less stringent standard was made only after intensive investigation into the consequences of a standard that would require the closed-hood system on all new steel facilities. Several of these consequences are considered in the following paragraphs.
Manganese is used in all steel manufactured by the BOPF process to improve the fluidity of slag, which reduces splashing and permits increased production rates. Those BOPF's controlled by closed hoods, however, require higher manganese levels. The closed hood has minimum clearnace between the hood, furnace, and removable oxygen lance; and slag that splashes on the lance or the hood-furnace juncture and solidifies will halt production,. A requirement that would necessitate increased use of manganese, a strategic raw material essential to the national defense but available within the continental United States in only limited quantities, would be undesirable.
If the closed-hood system were used on all new steel production facilities in the United States, the nation's capability to recycle scrap steel would diminish. Contamination in poor (dirty) grades of scrap causes excessive splashing, which the closed hood cannot tolerate. Furthermore, low-grade scrap contains appreciable grease, paint, and other contaminants. Some of these materials are burned with the carbon monoxide in flares or boilers; however, a portion of the hydrocarbon emissions escapes from the closed hood to become either an air or water pollution problem.
The closed-hood system tested by EPA is of Japanese design and patent. A single U.S. company has been licensed to market the system. Although other systems are available, none was tested and all are of foreign design. The implication of having a foreign supplier and the associated adverse economic effects for the United States were considered.
Routine maintenance of the closed-hood system is far more expensive than that for the open- hood system. Since the closed system is designed to prevent intrusion of dilution air, even simple repairs can become complex and time consuming, often requiring arc-cutting and rewelding of connections that in the open-hood system are merely bolted together.
In a facility where an open-hood system is used, the capital cost for installation of a third furnace controlled by a closed-hood system is several million dollars more than would otherwise be required. Thirty percent of the existing BOPF shops were designed to accommodate a third furnace at some future date when steel demand would justify the investment. A new open hood can normally be manifolded to the existing control device. A closed-hood installation, however, would require a hood, ducting fans, and new Control equipment at a premium of $7 million to $8 million. Some steel facilities that cannot physically accommodate the high vertical profile required by the retractable closed-ho0d system would also need building modifications that could cost up to $30 million. The proposed standard, which will allow the existing control device to be improved to service the third furnace, will result in a reduction of emissions from the older vessels even though they are not subject to the standard.
53

ENVIRONMENTAL IMPACT OF PROPOSED STANDARDS
Most new units are expected to utilize scrubbers to meet the Standard. In typical installations, including all three scrubbing systems tested during the EPA development program, water is recirculated. Two to 10 percent purge may be necessary (40 to 200 gal/min). This purge can be treated in the plant water treatment facilities with existing techniques. Guidelines for water effluents from steel plants are currently under preparation.
At the present time, the high zinc content of the collected dust prevents it from being used as
blast furnace charge. It is possible that technology may be developed to enable the dust to be recycled, but at the present time it is landfilled. The material may be in the form of sludge or dust, or it may be pelletized. Landfill sites are usually segregated and mapped for possible future reclamation.
Contamination of ground water by BOPF dust disposal sites has not been identified as a
problem. The dust is primarily iron and zinc oxide and calcium fluoride precipitated from the scrubber solution through lime addition. None of these materials l•s significant solubility in
water.
ECONOMIC IMPACT OF PROPOSED STANDARDS
At the end of 1971, there were 36 basic oxygen steel furnace facilities in the United States, owned by 19 different companies. Of a total of 120 million tons of new steel produced that year, these facilities accounted for 64 million tons• Only three of the major integrated iron and steel firms do not utilize the basic oxygen furnace steel facilities.
It has been estimated that approximately 8 million tons of additional capacity will come on-
stream between 1974 and 1977. This projection is based on two factors: (1) an expected growth rate of 4.$ percent in raw steel production by th• BOPF process and (2) a recovery from the 1971 production-to-capacity ratio of 86 percent to the historic ratio of 92 percent. At present, it is not known how many new facilities will be constructed or how many existing two-vessel facilities will add a third vessel with an open-hood control device.
Three types of control systems can meet the proposed regulations:O) open hood with scrubber, (2) open hood with precipitator, and (3) closed hood with scrubber. Costs of cont,'oiling particulate emissions fro m new two-vessel facilities are shown in Table 8. These costs cover gas-cleaning devices, hood, duct work, Cooling towers (for open-hood scrubbers only), fans, pumps, motors, slurry settlers and filters (for scrubbers), and dust-removal and storage equipment (for precipitators).
Many states formulating plans for air quality implementation are developing particulate standards that limit emissions from steel furnaces to 0.03 to 0.05 gr/dscf. These values are fairly close to current industry performance for all BOPF shops. Meeting the new source performance standards would not increase costs over the requirements of the current industry practice of installing electrostatic precipitators at a new plant. Employing an open-hood scrubber to meet the performance standards at a new plant would increase costs about $0.10/t0n nmre in comparison with current industry practice in BOPF shops •using such control devices. The difference is due to increased power consumption. This cost penalty is negligible Compared with a price of $220/t0n of finished steel products for a typical mill product mix.
Plants expanding from two- to three-vessel facilities may be required to incorporate increased cleaning capability into their operations, either with (1) larger fans and bigger motors (including cooling towers for those facilities that do not have them) for scrubbers or (2) additional cleaning sections in precipitation systems. It is expected that an individual shop with two 200-ton vessels
may spend up to $1 million to upgrade the existing control equipment to meet the proposed performance standards coveting the third vessel.: It seems that this same investment may be required to comply with State regulations as proposed in the implementation plans• especially where expansion of facilities is concerned.
54
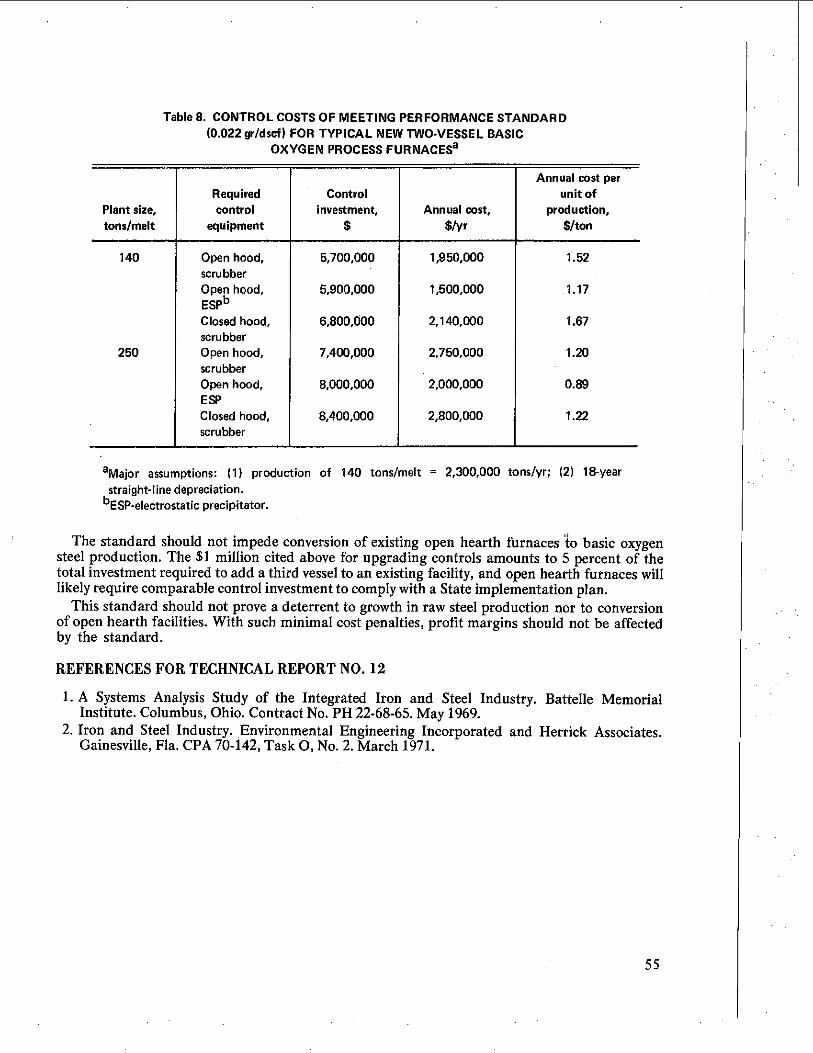
Table 8. CONTROL COSTS OF MEETING PERFORMANCE STANDARD (0.022 gr/dscf) FOR TYPICAL NEW TWO-VESSEL BASIC
OXYGEN PROCESS FURNACES a
Annual cost per Required Control unit of
Plant size, control investment, Annual cost, production, tons/melt equipment $ $/yr S/ton
140
250
Open hood, scrubber Open hood, ESP b
Closed hood, scrubber Open hood, scrubber
Open hood, ESP Closed hood, scrubber
5,700,000
5,900,000
6,800,000
7,400,000
8,000,000
8,400,000
1,950,000
1,500,000
2,140,000
2,750,000
2,000,000
2,800,000
1.52
1.17
1.67
1.20
0.89
1.22
aMajor assumptions: (1) production of 140 tons/melt 2,300,000 tons/yr; (2) 18-year straight-line depreciation.
bESP-electrostatic precipitator.
The standard should not impede conversion of existing open hearth furnaces •o basic oxygen steel production. The $1 million cited above for upgrading controls amounts to 5 percent of the total investment required to add a third vessel to an existing facility, and open hearth furnaces will likely require comparable control investment to comply with a State implementation plan.
This standard should not prove a deterrent to growth in raw steel production nor to conversion of open hearth facilities. With such minimal cost penalties, profit margins should not be affected by the standard.
REFERENCES FOR TECHNICAL REPORT NO. 12
1. A Systems Analysis Study of the Integrated Iron and Steel Industry. Battelle Memorial Institute. Columbus, Ohio. Contract No. PH 22-68-65. May 1969.
2. Iron and Steel Industry. Environmental Engineering Incorporated and Herrick Associates. Gainesville, Fla. CPA 70-142, Task O, No. 2. March 1971.
55


TECHNICAL REPORT NO. 13-
SEWAGE TREATMENT PLANTS
SUMMARY OF PROPOSED STANDARDS
Standards of performance being proposed for municipal sewage treatment plants would limit emission of particulate matter (including visible emissions) fi'om new incinerators used to burn sludge generated in the treatment plant. These standards would apply to all sewage treatment plants that incinerate sludge from primary or secondary treatment. For plants processing industrial wastewaters, further restriction might be required to prevent the release of specific metals, toxic, organics, or radioactive substances.
The proposed standards would limit particulate emissions to the atmosphere as follows: 1. No more than 70 mg/Nm3 (undiluted), or 0.031 gr/dscf. 2. No more than 10 percent opacity. The proposed visible emission standard is compatible with the mass emission limit; if p•rticulate emissions are below 70 mg/_Nm3, visible emissions will be less than 10 percent opacity.
EMISSIONS FROM SLUDGE INCINERATORS Sludge incinerators (Figures 27 and 28) differ from most other types of incinerators, primarily in that the refuse does not supply enough heat to sustain combustion. Further, there is less emphasis
on retaining ash in the incinerator and much of it is discharged in stack gases. In one type of incinerator, the fluidized bed reactor, all of the ash is carried out with the gases. Particulate emissions into the atmosphere are almost entirely a function of the scrubber efficiency and are only minimally affected by incinerator conditions. All sludge incinerators in the United States are equipped with scrubbers of varying efficiency; the scrubbers range from simple bubble-through units to venturi scrubbers with pressure drops of up to 18 inches of water.
Available data indicate that, on the average, uncontrolled multiple-hearth incinerator gases contain about 0.9 gr/dscf of particulate matter. Uncontrolled fluid bed reactor gases contain about 8.0 gr/dscf. For average municipal sewage sludge, these values correspond to about 23 lb/hr in a multiple-hearth unit and about 205 lb/hr in a fluid bed unit. Particulate collection efficiencies of 96.6 to 99.6 percent will be required to meet the standard, based on the above uncontrolled emission rate. Emissions will be on the order of 1.0 lb/hr.
Existing State or local regulations tend to regulate sludge incinerator emissions through incinerator codes or process weight regulations. The most stringent State or local limit, 0.03 gr/dscf, is based on a test method that is different from the reference method in that it includes impingers.t Many State and local standards are corrected to a reference base of 12 percent carbon dioxide or 6 percent oxygen. Corrections to carbon dioxide or oxygen baselines are not directly related to the sludge incinerator rate because of the high percentage of auxiliary fuel required. In some regulations, the carbon dioxide from fuel burning is subtracted from the total in determinations of compliance.
For a typical incinerator with a rated dry solids charging rate of0.S ton/hr at a gas flow rate of 3000 dscfm, the proposed standard would allow the incinerator to emit 0.8 lb/hr of particulate matter. The reference process weight regulation (Table 1) would limit emissions to 6.3 Ib/hr, based on a charging rate of wet sludge (80 percent water) of 5000 Ib/hr. Dry solids charging rates for new incinerators will range from 0.5 to 4.0 tons/hr, with gas flow rates of 1,000 to 20,000 dscfm.
57

SLUDGE CAKE
EXHAUST
WATER INLET
SCRUBBER
SHAFT COOLING AIR FAN •
Figure 27.
FUEL WATER
•ASH CONVEYOR rLET
Controlled multiple-hearth furnace, scrubber.
.l_,I
BURNER FUEl REACTOR •CRUBBER
f;-I )......, ..
AIR BLOWER AIR BLOWER Figure 28. Controlled fluidized bed reactor, scrubber.
EMISSIONS
FAN
RATIONALE FOR PROPOSED STANDARDS
Preliminary investigations revealed the location of 30 reportedly well controlled sewage sludge incinerators. These plants were visited, and information was obtained on the process and control equipment. At 15 of the plants, visible emissions were observed to be less than 10 percent opacity.
58

Determination was made as to the feasibility of stack testing in each case. Stack tests were conducted at five locations, including three multiple-hearth incinerators and two fluid bed reactors. Four incinerators tested were controlled by impingment-type scrubbers, and one by a venturi •crubber. Pressure drops across th e scrubbers range from 2.5 to 18 inches of water.
Of the incinerators tested, one fluid bed reactor and one multiple-hearth incinerator showed particulate emissions at or below the proposed standard (Figure 29). Particulate emissions averaged 0.010 and 0.030 gr/dscf, respectively. A previsous test by a local control agency • using the reference method on the fluid bed reactor (Figure 29) indicated average emissions of 0.009 gr/dscf. The other multiple-hearth incinerators tested had erroneously low exit particulate concentrations as a result of dilution by shaft cooling air prior to sampling. Estimated undiluted exit concentrations (Figure 29) are 0.050 and 0.055 gr/dscf. Emission from the second fluid bed reactor (Figure 29) averaged 0.060 gr/dscf.
The fluid bed reactor on which the standard is based is controlled by a venturi scrubber with a
pressure drop of 18 inches of water. Because of the limited application of this type of control device
0.I0
0.08
• 0.06
= 0.04
.0.02
CODE METHOD NUMBER 2-EPA METHOD 5 8-STATE OF NEWJERSEY TEST i,E• MAXIMUM •
AVERAGE MINIMUM
EPA OTHER s-SCRUBBER p- PLATE SCRUBBER *-CORRECTED TO ACCOUNT
FOR DILUTED AIR 2
2
B(p)* C(p) PLANT (CONTROL EQUIPMENT)
2
A1 (s) A2(s) D(p) E(s)*
Figure 29. Particulate emissions from sewage treatment plant, sludge incinerator.
59

on sludge incinerators, the standard has been set at a level somewhat higher than that obtained during the tests of the unit. The remaining installations tested had impingement-type scrubbers, which operated at considerably less pressure drop (2.5 to 6 inches of water). The lower-efficiency impingement scrubbers are adequate to meet opacity and process weight regulations, but do not
represent the best control technology. Designers and manufacturers of control equipment will
guarantee an outlet concentration of less than 0.030 gr/dscf. No visible particulate emissions were observed at the five incinerators tested, although moisture-
condensation plumes were sometimes present. Ten additional incinerators were observed by EPA engineers to have visible emissions that were within the proposed standard.
ENVIRONMENTAL IMPACT OF PROPOSED STANDARDS
Incineration consumes hydrocarbons and reduces the volume of solid wastes by up to 95 percent. Incinerated sludge is usually acceptable for landfill. If raw sludge is not incinerated, it must be digested or otherwise stabilized to render it acceptable for landfill. Water from the plant is used as
the scrubbing medium and recycled to treatment facilities. In no case is new solid or liquid waste created.
For municipal treatment plants, the combination of high-temperature incineration and high- efficiency scrubbing will provide sufficient safeguards against the release of highly toxic air pollutants. Nevertheless, this treatment may not be adequate for industrial installations where there are significant concentrations of mercury or other toxic materials in the sewage. In such instances, other means of sludge handling and disposal should be evaluated.
ECONOMIC IMPACT OF PROPOSED STANDARDS
Over the next few years, it is estimated that 70 new municipal sewage sludge incinerators will be constructed annually in the United States. Factors such as the availability of alternative methods of sludge disposal will have a signl-ficant effect on the actual rate of construction.
To estimate the economic impact of the proposed new source performance standards, a model sewage sludge incinerator (multiple-hearth furnace) serving a population of 100,000 persons was utilized. Investment and annual cost to achieve the proposed standard were estimated. To provide a basis for cost comparison, investment and annual costs to comply with a process weight standard for the incinerator were also estimated. Table 9 gives the results of these analyses. Cost information is based upon private communication with manufacturers of sludge incinerators and manufacturers of air pollution control equipment.
Investment costs in air pollution control equipment (low-energy impingement scrubbers) to meet the process weight standard were found to be approximately 4.0 percent of the total installed cost of the sludge incineration facility. The control cost (for a low,energy venturi scrubber) to achieve the proposed new source performance standard represents approximately 4.3 percent of the total installed cost. The increase in installed cost from 4.0 to 4.3 percent is due primarily to the additional fans and motors required for the venturi scrubber.
Annual costs to meet the process weight standard were estimated to be 4 percent of the total annual cost of the sludge incinerator facility. The annual cost of control to comply with the proposed new source standard is estimated to be 6 percent of the total annual cost of the incinerator facility. Increases in the power requirements of the venturi scrubber were found to be a major cause for the increases in annual cost of control. On a per capita basis (population of 100,000 persons), meeting the proposed new source performance standard is estimated to cost $0.04/year more than a process weight standard of 0.10 gr/scf.
In financing the required investment, municipalities have several alternatives, such as issuing bonds or securing money through pledges of ad valorem tax revenues. The proposed new source performance standard is not anticipated to cause additional difficulties.
60

Table 9. CONTROL COSTS FOR TYPICAL SEWAGE SLUDGE INCINERATOR a
Plant size, tons/day (cfm)
10 (10,000)
100 (17,800)
Emission standard
Performance standard 0.031 gr/dscf Typical local
standard 0.10 gr/dscf Performance standard 0.031 gr/dscf Typical local standard 0.10 gr/dscf
Required control
equipment
Low-energy venturi scrubber
Low-energy impingement scrubber Low-energy ventu ri scrubber
Low-energy impingement scrubber
Control investment, Annua| cost,
$ S/year
60,000 11,700
55,000 8,400
132,000 34,200
120,000 21,100
Annual cost per
person, $
0.12
0.08
0.03
0.02
aModel plant assumptions: (1) 10 tons/day-3640 hours of operation per year, 100 tons/day- 8736 hours of operation per year; (2) sinking fund depreciation over 12.5 years; and (3) intePest at 6 percent.
REFERENCES FOR TECHNICAL REPORT NO. 13
References Cited
1. Implementation Plan, Metropolitan Baltimore Intrastate Air Quality Control Region. State of Maryland, Department of Health and Mental Hygiene, Environmental Health Administration. Baltimore, Md. January 28, 1972. (addendum April 4. 1972).
2. Test Report on the N.W. Bergin Sewage Authority Sludge Incinerator for the State of New Jersey. Engineering-Science, Inc. Washington, D.C. Contract No. 68-02-0225. May 1972.
Supplemental References
3. Burd, R.S. A Study of Sludge Handling and Disposal. Ohio Basin Region, Federal Water Pollution Control Administration. Cincinnati, Ohio. FWPCA Publication No. WP-20-4. May 1%8.
4. State of the Art Review on Sludge Incineration Practice. Resource Engineering Associates. Wilton, Conn. Contract No. 14-12-499. April 1970.


SHEET APTD-1352a 4. Tkleana Sub•itl• BACKGROUND INFOPddATION FOR PROPOSED NEW SOURCE PERFORMANCE STANDARDS: Asphalt Concrete Plants, Petroleum Refin- eries, Storage Vessels, Secondary Lead Smelters and Refineries, Brass or Bronze In ot Production PInts Iron and Steel Plants LA.tho,(s) Sewage Treatment Plantsl Volume i, Main
9. Performing •ganizatlon Name and Address
U.S. Environmental Protection Agency Office of Air and Water Programs Office of Air Quality Planning and Standards Research Trian e Park t
June" 1973
IS. Supplementary Notes
16. AbstractsThis document provides background information on the de•ivatlon
of the propose•
second group of new source performance standards and their economic impact on the con- struction and operation of asphalt concrete plants, petroleum refineries, storage vesse• secondary lead smelters and refineries, brass or bronze ingot production plants, iron and steel plants, and Sewage treatment plants. Information is also provided on the en- Vironmental impact of imposing the standards. The standards require control at a level typical of well controlled existing plants and' attainable with existing technology. To determine these levels, extensive on-slte investigations were conducted, and design fac- tors, maintenance practices, available test data• and the character of emissions were considered. Economic analyses of the effects of the standards indicate they will not cause undue reductions of profit margins or reductions in growth rates.
Air Pollution Pollution control * Performance standards * Asphalt concrete plants * Petroleum refineries * Lead smelters and refineries * Brass ingot production * Bronze ingot production * Iron production
]•7b. ldentJfiers/Open-Ended Terms
i, Air pollution control
* Steel production * Sewage treatment
17¢, COSATI F•eld/G•oup
18. Awilability Statement Unlimited
19. Security Class (This 121. No. of Pages Report).
UNCLASSIFIED 61 20. Security Class (This 122. Price
Pa •NCLASSIFIED
•ff.S.S.P.O.: 1974-747-79•./344, Region NO. 4