appendix b: map folio - university of...
TRANSCRIPT

66
Map Title Page
Household Income by Census TractB19001 - HOUSEHOLD INCOME IN THE PAST 12 MONTHS (IN 2013 INFLATION-ADJUSTED DOLLARS)
1.1 Number of Households earning less than $10,000 per year by census tract
67
1.2 Number of Households earning $10,000-19,999 per year by census tract
68
1.3 Number of Households earning $20,000-$34,999 by census tract 69
1.4 All three income categories by place 70
Cost Burdened Renter Households25074 - HOUSEHOLD INCOME BY GROSS RENT AS A PERCENTAGE OF HOUSEHOLD INCOME IN THE PAST 12 MONTHS
2.1 Number of Households earning less than $10,000 per year paying more than 30% in housing costs
71
2.2 Number of Households earning $10,000-19,999 per year paying more than 30% in housing costs
72
2.3 Number of Households earning $20,000-$34,999 paying more than 30% in housing costs
73
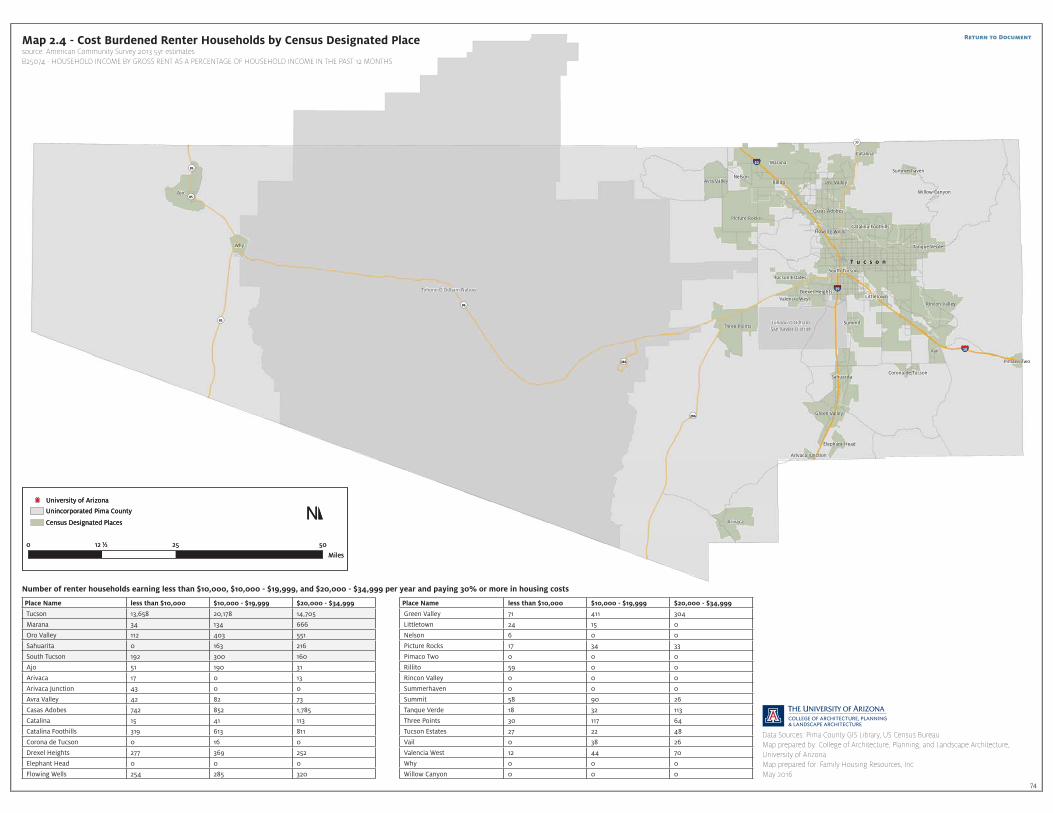
2.4 All three income categories by place 74
Cost Burdened Owner HouseholdsC25095 - HOUSEHOLD INCOME BY SELECTED MONTHLY OWNER COSTS AS A PERCENTAGE OF HOUSEHOLD INCOME IN THE PAST 12 MONTHS
2.5 Number of Households earning less than $10,000 per year paying more than 30% in housing costs
75
2.6 Number of Households earning $10,000-19,999 per year paying more than 30% in housing costs
76
2.7 Number of Households earning $20,000-$34,999 paying more than 30% in housing costs
77
2.8 All three income categories by place 78
Map Title Page
Gross RentB25063 - GROSS RENT
3.1 Number of Households paying less than $349 in rent 79
3.2 Number of Households paying less than $549 in rent 80
3.3 Number of Households paying less than $899 in rent 81
3.4 All three rent categories by place 82
Mothly Owner CostsB25094 - SELECTED MONTHLY OWNER COSTS
3.5 Number of Households paying less than $399 in owner costs 83
3.6 Number of Households paying less than $599 in owner costs 84
3.7 Number of Households paying less than $899 in owner costs 85
3.8 All three owner cost categories by place 86
3.9 Income Restricted Housing 87
Gentrification
4.1 Eligible gentrified tracts 88
4.2 Gentrified tracts 89
6.1 Transportation costs by location 90
6.2 Workers earning $1250 or less per month 91
6.3 Areas in Pima County with a Walkscore of 70 or more 92
6.4 Locations walkable to transit 93
B1 Renter Occupied Mobile Homes by Census Tract 94
B2 Owner Occupied Mobile Homes by Census Tract 95
B3 Renter Occupied Homes Built 1979 or Earlier 96
B4 Owner Occupied Homes Built 1979 or Earlier 97
B5 Habitat for Humanity Homes and NSP2 Activities 98
Appendix B: Map Folio
Printing InstructionsThe following maps are 18” x 24” at full size. However, they may be printed on a standard office printer by splitting the page across multiple sheets of paper (called “tiling”). You can adjust the size of the original to best fit the paper and specify how much each “tile” overlaps. You can then piece together the tiles.Adobe Reader 9 or earlier does not offer the tiling option.
1. Choose File > Print.In the Print dialog box beneath Page Sizing & Handling, choose the “Poster” option
2. Set the following options as needed:Tile Scale - the scale at which the final output image will be
printed (100% is recommended)Overlap - amount of image overlap between tiles
Cut Marks - adds lines to the corners of each page indicating where to cut away excess paper before piecing together map tiles
Labels - will add the filename and page number to each tile3. Click OK or Print.Note: The maps can also be printed full size at any copy or print shop

Spatial Data: Pima County GIS LibraryMap prepared by: College of Architecture, Planning, and Landscape Architecture, University of Arizona Map prepared for: Family Housing Resources, IncMay 2016
67
Marana
Ajo
Vail
Picture Rocks
Three Points
Arivaca
Oro Valley
Green Valley
Catalina Foothills
Tanque Verde
Rincon Valley
Why
Catalina
Sahuarita
Avra Valley
Casas Adobes
Drexel Heights
Tucson Estates
Valencia West
Summit
Elephant Head
Pimaco Two
Corona de Tucson
Summerhaven
Flowing Wells
Arivaca Junction
South Tucson
Nelson
Willow Canyon
Littletown
Rillito
§̈¦10
§̈¦19
§̈¦10
¬«86
¬«286
¬«85
¬«386
¬«77
¬«85
¬«85
T u c s o n
Map 1.1 - Household Income by Census Tractsource: American Community Survey 2013 5yr estimates B19001 - HOUSEHOLD INCOME IN THE PAST 12 MONTHS (IN 2013 INFLATION-ADJUSTED DOLLARS)
Tohono O’Odham Nation
Tohono O’Odham San Xavier District
no data available
1
788
University of Arizona
Miles
0 12 ½ 25 50
N
Number of households earning less than $10,000 per year
Return to Document

Spatial Data: Pima County GIS LibraryMap prepared by: College of Architecture, Planning, and Landscape Architecture, University of Arizona Map prepared for: Family Housing Resources, IncMay 2016
68
Marana
Ajo
Vail
Picture Rocks
Three Points
Arivaca
Oro Valley
Green Valley
Catalina Foothills
Tanque Verde
Rincon Valley
Why
Catalina
Sahuarita
Avra Valley
Casas Adobes
Drexel Heights
Tucson Estates
Valencia West
Summit
Elephant Head
Pimaco Two
Corona de Tucson
Summerhaven
Flowing Wells
Arivaca Junction
South Tucson
Nelson
Willow Canyon
Littletown
Rillito
§̈¦10
§̈¦19
§̈¦10
¬«86
¬«286
¬«85
¬«386
¬«77
¬«85
¬«85
T u c s o n
Map 1.2 - Household Income by Census Tractsource: American Community Survey 2013 5yr estimates B19001 - HOUSEHOLD INCOME IN THE PAST 12 MONTHS (IN 2013 INFLATION-ADJUSTED DOLLARS)
Tohono O’Odham Nation
Tohono O’Odham San Xavier District
no data available
0
743
University of Arizona
Miles
0 12 ½ 25 50
N
Number of households earning $10,000 - $19,999 per year
Return to Document

Spatial Data: Pima County GIS LibraryMap prepared by: College of Architecture, Planning, and Landscape Architecture, University of Arizona Map prepared for: Family Housing Resources, IncMay 2016
69
Marana
Ajo
Vail
Picture Rocks
Three Points
Arivaca
Oro Valley
Green Valley
Catalina Foothills
Tanque Verde
Rincon Valley
Why
Catalina
Sahuarita
Avra Valley
Casas Adobes
Drexel Heights
Tucson Estates
Valencia West
Summit
Elephant Head
Pimaco Two
Corona de Tucson
Summerhaven
Flowing Wells
Arivaca Junction
South Tucson
Nelson
Willow Canyon
Littletown
Rillito
§̈¦10
§̈¦19
§̈¦10
¬«86
¬«286
¬«85
¬«386
¬«77
¬«85
¬«85
T u c s o n
Map 1.3 - Household Income by Census Tractsource: American Community Survey 2013 5yr estimates B19001 - HOUSEHOLD INCOME IN THE PAST 12 MONTHS (IN 2013 INFLATION-ADJUSTED DOLLARS)
Tohono O’Odham Nation
Tohono O’Odham San Xavier District
no data available
0
846
University of Arizona
Miles
0 12 ½ 25 50
N
Number of households earning $20,000 - $34,999 per year
Return to Document

Spatial Data: Pima County GIS LibraryMap prepared by: College of Architecture, Planning, and Landscape Architecture, University of Arizona Map prepared for: Family Housing Resources, IncMay 2016
70
Marana
Ajo
Vail
Picture Rocks
Three Points
Arivaca
Oro Valley
Green Valley
Catalina Foothills
Tanque Verde
Rincon Valley
Why
Catalina
Sahuarita
Avra Valley
Casas Adobes
Drexel Heights
Tucson Estates
Valencia West
Summit
Elephant Head
Pimaco Two
Corona de Tucson
Summerhaven
Flowing Wells
Arivaca Junction
South Tucson
Nelson
Willow Canyon
Littletown
Rillito
§̈¦10
§̈¦19
§̈¦10
¬«86
¬«286
¬«85
¬«386
¬«77
¬«85
¬«85
T u c s o n
Place Name less than $10,000 $10,000 - $19,999 $20,000 - $34,999
Tucson 23,987 31,730 41,093
Marana 178 671 1,645
Oro Valley 489 948 1,941
Sahuarita 127 526 898
South Tucson 281 467 564
Ajo 170 361 273
Arivaca 17 61 122
Arivaca Junction 43 0 76
Avra Valley 168 181 314
Casas Adobes 1,449 2,225 4,320
Catalina 205 269 610
Catalina Foothills 947 1,379 2,898
Corona de Tucson 22 47 85
Drexel Heights 728 1,103 1,634
Elephant Head 4 49 0
Flowing Wells 724 1,130 1,804
Map 1.4 - Household Income by Census Designated Placesource: American Community Survey 2013 5yr estimates B19001 - HOUSEHOLD INCOME IN THE PAST 12 MONTHS (IN 2013 INFLATION-ADJUSTED DOLLARS)
Place Name less than $10,000 $10,000 - $19,999 $20,000 - $34,999
Green Valley 472 1,685 2,808
Littletown 24 15 44
Nelson 6 0 28
Picture Rocks 206 281 425
Pimaco Two 9 40 72
Rillito 59 18 0
Rincon Valley 15 45 212
Summerhaven o 0 0
Summit 135 290 244
Tanque Verde 116 231 631
Three Points 198 311 321
Tucson Estates 347 397 1,076
Vail 76 176 311
Valencia West 128 189 602
Why 20 5 0
Willow Canyon 0 0 0
Tohono O’Odham Nation
Tohono O’Odham San Xavier District
Unincorporated Pima County
Census Designated Places
University of Arizona
Miles
0 12 ½ 25 50
N
Number of owner households earning less than $10,000, $10,000 - $19,999, and $20,000 - $34,999 per year
Data Sources: Pima County GIS Library, US Census BureauMap prepared by: College of Architecture, Planning, and Landscape Architecture, University of Arizona Map prepared for: Family Housing Resources, IncMay 2016
Return to Document

Spatial Data: Pima County GIS LibraryMap prepared by: College of Architecture, Planning, and Landscape Architecture, University of Arizona Map prepared for: Family Housing Resources, IncMay 2016
71
Marana
Ajo
Vail
Picture Rocks
Three Points
Arivaca
Oro Valley
Green Valley
Catalina Foothills
Tanque Verde
Rincon Valley
Why
Catalina
Sahuarita
Avra Valley
Casas Adobes
Drexel Heights
Tucson Estates
Valencia West
Summit
Elephant Head
Pimaco Two
Corona de Tucson
Summerhaven
Flowing Wells
Arivaca Junction
South Tucson
Nelson
Willow Canyon
Littletown
Rillito
§̈¦10
§̈¦19
§̈¦10
¬«86
¬«286
¬«85
¬«386
¬«77
¬«85
¬«85
T u c s o n
Tohono O’Odham Nation
Tohono O’Odham San Xavier District
University of Arizona
Miles
0 12 ½ 25 50
N
Number of households earning less than $10,000 per year and paying 30% or more in housing costs
Map 2.1 - Cost Burdened Renter Households by Census Tractsource: American Community Survey 2013 5yr estimates B25074 - HOUSEHOLD INCOME BY GROSS RENT AS A PERCENTAGE OF HOUSEHOLD INCOME IN THE PAST 12 MONTHS
no data available
0
1
597
Return to Document

Spatial Data: Pima County GIS LibraryMap prepared by: College of Architecture, Planning, and Landscape Architecture, University of Arizona Map prepared for: Family Housing Resources, IncMay 2016
72
Marana
Ajo
Vail
Picture Rocks
Three Points
Arivaca
Oro Valley
Green Valley
Catalina Foothills
Tanque Verde
Rincon Valley
Why
Catalina
Sahuarita
Avra Valley
Casas Adobes
Drexel Heights
Tucson Estates
Valencia West
Summit
Elephant Head
Pimaco Two
Corona de Tucson
Summerhaven
Flowing Wells
Arivaca Junction
South Tucson
Nelson
Willow Canyon
Littletown
Rillito
§̈¦10
§̈¦19
§̈¦10
¬«86
¬«286
¬«85
¬«386
¬«77
¬«85
¬«85
T u c s o n
Tohono O’Odham Nation
Tohono O’Odham San Xavier District
University of Arizona
Number of households earning $10,000 - $19,999 per year and paying 30% or more in housing costs
no data available
0
1
672
Map 2.2 - Cost Burdened Renter Households by Census Tractsource: American Community Survey 2013 5yr estimates B25074 - HOUSEHOLD INCOME BY GROSS RENT AS A PERCENTAGE OF HOUSEHOLD INCOME IN THE PAST 12 MONTHS
Miles
0 12 ½ 25 50
N
Return to Document

Spatial Data: Pima County GIS LibraryMap prepared by: College of Architecture, Planning, and Landscape Architecture, University of Arizona Map prepared for: Family Housing Resources, IncMay 2016
73
Marana
Ajo
Vail
Picture Rocks
Three Points
Arivaca
Oro Valley
Green Valley
Catalina Foothills
Tanque Verde
Rincon Valley
Why
Catalina
Sahuarita
Avra Valley
Casas Adobes
Drexel Heights
Tucson Estates
Valencia West
Summit
Elephant Head
Pimaco Two
Corona de Tucson
Summerhaven
Flowing Wells
Arivaca Junction
South Tucson
Nelson
Willow Canyon
Littletown
Rillito
§̈¦10
§̈¦19
§̈¦10
¬«86
¬«286
¬«85
¬«386
¬«77
¬«85
¬«85
T u c s o n
Tohono O’Odham Nation
Tohono O’Odham San Xavier District
University of Arizona
Number of households earning $20,000 - $34,999 per year and paying 30% or more in housing costs
no data available
0
1
525
Map 2.3 - Cost Burdened Renter Households by Census Tractsource: American Community Survey 2013 5yr estimates B25074 - HOUSEHOLD INCOME BY GROSS RENT AS A PERCENTAGE OF HOUSEHOLD INCOME IN THE PAST 12 MONTHS
Miles
0 12 ½ 25 50
N
Return to Document
Marana
Ajo
Vail
Picture Rocks
Three Points
Arivaca
Oro Valley
Green Valley
Catalina Foothills
Tanque Verde
Rincon Valley
Why
Catalina
Sahuarita
Avra Valley
Casas Adobes
Drexel Heights
Tucson Estates
Valencia West
Summit
Elephant Head
Pimaco Two
Corona de Tucson
Summerhaven
Flowing Wells
Arivaca Junction
South Tucson
Nelson
Willow Canyon
Littletown
Rillito
§̈¦10
§̈¦19
§̈¦10
¬«86
¬«286
¬«85
¬«386
¬«77
¬«85
¬«85
T u c s o n
Tohono O’Odham Nation
Tohono O’Odham San Xavier District
Unincorporated Pima County
Census Designated Places
University of Arizona
Miles
0 12 ½ 25 50
N
74
Place Name less than $10,000 $10,000 - $19,999 $20,000 - $34,999
Tucson 13,658 20,178 14,705
Marana 34 134 666
Oro Valley 112 403 551
Sahuarita 0 163 216
South Tucson 192 300 160
Ajo 51 190 31
Arivaca 17 0 13
Arivaca Junction 43 0 0
Avra Valley 42 82 73
Casas Adobes 742 852 1,785
Catalina 15 41 113
Catalina Foothills 319 613 811
Corona de Tucson 0 16 0
Drexel Heights 277 369 252
Elephant Head 0 0 0
Flowing Wells 254 285 320
Place Name less than $10,000 $10,000 - $19,999 $20,000 - $34,999
Green Valley 71 411 304
Littletown 24 15 0
Nelson 6 0 0
Picture Rocks 17 34 33
Pimaco Two 0 0 0
Rillito 59 0 0
Rincon Valley 0 0 0
Summerhaven 0 0 0
Summit 58 90 26
Tanque Verde 18 32 113
Three Points 30 117 64
Tucson Estates 27 22 48
Vail 0 38 26
Valencia West 12 44 70
Why 0 0 0
Willow Canyon 0 0 0
Tohono O’Odham Nation
Tohono O’Odham San Xavier District
Unincorporated Pima County
Census Designated Places
University of Arizona
Miles
0 12 ½ 25 50
N
Number of renter households earning less than $10,000, $10,000 - $19,999, and $20,000 - $34,999 per year and paying 30% or more in housing costs
Map 2.4 - Cost Burdened Renter Households by Census Designated Placesource: American Community Survey 2013 5yr estimates B25074 - HOUSEHOLD INCOME BY GROSS RENT AS A PERCENTAGE OF HOUSEHOLD INCOME IN THE PAST 12 MONTHS
Data Sources: Pima County GIS Library, US Census BureauMap prepared by: College of Architecture, Planning, and Landscape Architecture, University of Arizona Map prepared for: Family Housing Resources, IncMay 2016

Spatial Data: Pima County GIS LibraryMap prepared by: College of Architecture, Planning, and Landscape Architecture, University of Arizona Map prepared for: Family Housing Resources, IncMay 2016
75
Marana
Ajo
Vail
Picture Rocks
Three Points
Arivaca
Oro Valley
Green Valley
Catalina Foothills
Tanque Verde
Rincon Valley
Why
Catalina
Sahuarita
Avra Valley
Casas Adobes
Drexel Heights
Tucson Estates
Valencia West
Summit
Elephant Head
Pimaco Two
Corona de Tucson
Summerhaven
Flowing Wells
Arivaca Junction
South Tucson
Nelson
Willow Canyon
Littletown
Rillito
§̈¦10
§̈¦19
§̈¦10
¬«86
¬«286
¬«85
¬«386
¬«77
¬«85
¬«85
T u c s o n
Tohono O’Odham Nation
Tohono O’Odham San Xavier District
University of Arizona
Number of households earning less than $10,000 per year and paying 30% or more in housing costs
Map 2.5 - Cost Burdened Owner Households by Census Tract source: American Community Survey 2013 5yr estimates C25095 - HOUSEHOLD INCOME BY SELECTED MONTHLY OWNER COSTS AS A PERCENTAGE OF HOUSEHOLD INCOME IN THE PAST 12 MONTHS
no data available
0
1
180
Miles
0 12 ½ 25 50
N
Return to Document

Spatial Data: Pima County GIS LibraryMap prepared by: College of Architecture, Planning, and Landscape Architecture, University of Arizona Map prepared for: Family Housing Resources, IncMay 2016
76
Marana
Ajo
Vail
Picture Rocks
Three Points
Arivaca
Oro Valley
Green Valley
Catalina Foothills
Tanque Verde
Rincon Valley
Why
Catalina
Sahuarita
Avra Valley
Casas Adobes
Drexel Heights
Tucson Estates
Valencia West
Summit
Elephant Head
Pimaco Two
Corona de Tucson
Summerhaven
Flowing Wells
Arivaca Junction
South Tucson
Nelson
Willow Canyon
Littletown
Rillito
§̈¦10
§̈¦19
§̈¦10
¬«86
¬«286
¬«85
¬«386
¬«77
¬«85
¬«85
T u c s o n
Tohono O’Odham Nation
Tohono O’Odham San Xavier District
University of Arizona
no data available
0
1
239
Number of households earning $10,000 - $19,999 per year and paying 30% or more in housing costs
Map 2.6 - Cost Burdened Owner Households by Census Tract source: American Community Survey 2013 5yr estimates C25095 - HOUSEHOLD INCOME BY SELECTED MONTHLY OWNER COSTS AS A PERCENTAGE OF HOUSEHOLD INCOME IN THE PAST 12 MONTHS
Miles
0 12 ½ 25 50
N
Return to Document

Spatial Data: Pima County GIS LibraryMap prepared by: College of Architecture, Planning, and Landscape Architecture, University of Arizona Map prepared for: Family Housing Resources, IncMay 2016
77
Marana
Ajo
Vail
Picture Rocks
Three Points
Arivaca
Oro Valley
Green Valley
Catalina Foothills
Tanque Verde
Rincon Valley
Why
Catalina
Sahuarita
Avra Valley
Casas Adobes
Drexel Heights
Tucson Estates
Valencia West
Summit
Elephant Head
Pimaco Two
Corona de Tucson
Summerhaven
Flowing Wells
Arivaca Junction
South Tucson
Nelson
Willow Canyon
Littletown
Rillito
§̈¦10
§̈¦19
§̈¦10
¬«86
¬«286
¬«85
¬«386
¬«77
¬«85
¬«85
T u c s o n
Tohono O’Odham Nation
Tohono O’Odham San Xavier District
no data available
0
1
290
University of Arizona
Number of households earning $20,000 - $34,999 per year and paying 30% or more in housing costs
Map 2.7 - Cost Burdened Owner Households by Census Tract source: American Community Survey 2013 5yr estimates C25095 - HOUSEHOLD INCOME BY SELECTED MONTHLY OWNER COSTS AS A PERCENTAGE OF HOUSEHOLD INCOME IN THE PAST 12 MONTHS
Miles
0 12 ½ 25 50
N
Return to Document

Marana
Ajo
Vail
Picture Rocks
Three Points
Arivaca
Oro Valley
Green Valley
Catalina Foothills
Tanque Verde
Rincon Valley
Why
Catalina
Sahuarita
Avra Valley
Casas Adobes
Drexel Heights
Tucson Estates
Valencia West
Summit
Elephant Head
Pimaco Two
Corona de Tucson
Summerhaven
Flowing Wells
Arivaca Junction
South Tucson
Nelson
Willow Canyon
Littletown
Rillito
§̈¦10
§̈¦19
§̈¦10
¬«86
¬«286
¬«85
¬«386
¬«77
¬«85
¬«85
T u c s o n
Tohono O’Odham Nation
Tohono O’Odham San Xavier District
Unincorporated Pima County
Census Designated Places
University of Arizona
Miles
0 12 ½ 25 50
N
78
Place Name less than $10,000 $10,000 - $19,999 $20,000 - $34,999
Tucson 3,551 5,808 8,917
Marana 81 374 574
Oro Valley 112 337 599
Sahuarita 98 202 303
South Tucson 25 71 72
Ajo 103 48 41
Arivaca 0 19 0
Arivaca Junction 0 0 18
Avra Valley 70 74 90
Casas Adobes 419 949 1107
Catalina 116 98 265
Catalina Foothills 216 590 1175
Corona de Tucson 0 31 41
Drexel Heights 235 522 792
Elephant Head 4 20 0
Flowing Wells 347 492 278
Place Name less than $10,000 $10,000 - $19,999 $20,000 - $34,999
Green Valley 249 457 583
Littletown 0 0 33
Nelson 0 0 25
Picture Rocks 84 120 110
Pimaco Two 0 11 47
Rillito 0 0 0
Rincon Valley 15 45 119
Summerhaven 0 0 0
Summit 40 101 120
Tanque Verde 42 167 255
Three Points 126 120 139
Tucson Estates 221 181 374
Vail 25 114 167
Valencia West 88 126 418
Why 5 0 0
Willow Canyon 0 0 0
Tohono O’Odham Nation
Tohono O’Odham San Xavier District
Unincorporated Pima County
Census Designated Places
University of Arizona
Miles
0 12 ½ 25 50
N
Number of owner households earning less than $10,000, $10,000 - $19,999, and $20,000 - $34,999 per year and paying 30% or more in housing costs
Map 2.8 - Cost Burdened Owner Households by Census Designated Placesource: American Community Survey 2013 5yr estimates C25095 - HOUSEHOLD INCOME BY SELECTED MONTHLY OWNER COSTS AS A PERCENTAGE OF HOUSEHOLD INCOME IN THE PAST 12 MONTHS
Data Sources: Pima County GIS Library, US Census BureauMap prepared by: College of Architecture, Planning, and Landscape Architecture, University of Arizona Map prepared for: Family Housing Resources, IncMay 2016

Spatial Data: Pima County GIS LibraryMap prepared by: College of Architecture, Planning, and Landscape Architecture, University of Arizona Map prepared for: Family Housing Resources, IncMay 2016
79
Marana
Ajo
Vail
Picture Rocks
Three Points
Arivaca
Oro Valley
Green Valley
Catalina Foothills
Tanque Verde
Rincon Valley
Why
Catalina
Sahuarita
Avra Valley
Casas Adobes
Drexel Heights
Tucson Estates
Valencia West
Summit
Elephant Head
Pimaco Two
Corona de Tucson
Summerhaven
Flowing Wells
Arivaca Junction
South Tucson
Nelson
Willow Canyon
Littletown
Rillito
§̈¦10
§̈¦19
§̈¦10
¬«86
¬«286
¬«85
¬«386
¬«77
¬«85
¬«85
T u c s o n
Tohono O’Odham Nation
Tohono O’Odham San Xavier District
University of Arizona
Number of households paying less than $349 in rent per month
no data available
0
1
349
Map 3.1 - Gross Rent by Census Tractsource: American Community Survey 2013 5yr estimates B25063 - GROSS RENT
Miles
0 12 ½ 25 50
N
Return to Document

Spatial Data: Pima County GIS LibraryMap prepared by: College of Architecture, Planning, and Landscape Architecture, University of Arizona Map prepared for: Family Housing Resources, IncMay 2016
80
Marana
Ajo
Vail
Picture Rocks
Three Points
Arivaca
Oro Valley
Green Valley
Catalina Foothills
Tanque Verde
Rincon Valley
Why
Catalina
Sahuarita
Avra Valley
Casas Adobes
Drexel Heights
Tucson Estates
Valencia West
Summit
Elephant Head
Pimaco Two
Corona de Tucson
Summerhaven
Flowing Wells
Arivaca Junction
South Tucson
Nelson
Willow Canyon
Littletown
Rillito
§̈¦10
§̈¦19
§̈¦10
¬«86
¬«286
¬«85
¬«386
¬«77
¬«85
¬«85
T u c s o n
Tohono O’Odham Nation
Tohono O’Odham San Xavier District
University of Arizona
no data available
0
1
987
Map 3.2 - Gross Rent by Census Tractsource: American Community Survey 2013 5yr estimates B25063 - GROSS RENT
Number of households paying less than $549 in rent per month
Miles
0 12 ½ 25 50
N
Return to Document

Spatial Data: Pima County GIS LibraryMap prepared by: College of Architecture, Planning, and Landscape Architecture, University of Arizona Map prepared for: Family Housing Resources, IncMay 2016
81
Marana
Ajo
Vail
Picture Rocks
Three Points
Arivaca
Oro Valley
Green Valley
Catalina Foothills
Tanque Verde
Rincon Valley
Why
Catalina
Sahuarita
Avra Valley
Casas Adobes
Drexel Heights
Tucson Estates
Valencia West
Summit
Elephant Head
Pimaco Two
Corona de Tucson
Summerhaven
Flowing Wells
Arivaca Junction
South Tucson
Nelson
Willow Canyon
Littletown
Rillito
§̈¦10
§̈¦19
§̈¦10
¬«86
¬«286
¬«85
¬«386
¬«77
¬«85
¬«85
T u c s o n
Tohono O’Odham Nation
Tohono O’Odham San Xavier District
University of Arizona
no data available
0
1
2098
Map 3.3 - Gross Rent by Census Tractsource: American Community Survey 2013 5yr estimates B25063 - GROSS RENT
Number of households paying less than $899 in rent per month
Miles
0 12 ½ 25 50
N
Return to Document

Marana
Ajo
Vail
Picture Rocks
Three Points
Arivaca
Oro Valley
Green Valley
Catalina Foothills
Tanque Verde
Rincon Valley
Why
Catalina
Sahuarita
Avra Valley
Casas Adobes
Drexel Heights
Tucson Estates
Valencia West
Summit
Elephant Head
Pimaco Two
Corona de Tucson
Summerhaven
Flowing Wells
Arivaca Junction
South Tucson
Nelson
Willow Canyon
Littletown
Rillito
§̈¦10
§̈¦19
§̈¦10
¬«86
¬«286
¬«85
¬«386
¬«77
¬«85
¬«85
T u c s o n
Tohono O’Odham Nation
Tohono O’Odham San Xavier District
Unincorporated Pima County
Census Designated Places
University of Arizona
Miles
0 12 ½ 25 50
N
Spatial Data: Pima County GIS LibraryMap prepared by: College of Architecture, Planning, and Landscape Architecture, University of Arizona Map prepared for: Family Housing Resources, IncMay 2016
82
Tohono O’Odham Nation
Tohono O’Odham San Xavier District
Unincorporated Pima County
Census Designated Places
University of Arizona
Miles
0 12 ½ 25 50
N
Number of renter households paying less han $349, $549, and $899 per month
Map 3.4 - Gross Rent by Census Designated Placesource: American Community Survey 2013 5yr estimates B25063 - GROSS RENT
Place Name less than $349 less than $549 less than $899
Tucson 4,242 20,285 66,109
Marana 24 57 761
Oro Valley 0 101 1,314
Sahuarita 0 0 288
South Tucson 103 639 955
Ajo 6 173 335
Arivaca 0 15 61
Arivaca Junction 0 38 43
Avra Valley 52 79 248
Casas Adobes 85 220 3,548
Catalina 0 25 192
Catalina Foothills 40 332 2,731
Corona de Tucson 0 0 23
Drexel Heights 52 218 1,010
Elephant Head 0 0 2
Flowing Wells 46 371 1,237
Place Name less than $349 less than $549 less than $899
Green Valley 85 220 800
Littletown 0 24 39
Nelson 0 6 6
Picture Rocks 0 28 231
Pimaco Two 0 15 37
Rillito 0 59 59
Rincon Valley 0 76 109
Summerhaven 0 0 0
Summit 21 123 250
Tanque Verde 0 33 112
Three Points 6 35 173
Tucson Estates 0 132 260
Vail 0 0 0
Valencia West 0 16 44
Why 0 0 0
Willow Canyon 0 0 0
Data Sources: Pima County GIS Library, US Census BureauMap prepared by: College of Architecture, Planning, and Landscape Architecture, University of Arizona Map prepared for: Family Housing Resources, IncMay 2016

Spatial Data: Pima County GIS LibraryMap prepared by: College of Architecture, Planning, and Landscape Architecture, University of Arizona Map prepared for: Family Housing Resources, IncMay 2016
83
Marana
Ajo
Vail
Picture Rocks
Three Points
Arivaca
Oro Valley
Green Valley
Catalina Foothills
Tanque Verde
Rincon Valley
Why
Catalina
Sahuarita
Avra Valley
Casas Adobes
Drexel Heights
Tucson Estates
Valencia West
Summit
Elephant Head
Pimaco Two
Corona de Tucson
Summerhaven
Flowing Wells
Arivaca Junction
South Tucson
Nelson
Willow Canyon
Littletown
Rillito
§̈¦10
§̈¦19
§̈¦10
¬«86
¬«286
¬«85
¬«386
¬«77
¬«85
¬«85
T u c s o n
Tohono O’Odham Nation
Tohono O’Odham San Xavier District
University of Arizona
Number of owner households paying less than $399 per month
Map 3.5 - Monthly Owner Costs by Census Tractsource: American Community Survey 2013 5yr estimates B25094 - SELECTED MONTHLY OWNER COSTS
no data available
0
1
926
Miles
0 12 ½ 25 50
N
Return to Document

Spatial Data: Pima County GIS LibraryMap prepared by: College of Architecture, Planning, and Landscape Architecture, University of Arizona Map prepared for: Family Housing Resources, IncMay 2016
84
Marana
Ajo
Vail
Picture Rocks
Three Points
Arivaca
Oro Valley
Green Valley
Catalina Foothills
Tanque Verde
Rincon Valley
Why
Catalina
Sahuarita
Avra Valley
Casas Adobes
Drexel Heights
Tucson Estates
Valencia West
Summit
Elephant Head
Pimaco Two
Corona de Tucson
Summerhaven
Flowing Wells
Arivaca Junction
South Tucson
Nelson
Willow Canyon
Littletown
Rillito
§̈¦10
§̈¦19
§̈¦10
¬«86
¬«286
¬«85
¬«386
¬«77
¬«85
¬«85
T u c s o n
Tohono O’Odham Nation
Tohono O’Odham San Xavier District
University of Arizona
no data available
0
1
1419
Number of owner households paying less than $599 per month
Map 3.6 - Monthly Owner Costs by Census Tractsource: American Community Survey 2013 5yr estimates B25094 - SELECTED MONTHLY OWNER COSTS
Miles
0 12 ½ 25 50
N
Return to Document

Spatial Data: Pima County GIS LibraryMap prepared by: College of Architecture, Planning, and Landscape Architecture, University of Arizona Map prepared for: Family Housing Resources, IncMay 2016
85
Marana
Ajo
Vail
Picture Rocks
Three Points
Arivaca
Oro Valley
Green Valley
Catalina Foothills
Tanque Verde
Rincon Valley
Why
Catalina
Sahuarita
Avra Valley
Casas Adobes
Drexel Heights
Tucson Estates
Valencia West
Summit
Elephant Head
Pimaco Two
Corona de Tucson
Summerhaven
Flowing Wells
Arivaca Junction
South Tucson
Nelson
Willow Canyon
Littletown
Rillito
§̈¦10
§̈¦19
§̈¦10
¬«86
¬«286
¬«85
¬«386
¬«77
¬«85
¬«85
T u c s o n
Tohono O’Odham Nation
Tohono O’Odham San Xavier District
University of Arizona
no data available
0
1
1693
Number of owner households paying less than $899 per month
Map 3.7 - Monthly Owner Costs by Census Tractsource: American Community Survey 2013 5yr estimates B25094 - SELECTED MONTHLY OWNER COSTS
Miles
0 12 ½ 25 50
N
Return to Document

Marana
Ajo
Vail
Picture Rocks
Three Points
Arivaca
Oro Valley
Green Valley
Catalina Foothills
Tanque Verde
Rincon Valley
Why
Catalina
Sahuarita
Avra Valley
Casas Adobes
Drexel Heights
Tucson Estates
Valencia West
Summit
Elephant Head
Pimaco Two
Corona de Tucson
Summerhaven
Flowing Wells
Arivaca Junction
South Tucson
Nelson
Willow Canyon
Littletown
Rillito
§̈¦10
§̈¦19
§̈¦10
¬«86
¬«286
¬«85
¬«386
¬«77
¬«85
¬«85
T u c s o n
Tohono O’Odham Nation
Tohono O’Odham San Xavier District
Unincorporated Pima County
Census Designated Places
University of Arizona
Miles
0 12 ½ 25 50
N
Spatial Data: Pima County GIS LibraryMap prepared by: College of Architecture, Planning, and Landscape Architecture, University of Arizona Map prepared for: Family Housing Resources, IncMay 2016
86
Place Name less than $399 less than $599 less than $899
Tucson 19,056 32,607 42,348
Marana 946 1,959 2,372
Oro Valley 1,506 3,525 4,515
Sahuarita 774 1,842 2,056
South Tucson 153 234 318
Ajo 603 719 835
Arivaca 125 167 255
Arivaca Junction 44 59 104
Avra Valley 445 686 766
Casas Adobes 2,213 4,587 5,996
Catalina 457 787 1,100
Catalina Foothills 1,060 3,213 4,936
Corona de Tucson 77 195 270
Drexel Heights 1,160 1,839 2,425
Elephant Head 34 38 51
Flowing Wells 1,614 2,713 3,233
Place Name less than $399 less than $599 less than $899
Green Valley 5,104 6,936 7,991
11 39 52
Nelson 3 7 38
Picture Rocks 404 848 1,190
Pimaco Two 70 97 114
Rillito 33 33 33
Rincon Valley 93 181 322
Summerhaven 0 14 14
Summit 224 379 495
Tanque Verde 318 998 1,550
Three Points 295 558 708
Tucson Estates 1,468 2,050 2,548
Vail 280 541 669
Valencia West 296 456 552
Why 63 63 63
Willow Canyon 0 0 0
San Xavier District
Unincorporated Pima County
Census Designated Places
University of Arizona
Miles
0 12 ½ 25 50
N
Number of owner households paying less han $399, $599, and $899 per month in housing costs
Map 3.8 - Monthly Owner Costs by Census Designated Placesource: American Community Survey 2013 5yr estimates B25094 - SELECTED MONTHLY OWNER COSTS
Data Sources: Pima County GIS Library, US Census BureauMap prepared by: College of Architecture, Planning, and Landscape Architecture, University of Arizona Map prepared for: Family Housing Resources, IncMay 2016

Spatial Data: Pima County GIS LibraryMap prepared by: College of Architecture, Planning, and Landscape Architecture, University of Arizona Map prepared for: Family Housing Resources, IncMay 2016
87
Marana
Vail
Picture Rocks
Three Points
Oro Valley
Sahuarita
Catalina Foothills
Tanque Verde
Rincon Valley
Avra Valley
Casas Adobes
Drexel Heights
Catalina
Green Valley
Tucson Estates
Valencia West
Summit
Summerhaven
Flowing Wells
Corona de Tucson
South Tucson
Nelson
Willow Canyon
Littletown
Rillito
§̈¦10
§̈¦19
§̈¦10
§̈¦19
¬«286
¬«86
¬«77
T u c s o n
Map 3.9 - Income Restricted Housing by location and target groupsources: U.S Department of Housing and Urban Development LIHTC database, National Housing Preservation Database,Pima County Housing Search, Pima Council on Aging, Arizona Department of Housing, Arizona Department of Housing LIHTC Projects 1987 – 2014, MF Properties with Assistance and Section8 contracts Pima County, Credio Low Income Housing, Southern Arizona Land Trust, Habitat for Humanity, Primavera, Pima County Neighborhood Stabilization Program Properties, Pima County Community Development and Neighborhood Conservation Department
Unincorporated Pima County
Census Designated Places
General Occupancy
Elderly
Elderly/Disabled
Disabled/Mentally Ill/Special needs
Other
Unknown
University of Arizona
1 - 2 units
3 - 60 units
61 - 120 units
121 - 200 units
201 - 408 units
Unmapped properties
Property Name Contact CompanyNumber of
Affordable UnitsTarget Residents Group/Non-income Restrictions
Alamo Apartments Primavera Foundation 13 Elderly (Age 62+)/men
El Portal scattered SitesHousing and Community
Development Tucson286 General Occupancy
Scattered Sites "AMP 5 Scattered Site"
Housing and Community Development Tucson
231 General Occupancy/Disabled/Elderly
Women in Transition Primavera Foundation 12 Transitional - Women
Hope VI Lease Purchase Unknown 11 Unknown
La Causa Lease Purchase Unknown 9 Unknown
TMM Fairhaven North and South Apartments
TMM Family Services 9 Transitional - Single Women with Children
Tucson CNSRT Unknown 8 Unknown
Total Units 579
30 u
nit a
rtis
t liv
e-w
ork
prop
erty
off-
map
- A
jo, A
rizo
na
Miles
0 10 20
N
Return to Document

Spatial Data: Pima County GIS LibraryMap prepared by: College of Architecture, Planning, and Landscape Architecture, University of Arizona Map prepared for: Family Housing Resources, IncMay 2016
88
Marana
Ajo
Vail
Picture Rocks
Three Points
Arivaca
Oro Valley
Green Valley
Catalina Foothills
Tanque Verde
Rincon Valley
Why
Catalina
Sahuarita
Avra Valley
Casas Adobes
Drexel Heights
Tucson Estates
Valencia West
Summit
Elephant Head
Pimaco Two
Corona de Tucson
Summerhaven
Flowing Wells
Arivaca Junction
South Tucson
Nelson
Willow Canyon
Littletown
Rillito
§̈¦10
§̈¦19
§̈¦10
¬«86
¬«286
¬«85
¬«386
¬«77
¬«85
¬«85
T u c s o n
Tohono O’Odham Nation
Tohono O’Odham San Xavier District
University of Arizona
Miles
0 12 ½ 25 50
Nno data available
Not Eligible for Gentrification
Eligible for Gentrification
Census Tracts Determined to Be Eligible for Gentrification
Map 4.1 - Eligible Gentrified Tractssource: ACS 2014 (5 year estimates) and 2000 Census Summary files
Map 4.1 shows the 65 eligible tracts for gentrification in the County. In other words, only areas that had lower education levels, incomes, rents, and home values could be gentrified because gentrification is a process that occurs in these types of neighborhoods. Second, change over time values were calculated for each of the four metrics. Specifically, the county-wide mean change for each metric was calculated for the period 2000 to 2014.
Return to Document

Spatial Data: Pima County GIS LibraryMap prepared by: College of Architecture, Planning, and Landscape Architecture, University of Arizona Map prepared for: Family Housing Resources, IncMay 2016
89
Marana
Ajo
Vail
Picture Rocks
Three Points
Arivaca
Oro Valley
Green Valley
Catalina Foothills
Tanque Verde
Rincon Valley
Why
Catalina
Sahuarita
Avra Valley
Casas Adobes
Drexel Heights
Tucson Estates
Valencia West
Summit
Elephant Head
Pimaco Two
Corona de Tucson
Summerhaven
Flowing Wells
Arivaca Junction
South Tucson
Nelson
Willow Canyon
Littletown
Rillito
§̈¦10
§̈¦19
§̈¦10
¬«86
¬«286
¬«85
¬«386
¬«77
¬«85
¬«85
T u c s o n
Tohono O’Odham Nation
Tohono O’Odham San Xavier District
University of Arizona
Miles
0 12 ½ 25 50
Nno data available
Tracts that have not experienced gentrification
Tracts that have experienced gentrification
Census Tracts Determined to Have Experienced Gentrification
Map 4.2 - Gentrified Tractssource: ACS 2014 (5 year estimates) and 2000 Census Summary files
Tracts were classified as having experienced gentrification if three or more of the gentrification metrics (education levels, incomes, rents, and home values) changed by at least the county-wide mean change. Map 4.2 shows the location of the 7 tracts (out of 241 tracts in the county) that experienced gentrification according to this definition. Most gentrified tracts are clustered in the central and mid-town portions of Tucson. Specifically, 4 out of the 7 gentrified tracts are in downtown Tucson.
Return to Document

Spatial Data: Pima County GIS LibraryMap prepared by: College of Architecture, Planning, and Landscape Architecture, University of Arizona Map prepared for: Family Housing Resources, IncMay 2016
90
Marana
Vail
Picture Rocks
Three Points
Oro Valley
Sahuarita
Catalina Foothills
Tanque Verde
Rincon Valley
Avra Valley
Casas Adobes
Drexel Heights
Catalina
Green Valley
Tucson Estates
Valencia West
Summit
Summerhaven
Flowing Wells
Corona de Tucson
South Tucson
Nelson
Willow Canyon
Littletown
Rillito
§̈¦10
§̈¦19
§̈¦10
§̈¦19
¬«286
¬«86
¬«77
T u c s o n
Map 6.1 - Transportation Costs by Locationsources: HUD Location Affordability Index (LAI) data, 2008-2012, U.S Department of Housing and Urban Development LIHTC database, National Housing Preservation Database,Pima County Housing Search, Pima Council on Aging, Arizona Department of Housing, Arizona Department of Housing LIHTC Projects 1987 – 2014, MF Properties with Assistance and Section8 contracts Pima County, Credio Low Income Housing, Southern Arizona Land Trust, Habitat for Humanity, Primavera, Pima County Neighborhood Stabilization Program Properties, Pima County Community Development and Neighborhood Conservation Department
no data available
0 - 25
26 - 49
50 - 74
75 - 82
General Occupancy
Elderly
Elderly/Disabled
Disabled/Mentally Ill/Special needs
Other
Unknown
University of Arizona
1 - 2 units
3 - 60 units
61 - 120 units
121 - 200 units
201 - 408 units
Map 6.1 shows that only a few of the income restricted properties are located in neighborhoods with the lowest transportation costs, which are located in downtown Tucson. Most, however, are located where transportation costs are below the national average; however there are some properties that have been developed in more expensive locations.
Summary from HUD.gov: This index is based on estimates of transportation costs for a family that meets the following description: a 3-person single-parent family with income at 50% of the median income for renters for the region (i.e. CBSA). The estimates come from the Location Affordability Index (LAI). The data correspond to those for household type 6 (hh_type6_) as noted in the LAI data dictionary. More specifically, among this household type, we model transportation costs as a percent of income for renters (t_rent). Neighborhoods are defined as census tracts. The LAI data do not contain transportation cost information for Puerto Rico.InterpretationValues are inverted and percentile ranked nationally, with values ranging from 0 to 100. The higher the transportation cost index, the lower the cost of transportation in that neighborhood. Transportation costs may be low for a range of reasons, including greater access to public transportation and the density of homes, services, and jobs in the neighborhood and surrounding community.
Data is current as of 6/15/2015
Miles
0 10 20
N
HUD Transportation Cost Index - by census tract
30 u
nit a
rtis
t liv
e-w
ork
prop
erty
off-
map
- A
jo, A
rizo
na
Return to Document

Spatial Data: Pima County GIS LibraryMap prepared by: College of Architecture, Planning, and Landscape Architecture, University of Arizona Map prepared for: Family Housing Resources, IncMay 2016
91
Marana
Vail
Picture Rocks
Three Points
Oro Valley
Sahuarita
Catalina Foothills
Tanque Verde
Rincon Valley
Avra Valley
Casas Adobes
Drexel Heights
Catalina
Green Valley
Tucson Estates
Valencia West
Summit
Summerhaven
Flowing Wells
Corona de Tucson
South Tucson
Nelson
Willow Canyon
Littletown
Rillito
§̈¦10
§̈¦19
§̈¦10
§̈¦19
¬«286
¬«86
¬«77
T u c s o n
Source: Esri, DigitalGlobe, GeoEye, Earthstar Geographics, CNES/Airbus DS, USDA, USGS, AEX, Getmapping, Aerogrid, IGN, IGP, swisstopo,and the GIS User Community
Map 6.2 - Workers Earning $1250 per Month or Less (Home Location)sources: US Census Longitudinal Employer-Household Dynamics program, US EPA Smart Location Database, U.S Department of Housing and Urban Development LIHTC database, National Housing Preservation Database,Pima County Housing Search, Pima Council on Aging, Arizona Department of Housing, Arizona Department of Housing LIHTC Projects 1987 – 2014, MF Properties with Assistance and Section8 contracts Pima County, Credio Low Income Housing, Southern Arizona Land Trust, Habitat for Humanity, Primavera, Pima County Neighborhood Stabilization Program Properties, Pima County Community Development and Neighborhood Conservation Department
0 - 25
26 - 49
50 - 99
100 - 199
General Occupancy
Elderly
Elderly/Disabled
Disabled/Mentally Ill/Special needs
Other
Unknown
University of Arizona
1 - 2 units
3 - 60 units
61 - 120 units
121 - 200 units
201 - 408 units
200 - 499
500 - 749
750 - 1000
1000 - 4392
This map shows the location of income restricted units in comparison to the location of jobs held by workers earning $1250/month or less, based on workplace location in 2010. These data come from the US Census Longitudinal Employer-Household Dynamics program and the US EPA Smart Location Database. The results show that some lower income job concentrations may be underserved by income restricted housing, including parts of Casas Adobes, Davis-Monthan Air Force Base, Tucson Medical Center, and Park Place Mall.
Smart Location Database - number of workers earning 1250 per month or less by census block group
Income Restricted Housing by location and target group
30 u
nit a
rtis
t liv
e-w
ork
prop
erty
off-
map
- A
jo, A
rizo
na
Miles
0 10 20
N
Return to Document

Spatial Data: Pima County GIS LibraryMap prepared by: College of Architecture, Planning, and Landscape Architecture, University of Arizona Map prepared for: Family Housing Resources, IncMay 2016
92
§̈¦10§̈¦19
§̈¦10
§̈¦19
¬«77
¬«86
T u c s o n
Sources: Esri, HERE, DeLorme, USGS, Intermap, increment P Corp., NRCAN, Esri Japan, METI, Esri China (Hong Kong), Esri (Thailand),MapmyIndia, © OpenStreetMap contributors, and the GIS User Community
Map 6.3 - Areas in Pima County with a Walkscore of 70 or moresources: Walkscore.com, U.S Department of Housing and Urban Development LIHTC database, National Housing Preservation Database,Pima County Housing Search, Pima Council on Aging, Arizona Department of Housing, Arizona Department of Housing LIHTC Projects 1987 – 2014, MF Properties with Assistance and Section8 contracts Pima County, Credio Low Income Housing, Southern Arizona Land Trust, Habitat for Humanity, Primavera, Pima County Neighborhood Stabilization Program Properties, Pima County Community Development and Neighborhood Conservation Department
Walkscore of 70 or more
General Occupancy
Elderly
Elderly/Disabled
Disabled/Mentally Ill/Special needs
Other
Unknown
University of Arizona
Miles
0 3 6
1 - 2 units
3 - 60 units
61 - 120 units
121 - 200 units
201 - 408 units
Walk Score is a measure of walkability, or the ability of residents in an area to walk to desired locations such as shopping, services, parks, and schools. Walkability was noted by stakeholders and providers as a desirable attribute for income restricted affordable housing locations. Map 6.3 compares locations with a Walk Score of 70 or more (out of 100) to the location of income restricted properties. A score of 70+ is considered “very walkable” because most errands can be accomplished on foot. Most income restricted units in Pima County are not sited in very walkable locations, although there are not many highly walkable locations.
From Walkscore.com:
90–100 Walker’s Paradise Daily errands do not require a car
70–89 Very Walkable Most errands can be accomplished on foot
N
Income Restricted Housing by location and target group
Return to Document

Spatial Data: Pima County GIS LibraryMap prepared by: College of Architecture, Planning, and Landscape Architecture, University of Arizona Map prepared for: Family Housing Resources, IncMay 2016
93
§̈¦10
§̈¦19
§̈¦10
§̈¦19
¬«286
¬«86
¬«77
T u c s o n
Sources: Esri, HERE, DeLorme, USGS, Intermap, increment P Corp., NRCAN, Esri Japan, METI, Esri China (Hong Kong), Esri (Thailand),MapmyIndia, © OpenStreetMap contributors, and the GIS User Community
Map 6.4 - Locations Walkable to Transit sources: U.S Department of Housing and Urban Development LIHTC database, National Housing Preservation Database,Pima County Housing Search, Pima Council on Aging, Arizona Department of Housing, Arizona Department of Housing LIHTC Projects 1987 – 2014, MF Properties with Assistance and Section8 contracts Pima County, Credio Low Income Housing, Southern Arizona Land Trust, Habitat for Humanity, Primavera, Pima County Neighborhood Stabilization Program Properties, Pima County Community Development and Neighborhood Conservation Department
1/2 mile radius around streetcar stations
1/4 mile radius around streetcar stations
1/2 mile radius around bus stops
1/4 mile radius around bus stops
General Occupancy
Elderly
Elderly/Disabled
Disabled/Mentally Ill/Special needs
Other
Unknown
University of Arizona
1 - 2 units
3 - 60 units
61 - 120 units
121 - 200 units
201 - 408 units
30 u
nit a
rtis
t liv
e-w
ork
prop
erty
off-
map
- A
jo, A
rizo
na
Income Restricted Housing by location and target group
Proximety to transit
Miles
0 10 20
N
We surveyed both providers and stakeholders to see where future affordable housing should be prioritized in terms of geography and access to services. The surveys indicated that lower income housing should be located where there is good bus or streetcar service. Map 6.4 shows all locations within ½ and ¼ mile of a bus or transit stop, which are normal standards for walking distance to a transit stop. About three dozen income restricted properties are more than ¼ mile from a bus or streetcar stop, though nearly all properties are within ½ mile of those locations.
Return to Document

Spatial Data: Pima County GIS LibraryMap prepared by: College of Architecture, Planning, and Landscape Architecture, University of Arizona Map prepared for: Family Housing Resources, IncMay 2016
94
Marana
Ajo
Vail
Picture Rocks
Three Points
Arivaca
Oro Valley
Green Valley
Catalina Foothills
Tanque Verde
Rincon Valley
Why
Catalina
Sahuarita
Avra Valley
Casas Adobes
Drexel Heights
Tucson Estates
Valencia West
Summit
Elephant Head
Pimaco Two
Corona de Tucson
Summerhaven
Flowing Wells
Arivaca Junction
South Tucson
Nelson
Willow Canyon
Littletown
Rillito
§̈¦10
§̈¦19
§̈¦10
¬«86
¬«286
¬«85
¬«386
¬«77
¬«85
¬«85
T u c s o n
Tohono O’Odham Nation
Tohono O’Odham San Xavier District
University of Arizona
no data available
0
1
94
Map B1 - Renter Occupied Mobile Homes by Census Tractsource: American Community Survey 2013 5yr estimates BS2504 - PHYSICAL HOUSING CHARACTERISTICS FOR OCCUPIED HOUSING UNITS
Renter Occupied Mobile Homes per census tract
Miles
0 12 ½ 25 50
N

Spatial Data: Pima County GIS LibraryMap prepared by: College of Architecture, Planning, and Landscape Architecture, University of Arizona Map prepared for: Family Housing Resources, IncMay 2016
95
Marana
Ajo
Vail
Picture Rocks
Three Points
Arivaca
Oro Valley
Green Valley
Catalina Foothills
Tanque Verde
Rincon Valley
Why
Catalina
Sahuarita
Avra Valley
Casas Adobes
Drexel Heights
Tucson Estates
Valencia West
Summit
Elephant Head
Pimaco Two
Corona de Tucson
Summerhaven
Flowing Wells
Arivaca Junction
South Tucson
Nelson
Willow Canyon
Littletown
Rillito
§̈¦10
§̈¦19
§̈¦10
¬«86
¬«286
¬«85
¬«386
¬«77
¬«85
¬«85
T u c s o n
Tohono O’Odham Nation
Tohono O’Odham San Xavier District
University of Arizona
no data available
0
1
85
Map B2 - Owner Occupied Mobile Homes by Census Tractsource: American Community Survey 2013 5yr estimates BS2504 - PHYSICAL HOUSING CHARACTERISTICS FOR OCCUPIED HOUSING UNITS
Owner Occupied Mobile Homes per census tract
Miles
0 12 ½ 25 50
N

Spatial Data: Pima County GIS LibraryMap prepared by: College of Architecture, Planning, and Landscape Architecture, University of Arizona Map prepared for: Family Housing Resources, IncMay 2016
96
Marana
Ajo
Vail
Picture Rocks
Three Points
Arivaca
Oro Valley
Green Valley
Catalina Foothills
Tanque Verde
Rincon Valley
Why
Catalina
Sahuarita
Avra Valley
Casas Adobes
Drexel Heights
Tucson Estates
Valencia West
Summit
Elephant Head
Pimaco Two
Corona de Tucson
Summerhaven
Flowing Wells
Arivaca Junction
South Tucson
Nelson
Willow Canyon
Littletown
Rillito
§̈¦10
§̈¦19
§̈¦10
¬«86
¬«286
¬«85
¬«386
¬«77
¬«85
¬«85
T u c s o n
Tohono O’Odham Nation
Tohono O’Odham San Xavier District
University of Arizona
no data available
0
1
100
Map B3 - Renter Occupied Homes Built 1979 or Ealiersource: American Community Survey 2013 5yr estimates BS2504 - PHYSICAL HOUSING CHARACTERISTICS FOR OCCUPIED HOUSING UNITS
Renter Occupied Homes built 1979 or earlier
Miles
0 12 ½ 25 50
N

Spatial Data: Pima County GIS LibraryMap prepared by: College of Architecture, Planning, and Landscape Architecture, University of Arizona Map prepared for: Family Housing Resources, IncMay 2016
97
aging housing stock
Marana
Ajo
Vail
Picture Rocks
Three Points
Arivaca
Oro Valley
Green Valley
Catalina Foothills
Tanque Verde
Rincon Valley
Why
Catalina
Sahuarita
Avra Valley
Casas Adobes
Drexel Heights
Tucson Estates
Valencia West
Summit
Elephant Head
Pimaco Two
Corona de Tucson
Summerhaven
Flowing Wells
Arivaca Junction
South Tucson
Nelson
Willow Canyon
Littletown
Rillito
§̈¦10
§̈¦19
§̈¦10
¬«86
¬«286
¬«85
¬«386
¬«77
¬«85
¬«85
T u c s o n
Tohono O’Odham Nation
Tohono O’Odham San Xavier District
University of Arizona
no data available
0
1
103
Map B4 - Owner Occupied Homes Built 1979 or Ealiersource: American Community Survey 2013 5yr estimates BS2504 - PHYSICAL HOUSING CHARACTERISTICS FOR OCCUPIED HOUSING UNITS
Owner Occupied Homes built 1979 or earlier
Miles
0 12 ½ 25 50
N

Spatial Data: Pima County GIS LibraryMap prepared by: College of Architecture, Planning, and Landscape Architecture, University of Arizona Map prepared for: Family Housing Resources, IncMay 2016
98
E
EEE E
E
E
EEEE
E E
EE
E
E
E
E
T u c s o n
Sources: Esri, HERE, DeLorme, USGS, Intermap, increment P Corp., NRCAN, Esri Japan, METI, Esri China (Hong Kong), Esri (Thailand),MapmyIndia, © OpenStreetMap contributors, and the GIS User Community
Map B5 - Habitat for Humanity Homes and NSP2 2010-2015 Activitiessources: Pima County, Habitat for Humanity
Habitat for Humanity Home
NSP2 - Acquisition and Rehab
NSP2 - Demolition
NSP2 - Down payment Assistance
NSP2 - New Construction
NSP2 - Redevelop
University of Arizona
Miles
0 10 20
N
NSP2 Activities - Pima County 2010-2015 and Habitat for Humanity Homes