application of desorption electrospray ionization mass ... · pdf fileapplication of...
TRANSCRIPT
Application of desorption electrospray ionization massspectrometry imaging in breast cancer margin analysisDavid Calligarisa,1, Diana Caragacianua,b,c,1, Xiaohui Liua,2, Isaiah Nortona, Christopher J. Thompsond,Andrea L. Richardsone,f, Mehra Golshanc, Michael L. Easterlingd, Sandro Santagatae,f, Deborah A. Dillone, Ferenc A. Joleszb,and Nathalie Y. R. Agara,b,f,3
Departments of aNeurosurgery, bRadiology, cSurgery, and ePathology, Brigham and Women’s Hospital, Harvard Medical School, Boston, MA 02115;dBruker Daltonics, Billerica, MA 01821; and fDepartment of Cancer Biology, Dana–Farber Cancer Institute, Boston, MA 02215
Edited by Jerrold Meinwald, Cornell University, Ithaca, NY, and approved August 28, 2014 (received for review May 6, 2014)
Distinguishing tumor from normal glandular breast tissue is animportant step in breast-conserving surgery. Because this distinctioncan be challenging in the operative setting, up to 40% of patientsrequire an additional operationwhen traditional approaches are used.Here,we present a proof-of-concept study to determine the feasibilityof using desorption electrospray ionization mass spectrometry im-aging (DESI-MSI) for identifying and differentiating tumor fromnormal breast tissue. We show that tumor margins can be identifiedusing the spatial distributions and varying intensities of differentlipids. Several fatty acids, including oleic acid, were more abundantin the cancerous tissue than in normal tissues. The cancer marginsdelineated by the molecular images from DESI-MSI were consistentwith those margins obtained from histological staining. Our findingsprove the feasibility of classifying cancerous and normal breast tis-sues using ambient ionization MSI. The results suggest that an MS-based method could be developed for the rapid intraoperative de-tection of residual cancer tissue during breast-conserving surgery.
metabolites | FT-ICR MS | molecular pathology | intrasurgical diagnosis
Breast cancer is the most commonly diagnosed carcinoma inwomen in the United States and Western countries. Breast
conservation surgery (BCS) has become the preferred treatmentoption for many women with early-stage breast cancer (1). BCSentails resection of the tumor, with a clean margin of normaltissue around it. Surgery is usually followed by radiation therapy.Results from seven large randomized prospective studies, withthe largest two having over 20 y of follow-up, have shown equalsurvival when comparing BCS coupled with whole-breast radia-tion and mastectomy (2, 3).Normally, breast surgeons aim to remove a patient’s tumor, along
with a rim of normal tissue that is free of cancer. Preoperativemammography, ultrasonography, or MRI may be used by the sur-geon to guide adequate resection (4–6). Despite numerousimprovements in imaging and surgical technique, the need forreexcision to achieve complete tumor resection in the UnitedStates typically ranges from 20–40% (7–15), and has beenreported as being as high as 60% (16). The importance of reex-cision is underscored by numerous studies, which have shown thatincomplete resection of tumor and positivemargins are associatedwith increased locoregional recurrence compared with negativemargins (12, 17–20). Furthermore, the landmark meta-analysisperformed by the Early Breast Cancer Trialists’ CollaborativeGroup (18, 21) directly linked local recurrence to survival, placinggreat emphasis on the surgeon’s role in minimizing local re-currence by obtaining adequate margins.Breast tumor reexcisions are accompanied by a number of un-
desirable problems: The completion of therapy is delayed, infectionrates are increased, cost is increased, there can be a negative psy-chological impact on the patient, and there can be diminishedaesthetic outcomes (22–24). The development of an intraoperativetechnique that allows the fast and accurate identification of re-sidual tumor at surgical resection margins could decrease the
reexcision rate, and therefore improve the care delivered topatients with cancer who are receiving BCS.To this end, multiple intraoperative methods have been ex-
plored, with various benefits as well as limitations. These methodsinclude touch frozen section analysis (25), touch preparation cy-tology (26), specimen radiography (27, 28), rf spectroscopy (29, 30),Raman spectroscopy (31), radioguided occult lesion localization(32), near-IR fluorescence (33, 34), and high-frequency ultrasound(35–37). The intraoperative application of MRI, which has beensuccessfully applied in brain surgery (38–42), is limited in its ap-plication in BCS. These limitations include MRI interpretation inthe presence of acute surgical changes; lack of real-time imaging,requiring the interruption of surgery; and accurate localization oftumor based on images requiring development of fiducials (43–46).Mass spectrometry imaging (MSI) has been applied to investigate
the molecular distribution of proteins, lipids, and metaboliteswithout the use of labels (47, 48). In particular, the newly developedambient ionization technique of desorption electrospray ionization(DESI) allows direct tissue analysis with little to no sample prepa-ration (49, 50). Therefore, with the advantage of easy use, DESI-MSI has great potential in the application of intraoperative tumorassessment. The development of DESI-MSI enables the correlationof lipid distribution in two or three dimensions with tissue mor-phology (47, 51) and the distinction of cancerous from noncan-cerous tissues based on lipidomic information (52–54). Distinctive
Significance
This study is the first demonstration, to our knowledge, of theapplication of desorption electrospray ionization mass spec-trometry imaging (DESI-MSI) for discrimination of breast cancerand delineation of tumor margins. Using DESI-MSI, it is possibleto discriminate between cancerous and adjacent normal tissueon the basis of the detection and specific spatial distributionsof different lipid species. This study proves the feasibility ofclassifying cancerous and normal breast tissues using ambientionization MSI. It will allow the surgeon to access to this in-formation in real time so as to make accurate intraoperativedecisions quickly. It will result in improved cosmesis and de-crease the need for multiple operations for margin reexcision.
Author contributions: F.A.J. and N.Y.R.A. designed research; D. Calligaris, X.L., C.J.T., and M.L.E.performed research; A.L.R. andM.G. contributed new reagents/analytic tools; D. Calligaris, X.L.,I.N., S.S., and D.A.D. analyzed data; A.L.R. andM.G. provided the samples; and D. Calligaris,D. Caragacianu, and N.Y.R.A. wrote the paper.
Conflict of interest statement: In compliance with Harvard Medical School and PartnersHealthcare guidelines on potential conflict of interest, we disclose that S.S. and N.Y.R.A.are scientific advisors to BayesianDx.
This article is a PNAS Direct Submission.1D. Calligaris and D. Caragacianu contributed equally to this work.2Present address: School of Life Sciences, Tsinghua University, Beijing 100084, China.3To whom correspondence should be addressed. Email: [email protected].
This article contains supporting information online at www.pnas.org/lookup/suppl/doi:10.1073/pnas.1408129111/-/DCSupplemental.
15184–15189 | PNAS | October 21, 2014 | vol. 111 | no. 42 www.pnas.org/cgi/doi/10.1073/pnas.1408129111
lipid profiles associated with different human cancers have beeninvestigated by DESI-MSI (55–58). Moreover, the grades andsubtypes of human brain tumors have been discriminated usingthis technique. Additionally, tumor margins have been delineatedusing DESI-MSI, and the results have been correlated with his-topathological examination (59, 60).It has been reported that breast cancer demonstrates meta-
bolic profiles that are distinct from those metabolic profilesfound in normal breast tissue. This finding suggests a potentialfor using metabolite information for breast cancer diagnosis andtumor margin identification (61, 62). Here, we demonstrate anMS-based methodology for using lipidomic information to dis-tinguish cancerous from noncancerous tissue and to delineatetumor boundaries.
ResultsMetabolite Profiling in Breast Cancer Tissues Using DESI-MSI. ADESI-MSI profile from the sample can be acquired quickly froma linear region of tissue on a slide (what is referred to as a linescan), or a more complete 2D molecular image can be acquiredfrom a tissue section on a slide, yielding detailed spatial data thatcan be used to correlate underlying histology with the presenceof signatures (multiple peaks) or specific single peaks (from onemolecule). The line scan profile is appropriate for rapid dataacquisition during a surgical procedure, whereas 2D molecularimaging is carefully done in the research setting to validate sig-natures relative to classic histopathology criteria. Here, we firstdemonstrate profiled mass spectra distinguishing normal andtumor tissues and then, in the section below, we present DESI-MSI data from 14 research subjects for more detailed validation.The tissues from a total of 14 research subjects were analyzed
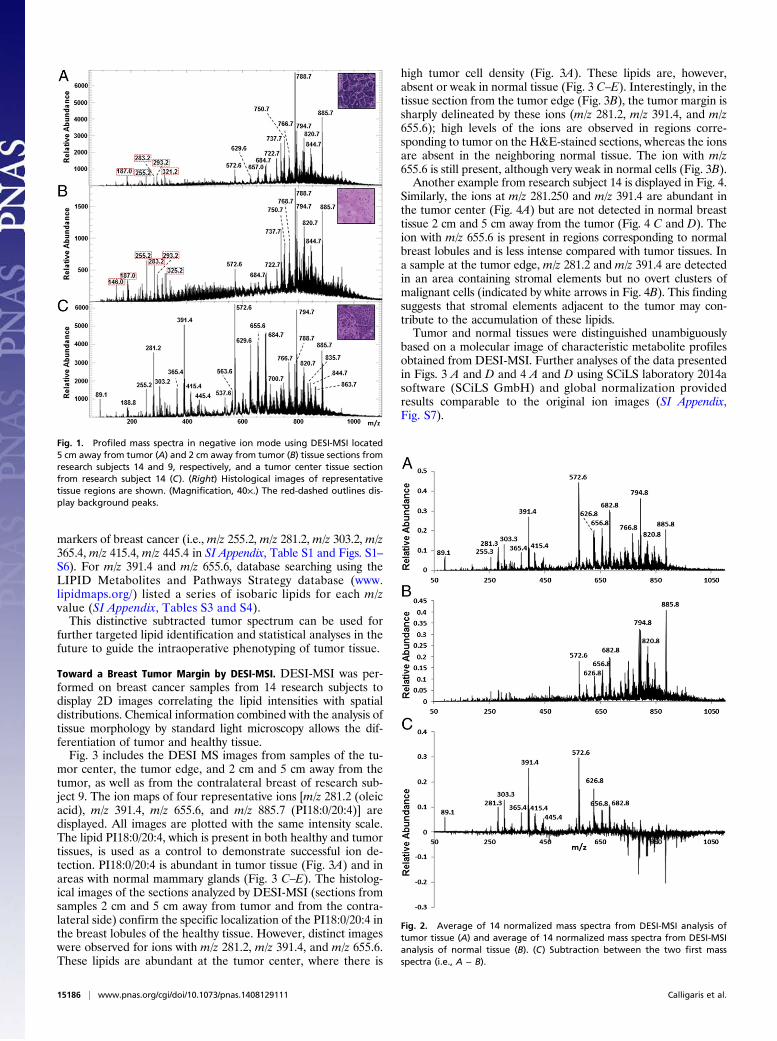
using DESI-MSI. For each research subject, samples were takenat the tumor center, at the tumor edge, and 2 cm and 5 cm awayfrom the tumor, as listed in Table 1. The samples from thecontralateral breast were obtained from five research subjectswho underwent double mastectomies. All of the samples wereanalyzed in negative ion mode in the m/z range of 50–1,100,meaning that the negative ions detected were predominantlylipid and metabolite species (47, 51, 54, 56, 59, 60). Comparedwith positive ion mode, the lipid spectra obtained from negativeion mode gave more unique information. Representative massspectra from profiled breast cancer and nonneoplastic tissue sec-tions are shown in Fig. 1 with corresponding optical images afterhistological staining. DESI-MS analysis, followed by standard H&Estaining, was performed on the same tissue sections. This validation
process has been made possible by using a nondestructive spraysolvent (50:50 acetonitrile/dimethylformamide) to preserve tissueintegrity during DESI-MSI analyses. Two healthy tissue sampleswere analyzed first. The first sample comprised breast lobules withepithelial cells (Fig. 1A), and the second comprised fibrous tissuemostly composed of fibroblasts and ECM (Fig. 1B). Most of theions are detected in anm/z range between 700 and 1,000. Accordingto previous studies, several peaks have been assigned to phospho-lipid (PL) species as phosphatidylinositol (PI), phosphatidylserine(PS), and phosphatidylethanolamine (59, 63–66) (SI Appendix,Table S1). We then confirmed the peak assignments by performinghigh-resolution MS using a Fourier transform ion cyclotron reso-nance (FT-ICR) mass spectrometer. The high-mass precisionmeasurement of the FT-ICR analyzer allowed us to determine theelemental composition of the ions with a precision greater than0.5 ppm during MS analyses (SI Appendix, Table S1) and to obtainstructure information during tandem MS (MS/MS) analyses (SIAppendix, Table S2). From these two samples, series of lipid speciespresent at nearly the same relative abundance [e.g.,m/z 788.7 (i.e.,PS18:0/18:1) andm/z 885.7 (i.e., PI18:0/20:4)] were identified (Fig.1 A and B). Below m/z 500, most of the ions detected are back-ground ions (Fig. 1A andB). The overall signal acquired for fibroustissue is less intense than for breast lobules due to a lower celldensity, and therefore lower total lipid content (Fig. 1 A and B). Incontrast, the profiled mass spectrum acquired from breast cancertissue presents different relative intensities between the same PLpeaks and ions of higher abundance in the m/z range of 500–700.Additional peaks in the low-m/z range (i.e., belowm/z 500) are alsodetected (Fig. 1C). Using the DESI-MSI data from each of the 14research subjects, we subtracted the average profile mass spectra oftumor tissue (Fig. 2A) from the average profile mass spectra ofnormal tissue (Fig. 2B) belonging to the same research subjects.Fig. 2C displays a “tumor-specific mass spectrum” that highlightsall of the ions that could be taken into account to distinguish breastcancer tissue from normal breast tissue byDESI-MSI. Based on theprofile mass spectra of Fig. 2C, all of the 14 research subjects havedistinctive peak patterns in the low-mass region (Fig. 1C). We alsoperformed high-mass resolution analyses to cross-validate theidentification of these metabolites (discussion of sample prepara-tion and MS analysis methods is provided in SI Appendix). Weassigned with a precision greater than 0.5 ppm eight peaks presentin the subtracted spectrum by an electrospray ionization FT-ICRMS analysis of a lipid extract from the center of a tumor samplefrom research subject 9 (SI Appendix, Table S1). MS/MS analysesallowed the identification of six of these peaks that are potentially
Table 1. Summarized description of samples from 14 research subjects
Subject no. Tumor center Tumor edge 2 cm away 5 cm away Contralateral
Receptor status
Age, y SexER PR Her2
1 Y Y Y Y Y Positive Positive Negative 42 Female2 Y Y Y Y Y Negative Negative Negative 63 Female3 Y Y Y Y N Positive Positive Negative 65 Male4 Y Y Y Y N Positive Positive Negative 76 Female5 Y Y Y Y N Positive Positive Negative 48 Female6 Y Y Y Y N Positive Positive Positive 46 Female7 Y Y Y Y N Positive Positive Negative 59 Female8 Y Y Y Y N Negative Negative Positive 60 Female9 Y Y Y Y Y Positive Positive Negative 38 Female10 Y Y Y Y N Positive Positive Negative 48 Female11 Y Y Y Y N Negative Negative Negative 64 Female12 Y Y Y Y Y Positive Positive Negative 47 Female13 Y Y Y Y Y Positive Positive Negative 38 Female14 Y Y Y Y N Positive Positive Negative 40 Female
N, no; Y, yes.
Calligaris et al. PNAS | October 21, 2014 | vol. 111 | no. 42 | 15185
MED
ICALSC
IENCE
SCH
EMISTR
Y
markers of breast cancer (i.e., m/z 255.2, m/z 281.2, m/z 303.2, m/z365.4, m/z 415.4, m/z 445.4 in SI Appendix, Table S1 and Figs. S1–S6). For m/z 391.4 and m/z 655.6, database searching using theLIPID Metabolites and Pathways Strategy database (www.lipidmaps.org/) listed a series of isobaric lipids for each m/zvalue (SI Appendix, Tables S3 and S4).This distinctive subtracted tumor spectrum can be used for
further targeted lipid identification and statistical analyses in thefuture to guide the intraoperative phenotyping of tumor tissue.
Toward a Breast Tumor Margin by DESI-MSI. DESI-MSI was per-formed on breast cancer samples from 14 research subjects todisplay 2D images correlating the lipid intensities with spatialdistributions. Chemical information combined with the analysis oftissue morphology by standard light microscopy allows the dif-ferentiation of tumor and healthy tissue.Fig. 3 includes the DESI MS images from samples of the tu-
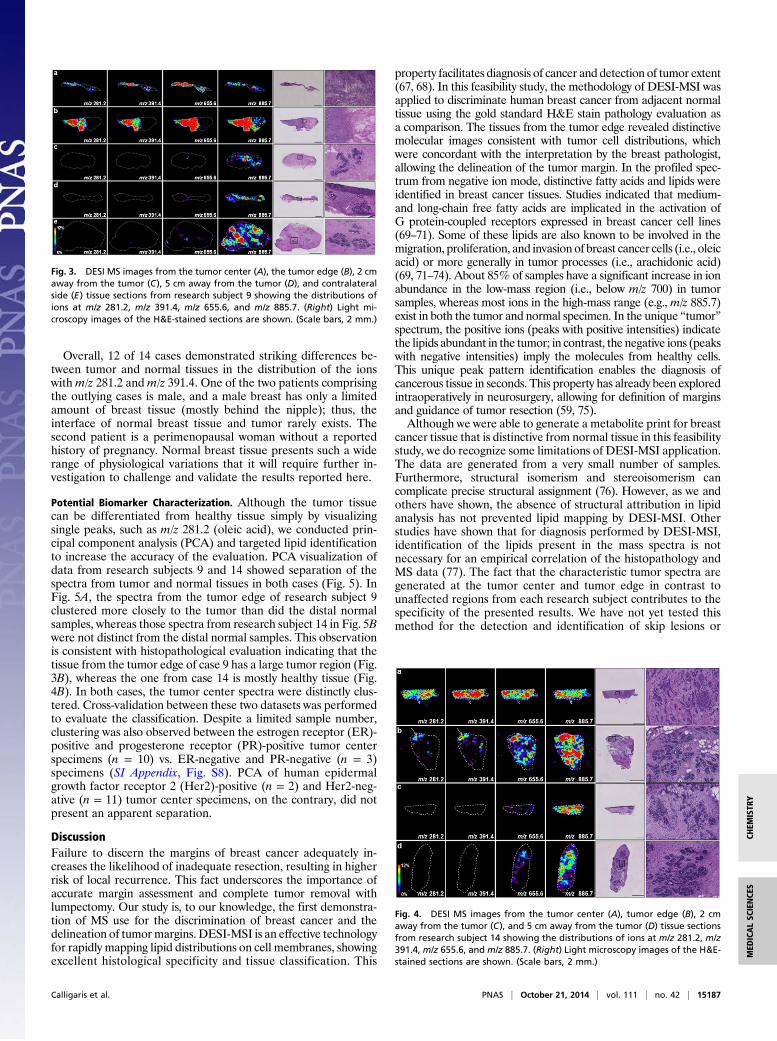
mor center, the tumor edge, and 2 cm and 5 cm away from thetumor, as well as from the contralateral breast of research sub-ject 9. The ion maps of four representative ions [m/z 281.2 (oleicacid), m/z 391.4, m/z 655.6, and m/z 885.7 (PI18:0/20:4)] aredisplayed. All images are plotted with the same intensity scale.The lipid PI18:0/20:4, which is present in both healthy and tumortissues, is used as a control to demonstrate successful ion de-tection. PI18:0/20:4 is abundant in tumor tissue (Fig. 3A) and inareas with normal mammary glands (Fig. 3 C–E). The histolog-ical images of the sections analyzed by DESI-MSI (sections fromsamples 2 cm and 5 cm away from tumor and from the contra-lateral side) confirm the specific localization of the PI18:0/20:4 inthe breast lobules of the healthy tissue. However, distinct imageswere observed for ions with m/z 281.2, m/z 391.4, and m/z 655.6.These lipids are abundant at the tumor center, where there is
high tumor cell density (Fig. 3A). These lipids are, however,absent or weak in normal tissue (Fig. 3 C–E). Interestingly, in thetissue section from the tumor edge (Fig. 3B), the tumor margin issharply delineated by these ions (m/z 281.2, m/z 391.4, and m/z655.6); high levels of the ions are observed in regions corre-sponding to tumor on the H&E-stained sections, whereas the ionsare absent in the neighboring normal tissue. The ion with m/z655.6 is still present, although very weak in normal cells (Fig. 3B).Another example from research subject 14 is displayed in Fig. 4.
Similarly, the ions at m/z 281.250 and m/z 391.4 are abundant inthe tumor center (Fig. 4A) but are not detected in normal breasttissue 2 cm and 5 cm away from the tumor (Fig. 4 C and D). Theion with m/z 655.6 is present in regions corresponding to normalbreast lobules and is less intense compared with tumor tissues. Ina sample at the tumor edge, m/z 281.2 and m/z 391.4 are detectedin an area containing stromal elements but no overt clusters ofmalignant cells (indicated by white arrows in Fig. 4B). This findingsuggests that stromal elements adjacent to the tumor may con-tribute to the accumulation of these lipids.Tumor and normal tissues were distinguished unambiguously
based on a molecular image of characteristic metabolite profilesobtained from DESI-MSI. Further analyses of the data presentedin Figs. 3 A and D and 4 A and D using SCiLS laboratory 2014asoftware (SCiLS GmbH) and global normalization providedresults comparable to the original ion images (SI Appendix,Fig. S7).
Fig. 1. Profiled mass spectra in negative ion mode using DESI-MSI located5 cm away from tumor (A) and 2 cm away from tumor (B) tissue sections fromresearch subjects 14 and 9, respectively, and a tumor center tissue sectionfrom research subject 14 (C). (Right) Histological images of representativetissue regions are shown. (Magnification, 40×.) The red-dashed outlines dis-play background peaks.
Fig. 2. Average of 14 normalized mass spectra from DESI-MSI analysis oftumor tissue (A) and average of 14 normalized mass spectra from DESI-MSIanalysis of normal tissue (B). (C) Subtraction between the two first massspectra (i.e., A − B).
15186 | www.pnas.org/cgi/doi/10.1073/pnas.1408129111 Calligaris et al.
Overall, 12 of 14 cases demonstrated striking differences be-tween tumor and normal tissues in the distribution of the ionswithm/z 281.2 and m/z 391.4. One of the two patients comprisingthe outlying cases is male, and a male breast has only a limitedamount of breast tissue (mostly behind the nipple); thus, theinterface of normal breast tissue and tumor rarely exists. Thesecond patient is a perimenopausal woman without a reportedhistory of pregnancy. Normal breast tissue presents such a widerange of physiological variations that it will require further in-vestigation to challenge and validate the results reported here.
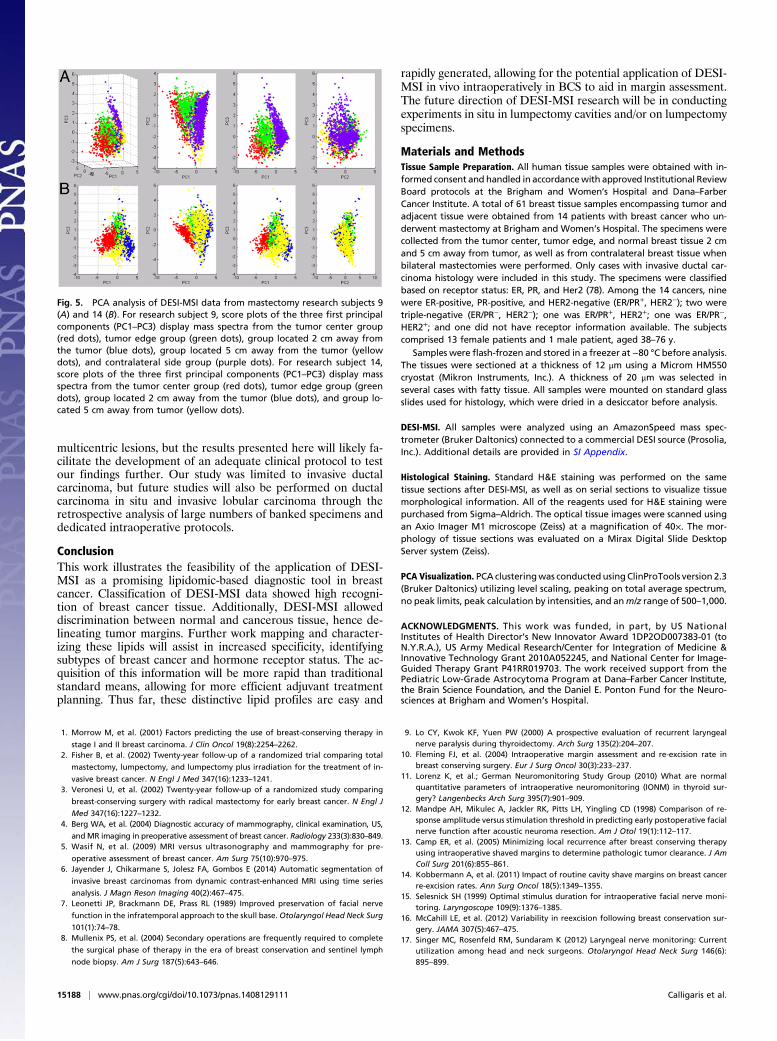
Potential Biomarker Characterization. Although the tumor tissuecan be differentiated from healthy tissue simply by visualizingsingle peaks, such as m/z 281.2 (oleic acid), we conducted prin-cipal component analysis (PCA) and targeted lipid identificationto increase the accuracy of the evaluation. PCA visualization ofdata from research subjects 9 and 14 showed separation of thespectra from tumor and normal tissues in both cases (Fig. 5). InFig. 5A, the spectra from the tumor edge of research subject 9clustered more closely to the tumor than did the distal normalsamples, whereas those spectra from research subject 14 in Fig. 5Bwere not distinct from the distal normal samples. This observationis consistent with histopathological evaluation indicating that thetissue from the tumor edge of case 9 has a large tumor region (Fig.3B), whereas the one from case 14 is mostly healthy tissue (Fig.4B). In both cases, the tumor center spectra were distinctly clus-tered. Cross-validation between these two datasets was performedto evaluate the classification. Despite a limited sample number,clustering was also observed between the estrogen receptor (ER)-positive and progesterone receptor (PR)-positive tumor centerspecimens (n = 10) vs. ER-negative and PR-negative (n = 3)specimens (SI Appendix, Fig. S8). PCA of human epidermalgrowth factor receptor 2 (Her2)-positive (n = 2) and Her2-neg-ative (n = 11) tumor center specimens, on the contrary, did notpresent an apparent separation.
DiscussionFailure to discern the margins of breast cancer adequately in-creases the likelihood of inadequate resection, resulting in higherrisk of local recurrence. This fact underscores the importance ofaccurate margin assessment and complete tumor removal withlumpectomy. Our study is, to our knowledge, the first demonstra-tion of MS use for the discrimination of breast cancer and thedelineation of tumormargins. DESI-MSI is an effective technologyfor rapidly mapping lipid distributions on cell membranes, showingexcellent histological specificity and tissue classification. This
property facilitates diagnosis of cancer and detection of tumor extent(67, 68). In this feasibility study, the methodology of DESI-MSI wasapplied to discriminate human breast cancer from adjacent normaltissue using the gold standard H&E stain pathology evaluation asa comparison. The tissues from the tumor edge revealed distinctivemolecular images consistent with tumor cell distributions, whichwere concordant with the interpretation by the breast pathologist,allowing the delineation of the tumor margin. In the profiled spec-trum from negative ion mode, distinctive fatty acids and lipids wereidentified in breast cancer tissues. Studies indicated that medium-and long-chain free fatty acids are implicated in the activation ofG protein-coupled receptors expressed in breast cancer cell lines(69–71). Some of these lipids are also known to be involved in themigration, proliferation, and invasion of breast cancer cells (i.e., oleicacid) or more generally in tumor processes (i.e., arachidonic acid)(69, 71–74). About 85% of samples have a significant increase in ionabundance in the low-mass region (i.e., below m/z 700) in tumorsamples, whereas most ions in the high-mass range (e.g., m/z 885.7)exist in both the tumor and normal specimen. In the unique “tumor”spectrum, the positive ions (peaks with positive intensities) indicatethe lipids abundant in the tumor; in contrast, the negative ions (peakswith negative intensities) imply the molecules from healthy cells.This unique peak pattern identification enables the diagnosis ofcancerous tissue in seconds. This property has already been exploredintraoperatively in neurosurgery, allowing for definition of marginsand guidance of tumor resection (59, 75).Although we were able to generate a metabolite print for breast
cancer tissue that is distinctive from normal tissue in this feasibilitystudy, we do recognize some limitations of DESI-MSI application.The data are generated from a very small number of samples.Furthermore, structural isomerism and stereoisomerism cancomplicate precise structural assignment (76). However, as we andothers have shown, the absence of structural attribution in lipidanalysis has not prevented lipid mapping by DESI-MSI. Otherstudies have shown that for diagnosis performed by DESI-MSI,identification of the lipids present in the mass spectra is notnecessary for an empirical correlation of the histopathology andMS data (77). The fact that the characteristic tumor spectra aregenerated at the tumor center and tumor edge in contrast tounaffected regions from each research subject contributes to thespecificity of the presented results. We have not yet tested thismethod for the detection and identification of skip lesions or
Fig. 3. DESI MS images from the tumor center (A), the tumor edge (B), 2 cmaway from the tumor (C), 5 cm away from the tumor (D), and contralateralside (E) tissue sections from research subject 9 showing the distributions ofions at m/z 281.2, m/z 391.4, m/z 655.6, and m/z 885.7. (Right) Light mi-croscopy images of the H&E-stained sections are shown. (Scale bars, 2 mm.)
Fig. 4. DESI MS images from the tumor center (A), tumor edge (B), 2 cmaway from the tumor (C), and 5 cm away from the tumor (D) tissue sectionsfrom research subject 14 showing the distributions of ions at m/z 281.2, m/z391.4, m/z 655.6, and m/z 885.7. (Right) Light microscopy images of the H&E-stained sections are shown. (Scale bars, 2 mm.)
Calligaris et al. PNAS | October 21, 2014 | vol. 111 | no. 42 | 15187
MED
ICALSC
IENCE
SCH
EMISTR
Y
multicentric lesions, but the results presented here will likely fa-cilitate the development of an adequate clinical protocol to testour findings further. Our study was limited to invasive ductalcarcinoma, but future studies will also be performed on ductalcarcinoma in situ and invasive lobular carcinoma through theretrospective analysis of large numbers of banked specimens anddedicated intraoperative protocols.
ConclusionThis work illustrates the feasibility of the application of DESI-MSI as a promising lipidomic-based diagnostic tool in breastcancer. Classification of DESI-MSI data showed high recogni-tion of breast cancer tissue. Additionally, DESI-MSI alloweddiscrimination between normal and cancerous tissue, hence de-lineating tumor margins. Further work mapping and character-izing these lipids will assist in increased specificity, identifyingsubtypes of breast cancer and hormone receptor status. The ac-quisition of this information will be more rapid than traditionalstandard means, allowing for more efficient adjuvant treatmentplanning. Thus far, these distinctive lipid profiles are easy and
rapidly generated, allowing for the potential application of DESI-MSI in vivo intraoperatively in BCS to aid in margin assessment.The future direction of DESI-MSI research will be in conductingexperiments in situ in lumpectomy cavities and/or on lumpectomyspecimens.
Materials and MethodsTissue Sample Preparation. All human tissue samples were obtained with in-formed consent and handled in accordancewith approved Institutional ReviewBoard protocols at the Brigham and Women’s Hospital and Dana–FarberCancer Institute. A total of 61 breast tissue samples encompassing tumor andadjacent tissue were obtained from 14 patients with breast cancer who un-derwent mastectomy at Brigham and Women’s Hospital. The specimens werecollected from the tumor center, tumor edge, and normal breast tissue 2 cmand 5 cm away from tumor, as well as from contralateral breast tissue whenbilateral mastectomies were performed. Only cases with invasive ductal car-cinoma histology were included in this study. The specimens were classifiedbased on receptor status: ER, PR, and Her2 (78). Among the 14 cancers, ninewere ER-positive, PR-positive, and HER2-negative (ER/PR+, HER2−); two weretriple-negative (ER/PR−, HER2−); one was ER/PR+, HER2+; one was ER/PR−,HER2+; and one did not have receptor information available. The subjectscomprised 13 female patients and 1 male patient, aged 38–76 y.
Samples were flash-frozen and stored in a freezer at −80 °C before analysis.The tissues were sectioned at a thickness of 12 μm using a Microm HM550cryostat (Mikron Instruments, Inc.). A thickness of 20 μm was selected inseveral cases with fatty tissue. All samples were mounted on standard glassslides used for histology, which were dried in a desiccator before analysis.
DESI-MSI. All samples were analyzed using an AmazonSpeed mass spec-trometer (Bruker Daltonics) connected to a commercial DESI source (Prosolia,Inc.). Additional details are provided in SI Appendix.
Histological Staining. Standard H&E staining was performed on the sametissue sections after DESI-MSI, as well as on serial sections to visualize tissuemorphological information. All of the reagents used for H&E staining werepurchased from Sigma–Aldrich. The optical tissue images were scanned usingan Axio Imager M1 microscope (Zeiss) at a magnification of 40×. The mor-phology of tissue sections was evaluated on a Mirax Digital Slide DesktopServer system (Zeiss).
PCA Visualization. PCA clusteringwas conducted usingClinProTools version 2.3(Bruker Daltonics) utilizing level scaling, peaking on total average spectrum,no peak limits, peak calculation by intensities, and anm/z range of 500–1,000.
ACKNOWLEDGMENTS. This work was funded, in part, by US NationalInstitutes of Health Director’s New Innovator Award 1DP2OD007383-01 (toN.Y.R.A.), US Army Medical Research/Center for Integration of Medicine &Innovative Technology Grant 2010A052245, and National Center for Image-Guided Therapy Grant P41RR019703. The work received support from thePediatric Low-Grade Astrocytoma Program at Dana–Farber Cancer Institute,the Brain Science Foundation, and the Daniel E. Ponton Fund for the Neuro-sciences at Brigham and Women’s Hospital.
1. Morrow M, et al. (2001) Factors predicting the use of breast-conserving therapy in
stage I and II breast carcinoma. J Clin Oncol 19(8):2254–2262.2. Fisher B, et al. (2002) Twenty-year follow-up of a randomized trial comparing total
mastectomy, lumpectomy, and lumpectomy plus irradiation for the treatment of in-
vasive breast cancer. N Engl J Med 347(16):1233–1241.3. Veronesi U, et al. (2002) Twenty-year follow-up of a randomized study comparing
breast-conserving surgery with radical mastectomy for early breast cancer. N Engl J
Med 347(16):1227–1232.4. Berg WA, et al. (2004) Diagnostic accuracy of mammography, clinical examination, US,
andMR imaging in preoperative assessment of breast cancer. Radiology 233(3):830–849.5. Wasif N, et al. (2009) MRI versus ultrasonography and mammography for pre-
operative assessment of breast cancer. Am Surg 75(10):970–975.6. Jayender J, Chikarmane S, Jolesz FA, Gombos E (2014) Automatic segmentation of
invasive breast carcinomas from dynamic contrast-enhanced MRI using time series
analysis. J Magn Reson Imaging 40(2):467–475.7. Leonetti JP, Brackmann DE, Prass RL (1989) Improved preservation of facial nerve
function in the infratemporal approach to the skull base. Otolaryngol Head Neck Surg
101(1):74–78.8. Mullenix PS, et al. (2004) Secondary operations are frequently required to complete
the surgical phase of therapy in the era of breast conservation and sentinel lymph
node biopsy. Am J Surg 187(5):643–646.
9. Lo CY, Kwok KF, Yuen PW (2000) A prospective evaluation of recurrent laryngealnerve paralysis during thyroidectomy. Arch Surg 135(2):204–207.
10. Fleming FJ, et al. (2004) Intraoperative margin assessment and re-excision rate inbreast conserving surgery. Eur J Surg Oncol 30(3):233–237.
11. Lorenz K, et al.; German Neuromonitoring Study Group (2010) What are normalquantitative parameters of intraoperative neuromonitoring (IONM) in thyroid sur-gery? Langenbecks Arch Surg 395(7):901–909.
12. Mandpe AH, Mikulec A, Jackler RK, Pitts LH, Yingling CD (1998) Comparison of re-sponse amplitude versus stimulation threshold in predicting early postoperative facialnerve function after acoustic neuroma resection. Am J Otol 19(1):112–117.
13. Camp ER, et al. (2005) Minimizing local recurrence after breast conserving therapyusing intraoperative shaved margins to determine pathologic tumor clearance. J AmColl Surg 201(6):855–861.
14. Kobbermann A, et al. (2011) Impact of routine cavity shave margins on breast cancerre-excision rates. Ann Surg Oncol 18(5):1349–1355.
15. Selesnick SH (1999) Optimal stimulus duration for intraoperative facial nerve moni-toring. Laryngoscope 109(9):1376–1385.
16. McCahill LE, et al. (2012) Variability in reexcision following breast conservation sur-gery. JAMA 307(5):467–475.
17. Singer MC, Rosenfeld RM, Sundaram K (2012) Laryngeal nerve monitoring: Currentutilization among head and neck surgeons. Otolaryngol Head Neck Surg 146(6):895–899.
Fig. 5. PCA analysis of DESI-MSI data from mastectomy research subjects 9(A) and 14 (B). For research subject 9, score plots of the three first principalcomponents (PC1–PC3) display mass spectra from the tumor center group(red dots), tumor edge group (green dots), group located 2 cm away fromthe tumor (blue dots), group located 5 cm away from the tumor (yellowdots), and contralateral side group (purple dots). For research subject 14,score plots of the three first principal components (PC1–PC3) display massspectra from the tumor center group (red dots), tumor edge group (greendots), group located 2 cm away from the tumor (blue dots), and group lo-cated 5 cm away from tumor (yellow dots).
15188 | www.pnas.org/cgi/doi/10.1073/pnas.1408129111 Calligaris et al.
18. Marcus B, et al. (2003) Recurrent laryngeal nerve monitoring in thyroid and para-thyroid surgery: The University of Michigan experience. Laryngoscope 113(2):356–361.
19. Gage I, et al. (1996) Pathologic margin involvement and the risk of recurrence inpatients treated with breast-conserving therapy. Cancer 78(9):1921–1928.
20. Mu L, Yang S (1991) An experimental study on the laryngeal electromyography andvisual observations in varying types of surgical injuries to the unilateral recurrentlaryngeal nerve in the neck. Laryngoscope 101(7 Pt 1):699–708.
21. Darby S, et al.; Early Breast Cancer Trialists’ Collaborative Group (EBCTCG) (2011)Effect of radiotherapy after breast-conserving surgery on 10-year recurrence and15-year breast cancer death: Meta-analysis of individual patient data for 10,801women in 17 randomised trials. Lancet 378(9804):1707–1716.
22. Deutsch M, Flickinger JC (2003) Patient characteristics and treatment factors affectingcosmesis following lumpectomy and breast irradiation. Am J Clin Oncol 26(4):350–353.
23. Cochrane RA, Valasiadou P, Wilson AR, Al-Ghazal SK, Macmillan RD (2003) Cosmesisand satisfaction after breast-conserving surgery correlates with the percentage ofbreast volume excised. Br J Surg 90(12):1505–1509.
24. Heil J, et al. (2012) Do reexcisions impair aesthetic outcome in breast conservationsurgery? Exploratory analysis of a prospective cohort study. Ann Surg Oncol 19(2):541–547.
25. McLaughlin SA, Ochoa-Frongia LM, Patil SM, Cody HS, 3rd, Sclafani LM (2008) In-fluence of frozen-section analysis of sentinel lymph node and lumpectomy marginstatus on reoperation rates in patients undergoing breast-conservation therapy. J AmColl Surg 206(1):76–82.
26. Valdes EK, Boolbol SK, Cohen JM, Feldman SM (2007) Intra-operative touch prepa-ration cytology; does it have a role in re-excision lumpectomy? Ann Surg Oncol 14(3):1045–1050.
27. Abbas G, Heller KS, Khoynezhad A, Dubner S, Sznyter LA (2001) The incidence ofcarcinoma in cytologically benign thyroid cysts. Surgery 130(6):1035–1038.
28. Erguvan-Dogan B, et al. (2006) Specimen radiography in confirmation of MRI-guidedneedle localization and surgical excision of breast lesions. AJR Am J Roentgenol187(2):339–344.
29. Joines WT, Zhang Y, Li C, Jirtle RL (1994) The measured electrical properties of normaland malignant human tissues from 50 to 900 MHz. Med Phys 21(4):547–550.
30. Karni T, et al. (2007) A device for real-time, intraoperative margin assessment inbreast-conservation surgery. Am J Surg 194(4):467–473.
31. Haka AS, et al. (2006) In vivo margin assessment during partial mastectomy breastsurgery using raman spectroscopy. Cancer Res 66(6):3317–3322.
32. Thomusch O, et al. (2004) Validity of intra-operative neuromonitoring signals inthyroid surgery. Langenbecks Arch Surg 389(6):499–503.
33. Thomusch O, Sekulla C, Walls G, Machens A, Dralle H (2002) Intraoperative neuro-monitoring of surgery for benign goiter. Am J Surg 183(6):673–678.
34. Tomoda C, et al. (2006) Sensitivity and specificity of intraoperative recurrent laryngealnerve stimulation test for predicting vocal cord palsy after thyroid surgery. World JSurg 30(7):1230–1233.
35. Gianfelice D, Khiat A, Amara M, Belblidia A, Boulanger Y (2003) MR imaging-guidedfocused ultrasound surgery of breast cancer: Correlation of dynamic contrast-enhanced MRI with histopathologic findings. Breast Cancer Res Treat 82(2):93–101.
36. Zippel DB, Papa MZ (2005) The use of MR imaging guided focused ultrasound inbreast cancer patients; a preliminary phase one study and review. Breast Cancer 12(1):32–38.
37. Furusawa H, et al. (2006) Magnetic resonance-guided focused ultrasound surgery ofbreast cancer: Reliability and effectiveness. J Am Coll Surg 203(1):54–63.
38. Risholm P, Golby AJ, Wells W, 3rd (2011) Multimodal image registration for pre-operative planning and image-guided neurosurgical procedures. Neurosurg Clin NAm 22(2):197–206, viii.
39. Jolesz FA, et al. (2002) Intraoperative magnetic resonance imaging and magneticresonance imaging-guided therapy for brain tumors. Neuroimaging Clin N Am 12(4):665–683.
40. Black PM, et al. (1997) Development and implementation of intraoperative magneticresonance imaging and its neurosurgical applications. Neurosurgery 41(4):831–842;discussion 842–835.
41. Schwartz RB, et al. (1999) Intraoperative MR imaging guidance for intracranial neu-rosurgery: Experience with the first 200 cases. Radiology 211(2):477–488.
42. Claus EB, et al. (2005) Survival rates in patients with low-grade glioma after intra-operative magnetic resonance image guidance. Cancer 103(6):1227–1233.
43. Yamashiro N, et al. (2009) Preoperative MRI marking technique for the planning ofbreast-conserving surgery. Breast Cancer 16(3):223–228.
44. Gould SW, Lamb G, Lomax D, Gedroyc W, Darzi A (1998) Interventional MR-guidedexcisional biopsy of breast lesions. J Magn Reson Imaging 8(1):26–30.
45. Sturgeon C, Sturgeon T, Angelos P (2009) Neuromonitoring in thyroid surgery: Atti-tudes, usage patterns, and predictors of use among endocrine surgeons.World J Surg33(3):417–425.
46. Tomikawa M, et al. (2010) Real-time 3-dimensional virtual reality navigation systemwith open MRI for breast-conserving surgery. J Am Coll Surg 210(6):927–933.
47. Wiseman JM, Ifa DR, Song Q, Cooks RG (2006) Tissue imaging at atmospheric pressureusing desorption electrospray ionization (DESI) mass spectrometry. Angew Chem IntEd Engl 45(43):7188–7192.
48. Walch A, Rauser S, Deininger SO, Höfler H (2008) MALDI imaging mass spectrometryfor direct tissue analysis: A new frontier for molecular histology. Histochem Cell Biol130(3):421–434.
49. Takáts Z, Wiseman JM, Cooks RG (2005) Ambient mass spectrometry using desorptionelectrospray ionization (DESI): Instrumentation, mechanisms and applications in for-ensics, chemistry, and biology. J Mass Spectrom 40(10):1261–1275.
50. Donnellan KA, Pitman KT, Cannon CR, Replogle WH, Simmons JD (2009) Intra-operative laryngeal nerve monitoring during thyroidectomy. Arch Otolaryngol HeadNeck Surg 135(12):1196–1198.
51. Eberlin LS, Ifa DR, Wu C, Cooks RG (2010) Three-dimensional vizualization of mousebrain by lipid analysis using ambient ionization mass spectrometry. Angew Chem IntEd Engl 49(5):873–876.
52. Pirro V, Eberlin LS, Oliveri P, Cooks RG (2012) Interactive hyperspectral approach forexploring and interpreting DESI-MS images of cancerous and normal tissue sections.Analyst (Lond) 137(10):2374–2380.
53. Cooks RG, et al. (2011) New ionization methods and miniature mass spectrometers forbiomedicine: DESI imaging for cancer diagnostics and paper spray ionization fortherapeutic drug monitoring. Faraday Discuss 149:247–267; discussion 333–356.
54. Eberlin LS, et al. (2011) Desorption electrospray ionization then MALDI mass spec-trometry imaging of lipid and protein distributions in single tissue sections. AnalChem 83(22):8366–8371.
55. Masterson TA, et al. (2011) Distinctive glycerophospholipid profiles of human semi-noma and adjacent normal tissues by desorption electrospray ionization imagingmass spectrometry. J Am Soc Mass Spectrom 22(8):1326–1333.
56. Calligaris D, et al. (2013) Mass spectrometry imaging as a tool for surgical decision-making. J Mass Spectrom 48(11):1178–1187.
57. Eberlin LS, et al. (2010) Cholesterol sulfate imaging in human prostate cancer tissue bydesorption electrospray ionization mass spectrometry. Anal Chem 82(9):3430–3434.
58. Dill AL, et al. (2010) Multivariate statistical differentiation of renal cell carcinomasbased on lipidomic analysis by ambient ionization imaging mass spectrometry. AnalBioanal Chem 398(7-8):2969–2978.
59. Eberlin LS, et al. (2012) Classifying human brain tumors by lipid imaging with massspectrometry. Cancer Res 72(3):645–654.
60. Eberlin LS, et al. (2010) Discrimination of human astrocytoma subtypes by lipidanalysis using desorption electrospray ionization imaging mass spectrometry. AngewChem Int Ed Engl 49(34):5953–5956.
61. Schlaepfer IR, et al. (2012) Progestin modulates the lipid profile and sensitivity ofbreast cancer cells to docetaxel. Mol Cell Endocrinol 363(1-2):111–121.
62. Hilvo M, et al. (2011) Novel theranostic opportunities offered by characterization ofaltered membrane lipid metabolism in breast cancer progression. Cancer Res 71(9):3236–3245.
63. Dill AL, et al. (2011) Multivariate statistical identification of human bladder carcinomasusing ambient ionization imaging mass spectrometry. Chemistry 17(10):2897–2902.
64. Girod M, Shi Y, Cheng JX, Cooks RG (2010) Desorption electrospray ionization im-aging mass spectrometry of lipids in rat spinal cord. J Am Soc Mass Spectrom 21(7):1177–1189.
65. He H, et al. (2007) Method for lipidomic analysis: p53 expression modulation of sul-fatide, ganglioside, and phospholipid composition of U87 MG glioblastoma cells. AnalChem 79(22):8423–8430.
66. Dill AL, et al. (2009) Lipid profiles of canine invasive transitional cell carcinoma of theurinary bladder and adjacent normal tissue by desorption electrospray ionizationimaging mass spectrometry. Anal Chem 81(21):8758–8764.
67. Jackson SN, Wang HY, Woods AS (2005) Direct profiling of lipid distribution in braintissue using MALDI-TOFMS. Anal Chem 77(14):4523–4527.
68. Gemoll T, Roblick UJ, Habermann JK (2011) MALDI mass spectrometry imaging inoncology (Review). Mol Med Rep 4(6):1045–1051.
69. Soto-Guzman A, Robledo T, Lopez-Perez M, Salazar EP (2008) Oleic acid induces ERK1/2activation and AP-1 DNA binding activity through a mechanism involving Src kinaseand EGFR transactivation in breast cancer cells. Mol Cell Endocrinol 294(1-2):81–91.
70. Navarro-Tito N, Robledo T, Salazar EP (2008) Arachidonic acid promotes FAK activationand migration in MDA-MB-231 breast cancer cells. Exp Cell Res 314(18):3340–3355.
71. Yonezawa T, Katoh K, Obara Y (2004) Existence of GPR40 functioning in a humanbreast cancer cell line, MCF-7. Biochem Biophys Res Commun 314(3):805–809.
72. Hardy S, St-Onge GG, Joly E, Langelier Y, Prentki M (2005) Oleate promotes theproliferation of breast cancer cells via the G protein-coupled receptor GPR40. J BiolChem 280(14):13285–13291.
73. Navarro-Tito N, Soto-Guzman A, Castro-Sanchez L, Martinez-Orozco R, Salazar EP(2010) Oleic acid promotes migration on MDA-MB-231 breast cancer cells through anarachidonic acid-dependent pathway. Int J Biochem Cell Biol 42(2):306–317.
74. Soto-Guzman A, Navarro-Tito N, Castro-Sanchez L, Martinez-Orozco R, Salazar EP(2010) Oleic acid promotes MMP-9 secretion and invasion in breast cancer cells. ClinExp Metastasis 27(7):505–515.
75. Eberlin LS, et al. (2013) Ambient mass spectrometry for the intraoperative moleculardiagnosis of human brain tumors. Proc Natl Acad Sci USA 110(5):1611–1616.
76. Bennett IC, Greenslade J, Chiam H (2005) Intraoperative ultrasound-guided excisionof nonpalpable breast lesions. World J Surg 29(3):369–374.
77. Hamelmann WH, Meyer T, Timm S, Timmermann W (2002) [A Critical Estimation ofIntraoperative Neuromonitoring (IONM) in Thyroid Surgery]. Zentralbl Chir 127(5):409–413. German.
78. Onitilo AA, Engel JM, Greenlee RT, Mukesh BN (2009) Breast cancer subtypes basedon ER/PR and Her2 expression: Comparison of clinicopathologic features and survival.Clin Med Res 7(1-2):4–13.
Calligaris et al. PNAS | October 21, 2014 | vol. 111 | no. 42 | 15189
MED
ICALSC
IENCE
SCH
EMISTR
Y