detection of volatile organic compounds in breath using ... · pounds in breath using thermal...
TRANSCRIPT

Loughborough UniversityInstitutional Repository
Detection of volatile organiccompounds in breath using
thermal desorptionelectrospray ionization-ionmobility-mass spectrometry
This item was submitted to Loughborough University's Institutional Repositoryby the/an author.
Citation: REYNOLDS, J. C. ... et al., 2010. Detection of volatile organic com-pounds in breath using thermal desorption electrospray ionization-ion mobility-mass spectrometry. Analytical Chemistry, 82 (5), pp. 2139 - 2144.
Additional Information:
• This document is the Accepted Manuscript version of a PublishedWork that appeared in final form in Analytical Chemistry, copyrightc© American Chemical Society after peer review and technical editingby the publisher. To access the final edited and published work see:http://pubs.acs.org/doi/abs/10.1021/ac9027593
Metadata Record: https://dspace.lboro.ac.uk/2134/16027
Version: Accepted for publication
Publisher: c© American Chemical Society
Rights: This work is made available according to the conditions of the Cre-ative Commons Attribution-NonCommercial-NoDerivatives 4.0 International(CC BY-NC-ND 4.0) licence. Full details of this licence are available at:https://creativecommons.org/licenses/by-nc-nd/4.0/
Please cite the published version.
1
Detection of Volatile Organic Compounds in Breath
Using Thermal Desorption Electrospray
Ionization-Ion Mobility-Mass Spectrometry J. C. Reynolds,* G. J. Blackburn, C. Guallar-Hoyas, V. H. Moll, V. Bocos-Bintintan, G. Kaur-Atwal,
M. D. Howdle, E. L. Harry, L. J. Brown, C. S. Creaser, and C. L. P. Thomas
Centre for Analytical Science, Department of Chemistry, Loughborough University, Loughborough,
Leicestershire,
A thermal desorption unit has been interfaced to an electrospray ionization-ion mobility-
time-of-flight mass spectrometer. The interface was evaluated using a mixture of six
model volatile organic compounds which showed detection limits of <1 ng sample loaded
onto a thermal desorption tube packed with Tenax, equivalent to sampled concentrations
of 4 μg L-1. Thermal desorption profiles were observed for all of the compounds, and ion
mobility-mass spectrometry separations were used to resolve the probe compound
responses from each other. The combination of temperature programmed thermal
desorption and ion mobility improved the response of selected species against
background ions. Analysis of breath samples resulted in the identification of breath
metabolites, based on ion mobility and accurate mass measurement using siloxane
peaks identified during the analysis as internal lockmasses.
Introduction
The development of electrospray ionization (ESI) by Fenn and co-workers in 19841
enabled the routine analysis of macromolecules and revolutionized the role mass
spectrometry plays in the analysis of biological samples. It was suggested as early as
19862 that volatile organic compounds (VOCs) could also be ionized and detected with a
high degree of sensitivity using ESI. However the first effective demonstration of the
application of ESI to VOC analysis was not reported until 1994,3 when an ESI source was
interfaced to an ion mobility spectrometer. Hill and co-workers further developed this
approach, termed, secondary electrospray ionization (SESI),4 in conjunction with a hybrid
ion mobility-quadrupole mass spectrometer, which they used to study a number of illicit

2
drugs. The charged droplets from the electrospray were reacted with the VOCs in a
reaction cell placed immediately before the ion mobility drift cell. This work demonstrated
that SESI could be used as an effective ionization method for both gas chromatography
(GC) and liquid chromatography- mass spectrometry (LC-MS) experiments and that it was
also more sensitive than standard electrospray for the analysis of VOCs. SESI was also
later used to analyze vapors from explosives with detection limits at the sub-parts per
trillion level, further demonstrating the high sensitivity of the approach.5 Recent work
has shown that VOCs may be detected down to parts per quadrillion levels using
electrospray ionization and that the ESI source parameters can be optimized to give
selectivity toward specific ion species.6 Cooks et al. proposed an alternative approach,
called extractive electrospray ionization (EESI), where an electrospray source was placed
in close proximity to a nebulized sample spray.7 The two sprays overlap, and the charged
droplets from the electrospray collide with the neutral droplets resulting in the extraction
of analyte molecules from the neutral droplets into the charged droplets, which are then
ionized as they desolvate. Initially this technique was used to look at trace level
pesticides and explosives in urine, river water, and milk. No prior sample preparation was
required, due to the extractive nature of the process, and limits of detection down to
picomolar levels were reported. EESI has since been used to analyze a wide range of
VOCs emitted from different sources such as fruit,8 perfumes,9,10 and human skin.11
EESI-MS has also been used to analyze human breath.12,13 A study conducted in 2007
showed that EESI could be used to follow the concentration of an exhaled breath
metabolite (urea) from breath to breath.12 In the same year, Zenobi and co-workers
used EESI to look directly at exhaled breath and were able to detect involatile species
such as carbohydrates which were present after eating a meal.13 The analysis of breath
samples using gas chromatography/ mass spectrometry (GC/MS) has shown that a large
number of VOCs may be detected and that VOC profiles in human breath are
characterized by a huge degree of complexity. A significant feature of VOC profiles in
breath is the wide concentration range over which they are detected, with many
compounds of interest present at concentrations below the limits of detection for direct
breath analysis.14 In order to detect the VOCs which are present in breath at these lower
levels, a preconcentration technique is required. The use of thermal desorption (TD)
tubes as a method of trapping and preconcentrating VOCs from the gas phase has been
widely used in conjunction with GC/MS instrumentation.14-16 Thermal desorption has
3
also been hyphenated to ion mobility spectrometry and has been shown to be able to
distinguish between volatile and semivolatile biogenic amines based on their thermal
desorption properties.17 In addition to being able to preconcentrate VOCs, TD tubes
enable samples to be stored and easily transported from the point of collection to the
analytical laboratory. GC/MS analysis of breath samples is a time-consuming process,
with typical analysis times of an hour. If the separation could be performed faster, then
breath analysis would be much more viable as a screening technique for large numbers
of breath samples. Ion mobility (IM) spectrometry18 is a gas phase technique that
separates analyte on the millisecond time scale. IM has previously been used widely as a
stand alone system with 63Ni atmospheric pressure chemical ionization for the detection
of a range of different VOCs19 and has been coupled to GC separations for the analysis
of breath metabolites.20 IM can also be hyphenated to electrospray ionization for the
analysis of involatile species.21 The time scale of IM separations makes it ideally
compatible for hyphenation with time-of-flight mass spectrometry (TOF-MS). The recent
development of commercially available hybrid electrospray ion mobility-mass
spectrometers has enabled the fast, orthogonal separations associated with IM and MS
to be applied in a widespread way to biological analysis.22-24 This work describes the
first interfacing of a thermal desorption unit to an IM-MS using an ESI source. The
potential of TD-ESI-IM-MS for the rapid screening of breath volatiles as an alternative
technique to TD-GC/MS is demonstrated.
EXPERIMENTAL SECTION
Instrumentation.
The electrospray source of a Waters (Manchester, U.K.) Synapt ion mobility-quadrupole
time-of-flight mass spectrometer was modified to accommodate the outlet from a Markes
International (Swansea, U.K.) UNITY 1 thermal desorption unit. This was accomplished by
removing the lockspray baffle plate and the reference sprayer assembly. The front of the
source was opened to allow the heated transfer line of the UNITY containing a 0.25 mm
i.d. fused silica capillary to be introduced into the ESI source. (Note: care needed to be
exercised during this process as it was necessary to deactivate the source interlock
switches.) The outlet of the transfer line capillary from the UNITY was positioned
approximately 0.5-1 cm from the sample cone of the mass spectrometer and aligned to
a point approximately 5 mm from the electrospray emitter, so that the gas stream from

4
the thermal desorber was entrained toward the sample cone by the desolvation gas.
Figure 1 shows a schematic of the instrument setup and the positioning of the transfer
line outlet in relation to the sample cone. The UNITY thermal desorber carrier gas was
helium, which flowed through the system at a rate of approximately 3 mL min-1. Samples
were trapped on thermal desorption tubes, containing approximately 150 mg of Tenax.
The thermal desorption tubes were conditioned by heating at 300 °C for 6 h with a flow
rate of 100 mL min-1. Analytes were desorbed from the Tenax at 300 °C for 5 min and
retained on a cold trap held at -10 °C. The secondary desorption rate from the cold trap
was varied between 1 and 12 °C s-1 for breath samples and was set at 40 °C s-1 for the
standard samples run to characterize the system. The cold trap was heated to a
desorption temperature of 300 °C and was held for 5 min. The electrospray source was
set to operate in the positive mode with conditions as follows: capillary voltage 3 kV,
cone voltage 20 V, source temperature 120 °C, desolvation temperature 300 °C,
desolvation gas was nitrogen at a flow rate of 800 L h-1, cone gas was also nitrogen set at
20 L h-1. The electrospray solvent was 0.1% formic acid in 50/50 (v/v) methanol/water
infused into the source at 5 μL min-1. The ion mobility cell parameters were varied
depending on the drift times of the analytes investigated. The T-wave height and IM cell
gas pressure were varied between 7.0 and 11.5 V/cm and 20 and 40 units, respectively.
Sample Preparation. A mixture of six standards was prepared by mixing equal amounts
(100 μL) of 2-butanone, 2-nonanone, heptaldehyde, capronaldehyde, 2-octanol, and 2-
hexanol into high- purity dichloromethane (100 μL of each standard and 400 μL of DCM).
Aliquots of this mixture were loaded onto thermal desorption tubes either through direct
spiking (0.1 μL) or by evaporating (0.1 μL) into a headspace vial and then pumping the
vapor from the headspace into the adsorbent tube using a venturi pump. Breath samples
were collected from a healthy volunteer using an adaptive sampling technique described
elswhere.14 The work with human participants was conducted in accordance with the
ethical principles of Good Clinical Practice and the Declaration of Helsinki. The local
ethics committee (Loughborough University) approved the protocol before
commencement of the study.
RESULTS
Thermal Desorption of Standard Compounds.

5
In order to determine whether mass spectra could be obtained from the thermal
desorption of VOCs from thermal desorption tubes packed with Tenax, the system was
initially tested using 0.1 μL of a 10 ppmv solution of the six component mixture spiked
onto a previously blanked tube. Figure 2 shows the selected ion thermal desorption
profiles for each of these species. All of the compounds were detected in the mass
spectrum. Butan-2-one and nonan-2- one yielded the most intense responses and the
highest signal to- noise (peak to peak) ratio, in line with their higher proton affinities. The
alcohols and aldehydes showed significantly lower responses but can still clearly be seen
to be desorbed from their thermal desorption profiles, which show elevated levels
coinciding with the cold trap firing. Limits of detection were determined from the signal-
to-noise ratios obtained and were as follows: butan-2- one 0.085 ng, nonan-2-one 0.03
ng, 2-octanol 0.31 ng, 2-hexanol 0.65 ng, heptaldehyde 0.48 ng, and capronaldehyde
0.37 ng. Figure 2 also shows the differences in the thermal desorption profiles for each
of the different species. The most volatile species, 2-butanone (boiling point (BP) 80 °C)
was desorbed rapidly with the desorption profile maximum at 0.458 min from the start of
cold trap heating. This contrasts with the relatively less volatile species, octanol (BP 195
°C) with a desorption profile maximum at 0.502 min from the start of the cold trap
heating cycle. Overall, Figure 2 indicates that partial resolution is possible between the
thermal desorption profiles, for example, octanol and 2-butanone responses. This
observation suggests that careful control of the temperature programming of the thermal
desorption may enable better separation of species based on their volatility, giving an
extra degree of selectivity to the TD-ESI-IM-MS approach. Optimization of the ion mobility
cell was also performed by spiking the six model compounds onto a Tenax tube.
Reducing the traveling wave height to 7.0 V and increasing the nitrogen pressure in the
IM drift cell to 40 units, 0.91 mbar resulted in the best IM separation. The resulting
mass-selected ion mobility spectra are shown in Figure 3 corresponding to the
desorption of 0.80-0.83 ng of the model compounds from the Tenax tube. The partial
resolution in the mobility domain could be exploited to improve the relative intensity of
specific ion species. The total ion mobility trace in Figure 3 indicates that the ion mobility
can be used to enhance the response from the probe compounds relative to the
background response.
Breath Sample Analysis.

6
The optimum parameters for the ion mobility drift cell identified from the studies with the
six probe compounds were used for the analysis of breath samples collected on Tenax
tubes. Figure 4 shows an example of the total ion desorption profile obtained from a
breath sample against the tube blank. The strong response obtained from the breath
samples is evident, and further analysis in the mass and mobility domains was
undertaken. Figure 5 shows the mass spectrum obtained from a blank thermal
desorption tube (Figure 5A) and the TD-IM-MS spectrum of a breath sample (Figure 5B).
Figure 5C shows the background subtracted mass spectrum obtained over the expanded
mass range m/z 50-250. The mass spectrum obtained from the blank tube indicted the
presence of common background interferences (e.g., m/z 158.0842, 141.0549, and
214.1622). The ion at m/z 170.1556 was not removed by background subtraction and
originated from the thermal desorption process. Figure 5B shows a large number of
peaks that were not present in the blank analysis. Of interest were the siloxanes,
identified on the basis of m/z values and characteristic isotope patterns. The source of
these species in the breath sample has yet to be unequivocally determined, but the most
likely sources are probably the silicone seals used in the face mask and silicone tubing
used to connect the face mask to the air supply. Hexamethylcyclotrisiloxane (m/z
223.0642), octamethylcyclotetrasiloxane (m/z 297.0793), and
decamethylcyclopentasiloxane (m/z 371.0882) were identified, with
decamethylcyclopentasiloxane the base peak in the mass spectrum. Since the exact
masses of these species are known they can be used as internal lockmasses to calibrate
the mass spectra. The protonated molecular ion of hexamethylcyclotrisiloxane (exact
mass ) m/z 223.0642) was selected as a lockmass because it was present at an
intensity that did not cause the detector of the mass spectrometer to go into deadtime
and hence affect the mass accuracy of the experiment. The limited dynamic range of the
IM-MS in the ion mobility mode of operation prevented the higher intensity siloxanes
from being adopted as lockmasses. In addition to the siloxanes, there are significant
numbers of other peaks attributable to breath VOC and metabolites (Figure 5C), the
majority of which were observed at lower m/z ratios. The internal lockmass calibration
generated high enough mass accuracies for the prediction of elemental composition
(MassLynx software, Waters Micromass U.K.). Metabolites were identified with a high
degree of mass accuracy (<6 ppm), providing extra confidence in metabolite
assignments. For example, the major breath metabolite acetone25 was identified by the
7
[M + H]+ ion at m/z 59.0491 (expected 59.0497), a mass accuracy of 1.4 ppm. Five
replicate breath samples were analyzed using TD-ES-IM-MS; acetone was detected in all
five samples. The reproducibility of the mass measurement accuracy was calculated
using the siloxane peak as a lockmass with an average m/z ratio of 59.0494 and with a
relative standard deviation of 9.6 ⋅ 10-7%. The mean intensity of the acetone peak was
found to be 1.35 ⋅ 104 counts with a relative standard deviation of 13.5%. These data
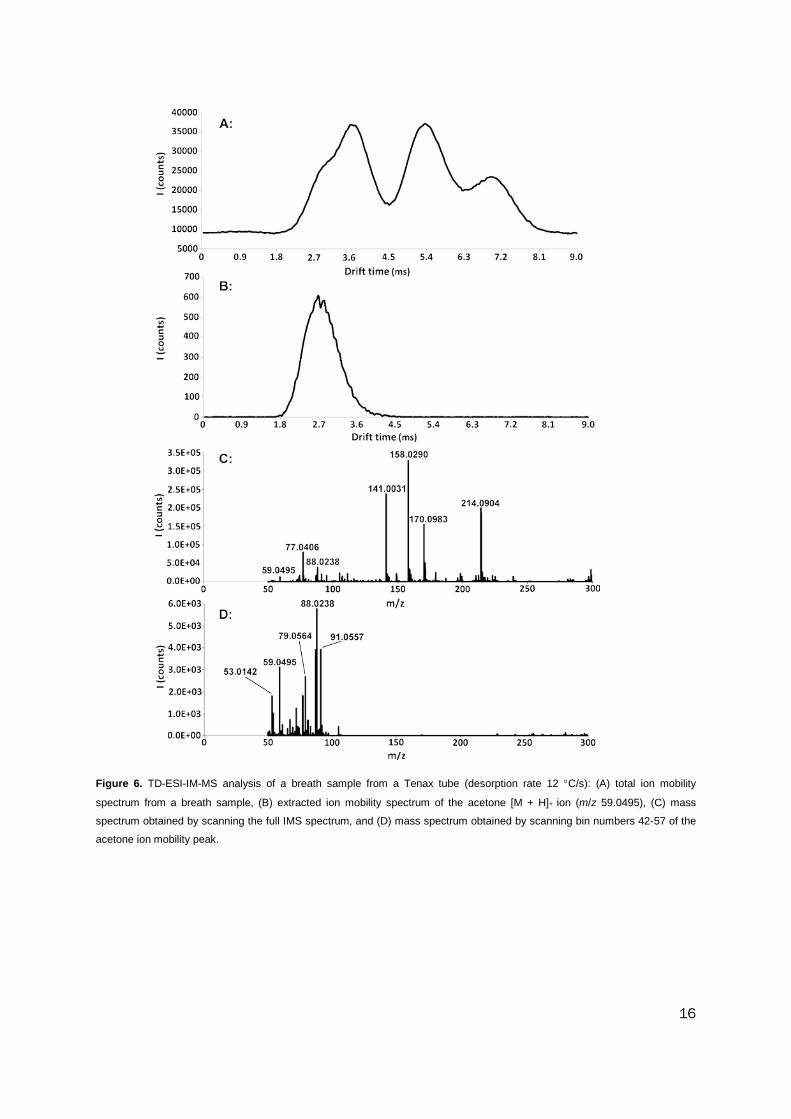
show good reproducibility and mass measurement accuracy between samples. The ion
mobility separation can be used to enhance the mass spectrum for a specific metabolite,
and an example of this is demonstrated in Figure 6. Parts A and B of Figure 6 contrast
the total ion mobility spectrum and the selected ion mobility response for acetone. The
relative intensity of the acetone peak in the mass spectrum (Figure 6C) obtained by
integrating the 200 scans of the ion mobility spectrum was 6%. The acetone peak in the
mass spectrum isolated from between 1.89 and 2.56 ms (Figure 6D) was much
enhanced with higher mass interferences eliminated and a significant increase in the
relative intensity (60%) of the acetone [M + H]+ response.
CONCLUSIONS
This work shows that thermal desorption can be successfully hyphenated to an
electrospray ion mobility-time-of-flight mass spectrometer. The TD-ESI-IM-MS technique
has been used to study standard compounds, volatile analytes, and metabolites sampled
from human breath. The technique has been shown to be able to detect subnanogram
levels of analyte desorbed from an adsorbent tube. Control of the temperature program
used in the thermal desorption process appears to have potential to introduce a time
domain to those of mass and mobility as part of the separation process to impart
additional selectivity to the technique. Volatile breath metabolites were isolated and
identified using accurate mass analysis. Such accuracy is sufficient to allow reliable
elemental composition predictions to be made. These initial data demonstrate the
viability of using thermal desorption with ion mobility-mass spectrometry. The ion mobility
cell generated an additional degree of selectivity, and partial resolution of the analyte
species was achieved with background interferences suppressed and spectral quality
improved. This work establishes the potential for increasing analysis speed in breath
screening by combining TD with IM-MS. Indeed, with further advances in the design of IM-
MS instrumentation, this could open the possibility of TD-IM-MS becoming a significantly

8
faster alternative for the rapid screening of VOCs to conventional GC based approaches.
Furthermore, a move to adsorbent based sampling in conjunction with IM-MS addresses
one of the significant barriers to implementing widespread breathbased screening and
research. Namely, samples from a large geographic region may be analyzed by a single
facility, significantly enhancing the capability in breath research and the development of
new diagnostic techniques.
ACKNOWLEDGMENT
The authors gratefully acknowledge the support given to G. J. Blackburn, C. Guallar-Hoyas
and E. L. Harry by AstraZeneca. G. J. Blackburn also gratefully acknowledges his BBSRC
CASE studentship. M. D. Howdle acknowledges his EPSRC CASE studentship supported
by GlaxoSmithKline. L. J. Brown acknowledges the support provided by Owlstone Ltd. V.
H. Moll, V. Bocos- Bintintan were supported jointly by John Hoggs Technical Solutions
Shell Global Solutions and the Technology Strategy Board.
References
(1) Yamashita, M.; Fenn, J. B. J. Phys. Chem. 1984, 117, 4451.
(2) Whitehouse, C. M.; Levin, F.; Meng, C. K.; Fenn, J. B. Proceedings of the 34th ASMS
Conference on Mass Spectrometry and Allied Topics, Denver, CO, 1986; p 507.
(3) Chen, Y. H.; Hill, H. H.; Wittmer, D. P. J. Microcolumn Sep. 1994, 6, 1994.
(4) Wu, C.; Siems, W. F.; Hill, H. H. Anal. Chem. 2000, 72, 396.
(5) Tam, M.; Hill, H. H. Anal. Chem. 2004, 76, 2741.
(6) Dillon, L.; Fielden, P. R.; Goddard, N. J.; Thomas, C. L. P. Analyst Submitted for
publication.
(7) Chen, H.; Venter, A.; Cooks, R. G. Chem. Commun. 2006, 2042.
(8) Chen, H.; Sun, Y.; Wortmann, A.; Gu, H.; Zenobi, R. Anal. Chem. 2007, 79, 1447.
(9) Chingin, K.; Gamez, G.; Chen, H.; Zhu, L.; Zenobi, R. Rapid Commun. Mass Spectrom.
2008, 22, 2009.
(10) Chingin, K.; Chen, H.; Gamez, G.; Zhu, L.; Zenobi, R. Anal. Chem. 2009, 81, 123.
(11) Chen, H.; Yang, S.; Wortmann, A.; Zenobi, R. Angew. Chem., Int. Ed. 2007, 46, 759.
9
(12) Martinez-Lozano, P.; Fernandez de la Mora, J. Int. J. Mass Spectrom. 2007, 265,
6872.
(13) Chen, H.; Wortmann, A.; Zhang, W.; Zenobi, R. Angew. Chem., Int. Ed. 2007, 46,
580.
(14) Basanta, M.; Koimtzis, T.; Singh, D.; Wilson, I.; Thomas, C. L. P. Analyst 2007, 132,
153.
(15) Van Berkel, J. J. B. N.; Dalling, J. W.; Moeller, G. M.; Godschalk, R. W. L.; Moonen, E.;
Wouters, E. F. M.; Van Schooten, F. J. J. Chromatogr., B 2008, 861, 101.
(16) Harper, M. J. Chromatogr., A 2000, 885, 129.
(17) Karpas, Z.; Chaim, W.; Gdalevsky, R.; Tilman, B.; Lorber, A. Anal. Chim. Acta 2002,
474, 115.
(18) Creaser, C. S.; Griffiths, J. R.; Bramwell, C. J.; Noreen, S.; Hill, C. A.; Thomas, C. L. P.
Analyst 2004, 129, 984.
(19) Steinfeld, J. I.; Wormhoudt, J. Annu. Rev. Phys. Chem. 1998, 49, 203.
(20) Ruzsanyi, V.; Baumbach, J. A.; Sielemann, S.; Litterst, P.; Westhoff, M.; Freitag, L. J.
Chromatogr., A 2005, 1084, 145.
(21) Budimir, N.; Weston, D. J.; Creaser, C. S. Analyst 2007, 132, 34–40.
(22) Pringle, S. D.; Giles, K.; Wildgoose, J. L.; Williams, J. P.; Slade, S. E.; Talassinos, K.;
Bateman, R. H.; Bowers, M. T.; Scrivens, J. H. Int. J. Mass Spectrom. 2007, 261, 1.
(23) Weston, D. J.; Bateman, R.; Wilson, I. D.; Wood, T. R.; Creaser, C. S. Anal. Chem.
2005, 77, 7572.
(24) Kaur-Atwal, G.; Weston, D. J.; Green, P. S.; Crosland, S.; Bonner, P. L. R.; Creaser, C.
S. Rapid Commun. Mass Spectrom. 2007, 21, 1131.

10
Figure 1. Schematic of the mass spectrometer electrospray source showing the positioning of the thermal desorption unit outlet capillary with respect to the sample inlet cone.

11
Figure 2. Offset mass selected thermal desorption profiles for the six probe compounds (on-trap masses ) 0.805-0.832 ng).
These responses clearly illustrate the different ionization yields observed for the different species, the signal-to-noise (ptp) ratio,
and the different desorption time maxima, indicating the potential of introducing an additional degree of separation.

12
Figure 3. Offset normalized selected ion mobility spectra of six model compounds and
the total ion mobility spectrum: (A) total IM spectrum, (B) capronaldhyde, (C)

13
heptaldehyde, (D) hexanol, (E) octanol, (F) 2-nonanone proton bound dimer, (G) 2-
nonanone, and (H) 2-butanone.

14
Figure 4. TD-ESI-IM-MS analysis of tube 150 prior to taking a breath sample (bottom) and tube 150 after taking a breath
sample (top). The desorption rate was 12 °C s-1.

15
Figure 5. TD-ESI-IM-MS analysis of a breath sample from a Tenax tube (desorption rate 1 °C/s): (A) tube 483 blank mass
spectrum taken prior to breath sampling, (B) mass spectrum (background subtracted) obtained from a breath sample collected
on tube 483, and (C) expanded low m/z region of the spectrum in part B.
16
Figure 6. TD-ESI-IM-MS analysis of a breath sample from a Tenax tube (desorption rate 12 °C/s): (A) total ion mobility
spectrum from a breath sample, (B) extracted ion mobility spectrum of the acetone [M + H]+ ion (m/z 59.0495), (C) mass
spectrum obtained by scanning the full IMS spectrum, and (D) mass spectrum obtained by scanning bin numbers 42-57 of the
acetone ion mobility peak.