application of novel metabolic engineering tools for
TRANSCRIPT

KU LEUVEN
FACULTY OF SCIENCE
DEPARTEMENT OF BIOLOGY
Laboratory of Molecular Cell Biology
Dissertation presented in partial fulfilment
of the requirements for the degree of Doctor in Biology
Application of novel metabolic engineering tools
for engineering of the complex trait of glycerol yield in
Saccharomyces cerevisiae
Georg Hubmann
Supervisors: Prof. Dr. Johan Thevelein
Prof. Dr. Elke Nevoigt
Members of the Examination Committee:
Prof. Dr. P. Van Dijck
Prof. Dr. B. Teusink
Prof. Dr. K. Verstrepen
Prof. Dr. S. Guillouet
Dr. M. Foulquié-Moreno
– Leuven 2013 –
© 2013 KU Leuven, Science, Engineering & Technology
v.u. Leen Cuypers, Arenberg Doctoraatsschool, W. de Croylaan 6, 3001 Heverlee
Alle rechten voorbehouden. Niets uit deze uitgave mag worden vermenigvuldigd en/of openbaar gemaakt
worden door middel van druk, fotokopie, microfilm, elektronisch of op welke andere wijze ook zonder
voorafgaandelijke schriftelijke toestemming van de uitgever.
All rights reserved. No part of the publication may be reproduced in any form by print, photoprint, microfilm,
electronic or any other means without written permission from the publisher.
ISBN 978-90-8649-618-1
Wettelijk depot D/2013/10.705/33

“We have merely scratched the surface of the store of knowledge
which will come to us. I believe that we are now, a-tremble on the
verge of vast discoveries - discoveries so wondrously important
they will upset the present trend of human thought and start it
along completely new lines.”

Acknowledgements
This research work was supported by the DFG (Deutsche Forschungsgemeinschaft), the
Agency for Innovation by Science and Technology (IWT-Flanders) and the EC 7th
Framework program, NEMO.
I want to thank my supervisors, Prof. Dr. Johan Thevelein and Prof. Dr. Elke Nevoigt for
giving me the opportunity to work together for more than four years. Their great supervision,
unbroken support and motivation was enormous and of great help to bring this research work
to completion. I would also like to express my gratitude to the members of my examination
committee, Prof. Dr. Patrick Van Dijck, Prof. Dr. Bas Teusink, Prof. Dr. Kevin Verstrepen,
Prof. Dr. Stephane Guillouet, Dr. M. Foulquié-Moreno and my supervisors, Prof. Dr. Johan
Thevelein and Prof. Dr. Elke Nevoigt for critical reading and commenting of the manuscript.
I would like to thank my colleagues Dr. Maria Foulquié-Moreno, Dr. Yudi Yang, Dr. Thiago
Pais, almost Dr. Mekonnen Demeke, Dr. Jean Paul Meijnen, Dr. Ben Souffriau and of course
all other members of the Genetic Analysis Group for stimulating discussions and good
cooperation during my PhD. Thanks also to the technicians Catherina Coun, Martine De
Jonge, Eef Allegaert, Evy Vanderheyden, Nico Vangoethem, Jan Wouters and Paul
Vandecruys, who organize the daily work in the laboratory and therefore, greatly support
one's own work in every respect. Of course I would like to express my greatest gratitude to the
two most indispensible persons @MCB, Leni Vandoren and Hilde Florquin, for the Dutch
lessons and the introduction to the Flemish culture and for having a open ear for all
problems. Finally, I would like to thank my students Lotte Mathe, Hind Hashweh and Ilke
Suder for their work and good cooperation during the internship or master thesis. Best wishes
for the future and thanks for all. It was a pleasure for me to teach you about the world of
yeast.
Also, I want to thank the team of the Cargill R&D center in Vilvoorde, Dr. Jean-Claude de
Troostembergh, Dr. Luigi Concilio and Nicolas Meurens for good team work and support of
this work.
Many thanks go to all my colleagues and friends, Harish, Dries, Joep, Tom & Tom, Joana,
Huyen and all other @MCB for a pleasant working atmosphere and adventurous time that we
speed together in the lab and outside. Thanks to my friends Frido, Vinay, Vipul and Uli for
the time together in Leuven, for sharing the good and bad times.
Special thanks go to all workers of the NMBS, who decided to go on strike before Christmas
2011. Thanks to their help, I met the loveliest person, who ever since I love and adore at
Leuven's train station on the 23rd
December at 6:27 am in the morning. Nadja, I want to thank
you for sharing so many moments with me in the past year, for your help and support
especially during the final phase of my PhD. I gratefully appreciate this and hope that there
are many more years for us to come.
Georg Hubmann
May 20, 2013

Table of Contents
TABLE OF CONTENTS .................................................................................................. VI
LIST OF FIGURES ........................................................................................................... IX
LIST OF TABLES ............................................................................................................ XI
LIST OF ABBREVIATIONS .......................................................................................... XII
LIST OF GENES AND GENE PRODUCTS ................................................................ XIV
SUMMARY ................................................................................................................ XVI
SAMENVATTING ....................................................................................................... XVII
Introduction ................................................................................................................ 1
CHAPTER I
Literature Overview
1. Yeast of the Saccharomyces sensu stricto family ................................................. 6
2. Alcoholic fermentation ......................................................................................... 7
2.1 Alcoholic beverages ................................................................................................................. 7
2.2 Bioethanol production .............................................................................................................. 9
3. Glycerol formation in Saccharomyces cerevisiae ............................................... 14
3.1 Glycerol Metabolism .............................................................................................................. 15
3.2 Osmoadaption in Saccharomyces cerevisiae .......................................................................... 18
3.3 The role of glycerol in Saccharomyces cerevisiae redox metabolism .................................... 29
3.4 Glycerol formation as complex trait in yeast .......................................................................... 33

Table of Contents VII
4. Engineering of Saccharomyces cerevisiae for Ethanol Fermentation ................ 34
4.1 Metabolic engineering of Saccharomyces cerevisiae – importance and strategies ................ 34
4.2 Previous approaches to optimize yields in ethanol production ............................................... 38
5. Conclusions and scope of the present thesis ....................................................... 49
CHAPTER II
Gpd1 and Gpd2 fine tuning for sustainable reduction of glycerol formation
in Saccharomyces cerevisiae
1. Abstract ............................................................................................................... 52
2. Bibliographic references ..................................................................................... 53
3. Scientific contribution ......................................................................................... 53
4. Manuscript I ........................................................................................................ 54
4.1 Introduction ............................................................................................................................ 54
4.2 Materials and Methods ........................................................................................................... 56
4.3 Results .................................................................................................................................... 62
4.4 Discussion .............................................................................................................................. 72
CHAPTER III
Quantitative trait analysis of yeast biodiversity yields novel gene tools
for metabolic engineering
1. Abstract ............................................................................................................... 78
2. Bibliographic references ..................................................................................... 79
3. Scientific contribution ......................................................................................... 79
4. Manuscript II ....................................................................................................... 80
4.1 Introduction ............................................................................................................................ 80
4.2 Materials and Methods ........................................................................................................... 83
4.3 Results .................................................................................................................................... 93
4.4 Discussion ............................................................................................................................ 108
4.5 Supplementary material ........................................................................................................ 112

VIII Table of Contents
CHAPTER IV
Identification of multiple alleles conferring low glycerol and high ethanol yields
in Saccharomyces cerevisiae ethanolic fermentation.
1. Abstract ............................................................................................................. 120
2. Bibliographic references ................................................................................... 121
3. Scientific contribution ....................................................................................... 121
4. Manuscript III ................................................................................................... 122
4.1 Introduction .......................................................................................................................... 122
4.2 Materials and Methods ......................................................................................................... 125
4.3 Results .................................................................................................................................. 132
4.4 Discussion ............................................................................................................................ 144
4.5 Supplementary material ........................................................................................................ 148
CHAPTER V
General discussion and future perspectives
1. Application and valorisation of the project ....................................................... 156
2. Genetic configurations of strains with reduced glycerol synthesis ................... 157
3. Extending the toolbox for yeast metabolic engineering .................................... 161
4. Designed on the drawing board: Future cell factories ...................................... 162
REFERENCES ................................................................................................................ 165

List of Figures IX
List of Figures
CHAPTER I
Figure 1 Trends of corn and ethanol production in the United States of America since 1981 ........ 11
Figure 2 Annually real price indices of food, sugar and cereals from 1990 to 2011 ....................... 12
Figure 3 Glycerol Metabolism in Saccharomyces cerevisiae. ......................................................... 16
Figure 4 High osmolarity glycerol pathway in Saccharomyces cersvisiae. .................................... 20
Figure 5 Activation of the Sln1 branch in high osmolarity ............................................................. 21
Figure 6 Hog1 dependent cytosolic changes after a hyperosmotic shock ....................................... 25
Figure7 Overview of the differential expression of functional gene families upon
osmotic stress .................................................................................................................... 27
Figure 8 Mechanisms of Hog1 dependent transcriptional regulation upon osmostress .................. 28
Figure 9 Mechanism of NADH oxidation and transport in Saccharomyces cerevisiae .................. 31
Figure 10 Quantitative trait locus (QTL) mapping in Saccharomyces cerevisiae ............................. 37
Figure 11 Major metabolites produced in an ethanol fermentation process
of Saccharomyces cerevisiae ............................................................................................ 39
Figure 12 Metabolic engineering strategies directly targeting glycerol synthesis or transport ......... 42
Figure 13 Changing the NADH/ NADPH cofactor imbalance ......................................................... 46
Figure 14 Co-fermentation of substrates or alternative reduced product formation .......................... 48
CHAPTER II
Figure 1 Schematic overview showing the generation of 11 Saccharomyces cerevisiae
strains with reduced levels of Gpd1 and Gpd2 ................................................................. 63
Figure 2 Specific GPDH activity and glycerol yields of Saccharomyces cerevisiae
wild type and engineered strains ....................................................................................... 64
Figure 3 Growth of Saccharomyces cerevisiae wild type and engineered strains with
reduced levels of Gpd1 and Gpd2 ..................................................................................... 65
Figure 4 Ethanol yields (A), maximal volumetric ethanol production rates (B), biomass yields (C)
and acetate yields (D) of Saccharomyces cerevisiae wild type and engineered strains .... 69

X List of Figures
CHAPTER III
Figure 1 Variation in glycerol and ethanol yield ............................................................................. 94
Figure 2 Glycerol and ethanol yield in the segregants of the diploid parent strains and
in segregants from the cross between the selected haploid parent strains ......................... 95
Figure 3 Plots of SNP variant frequency versus chromosomal position and
corresponding P-values ..................................................................................................... 98
Figure 4 SNP variant frequency and P-values determined in individual segregants
for downscaling of the QTLs .......................................................................................... 100
Figure 5 Identification of SSK1 as the causative gene in the QTL on chromosome XII ............... 101
Figure 6 Glycerol and ethanol yield after deletion or reciprocal exchange of the SSK1 alleles .... 104
Figure 7 Glycerol and ethanol yields and osmostress tolerance in fermentations with the
industrial bioethanol production strain Ethanol Red in which one or two copies
of the ssk1E330N…K356N allele had been introduced ............................................................ 107
CHAPTER IV
Figure 1 Phenotypes of the parental strains ER7A and CBS4C and the segregant 26B ................ 133
Figure 2 Glycerol and ethanol yield in the parental strains, segregant 26B and ER7A ................. 134
Figure 3 Plots of SNP variant frequency versus chromosomal position and corresponding
probability of linkage to the superior or inferior parent .................................................. 136
Figure 4 Linkage analysis of QTLs on chr. II, IV and XIII with different groups
of segregants. .................................................................................................................. 138
Figure 5 Reciprocal hemizygosity analysis ................................................................................... 140
Figure 6 Epistatic analysis of gpd1L164P in segregant 26B, ER7A, the diploid 26B x ER7A
and BY4742 .................................................................................................................... 142
Figure 7 Presence of 26B alleles, smp1R110Q,P269Q, gpd1L164P and hot1P107S,H274Y,
in the selected segregant population ............................................................................... 143
CHAPTER V
Figure 1 Multi - level control of high osmolarity glycerol pathway
in Saccharomyces cersvisiae ........................................................................................... 160

List of Tables XI
List of Tables
CHAPTER II
Table 1 Saccharomyces cerevisiae strains used ............................................................................. 57
Table 2 PCR primers and plasmids used ........................................................................................ 58
Table 3 Fermentation time, product yields and carbon balances of engineered
strains of Saccharomyces cerevisiae ................................................................................. 67
Table 4 Performance of engineered strains of Saccharomyces cerevisiae with reduced
levels of Gpd1 and Gpd2 .................................................................................................. 71
CHAPTER III
Table 1 Saccharomyces cerevisiae strains used ............................................................................. 84
Supplementary Table 1: Primers used ............................................................................................. 112
Supplementary Table 2: Plasmids used in this study ....................................................................... 115
CHAPTER IV
Table 1 Saccharomyces cerevisiae strains used ........................................................................... 125
Supplementary Table 1: Primers used ............................................................................................. 148
Supplementary Table 2: Plasmids used in this study ....................................................................... 153

XII List of Abbreviations
List of Abbreviations
AMP Adenosine monophosphate
ATP Adenosine triphosphate
BC Before christ
bp Base pair(s)
Cmol Moles carbon of a substance
CO2 Carbon dioxide
Co –A Coenzyme A
DHA Dihydroxy acetone
DHAP Dihydroxy acetone phosphate
DNA Deoxyribonulcleic acid
DOI Digital object identifier
DTT Dithiothreitol
dNTP Nucleotide triphosphate
EDTA Ethylendiaminetetraacetic acid
FAD Flavin adenine dinucleotide
FAO Food and Agriculture Organization of the United Nation
GAP Glyceraldehyde 3-phosphate
GAPDH NAD+ dependent glyceraldehyde 3-phosphate dehydrogenase
GPDH NAD+ dependent glycerol 3-phosphate dehydrogenase
HDAC Histone deacetylase complex
HOG High osmolarity glycerol pathway
HPLC High performance liquid chromatrography
LB Luria-Bertani medium
L-G3P Glycerol 3-phosphate
M Molar, mol/l
MAPK Mitogen-activated protein kinase
MAPKK Mitogen-activated protein kinase kinase
MAPKKK Mitogen-activated protein kinase kinase kinase
NADH Nicotinamide adenine dinucleotide (reduced)
NAD+
Nicotinamide adenine dinucleotide (oxidised)

List of Abbreviations XIII
NADPH Nicotinamide adenine dinucleotide phosphate (reduced)
NADP+ Nicotinamide adenine dinucleotide phosphate (oxidised)
O2 Oxygen
OD Optical density
PCR Polymerase chain reaction
PEG Polyethylene glycol
PMSF Phenylmethylsulfonyl flourid
QT Quantitative trait
QTL Quantitative trait locus
RHA Reciprocal hemizygosity analysis
RI Refraction index
RNA Ribonulcleic acid
rpm Rounds per minute
RQ Respiratory quotient
SAGA Spt-Ada-Gcn5-acetyltransferase histone acetylase complex
SDS Sodium dodecyl sulfate
SHF Separate hydrolysis and fermentation
SNP Single nucleotide polymorphism
SNV Single nucleotide variant
SSF Simultaneous saccharification and fermentation
STRE Stress response element
SWI/SNF Multi protein complex involved in nucleosome remodelling
TCA Tricarboxylic acid cylce
TEA Triethanolamine
TF Transcription factor
TPI Triosephosphate isomerase
Tris Tris (hydroxymethyl) aminomethane
UV Ultra violett
v/v Volume per volume [%]
w/v Weight per volume [%]
YD Complex medium (1 % yeast extract, 2 % D-glucose)
YPD Complex medium (1 % yeast extract, 2 % peptone 2 % D-glucose)

XIV List of Genes and Gene Products
List of Genes and Gene Products
ACS1, ACS2 Acetyl-coA synthetase
ADH1, ADH2,
ADH3 Alcohol dehydrogenase
AMD1 Amidase of Zygosaccharomyces rouxii
bleR Phleomycin resistance marker
CDC42 Small rho-like GTPase
CYC8 General transcriptional co-repressor
DAK1, DAK2 Dihydroxyacetone kinase
FPS1 Plasma membrane channel involved in efflux of glycerol
frdA NAD+
dependent fumarate reductase of Escherichia coli
GAL1 Galactose inducable promoter
gapN NADP+
dependent glyceraldehyde 3-phosphate dehydrogenase of
Streptococcus mutans
non-phosphorylating NADP+
dependent glyceraldehyde 3-phosphate
dehydrogenase from Bacillus cereus, or Kluyveromyces lactis
GCY1 NADP+ dependent glycerol dehydrogenase
GDH1 NADP+ dependent glutamate dehydrogenase
GIN11 X - element of the subtelomeric regions
gldA NADH dependent glycerol dehydrogenase
GLN1 Glutamine synthetase
GLT1 NAD+
dependent glutamate synthase
GPD1, GPD2 Glycerol 3-phosphate dehydrogenase
GPP1, GPP2
GRE3 Aldose reductase
GUT1, GUT2 Glycerol kinase
GUP1, GUP2 Plasma membrane protein involved in remodeling GPI anchors
HOG1 Mitogen-activated protein kinase involved in osmoregulation
HOT1 Transcription factor inducing glycerol biosynthetic genes
KanMX6 Kanamycin resistence gene
mgsA NADPH dependent methylglyoxcal synthase

List of Genes and Gene Products XV
mhpF NAD+
dependent acetaldehyde dehydrogenase of Escherichia coli
MSB2 Mucin family member involved in signaling;
MSN2, MSN4 Transcriptional activator; activated in stress conditions
NAT1 Nourseothricin N-acetyl-transferase of Streptomyces noursei
NDI1 NADH:ubiquinone oxidoreductase
NDE1, NDE2 Mitochondrial external NADH dehydrogenase
NMD5 Karyopherin carrier protein involved in nuclear import of proteins
PBS2 MAP kinase kinase of the HOG signaling pathway
PFK26, PFK27 6-phosphofructo-2-kinase
PGK1 3-phosphoglycerate kinase
PTC1 Type 2C protein phosphatase (PP2C); dephosphorylates Hog1
PTP2, PTP3 Phosphotyrosine-specific protein phosphatase
RPD3 Histone deacetylase
SHO1 Transmembrane protein involve in osmosensing
SKO1 Basic leucine zipper transcription factor of the ATF/CREB family
SLN1 Histidine kinase osmosensor
SMP1 Transcription factor of the MADS-box family
SOR1 Sorbitol dehydrogenase
srlD NADH/ NADPH dependent sorbitol 6-phosphate dehydrogenase of
Escherichia coli
SSK1 Cytoplasmic response regulator
SSK2, SSK22 MAP kinase kinase kinase of the HOG signaling pathway
STE11 Signal transducing MEK kinase
STE20 Cdc42p-activated signal transducing kinase
STE50 Adaptor that links G protein-associated Cdc42p-Ste20p complex
STL1 Glycerol proton symporter of the plasma membrane
TEF1 Translation Elongation Factor 1
TDH1, TDH2
TDH3 Glyceraldehyde-3-phosphate dehydrogenase
TUP1 General repressor of transcription
URA3 Orotidine-5'-phosphate decarboxylase
YPD1 Phosphorelay intermediate protein

XVI Summary
Summary
The yeast, Saccharomyces cerevisiae is still the prime species used in ethanol production.
Traditionally, ethanol has been produced from raw materials such as sugar cane or sugar beet
and starch from corn or other grains. Future expansion of ethanol production are planed its
use as a biofuel requiring the utilization new non- food resources, particularly lignocelluloses.
In the present and future ethanol production process, the expenditure for the raw material is a
significant cost factor. Although industrial yeast strains are very efficient in producing
ethanol, the current ethanol yield (90 - 93% of the theoretical maximum) could in principle be
further improved. Particularly, the synthesis of glycerol, a major by-product of alcoholic
fermentation, has been regarded as a wasteful process. The overall goal of this project was to
develop novel industrial yeast strains, which are able to produce more ethanol from the
traditional and future raw materials by reducing the yield of the undesirable by-product
glycerol. The challenge herein is that glycerol serves different important physiological
functions such as redox balancing and osmotic stress tolerance. In this project, two alternative
avenues were used to identify a genetic configuration for a ‘low glycerol’ producer strain. The
first approach was a rational engineering strategy aiming to finely tune the activity of the rate-
limiting enzyme of glycerol synthesis, the glycerol 3-phosphate dehydrogenase. The basic
idea here was to gradually reduce the expression of the corresponding genes, GPD1 and
GPD2, by replacing their native promoters through mutated low strength TEF1 promoter
versions. After the promoter exchange, the mutants were characterized for their residual
glycerol formation, fermentation and growth. In the second approach, the genetic
configuration of wild-type yeast with low glycerol yields were analyzed. Its genetic
determinants, which cause the ‘low glycerol’ phenotype were identified, using an advanced
genetic mapping methodology base on next-generation pooled segregants whole-genome
sequence analysis. The four genes, GPD1 SSK1 SMP1 and HOT1 were identified, which
harbored mutations linked to the 'low glycerol' phenotype. The SSK1 allele of the superior
low producing glycerol strain, ssk1E330N...K356N
was subsequently used as novel gene tool for
targeted genetic improvement of the ethanol yield of a frequently used ethanol production
strain with minimal risk of affecting its other industrially important traits.

Samenvatting XVII
Samenvatting
De gist, Saccharomyces cerevisiae is nog steeds het belangrijkste micro-organisme dat
gebruikt wordt voor de productie van ethanol. Traditioneel wordt ethanol geproduceerd uit
grondstoffen zoals suikerriet of suikerbieten en zetmeel uit maïs of andere granen.
Toekomstige uitbreiding van de ethanolproductie vereist het gebruik van nieuwe suiker- en
zetmeelbronnen die niet als voedsel dienen, voornamelijk lignocellulose, voor de productie
van biobrandstof In het huidige en toekomstige ethanol productieproces, is het verbruik van
grondstoffen een belangrijke kostenfactor. Hoewel industriële giststammen zeer efficiënt zijn
in het produceren van ethanol, kan het huidige ethanol rendement (90 - 93% van het
theoretische maximum) in principe verder verbeterd worden. De synthese van glycerol, een
belangrijk bijproduct van alcoholische gisting, wordt in het bijzonder beschouwd als een
verspilling van grondstoffen. Het doel van dit project was om nieuwe industriële giststammen
te ontwikkelen, die in staat zijn om meer ethanol te produceren uit de traditionele en
toekomstige grondstoffen door de vorming van het ongewenste bijproduct glycerol te
verminderen. De uitdaging ligt in het feit dat glycerol verschillende belangrijke fysiologische
functies in de cel vervult, zoals behouden van het redox evenwicht en beschermen van de cel
bij osmotische stress. In dit project werden twee alternatieven gebruikt om een genetische
configuratie voor een stam met lage glycerol productie te identificeren. De eerste benadering
is een rationele strategie gebaseerd op de beschikbare kennis over het snelheidsbepalend
enzym in glycerol synthese door gist. Het basis idee is de expressie van dit enzym gelijkmatig
te verminderen en zo te onderzoeken hoeveel glycerol moet gevormd worden opdat de cel
goed kan fermenteren en groeien. In de tweede benadering wordt de genetische configuratie
van bestaande wild-type gist stammen met lage glycerol productie tijdens fermentatie
geanalyseerd. De genetische factoren, die dit 'lage glycerol' fenotype veroorzaken worden
geïdentificeerd met behulp van een geavanceerde genetische karteringsmethode gebaseerd op
‘next-generation pooled segregants whole genome sequence analysis’. De geïdentificeerde
causatieve factoren worden gebruikt als nieuw 'gene tools' voor doelgerichte genetische
verbetering van de ethanol opbrengst van een gist stam vaak gebruikt voor ethanolproductie
op een manier waarop zijn andere industrieel belangrijke eigenschappen minimaal worden
beïnvloedt.


Introduction
The production of ethanol by fermentation of grape juices or hydrolyzed cereals originates
from time immemorial. Earliest evidences for preparation of alcoholic beverages and bread
using yeast are dating back to 7000BC in China. Since that time fermentation technology
spread outwards from Asia, Mesopotamia and Egypt (Dequin and Casaregola, 2011) to
become the most important and the most widely used biotechnological process in the world.
Ethyl alcohol is produced in the form of alcoholic beverages such as beer, wine, cider and
other flavoured alcoholic beverages, which contain a low amount of ethanol or in form of
distilled spirits, like whisky, rum and vodka, where the ethanol concentration exceeds more
than a third of the total volume. In 2011, the global alcoholic beverage industry produced a
volume of 206.7 billion litres, reaching a market value of $1 trillion1. Besides the
consumption in alcoholic beverages, pure ethanol is also used as alternative fuel to substitute
mineral fuels in motor vehicles. Over the past decade, demand and production of fuel ethanol
grew exponentially, resulting in a production of 85 billion litres ethanol in 20122 mainly in the
United States and Brazil, which are the two largest producers in the world.
Despite the centuries-old economical importance, the alcoholic fermentation process itself
remained mysterious for a long time and the earliest investigations only started in the 19th
century by the two chemists, Antoine Lavoisier (1789) and Joseph Gay-Lussac (1810). Both
scientists described the “alcoholic fermentation” phenomenon as a chemical conversion of
sugar to carbonic acid and alcohol without being aware of the central role of yeast in this
process. It is astonishing how precisely Gay-Lussac predicted the weight parts of the formed
products, laying the foundation of the equation describing the chemical conversion during
alcoholic fermentation:
C6H12O6 ➝ 2 C2H5OH + 2 CO2
1Alcoholic Drinks: Global Industry Guide, MarketLine March 2012
2F.O. Licht’s World Ethanol & Biofuel Report

2 Introduction
In the early nineteenth century, light microscopy improved considerably, enabling people to
visualize small microbes. This opened up the possibility to study the microbiology of
fermentation and putrefaction. These processes caused the spoilage of vast quantities of wine
in those days. The three scientists, Charles Cagniard-Latour, Friedrich Kützing and Theodor
Schwann discovered and described the microbes responsible for the alcoholic fermentation
for the first time in history. In 1837, Schwann published his observation on alcoholic
fermentation (Schwann, 1837), which describes yeast as a living organism resembling fungi.
Furthermore, he concluded that alcoholic fermentation is started by the development of the
fungus decomposing the available sugar. Schwann’s idea of yeast as a living organism was
opposed by the famous chemists of these days, Jöns Berzelius, Justus von Liebig and
Friedrich Wöhler, which defined fermentation as being a purely physico-chemical
phenomenon. According to their theory, alcoholic fermentation was a chemical
decomposition of sugary plant juice after exposure to air, in which yeast was a body
composed from degenerated molecules (Barnett, 2003). The rejection of this theory and
acceptance of yeast as living organism came nearly two decades later by the work of Louis
Pasteur (Pasteur, 1857), who affirmed yeast as a microorganism causing the alcoholic
fermentation. In addition, he found other fermentation products, for instance glycerol and
succinic acid, besides ethanol and carbon dioxide formed in this physiological process.
In the late nineteenth and early twentieth century, yeast sugar metabolism was further studied
using cell free yeast extracts by Emil Fischer (Fischer, 1894; Fischer and Thierfelder, 1894)
and Eduard Buchner (1897). Their discoveries were the first comprehensive studies of
enzymes and laid the foundation for modern biochemistry. Ever since the discovery of
Lavoisier and Gay-Lussac, one can truly say that studying alcoholic fermentation in yeast has
been the driving force for many new scientific findings in microbiology and biochemistry.
This also explains why Saccharomyces cerevisiae has become a model organism in biology,
which is extraordinary well characterized as a biological system. In fact, the Saccharomyces
cerevisiae genome was the first to be fully sequenced (Goffeau et al, 1996) and many genes
and their function are already known. This paved the way to study systematically the
genotype - phenotype relations. Moreover, yeast is used as model organism for higher
eukaryotes due to the conservation of many pivotal structural and regulatory pathways.
Besides the basic research, our comprehensive knowledge of yeast can be applied to optimize
yeasts for biotechnological applications. In particular, the production of ethanol used as

Introduction 3
biofuel has become a prominent subject in the last decade. Key challenges in engineering
yeasts are the extension of substrate utilization, the optimization of the product formation and
the improvement of robustness and stress tolerance (Stephanopoulos, 2007) in order to create
tailor made Saccharomyces cerevisiae strains, which are perfectly suited for their specific
industrial applications.
During its millennia-long domestication, yeast adapted almost perfectly to the fermentation
environment and became very efficient in producing ethanol, reaching currently 90 - 93% of
the theoretical maximum ethanol yield. However, there is a clear interest of the ethanol
producers in using yeast strains with higher conversion efficiency than that of naturally
appearing strains. Particularly, the synthesis of glycerol, a major by-product of alcoholic
fermentation, has been regarded as a wasteful process, because this metabolite is a highly
reduced product not further converted to ethanol. The overall goal of this project is to develop
novel industrial yeast strains, which are able to produce more ethanol from the traditional and
future raw materials by reducing the yield of the undesirable by-product glycerol. The
challenge herein is that glycerol serves different important physiological functions such as
redox balancing and osmotic stress tolerance.
The goal of the present work is to find genetic configurations, which determine low glycerol
formation along with cellular integrity. Rational engineering was applied to finely tune
glycerol formation and thereafter analyze its impact on the fermentation process. In addition
to rational engineering, a reverse engineering approach was applied. In the latter approach, the
genetic configuration of a natural occurring low glycerol producing Saccharomyces cerevisiae
was elucidated determining the phenotype - genotype relationship of glycerol as a complex
trait. Gene variants, identified as being causative for reduced glycerol formation, were used as
novel gene tools to reduce glycerol yield in industrial yeast. The methods and strategies
presented in this work can in principle be applied on any other phenotype in Saccharomyces
cerevisiae and clearly add to our present toolbox of yeast metabolic engineering.


Chapter I
Literature Overview

6 Chapter I
1. Yeast of the Saccharomyces sensu stricto family
Yeasts are defined as unicellular eukaryotes and are classified in the kingdom of fungi. The
word yeast, descending from the Old English gist or gyst, is a collective term grouping
diverse unrelated species of different taxonomic and phylogenetic origin. This diversity
comprises the commonly known ‘baker’s yeast’, Saccharomyces cerevisiae, used for baking
and preparation of alcoholic beverages and also pathogenic species, like Candida albicans,
causing infections in humans. Baker’s yeast is classified in the Saccharomyces sensu stricto
family, which summarizes all yeast species relevant for the fermentation industry. The yeasts
of the Saccharomyces family, meaning sugar moulds, are able to convert sugar into ethanol
and CO2 via fermentation (Sicard and Legras, 2011) and have been domesticated thousands of
years ago to make beer, wine or bread. Their unique ability is to survive and grow without
oxygen by using the fermentation process (Sicard et al, 2011). This process occurs even in the
presence of oxygen, as long as there is an excess of glucose present. This phenomenon,
named after its discoverer Herbert Grace Crabtree (1928), allows yeasts to produce ethanol
and to repress its respiration. Yeasts exhibiting such a peculiarity are therefore referred as
Crabtree-positive. Once glucose is depleted and oxygen present, the fermentation product,
ethanol is taken up again and consumed via respiration. The yeast must shift their enzymes
and metabolism from fermentation to respiration, causing a small lag phase between two
growth phases, which is referred to as the diauxic shift (Crabtree, 1928).
Beer yeasts were the first microbes to be scientifically studied due to their relatively large cell
size compared to bacteria and due to the financial support from the alcoholic fermentation
industries, which incurred each year losses by putrefaction and false fermentation (Barnett,
2003). The best-known member of the Saccharomyces genus is the species cerevisiae, whose
name is the Latin word for beer referring directly to its main application. Besides the food and
beverage applications, Saccharomyces cerevisiae is one of the most thoroughly researched
eukaryotic microorganisms. Researchers have used it to gather information about the biology
of the eukaryotic cell and ultimately human biology. It was the first eukaryotic genome to be
sequenced (Dujon, 1996; Goffeau et al, 1996) and annotated. Furthermore, it has become an
indispensible model organism in microbiology and biochemistry, exemplified by the work of
Buchner (1897) on cell-free extracts, by Harden & Young’s discoveries of D-fructose 1,6-
bisphoshate and coenzymes (1905), and by Nurse’s findings on the cell cycle (1991).

Chapter I 7
2. Yeast alcoholic fermentation
2.1 Alcoholic beverages
Wine/Cider is made from fermented grapes or other fruits. Wine production has a long
tradition in human history. First evidences of wine preparation are dating back to
Mesopotamia and Egypt (Dequin et al, 2011). During the Roman Empire, wine making
spread around the Mediterranean area and Western Europe. Millennia later, the Spanish
conqueror and the era of imperialism brought grapes and winemaking technology to almost
every place in the world, where the climate is appropriate for growing grapes or other fruits,
which generally contain sucrose as main sugar. After juice extraction from the fruit, the wine
must is ready for fermentation without further pre-treatment or addition of nutrients of any
kind. There is a huge variety of wine and ciders worldwide with diverse aroma bouquet and
flavours. This diversity in wine products originates from the different yeasts, grapes and
vinification conditions, resulting in a variety of chemical compounds produced during this
fermentation process.
Beer is aside from wine one of the most popular alcoholic beverages in the world. It is
produced from grains, like barley, wheat, rice or corn. The grain starch is saccharified prior to
fermentation in the malting process. In the malting process, grains are germinated to produce
the enzymes (α-amylase, β-amylase, proteases and β-glucanase) necessary for starch
hydrolysis. The germination is arrested via a controlled drying process of the grains, which
also preserves the necessary enzymes for the wort preparation. Saccharification itself occurs
in the next step, the mashing process. In this step, the milled grains, referred as malt, are
heated in water up to 72˚C to allow for optimal condition for enzymatic starch degradation.
The solid residuals of the grains are separated from the liquid, resulting in a sweet syrup,
called brewer’s wort, which is subsequently boiled. During boiling, addition of hop to the
wort imparts the characteristic bitter flavour to the beer. After cooling, the wort is ready for
fermentation to either lager beers or ales. These two types of beers are distinguished by the
utilized yeasts and the temperature at which fermentation occurs. For lager beers bottom
fermenting yeast and a temperature of 5-14˚C are used, whereas for ale beers top fermenting
yeast and a temperature of 15-20˚C are used. Historically, authorities have strictly regulated

8 Chapter I
brewing by laws, like the Bavarian purity law of 1516. Today, brewing is a global industrial
business, dominated by multinational companies and a production capacity of over 100 billion
litres.
Sake, sometimes also referred as rice wine, has its origin in the Japanese culture. The
specification as a wine might be misleading, because sake production resembles more
brewing than vinification. In sake preparation, rice starch has to be hydrolysed prior to the
fermentation, comparable to the malting and mashing process in brewing. The mould
Aspergillus oryzae, is responsible for the conversion of starch to fermentable sugar by
producing the enzymes necessary for saccharification. In the initial phase of the fermentation,
only the mould is present, starting the saccharification process. Later yeast and more rice are
added to the mould culture resulting in a simultaneous saccharification and fermentation,
which continues for 2 - 3 weeks at 15 - 20˚C and reaches a final alcohol concentration of 18 -
20% [v/v]. Afterwards, sake is stored for a period of nine to twelve months, in which the sake
develops its characteristic smooth taste.
Distilled beverages/Spirits are alcoholic beverages, which are produced by distillation of
fermented grain, fruit or vegetables. There is a huge variety amongst spirits, all sharing one
common attribute, which is a high alcohol content of at least 20% [v/v]. Whiskies are made
from cereal grains. Its characteristic and unique flavours originates from the grain and its
processing. Apart from whiskey, neutral grain sprits are produced, which are low in flavour
and therefore devoid of any taste. This mostly pure alcohol is used for vodka, gin and other
flavoured distilled beverages. Rum or Cachaça are spirits base on fermented sugar cane juice
or sugar molasses, which are by-products of the sugar refining process. The majority of these
spirits are produced in Latin America and the Caribbean. Fermentation usually occurs rapidly
at higher temperatures of up to 40˚C. Brandy, Schnapps or Eau de vie are produced by
distillation of fermented grapes or other fruits and have their main origin in Europe.

Chapter I 9
2.2 Bioethanol production
Ethanol can substitute gasoline as fuel used for Otto engines. In fact, Henry Ford used ethanol
to fuel one of his first automobiles in the 1880s. Despite Ford’s choice, crude oil became the
most favoured primary source for fuels due to its easy exploitation and low production costs.
Till date, mineral fuels dominate world fuel markets; however views of policy makers started
to change after the first global oil crisis in 1973, during which extensive ethanol production
programs, likewise PROALCOOL in Brazil (Basso et al, 2008; Koizumi, 2003), were
launched. Despite increasing prices and insecure crude oil supply for mineral fuels, most
countries mainly kept on relying on fossil resources. This resulted in steadily increasing prices
for mineral fuels, which led to a renaissance of ethanol as alternative biofuel for substitution.
Today, policy makers regard ethanol production as one feasible alternative to fossil fuels in a
short and medium term perspective for partial substitution of petroleum-based fuels.
Moreover, the stimulation of ethanol production is also for the purpose of lowering carbon
dioxide emissions – the major contributor to human-induced climate change. For instance,
combustion of renewable fuel by motor vehicles releases only the amount of carbon dioxide
previously consumed by plants; thereby reducing the total CO2 emissions, which contribute to
global warming. Therefore, interest in alternative fuels has intensified during the last decade.
In 2012, the annual world production of ethanol exceeded 80 billion liters (F.O.Licht's, 2013)
indicating the importance of ethanol as a partial substitute for petroleum-based liquid fuels.
Ethanol can be mixed with gasoline in various ratios. Currently used blends in Europe are low
ethanol mixtures up to 10% ethanol. The fraction of alternative fuels in blends will increase in
the next years due to the bio-fuel initiatives prompted by governments of countries all over
the world3,4
(FAO, 2008). Currently, most ethanol is produced in Brazil and the United States
of America.
2.2.1 1st Generation bioethanol production
Traditionally, fuel ethanol has been produced from sugar or starch-containing feedstock such
as sugar cane, sugar beet, corn or small grains via microbial fermentation predominantly
3 EU (2003) DIRECTIVE 2003/30/EC OF THE EUROPEAN PARLIAMENT AND OF THE COUNCIL of 8
May 2003 on the promotion of the use of biofuels or other renewable fuels for transport.
4 USA (2007) ENERGY INDEPENDENCE AND SECURITY ACT, 110th Congress Public Law 110-140.

10 Chapter I
using the yeast Saccharomyces cerevisiae. Today, the majority of the produced ethanol still
originates from traditional feedstock - referred to as first-generation biofuel. Feedstock crops
and process types used for ethanol production vary globally, mainly depending on the climate.
After its extraction from the plant, the type of carbohydrate present distinguishes the two
main types of traditional feedstock, which contain either fermentable sugar or starch.
Sugary feedstock, composed of fermentable carbohydrates, such as sucrose, glucose and
fructose, originates from sugar cane, sugar beet or sweet sorghum. In these plants, sugars are
accumulated in a high quantity and are easily extractable. The sugar juice extracted from the
plants is either used for sugar refining or ethanol production, depending on the market price
for sugar or ethanol. Unavoidable waste streams during the sugar refining process are
molasses, which still contain residues of sugar. These molasses are still an ideal and cheap
feedstock for ethanol production. In general, molasses are mixed with the green juice to avoid
fermentation inhibition, caused by the high concentration of inhibitors in molasses. One
advantage of this high inhibitor concentration is that molasses can be stored whereas the juice
is rapidly deteriorated. The utilisation of sugar cane for ethanol production is restricted to
tropical areas around the equator. In Brazilian tropical climate, sugar cane is the most
abundant feedstock used for bioethanol production. After sugar extraction, the plant residual,
so-called bagasse, is further processed for heat (milling and distillation) or electricity
generation. According to Dos Santos (1997), ethanol from sugar cane has the highest energy
ratio, meaning that energy outcome is 6.45 - 9.53 times higher than the energy necessary for
its production. Brazilian bioethanol industry has perfected the production process during the
last three decades. Ethanol plants are mainly operated in fed-batch, referred as Melle-Boinot
process (Basso et al, 2011), or as continuous fermentation. After fermentation, yeast is
recycled and used for the next fermentation, enabling rapid fermentation and a reduced
contamination risk. In temperate climates, like Europe, Canada or Russia, sugar beet is grown
for sugar or ethanol production. Despite a higher sugar content in sugar beets, ethanol
production costs (per litre ethanol) from sugar beet (Basso et al, 2011) are higher and its
energy ratio (Dos Santos, 1997) is lower when compared to sugar cane. Sugar extraction from
beets is more complex than the process necessary for sugar cane and usually plant residuals
are not combusted to generate process energy. These residuals, namely the pulp and tops, are
marketed as high-value cattle feed.

Chapter I 11
Starch based feedstock, originating from corn or small grains, are mainly used for ethanol
production in temperate climates. In the United States of America (USA), currently the
worldwide biggest producer of ethanol, corn is preferably used for feedstock preparation. In
2012, over 300 million tons of corn were harvested in the USA and approximately 40% of the
corn harvest was used for ethanol production5. Since 2002, ethanol production and in lockstep
corn production increased exponentially driven by the American policy, enacting renewable
energy directives, like the Energy Independence and Security Act 6 (2007) (Figure1).
Figure 1 Trends of corn and ethanol production in the United States of America since 1981. Development
of the annual corn production in the USA (white bars) and the percentage of corn consumption for fuel ethanol
production (black bars) from 1981 to 2012 (adapted from Feed Grains: Yearbook tables, United States
Departement of Agriculture, Economic Research Service (USDA, 2012).
The ethanol production process from starch differs substantially from the sugar based process.
The grains are milled to reduce the size and to make the starch accessible for the next step. In
the liquefaction step, water is added to the meal to adjust a dry-matter content of 30 - 35%.
This starch slurry is passed through a heat exchanger (jet cooker), in which the starch granules
gelatinize at 70 - 90˚C. The viscosity of the gelatinized starch increases drastically, which
would complicate the further downstream processing steps. To counteract this, α-amylase is
added to partially hydrolyze starch to soluble maltodextrins (Douglas Crabb and Mitchinson,
5United States Departement of Agriculture (USDA) (2012) Feed Grains: Yearbook tables available at:
http://wwwersusdagov/data-products/feed-grains-database/feed-grains-yearbook-tablesaspx.
6USA (2007) ENERGY INDEPENDENCE AND SECURITY ACT, 110th Congress Public Law 110-140.

12 Chapter I
1997). Complete saccharification of the maltodextrin results after addition of glucoamylase,
which sequentially removes glucose units from the non-reducing end. This step can either
occur ahead (separate hydrolysis and fermentation, SHF) or simultaneous with the
fermentation (simultaneous saccharification and fermentation, SSF). Today, most grain-based
ethanol plants are operated in the continuous SSF process (Madson and Monceaux, 1999),
due to higher ethanol yields obtained in this process when compared to separate hydrolysis. In
contrast to the cell recycle in the Brazilian process, fermentation is started with active dry
yeast, which is simultaneously propagated. The increase of the ethanol yield in SSF compared
to SHF results from improved enzymatic hydrolysis and a controlled release of sugar avoiding
elevated osmotic pressure, which induces glycerol formation. Moreover, the lack of free sugar
also reduces bacterial growth. After fermentation and ethanol distillation, water is evaporated
from the slurry and the fermentation residuals are dried, producing distillers grains used as
cattle feed.
2.2.2 2nd
Generation bioethanol production
In 2007, the US congress enacted the Energy Independence and Security Act (2007), which
regulates the production of renewable fuels until the year 2022. It is stated in the law that
production of renewable fuels should annually increase until 2022 to a final total volume of
36 billion gallons. Utilization of only corn-starch derived bioethanol, referred in the law as
‘conventional biofuel’, will be insufficient to fulfil this ambiguous aim. Moreover, 1st
generation biofuels originate from feedstock and crops, used for feed and food production. Its
expansion already raised prices for food commodities (Figure 2), creating a global food crisis
in 2007 - 2008 and causing political and economical instability.
Figure 2 Annual real price indices of food, sugar and cereals from 1990 to 2011 (published by the Food and
Agriculture Organization of the United Nation (FAO)).

Chapter I 13
To avoid competition with food commodities, future renewable biofuels, termed in the US
law as ‘advanced biofuels’, should derive from non-starch renewable biomass, such as non-
food crops, crop residues, animal waste or algae. Especially, lignocellulosic biomass,
composed of cellulose, hemi-cellulose and lignin, is regarded as future solution in a long-term
perspective ensuring both food and energy security. Ethanol produced from such biomass is
termed 2nd
generation bioethanol or ‘cellulosic ethanol’. In the last decade, researchers of all
disciplines have made huge efforts in developing and implementing new technologies to
produce ‘cellulosic ethanol’ and ‘advanced biofuels’. In order to obtain a mature
economically viable production process, two major challenges need to be solved, which are
the efficient and cost-effective hydrolysis of the lignocellulosic biomass into its sugar
monomers and the construction of microorganisms for the conversion of the sugars into the
desired biofuel.
Advances in pre-treatment methods and hydrolysis have been reviewed by Kumar et al.
(2009) and Van Dyk & Pletschke (2012). Host microorganisms, have been extensively
engineered to adapt them to the new process conditions and utilize them for fuel production
(Darku and Richard, 2001; Nevoigt, 2008; Peralta-Yahya and Keasling, 2010; Peralta-Yahya
et al, 2012). The yeast, Saccharomyces cerevisiae was amongst the primary species
engineered for advanced biofuel production. Particularly, two heterologous pathways for the
utilization of the pentoses, i.e. xylose and arabinose, were established to enable pentose
fermentation of hemi-cellulose hydrolyzates (Nevoigt, 2008). Overall, advanced biofuel
technologies have made an impressive progress over the last ten years and at present several
demonstration cellulosic ethanol plants are worldwide operational or under construction.

14 Chapter I
3. Glycerol formation in Saccharomyces cerevisiae
Firstly mentioned in 1858, glycerol as a product of the alcoholic fermentation was discovered
by Louis Pasteur (Pasteur, 1858). He wrote in a letter to the French Academy of Science:
“Je vous prie de vouloir bien annoncer à l’Académie un résultat curieux et très-
inattendu. C’est la presence constante de la glycerine parmi les produits de la
fermentation alcoolique […] à 3 pour 100 environ du poids du sucre […]”
In general, glycerol is formed at a quantity of 2.0-3.6% [g g-1
] from the sugar during alcoholic
fermentation (Pasteur, 1858). More than a century after Pasteurs’ initial findings, the glycerol
metabolism of yeasts, and particularly that of S. cerevisiae, has been well understood and has
proven to be an indispensible part of its metabolism. In S. cerevisiae, glycerol has two major
physiological functions, which are: i) the regulation of cell turgor especially under high
osmolarity and ii) the replenishment of the cofactor NAD+ to enable the cytosolic redox
balance in the absence of oxygen.
The increase or reduction of the glycerol formation in the yeast S. cerevisiae has been
extensively studied. Reduced glycerol formation is desirable for fuel ethanol production, in
order to increase ethanol yields and to prevent the carbon use for other fermentation products.
Elevated glycerol formation is desirable in wine and beer production (Cambon et al, 2006;
Geertman et al, 2006; Heux et al, 2006; Nevoigt and Stahl, 1996; Remize et al, 1999;
Schuller and Casal, 2005) to improve the mouthfeel of the beverages or to reduce their
alcohol content (Cambon et al, 2006; Eglinton et al, 2002; Ehsani et al, 2009). Moreover,
glycerol can also be the main product in the fermentation of carbohydrates by S. cerevisiae.
During World War I, demands for glycerol increased due to the production of nitro-glycerine.
Steering agents, such as bi-sulfite ions, were added in the fermentation retarding ethanol
production by trapping the intermediate, acetaldehyde (Neuberg and Reinfurth, 1918).
Neuberg’s second form of fermentation increased glycerol synthesis, obtaining conversion
efficiencies from 23% to 28% depending on the process conditions (Wang et al, 2001).
Today, the polyalcohol, glycerol, is an important starting substance for chemical synthesis. Its
demand has increased ever since it was discovered, in the 19th
century.

Chapter I 15
3.1 Glycerol Metabolism
3.1.1 Synthesis
Glycerol synthesis is part of S. cerevisiae central catabolism for the degradation of carbohyd-
rates. It starts from dihydroxy-acetone-phosphate (DHAP), which originates from the split of
fructose 1,6-bisphosphate into DHAP and glyceraldehyde 3-phosphate (GAP). The two
products are the starting point of two metabolic pathways, which lead to the final products
ethanol from GAP and glycerol from DHAP (Figure 3). In S. cerevisiae wild type cells, the
metabolic pathway for glycerol formation is the reduction of DHAP by the NAD+ dependent
glycerol 3-phosphate dehydrogenase (GPDH) and the successive dephosphorylation by the
glycerol 3-phosphate phosphatase.
The key enzyme of the glycerol synthesis, GPDH, is encoded by the two isogenes GPD1 and
GPD2. First discovered by Larson et al. (1993) and Albertyn et al. (1994), the gene GPD1
has been identified as essential for growth under osmotic stress. Moreover, its expression is
induced under reduced water activity. The gpd1∆ mutant was clearly inhibited in growth
under such conditions. In order to increase osmotic stress tolerance, the GPD1 transcription
level is induced by the high osmolarity glycerol (HOG) pathway and leads to intracellular
accumulation of glycerol. A second isogene (GPD2) that encodes the GPDH in S. cerevisiae
was discovered later by Ansell et al. (1997). The transcription of the GPD2 gene was not
affected by changes in external osmolarity, however, gpd2∆ mutants showed poor growth in
the absence of oxygen. The oxygen availability did not directly increase the GPD2
expression, but seemed to be rather linked to the cell’s redox state which is significantly
affected by oxygen availability (Ansell et al, 1997). However, the importance of GPD2 is not
reflect in the specific enzyme activity, since the loss of GPD2 merely reduced the specific
GPDH activity; whereas strains deficient of GPD1, showed a decreased enzymatic activity
(Nissen et al, 2000a). The gpd1∆ gpd2∆ mutant was highly osmo-sensitive and unable to
grow under anaerobic conditions (Bjorkqvist et al, 1997; Nissen et al, 2000a).
The second step in the synthesis of glycerol is the dephosphorylation of L-G3P by the
glycerol 3-phosphatase, which is encoded by the two paralogs, GPP1 (standard name RHR2)
and GPP2 (standard name HOR2) (Norbeck et al, 1996). Mutants lacking GPP1 showed poor
growth under anaerobic conditions and GPP1 expression seemed to be transiently induced

16 Chapter I
under these conditions (Pahlman et al, 2001). The expression of GPP2 is strongly activated
through the HOG pathway in the presence of hyperosmotic or oxidative stress (Norbeck et al,
1996; Pahlman et al, 2001). Single mutants of either GPP1 or GPP2 remain unaffected during
osmotic stress, indicating that the two paralogs can substitute well for each other (Pahlman et
al, 2001). However, the deletion of both genes in the gpp1∆ gpp2∆ mutant caused sensitivity
to osmotic and oxidative stress and a growth inhibition under anaerobic conditions. Devoid of
glycerol 3-phosphatase activity, this mutant showed increased levels of L-G3P and produced
only minor amounts of glycerol (Pahlman et al, 2001).
Figure 3 Glycerol Metabolism in Saccharomyces cerevisiae. Glycerol is synthesized from dihydroxyacetone
phosphate (DHAP) in two enzymatic steps. First, DHAP is reduced to glycerol 3-phosphate (L-G3P) by the
glycerol 3-phosphate dehydrogenase (GPDH, encoded by GPD1 and GPD2). Consecutively, L-G3P is
dephosphorylated by the glycerol 3-phosphatase (GPP, encoded by GPP1 and GPP2). Besides its passive
diffusion, retention and efflux of glycerol are regulated by the Fps1 plasma membrane channel (Luyten et al,
1995). Glycerol uptake occurs via the transporter Stl1 and probably also via Gup1 and Gup2 (Neves et al, 2004).
In S. cerevisiae, glycerol can be dissimilated via L-G3P or dihydroxyacetone (DHA). The L-G3P pathway
dissimilates glycerol by the glycerol kinase, encoded by GUT1 and the mitochondrion-located FAD dependent
glycerol 3-phosphate dehydrogenase, encoded by GUT2. In the DHA pathway, glycerol is first oxidized to DHA
by the glycerol dehydrogenase, encoded by GCY1. DHA is then phosphorylated by the dihydroxyacetone kinase,
encoded by the two isoenzymes DAK1 and DAK2 (Molin et al, 2003). Although the DHA pathway is present and
functional, it might be insignificant for glycerol dissimilation (adapted from Nguyen and Nevoigt (2009)).

Chapter I 17
3.1.2 Glycerol Dissimilation
Under aerobic conditions, S. cerevisiae can use glycerol as a sole carbon and energy source.
In fungi, glycerol dissimilation might occur through two possible pathways (Figure 3), named
after their main intermediate, dihydroxyacetone (DHA) or glycerol 3-phosphate (L-G3P).
Glycerol 3-phosphate pathway. Two mutants, which were deficient in glycerol utilization,
were isolated by Sprague and Cronan (1977). They attributed the growth defect to the lack of
either the glycerol kinase or glycerol 3-phosphate dehydrogenase. This showed that glycerol
is utilized in a two-step process. The gene GUT1 encoded glycerol kinase and its disruption
resulted in a glycerol growth defect (Pavlik et al, 1993). Glycerol 3-phosphate is subsequently
oxidized to DHAP by the mitochondrion-located flavin adenine dinucleotide (FAD)-
dependent glycerol 3-phosphate dehyrdogenase, encoded by GUT2 (Ronnow and Kielland-
Brandt, 1993). DHAP can either enter into the central catabolism via the transformation to
glyceraldehyde 3-phosphate by a triose phosphate isomerase or can serve as a substrate for
lipid synthesis.
Dihydroxyacetone pathway. A second pathway for glycerol dissimilation via DHA, was
proposed by Norbeck and Blomberg (1997) (Figure 3). The first step in the pathway is the
oxidation of glycerol to DHA by the NADP+ dependent glycerol dehydrogenase followed by
the phosphorylation of DHA by the dihydroxyacetone kinase. GCY1, DAK1 and DAK2
encode this two-step pathway. Jung and coworkers recently confirmed that Gcy1 is the
NADP+ dependent glycerol dehydrogenase (Jung et al, 2012). Although its function is
unclear, the pathway might play a role in the regulation of the glycerol concentration during
hyperosmotic stress (Blomberg, 2000) or redox regulation (Costenoble et al, 2000).
3.1.3 Glycerol transport across the membrane
In S. cerevisiae, retention and efflux of glycerol across the plasma membrane are regulated by
the plasma membrane channel, Fps1 (Luyten et al, 1995; Sutherland et al, 1997; Van Aelst et
al, 1991). Mutants lacking FPS1 are sensitive to hypo-osmotic shock, indicating that Fps1 is
facilitating the efflux of glycerol for adaptation to sudden drops in osmolarity (Tamas et al,

18 Chapter I
1999). During growth on glycerol, yeast cells actively take up glycerol by the glycerol proton
symporter Stl1 (Ferreira et al, 2005; Zhao et al, 1994). Other glycerol uptake mechanisms
probably involve the two plasma membrane proteins, Gup1 and Gup2 (Holst et al, 2000).
3.2 Osmoadaptation in Saccharomyces cerevisiae
3.2.1 Accumulation of compatible solutes conferring osmotic stress tolerance
The availability of water is crucial for microbial growth and limitation of water becomes
detrimental or lethal for the organism. In solutions, the term aw (water activity) defines the
thermodynamically available water, taking into account the solutes present in the solution.
Microorganisms developed mechanisms to avoid water efflux and to survive in low aw
environments. These mechanisms can be divided into two basic strategies, which are either to
balance inorganic ions (usually KCl) or the production and accumulation of small organic
molecules with osmotic potential (Grant, 2004). Organic osmolytes, also named as compatible
solutes, are protecting the cells against protein or enzyme inactivation and prevent the
denaturation of macromolecules in cells facing low water activity. As implied by their name,
such small molecules are compatible with cellular functionality even at a high intracellular
concentration (Brown, 1978). In general, the most important compatible solutes in
microorganisms are uncharged or zwitterionic molecules and can be divided into the
following groups: i) polyols (glycerol, arabitol, trehalose and sucrose), ii) amino acids
(proline, glutamate and glutamine), and iii) ectoines, (ectoine and β-hydroxyectoine) (Grant,
2004).
In yeast and fungi, the polyol glycerol is the most prominent compatible solute to regulate the
cell turgor at high extracellular osmolarity and upon changes in the external water potential
(Brown, 1978; Grant, 2004; Nevoigt and Stahl, 1997). In S. cerevisiae, glycerol production
increased in medium containing high concentrations of NaCl (Blomberg and Adler, 1989).
Moreover, the measured specific GPDH activity was six fold higher than under basal
conditions. The yeast cells also favoured the production of glycerol by decreasing the
metabolic flux toward ethanol, in that the activity of the alcohol dehydrogenase was reduced.

Chapter I 19
A high level of GPDH expression, however, is not the only prerequisite for an enhanced
osmotolerance of S. cerevisiae, because ethanol-grown cells display also a high specific
GPDH activity level but less tolerance towards a reduced water potential (Andre et al, 1991).
Glycerol was produced, not only in cultures containing glucose as a carbon source, but also
when raffinose or ethanol served as the sole carbon source in high salinity media (Andre et al,
1991). Under hypotonic conditions, S. cerevisiae cells release glycerol into the surrounding
medium; whereas at high salinity it retains glycerol. Osmotolerance of S. cerevisiae can be
acquired or enhanced, by conditioning the cells with non-lethal NaCl concentrations. This
indicates that protein synthesis is required to establish a state of osmotolerance.
In contrast to S. cerevisiae, xerotolerant yeasts such as Zygosaccharomyces rouxii use a
different adaptation mechanism to respond to a hyperosmotic shock. Unlike S. cerevisiae,
which seems to enhance intracellular glycerol by increasing its synthesis through higher
activity of GPDH or phosphofructokinase, Z. rouxii retains and accumulates a higher
intracellular level of glycerol against the concentration gradient (Edgley and Brown, 1983;
Lages et al, 1999). Accumulation and synthesis of compatible solutes are highly regulated in
cells due to the rapid reaction necessary for adaptation to sudden changes in osmolarity in the
environment (Hohmann, 2002).
3.2.2 Osmotic sensing and signalling
Generally, S. cerevisiae accumulates glycerol as compatible solute to re-establish cellular
turgor under hyperosmotic conditions (Blomberg et al, 1989). This adaptation in the yeast is
exerted by a complex mechanism, enabling the cells to respond and adapt their physiology.
Changes in osmolarity are sensed and stimulate a rapid cellular response, thereby maintaining
cellular activity in the new growth environment. The cellular response mechanism is
ubiquitous in eukaryotes and follows basic principles commonly found in signalling
pathways, e.g. those controlling mating pheromone response, filamentous growth and other
stress responses. These signalling pathways are only responsive to a specific stimulus, and
execute a distinct cellular response for appropriate adaptation of cellular physiology. The
cellular responses involved are specific to their stimuli, avoiding erroneous cross-talk and
unwanted responses (Schwartz and Madhani, 2004). In yeast, osmo-adaptation is primarily
based on one signalling pathway, referred to as high-osmolarity glycerol (HOG) pathway. The

20 Chapter I
HOG pathway is a typical example of a mitogen-activated protein kinase (MAPK) pathway,
regulated by a three-tiered cascade of kinases. Central in the HOG pathway is the MAPK,
Hog1 (Brewster et al, 1993), which is activated by the MAP kinase kinase (MAPKK), Pbs2
(Brewster et al, 1993). Pbs2 itself is phosphorylated and activated by a third type of kinase, a
MAP kinase kinase kinase (MAPKKK). As shown in Figure 4, there are two different
enzymes of this type involved in Pbs2 activation. This cascade of kinases allows for multistep
regulation, for integration of several upstream control and sensing systems (Figure 4).
Figure 4 High osmolarity glycerol pathway in Saccharomyces cerevisiae. The yeast uses a mitogen-activated
protein kinase (MAPK) signalling pathway to respond to high osmolarity. The MAPK cascade is ubiquitous in
eukaryotes and usually composed of three sequentially acting kinases: the MAP kinase kinase kinase (MPKKK)
phosphorylates the MAP kinase kinase (MAPKK), which finally phosphorylates and activates the MAPK (e.g.
Hog1). The two independent upsteam osmo-sensing pathways, the Sln1-branch and Sho1-branch, activate the
MAPKK, Pbs2. The Sln1-branch is composed of the transmembrane protein Sln1, which forms together with
Ypd1 and Ssk1 a phosphorelay system responsible for inactivation of the MAPKKK, Ssk2 and Ssk22, under
basal conditions. The Sho1-branch is composed of the Sho1 transmembrane protein, with its C-terminal
elongation, the SH3 domain. This domain anchors Pbs2 to the membrane, where it interacts with the MAPKKK,
Ste11. This branch includes Ste20 and Ste50, which are part of the pheromone-response and filamentous MAPK
pathways. A third osmo-sensing branch is constituted by Msb2, which probably converges with the Sho1 branch
before activation of Pbs2. Active phosphorylated Hog1 is imported into the nucleus, where it interacts with
transcription factors (e.g. Hot1) to increase the expression of osmotic stress relevant genes, amongst them GPD1
and GPP2. After rapid signal amplification in the initial minutes, Hog1 is thereafter inactivated and
dephosphorylated by the phosphatases Ptp2, Ptp3 and Ptc1 to prepare the cell for the consecutive signal.

Chapter I 21
The two independent upstream osmo-sensing pathways, the Sln1-branch and Sho1-branch
activate the MAPKK Pbs2 (Hohmann, 2002; O'Rourke et al, 2002). Both branches may not
directly sense osmotic stress but rather act in response to mechanical stimuli in the plasma
membrane upon changes in osmolarity. Sln1 negatively regulates the HOG pathway and is
composed of two transmembrane domains and an intracellular histidine kinase (Hohmann,
2002; O'Rourke et al, 2002). Its intracellular kinase domain forms together with Ypd1 and
Ssk1 a phosphorelay system, a signaling concept more commonly present in prokaryotes
(Maeda et al, 1994). In this phosphorelay system, phosphate is transferred from the sensor
histidine-kinase to the response regulator Ssk1, via the intermediate protein Ypd1. Ssk1
subsequently interacts with the MAPKKK, Ssk2 and Ssk22, to start the signaling process.
Under low osmolarity, Sln1 is constitutively active and inactivates its downstream target Ssk1
by phosphorylation (Figure 5). A change to high osmolarity inactivates Sln1, leading to rapid
Ssk1 dephosphorylation, which then enables binding of Ssk1 with Ssk2 and Ssk22. This
triggers the auto-phosphorylation of the MAPKKK, and subsequent phosphorylation of Pbs2
and Hog1 (Hohmann, 2002; O'Rourke et al, 2002). During a hyperosmotic shock, the level of
dephosphorylated Ssk1 increases rapidly, suggesting that an unkown phosphatase might be
involved (Hohmann, 2002; O'Rourke et al, 2002). Avoiding hyperactivation of the HOG
pathway, the dephosphorylated Ssk1 is rapidly degraded by the ubiquitin-proteasome system
(Sato et al, 2003) to down-regulate the signal and prepare the cell for the next signal.
Figure 5 Activation of the Sln1 branch in high osmolarity conditions (modified from Posas et al. (1996)).
Dashed boxes indicate inactive elements. Arched arrows indicate phospho-transfer reactions, whereas straight
arrows simply indicate signal flow. At low osmolarity, Sln1 is activated and phosphorylates an aspartate residue
of Ssk1 via the intermediate Ypd1. Phosphorylated Ssk1 is inactive and inhibits the signal transduction. At high
osmolarity, Sln1 is inactivated, resulting in accumulation of dephosphorylated Ssk1. The dephosphorylated form
of Ssk1 interacts with the MAPKKK Ssk2/Ssk22, which then activates the MAPKK, Pbs2 and the MAPK,
Hog1.
22 Chapter I
The Sho1-branch is composed of the Sho1 transmembrane protein, with its C-terminal
elongation, the SH3 domain. Although Sho1 has been proposed as the osmo-sensor in this
branch, no activation mechanism was found for the protein. Recent investigations by
Zarrinpar et al. (2004) gave evidence that Sho1 together with Pbs2 acts as co-scaffold
proteins, linking all components of the Hog pathway to the membrane. The C-terminal, SH3
domain of Sho1 anchors the two scaffolds, Sho1 and Pbs2 (Raitt et al, 2000), thereby
enabling the interaction of Pbs2 with the MAPKKK Ste11 and the MAPK Hog1. The Sho1-
dependent activation of Hog1 involves two other membrane-localized proteins, Cdc42 and
Ste20. Upon osmotic stress, both genes are required for phosphorylation of Ste11, which in
turn activates Pbs2 involving Ste50 as a cofactor for phosphorylation; however, the exact
induction mechanism of Ste20 is still unclear. Other studies revealed Msb2, a mucin-like
transmembrane protein, as a potential osmo-sensor in the Sho1-branch, which monitors
movements between the cell wall and the plasma membrane (Hohmann, 2009; O'Rourke et al,
2002).
After rapid signal amplification in the initial minutes, the HOG pathway is brought back to a
basal level to prepare the cell for a consecutive signal. The constitutive activation of the HOG
pathway, by for example deletion of SLN1, is lethal for the yeast cells (Hohmann, 2002). The
inactivation of the HOG pathway occurs through dephosphorylation of Hog1 by the negative
regulators Ptp2, Ptp3 and Ptc1 (Warmka et al, 2001; Wurgler-Murphy et al, 1997). Ptp2 and
Ptp3 are phosphotyrosine specific phosphatases and remove the phosphate at Tyr176. Ptc1 is
a serine/threonine-specific phosphatase, which dephosphorylates Thr174. The activity of both
phosphatases is required to limit Hog1 acitivity, even under basal conditions (O'Rourke et al,
2002).
Once activated through dual phosphorylation, Hog1 regulates cellular adaptation processes
for short-term (<2 min) and long-term (>30 min) protection against osmotic stress (Westfall et
al, 2004).

Chapter I 23
3.2.3 Hog1 dependent short-term osmoadaptation
Increases in external osmolarity causes a yeast cell response within a few milliseconds, which
are visible through changes in the cell volume immediately after the shock. The cell shrinkage
is caused by the efflux of water due to a very high hydraulic permeability for yeast membrane
(Gervais and Beney, 2001). A recent study by Petelenz-Kurdziel et al. (2011) quantified the
dynamics of cell volume changes during hyperosmotic stress. In agreement with the earlier
studies of Gervais and Beney (2001), they found that the shrinkage is proportional to the
stress intensity until the cell volume reaches approximately 55% of its unstressed volume .
This volume is maintained even in the case of further increases in osmolarity (Petelenz-
Kurdziel et al, 2011). The severity of the cell shrinkage during osmotic stress forces the yeast
cell to adapt quickly to the new conditions within a time range of 5 to 15 min (Mettetal et al,
2008). These adaptations allow yeast cells to regain their initial, unstressed volume
approximately 45 minutes after the osmotic shock. This time span is too short for
transcriptional changes, which lead to cellular protection. Thus Hog1 triggers a rapid
cytoplasmic response that does not require protein synthesis. During osmo-adaptation, these
cytoplasmic processes may play a more critical role for an instant protection of the cells than
the longer lasting process of de-novo protein synthesis. Moreover, Westfall et al. (2008)
showed that cells deficient in the nuclear import of Hog1 or in which Hog1 was anchored at
the plasma membrane were still able to withstand a long-term hyperosmotic shock by ionic
and non-ionic solutes. In these cells, the usual Hog1 dependent changes in the transcriptional
program were not found, suggesting that Hog1 dependent gene expression is not critical for
survival of a hyperosmotic shock; however fast-acting Hog1 dependent processes, which do
not require de-novo protein synthesis, control the intracellular glycerol formation to re-
establish the osmotic balance (Mettetal et al, 2008). In fact, changes in yeast metabolism may
account for 80% of the increase in the glycerol flux, whereas the induction of gene expression
results in only a 20% increase. Contrary to the general assumption that glycerol flux increases
due to Hog1 dependent transcriptional activation of GPD1 and GPP2, these findings support
that the osmotic adaptations are mainly effected through rapidly induced metabolic shifts
towards glycerol production (Bouwman et al, 2011; Mettetal et al, 2008; Westfall et al,
2008).

24 Chapter I
As depicted in Figure 6, Hog1 controls glycerol formation and accumulation in order to
establish the metabolic conditions and to maintain a high intracellular glycerol level. These
mechanisms are briefly highlighted in the following paragraphs.
Control of glycerol flux across the plasma membrane. Glycerol transport has a crucial
function in short-term osmoadaptation to hyperosmotic and hypoosmotic shock. The plasma
membrane channel Fps1 reduces efflux of glycerol under hyperosmotic conditions and
facilitates its efflux in the absence of osmotic stress and particularly during a hypoosmotic
shock. In fact, a high intracellular glycerol concentration was present in fps1∆ mutants, which
caused a growth defect under anaerobic conditions and sensitivity to hypoosmotic shocks
(Tamas et al, 1999). There is clear evidence that Hog1 targets Fps1 to acquire tolerance
against arsenite (Thorsen et al, 2006) or acetic acid (Mollapour and Piper, 2006), yet the
Hog1 dependent control mechanism of Fps1 during a hyperosmotic shock is still unclear. A
recent study by Geijer et al. (2012) has shed some light on this mechanism. The Fps1 channel
might be regulated by the interplay of its transmembrane helices with its extended cytosolic
termini; both are required to fine-tune glycerol flux through the channel, allowing the
adaptation to a wide range of extracellular osmolarities. In addition to preventing glycerol
efflux by closing the Fps1 channel, intracellular glycerol accumulation during osmotic shock
seems to be facilitated by a transient induction of the glycerol/H+ symporter Stl1which
transports glycerol from the medium into the cell (Ferreira et al, 2005).
Adjustments of glycolytic flux. Kühn et al. (2008) investigated the changes in glycolysis
during osmoadaptation, suggesting an activation of glycolysis and a redirection of central
metabolic fluxes to glycerol rather than to pyruvate. Their model is supported by experimental
findings of Dihazi et al. (2004) and Westfall et al. (2008). First, the model suggested a Hog1
dependent activation of the upstream part of glycolysis, possibly via stimulation of the
activity of phosphofructo-kinase. This enzyme undergoes allosterical control by AMP and
fructose 2,6-bisphosphate, which both increase phosphofructo-kinase activity. The latter,
fructose 2,6-bisphosphate is the product of the phosphorylation of fructose 6-phosphate by 6-
phosphofructo-2-kinase, which is encoded by PFK26 and PFK27. Dihazi et al. (2004)
showed a Hog1 dependent increase in Pfk26 activity resulting in higher activity of the upper
part of glycolysis under hyperosmotic conditions. The second finding of Westfall et al. (2008)

Chapter I 25
postulates a shift of the glycolytic flux towards glycerol production at the costs of ethanol
formation caused by a Hog1-mediated activity loss of glyceraldehyde 3-phosphate-
dehydrogenase, Tdh1 Tdh2 and Tdh3. The decreased activity leads to lower conversion of
GAP into 1,3-bisphosphoglycerate and partially redirects the glycolytic flux to DHAP, the
first intermediate of glycerol synthesis. Westfall et al. (2008) further observed a Hog1
dependent decrease in activity of Tdh1 and Tdh3. Similar rerouting of the carbon-flux by
altering NAD+ dependent glyceraldehyde 3-phosphate dehydrogenase (GAPDH) and triose-
phosphate isomerase (TPI) levels has been associated with oxidative stress (Ralser et al,
2007).
Independent of Hog1, changes in metabolism, e.g. in reaction equilibria, may simply result
from the rapid shrinking of the cells. In particular, cell-shrinking releases NADH bound to
proteins, stimulating the production of glycerol (Bouwman et al, 2011). Furthermore, the
changes in redox status can cause shifts in the cellular distribution of Gpd1, as a recent study
of the subcellular distribution of Gpd1 during osmotic stress has shown (Jung et al, 2010).
The redistribution of Gpd1 may be a spatial metabolic regulation mechanism, which further
shifts the glycolytic flux towards the production of glycerol.
Figure 6 Hog1 dependent cytosolic changes after a hyperosmotic shock. After activation, Hog1 regulates
several steps to increase glycerol formation and accumulation, which are: i) the transcriptional activation of
GPD1 and GPP2 involving the transcription factor HOT1; ii) expression of the glycerol symporter Stl1 for
glycerol uptake from the medium; iii) activation of phosphofructo-2 kinase, encoded by PFK26; iv) control of
the plasma membrane channel Fps1 and v) down-regulation of glyceraldehyde 3-phosphate dehydrogenase
(GAPDH), encoded by TDH1, TDH2 and TDH3.

26 Chapter I
Additional mechanisms. Besides the shift in glycerol accumulation and production, Hog1
regulates several other cellular processes upon hyperosmotic stress, like regulation of protein
biosynthesis (Bilsland-Marchesan et al, 2000; Teige et al, 2001), cell-cycle progression
(Alexander et al, 2001) and ion transport (Proft and Struhl, 2004). Lastly, phosphorylated
Hog1 is imported into the nucleus by the karyopherin Nmd5 (Ferrigno et al, 1998). Once
inside the nucleus, Hog1 participates directly or indirectly in the regulation of gene expression
of approximately 600 genes (O'Rourke and Herskowitz, 2004).
3.2.4 Hog1 dependent long-term osmoadaptation
Besides the rapid Hog1 dependent cytosolic changes, there is also evidence for a Hog1
dependent transcriptional program to survive and grow under the new environmental
conditions. Transcriptional changes are most pronounced 20 min after the shock, suggesting
that transcriptional regulation becomes relevant only 30 min after the osmotic shock. Thus,
transcriptional regulation plays a role in the long-term osmo-adaptation and in faster response
to consecutive stimuli (Mettetal et al, 2008). Aside from its minor contribution to instant
osmo-adaptation, the numerous changes in gene transcription occur within the adaptation
process. Interestingly, the induction patterns of osmo-responsive genes, are often similar and
transient in nature (Gasch et al, 2000; O'Rourke et al, 2004; Posas et al, 2000; Yale and
Bohnert, 2001). The maximum change is reached within 20 min; after that expression is
rapidly reverted to the basal level. O’Rourke and Herskowitz (2004) analyzed the yeast
transcriptome in a time span of 180 min after a hyperosmotic shock and uncovered a set of
2277 genes, differentially expressed during this period. Approximately 600 genes showed a
strong Hog1 dependent change in expression. The most significant changes in expression
were found in genes, which were either involved in carbohydrate metabolism, e.g. glycerol,
trehalose and glycogen metabolism, or in general stress response (Martinez-Montanes et al,
2010; O'Rourke et al, 2004; Posas et al, 2000). Figure 7 depicts an overview of the functional
gene families, which show changes in expression after a hyperosmotic shock.
In general, activated nuclear Hog1 associates with the osmo-responsive genes by specific
chromatin-bound proteins. The Hog1 kinase then recruits RNA polymerase II (Pol II) and
other transcription factors (Alepuz et al, 2003; Alepuz et al, 2001; Martinez-Montanes et al,

Chapter I 27
2010), required for transcription initiation. Additionally, recent findings showed that Hog1
remodels the chromatin structure at stress-responsive loci, resulting in higher levels of
transcription (Nadal-Ribelles et al, 2012). Furthermore, Hog1 behaves as a transcriptional
elongation factor and remains associated with Pol II to ensure a fast and proper mRNA
production during the transcriptional process (de Nadal and Posas, 2011; Proft et al, 2006).
The transcriptional re-programming regulated by Hog1 has been classified in three main
mechanisms, through which Hog1 controls different stages in the transcription cycle: A)
direct regulation of transcription factor or DNA bound proteins; B) stimulation of the
recruitment of Pol II at osmo-responsive promoters and C) chromatin modifying activities at
osmo-stress responsive genes (Figure 8).
Figure 7 Overview of the differential expression of functional gene families upon osmotic stress (adapted
from Martinez-Montanes et al. (2010)).
Once in the nucleus, active Hog1 targets directly several transcription factors (TF) and
regulates their activity by phosphorylation. A direct interaction with Hog1 has been shown for
several TFs, including the activators, Hot1 (Alepuz et al, 2003; Rep et al, 2000) and Smp1 (de
Nadal et al, 2003), or the repressor Sko1 (Proft et al, 2001; Proft and Struhl, 2002). The Hog1
dependent activation mechanism is well described for the repressor Sko1, which switches
from repression to activation upon osmo-stress (Figure 8A). Under basal conditions, this

28 Chapter I
repressor shuts down gene expression by the recruitment of the Tup1 - Cyc8 co-repressor
complex (Proft et al, 2002; Rep et al, 2001).
Figure 8 Mechanisms of Hog1 dependent transcriptional regulation upon osmostress. Hog1 modulates the
initiation of transcription by A) direct phosphorylation of promoter-specific transcription factors (TF), by B)
stimulating the recruitment of RNA Pol II and other required cofactors and by C) recruitment of the Rpd3
histone deacetylase complex (HDAC) (adapted from deNadal and Posas (2011)).
After phosphorylation by Hog1, Sko1 releases the Tup1 - Cyc8 complex and switches into an
activator, recruiting the ‘Spt - Ada - Gcn5 - acetyltransferase’ (SAGA) histone acetylase
complex and SWI/SNF chromatin modifying complexes (Proft et al, 2002). Apart from direct
targeting, Hog1 also associates with general stress-responsive transcription factors (Figure
8B), for example Msn2 and Msn4, which induce gene expression by the stress response
elements (STRE) (de Nadal and Posas, 2010; Martinez-Pastor et al, 1996). Although this
Hog1 dependent regulation mechanism is still unclear, both activators, Msn2 and Msn4, are
stimulated by the MAPK upon osmo-stress. Similar interactions with Hog1 were reported for
osmo-induced TF Hot1 (Rep et al, 1999). Lastly, Hog1 is involved in chromatin re-structuring
by the Rpd3 histone deacetylation complex (Figure 8C). The Rpd3 deacetylase complex is
recruited to the promoters by Hog1 and alters DNA accessibility to allow for the binding and
recruitment of other transcriptional activators thereby inducing osmo-responsive genes (de
Nadal et al, 2010).

Chapter I 29
3.3 The role of glycerol in Saccharomyces cerevisiae redox metabolism
3.3.1 Redox metabolism in Saccharomyces cerevisiae
Dissimilation of nutrients, e.g. carbohydrates generates energy and cell constituents required
for growth and cell proliferation. In general, the dissimilatory pathways (catabolism) involve
several steps of oxidative reactions, which transfer electrons from the nutrients itself or its
metabolized intermediates to an electron acceptor. In cells, final electron donors and acceptors
are often not involved in the same reaction and electrons must be transferred from one redox-
reaction to the next one. In many organisms, two main important electron transport carriers
exist, which are the coenzymes, nicotinamide adenine dinucleotide (NAD+) and nicotinamide
adenine dinucleotide phosphate (NADP+). First discovered by Harden and Young (1905) and
Warburg (1932), both coenzymes are limited in the cells and must be continuously cycled
between their oxidative NAD(P)+ and reduced NAD(P)H + H
+ state. In yeast, both redox
couples are functionally separated by their predominant role in either catabolism involving
mainly NAD(H) or anabolism involving mainly NADP(H) (van Dijken and Scheffers, 1986).
This separation is even more pronounced due to the lack of transhydrogenase activity
resulting in a chemical compartmentation of the two coenzymes (van Dijken et al, 1986). As a
consequence of this chemical compartmentation, a small part of the sugar is metabolised via
the hexose mono-phosphate pathway, also referred as the pentose phosphate pathway (PPP),
to generate the reducing power NADPH for the anabolic processes, such as synthesis of
amino acids or fatty acids. Besides the role in anabolism, NADP(H) plays an essential role in
yeast’s resistance to oxidative stress. The NADPH dependent glutathione reductase requires
this coenzyme to regenerate the oxidized tri-peptide glutathione (γ - L - glutamyl - L -
cystinyl - glycine) as the main reducing agent, which protects yeast cells against oxidants, free
radicals, and alkylating agents (Boles et al, 1993). NADP(H) metabolism is not further
described in this literature review due to its minor role in glycerol metabolism. The next
section is focused solely on the coenzyme NAD(H), with regards to its cellular metabolism
and compartmentation.

30 Chapter I
3.3.2 Cellular metabolism and compartmentation of NAD(H)
NAD(H) is predominantly used in redox reactions of the central catabolism, comprising
glycolysis and the tricarboxylic acid (TCA/ Krebs) cycle, (Bakker et al, 2001; van Dijken et
al, 1986). Aside from its metabolic function, NAD(H) has also an important role in
transcriptional regulation or cellular aging processes, which are not further addressed (Lin and
Guarente, 2003).
Continuous circulation of the coenzyme steadily maintains the concentrations of both, the
oxidized NAD+ and the reduced NADH, in order to preserve a proper redox state within the
cell. Moreover, the coenzyme is cycled in each cellular compartment where it was generated
due to the impermeability of membranes for pyridine nucleotides. The total ratio of
NAD:NADH is approximately 3 in yeast (Anderson et al, 2002), including the free and bound
forms of the coenzyme. The ratio of the free form, also referred as ‘cytosolic pool’ is
classically inferred from the cell’s redox potential resulting in a NAD:NADH ratio of 500
(Lin et al, 2003; Williamson et al, 1967). However, the reported numbers for the cytosolic
pool diverge considerably (Lin et al, 2003). In the cytosol, the reduction of NAD+ is mainly
catalyzed by the glyceraldehyde 3-phosphate dehydrogenase. The mitochondrial NADH
originates from the reactions catalyzed by pyruvate dehydrogenase, isocitrate dehydrogenase
and α-ketoglutarate dehydrogenase. The generated NADH is re-oxidized via five main
mechanisms existing in S. cerevisiae, which are: i) ethanol production by the alcohol
dehydrogenase, Adh; ii) glycerol production by cytosolic glycerol 3-phosphate dehydrogenase
Gpd1/2; iii) respiration of cytosolic NADH via the external mitochondrial NADH
dehydrogenases, Nde1/2; iv) respiration of cytosolic NADH via the glycerol 3-phosphate
shuttle; and v) oxidation of intramitochondrial NADH via a mitochondrial ‘internal’ NADH
dehydrogenase, Ndi1 (Bakker et al, 2001). Depending on the carbon source, NADH turnover
in the cytosol and mitochondrion is different. In order to establish the redox balance between
these two compartments, two main electron transport mechanisms are known, which
circumvent the impermeability of the inner mitochondrial membrane for the NAD(H)
cofactors. NADH transfer is mediated via the glycerol 3-phosphate or ethanol - acetaldehyde
redox-shuttle (Figure 9). Electrons are shuttled through the mitochondrial membrane in the
form of reduced metabolites, L-G3P or ethanol, which are able to pass the membrane. Both
shuttle mechanisms are involved in electron transfer from cytosolic NADH to the respiratory
chain.

Chapter I 31
Figure 9 Mechanism of NADH oxidation and transport in Saccharomyces cerevisiae. There are at least five
mechanisms for NADH oxidation: i) ethanol production by the Adh, alcohol dehydrogenase; ii) glycerol
production by cytosolic glycerol 3-phosphate dehydrogenase Gpd1/2; iii) respiration of cytosolic NADH via the
external mitochondrial NADH dehydrogenases, Nde1/2; iv) respiration of cytosolic NADH via the glycerol 3-
phosphate shuttle; and v) oxidation of intramitochondrial NADH via a mitochondrial ‘internal’ NADH
dehyrogenase, Ndi1; Cytosolic NADH can be transferred to the mitochondrial matrix via the glycerol 3-
phosphate or ethanol-acetaldehyde shuttle. The respiratory chain of S. cerevisiae is schematically indicated by
bc1 (bc1 complex); cox (cytochrome c oxidase); Q (ubiquinone) (adapted from Bakker et al. (2001)).
During growth, the formation of biomass results in net NADH production, which is re-
oxidized by generating reduced metabolites (Bakker et al, 2001). The ethanol production is
itself a redox-neutral process, and thus ethanol cannot serve as a redox sink for excess
NADH. A closed redox balance is realized by S. cerevisiae through i) the production of
glycerol in fermentative cultures and ii) the mitochondrial reduction of oxygen in respiring
cells. During the respiratory growth of S. cerevisiae, cytosolic NADH is mainly re-oxidized
by the respiratory chain. The external NADH dehydrogenase (Nde) and internal NADH
dehydrogenase (Ndi), both localized in the mitochondrial inner membrane, directly transfer
the reducing equivalents of their compartment to the respiratory chain. The glycerol 3-
phosphate shuttle is an alternative way for oxidizing excess cytosolic NADH. The shuttle
consists of the two metabolites DHAP and G3P. Both substances are transported through the
outer mitochondrial membrane. The cytosolic generation of G3P by GPDH consumes NADH.

32 Chapter I
After diffusion through the outer mitochondrial membrane, G3P is oxidized by the
membrane-bound glycerol 3-phosphate ubiquinone oxidoreductase, Gut2. The generated
DHAP returns to the cytosol, where it can be again reduced by GPDH activity.
An export of NADH from the mitochondria to the cytosol is necessary for growth in the
absence of oxygen, when the mechanisms of NADH re-oxidation by the respiratory chain do
not operate. Generally the excess NADH of biomass formation originates from amino acid
synthesis, which occurs mainly in the mitochondrial matrix. According to Valadi et al.
(2004), the addition of lysine and glutamine/glutamic acid to the culture medium restored
growth of respiratory-deficient yeasts lacking GPD2, which codes for Gpd2, under aerobic
conditions. Moreover, the amino acid synthesis occurs mainly in the mitochondria, and half of
the NADH generated during amino acid synthesis is produced in the mitochondrial matrix
(Valadi et al, 2004). Bakker et al. (2001) proposed a possible involvement of the second
shuttle, the ethanol-acetaldehyde shuttle, in order to enable re-oxidation of mitochondrial
NADH in anaerobically grown cultures. Supposedly, this shuttle plays an important role in
the export of intra-mitochondrial NADH. The shuttle involves three alcohol dehydrogenases,
Adh. One of them, located in the mitochondrial matrix, reduces acetaldehyde to ethanol by
the consumption of NADH. The inverse reaction appears in the cytosol and is linked to
NADH generation. The re-oxidation of NADH takes place through the Gpd2 catalysed
reduction of DHAP to glycerol 3-phosphate. The shuttle is driven by the NADH/NAD+ ratio
gradient over the inner mitochondrial membrane (Valadi et al, 2004). Gpd1 is also able to
drive this shuttle instead of Gpd2, although the NADH/NAD+ gradient across the
mitochondrial membrane might be increased - due to the peroxisomal localization of Gpd1
(Valadi et al, 2004). In respiro-fermentative cultures, all mechanisms of NADH re-oxidation
described above are possible; whereas in the absence of oxygen the formation of glycerol is
the only possibility left to re-oxidize excess NADH as already described by Neuberg and
Reinfurth (1918). In S. cerevisiae, glycerol production is closely linked to the maintenance of
the cell’s redox-state. Neuberg’s approach enhanced glycerol formation of S. cerevisiae by
adding sulfite to the medium, which trapped acetaldehyde. Ethanol formation, which
consumes glycolytic NADH, was therefore impaired, lacking the intermediate acetaldehyde;
consequently the re-oxidation of the cofactor was managed through glycerol production.

Chapter I 33
3.4 Glycerol yield as complex trait in yeast
Glycerol formation or dissimilation is required for many cellular processes, as exemplified for
osmo-adaption and redox-balancing in the previous chapters. These cellular processes involve
several hundred cellular reactions, enzymes and their encoding genes; hence glycerol
formation shows by itself a particular variation caused by its polygenic nature. Generally, the
amount of glycerol formed in a population of S. cerevisiae subspecies varies continuously a
low yield of 0.03 gram per gram consumed glucose to high yield of 0.09 gram per gram
consumed glucose (Hubmann et al, 2013) and can take any measurable value between these
two extremes. Frequently found glycerol phenotypes in natural yeast populations show
glycerol formation between those two extremes of either very high or very low, resulting in a
Gaussian distributed trait (Hubmann et al, 2013). Such a phenotypic appearance, i.e.
continuous and normally distributed, distinctly typifies glycerol formation as a quantitative
trait (QT) (Swinnen et al, 2012b). In yeast strains, genetic as well as environmental variations
determine the amount of formed glycerol (Albers et al, 1996; Bideaux et al, 2006). Apart
from the environmental variation; genetic variation results from the sum of many small
effects of genetic differences (Brookfield, 2012). This polygenic nature caused a complex
pattern of inheritance, usually divergent from Mendelian inherited traits, which makes its
characterization difficult. Apart from the characterization, this polygenic nature is
advantageous for the modification of glycerol formation, which is possible and has been done
in several ways to either increase or decrease the amount of glycerol produced by yeast during
growth or alcoholic fermentation.

34 Chapter I
4. Engineering of Saccharomyces cerevisiae for ethanol fermentation
4.1 Metabolic engineering of Saccharomyces cerevisiae – importance and strategies
4.1.1 Saccharomyces cerevisiae, a key ‘cell factory of the future’
The yeast S. cerevisiae has become a key microorganism in the biotech industry. Beside its
traditional role for ethanol production, this yeast has developed in recent years into an
important ‘cell factory’ for the production of other bulk or fine chemicals, food ingredients
and pharmaceuticals (Hong and Nielsen, 2012). Obviously, there are good reasons why this
yeast has been selected multiple times as the ‘microbial host of choice’ (Fischer et al, 2008).
First, its physiology, genetics and biochemistry have been comprehensively investigated and
described by generations of researchers for well over a century. Today, this great amount of
accumulated knowledge of yeast as a cellular system allows us to engineer this
microorganism in manifold ways, adapting and improving it more and more for its industrial
purpose. Secondly, its outstanding genetic competence to take up and accept foreign DNA
facilitates targeted manipulations within genes or chromosomes. Besides that, the availability
of an almost fully annotated reference-genome (Goffeau et al, 1996) and the capability of
homologous recombination allows for fast and efficient strain development. Finally,
manipulation of the genotype is accomplished in manifold ways due to the availability of a
large genetic tool set for engineering, comprising several types of expression vectors, reporter
genes and selectable or counter-selectable markers for highly efficient transformation
(Nevoigt, 2008). The cellular responses to genetic modification can now be studied
comprehensively due to the availability of ‘omics’ platforms and other system biology
approaches (Fischer et al, 2008; Nevoigt, 2008). In the last decade, key challenges in
engineering yeasts for biofuel production were the extension of substrate utilization (Fischer
et al, 2008; Hong et al, 2012), the optimization of product formation and the improvement of
robustness and stress tolerance (Fischer et al, 2008; Stephanopoulos, 2007) in order to create
tailor-made Saccharomyces cerevisiae strains perfectly suited for various industrial
applications.

Chapter I 35
4.1.2 Novel strategies and tools for engineering of Saccharomyces cerevisae
In today’s bioethanol industry, many production strains originate from simple non-targeted
engineering strategies. However, such strategies often apply a mechanism to select a strain
with a desired phenotypic trait. Traits such as, for example reduced glycerol formation, are
not selectable. This excludes methodologies, such as evolutionary engineering or random
mutagenesis, which are based on a selection mechanism to sort out improved strains in a huge
population. However, an advantage of those selection-based strategies is the independency of
a priori knowledge on the genetics or on the physiology of the microorganism; hence, such
non-targeted approaches are until today a key driver of microbial strain improvements (Oud et
al, 2012). Moreover, many industrially relevant traits of S. cerevisiae are far from being
completely elucidated, particularly with regards to complex traits such as glycerol formation.
Consequently, it is difficult to predict, how genetic modification affect the whole cellular
system. This is often the principal reason for the failure of many rationally deduced
approaches. Avoiding failure, successful engineering strategies are based on a fundamental
knowledge of the molecular mechanisms underlying the traits of interest, allowing the precise
prediction of cellular behaviour after the genetic modification. In case detailed knowledge on
the trait of interest in the microorganism is not available, one has to apply engineering
strategies, which aims to elucidate complexity, shedding light into the ‘black box’ of a
complex trait. Such an engineering concept, as Bailey et al. (1996) proposed, encompasses
two steps: the ‘black box’ system is first analyzed in order to elucidate the molecular
principles and subsequently it is reconstructed (Oud et al, 2012). Bailey and co-workers
(1996) specified their concept as ‘inverse metabolic engineering’. However, its principles are
based on the more commonly known discipline of reverse engineering. In the framework of
metabolic engineering, reverse approaches start with an existing microbial strain with superior
features relative to a reference strain. In this regard, the huge natural phenotypic diversity
allows finding a superior yeast strain or a superior species for almost every phenotype.
Biodiversity therefore constitutes a remarkable “treasure chest” for improving industrially
used microorganisms.
Phenotypic diversity originates in the first instance from genetic diversity. Thus, one has to
find the genetic basis of the superior feature and establish the genotype-phenotype
relationship; this analysis turned out to be the bottleneck of reverse engineering due to the

36 Chapter I
lack of genome-wide methods for detection of such genetic elements. However, its
attractiveness lies within the possibility of discovering novel genes and mutations involved in
the phenotype, which would never have been found by any rational method. Once this
unknown genetic basis has been identified, targeted genetic modifications can be used to
improve the industrial strain. Since only beneficial, naturally-occurring mutations are
transferred, reverse engineering approaches suffer less from side-effects, commonly present in
rational engineering or non-targeted strain improvement, such as mutagenesis or evolutionary
engineering (Oud et al, 2012).
For many years, resolving the complexity of the phenotype-genotype relationship restricted
reverse engineering approaches. However, recent advances in analytical technologies,
generally referred as ‘omics’ technologies, partially resolved this problem, allowing now for a
better and faster identification of genetic determinants over the whole genome. For instance,
the development of highly efficient DNA sequencing methodologies, referred as 2nd
generation sequencing technology, simplified genomic localization and identification of the
multiple mutant genes involved in complex traits (Ehrenreich et al, 2010; Parts et al, 2011;
Swinnen et al, 2012a). Locating or mapping such causative determinants is possible by
analyzing the inheritance of genomic regions in offspring of parents, where one of the two
exhibits the superior phenotype. As depicted in Figure 10, genetic mapping of causative
mutations in yeast requires two strains of opposite extreme phenotypes, i.e. one exhibiting the
superior trait (Trait+) and the other showing inferior behaviour (Trait
-). After crossing the two
parental strains, meiotic segregants are isolated, phenotyped and individually tested and
selected for the phenotype Trait+. In such a selected offspring population, the mutations,
which are causative for Trait+, are preferentially inherited from the superior parent and
therefore overrepresented in the selected population. The localization of these mutations is
possible by tracking molecular markers, such as single nucleotide polymorphisms, which
distinguish the Trait+ from the Trait
- parent. The availability of efficient sequencing methods
now allows for the rapid tracking of SNPs or other molecular markers over the whole genome
in individuals or pooled-segregant populations (Swinnen et al, 2012a; Swinnen et al, 2012b).
Scoring the parental markers in the selected offspring population will result in a higher
frequency of the markers in close proximity to the genetic elements important for the Trait+
phenotype. On the other hand, the frequency of a randomly selected population remains at

Chapter I 37
about 50% for the whole genome (Swinnen et al, 2012a; Swinnen et al, 2012b).
Chromosomal regions, which show a statistically significant deviation, are termed
quantitative trait loci. The locus itself is then further dissected to identify the causative genes
using for instance the method of reciprocal hemizygosity analysis (Steinmetz et al, 2002).
Once the gene or mutation has been localized and identified, it can be transferred to its
destination industrial strain, thereby establishing to a certain extent the desired trait. In this
way, genetic mapping will become very powerful for identification of genetic determinants in
reverse engineering approaches.
Figure 10 Quantitative trait locus (QTL) mapping in Saccharomyces cerevisiae. A quantitative trait (QT)
varies continuously in yeast populations between two extremes of either Trait+ or Trait-, and can take any
measurable value between these two extremes. QTL mapping aims to locate the genetic determinants in the
genome, using two yeast strains of opposite extreme phenotypes, i.e. one exhibiting Trait+ and the other Trait-. In
the offspring population of segregants, selected for the phenotype Trait+, molecular markers, such as single
nucleotide polymorphisms, which distinguish the Trait+ from the Trait- parent, are tracked, and a higher
frequency of Trait+ associated molecular markers will be observed. The SNP variant frequency of the selected
population significantly deviates in the chromosomal loci, which are linked to the Trait+ phenotype, whereas the
SNP variant frequency of a randomly selected population remains constant at about 50% for the whole genome
(adapted from Swinnen et al. (2012b)).

38 Chapter I
4.2 Previous approaches to optimized yields in ethanol production
In industrial ethanol production, yeast strains must show distinct key features to allow for a
competitive production process. These key features comprise the ability to produce ethanol in
a high titer, yield and at the fastest rate possible; additionally the yeast should tolerate a
number of stresses and, ideally, be able to ferment other sugars than hexoses (Fischer et al,
2008). The final ethanol titer is an important cost factor in the downstream purification
process, a low ethanol titer caused by growth inhibiting compounds or a low ethanol tolerance
of the yeast strain, will increase purification costs. Manufacturing as well as capital costs are
lowered by increasing ethanol productivity of the yeast. Conversion efficiency and yield are
important determinants for competitiveness, since the major portion of the total expenditure in
ethanol production is allotted to the cost of the fermentation feedstock. Thus, the ethanol
industry is always seeking for new yeast strains that could meet their standards, because even
small improvements in the ethanol titer, yield or productivity would have a large impact on
earnings and cost competitiveness of the whole production process (Basso et al, 2008;
Stephanopoulos, 2007).
Although S. cerevisiae is an efficient ethanol producer, it can still be improved in several
ways in order to increase the economic viability of the industrial ethanol production process.
The classical way, mutagenesis or breeding, often affects not only glycerol metabolism but
also other good traits of the production strains. Furthermore, shifting to a new production
strain is often difficult and is connected with changes in the entire process in order to find the
optimal conditions for the new production strains. Therefore, the aim of previous engineering
approaches as well as the current work is to develop novel strains based on existing industrial
yeast strains. Microbiological and metabolic engineering have leveraged the finding of
optimized fermentation conditions and suitable yeast strains for ethanol production. Rate
limiting steps have to be identified and abolished in order to improve the manufacturing
process and its economic viability. Thus, there is a strong interest of the ethanol producers in
using and in further developing novel strategies to engineer tailored strains (Stephanopoulos,
2007).
In ethanol production, a prominent engineered trait in yeast is the conversion efficiency,
which is the ratio of the product to the consumed substrate, which is usually referred as
ethanol yield. As Figure 11 reveals, the major products in ethanol fermentation are ethanol

Chapter I 39
and carbon dioxide (CO2). By-products are biomass, glycerol, and acetate. If the substrate
glucose is only converted into CO2 and ethanol, S. cerevisiae produces one mole of CO2 per
mole of ethanol; as a result the theoretical maximum ethanol yield is 51% (gram ethanol per
gram substrate). However, ethanol yields in practice are lower since some carbon is used for
the synthesis of cell components during yeast growth and the generation of fermentation by-
products such as glycerol and acetate. In fact, ethanol yield in industrial processes reaches
roughly 90-93% of the maximal theoretical value (Bai et al, 2008). One of the major by-
products of the alcoholic fermentation by S. cerevisiae is glycerol. Its synthesis has been
regarded as a wasteful process, because this metabolite is a fairly highly reduced fermentation
product not further converted to ethanol. The challenge herein is that glycerol has important
biological functions such as redox balancing and osmotic stress tolerance. Glycerol as by-
product in alcoholic fermentation is necessary for the growth of S. cerevisiae; however the
requirements might be lower than the normally produced level. Engineering glycerol
metabolism, one should consider the necessity of glycerol, as a redox sink for excess NADH,
which is generated during biomass synthesis, and as a compatible solute to enable osmotic
stress tolerance. Therefore, glycerol formation is important for the yeast cell and various
metabolic engineering strategies attempted to find compromises between higher ethanol
yields and the yeast’s minimal glycerol requirements.
Figure 11 Major metabolites produced in an ethanol fermentation process by Saccharomyces cerevisiae.
Anaerobic batch fermentation of CEN.PK 113-7D; 5% glucose was used as single carbon source. The amounts
of ethanol, CO2, glycerol, biomass and acetate are presented as part of the molar carbon fraction used from the
consumed glucose during anaerobic fermentation.

40 Chapter I
4.2.1 Optimization of Process Conditions
Various attempts were made to optimize the alcoholic fermentation process. Not only could
genetic modification of the yeast improve the overall yield of ethanol, but also the variation of
fermentation conditions was able to minimize the formation of by-product. In general,
glycerol formation can be influenced by the availability of oxygen and by the nitrogen source
present in the medium.
Aeration strategy. The effects of different aeration strategies in a fed-batch process were
studied extensively by Alfenore et al. (2004). Non-limited oxygen conditions enhanced
average productivity, viability, and the final ethanol titer. Glycerol formation was also
strongly reduced in comparison to limited oxygen conditions, and the limitation of oxygen
resulted in higher ethanol yields. In contrast to glycerol, the yield of other fermentation
products, in general biomass and acetate, was higher under non-limiting oxygen conditions.
Another approach aimed to minimize the glycerol production in a respiratory quotient (RQ)
controlled fed-batch process (Bideaux et al, 2006). The RQ value was maintained between
four and five times the ratio of CO2 production to O2 consumption, during the fermentation
process. The overall glycerol yield obtained by this aeration strategy was minimal in
comparison to micro-aerated or fully aerated processes (RQ = 1). The RQ-controlled process
could maintain growth and biomass formation on the one hand, but on the other hand, resulted
in a decreased ethanol yield and lower productivity of S. cerevisiae. Cell viability was also
impaired by oxygen limitation under micro-aerated or RQ-controlled processes, which led to
a decreased final ethanol titer.
Influence of the nitrogen source. A sufficient supply of nitrogen and other nutrient
supplements is essential for a rapid and complete fermentation process (Arshad et al, 2008;
Jones and Ingledew, 1994). Albers et al. (1996) studied the influence of the nitrogen source
on S. cerevisiae growth and product formation under anaerobic conditions. Three different
nitrogen sources - ammonium, glutamic acid, and a mixture of amino acids - were used to
examine the effect on glycerol formation and growth behaviour. Earlier studies noted that
high amino acid concentrations in the wort increased the fermentation rate of yeasts in
brewing processes. With the addition of the amino acid, in the form of a mixture or a single
amino acid (glutamic acid), Albers et al. (1996) could stimulate growth and biomass

Chapter I 41
formation. In comparison to ammonia-grown cultures; the glycerol yield decreased by 19%
when glutamic acid was used as the nitrogen source and by 50% with the use of a mixture of
amino acids. The ethanol yields, however, increased by 8% and by 14% respectively. The
different nitrogen sources did not influence biomass composition in terms of carbohydrate
storage, protein content, or protein composition. Interestingly, a preference for certain amino
acids, in particular glutamic acid, aspartic acid, and asparagine, was observed. These amino
acids were involved in the up-take of other amino acids and also preferred by the cells as
additional carbon sources (Albers et al, 1996).
4.2.2 Genetic optimization of metabolic pathways in Saccharomyces cerevisiae
Restructuring of metabolic networks by altering pathway or flux rates can improve the
production of a desirable metabolite or abolish the production of unwanted by-products
(Bailey, 1991). A young engineering discipline, which deals with such scientific issues, is
metabolic engineering. This engineering discipline aims to iteratively optimize product
formation using targeted genetic perturbation combined with cellular system analysis until the
final goal, i.e. the improved strain, is accomplished (Nevoigt, 2008). Traditionally, the places
of the perturbations in the metabolic network are ‘rationally’ deduced from available
information about the pathways, enzymes, and their regulation. In terms of optimized ethanol
production, different strategies were pursued to direct the glycolytic flux of S. cerevisiae
toward the production of ethanol. These strategies can be classified in three groups, which
are: i) the direct targeting of glycerol synthesis, ii) the change of cofactor utilization to
improve redox balancing, and iii) the co-fermentation of an oxidized substrate.
Directly targeting glycerol synthesis. The first approaches directly influenced the synthesis
or the transport of glycerol (Figure 12). Mutants, either deleted in the genes, GPD1 or GPD2,
and the gpd1∆ gpd2∆ mutant were described in several studies (Albertyn et al, 1994; Ansell
et al, 1997; Bjorkqvist et al, 1997; Nissen et al, 2000a; Valadi et al, 1998). The earlier studies
of Bjorkqvist et al. (1997) and Nissen et al. (2000a) examined the physiology of these S.
cerevisiae strains under aerobic and anaerobic conditions. Under aerobic conditions the
gpd1∆ and gpd2∆ single deletion strains behaved almost identical to their parental strain,
which grew at rates up to 0.5 h-1
. The growth behaviour of the gpd1∆ gpd2∆ mutant was

42 Chapter I
obviously impaired. The physiology of the single or double mutants diverged from the wild
type much more in the absence of oxygen. The wild type and the gpd1∆ mutant responded in
a similar way to the shift from aerobic to anaerobic conditions. Both strains adapted quickly
to the anoxic conditions and their fermentative capacity was only temporarily decreased. The
ethanol yield increased in both single mutants, gpd1∆ and gpd2∆, whereas the glycerol yield
correspondingly decreased. A more drastic consequence was observed for the gpd1∆ gpd2∆
mutant. Growth and ethanol formation were stopped under anaerobic conditions and could
only be restored by the addition of acetoin, which was used as an alternative redox sink for
excess NADH via production of butanediol. The results suggested that anaerobic conversion
of glucose to ethanol by S. cerevisiae without glycerol formation was not possible (Bjorkqvist
et al, 1997; Nissen et al, 2000a).
Figure 12 Metabolic engineering strategies directly targeting glycerol synthesis or transport. Glycerol
formation in S. cerevisiae can be decreased or even inhibited by modification of the structural pathway enzymes,
glycerol 3-phosphate dehyrogenase, encoded by GPD1 and GPD2, and glycerol 3-phosphatase, encoded by
GPP1 and GPP2, or the plasma membrane channel, encoded by FPS1, which facilitates glycerol efflux.

Chapter I 43
In anaerobic fermentations, GPDH activity was examined in addition to product formation
and growth behaviour of the gpd1∆ and gpd2∆ mutants. The specific GPDH activity, in cell
extracts of the gpd1∆ mutant, was lower than that measured in the gpd2∆ strain, which was
higher compared to the wild type. However the anaerobic growth behaviour of these strains
was not related to their specific GPDH activity.
Since the GPDH is the rate-limiting step in glycerol synthesis (Cronwright et al, 2002;
Remize et al, 2001), the consecutive second step catalyzed by the glycerol 3-phosphatase, was
less attractive for modification in the glycerol pathway. Only the gpp1∆ gpp2∆ mutant, which
is devoid of glycerol 3-phosphatase activity, produced a small amount of glycerol; whereas
the mutants lacking either GPP1 or GPP2 did not show any changes in glycerol formation
(Pahlman et al, 2001). Under anaerobic conditions, all gpp mutants showed a significant
increase in intracellular levels of glycerol 3-phosphate, which has been of interest for the
production of glycerol 3-phosphate (L-G3P) as a starting material for the enzymatic synthesis
of monosaccharides and glycerophospholipids (Nguyen et al, 2004). Interestingly, the
mutants engineered for high L-G3P production, produced glycerol at a later phase in the
fermentation, despite the complete elimination of glycerol 3-phosphatase activity. These
findings suggest that dephosphorylation of L-G3P also occurs by unspecific phosphatases
besides the main phosphatases Gpp1 and Gpp2 (Popp et al, 2008).
Zhang et al. (2007) investigated whether a change in the transport of glycerol across the
membrane, has an influence on glycerol formation. In fact, they observed a decrease in
glycerol and a concomitant increase in ethanol yield in fps1∆ mutants. The plasma membrane
channel Fps1 facilitates the efflux of glycerol across the plasma membrane during osmo-
adaptation (Luyten et al, 1995; Sutherland et al, 1997; Van Aelst et al, 1991). In the fps1∆
mutants, glycerol export is severely reduced and may only be possible via passive diffusion.
Probably, this enhanced the intracellular glycerol level, resulting in an inhibitory effect on its
own production.
Changing the cofactor in enzymatic reactions. Another way to reduce glycerol formation of
S. cerevisiae in alcoholic fermentation is to change the cofactor usage in redox reactions of
biomass synthetic pathways. Bro et al. (2006) tested different strategies of cofactor exchange
in S. cerevisiae’s redox metabolism for improved ethanol production. Their metabolic model
tested three main scenarios, which theoretically allowed for reduced glycerol and increased

44 Chapter I
ethanol due to a change in cofactor utilization. These scenarios are: i) substitution of
NADP(H) dependent reactions in biomass formation with NAD(H) dependent reactions, ii)
introduction of a reaction which either directly or via a cycle converts NADH into NADPH,
iii) substitution of glycerol production with production of ethanol, which occurs with a net
oxidation of NADH (Figure 13).
Nissen et al. (2000b) successfully confirmed the first scenario, e.g. the exchange of cofactors
in biomass synthesis, by changing the cofactor requirement in ammonium assimilation. The
approach pursued the goal of reducing surplus formation of NADH during biomass
production by using NADH for ammonium assimilation. Consequently, NADH accumulation
was less severe during anaerobic growth of S. cerevisiae. Since less NADH had to be
regenerated via glycerol synthesis in the engineered S. cerevisiae strains, these strains
produced less glycerol - despite their unaffected opportunity to synthesize the metabolite. As
depicted in Figure 13, cofactor utilization in ammonium assimilation can easily be changed
from NADPH to NADH by the over-expression of the pathway, using NADH as cofactor, and
deleting the enzymatic reaction requiring NADPH as cofactor. Ammonium assimilation is
mainly catalyzed by the NADPH dependent glutamate dehydrogenase (encoded by GDH1).
Another pathway, existing in S. cerevisiae, synthesizes glutamate in two coupled reactions,
which leads to a net consumption of NADH (glutamate synthase, encoded by GLT1) and ATP
(glutamine synthase, encoded by GLN1). Finally, minor accumulation of cytocolic NADH
resulted in a reduction of the glycerol yield by 38% and an increase of the ethanol yield by
10%. This was obtained in anaerobic batch fermentation in a minimal medium. In addition,
the maximum specific growth rate of the engineered strains was slightly lower than that of the
wild type (Nissen et al, 2000b). A disadvantage of Nissen’s strategy was that biomass growth
was necessary in order to provide ATP, which was required in addition to NADH for
ammonium assimilation. Furthermore industrial media often contain other nitrogen sources
than ammonia, and as long as there are amino acids present in the medium, amino acid
biosynthesis is largely downregulated.
In addition, Nissen and co-workers (Nissen et al, 2001; Nissen et al, 2000b) investigated the
feasibility of the second scenario by introducing a transhydrogenase system in a gpd1∆ gpd2∆
mutant, thereby converting excess NADH to NADPH. However, the expression of the

Chapter I 45
cytoplasmic transhydrogenase from Azotobacter vinelandii in the double mutant affected a
further decrease in µmax, because the transhydrogenase converted NADPH into NADH.
Therefore it was not possible to introduce an alternative pathway for re-oxidation of excess
NADH. In fact, yeast is devoid of any transhydrogenase activity. However, a cyclic
transhydrogenase system has been proposed to suppress the growth defect on glucose of
mutants lacking phosphoglucose isomerase (Boles et al, 1993). This artificial cyclic
transhydrogenase system was created by a substrate cycling between 2-oxoglutarate and
glutamate. Over-expression of NADH dependent glutamate dehydrogenase caused an
elevated oxidative deamination of glutamate to 2-oxoglutarate - accompanied by the reduction
of NAD+. 2-Oxoglutarate was aminated to glutamate by the NADPH dependent glutamate
dehydrogenase, whereby NADPH was consumed. This cyclic transhydrogenase system
oxidized NADPH to NADP+ under the generation of NADH, which can be used by other
NADH consuming systems (Boles et al, 1993).
The third scenario predicted the reduction of glycerol production by introducing reactions,
which change the redox neutral state of NADH in ethanol production to a net oxidation of
NADH. Bro et al. (2006) investigated the success of this scenario by over-expressing the
NADP+ dependent glyceraldehyde 3-phosphate dehydrogenase of Streptococcus mutans
(gapN). This enzyme partially substituted the NAD+ reducing two-step reaction from
glyceraldehyde 3-phosphate to 3-phosphogylcerate, which is normally catalyzed by the
NAD+-dependent glyceraldehyde 3-phosphate dehydrogenase, GAPDH, and the phospho-
glycerate kinase, PGK. The heterologous gapN uses NADP+ instead of NAD
+ as cofactor for
the redox reaction. Thus, the reaction contributes to reduce the cytosolic NADH formation,
consequently, less glycerol has to be produced to re-oxidize NADH. The in vivo evaluation of
this strategy resulted in a 40% decreased glycerol yield and a 3% increased ethanol yield. The
growth of the strain expressing gapN was unaffected under anaerobic conditions. Recently, a
similar approach described by Guo Zp and co-workers (2011) used the non-phosphorylating
NADP+-dependent glyceraldehyde 3-phosphate dehydrogenase from Bacillus cereus or
Kluyveromyces lactis. The expression of both gapN in a gpd2∆ mutant reduced glycerol yield
by half and concomitantly increased ethanol yield by 7% (Guo et al, 2011). Interestingly, the
maximum specific growth rate of the mutants expressing gapN increased compared to the
gpd2∆ mutant, and were indistinguishable from the wild type strain in anaerobic batch
fermentations.
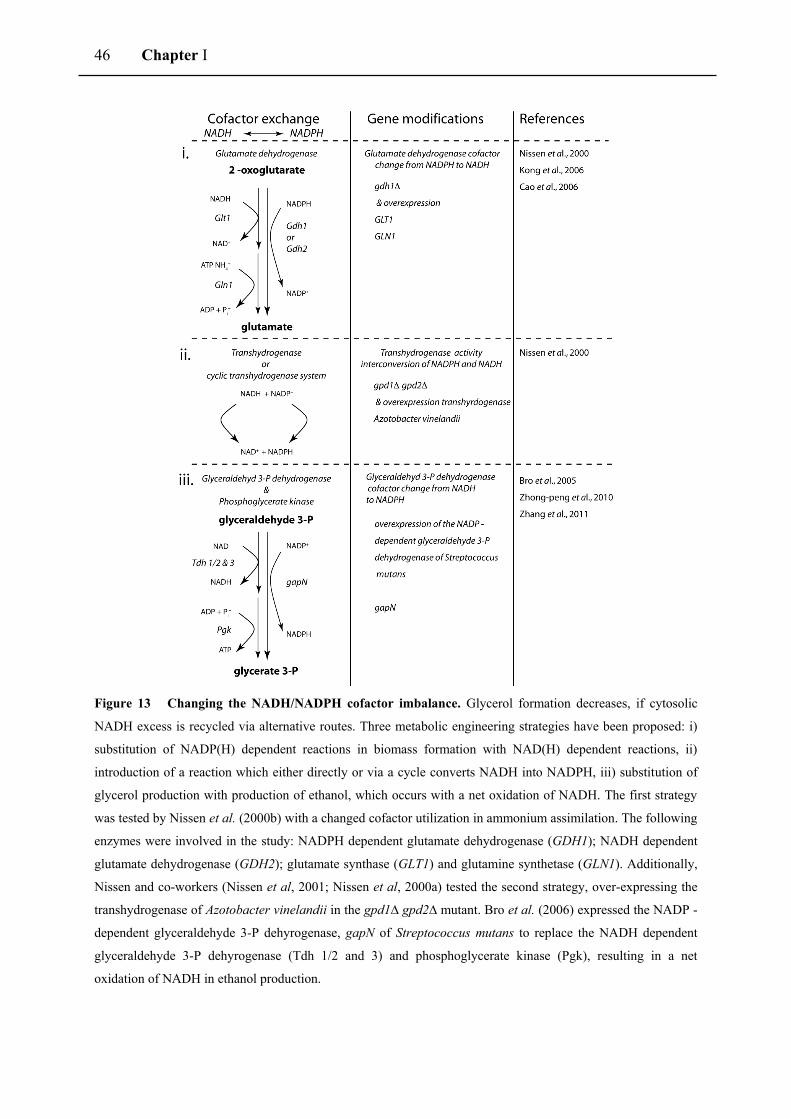
46 Chapter I
Figure 13 Changing the NADH/NADPH cofactor imbalance. Glycerol formation decreases, if cytosolic
NADH excess is recycled via alternative routes. Three metabolic engineering strategies have been proposed: i)
substitution of NADP(H) dependent reactions in biomass formation with NAD(H) dependent reactions, ii)
introduction of a reaction which either directly or via a cycle converts NADH into NADPH, iii) substitution of
glycerol production with production of ethanol, which occurs with a net oxidation of NADH. The first strategy
was tested by Nissen et al. (2000b) with a changed cofactor utilization in ammonium assimilation. The following
enzymes were involved in the study: NADPH dependent glutamate dehydrogenase (GDH1); NADH dependent
glutamate dehydrogenase (GDH2); glutamate synthase (GLT1) and glutamine synthetase (GLN1). Additionally,
Nissen and co-workers (Nissen et al, 2001; Nissen et al, 2000a) tested the second strategy, over-expressing the
transhydrogenase of Azotobacter vinelandii in the gpd1∆ gpd2∆ mutant. Bro et al. (2006) expressed the NADP -
dependent glyceraldehyde 3-P dehyrogenase, gapN of Streptococcus mutans to replace the NADH dependent
glyceraldehyde 3-P dehyrogenase (Tdh 1/2 and 3) and phosphoglycerate kinase (Pgk), resulting in a net
oxidation of NADH in ethanol production.

Chapter I 47
Co-fermentation of oxidized substrates or production of alternative products. The third
scenario solves the NADH redox imbalance by co-fermentation of sugar together with
oxidized substrates. Alternatively, glycerol synthesis is replaced by formation of another
reduced product.
As already known from earlier studies on the glycerol pathway, the growth of the gpd1∆
gpd2∆ mutant was restored by the addition of acetoin, an intermediate of butanoate
metabolism, which is further reduced to butanediol. Acetoin served as an acceptor and redox
sink for excess NADH present in the gpd1∆ gpd2∆ mutant through its further reduction to
butanediol (Bjorkqvist et al, 1997). Several recent publications used this strategy to
completely eliminate glycerol formation and to improve ethanol yield towards the possible
theoretical maximum (Figure 14). Guadalupe Medina et al. (2010) introduced a heterologous
pathway to enable co-fermentation of glucose together with acetate, which is available in
significant amounts in starch or lignocellulosic hydrolysates. Generally, the acetate
dissimilation is subject to glucose repression and its consumption starts only after glucose
exhaustion; hence, acetate is usually not consumed during fermentation (Vilela-Moura et al,
2011). When cells are grown on acetate as a sole carbon source, acetate is mainly metabolized
to acetyl coenzyme-A (Co-A) by the acetyl-Co A synthetase, encoded by ACS1 and ACS2 and
then further oxidized in the tricarboxylic acid cycle. Besides CoA, the synthesis in S.
cerevisiae requires ATP. In contrast to S. cerevisiae, Escherichia coli catalyzes the same
reaction by the NAD+-dependent acetaldehyde dehydrogenase, mhpF. Therefore, expression
of mhpF in S. cerevisiae enables the re-oxidation of NADH through the reduction of acetic
acid during fermentation (Guadalupe Medina et al, 2010). This strategy allowed the complete
elimination of glycerol production via co-fermentation of acetate; however the osmo-
sensitivity of the gpd1∆ gpd2∆ mutant remains a problem. Guo et al. (2011) compared the
mhpF, as functional replacement for glycerol as a redox sink, with a reduction of fumarate,
catalyzed by the NAD+
dependent fumarate reductase, frdA of Escherichia coli. The
production of reduced metabolites, such as sorbitol or propane-1,2-diol, has been tested as a
functional glycerol alternative, restoring the redox balance in mutants deficient in glycerol
formation (Jain et al, 2011). As depicted in Figure 14, heterologous pathways were introduced
for sorbitol and 1,2 propanediol formation. The ethanol yields in this approach did not

48 Chapter I
improve, despite the absence of glycerol and the restored growth ability of the double mutant
under anaerobic conditions.
Figure 14 Co-fermentation of substrates or alternative reduced product formation. Glycerol formation
can be functionally replaced as a redox sink by the NADH dependent reduction of acetate or fumarate or by
producing other reduced metabolites, such as sorbitol or 1,2 propanediol.
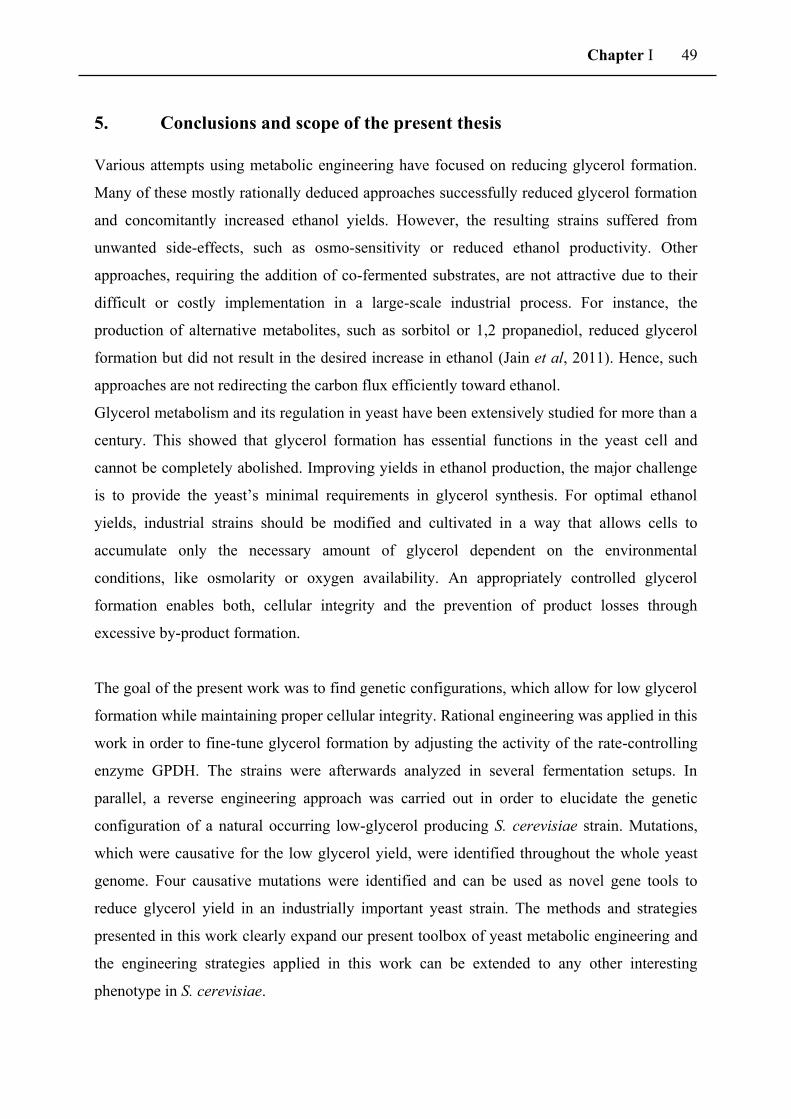
Chapter I 49
5. Conclusions and scope of the present thesis
Various attempts using metabolic engineering have focused on reducing glycerol formation.
Many of these mostly rationally deduced approaches successfully reduced glycerol formation
and concomitantly increased ethanol yields. However, the resulting strains suffered from
unwanted side-effects, such as osmo-sensitivity or reduced ethanol productivity. Other
approaches, requiring the addition of co-fermented substrates, are not attractive due to their
difficult or costly implementation in a large-scale industrial process. For instance, the
production of alternative metabolites, such as sorbitol or 1,2 propanediol, reduced glycerol
formation but did not result in the desired increase in ethanol (Jain et al, 2011). Hence, such
approaches are not redirecting the carbon flux efficiently toward ethanol.
Glycerol metabolism and its regulation in yeast have been extensively studied for more than a
century. This showed that glycerol formation has essential functions in the yeast cell and
cannot be completely abolished. Improving yields in ethanol production, the major challenge
is to provide the yeast’s minimal requirements in glycerol synthesis. For optimal ethanol
yields, industrial strains should be modified and cultivated in a way that allows cells to
accumulate only the necessary amount of glycerol dependent on the environmental
conditions, like osmolarity or oxygen availability. An appropriately controlled glycerol
formation enables both, cellular integrity and the prevention of product losses through
excessive by-product formation.
The goal of the present work was to find genetic configurations, which allow for low glycerol
formation while maintaining proper cellular integrity. Rational engineering was applied in this
work in order to fine-tune glycerol formation by adjusting the activity of the rate-controlling
enzyme GPDH. The strains were afterwards analyzed in several fermentation setups. In
parallel, a reverse engineering approach was carried out in order to elucidate the genetic
configuration of a natural occurring low-glycerol producing S. cerevisiae strain. Mutations,
which were causative for the low glycerol yield, were identified throughout the whole yeast
genome. Four causative mutations were identified and can be used as novel gene tools to
reduce glycerol yield in an industrially important yeast strain. The methods and strategies
presented in this work clearly expand our present toolbox of yeast metabolic engineering and
the engineering strategies applied in this work can be extended to any other interesting
phenotype in S. cerevisiae.


Chapter II
Gpd1 and Gpd2 fine-tuning for sustainable
reduction of glycerol formation in Saccharomyces
cerevisiae

52 Chapter II
1. Abstract
Gpd1 and Gpd2 are the two isoforms of glycerol 3-phosphate dehydrogenase (GPDH), i.e. the
rate-controlling enzyme of glycerol formation in S. cerevisiae. The two isoenzymes play
crucial roles in osmoregulation and redox balancing. Past approaches to increase ethanol yield
at the cost of reduced glycerol yield have most often been based on deletion of either one or
two isogenes (GPD1 and GPD2). While single deletions of GPD1 or GPD2 reduced glycerol
formation only slightly, the gpd1 gpd2 double deletion strain produced zero glycerol but
showed an osmo-sensitive phenotype and abolished anaerobic growth. Our current approach
has aimed at generating "intermediate" phenotypes by reducing both isoenzyme activities
without abolishing them. To this end, the GPD1 promoter was replaced in a gpd2
background by two lower-strength TEF1 promoter mutants. In the same manner, the activity
of the GPD2 promoter was reduced in a gpd1∆ background. The resulting strains were
crossed to obtain different combinations of residual GPD1 and GPD2 expression levels.
Among our engineered strains we identified four candidates showing improved ethanol yields
compared to the wild type. In contrast to a gpd1 gpd2 double deletion strain these strains
were able to completely ferment the sugars under quasi-anaerobic conditions in both minimal
medium and during Simultaneous Saccharification and Fermentation (SSF) of liquefied wheat
mash (wheat liquefact). This result implies that our strains can tolerate the ethanol
concentration at the end of the wheat liquefact SSF (up to 90 g l-1
). Moreover, a few of these
strains showed no significant reduction in osmotic stress tolerance compared to the wild type.

Chapter II 53
2. Bibliographic reference
Pagliardini, J., Hubmann, G., Bideaux, C., Alfenore, S., Nevoigt, E. and Guillouet, S. E.
Quantitative evaluation of yeast's requirement for glycerol formation in very
high ethanol performance fed-batch process.
Microb. Cell Fact. May 2010 vol. 9 no. 36.
DOI: http://dx.doi.org/10.1186/1475-2859-9-36
Hubmann, G., Guillouet, S. and Nevoigt, E.
Gpd1 and Gpd2 fine-tuning for sustainable reduction of glycerol formation in
Saccharomyces cerevisiae.
Appl. Environ. Microbiol. September 2011 vol. 77 no. 17 5857-5867
DOI: http://dx.doi.org/10.1128/AEM.05338-11
European Patent
METHOD OF MODIFYING A YEAST CELL FOR THE PRODUCTION OF
ETHANOL
Publication number: EP2222860
Publication date: 2010-09-01
Inventor(s): NEVOIGT, E., GUILLOUET, S., BIDEAUX, C., ALFENORE,
S., HUBMANN, G.
Pagliardini, J ., Hubmann, G., Alfenore, S., Nevoigt, E., Bideaux, C., Guillouet, S.E.
The metabolic costs of improving ethanol yield by reducing glycerol formation
capacity under anaerobic conditions in Saccharomyces cerevisiae
Microb. Cell Fact. March 2013 vol. 12 no. 29.
DOI: http://dx.doi.org/10.1186/1475-2859-12-29
3. Scientific contribution
The author participated in the project conception, experimental work, data analysis and article
writing.

54 Chapter II
4. Manuscript I: Gpd1 and Gpd2 fine-tuning for sustainable reduction of
glycerol formation in Saccharomyces cerevisiae
4.1 Introduction
The major portion of total expenditure in today’s bioethanol industry is allotted to feedstock
costs (Galbe et al, 2007). Therefore, it has to be ensured that all polysaccharides present in the
raw material are efficiently converted into fermentable sugars plus that all sugars are
completely converted into ethanol with a high yield (ethanol per sugar consumed). This work
focuses on the question of how to improve the conversion yield (sugar to ethanol) in the yeast
S. cerevisiae.
The maximum theoretical ethanol yield of glucose fermentation by S. cerevisiae is 0.51 g (g
glucose)-1
. However, the ethanol yields in current industrial processes only reach 90 - 93% of
this maximal theoretical value (Bai et al, 2008). In fact, some carbon is used for the formation
of biomass and certain by-products particularly glycerol. As even small improvements in
ethanol yield would have significant impacts on profits in large-scale ethanol production,
there is a great industrial interest to reduce by-product formation and increase ethanol yield.
A promising route towards an increase in ethanol yield has been the reduction of glycerol
formation (Bro et al, 2006). Indeed, glycerol production in S. cerevisiae can be quite
substantial. For example, 2.0 - 3.6 g glycerol per 100 g consumed glucose have been already
reported by Pasteur (1858). Glycerol formation depends on yeast strain, fermentation
conditions (Alfenore et al, 2004; Bideaux et al, 2006; Gardner et al, 1993) and medium
composition, especially the type of nitrogen source (Albers et al, 1996). Therefore, glycerol
yields (per glucose consumed) reported for different strains and conditions vary and can even
significantly exceed the above mentioned value reported by Pasteur (1858).
Glycerol formation results primarily from balancing the net NADH surplus generated during
yeast growth, particularly under anaerobic conditions (Ansell et al, 1997; Bakker et al, 2001;
Rigoulet et al, 2004; Valadi et al, 2004). In addition, intracellular glycerol is involved in
osmo-adaptation (Hohmann, 2002), oxidative stress protection (Pahlman et al, 2001), and
response to heat shock (Aldiguier et al, 2004; Siderius et al, 2000).
A first group of past metabolic engineering approaches towards reduction of glycerol
formation in yeast targeted either enzymes (Bjorkqvist et al, 1997; Nissen et al, 2000a; Valadi

Chapter II 55
et al, 1998) and/or a plasma membrane transporter (Cao et al, 2007; Zhang et al, 2007) which
are directly involved in formation and intracellular accumulation of glycerol. A second type
of approaches attempted reducing net NADH production during yeast growth (Bro et al,
2006; Nissen et al, 2000b). Moreover, a number of studies have combined strategies of the
first and the second type (Cao et al, 2007; Kong et al, 2007a; Kong et al, 2006; Kong et al,
2007b). Recently, Guadalupe Medina et al. (2010) have opened up a third type of approaches,
namely by providing an alternative route of NADH re-oxidation. The additional value of this
latter approach is that acetic acid, an unwanted compound in plant biomass hydrolyzates is
converted into ethanol thereby serving as a redox sink and replacing glycerol formation.
However, the approach of Guadalupe Medina et al. (2010) also included a double deletion of
GPD1 and GPD2 and was thus accompanied by osmostress sensitivity and a strongly reduced
specific growth rate. A recently published route in order to overcome the osmosensitivity of
mutants defective in GPD1, has been the overexpression of trehalose synthesis genes TPS1
and TPS2 (Guo et al, 2011).
The glycerol 3-phosphate dehydrogenase (GPDH) is the rate-controlling enzyme in the
glycerol formation pathway of S. cerevisiae (Cronwright et al, 2002). Therefore, many
previous attempts of group one and several combined strategies included deleting either one
or both isogenes encoding GPDH. The phenotypes after deleting GPD1 and/or GPD2 have
already been tested in different yeast strain backgrounds, media and oxygenation conditions.
Generally speaking, the single deletion of GPD1 resulted in strains sensitive to osmotic stress
(Albertyn et al, 1994), while the deletion of GPD2 reduced growth under anaerobiosis
(Bjorkqvist et al, 1997; Nissen et al, 2000a). However, neither the deletion of GPD1 nor
GPD2 resulted in a noticeable change in glycerol yield at least when prototrophic strains were
studied (Nissen et al, 2000a). In contrast, the deletion of both isogenes led to complete loss of
glycerol formation under all tested conditions. However, the gpd1∆ gpd2∆ mutant is of no
practical relevance since growth and ethanol productivity was abolished under anaerobic
conditions and even strongly reduced under aerobic conditions (Ansell et al, 1997; Bjorkqvist
et al, 1997; Nissen et al, 2000a).
In order to study S. cerevisiae strains which have a glycerol formation capacity ranging
between that of the gpd2∆ single mutant (100%) and the gpd1∆ gpd2∆ double mutant (0%),
we recently replaced the native GPD1 promoter in a gpd2∆ background by two well-
characterized TEF1 promoter mutant versions (Nevoigt et al, 2006; Pagliardini et al, 2010).

56 Chapter II
The genetic modifications were accompanied by 61% and 88% reduction in glycerol yield on
glucose and by 20 and 30% reduction in maximal aerobic growth rate compared to the wild
type. Interestingly, our engineered (“intermediate”) strains referred to as TEFmut2 and
TEFmut7 showed a 2 and 5% increase in ethanol yield and could well cope with process
stress which is in remarkable contrast to a gpd1Δ gpd2Δ double deletion strain. These results
were obtained in a Very High Ethanol Performance (VHEP) fed-batch process with aeration
(Pagliardini et al, 2010). It remained to be tested, how these strains will perform under
anaerobic conditions. This was the first motivation for our current work. A second motivation
resulted from the fact that Gpd2 activity was completely abolished in the “intermediate”
strains described by Pagliardini et al. (2010) and the residual GPDH activity was solely based
on the Gpd1 isoenzyme. As mentioned above, Gpd2 plays a crucial role in redox balancing
under anaerobiosis. In fact, industrial bioethanol production usually occurs under anaerobic
conditions. In the current work, two isogenic strains with abolished Gpd1 activity and two
residual levels of Gpd2 activity were constructed. These novel strains have the opposite
mating type compared to the strains described by Pagliardini et al. (2010) and allowed to
eventually obtain all possible combinations of Gpd1 and Gpd2 residual activities by mating.
Our set of 12 different strains formed a sound basis in order to study the impact of partial
reduction of Gpd1 and Gpd2 activity on physiology under laboratory conditions as well as
conditions relevant in bioethanol industry.
4.2 Materials and Methods
Microbial strains and cultivation conditions
The Escherichia coli strain DH5αTM
(Invitrogen Corp., Carlsbad) was used for amplification
of plasmids. The strain was grown in Luria-Bertani (LB) medium (0.5 % yeast extract, 1 %
peptone, 1% NaCl, pH 7) at 37˚C. E. coli transformation and isolation of plasmid DNA was
carried out using standard techniques (Sambrook et al, 1989). All engineered Saccharomyces
cerevisiae strains (Table 1) generated in this study have been derived from the prototrophic
haploid wild-type strains CEN.PK 113-7D (Mat a) and CEN.PK 113-1A (Mat α). The
medium used for yeast strain maintenance was YD, which contained 1% (v/w) yeast extract
and 1% (v/w) glucose.

Chapter II 57
Table 1 Saccharomyces cerevisiae strains used.
Group Strain Code Genotype Source
reference
I
CEN.PK 113-7D A B MATa van Dijken
et al. (2000) CEN.PK 113-1A A B MATα provided by
P. Kötter IA 1
☐ a B gpd1∆::loxP-bleR-loxP This study
CE 1* A b gpd2∆::loxP-bleR-loxP This study
CE 1.01* a b gpd1∆::loxP-KanMX4-loxP
gpd2∆::loxP-bleR-loxP
This study
II
CE 1.71* a7 b gpd2∆::loxP-bleR-loxP
GPD1p∆::loxP-KanMX4-loxP-TEF1p mutant 7
Pagliardini
et al. (2010)
CE 1.21* a2b gpd2∆::loxP-bleR-loxP
GPD1p∆::loxP-KanMX4-loxP-TEF1p mutant 2
Pagliardini
et al. (2010)
IA 1.743☐ a b7 gpd1∆::loxP-bleR-loxP
GPD2p∆::loxP-KanMX4-loxP-TEF1p mutant 7
This study
IA 1.232☐ a b2 gpd1∆::loxP-bleR-loxP
GPD2p∆::loxP-KanMX4-loxP-TEF1p mutant 2
This study
III
HGW 12-P4▲ a7 b7 GPD1p∆::loxP-KanMX4-loxP-TEF1p mutant 7
GPD2p∆::loxP-KanMX4-loxP-TEF1p mutant 7
This study
HGW 15-F6▲ a7 b2 GPD1p∆::loxP-KanMX4-loxP-TEF1p mutant 7
GPD2p∆::loxP-KanMX4-loxP-TEF1p mutant 2
This study
HGW 14-J6▲ a2 b7 GPD1p∆::loxP-KanMX4-loxP-TEF1p mutant 2
GPD2p∆::loxP-KanMX4-loxP-TEF1p mutant 7
This study
HGW 17-H5▲ a2 b2 GPD1p∆::loxP-KanMX4-loxP-TEF1p mutant 2
GPD2p∆::loxP-KanMX4-loxP-TEF1p mutant 2
This study
* Strains derived from CEN.PK 113-7D
☐ Strains derived from CEN.PK 113-1A
▲ Strains isolated after mating of * strains with ☐ strains of group II and sporulation
Abbreviations for strain codes:
A GPD1 controlled by the natural promoter B GPD2 controlled by the natural promoter
a gpd1∆ b gpd2∆
a7 GPD1 controlled by TEFmut7 promoter b7 GPD2 controlled by TEFmut7 promoter
a2 GPD1 controlled by TEFmut2 promoter b2 GPD2 controlled by TEFmut2 promoter

58 Chapter II
Yeast strain construction
Genetic modifications of S. cerevisiae carried out within this study comprised the deletion of
GPD1 and the replacement of the native GPD2 promoter by the two low-activity promoters,
TEFmut2 and TEFmut7. Both promoters are mutated version of the constitutive TEF1
promtor and were characterized and published by Nevoigt and co-workers (2006). Deletion of
GPD1 was carried out using the method described by Güldener et al. (Gueldener et al, 2002).
The primers for the amplification of the GPD1 disruption and promoter replacement cassettes
as well as for the verification of the correct integration are listed in Table 2.
Table 2 PCR primers and plasmids used as templates for amplification of GPD1 disruption and GPD2
promoter replacement cassettes and for verification of their correct integration in the S. cerevisiae genome.
PCR application Primer
code Sequence*
Amplification of GPD1 deletion
cassette; templates: pUG6 or pUG66
(Gueldener et al, 2002)
P56 CATCAAATCTATCCAACCTAATTCGCACGTAGACTGGCTTGGTAT
cagctgaagcttcgtacgc
P57 CGACGTCCTTGCCCTCGCCTCTGAAATCCTTTGGAATGTGGTAAG
gcataggccactagtggatctg
Verification of GPD1 deletion
P58 CCGCACAACAAGTATCAGA
P59 AAGTAAGGTCTGTGGAACAA
GPD2 promoter replaced byTEFmut7;
template:p416-loxP-KmR-TEFmut7-
yECitrine (Nevoigt et al, 2006)
A2631 TAGCTTACGGACCTATTGCCATTGTTATTCCGATTAATCTATTGT
cagctgaagcttcgtacgc
A2633 TGCGTTCGCTTAAGGAATGTGTATCTTGTTAATCTTCTGACAGCAAGCA
T ttttctagaaaactag
GPD2 promoter replaced byTEFmut2;
template: p416-loxP-KmR-TEFmut2-
yECitrine (Nevoigt et al, 2006)
A2631 See above
A2632 TGCGTTCGCTTAAGGAATGTGTATCTTGTTAATCTTCTGACAGCAAGCA
T ttttctagaaaacttgg
Verification of GPD2 promoter
replacement
A2766 ACGACGATGGCTCTGCCATTG
A2767 AGGATCGGCCACTAGATTATGG
* Nucleotides in capital letters were derived from S. cerevisiae genomic sequence for homologous recombinations at GPD1 and GPD2 locus.
Sequences in low chase letters served as primers for amplification of the deletion or promoter cassettes from respective plasmids (Gueldener
et al, 2002; Nevoigt et al, 2006).
Gene-disruption and promoter-replacement cassettes were amplified by DNA polymerases
with proofreading activity. The PCR reaction conditions were adapted to the guidelines of the
manufacturer. Transformation of S. cerevisiae was carried out according to Gietz and Schiestl
(1991) using treatment with lithium acetate and polyethylene glycol. After the transformation,
cells were incubated in YD for at least 4 h at 30 ˚C to allow expression of the antibiotic
Chapter II 59
resistance genes. In order to select positive yeast transformants, YD agar plates were
supplemented with 7.5 µg/ml phleomycin or 200 µg/ml geneticin G418.
The deletion of GPD1 in the gpd2∆ background (Ab) was carried out using the loxP-
KanMX4-loxP disruption cassette amplified from pUG6 plasmid (Gueldener et al, 2002). The
resulting strain is referred to as the gpd1∆ gpd2∆ double deletion strain (ab). The loxP-bleR-
loxP disruption cassette located on the pUG66 plasmid (Gueldener et al, 2002) was used to
delete GPD1 in Mat α background in order to construct strain aB. The correct integration of
the disruption cassettes into the GPD1 gene locus was verified by PCR (Table 2).
In order to replace the native GPD2 promoter by promoters of much lower activities, the
TEF1 promoter mutants 2 and 7 of our previously published promoter collection for fine-
tuning gene expression in yeast (Nevoigt et al, 2006) were used. Both promoters were located
on CEN/ARS plasmids, which contained the loxP-KanMX-loxP cassette upstream of the
TEF1 promoter mutant. The replacement of the native GPD2 promoter by the low-strength
promoters in gpd1∆ background (strain aB) was confirmed by PCR diagnosis using primers
listed in Table 2.
Mating, sporulation and tetrad analysis
In order to obtain all combinations of promoter engineered GPD1 and GPD2 expression
levels, the strains a7b and a2b (both MATa) described by Pagliardini et al. (2010) were mated
with the newly created strains ab7 and ab2 (both MATα). The diploids were grown over night
in YD medium, harvested and transferred to sporulation plates containing 1,5% agar and 1%
potassium acetate at pH 6. The plates were incubated at 25˚C for 5 days. Asci were pretreated
with 1000 U/ml lyticase (Sigma) to degrade the ascus walls before spore dissection. Dissected
spores were grown on YD medium and segregants afterwards replica plated to YD medium
containing either the antibiotic phleomycin or Geneticin (G418) with the above mentioned
concentrations in order to check the presence of the resistance markers KanMX and bleR. The
segregants which grew in the presence of both antibiotics were parental types (a7b, a2b, ab7
and ab2). Recombination types which had lost the geneticin resistance but were resistant to
phleomycin corresponded to the double deletion strain gpd1∆ gpd2∆ (ab). In recombination
types with resistance to geneticin and sensitivity against phleomycin both GPD1 and GPD2
promoters were replaced by the TEF1 promoter mutant versions TEFmut2 or TEFmut7 (a7b7,

60 Chapter II
a7b2, a2b7 and a2b2). The pre-selected segregants were checked by PCR for the presence of the
promoter cassettes or gene deletions. PCR primers for GPD1 promoter replacement and
GPD2 deletion have been described in Pagliardini et al. (2010), while those for GPD2
promoter replacement and GPD1 deletion are given in Table 2.
Measurement of specific GPDH activity
To determine the specific GPDH activity, yeast strains were grown in minimal medium
(Verduyn et al, 1992) containing 2% (w/v) glucose in shake flasks. The GPDH activity was
measured in exponentially growing cells (OD600 was roughly 1) according to a previously
described method (Gancedo et al, 1968; Nevoigt and Stahl, 1996). One unit of enzyme
activity (U) corresponds to the conversion of 1 µmol NADH to NAD+ per minute (Verduyn et
al, 1992).
Growth tests on solid medium
Cells were grown over night in YD medium. The OD600 was determined and adjusted with
0.85% NaCl solution to OD600 of 1. A 1:10 serial dilution of these cultures was prepared in
triplicate using 0.85% NaCl solution, and 5 l of each dilution was spotted on different solid
media. The minimal medium used for the spot test contained 1.7g l-1
Yeast Nitrogen Base
(Fisher Scientific), 5 g l-1
NH4SO4 and 2% glucose (w/v). For testing osmotolerance, the
glucose concentration was increased to 25% (w/v). Growth was monitored for 2 to 3 days at
30˚C. Anaerobic incubation of agar plates was carried out in an anaerobic jar. The anaerobic
environment was generated by Anaerocult®
A (MERCK, Darmstadt) and controlled with
indicator stripes.
Batch-fermentations under quasi-anaerobic conditions in both minimal and industrial
medium (wheat liquefact)
The fermentations were carried out in 250 ml Erlenmeyer flasks containing 150 ml of medium
inoculated with yeast cells adjusting an initial OD600 of 1. The inoculum was prepared in
minimal medium containing 2% (w/v) glucose. Flasks were equipped with air locks, ensuring

Chapter II 61
the exclusion of oxygen but allowing the release of CO2. This setup was chosen to imitate
industrial bioethanol production and can be considered to provide quasi-anaerobic conditions
for the major part of the fermentation, i.e. after a short initial phase during which cells
consumed residual oxygen. The fermentations were performed at 30˚C and cultures were
continuously mixed at 200 rpm using a magnetic stirrer.
The synthetic minimal medium used for the fermentation experiments was composed as
follows: (NH4)2SO4 3g l-1
, KH2PO4 3.51g l-1
, K2HPO4 3H2O 2.1 g l-1
, MgSO4 7H2O 0.74 g l-1
,
EDTA (disodium salt) 1 mg l-1
, CaCl2 2H2O 6 mg l-1
, ZnSO4 7H2O 9 mg l-1
, FeSO4 7H2O
6mg l-1
, H3BO3 2 mg l-1
, MnCl2 4H2O 1.23 mg l-1
, Na2MoO4 2H2O 0.6 mg l-1
, CoCl2 6H2O
0.8 mg l-1
, CuSO4 5H2O 0.5 mg l-1
, KI 0.2 mg l-1
, D-Biotin 0.05 mg l-1
, p-Aminobenzoic acid
1 mg l-1
, Nicotinic acid 1 mg l-1
, Ca pantothenate 8 mg l-1
, Pyridoxine HCl 5 mg l-1
, Thiamine
HCl 5 mg l-1
, m-Inositol 25 mg l-1
, and D-glucose 50 g l-1
.
The wheat liquefact (24.5% dry mass content) used in the SSF fermentation was kindly
provided by a local ethanol producer. The pH was adjusted to 4.5 with sulfuric acid. In order
to obtain wheat hydrolyzate from wheat liquefact, enzymatic starch hydrolysis was performed
using Spirizyme®
(Novozyme, Denmark). In order to perform the SSF of the wheat liquefact,
Spirizyme®
was added up to 0.05% (w/w) of the wheat liquefact dry mass. At the same time,
wheat liquefact was inoculated with yeast OD600 of 1. We added 5 mg l-1
of the antibiotic
chloramphenicol to inhibit bacterial growth in the first hours of the fermentation. All
Erlenmeyer flasks were weighed during fermentation to monitor CO2 production as readout
for the volumetric productivity.
In order to obtain the glucose concentration after the complete hydrolysis of the liquefact (for
product yield calculations), an aliquot was incubated at 60˚C for 24h with the Spirizyme®
(without yeast).
Determination of biomass in minimal medium fermentations
OD600 was determined at the beginning and at the end of the fermentation. In addition, the
yeast dry mass was determined at the end of fermentation by filtering 50 ml of culture through
pre-weighed nitrocellulose filters with a pore size of 0.45 µm. Filters were washed once with
distilled water and kept at 80˚C for two days. Afterwards, they were weighed again. The

62 Chapter II
biomass at the start of the minimal medium fermentation was estimated from OD600 using the
dry mass OD600/ratio obtained from samples taken at the end of fermentation.
Determination of ethanol, glycerol and glucose
Glucose, glycerol and ethanol concentrations in the fermentation supernatants were
determined by HPLC (Waters®
isocratic BreezeTM
HPLC, ion exchange column
WAT010290) and refractive index detection (Waters, 2414 RI detector) using the following
conditions: 75˚C column temperature, 5 mM H2SO4 used as eluent and 1 ml min-1
flow rate.
Yield calculations
The product yields in the minimal medium fermentations were calculated from the final
product concentration (g l-1
) and the difference in glucose concentrations at start and end of a
fermentation (consumed glucose in g l-1
). The product yields in the SSF were based on the
final product concentrations and the equivalent initial glucose concentration (the latter was
measured in a completely hydrolyzed sample of wheat liquefact as described above).
Maximal volumetric production rate
The fermentation tubes were weighed throughout the fermentation process. The loss of the
medium mass was recorded and related to the initial medium mass. The maximal volumetric
ethanol production rate rmax (g l-1
h-1
) was calculated from the monitoring of the mass loss
during anerobic fermentation as described by Zwietering et al. (1990).
4.3 Results
Genetic modifications of GPD1 and GPD2
The goal of the current work was to study the effect of partly reduced Gpd1 and Gpd2 cellular
levels (separately and in combinations) on physiology of S. cerevisiae. The CEN.PK
background was used as a model genetic background, since strains of the CEN.PK family

Chapter II 63
have been previously proposed as "acceptable references for quantitative yeast research"
(van Dijken et al, 2000). We exclusively used prototrophic strains in order to avoid any
potential artefacts based on auxotrophic markers (Pronk, 2002). The strains with several
residual activities of Gpd1p and Gpd2p in different combinations were obtained as described
in Material and Methods and depicted in Figure 1.
Figure 1 Schematic overview showing the generation of 11 S. cerevisiae strains with reduced levels of
Gpd1 and Gpd2 by genetic engineering and mating. The isogenic haploid and prototrophic wild-type strains
CEN.PK 113-7D and CEN.PK 113-1A were used as starting strains.
The resulting strains listed in Table 1 were classified into three groups. The group I contains
the wild type (AB), the gpd1∆ (aB) and gpd2∆ (Ab) single deletion as well as the gpd1∆
gpd2∆ double deletion strain (ab). These strains served as references in our study since these
genetic modifications correspond to those which have already been characterized by other
authors even though in a different genetic background (Albertyn et al, 1994; Ansell et al,
1997; Bjorkqvist et al, 1997; Guo et al, 2011; Nissen et al, 2000a; Remize et al, 2003; Valadi
et al, 1998). Strains of group II each have one deleted isogene and the other isogene under
control of either the TEFmut2 or the TEFmut7 promoter. These promoters are mutated
versions of the S. cerevisiae TEF1 promoter (Nevoigt et al, 2006), i.e. not regulated by
osmostress or anarobiosis and weaker than the native promoters of GPD1 and GPD2. Group
III comprises strains having residual levels of both isogenes, i.e. the expression of both GPD1
and GPD2 gene is de- and downregulated by the TEFmut2 or the TEFmut7 promoter.

64 Chapter II
Figure 2 Specific GPDH activity and glycerol yields of S. cerevisiae wild type and engineered strains with
reduced levels of Gpd1 and Gpd2. (A) GPDH activity measured in yeast cell extracts of aerobically grown cells
harvested during the exponential growth phase. (B) Glycerol yield obtained with the strains in synthetic minimal
medium under quasi-anaerobic conditions are plotted against the specific GPDH activity shown in Figure 3A
(explanation in the text). Strains are indicated as follows: ▽ for wild type CEN.PK 113-7D (AB), ◆ for gpd1∆
(aB), ● for gpd2∆ (Ab), ▲ for gpd1∆ gpd2∆ (ab), and for all intermediate strains (ab2, ab7, a2b, a7b, a2b7,
a7b2, a2b2, a7b7). All results shown are mean values including standard deviations from three biological
replicates.
Specific GPDH activities of all engineered strains and the wild type (CEN.PK 113-7D) were
measured in exponentially growing cells from shake flask experiments (Figure 2). The
deletion of the GPD1 (strain aB) reduced GPDH activity to 26%; whereas the deletion of
GPD2 (strain Ab) led to an increase of GPDH activity by 12% when compared to the wild
type. The GPDH activity measured in the double deletion gpd1∆ gpd2∆ strain (ab) was close
to zero. These relative GPDH activities (% of wild-type activities) measured for group I
reference strains more or less matched the findings obtained by other authors when studying
the GPDH gene deletions in different genetic backgrounds (Nissen et al, 2000a; Valadi et al,
2004). The increased GPDH activity in the gpd2∆ deletion strain has been traced back to a
kind of autoregulation, i.e. an increased transcription level of GPD1 (Valadi et al, 2004). This
auto-regulation should be abolished in all engineered strains which do not have the native
GPD1 promoter. The main objective of the current study was to generate “intermediate”
strains, i.e. specific GPDH activities between the level of the wild type (AB) and the gpd1∆

Chapter II 65
single deletion strain (aB). When looking at the GPDH activities of the group II strains
(Figure 2A), it becomes obvious that only strain a7b represents such an “intermediate” strain
while the levels of the other three strains are equal or lower compared to strain aB. In
contrast, strains of group III show finely graded residual activities between those of AB and
aB.
Figure 3 Growth of S. cerevisiae wild type and engineered strains with reduced levels of Gpd1 and Gpd2
under conditions, which challenge glycerol formation, i.e. osmotic stress (synthetic minimal medium plus 25%
glucose) and NADH accumulation (synthetic minimal medium with 2% glucose under anaerobiosis). Minimal
medium under aerobiosis was used as reference conditions. Growth tests were performed on solid media. Cells
were pre-grown in YD. The OD600 of all cultures was adjusted to 1, serial 1:10 dilutions were prepared and 5 l
of each dilution was spotted.
Growth during osmotic stress or anaerobic conditions
As mentioned in the introduction, the formation of glycerol has several important biological
functions in S. cerevisiae. It enables growth under osmotic stress and its formation maintains
cytosolic NADH/NAD+ balance. Surplus cytosolic NADH is generated during biomass
formation, particularly when yeast grows in minimal medium and has to synthesize all amino

66 Chapter II
acids de novo (Albers et al, 1996). Moreover, maintaining cytosolic redox balance is
particularly important under anaerobiosis when cells cannot reoxidize the surplus NADH by
the external NADH dehydrogenases coupled to the respiratory chain (Bakker et al, 2001).
Therefore, we tested our set of strains under conditions, which particularly challenge glycerol
formation such as minimal medium in presence and absence of oxygen as well as minimal
medium with 25% (w/v) glucose (to test osmotolerance). In the presence of 25% glucose,
growth on solid medium was unaffected as long as GPD1 expression was driven by the native
GPD1 promoter. Interestingly, 25% glucose did also not negatively influence the growth if
GPD1 expression was controlled by the TEFmut7 promoter which has been shown to confer
16% of native TEF1 promoter activity (Nevoigt et al, 2006). The TEFmut7 promoter is
assumed to be much less active than the native GPD1 promoter particularly during osmostress
where the native GPD1 promoter is strongly induced. Growth in 25% glucose was however
severely decreased if GPD1 expression was either under control of the weak TEFmut2
promoter (7% of native TEF1 promoter) or completely abolished by gene deletion.
Without osmotic stress, virtually all strains grew fairly well on minimal medium in the
presence of oxygen, however the combination of minimal medium with anaerobiosis
negatively influenced the growth of the strains with reduced Gpd1 and/or Gpd2 activities
(Figure 3). It seems that the impact of a reduced GPDH activity on growth under anaerobic
conditions in minimal medium is independent of whether Gpd1 or Gpd2 activity was reduced.
For example, there was no significant difference in growth between the strains a7b and ab7 or
between the strains a7b2 and a2b7 under anaerobic conditions (Figure 3). Remarkably, these
pairs of strains showed clear differences in growth under osmotic stress, respectively.
In contrast to several previous studies, which showed that mutants lacking GPD2 showed
poor growth under anaerobic conditions (Bjorkqvist et al, 1997; Nissen et al, 2000a), our
gpd2∆ deletion strain (Ab) did not show any remarkable growth problems under anoxic
conditions in minimal medium (Figure 3; Table 3). Moreover, expression of GPD2 has been
shown to be stimulated by cytosolic NADH accumulation as it occurs e.g. during anoxic
conditions in minimal medium (Ansell et al, 1997). In fact, this upregulation was impossible
in strains where GPD2 was under control of the TEFmut promoters. Our results put an
isoform-specific role of Gpd2 under anaerobic conditions somewhat into question. It should,
however, be emphasized that a growth test on solid medium does not allow a deduction of

Chapter II 67
specific growth rates and is less sensitive than liquid medium when it comes to the detection
of only slight differences in specific growth rates.
Fermentations in defined minimal medium
We first chose defined minimal medium in order to investigate the fermentation performance
of our strains with different GPD1/2 expression levels, particularly their glycerol and ethanol
yields as well as their maximal volumetric ethanol production rates. One advantage of using
synthetic minimal medium is a generally high demand in NAD+ regeneration particularly
under anaerobic conditions as explained above. In fact, slight differences in glycerol
production capacity between the 12 strains were expected to be more pronounced in minimal
medium than in industrially used media which are complex and contain amino acids (see
below). Another major advantage of using defined minimal medium is the possibility to
calculate precise carbon balances.
Table 3 Fermentation time, product yields and carbon balances of engineered strains of S. cerevisiae with
reduced levels of Gpd1 and Gpd2 as well as the isogenic wild type calculated at the end of fermentations in
synthetic minimal medium under quasi-anaerobic conditions.
Gen
oty
pe
Tim
e (h
) Yields of fermentation products
(C-mol ratio product per glucose consumed)
Ca
rbo
n
reco
ver
y
Ethanol Carbon
dioxide1 Glycerol Acetate Biomass
Gro
up
I
A B 25.8 0.586 0.275 0.058 0.008 0.064 99.1%
a B 28.5 0.595 0.276 0.050 0.006 0.075 100.2%
A b 27.1 0.595 0.279 0.046 0.005 0.070 99.4%
a b n.d.2 0.6302 0.3092 0.0052 0.0002 0.0442 98.8%2
Gro
up
II
a7 b 68.2 0.623 0.295 0.021 0.001 0.065 100.6%
a2 b 152.3 0.632 0.324 0.009 0.000 0.050 101.6%
a b7 75.3 0.615 0.288 0.022 0.001 0.064 99.0%
a b2 140.5 0.627 0.311 0.017 0.001 0.054 101.0%
Gro
up
III
a7 b7 51.0 0.613 0.288 0.032 0.002 0.060 99.3%
a7 b2 48.0 0.610 0.295 0.025 0.001 0.070 100.1%
a2 b7 54.2 0.621 0.287 0.023 0.001 0.067 99.9%
a2 b2 110.0 0.622 0.301 0.019 0.000 0.062 100.5%
1Carbon dioxide production was calculated from the total weight loss of the medium during fermentation.

68 Chapter II
2 The gpd1∆ gpd2∆ double deletion was not able to completely consume the sugar.
The small-scale batch fermentations in synthetic minimal medium were carried out under
quasi-anaerobic conditions (see Material and Methods). Glucose concentration used for this
experiment was 50 g l-1
which was not expected to cause osmotic stress (Wang et al, 1979).
Apart from the double deletion gpd1∆ gpd2∆ strain, all strains were able to completely
consume the sugar even though the required time was different (Table 3). Product yields are
also shown in Table 3. Although obtained under different conditions, we plotted the glycerol
yield (obtained under quasi-anaerobic conditions) against the corresponding GPDH activity
measured in shake flasks. The decision to measure all GPDH activities under aerobic
conditions was due to comparable growth characteristics, which was not achievable under
anaerobic conditions. A fairly good correlation can be seen in Figure 3B, when disregarding
the wild type and gpd1∆ deletion strain. In these two strains, GPD2 expression is under
control of the native GPD2 promoter. This promoter has been shown to be induced by NADH
accumulation under quasi-anaerobic conditions (Ansell et al, 1997; Valadi et al, 2004) and
the GPDH activity measured under aerobic conditions clearly underestimated the actual value
under quasi-anaerobic conditions. As all other strains have a deregulated or no GPD2 gene,
we do not assume major differences between anaerobic and aerobic GPDH activity.
To evaluate the effect of reduced glycerol formation capacity on other fermentation
parameters, we decided to plot the relevant fermentation product yields against the glycerol
yield. Figure 4A shows that any reduction in glycerol yield leads to a corresponding increase
in the ethanol yield. This inverse correlation can be seen over the entire range of glycerol
yields. However, the metabolic shift from glycerol to ethanol is accompanied by a reduction
in the maximal volumetric ethanol production rate (g h-1
l-1
; calculation see Material and
Methods) as visible in Figure 4B. We can conclude that even a slight reduction in glycerol
formation capacity resulted in a decrease in growth rate and/or specific ethanol production
rate. This is in contrast to the biomass yield, where we can only see a reduction at glycerol
yields lower than 50% of the wild-type level (Figure 4C). Interestingly, acetate yields
exhibited a nice direct correlation with glycerol yield (Figure 4D), particularly in the range
between 50 and 100% of wild-type glycerol yield. Carbon balances were nicely closed for
virtually all strains (Table 3).
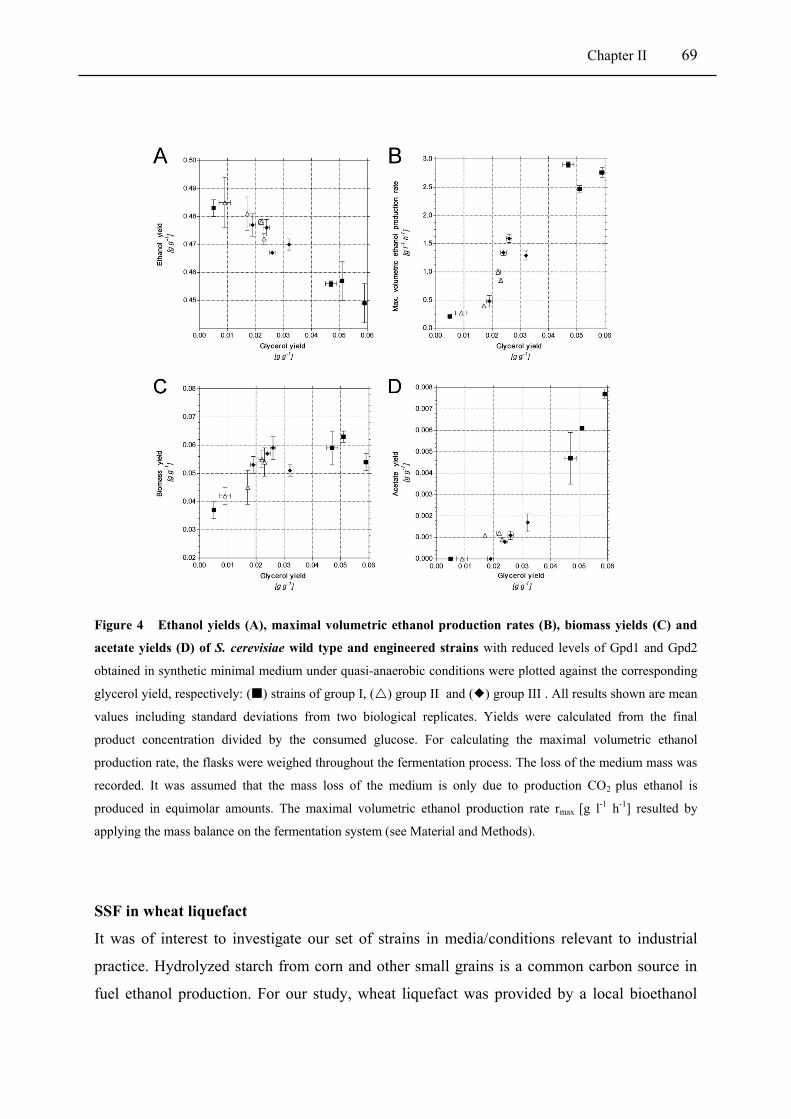
Chapter II 69
Figure 4 Ethanol yields (A), maximal volumetric ethanol production rates (B), biomass yields (C) and
acetate yields (D) of S. cerevisiae wild type and engineered strains with reduced levels of Gpd1 and Gpd2
obtained in synthetic minimal medium under quasi-anaerobic conditions were plotted against the corresponding
glycerol yield, respectively: () strains of group I, () group II and () group III . All results shown are mean
values including standard deviations from two biological replicates. Yields were calculated from the final
product concentration divided by the consumed glucose. For calculating the maximal volumetric ethanol
production rate, the flasks were weighed throughout the fermentation process. The loss of the medium mass was
recorded. It was assumed that the mass loss of the medium is only due to production CO2 plus ethanol is
produced in equimolar amounts. The maximal volumetric ethanol production rate rmax [g l-1 h-1] resulted by
applying the mass balance on the fermentation system (see Material and Methods).
SSF in wheat liquefact
It was of interest to investigate our set of strains in media/conditions relevant to industrial
practice. Hydrolyzed starch from corn and other small grains is a common carbon source in
fuel ethanol production. For our study, wheat liquefact was provided by a local bioethanol

70 Chapter II
producer. Wheat liquefact contains mainly dextrins and results from milling, cooking and α-
amylase treatment of wheat kernels (Kelsall and Lyons, 2003). In order to further convert the
dextrins into fermentable sugars, a treatment with glucoamylase is required. Two different
scenarios are common in industry (Kelsall et al, 2003): Separate Hydrolysis and Fermentation
(SHF) and Simultaneous Saccharification and Fermentation (SSF). In SHF, the glucoamylase
treatment of wheat liquefact is performed before the hydrolyzate is inoculated with yeast. The
sugar concentration at the end of the mashing process was 200 g l-1
and thus represents an
osmotic stress for the yeast cells. In the SSF scenario, the hydrolytic enzymes plus the yeast
are added to the liquefact at the same time, i.e. saccharification and fermentation occur
simultaneously. This SSF process which is nowadays more frequently used in industrial
practice does not allow an accumulation of sugars released from starch and thus avoids
osmotic stress. Based on our plate growth assays (Figure 3), we already knew that osmotic
stress was deleterious for the strains with very low GPD1 expression levels. Therefore, we
decided to investigate our strains in the SSF process. The SSF experiments in wheat liquefact
revealed that not all strains were able to completely ferment the available sugars in an
acceptable time. In fact, the wild type required 53 hours to finish fermentation and, apart from
the single deletion strains (aB and Ab), only four further strains (a7b, a7b7, a7b2 and a2b7)
completed the fermentation within a period no longer than 150 hours (Table 4).
The glycerol yield obtained with the wild type in the SSF was only half of the glycerol yield
in minimal medium (Figure 4 and Table 3) because of two reasons. Firstly, wheat mash
(hydrolyzate) is rich in nutrients and thus also contains amino acids even though assimilable
nitrogen in wheat hydrolyzate is not sufficient to support fermentation at the fastest rate
(Thomas and Ingledew, 1990). Secondly, it is a well known fact that the major part of
glycerol formation is coupled to growth (Boender et al, 2009). Glycerol yield per sugar
consumed becomes lower if there is a longer production phase after finishing cell growth.
This was the case in wheat liquefact since the total amount of glucose (180 g l-1
) was much
higher compared to the experiments in minimal medium (50 g l-1
). Due to the generally lower
glycerol yields in wheat liquefact, the differences between strains were, as expected, less
pronounced in the SSF compared to minimal medium. For example, the reduction of the
glycerol yield in the a7b strain was only 33% (Table 4) when compared to the wild type, while
the same strain showed a reduction by 63% (Table 3) in the fermentations in minimal
medium.

Chapter II 71
Table 4 Performance of engineered strains of S. cerevisiae with reduced levels of Gpd1 and Gpd2 as well
as the isogenic wild type simultaneous saccharification and fermentation (SSF) of wheat liquefact under quasi-
anaerobic conditions. Results shown are mean values of two independent experiments including standard
deviation. Ethanol yield, glycerol yield and maximal volumetric production rate was only calculated if
fermentation was completed within 150 hours or less. Fermentation was considered to be completed when the
mass of the medium did not change anymore.
Gen
oty
pe
Fermentation
time Yields on total substrate Max. volumetric
ethanol
production rate Glycerol Ethanol
[h] [g g-1] [g g-1] [g l-1h-1]
Gro
up
I
A B 53 0.027 ± 0.002 0.487 ± 0.004 4.8 ± 0.1
a B 59 0.028 ± 0.001 0.486 ± 0.001 4.5 ± 0.7
A b 64 0.024 ± 0.002 0.489 ± 0.001 3.9 ± 0.2
a b >150 n.d. n.d. n.d.
Gro
up
II
a7 b 107 0.018 ± 0.000 0.492 ± 0.003 2.1 ± 0.1
a2 b >150 n.d. n.d. n.d.
a b7 >150 n.d. n.d. n.d.
a b2 >150 n.d. n.d. n.d.
Gro
up
III
a7 b7 87 0.020 ± 0.001 0.490 ± 0.006 2.7 ± 0.2
a7 b2 99 0.019 ± 0.001 0.492 ± 0.003 2.5 ± 0.1
a2 b7 150 0.019 ± 0.001 0.491 ± 0.004 1.6 ± 0.1
a2 b2 >150 n.d. n.d. n.d.
Regarding the four “intermediate” strains which were able to completely ferment the available
sugars, the reduction in the glycerol yield compared to the wild type was 33.3% in strain a7b,
25.9% in strain a7b7, and 29.6% in strains a7b2 and a2b7. Consistent with this, these strains
also showed an increase in ethanol yield which was 1.0% in strain a7b, 0.6% in strain a7b7,
1.0% in strain a7b2 and 0.8% in strain a2b7. Although the increases in ethanol yield do not
seem to be significant (when looking at the standard deviations), we still believe that the
slight increases are true due to the following considerations. Firstly, we measured a slight
increase in the ethanol yield in all four strains considered here (i.e. a7 b, a7b7, a7b2 and a2b7).

72 Chapter II
Secondly, a reduction in glycerol yield by 30% compared to the wild type (from 0.027 g g-1
to
0.019 g g-1
) should be, in theory, accompanied by an increase in the ethanol yield by 0.84%
(from 0.487 g g-1
to 0.491 g g-1
) provided that all carbon is redirected from glycerol to
ethanol. However, we previously showed that the increase in the ethanol yield with the a7b
and a2b strains observed in aerobic ethanolic fermentation was due to redirection of the
carbon from not only glycerol but also biomass to ethanol (Pagliardini et al, 2010).
It has to be emphasized once more, that even slight increases in the ethanol yield are not
irrelevant and could have major impacts on profits of a bioethanol company. However, the
increases in ethanol yield in SSF also come along with a decrease in maximal volumetric
ethanol production rates accompanied by prolonged fermentation times (Table 4). For
example, the two strains which show a 1% increase in ethanol yield (strains a7b and a7b2),
show a maximal volumetric production rate which is decreased by about 56 or 44% compared
to the wild type, which means that fermentation time was roughly doubled for these strains
(Table 4).
4.4 Discussion
Even slight reductions of glycerol production (which result in ethanol yield increases without
impacting volumetric productivity) would be of great interest for the bioethanol industry due
to the fact that ethanol is a bulk product and feedstock is a major cost factor. The glycerol 3-
phosphate dehydrogenase (GPDH) is known to be the rate-controlling enzyme of glycerol
formation and the isogenes GPD1 and GPD2 encode for it. On one hand, many approaches to
reduce glycerol formation have included the deletion of one or both isogenes. On the other
hand, the two gene products have been shown to fulfil different important biological functions
in the cell. Thus, the complete deletion of one gene might have negative impacts in particular
when it comes to industrial bioethanol production subjecting the yeast to several stress
conditions (Kelsall et al, 2003). We wondered whether it is more sustainable for the cell if
isoenzyme activities are not completely shut down to zero but rather reduced to a certain
residual level. Here, several prototrophic strains were constructed which have different
expression levels of both isogenes (i.e. gene expression is driven by either the native
promoter, the TEFmut7 promoter, the TEFmut2 promoter or completely abolished by gene

Chapter II 73
deletion). Different combinations of GPD1 and GPD2 expression levels were generated. The
resulting set of strains represents a comprehensive tool for in-depth quantitative studies about
the impact of reduced Gpd1 and/or Gpd2 levels on physiology of S. cerevisiae.
The use of prototrophic strains is particularly important in studying glycerol formation since
the flux through this pathway is strongly dependent on whether amino acids have to be de
novo synthesized or taken up from the medium (see below). In addition, medium composition
strongly influences glycerol formation. We therefore believe that it is crucial to test
engineered strains in real industrial media, which - in terms of free amino acid availability -
strongly differ from media used in fundamental yeast research such as synthetic minimal
medium or YPD complex medium. To our knowledge, this is the first study of strains with
reduced GPDH activity in a medium relevant in industrial bioethanol production.
S. cerevisiae strains deleted in GPD1 have been proven to be osmosensitive (Albertyn et al,
1994). Although osmotic stress can be virtually avoided during bioethanol production by
using the SSF process, we studied the behaviour of our strains when subjected to osmostress.
This was particularly interesting because the replacement of the native promoters of GPD1
and GPD2 by TEF1 promoter versions must be accompanied by a loss of native gene
regulation by osmostress and NADH accumulation, respectively. Interestingly, the three
“intermediate” strains a7b, a7b7 and a7b2 did not show any significant loss of osmotolerance
(Figure 3) despite the replacement of the native GPD1 promoter by a constitutive and weaker
promoter. The residual GPDH activity in these strains was between 60 and 78% of the wild
type (Figure 2A) under non-osmostress conditions and the activity of the wild type is known
to even increase significantly by osmotic stress (Albertyn et al, 1994). Our result showing that
GPD1 expression driven by the weaker and non-osmoresponsive TEFmut7 promoter is
sufficient to cope with osmotic stress such as the wild type is particularly interesting in the
context of recent findings published by other authors suggesting that GPD1 upregulation only
plays a minor (if any) role for survival of osmotic shock (Bouwman et al, 2011; Mettetal et al,
2008; Westfall et al, 2008). Instead metabolic changes seem to be far more important for
increased glycerol formation and counteracting osmotic stress.
Another interesting result of our study was the striking difference regarding how one GPD
isogene was able to replace the other one for its major biological function such as osmostress
tolerance and NADH balancing under anaerobiosis, respectively. Obviously, the major
function of GPD2, i.e. redox balancing, can be easier complemented by GPD1, while GPD2

74 Chapter II
is less efficient in taking over the role of GPD1 in osmostress response. In fact, no significant
differences in growth between the strains a7b and ab7 or between the strains a7b2 and a2b7 in
minimal medium under anaerobic conditions could be detected while these pairs of strains
showed clear differences under osmotic stress, respectively (Figure 3). It rather seems that the
role of GPDH in NADH balancing can be virtually equally fulfilled by both isoenzymes. This
even seems to be confirmed by the nice correlation of GPDH activities and glycerol yields in
Figure 2B (provided that the GPDH activities measured in this study are the sum of residual
Gpd1 and Gpd2 activities).
In contrast to redox balancing, osmostress tolerance was rather dependent on the residual
level of only one isoenzyme which is GPD1. Probably, the action of the metabolic regulation
on Gpd1 for glycerol formation during osmostress recently proposed by Bouwman et al.
(Bouwman et al, 2011) is stronger than on Gpd2. The detailed mechanism of this regulation is
not yet known. However, it has been assumed by Jung et al. (2010) that Gpd1 re-localizes to
the nucleus during osmostress. If this re-localization solely occurs on Gpd1 but not on Gpd2,
it could explain the inability of Gpd2 to act in the same way as Gpd1 after osmostress. We
have to emphasize that the expression levels of GPD1 and GPD2 are driven by opposite
promoter strengths in the strains a7b2 and a2b7. Thus, we can expect that the levels of
transcription for GPD1 in a7b2 should be comparable to the level for GPD2 in a2b7 and vice
versa. Nevertheless, we cannot completely exclude that a different efficiency of translation
was the reason for the difference in phenotype.
The metabolic shift from glycerol to ethanol was accompanied by a reduction in metabolic
rates as shown here by the maximal volumetric ethanol production rates (see discussion
below). However, the biomass yield (per glucose consumed) was not reduced as long as
glycerol yield was above 50% of wild type level. The question arise which route of NADH
reoxidation was used then instead of glycerol formation. The reduction of NADH production
during acetate production in strains with reduced GPDH activity observed by us and other
authors (Guo et al, 2010; Valadi et al, 2004) can also not serve as a quantitative explanation
since acetate production was extremely low. We rather believe that cells with reduced
glycerol formation capacity were to a certain part (i.e. up to 50% reduction of glycerol yield)
able to adjust their metabolism for maximizing biomass yield. In this regard, the reader might
be referred to the discussion of Valadi et al. (2004) who proposed that NADP+ could probably
substitute for NAD+ as a cofactor in biosynthetic pathways to a larger extent than expected.

Chapter II 75
A major industrially relevant question of our study was to which level Gpd1 and Gpd2
expression can be reduced without a negative impact on maximal volumetric ethanol
production rate. Based on our results, we can conclude that even a small reduction in glycerol
yield leads to a corresponding negative impact on maximal volumetric ethanol production rate
in CEN.PK, which means that this strain does not produce more glycerol than absolutely
necessary for fulfilling the crucial biological functions. It has to be however mentioned that
three industrial S. cerevisiae strains have been demonstrated to show a 60 to 80% higher
glycerol yield compared to the model strain CEN.PK used in the current study (Devantier et
al, 2005). Therefore, it remains to be studied whether these commercial strains differ from
CEN.PK in that they produce more glycerol than absolutely necessary for maximal growth.
The work presented here shows that higher yields in ethanol seem to be feasible if longer
fermentation times were acceptable. However, a higher risk of contamination impairs such an
approach. In fact, industrial ethanol production is carried out under non-sterile conditions and
quick ethanol production by yeast is required in order to efficiently inhibit the growth of lactic
acid bacteria and compete for the available sugars.
In summary, strains with intermediate activities of Gpd1 and Gpd2 showed an improved
ethanol yield combined with the ability to completely ferment the sugars in both minimal
medium and wheat liquefact (SSF). Our result implies that these strains were able to tolerate
the high ethanol concentration at the end of the wheat liquefact SSF (up to 90 g l-1
), i.e.
fermentation did not stick due to an elevated sensitivity against high ethanol caused by
reduced GPDH activity. In fact, the gpd1∆ gpd2∆ double deletion strain has been shown to be
severely affected in ethanol tolerance (Boulahya, 2005). Moreover, three of our strains were
comparable to the wild type in terms of osmotolerance. Thus, compared to the gpd1∆ gpd2∆
double deletion strain, which virtually cannot grow and ferment at all under anaerobic
conditions, our “intermediate” strains represent a clear improvement, even though maximal
volumetric ethanol production rate was only 50% in these strains when compared to wild
type. Although strains solely based on partly reduced levels of both Gpd1 and Gpd2 might not
be directly applicable in bio-ethanol production, they seem to be a good starting point for
further metabolic engineering approaches which provide alternative pathways for NADH
reoxidation such as the strategy recently presented by Guandalupe Medina et al. (2010).


Chapter III
Quantitative trait analysis of yeast biodiversity
yields novel gene tools for metabolic engineering

78 Chapter III
1. Abstract
Engineering of metabolic pathways by genetic modification has been restricted largely to
enzyme-encoding structural genes. The product yield of such pathways is a quantitative
genetic trait. Out of 52 Saccharomyces cerevisiae strains phenotyped in small-scale
fermentations, we identified strain CBS6412 as having unusually low glycerol production and
higher ethanol yield as compared to an industrial reference strain. We mapped the QTLs
underlying this quantitative trait with pooled-segregant whole-genome sequencing using 20
superior segregants selected from a total of 257. Plots of SNP variant frequency against SNP
chromosomal position revealed one major and one minor locus. Downscaling of the major
locus and reciprocal hemizygosity analysis identified an allele of SSK1, ssk1E330N…K356N
,
expressing a truncated and partially mistranslated protein, as causative gene. The diploid
CBS6412 parent was homozygous for ssk1E330N…K356N
. This allele affected growth and
volumetric productivity less than the gene deletion. Introduction of the ssk1E330N…K356N
allele
in the industrial reference strain resulted in stronger reduction of the glycerol/ethanol ratio
compared to SSK1 deletion and also compromised volumetric productivity and osmotolerance
less. Our results show that polygenic analysis of yeast biodiversity can provide superior novel
gene tools for metabolic engineering.

Chapter III 79
2. Bibliographic reference
Hubmann, G., Foulquié-Moreno, MR., Nevoigt, E., Duitama, J., Meurens, N., Pais, TM.,
Mathé, L., Saerens, S., Nguyen, HTT., Swinnen, S., Verstrepen, KJ., Concilio, L., de
Troostembergh, JC., Thevelein, JM.
Quantitative trait analysis of yeast biodiversity yields novel gene tools for
metabolic engineering
Manuscript accepted in Metabolic Engineering (available Online 18th
March 2013)
DOI: http://dx.doi.org/10.1016/j.ymben.2013.02.006
Patent Application Intellectual Property Office
Mutant yeast strain with decreased glycerol production
Application number: GB1217028.8
Date Loged: 25 Sept. 2012
Inventor(s): Thevelein J.M., Hubmann G., Foulquié-Moreno M.R.
Swinnen, S., Schaerlaekens, K., Pais, T., Claesen, J., Hubmann, G., Yang, Y., Demeke, M.,
Foulquie-Moreno, MR., Goovaerts, A., Souvereyns, K., Clement, L., Dumortier, F.,
Thevelein JM.
Identification of novel causative genes determining the complex trait of high
ethanol tolerance in yeast using pooled-segregant whole-genome sequence
analysis.
Genome Res. 2012. 22: 975-984
DOI: http://dx.doi.org/10.1101/gr.131698.111
3. Scientific contribution
The author participated in the project conception, experimental work, data analysis and article
writing.

80 Chapter III
4. Manuscript II: Quantitative trait analysis of yeast biodiversity yields
novel gene tools for metabolic engineering
4.1 Introduction
Up to now, the targeted genetic engineering of microorganisms has concentrated largely on
the modification of structural genes encoding enzymes in metabolic pathways. This has been
done either by up- or downregulation of gene expression or by modification of kinetic
characteristics, substrate specificity or regulatory properties of the constituent enzymes
(Nevoigt, 2008). However, targeted engineering has shown only limited success when it
comes to complex traits determined by multiple genes and largely unknown regulatory
networks. Empirical approaches, on the other hand, such as mutagenesis and genome
shuffling, have often been used more successfully as a strategy to alter such complex
phenotypes (Nevoigt, 2008). These approaches have mainly been applied to improve stress
tolerance, which allows direct selection of improved mutants. Alternatively, improvement of
stress tolerance in various species has been achieved using genomic, metagenomic or cDNA
libraries, expressed in a sensitive host microorganism (Nicolaou et al, 2010). Rational
attempts have been carried out to engineer regulatory factors in order to simultaneously and
randomly alter the regulation of many genes at a time. In bacterial systems, transcription of
multiple genes can be modified easily through mutagenesis of σ factors, which has been
referred to as global cellular transcription machinery engineering (Alper and Stephanopoulos,
2007). This strategy has also been used to improve ethanol tolerance and yield in
Saccharomyces cerevisiae (Alper et al, 2006). However, eukaryotic systems regulating gene
expression are by far more complex than those of bacteria. In comparison to bacterial
systems, the changes in the phenotype caused by mutations in transcription factors are still
difficult to predict and may also cause unwanted side-effects on other important properties.
Genetic engineering of metabolic pathways in industrial eukaryotic microorganisms, such as
yeast, is clearly limited by a lack of knowledge on regulatory factors and their mechanisms of
action. This is particularly true under the conditions that occur in industrial applications.
Moreover, the structural genes and regulatory factors involved in metabolic pathways contain

Chapter III 81
many mutations in natural and industrial yeast strains, which create large phenotypic
diversity, further complicating the understanding of the interplay between the functioning of
the structural pathway and its regulatory systems. On the other hand, reverse engineering
makes use of this phenotypic diversity by targeting genes identified by genetic analysis of
natural and industrial strains with interesting traits (Bailey et al, 1996; Nevoigt, 2008). Most
of these traits, however, are complex and only recently methodologies have become available
for efficient mapping and identification of the multiple mutant genes responsible for such
complex traits (Swinnen et al, 2012b).
The exceptional capacity of the yeast S. cerevisiae for anaerobic production of ethanol is the
basis of nearly all industrial production of alcoholic beverages and fuel ethanol. Apart from
carbon dioxide, glycerol is the most important byproduct in yeast ethanolic fermentation.
Under anaerobic conditions, glycerol production is closely connected to the growth rate of the
cells. The withdrawal of intermediates from glycolysis for biosynthetic purposes necessitates
regeneration of NAD+ to sustain the redox balance and in the absence of oxygen this is
accomplished by formation of glycerol (Bakker et al, 2001). A second function for glycerol
production in yeast is its use as a compatible osmolyte under conditions of hyperosmotic
stress (Blomberg and Adler, 1989; Hohmann, 2002).
Glycerol is synthesized in two steps from dihydroxyacetone phosphate by NAD+ dependent
glycerol 3-phosphate dehydrogenase (GPDH) and glycerol 3-phosphate phosphatase, encoded
by GPD1 and GPD2, and GPP1 and GPP2, respectively (Albertyn et al, 1994; Ansell et al,
1997). Enhanced expression of GPD1 is a major factor responsible for stimulation of glycerol
production under osmostress (Albertyn et al, 1994; Larsson et al, 1993; Nevoigt and Stahl,
1997). The high osmolarity glycerol (HOG) pathway, responsible for osmostress-induced
glycerol production and other cellular adaptations, has been characterized in great detail
(Brewster et al, 1993; Hohmann, 2002). Changes in extracellular osmolarity are sensed via
two independent transmembrane proteins, Sho1 and Sln1, that both activate the HOG Map
kinase pathway. The Sln1-branch plays the most prominent role and acts through a
phosphotransfer system, composed of Sln1, Ypd1 and Ssk1. The two pathways converge on
the phosphorylation of Pbs2, which activates the Map kinase Hog1. This causes translocation
of Hog1 into the nucleus, where it associates with several transcriptional regulators, i.a. Sko1,

82 Chapter III
Msn2, Smp1 and Hot1. These Hog1-regulator complexes induce GPD1 expression to enhance
the formation of glycerol under osmostress (Hohmann, 2002). Retention of glycerol within
the cells and its efflux upon relief of osmostress are controlled by the Fps1 plasma membrane
channel (Luyten et al, 1995).
Engineering of glycerol production in yeast has attracted considerable attention. Higher
glycerol levels are desirable in wine and beer production as well as industrial glycerol
production (Cambon et al, 2006; Geertman et al, 2006; Heux et al, 2006; Nevoigt and Stahl,
1996; Remize et al, 1999; Schuller and Casal, 2005). Multiple genetic modifications have
been used to raise glycerol production and counteract the side-effect of higher acetate
production (Cambon et al, 2006; Eglinton et al, 2002; Ehsani et al, 2009). Lower glycerol
levels are highly desirable in ethanol fuel production because they are usually associated with
increased ethanol yields (Basso et al, 2008; Bro et al, 2006; Nissen et al, 2000a; Nissen et al,
2000b). High ethanol yield is a key characteristic of bioethanol production strains, reaching
approximately 90-93% of the theoretical maximum of 0.51 g ethanol per g glucose in current
industrial processes (Bai et al, 2008). Despite the high ethanol yield, part of the sugar is still
used for yeast growth and glycerol production. Glycerol yield can reach up to 2.0 - 3.6 g per
100 g consumed glucose as already reported by Pasteur (Pasteur, 1858). Glycerol yields
strongly depend on fermentation conditions (Alfenore et al, 2004; Bideaux et al, 2006;
Gardner et al, 1993) and medium composition, especially the type of nitrogen source used
(Albers et al, 1996).
A key challenge in industrial ethanol production is lowering glycerol yield without
compromising osmostress tolerance and growth rate under anaerobic conditions.
Osmotolerance is an important trait for industrial production, storage and utilization of yeast
and growth rate is closely correlated with ethanol production rate under anaerobic conditions.
Hence, diminution of GPD1 and/or GPD2 expression is not an option since it likely
compromises osmostress tolerance and growth under anaerobic conditions (Ansell et al, 1997;
Bjorkqvist et al, 1997; Nissen et al, 2000a). Even strains with fine-tuned reduction in GPDH
activity obtained with promotor engineering still showed a significant drop in osmotolerance
and/or growth rate resulting in lower ethanol productivity (Hubmann et al, 2011; Pagliardini
et al, 2010). Hence, despite considerable efforts, metabolic engineering of the structural genes

Chapter III 83
for glycerol synthesis, GPD1 and GPD2, has met with little final success because of negative
side-effects on growth, fermentation and osmotolerance (Bjorkqvist et al, 1997; Bro et al,
2006; Cao et al, 2007; Guo et al, 2011; Guo et al, 2009, 2010; Hubmann et al, 2011; Kong et
al, 2007a; Kong et al, 2006; Kong et al, 2007b; Nissen et al, 2000a; Nissen et al, 2000b).
Reverse metabolic engineering is an attractive alternative (Bailey et al, 1996), but the
identification of the genetic basis of complex traits, such as glycerol yield in fermentation, has
remained for many years an important bottleneck. The availability of genome-wide methods
for scoring SNPs as genetic markers has facilitated simultaneous mapping of multiple linked
loci referred to as quantitative trait loci (QTLs) (Brem et al, 2002; Deutschbauer and Davis,
2005; Steinmetz et al, 2002; Winzeler et al, 1998). Next generation sequencing methods now
allow very efficient QTL mapping using whole-genome sequence analysis of pooled
segregants displaying the trait of interest (Ehrenreich et al, 2010; Parts et al, 2011; Swinnen et
al, 2012a).
We have now applied pooled-segregant whole-genome sequence analysis for identification of
genetic elements determining glycerol yield in yeast fermentation. We were able to identify a
yeast strain, CBS6412, with unusually low glycerol production and concomitantly higher
ethanol production. Using 20 - 44 segregants, we succeeded in identifying major and minor
QTLs and successfully identified SSK1 as the causative allele in the locus with the strongest
linkage. Introduction of the mutant SSK1 allele in the industrial target strain lowered the
glycerol/ethanol ratio more than deletion of SSK1, without compromising osmotolerance or
ethanol productivity more. Hence, our results show that QTL analysis of selected yeast strains
can provide interesting new gene tools for reverse metabolic engineering.
4.2 Materials and Methods
Microbial strains and cultivation conditions
All S. cerevisiae strains used are listed in Table 1. Strain CBS6412 was originally indicated as
sake yeast Kyokai No.7 in the CBS collection, but comparison of the genome sequence
revealed that this indication was erroneous. E. coli strain DH5αTM
(Invitrogen Corp.,
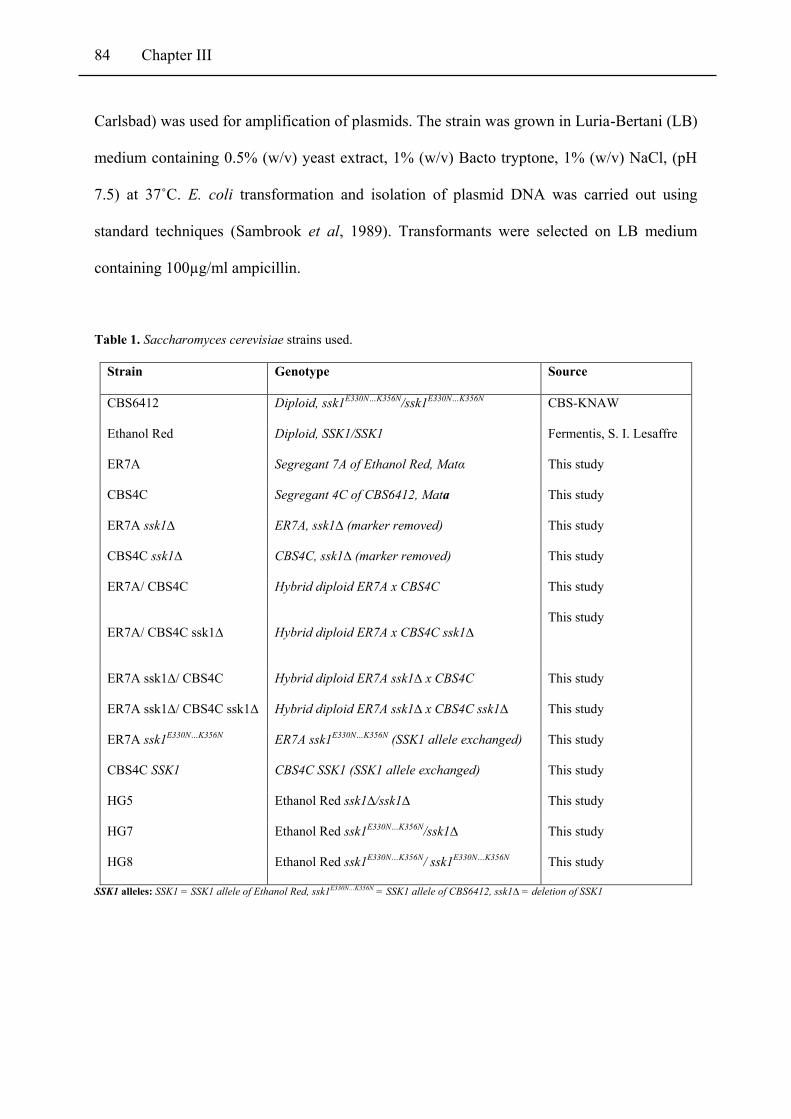
84 Chapter III
Carlsbad) was used for amplification of plasmids. The strain was grown in Luria-Bertani (LB)
medium containing 0.5% (w/v) yeast extract, 1% (w/v) Bacto tryptone, 1% (w/v) NaCl, (pH
7.5) at 37˚C. E. coli transformation and isolation of plasmid DNA was carried out using
standard techniques (Sambrook et al, 1989). Transformants were selected on LB medium
containing 100µg/ml ampicillin.
Table 1. Saccharomyces cerevisiae strains used.
Strain Genotype Source
CBS6412 Diploid, ssk1E330N…K356N/ssk1E330N…K356N CBS-KNAW
Ethanol Red Diploid, SSK1/SSK1 Fermentis, S. I. Lesaffre
ER7A Segregant 7A of Ethanol Red, Matα This study
CBS4C Segregant 4C of CBS6412, Mata This study
ER7A ssk1∆ ER7A, ssk1∆ (marker removed) This study
CBS4C ssk1∆ CBS4C, ssk1∆ (marker removed) This study
ER7A/ CBS4C Hybrid diploid ER7A x CBS4C This study
ER7A/ CBS4C ssk1∆ Hybrid diploid ER7A x CBS4C ssk1∆
This study
ER7A ssk1∆/ CBS4C Hybrid diploid ER7A ssk1∆ x CBS4C This study
ER7A ssk1∆/ CBS4C ssk1∆ Hybrid diploid ER7A ssk1∆ x CBS4C ssk1∆ This study
ER7A ssk1E330N…K356N ER7A ssk1E330N…K356N (SSK1 allele exchanged) This study
CBS4C SSK1 CBS4C SSK1 (SSK1 allele exchanged) This study
HG5 Ethanol Red ssk1∆/ssk1∆ This study
HG7 Ethanol Red ssk1E330N…K356N/ssk1∆ This study
HG8 Ethanol Red ssk1E330N…K356N/ ssk1E330N…K356N This study
SSK1 alleles: SSK1 = SSK1 allele of Ethanol Red, ssk1E330N…K356N = SSK1 allele of CBS6412, ssk1∆ = deletion of SSK1

Chapter III 85
Mating, sporulation and tetrad analysis
Mating, sporulation and dissection of asci were carried out according to standard procedures
(Sherman and Hicks, 1991). Mating type of segregants was determined by diagnostic PCR for
the MAT locus (Huxley et al, 1990).
Fermentation conditions
A selection of 52 S. cerevisiae wild type strains (Figure 1) was screened in 250 ml oxygen-
limited and stirred fermentations containing 1% (w/v) yeast extract, 2% (w/v) peptone and
12% (w/v) glucose. Screening of the selected parent strains and the segregants was performed
in 15 ml falcon tubes containing 5 ml minimal medium containing 1.9 g l-1
yeast nitrogen base
(Difco), 5 g l-1
ammonium sulphate, 250 mg l-1
leucine, 50 mg l-1
uracil, 100 mg l-1
histidine,
30 mg l-1
lysine, 20 mg l-1
methionine and 50 g l-1
glucose. Fermentations were inoculated
with an initial OD of 1 and their progress followed by weight loss. Selected segregants were
also tested in 100 ml oxygen-limited stirred fermentations. All fermentations were carried out
at 30˚C.
High gravity fermentations were carried out in fermentation tubes containing 250 ml of YP
and 33% (w/v) glucose. Precultures used as inoculum were first grown on YP 2% (w/v)
glucose for 24 hours and then on YP 10% (w/v) glucose up to an OD600 of 1. The
fermentations were inoculated with 5.10
7 cells/ml and kept at 25°C. Stirring was applied for
the first 4h (120 rpm). When the weight loss was stable for 2 consecutive days, the
fermentation was considered to be finished.
SHF (Separate Hydrolysis and Fermentation) fermentations were carried out with wheat
liquefact (24.5% dry mass content) acquired from a local ethanol plant. After adjustment of
the pH to 4.5 with sulfuric acid, it was treated with Dextrozyme®
(Novozyme, Denmark) for
24h at 60˚C to obtain hydrolysate. The latter was boiled at 100˚C for 20 min and then cooled.

86 Chapter III
Oxygen-limited fermentations were carried out with 100 ml of this medium inoculated with 5
ml of yeast suspension. The fermentations were performed at 30˚C and were continuously
stirred at 200 rpm.
Assessment of osmotolerance was performed in fermentations containing minimal medium
with or without 0.7M or 1.4M NaCl, or 1M or 2M sorbitol. The fermentations were
continuously stirred at 200 rpm.
Determination of fermentation parameters
In all fermentations weight loss was used to follow the progress of the fermentation. Glucose,
glycerol and ethanol in the medium were determined by HPLC (Waters® isocratic BreezeTM
HPLC, ion exchange column WAT010290). Column temperature was 75˚C, 5 mM H2SO4
was used as eluent with a flow rate of 1 ml min-1
and refractive index detection was used
(Waters, 2414 RI detector). Biomass was determined by OD600 at the beginning and the end
of fermentation and yeast dry mass also at the end. The product yield was calculated from the
final product concentration (g l-1
) and the difference in glucose concentration at the start and
end of fermentation (consumed glucose in g l-1
). The product yields in the SSF were based on
the final product concentrations and the equivalent initial glucose concentration (the latter was
measured in a completely hydrolyzed sample of wheat liquefact).
Determination of maximum aerobic growth rate
The aerobic cultivations were carried out in Erlenmeyer flasks containing 50 ml medium,
which was composed of 1% (w/v) yeast extract and 2% (w/v) glucose. The strains were pre-
cultured overnight at 30˚C and 200 rpm in small tubes containing 3 ml of the same medium.

Chapter III 87
The pre-culture were then used to inoculate the main culture up to an initial OD600 of 0.2. The
Erlenmeyer flasks were incubated at 30˚C in a rotary shaker at 200 rpm. Samples were taken
every second hour in order to determine the OD600. Non-linear regression was used to fit a
polynomial curve to the experimental progression of the OD600 values. The growth rate was
calculated by differentiating the continuous curve. Specific growth rates were calculated by
dividing the growth rate by the biomass estimated from the continuous curve at the same time.
The maximum of the curve was used as the maxium growth rate.
Aerobic growth spot assay
The aerobic growth behaviour was tested on solid medium, which contained 1% (w/v) yeast
extract, 2% (w/v) glucose and 1.5% (w/v) agar. The strains were pre-cultured overnight at
30˚C and 200 rpm in small tubes containing 3 ml of the same liquid medium. The OD600 was
determined for all pre-cultures and the amount of cells was harvested to obtain an OD600 of 1
in 1 ml distilled water. After re-suspension of the cells in 1 ml water, these samples were
subsequently diluted six times with a dilution factor of 1:5. All dilutions were transferred to a
microtiter plate, and 5 µl of each dilution was transferred to the solid medium. The plates
were incubated for two days at 30˚C. Growth was monitored after 24 h and at the end.
DNA methods
Yeast genomic DNA was extracted with Phenol/Chloroform/Isoamyl-alcohol (25:24:1)
(Hoffman and Winston, 1987) and further purified with diethyl-ether extraction or ethanol
precipitation if required. PCR was performed with high-fidelity polymerases PhusionTM
(Finnzymes) or ExTaqTM
(TaKaRa) for cloning, amplification of deletion or insertion

88 Chapter III
cassettes, and sequencing purposes. Sequencing was carried out using the dideoxy chain-
termination method (Sanger and Coulson, 1975) at the VIB Genetic Service Facility
(Antwerp). The sequences were analyzed with geneious (Geneious Basic 5.3.4), SeqMan
(Lasergene Coresuite 8) or CLC DNA workbench (CLC bio) software. Lists of primers and
plasmids are provided as Supplementary Tables 1 and 2, respectively.
Pooled-segregant whole-genome sequence analysis
After crossing the two parent strains CBS4C and ER7A, the 20 most superior segregants
(lowest glycerol production) were assembled in the 'selected pool' while 20 random
segregants were used to assemble the 'unselected pool'. The two pools were made by
combining equal amounts of cells based on OD600. High molecular weight DNA (3 µg, ~
20kb fragments) was isolated from the pools and parent strains according to Johnston and
Aust (1994). The purity of the DNA sample was estimated from UV measurement (260/280 =
1.7-2.0). The DNA samples were provided to GATC Biotech AG (Konstanz, Germany) and
BGI (Hong Kong, China) for whole-genome sequence analysis by Illumina technology.
QTL analysis based on the distribution of SNP variant frequency over the length of the
chromosomes was carried out as described by Swinnen et al. (2012a). The short read
sequences obtained from the parental strains and the pools were mapped against the known
S288c reference sequence using the mapping software Bfast (Homer et al, 2009). After
pairing, unique alignments for the CBS4C strain were selected and homozygous variants, i.e.
SNPs and small indels, were called using SNVQ (Duitama et al, 2012). In addition, regions
with coverage below 0.5 or above 1.5 of the average coverage were identified and SNPs of
those regions were filtered out. For each polymorphic position the variant calls in the aligned

Chapter III 89
reads for the ER7A strain were then extracted and variants were filtered out for which the
coverage of the reference variant was too small (<20x) or too large (>150x) or SNPs of both
parents coincided but were different from the reference. Finally, the number of calls to the
reference and the alternative variant of each selected polymorphic position was determined
from the set of aligned reads corresponding with the segregant pools. The SNP variant
frequencies were calculated by dividing the number of the alternative variant by the total
number of aligned reads. A very high or a very low frequency was a sign of a one-sided SNP
segregation preferentially coming from one parent, indicating a genetic linkage to the trait of
interest. Genetic linkage was statistically confirmed using the methods described earlier
(Swinnen et al, 2012a).
Detection of SNP markers by allele specific PCR
Individual SNPs were scored by allele specific PCR. The forward and reverse primer
contained the nucleotide of ER7A or CBS4C as the 3’ terminal nucleotide. The annealing
temperature was optimized using DNA extracts of ER7A and CBS4C so as to allow only
hybridization with primers containing a complete match. A list of primers is provided in
Supplementary Table 1.
Reciprocal hemizygosity analysis (RHA)
For RHA analysis (Steinmetz et al, 2002), two diploid strains were constructed by crossing
CBS4C and ER7A wild type or ssk1∆ strains, so that the resulting diploids only contained a
single SSK1 allele, either CBS4C derived ssk1E330N…K356N
or ER7A derived SSK1. Deletion
cassettes were constructed essentially as described by Gueldener et al. (2002) with the

90 Chapter III
phleomycin resistance marker bleR and SSK1 gene deletion was confirmed by PCR. The
selection marker was removed using the Cre-loxP system. The removal of the selection
marker was verified by phleomycin sensitivity as well as by PCR. RHA was performed with
three independent isolates of all tested diploids.
Construction of SSK1 insertion cassettes
The repeat region H1 was PCR amplified with the primers A-6101 and A-6103 using genomic
DNA of CBS4C and ER7A as template. The resulting PCR fragment was digested with KpnI
and SalI and purified from an agarose gel. SSK1 was PCR amplified from genomic DNA of
CBS4C and ER7A and the primers A-6100 and A-6102. The obtained product of around
2800bp was digested with SalI and XmaI. The cloning vector pBluescriptII SK(+)
(Fermentas) was digested with KpnI and XmaI and ligated with the repeat region H1 and the
SSK1 allele of the respective strain. The construct was verified using Sanger sequencing. The
two selectable and counter-selectable systems, AMD1 and NAT1-GIN11, were used to
introduce the insertion cassette. During counter-selection, the marker genes spontaneously
looped out via the H1 repeat region, leaving no scars of non-S. cerevisiae DNA in the
genome. The AMD1 marker of Zygosaccharomyces rouxii was cut out of the plasmid pF6a-
AMD1-MX6 using SacI and BglII (Shepherd and Piper, 2010). The fragment was gel purified
and ligated with pUG66, which was also digested with the same two enzymes. The resulting
plasmid pUG-AMD was used for PCR amplification of the AMD1 marker using the primers
A-5166 and A-6770. The PCR product as well as the H1-SSK1 plasmids were digested with
SalI and ligated, resulting in plasmids pBluescriptII_AMD1_ssk1E330N…K356N
and
pBluescriptII_AMD1_SSK1. The selection marker NAT1 was amplified from pAG25 using
primers A-7116 and A-7117. The GIN11 counter-selection marker (Akada et al, 2002) was

Chapter III 91
amplified from pG119 using primers A-7118 and A-7119. Both fragments were sequentially
digested with DraIII and SalI and ligated with the H1-SSK1 plasmid, which was previously
digested with SalI resulting in the plasmids pBluescriptII_NAT1_GIN11_ssk1E330N…K356N
and
pBluescriptII_NAT1_GIN11_SSK1. The insertion cassette H1-loxP-AMD1-loxP-SSK1 and
H1-loxP-AMD1-loxP- ssk1E330N…K356N
were amplified from pBluescriptII_AMD1_SSK1 and
pBluescriptII_AMD1_ssk1E330N…K356N
using the outside flanking primers matching the M13
primer binding sites of the plasmid pBluescriptII SK(+). The PCR product was purified and
used for transformation. Cassettes with H1-NAT1-GIN11-SSK or H1-NAT1-GIN11-
ssk1E330N…K356N
were digested with BspHI and digestion products were used for
transformation. Yeast was transformed with the LiAc/PEG method (Gietz et al, 1992).
Reciprocal SSK1 allele replacement in CBS4C and ER7A
Site-directed modification of the CBS4C and ER7A SSK1 locus was carried out using a two
step-method. In the first step, the SSK1 insertion cassettes (see above) were transferred to the
SSK1 deletion strains, CBS4C ssk1∆ and ER7A ssk1∆. After transformation, positive clones
were selected on YD agar plates containing 200µg/ml ClonNat. The presence of the insertion
cassette was verified by PCR using the primers A-5168 and A-7301. In the second step, the
marker genes were removed by selection of spontaneous loop-outs on galactose-containing
medium after induction of the counter-selectable marker GIN11 (Akada et al, 2002; Akada et
al, 1999; Olesen et al, 2000). Positive looped-out clones were identified by ClonNat
sensitivity and verified by PCR using the forward primer A-5168 and the SSK1 allele specific
reverse primers A-5126 and A-5127. The inserted SSK1 alleles were verified by Sanger
sequencing.

92 Chapter III
SSK1 allele replacement in the industrial strain Ethanol Red
The ssk1E330N…K356N
allele of CBS4C was inserted twice in the Ethanol Red derivative, HG5
(see Table 1), which had both SSK1 alleles deleted. The latter strain was constructed by
introducing a disruption cassette flanked with loxP sites using homologous recombination
(Gueldener et al, 2002; Kotaka et al, 2009). The disruption cassette was constructed with
homologous sequences (H1/H2) corresponding to the 5’ and 3’ end of the SSK1 ORF
surrounding the phleomycin resistance-gene bleR used as selectable marker. The selectable
marker, bleR, was removed by Cre recombinase. A second disruption cassette was constructed
with the recombination sites H1* and H2
*, which were located inside the first homologous
integration sites, H1 and H2, enabling specific recombination into the 2nd
SSK1 allele of the
diploid strain. Gene disruption was verified by PCR. The bleR marker gene was again
removed using the Cre/loxP system. The double deletion was confirmed by PCR using
primers located outside the integration site.
The two ssk1E330N…K356N
insertion cassettes, H1-loxP-AMD1-loxP-ssk1E330N…K356N
and H1-
NAT1-GIN11-ssk1E330N…K356N
, were successively transformed. After the 1st transformation of
the H1-loxP-AMD1-loxP-ssk1E330N…K356N
cassette, transformants were selected based on
hydrolysis by Amd1 of acetamide used as sole nitrogen source. The correct integration of the
insertion cassette was verified by PCR using the primers A-5168 and A-5894 inside the AMD
gene. In the 2nd
transformation, the H1-NAT1-GIN11-ssk1E330N…K356N
was transferred. Positive
transformants were selected on acetamide medium, containing 200µg/ml ClonNat. Correct
integration in the 2nd
chromosome was verified by PCR using the primers A-5168 and A-7301
to test the presence of the insertion cassette as well as the primers A-5168 and A-5169 to
verify the disappearance of the two ORF deletions of the Ethanol Red ssk1∆/∆. Counter-

Chapter III 93
selection was simultaneously applied for both marker systems using medium with 100mM
fluoroacetamide and 0.04% galactose (induction of GIN11).
Data deposition
Sequencing data is deposited at the SRA database (NCBI), http://www.ncbi.nlm.nih.gov/sra,
with the account number SRA054394.
4.3 Results
Selection of parent strains for genetic mapping of low glycerol yield
We have evaluated 52 diploid S. cerevisiae strains from diverse origins for the ratio between
the amount of glycerol and ethanol produced in small-scale (250 ml) fermentations with
complex medium containing 12% glucose. A continuous and normal distribution of the trait
was observed (Figure 1). The CBS6412 strainshowed the lowest glycerol yield (0.043 g g-1
)
of all strains tested, which was about 63% of that of the reference industrial strain Ethanol
Red (0.068 g g-1
) (Figure 2A), an industrial strain commonly used for bioethanol production
with corn and wheat starch hydrolysate. As it had both a low glycerol/ethanol ratio and a low
glycerol yield, CBS6412 was chosen as the superior strain and Ethanol Red was used as the
inferior strain. In order to obtain haploid strains for genetic mapping analysis, the two diploid
strains were sporulated and segregants were tested in small-scale fermentations. Glycerol
yields of the segregants were normally distributed around those of the diploid parents (Figure
2B), indicating a highly heritable phenotype. The CBS6412 segregant, CBS4C, had an even
lower glycerol yield than its parental diploid (Figure 2A), indicating acquirement of one or
more beneficial, recessive alleles present in heterozygous form in the diploid strain. CBS4C
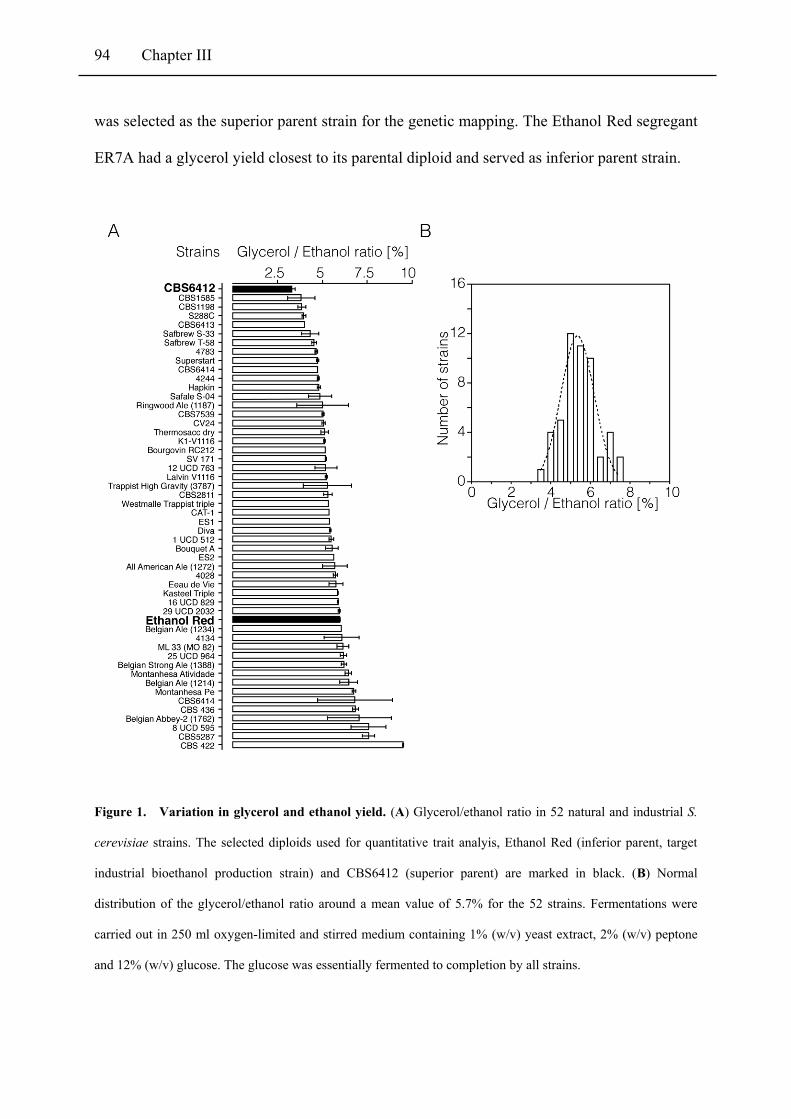
94 Chapter III
was selected as the superior parent strain for the genetic mapping. The Ethanol Red segregant
ER7A had a glycerol yield closest to its parental diploid and served as inferior parent strain.
Figure 1. Variation in glycerol and ethanol yield. (A) Glycerol/ethanol ratio in 52 natural and industrial S.
cerevisiae strains. The selected diploids used for quantitative trait analyis, Ethanol Red (inferior parent, target
industrial bioethanol production strain) and CBS6412 (superior parent) are marked in black. (B) Normal
distribution of the glycerol/ethanol ratio around a mean value of 5.7% for the 52 strains. Fermentations were
carried out in 250 ml oxygen-limited and stirred medium containing 1% (w/v) yeast extract, 2% (w/v) peptone
and 12% (w/v) glucose. The glucose was essentially fermented to completion by all strains.

Chapter III 95
Figure 2. Glycerol and ethanol yield in the segregants of the diploid parent strains and in segregants
from the cross between the selected haploid parent strains. (A) Glycerol and ethanol yield of the diploids,
Ethanol Red and CBS6412, and the CBS6412 segregant, CBS4C, showing the lowest glycerol yield of all tested
segregants of CBS6412. Fermentations were carried out in 100 ml minimal medium with 10% glucose. (B)
Distribution of the glycerol yield in the haploid segregants of CBS6412 (black bars) and Ethanol Red (white
bars). The distribution was normal around the value of the diploid parents, CBS6412 (left small black square on
top) and Ethanol Red (right small black square on top). (C) Distribution of the glycerol yield in the segregants
from the cross CBS4C x ER7A (white bars). All segregants were screened in 5 ml fermentations. After
evaluation of the 48 segregants with the lowest glycerol yield in 100 ml minimal medium with 5% glucose, the
44 segregants with the lowest glycerol production were selected for pooled-segregant whole-genome sequence
analysis (black bars). The glycerol yield of the haploid parents CBS4C and ER7A is indicated with small black
squares on top.
Construction of the CBS4C/ER7A hybrid and selection of superior segregants with low
glycerol yield
The CBS4C and ER7A haploid strains were crossed with each other and 257 segregants were
isolated and first characterized for glycerol and ethanol yield in 5 ml fermentations with 5%
glucose in minimal medium. Figure 2C shows a histogram of the glycerol yield in the

96 Chapter III
segregant population in comparison with that of the CBS4C and ER7A haploid parents. The
glycerol yield showed a normal distribution and most segregants had a glycerol yield close to
the average (0.063 g g-1
, ±142% of the CBS4C glycerol yield). We re-tested the 48 segregants
with a glycerol yield below 120% of the CBS4C parent in 100 ml small-scale fermentations;
44 segregants showed the same low glycerol yield also under these conditions. Among these,
the 20 segregants showing the lowest glycerol yield (≤ 0.054 g g-1
) were selected for QTL
mapping with pooled-segregant whole-genome sequence analysis. The 24 remaining
segregants were used for subsequent validation of the results as described below. A second
pool with 20 randomly selected segregants was also subjected to pooled-segregant whole-
genome sequence analysis and used as control.
QTL mapping using pooled-segregant whole-genome sequence analysis
The genomic DNA of the selected and random pools, as well as the two parent strains, was
extracted and submitted to custom sequence analysis using Illumina HiSeq 2000 technology
(GATC Biotech AG, Konstanz, Germany; BGI, Hong Kong, China). The sequence reads of
the CBS4C and ER7A parent strains were aligned with the S288c standard sequence, which
allowed to identify 21,818 SNPs between CBS4C and ER7A. The SNPs were filtered as
described previously (Duitama et al, 2012). The variant frequency of the quality-selected
SNPs in the DNA of the two pools was then plotted against the SNP position on the
chromosome. The scattered raw data were smoothened by fitting smoothing splines in the
generalized linear mixed model framework as previously described (Swinnen et al, 2012a).
The results are shown in Figure 3. A prominent QTL with strong linkage was present on
chromosome XII (between 135,000 and 200,000 bp) and is shown in more detail in Figure
4B. Individual SNPs from that region, as well as from the QTL with lower linkage on

Chapter III 97
chromosome II (Figure 4A), were scored by allele specific PCR detection in the 20 individual
segregants of the selected pool (Figure 4A, B). The precise SNP variant frequency determined
in this way was used to verify the linkage of the two regions on chromosome II and XII,
respectively. This revealed a very strong linkage with low glycerol yield for the QTL on
chromosome XII with the minimal P-value being 1.45.10
-4, while the P-values for the QTL on
chromosome II only dropped just below the 0.05 threshold for significance (0.009). The same
SNPs were also scored by allele specific PCR in the 24 remaining segregants with a glycerol
yield below 120% of the CBS4C parent. Calculation of the P-values for the whole group of 44
segregants no longer revealed significant linkage for the QTL on chromosome II. On the other
hand, the P-values for the QTL on chromosome XII dropped to 9.10
-11, strongly increasing
significance of the linkage. Hence, we concentrated the further analysis on the QTL of
chromosome XII.

98 Chapter III
Figure 3. Plots of SNP variant frequency versus chromosomal position and corresponding P-values. The
variation in SNP variant frequency is shown for all 16 yeast chromosomes (raw data: small grey circles;
smoothened data: black line; statistical confidence interval: grey lines). Significant upward deviations from the
average of 0.5 indicate linkage to the superior parent CBS4C, while significant downward deviations indicate
linkage to the inferior parent ER7A. The smoothened line was determined as described previously (Swinnen et
al, 2012a). Strong candidate QTLs were found on chromosome II (at position 500,000 – 700,000 bp) and
chromosome XII (at position 135,000 – 200,000 bp), but only for the latter the P-value dropped below the
significance limit of 0.05.

Chapter III 99
Identification of SSK1 as a causative gene in the QTL on chromosome XII
The 20,000 bp region with the strongest linkage in the QTL on chromosome XII contained 13
genes, of which four genes contained non-synonymous mutations in the ORF (Figure 4B).
One of those four genes, SSK1, was located in the centre of the QTL, which had a slightly
stronger linkage. Ssk1 has a known function in the HOG pathway. Sequence comparison of
the SSK1 alleles of the parental strains CBS4C and ER7A with the allele of the reference
strain S288c revealed ten polymorphisms between the sequence of the SSK1 ORF in CBS4C
and ER7A. A single base pair deletion at position 162,907 bp of Chr. XII was the most
prominent mutation in the CBS4C SSK1 ORF, since it caused a reading frame shift and a new
stop codon at position 357 in the protein. This resulted in a new primary amino acid sequence
from position 330 until 356, while the wild type Ssk1 protein had a total length of 712 amino
acids. Hence, we named the new allele ssk1E330N…K356N
. The dramatic change in amino acid
sequence and the truncation would normally be expected to result in a completely inactive
protein and therefore in a phenotype similar to that of the ssk1∆ strain. However, this was not
the case. The ssk1E330N…K356N
allele caused a different phenotype compared to deletion of
SSK1 (see below).
Next, we evaluated SSK1 as possible causative gene using reciprocal hemizygosity analysis
(RHA) (Steinmetz et al, 2002). For that purpose, two CBS4C/ER7A hybrid and hemizygous
diploid strains were constructed differing only in a single SSK1 allele, the other allele being
deleted. The diploid strain with the single ssk1E330N…K356N
allele derived from CBS4C showed
a significantly reduced glycerol yield and a significantly higher ethanol yield than the diploid
strain with the SSK1 allele from the ER7A strain (Figure 5). This showed that ssk1E330N…K356N
was a causative gene in the QTL on chromosome XII.

100 Chapter III
Figure 4. SNP variant frequency and P-values determined in individual segregants for downscaling of
the QTLs. Top: SNP variant frequency map of chromosome II (A) and chromosome XII (B) determined with
the pool of 20 selected segregants (raw data: small circles; smoothened data: black line; statistical confidence
interval: black stippled lines) and the pool of 20 unselected segregants (raw data: small triangles; smoothened
data: grey line; statistical confidence interval: grey stippled lines). Middle: SNP variant frequency of seven
selected SNPs in the candidate regions on chromosome II (at position 500,000 – 700,000 bp) (A) and
chromosome XII (at position 135,000 – 200,000 bp) (B), determined in the individual 20 most superior
segregants (▢) and the individual 44 most superior segregants (●). Smoothened lines: SNP variant frequency
determined with the pool of 20 selected segregants (black line) and the pool of 20 unselected segregants (grey
line). Bottom: P-values for the same seven SNPs in the regions on chromosome II (A) and XII (B). The
statistical confidence line (P-value ≤ 0.05) is also indicated. The region on chromosome XII was significantly
linked. Lowest panel: overview of all genes present and all SNPs identified in the region with the highest linkage
of the QTL on chromosome XII (154,000 bp – 175,000 bp). Genes marked with a star contained a non-
synonymous mutation in the ORF.
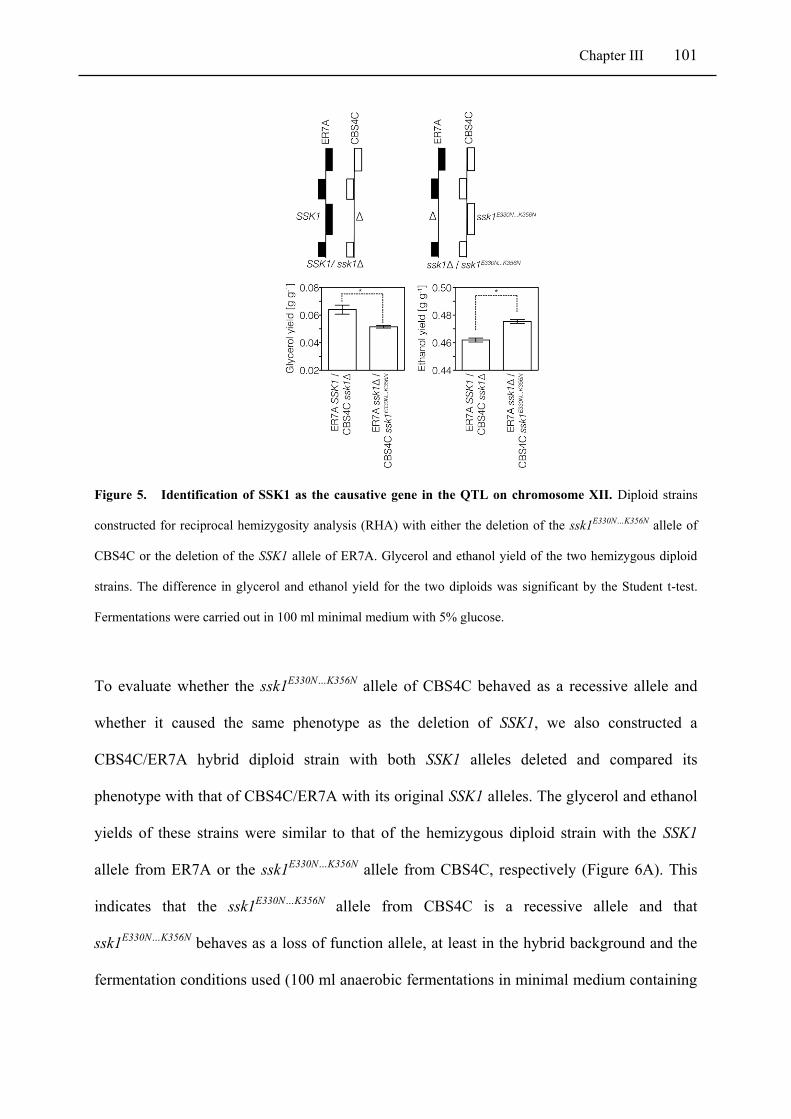
Chapter III 101
Figure 5. Identification of SSK1 as the causative gene in the QTL on chromosome XII. Diploid strains
constructed for reciprocal hemizygosity analysis (RHA) with either the deletion of the ssk1E330N…K356N allele of
CBS4C or the deletion of the SSK1 allele of ER7A. Glycerol and ethanol yield of the two hemizygous diploid
strains. The difference in glycerol and ethanol yield for the two diploids was significant by the Student t-test.
Fermentations were carried out in 100 ml minimal medium with 5% glucose.
To evaluate whether the ssk1E330N…K356N
allele of CBS4C behaved as a recessive allele and
whether it caused the same phenotype as the deletion of SSK1, we also constructed a
CBS4C/ER7A hybrid diploid strain with both SSK1 alleles deleted and compared its
phenotype with that of CBS4C/ER7A with its original SSK1 alleles. The glycerol and ethanol
yields of these strains were similar to that of the hemizygous diploid strain with the SSK1
allele from ER7A or the ssk1E330N…K356N
allele from CBS4C, respectively (Figure 6A). This
indicates that the ssk1E330N…K356N
allele from CBS4C is a recessive allele and that
ssk1E330N…K356N
behaves as a loss of function allele, at least in the hybrid background and the
fermentation conditions used (100 ml anaerobic fermentations in minimal medium containing

102 Chapter III
5% glucose). When the glycerol yield (0.043 g g-1
) of the CBS4C parent strain was
normalized to 100%, the glycerol yield of ER7A (147%) and that of the diploids ER7A/
CBS4C (145%) and ER7A/ CBS4C ssk1∆ (148%) was very similar (Figure 6A). In contrast,
the strains ER7A ssk1∆/ CBS4C ssk1E330N…K356N
and ER7A ssk1∆/ CBS4C ssk1∆ had a
glycerol yield of 119% and 122%, respectively, (Figure 6A) suggesting that ssk1E330N…K356N
was responsible for the majority of the reduction in glycerol yield in CBS4C compared to
ER7A. This agrees with the result of the pooled-segregant whole-genome mapping, which
revealed the SSK1 locus as the only QTL with significant linkage.
To confirm the importance of SSK1 in an alternative way, we reciprocally exchanged the
SSK1 alleles of CBS4C and ER7A by homologous recombination. The ssk1E330N…K356N
allele
was introduced as new allele in ER7A ssk1∆. In the same manner, SSK1 of ER7A was
introduced in CBS4C ssk1∆. The ER7A ssk1E330N…K356N
strain showed reduced glycerol yield
and enhanced ethanol yield comparable to the ER7A ssk1∆ strain (Figure 6B). Deletion of
ssk1E330N…K356N
in CBS4C resulted in a further reduction in glycerol yield when compared to
the original CBS4C. Concomitantly, ethanol yield increased in the CBS4C ssk1∆ strain when
compared to the original CBS4C strain, which may be due to a growth deficiency caused by
ssk1∆ in that strain background. This growth defect was suggested also by the maximal
volumetric ethanol production rate, which was strongly reduced in the CBS4C ssk1∆ strain
compared to the original CBS4C strain with the ssk1E330N…K356N
allele (Figure 6B). In the
ER7A background there was no difference. This again shows that at least in the CBS4C
background the effect of ssk1∆ is different from that of ssk1E330N…K356N
.

Chapter III 103
As shown by the aerobic growth assay in Figure 6C, we observed that the CBS4C ssk1∆
strain grew more poorly than the original CBS4C strain, which contains the ssk1E330N…K356N
allele. A clear difference in growth of these two strains was also observed in aerobic liquid
cultures, where the two strains, CBS4C and CBS4C ssk1∆, grew at a maximum rate of 0.47
and 0.35 h-1
, respectively (Figure 6C). This difference in growth was again not observed in
the ER7A strain background. The introduction of wild type SSK1 in CBS4C ssk1∆ enhanced
its glycerol yield and reduced its ethanol yield, and it increased the maximal volumetric
ethanol production rate (Figure 6B). These results confirmed SSK1 as a causative allele for
reduced glycerol and enhanced ethanol production in CBS4C. They also show that the
ssk1E330N…K356N
allele causes a different effect compared to the deletion of SSK1 and that it
also differs in causing no apparent growth defect in the CBS4C background as opposed to the
deletion of SSK1.
Given the recessive character of the ssk1E330N…K356N
allele, we tested its presence in the
original diploid strain CBS6412 and found it to be present in two copies (data not shown).
This suggests that the unusual allele may provide a selective advantage in specific
environmental niches.

104 Chapter III
Figure 6. Glycerol and ethanol yield after deletion or reciprocal exchange of the SSK1 alleles. (A)
Comparison of the glycerol and ethanol yield of the two hemizygous strains with that of the ER7A and CBS4C
parental strains and the SSK1/ssk1E330N…K356N and ssk1∆/ssk1∆ diploids. (B) Glycerol and ethanol yield and
maximal volumetric ethanol production rate in the ER7A and CBS4C parental strains, SSK1 deletion versions
and the ER7A and CBS4C strains with reciprocal exchange of the SSK1 and ssk1E330N…K356N alleles.
Fermentations were carried out in 100 ml minimal medium with 5% glucose. (C) Growth comparison of the
strains, as detailed in (B), under aerobic conditions. Fivefold dilutions of overnight pre-grown cells were spotted
on YPD medium and incubated at 30˚C for two days. The maximum growth rate in liquid cultures was
determined from OD600 measurements in 50 ml YPD shake flasks incubated at 30˚C.

Chapter III 105
Reduction of the glycerol/ethanol ratio in an industrial bio-ethanol strain using
ssk1E330N…K356N
as a novel gene tool
To test the functionality of ssk1E330N…K356N
as a novel gene tool for reduction of glycerol yield
under industrially relevant conditions, both SSK1 alleles of the industrial bio-ethanol
production strain, Ethanol Red, were replaced by the ssk1E330N…K356N
variant using
homologous recombination. In addition, an Ethanol Red ssk1∆/ssk1∆ strain and an Ethanol
Red ssk1E330N…K356N
/ssk1∆ strain were constructed. These strains were tested in fermentations
with minimal medium (5% (w/v) glucose), high gravity medium (YP with 33% (w/v) glucose)
and wheat hydrolysate (SHF: Separate Hydrolysis and Fermentation). The results are shown
in Figure 7A. The double deletion of SSK1 reduced the glycerol yield. Interestingly, further
reduction of glycerol yield was observed after introduction of one copy of ssk1E330N…K356N
,
while introduction of the second copy of ssk1E330N…K356
lowered glycerol yield even more.
Ethanol yields clearly increased in all Ethanol Red mutants compared to the wild type strain
in the minimal medium. The reduction of glycerol yield under high gravity or SHF conditions
was generally less pronounced compared to minimal medium. Thus, the concomitant increase
in ethanol yield in the Ethanol Red mutants was less obvious. Nevertheless, particularly the
result obtained in minimal medium indicated that in the Ethanol Red diploid background the
ssk1E330N…K356N
allele did not simply behave as a loss-of-function allele but had a stronger
reducing effect on the glycerol/ethanol ratio than deletion of the SSK1 gene. These results
confirm the usefulness of the ssk1E330N…K356N
allele as a novel gene tool for lowering glycerol
production in industrial yeast strains. Identification of other mutant alleles in the CBS4C
strain and introduction of these alleles in the Ethanol Red strain with two ssk1E330N…K356N
alleles, may allow to reduce glycerol yield even more, especially under the industrially-
relevant conditions.

106 Chapter III
The novel gene tool ssk1E330N…K356N
retains its positive effect under high osmolarity
conditions
Several previous studies successfully reduced glycerol yield in S. cerevisiae with a
concomitant increase in ethanol yield. However, many of the resulting strains showed a
significantly reduced maximal volumetric ethanol production rate and increased sensitivity
against osmotic stress (Bjorkqvist et al, 1997; Guadalupe Medina et al, 2010; Hubmann et al,
2011; Nissen et al, 2000a). In order to address this issue, we determined both the
glycerol/ethanol ratio and the maximal volumetric ethanol production rate in the Ethanol Red
strains containing one or two ssk1E330N…K356N
alleles under conditions of high osmolarity. In
general, the cells produced higher levels of glycerol under hyperosmotic stress, i.e. in the
presence of 1.4 M and 2 M sorbitol or 0.7 M and 1 M NaCl (Figure 7B). In spite of this, a
similar improvement in the glycerol/ethanol ratio was observed in the Ethanol Red strains
containing one or two ssk1E330N…K356N
alleles. The maximal volumetric ethanol production rate
dropped with increasing osmolarity but this drop was not correlated with the presence or the
number of ssk1E330N…K356N
alleles. Hence, the ssk1E330N…K356N
allele does not appear to cause
an increase in osmosensitivity and retains its positive effect under conditions of high
osmolarity. Close examination of the effect of ssk1E330N…K356N
on glycerol production in the
Ethanol Red background also allows to make a quantitative assessment of the contribution of
this allele to the phenotype. The initial glycerol yield was 167% of the CBS4C yield while the
double insertion of ssk1E330N…K356N
caused a drop to 128% of the CBS4C yield. Hence, the
ssk1 mutation appears to determine 50-60% of the trait.

Chapter III 107
Figure 7. Glycerol and ethanol yields and osmostress tolerance in fermentations with the industrial
bioethanol production strain Ethanol Red in which one or two copies of the ssk1E330N…K356N
allele had been
introduced. (A) Glycerol and ethanol yields in fermentations with minimal medium (5% (w/v) glucose), high
gravity medium (YP with 33% (w/v) glucose) and wheat hydrolyzate (SHF: Separate Hydrolysis and
Fermentation). (B) Glycerol/ethanol ratio and maximal volumetric ethanol production rate (rmax in g l-1 h-1) in
fermentations with minimal medium (5% glucose) in the presence of NaCl (0, 0.7 and 1M) or sorbitol (0, 1.4 and
2M).

108 Chapter III
4.4 Discussion
Up to now, QTL analysis in S. cerevisiae has been performed mainly with selectable traits
easily scorable in high throughput assays, so that many hundreds, thousands or, with
appropriate selection, even millions (Parts et al, 2011), of segregants can be used. Stress
tolerance for instance is a trait that can be screened easily with large numbers of strains
simultaneously. For many industrially-important traits, such as fermentation kinetics and
product yields, on the other hand, segregants have to be phenotyped individually, for instance
in small-scale fermentations. This requires much more work and is usually limited to a few
hundred strains. Glycerol yield is a non-selectable metabolic trait and up to now no such
quantitative traits have been submitted to polygenic analysis in yeast. In this work we have
shown that genetic mapping of QTLs underlying this metabolic trait can be performed
successfully using pooled-segregant whole-genome sequence analysis with only 20
segregants out of a total of 257 phenotyped. This shows that genetic analysis of polygenic
metabolic traits can now be used as a novel tool for identifying interesting alleles for reverse
metabolic engineering. This approach should in principle be useful for reverse metabolic
engineering of any phenotype and any target industrial yeast strain of which a mating-
competent haploid segregant can be obtained.
The conspicuous deficiency in our understanding of the interplay between metabolic
pathways and cellular regulation has made successful metabolic engineering and synthetic
biology a more daunting task than originally anticipated (Yadav et al, 2012). An important
issue in this respect is also the inability to mimic industrial-scale conditions precisely in the
laboratory, and therefore the inability to test for all possible side-effects which may occur at
industrial scale. This creates high risk for taking multi-engineered strains into industrial scale.

Chapter III 109
As shown in the present paper, appropriate screening of yeast biodiversity can identify strains
with superior performance for a specific metabolic trait, like reduced glycerol production. We
have shown that the responsible mutant alleles can be used successfully as new gene tools to
reverse engineer an industrial yeast strain, minimizing the risk of side-effects on other
industrially-important properties.
Application of pooled-segregant whole-genome sequence analysis resulted in the
identification of one major QTL located on chromosome XII, and a minor QTL located on
chromosome II. Besides this major QTL, two to three other QTLs were expected in CBS4C,
which may have been revealed by testing more segregants or defining more stringent
conditions for selection. For instance, the weakly linked region on chromosome II was
initially also confirmed by scoring the SNPs in the 20 individual segregants, the inclusion of
the 24 segregants with a somewhat weaker superior phenotype abolished the significance.
This seems to indicate that the causative gene in this QTL is additive to the major mutation in
SSK1 in further lowering glycerol production.
We identified a mutant SSK1 allele as a causative gene in the QTL on chromosome XII. Ssk1
is part of a “two component” signal transduction system, which signals via a multistep
phosphorelay mechanism from the plasma membrane osmo-sensor Sln1 to the redundant
MAP kinase kinase kinases (MAPKKK) Ssk2 and Ssk22 (Hohmann, 2002). Upon osmostress,
Ssk1 is rapidly dephosphorylated and the resulting protein binds with and activates Ssk2 and
Ssk22. Upon completion of osmoadaptation, dephosphorylated Ssk1 is degraded by the Ubc7-
dependent ubiquitin-proteasome system, causing downregulation of the HOG pathway (Sato
et al, 2003). The ssk1E330N…K356N
protein has lost part of its carboxyterminal end including the

110 Chapter III
response regulatory domain (amino acid position 505 - 647). However, at high osmolarity
Ssk1 is unphosphorylated, which enables the protein to interact with the non-catalytic
inhibitory domain of Ssk2 and Ssk22 MAPKKK (Maeda et al, 1995). Hence, one would
normally expect that absence of the functional regulatory domain causes overactivation of the
HOG pathway. In fact, hyperactivation of Hog, by deletion of negative regulators like PTC1
or PTP2 (Warmka et al, 2001; Wurgler-Murphy et al, 1997), is lethal in S. cerevisiae.
Therefore, the ssk1E330N…K356N
is probably not just a simple loss-of-function allele. This is
underscored by the observation that it does not cause the same effect as deletion of SSK1 for
glycerol/ethanol yield, ethanol productivity and growth in the CBS4C background.
A major goal of our work was to identify specific alleles, which would allow to reduce
glycerol yield without or with less-pronounced side-effects on osmotolerance or volumetric
ethanol productivity. The ssk1E330N…K356N
allele apparently fulfills these criteria. Introduction
of ssk1E330N…K356N
in the target strain Ethanol Red caused an even stronger reduction of
glycerol production than the deletion of SSK1, without causing a stronger effect on volumetric
productivity. Under anaerobic conditions glycerol production is required for reoxidation of
the NADH that is produced in glycolysis for the synthesis of intermediates that are withdrawn
for biosynthetic purposes. Under osmostress conditions, glycerol is produced as a compatible
osmolyte to prevent cellular dehydration. A possible explanation is that under both conditions,
the Ethanol Red strain produces an excess of glycerol and that therefore a partial reduction
can be achieved without seriously compromising ethanol productivity or osmotolerance.
The original diploid parent strain CBS6412 had two copies of the ssk1E330N…K356N
allele,
supporting that this mutation was also causative for the unusually low glycerol production in

Chapter III 111
that strain. This suggests that the mutant protein may provide a specific advantage in certain
environmental niches, for instance by enhancing ethanol production without compromising
osmostress tolerance. In this genetic background, the ssk1E330N…K356N
allele also did not
compromise growth as opposed to the deletion of SSK1. The precise origin of strain
CBS6412, however, is not known. The industrial strain Ethanol Red, with two copies of the
ssk1E330N…K356N
allele, showed a reduction in the glycerol/ethanol ratio, but not to the same
extent as in CBS6412. Identification of causative mutations in the other QTLs may allow
further reduction of the glycerol/ethanol ratio. The successful engineering of the industrial
target strain makes us conclude that the huge diversity of natural and industrial S. cerevisiae
strains available in culture collections may constitute a rich source of novel gene tools for
reverse metabolic engineering. In contrast to classical direct metabolic engineering, these
gene tools are not limited by our knowledge of the underlying molecular mechanisms.

112 Chapter III
4.5 Supplementary material
Supplementary Table 1: Primers used
No. Function Sequence
A-4770 SNP check Pair 1, CBS4C Chr II w 535197 GAAACTGAAACCAGGAGGAG
A-4735 SNP check Pair 1, ER7A Chr II w 535197 GAAACTGAAACCAGGAGGAA
A-4736 SNP check Pair 1, CBS4C Chr II c 535985 CTTTATGTAGTCTGGATTTTAG
A-4737 SNP check Pair 1, ER7A Chr II c 535985 CTTTATGTAGTCTGGATTTTAA
A-4738 SNP check Pair 2, CBS4C Chr II w 598260 TTCAAGTTAAATCGAATTGTAT
A-4739 SNP check Pair 2, ER7A Chr II w 598260 TTCAAGTTAAATCGAATTGTAC
A-4740 SNP check Pair 2, CBS4C Chr II c 599590 ATATCAATGTAAACACGTCA
A-4741 SNP check Pair 2, ER7A Chr II c 599590 ATATCAATGTAAACACGTCG
A-4742 SNP check Pair 3, CBS4C Chr II w 680091 GATATTAGTGTACATACGTTGC
A-4743 SNP check Pair 3, ER7A Chr II w 680091 GATATTAGTGTACATACGTTGA
A-4744 SNP check Pair 3, CBS4C Chr II c 681213 TTCCTTTTGAAGTGTCCTCG
A-4745 SNP check Pair 3, ER7A Chr II c 681213 TTCCTTTTGAAGTGTCCTCT
A-4746 SNP check Pair 4, CBS4C Chr XII w 169083 TCTCCATTACCAGCTGAA
A-4747 SNP check Pair 4, ER7A Chr XII w 169083 TCTCCATTACCAGCTGAG
A-4748 SNP check Pair 4, CBS4C Chr XII c 169876 GCATATATATATTTTAAGAAAATT
A-4749 SNP check Pair 4, ER7A Chr XII c 169876 GCATATATATATTTTAAGAAAATC
A-4750 SNP check Pair 5, CBS4C Chr XII w 198118 CAGAGTGGCAGACATTATCG
A-4751 SNP check Pair 5, ER7A Chr XII w 198118 CAGAGTGGCAGACATTATCA
A-4752 SNP check Pair 5, CBS4C Chr XII c 198478 GTAGCTGCCACAAAGCAC
A-4753 SNP check Pair 5, ER7A Chr XII c 198478 GTAGCTGCCACAAAGCAT
A-5009 SNP check Pair 6, CBS4C Chr II w 650007 TCTGCGTCTCTACGTTCTTG
A-5010 SNP check Pair 6, ER7A Chr II w 650007 TCTGCGTCTCTACGTTCTTA
A-5011 SNP check Pair 6, CBS4C Chr II c 650708 CACGCGTCGTTCTCGTC
A-5012 SNP check Pair 6, ER7A Chr II c 650708 CACGCGTCGTTCTCGTT
A-5013 SNP check Pair 7, CBS4C Chr II w 707209 ACATGTACACAAATCTTGAT

Chapter III 113
A-5014 SNP check Pair 7, ER7A Chr II w 707209 ACATGTACACAAATCTTGAC
A-5015 SNP check Pair 7, CBS4C Chr II c 708732 AGAAGAGAAGATCAAGCGTA
A-5016 SNP check Pair 7, ER7A Chr II c 708732 AGAAGAGAAGATCAAGCGTG
A-5017 SNP check Pair 8, CBS4C Chr II w 137510 CCCATTTTCTCGAATTGCAGA
A-5018 SNP check Pair 8, ER7A Chr II w 137510 CCCATTTTCTCGAATTGCAGG
A-5019 SNP check Pair 8, CBS4C Chr II c 138796 TGGCTTATGCAGGCGGTAAT
A-5020 SNP check Pair 8, ER7A Chr II c 138796 TGGCTTATGCAGGCGGTAAC
A-5049 SNP check Pair 9, CBS4C Chr II w 664541 GAATATGGATATGTAGCCAC
A-5050 SNP check Pair 9, ER7A Chr II w 664541 GAATATGGATATGTAGCCAT
A-5051 SNP check Pair 9, CBS4C Chr II c 665836 ATGGTCTTCAGAGGTCCC
A-5052 SNP check Pair 9, ER7A Chr II c 665836 ATGGTCTTCAGAGGTCCT
A-5053 SNP check Pair 10, CBS4C Chr II w 694207 CATGACAGTGAGTCTGAGTC
A-5054 SNP check Pair 10, ER7A Chr II w 694207 CATGACAGTGAGTCTGAGTT
A-5055 SNP check Pair 10, CBS4C Chr II c 695455 TTCAACAATCCTCAAAATCC
A-5056 SNP check Pair 10, ER7A Chr II c 695455 TTCAACAATCCTCAAAATCT
A-5057 SNP check Pair 11, CBS4C Chr XII w 155264 TCTTTTTGAGCTTAGGAGCG
A-5058 SNP check Pair 11, ER7A Chr XII w 155264 TCTTTTTGAGCTTAGGAGCA
A-5059 SNP check Pair 11, CBS4C Chr XII c 155773 GGTCCCCGTGTTTAAGAGTG
A-5060 SNP check Pair 11, ER7A Chr XII c 155773 GGTCCCCGTGTTTAAGAGTA
A-5061 SNP check Pair 12, CBS4C Chr XII w 179598 GGCACGTCATTATCGTCCAA
A-5062 SNP check Pair 12, ER7A Chr XII w 179598 GGCACGTCATTATCGTCCAG
A-5063 SNP check Pair 12, CBS4C Chr XII c 180560 GTTTTCCATTGCCGCTATTCT
A-5064 SNP check Pair 12, ER7A Chr XII c 180560 GTTTTCCATTGCCGCTATTCC
A-5118 SNP check Pair 13, CBS4C Chr XII w 162202 AAGTCCCTAATCTGCTTGGA
A-5119 SNP check Pair 13, ER7A Chr XII w 162202 AAGTCCCTAATCTGCTTGGC
A-5126 SNP check Pair 13, CBS4C Chr XII c 162909 GATCATATTTCTCCGGGGA
A-5127 SNP check Pair 13, ER7A Chr XII c 162909 GATCATATTTCTCCGGGCGA
A-5122 SNP check Pair 14, CBS4C Chr XII w 173098 GAGAAAGTCCATAAAGAATG
A-5123 SNP check Pair 14, ER7A Chr XII w 173098 GAGAAAGTCCATAAAGAATA
A-5124 SNP check Pair 14, CBS4C Chr XII c 174280 TCTTCACGGCAACTAATTTC
A-5125 SNP check Pair 14, ER7A Chr XII c 174280 TCTTCACGGCAACTAATTTT
A-5128 Sequencing SSK1 AAAAATTCTTTGTTTTAC
A-5129 Sequencing SSK1 AAGTTCGGCCGTTTTGTAT

114 Chapter III
A-5130 Sequencing SSK1 CCCACTCTGTAATTTTCT
A-5131 Sequencing SSK1 CGCCTTCCTTCCAAATAT
A-5132 Sequencing SSK1 ACATGGGTTGCGTTATGC
A-5133 Sequencing SSK1 CTTTACCTTTAAGATCTG
A-5134 Sequencing SSK1 AAGTGCAATCATTAACTG
A-5135 Sequencing SSK1 CGGCAAAGGCGTCGTATA
A-5136 Sequencing SSK1 TCAGTTTCTGAAAAAACC
A-5164 1st SSK1 deletion cassette, long flanking H1 site CACGATCACTCTTCCATCATA
A-5165 1st SSK1 deletion cassette, long flanking H1 site GGTTGTACCGTGTAGAGGACATT
A-5166* 1st SSK1 deletion cassette TCGTTACATTCTATCATAATGTCCTCTACACGGTA
CAACCCAGCTGAAGCTTCGTACGC
A-5167* 1st SSK1 deletion cassette
TTCGGCCGTTTTGTATAAGAAATATTGGAAAGGCT
GCTGTAAATCAAAAACGAATCGCATAGGCCACTA
GTGGATCTG
A-6113 2nd SSK1 deletion cassette CCCACTCTGTAATTTTCTTACTAAGCCAGTGTAAA
TTCACTGGTTTAGTCCAGCTGAAGCTTCGTACGC
A-6114 2nd SSK1 deletion cassette
TATACGACGCCTTTGCCGCCGTGCCGACAGTGGCC
GCGACTACCAATGTGGCATAGGCCACTAGTGGAT
CTG
A-5168 Verification of deletion, upstream of SSK1 TGCCAGTCAAGATTTCCCATA
A-5169 Verification of deletion, downstream of SSK1 TCCATGCCTATAATTATCGCGTTT
A-5894 Check primer AMD1 TCTCTAGCCTTCTGATAGGC
A-5895 Check primer AMD1 AGCCTTGGAATAGGTAGACG
A-6101 SSK1 insertion cassette, H1 TTTTTTGGTACCCACGATCACTCTTCCATCATA
KpnI
A-6103 SSK1 insertion cassette, H1 ATATATGTCGACGGTTGTACCGTGTAGAGGACATT
SalI
A-6100 SSK1 insertion cassette, SSK1 allele ATATATGTCGACCACGATCACTCTTCCATCATA
SalI
A-6102 SSK1 insertion cassette, SSK1 allele TTTTTTCCCGGGTCCATGCCTATAATTATCGCGTTT
XmaI
A-6770 SSK1 insertion cassette, pUG-AMD ATATATGTCGACGCATAGGCCACTAGTGGATCTG
SalI
A-7116 SSK1 insertion cassette, pAG25 (NAT1) ATGCGGCATCAGAGCAGATTGTA
A-7117 SSK1 insertion cassette, pAG25 (NAT1) TATATATACACGTAGTGGATCTG
DraIII
A-7118 SSK1 insertion cassette, pG119 (GIN11) CGAAATCGGCAAAATCCCTTAT

Chapter III 115
A-7119 SSK1 insertion cassette, pG119 (GIN11) TTCGCTCCTCTTTTAATGCCTTT
A-7301 Check primer NAT1 ACCCATCCAGTGCCTCGATG
Nucleotides in capital letters are derived from S. cerevisiae genome for homologous recombination at SSK1 gene locus. respectively.
Sequences with underlined letters functioned as primers for amplification of the deletion or promoter cassettes from respective plasmids
(Gueldener et al, 2002).
Supplementary Table 2: Plasmids used in this study
Plasmid Description Reference
pUG66 E. coli/ vector containing, Amp+, loxP-bleR-loxP
disruption cassette
Gueldener
et al., 2002
pFA6a-AMD1-MX6 vector containing AMD1 gene of Z.rouxii
pUG-AMD E. coli vector containing, Amp+, loxP-AMD1-
loxP disruption cassette This study
pNAT-Cre E. coli/ S. cerevisiae shuttle vector containing,
Amp+, NAT1, Cre recombinase This study
pBluescriptII SK(+) E.coli cloning vector Stratagene
pBluescriptII_AMD1_ssk1E330N…K356N
E. coli vector containing, Amp+, H1(repeat
region), AMD1 (selection/counterselction),
ssk1E330N…K356N of CBS4C
This study
pBluescriptII_NAT1_GIN11_ssk1E330N…K356N
E. coli vector containing, Amp+, H1(repeat
region), NAT1/GIN11 (selection/counterselction),
ssk1E330N…K356N of CBS4C
This study
pBluescriptII_AMD1_SSK1
E. coli vector containing, Amp+, H1(repeat
region), AMD1 (selection/counterselction), SSK1
of ER7A
This study
pBluescriptII_NAT1_GIN11_SSK1
E. coli vector containing, Amp+, H1(repeat
region), NAT1/GIN11 (selection/counterselction),
SSK1 of ER7A
This study

116 Chapter III
Calculations
Yields
Absolute yield
Relative yield
Carbon balance
The yields, based on product mass, were transferred into carbon based yields, using the
following coefficients:
Biomass 25.356 g/Cmol1 Ethanol 23 g/Cmol
Glycerol 30.66 g/Cmol Acetat 30 g/Cmol
CO2 44 g/Cmol Glucose 30 g/Cmol
The amount of CO2 produced during the fermentation resulted from the difference of the
initial weight and the final weight.
Calculation of the volumentric production rate
The fermentation tubes were weighed throughout the fermentation process to calculate the
relative weight loss m[%].
m % m0 mt
m0
100mCO2
m0
100
A curve was fit to the weight loss over time using a polynomial function of 8th
degree. The
derivate of this function resulted the normalized maximum fermentation rate [h-1
] during the
time of the fermentation.
Massbalance batch - fermentation:
dmCO2
dt = rCO2
V rCO2
1
V
dmCO2
dt
rCO2 =
1
V
m
t
Assumption => CO2 only produced together with EtOH (maximum yield)
Molar production rates of CO2 and EtOH are equal
1 Biomass formula used to convert dry weights into molar carbon concentrations was C1H1.79O0.64N0.16 (ENSC,
Toulouse).
YS / i cifinal
(csini cS
final)
Y% YS / i
segr
YS / i
CBS4C

Chapter III 117
rCO2
1
V
dnCO 2
dt rEtOH
1
V
dnEtOH
dt
nCO2 =
mCO2
MWCO2
1
nEtOH = mEtOH
MWEtOH
2
2
1 1 nEtOH
nCO2
mEtOH
MW CO 2
MWEtOH
mCO2
mEtOH mCO2
MWEtOH
MWCO 2
Use the weightloss [%]:
m % m0 m t
m0
100 mCO2
m0
100
mCO2
m % m0
100
rEtOH 1
V
dmCO2
dt
1
V
d mCO2
MW EtOH
MWCO 2
dt
rEtOH 1
V
MW EtOH
MW CO 2
dmCO2
dt
rEtOH 1
V
MW EtOH
MW CO2
m0
100
dm[%]
dt
maximum volumetric productivity rmax


Chapter IV
Identification of multiple alleles
conferring low glycerol and high ethanol yield
in Saccharomyces cerevisiae
ethanolic fermentation.

120 Chapter IV
1. Abstract
Genetic engineering of complex traits can make use of multiple strategies to create a desired
phenotype; however many engineering approaches suffer from undesirable side effects on
essential functions. A precedent-setting example in Saccharomyces cerevisiae is the reduction
of glycerol synthesis, which has been engineered in manifold ways for the purpose of
increasing ethanol yield. Many approaches relied on the manipulation of one or two genes
with marginal success because of unexpected side-effects; however complex traits must be
addressed by combinatorial gene modifications allowing for compatibility with normal
cellular functionality. Studying Saccharomyces cerevisiae biodiversity for specific alleles
causing lower glycerol and higher ethanol yield can provide new gene tools to design such
combinatorial engineering approaches. We previously identified ssk1E330N…K356N
as causative
allele in strain CBS6412, which displays a low glycerol and high ethanol yield. We have now
identified a single segregant, 26B, that lacks ssk1E330N…K356N
, and still shows similar low
glycerol/high ethanol production as the superior parent. Using segregants from the backcross
of 26B with the inferior parent strain, we applied pooled-segregant whole-genome sequencing
and identified three minor QTLs linked to low glycerol and high ethanol yield. Three alleles
known to be involved in regulation or metabolism of glycerol, smp1R110Q,P269Q
, hot1P107S,H274Y
and gpd1L164P
were identified as causative genes. All three genes separately caused a
significant drop in the glycerol yield in yeast fermentation, while gpd1L164P
was epistatically
suppressed by the other two alleles. Our results show that natural yeast strains harbor multiple
specific alleles controlling glycerol yield. These alleles can be used as gene tools for
engineering industrial yeast strains, minimizing the risk of negatively affecting other essential
functions. These gene tools can act at the transcriptional, regulatory and/or structural gene
level, distributing the impact over multiple targets and thus minimizing possible side-effects.
In addition, the results suggest complex trait analysis as a promising new avenue to identify
new components involved in cellular functions.

Chapter IV 121
2. Bibliographic reference
Hubmann, G., Mathé, L., Foulquié-Moreno, MR, Duitama, J, Nevoigt, E., and Thevelein, JM.
Identification of multiple alleles conferring low glycerol and high ethanol yield in
Saccharomyces cerevisiae ethanolic fermentation
(Manuscript submitted)
Duitama, J., Sanchez-Rodriguez, A., Goovaerts, A., Pulido-Tamayo, S., Hubmann, G.,
Foulquie-Moreno, MR., Thevelein, JM., Verstrepen, K. and Marchal, K.
Improved linkage analysis of Quantitative Trait Loci using bulk segregants
unveils a novel determinant of high ethanol tolerance in yeast
(Manuscript submitted)
3. Scientific contribution
The author participated in the project conception, experimental work, data analysis and article
writing.
122 Chapter IV
4. Manuscript III: Identification of multiple alleles conferring low
glycerol and high ethanol yield in Saccharomyces cerevisiae ethanolic
fermentation
4.1 Introduction
Glycerol formation is of great importance in the yeast S. cerevisiae and serves two major
physiological functions: i) the regulation of cell turgor especially under high osmolarity and
ii) recycling of the cofactor NAD+ to maintain the redox balance, particularly in the absence
of oxygen. In the first case, glycerol is produced as a compatible osmolyte during osmostress.
The HOG pathway mediates the stimulation of glycerol production during osmostress and has
been elucidated and characterized in great detail (Hohmann, 2002). It involves osmosensing
proteins at the level of the plasma membrane, a MAP kinase signalling pathway and
transcription factors that regulate expression of stress related target genes important for proper
adaptation to osmotic stress. In the second case, glycerol is produced to maintain the redox
balance during anaerobic growth. This is due to the fact that biosynthesis results in an excess
of NADH, which mainly is regenerated through glycerol formation from dihydroxy aceton 3-
phosphate (DHAP). Besides CO2, glycerol is the main by-product in the alcoholic
fermentation. It is synthesized by the consecutive action of glycerol 3-phosphate
dehydrogenase, encoded by GPD1 and GPD2, and glycerol 3-phosphate phosphatase,
encoded by GPP1 and GPP2 (Albertyn et al, 1994; Ansell et al, 1997).
Glycerol formation is a complex quantitative trait and is highly variable among isolates of
Saccharomyces cerevisiae (Hubmann et al, 2013). Low glycerol formation is essential for
maximal yield in bioethanol production (Bro et al, 2006; Nissen et al, 2000) while high
glycerol formation is important for production of wines with a good mouth-feel and a reduced
alcohol level (Schmidtke et al, 2012; Schuller and Casal, 2005). Rational genetic engineering
of glycerol production by modification of the main structural gene, GPD1, encoding glycerol-
3-phosphate dehydrogenase, the rate limiting enzyme of glycerol synthesis; has not been
successful in obtaining industrial yeast strains with low glycerol and high ethanol yield
because of the strong side-effects caused on other phenotypic traits. Deletion and even

Chapter IV 123
reduced expression of GPD1 lowers growth and fermentation rates (Bjorkqvist et al, 1997;
Guadalupe Medina et al, 2010; Hubmann et al, 2011; Nissen et al, 2000; Pagliardini et al,
2010) while overexpression causes redox imbalance and overproduction of acetate (Nevoigt
and Stahl, 1996; Remize et al, 1999; Schmidtke et al, 2012; Schuller et al, 2005). Hence,
studying glycerol formation as complex trait may provide new insights, gene targets and lastly
gene tools for more directed sustainable engineering of glycerol formation without causing
negative side-effects on other essential traits.
Like many other industrially relevant traits in yeasts, glycerol formation has a complex
phenotype/genotype relationship, meaning polygenic inheritance and environmental
variability. So far, such traits are poorly understood with regards to their regulatory network
and gene - gene interactions. For complex traits, knowledge based engineering has been
difficult and mainly addressed through targeted deletion and/or overexpression of one
structural or regulatory gene, which very often results in undesirable side-effects on other
essential functions (Albertyn et al, 1994; Guadalupe Medina et al, 2010; Nissen et al, 2000).
In awareness of these difficulties, strain improvement on complex traits has mainly been
achieved through non-targeted approaches, which do not require a priori knowledge about
gene targets. Such approaches, also referred as random engineering strategies, were the key
driver in microbial engineering (Nevoigt, 2008; Oud et al, 2012) and resulted in most of
today’s commercially used yeasts. Despite these easy to use ‘black box’ approaches, non-
targeted improvements are laborious with a high risk of affecting other traits and the acquired
improvements can also not be transferred to other strains. Hence, identification of causative
genes and gene - gene interactions is essential to overcome these drawbacks of non-targeted
approaches (Oud et al, 2012). Before the ‘-omics’ era, genome-scale methodologies for
identification of causative genetic determinants were limited and therefore this was a major
bottleneck in non-targeted approaches and reverse engineering (Bailey et al, 1996). The
developments of genome scale ‘-omics’ technologies facilitate such identification. For
instance, locating or mapping causative determinants is possible by analyzing the inheritance
of genomic regions in offspring of parents, where one of the two exhibits the superior
phenotype. An offspring population selected for the superior phenotype shows a deviation
from the usual 50% inheritance in the linked genomic regions. A genomic region with such
deviation is called a quantitative trait locus (QTL). Several genetic markers, the most

124 Chapter IV
prominent being the single nucleotide polymorphisms (SNPs), have been used to score
inheritance of both parental types. Recent advances in sequencing technologies facilitated
SNP scoring in genome-wide mapping studies allowing for simultaneous detection of
multiple linked QTLs over the whole genome (Brem et al, 2002; Deutschbauer and Davis,
2005; Steinmetz et al, 2002; Swinnen et al, 2012a; Winzeler et al, 1998). Moreover, methods
for rapid dissection of the mapped QTLs, such as reciprocal hemizygosity analysis, were
developed to identify the causative genes in the locus (Steinmetz et al, 2002). Certainly, QTL
analysis became very powerful for identification of genetic determinants using non-targeted
approaches (Hubmann et al, 2013). So far, major causative genes determining a trait were
easily identified and were even mapped to the gene level, using several random inbreeding
steps (Parts et al, 2011). Reliable identification and analysis of minor QTLs and their
causative genes has remained challenging because of weak linkage and the small contribution
to the phenotype, which are easily masked by major causative genes and/or can be replaced
by other minor causative genes. This often results in the insignificance of the minor QTLs. It
remains highly important in genetic analysis of complex traits to develop alternative
methodologies to analyze minor QTLs in an efficient and reliable way. One strategy for
identification of minor QTLs is the sequential elimination of the causative gene identified in
the major QTL using a backcross with a segregants that lacks this causative gene but shows
the phenotype of interest (Birkeland et al, 2010; Demogines et al, 2008; Sinha et al, 2008). A
disadvantage of this strategy is that the phenotypic difference between parent and segregants
often becomes smaller and that therefore larger numbers of segregants are required for
reliable phenotyping and QTL mapping. Another strategy to identify minor QTLs is to
increase the stringency of phenotypic screening. Swinnen et al. (2012a) showed that selection
of yeast segregants tolerant to 17% ethanol versus 16% ethanol, strengthened the linkage of
several minor QTLs, facilitating their further analysis. However, this methodology also results
in higher numbers of segregants being required in the phenotypic screening.
We conducted QTL mapping of the trait of ‘low glycerol yield’, for which we previously
identified the sake yeast CBS6412, as a ‘low glycerol’ producer (Hubmann et al, 2013). The
glycerol yield of this strain was about 63% of that of Ethanol Red, a commercial strain
commonly used for bioethanol production. CBS6412 and Ethanol Red were chosen as the
parent strains to conduct QTL mapping of ‘low glycerol’ as trait of interest. The two haploid

Chapter IV 125
segregants, CBS4C and ER7A, were closest in terms of glycerol yield to their parental diploid
progenitors CBS6412 and Ethanol Red. Downscaling of the major locus on chromosome XII
and reciprocal hemizygosity analysis identified and validated ssk1E330N…K356N
, a SSK1 mutant
allele, encoding a truncated, partially mistranslated protein, as causative for the low-glycerol
phenotype. Although the ssk1E330N…K356N
allele was the major effector, it did not completely
confer the ‘low glycerol’ phenotype observed in CBS6412.
In the present paper, we present a targeted backcross (Demogines et al, 2008; Sinha et al,
2008) of a segregant of the cross CBS4C/ER7A, which was selected for the phenotype of
interest, ‘low glycerol’ yield, but lacked the ssk1E330N…K356N
allele. Hence, in the backcross
with the inferior parent ER7A the ssk1E330N…K356N
allele was entirely absent. Mapping by
pooled-segregant whole-genome sequence analysis and reciprocal hemizygosity analysis led
to the identification in minor QTLs of three new causative alleles of known genes in glycerol
metabolism and its regulation, each by itself causing a reduction in glycerol yield.
4.2 Materials and Methods
Microbial strains and cultivation conditions
All S. cerevisiae strains used are listed in Table 1. E. coli strain DH5αTM
(Invitrogen Corp.,
Carlsbad) was used for amplification of plasmids. The strain was grown in Luria-Bertani (LB)
medium containing 0.5% (w/v) yeast extract, 1% (w/v) Bacto tryptone, 1% (w/v) NaCl, (pH
7.5) at 37˚C. E. coli transformation and isolation of plasmid DNA was carried out using
standard techniques (Sambrook et al, 1989). Transformants were selected on LB medium
containing 100µg/ml ampicillin.
Table 1 Saccharomyces cerevisiae strains used.
Strain Genotype Source
CBS6412 Diploid, ssk1E330N…K356N/ssk1E330N…K356N CBS-KNAW
Ethanol Red Diploid, SSK1/SSK1
Fermentis, S. I.
Lesaffre
ER7A Segregant 7A of Ethanol Red, Matα This study

126 Chapter IV
CBS4C Segregant 4C of CBS6412, Mata, ssk1E330N…K356N This study
26B Segregant of the cross ER7A x CBS4C, Matα, SSK1 This study
26B MatA Mating type switch of 26B to MatA This study
26B x ER7A Hybrid diploid 26B x ER7A This study
26B smp1∆ x ER7A Hybrid diploid 26B smp1∆ x ER7A
This study
26B x ER7A smp1∆ Hybrid diploid 26B x ER7A smp1∆ This study
26B gpd1∆ x ER7A Hybrid diploid 26B gpd1∆ x ER7A This study
26B x ER7A gpd1∆ Hybrid diploid 26B x ER7A gpd1∆ This study
26B hot1∆ x ER7A Hybrid diploid 26B hot1∆ x ER7A This study
26B x ER7A hot1∆ Hybrid diploid 26B x ER7A hot1∆ This study
BY 4742 gpd1∆ Ycplac33 Haploid, gpd1∆, Ycplac33 This study
BY 4742 gpd1∆ Ycplac33
GPD1-ER7A
Haploid, gpd1∆, Ycplac33 GPD1-ER7A This study
BY 4742 gpd1∆ Ycplac33
gpd1L164P-CBS4C
Haploid, gpd1∆, Ycplac33 gpd1L164P-CBS4C This study
26B gpd1∆ Ycplac33 Haploid, ura3∆, gpd1∆, Ycplac33 This study
26B gpd1∆ Ycplac33 GPD1-
ER7A
Haploid, ura3∆, gpd1∆, Ycplac33 GPD1-ER7A This study
26B gpd1∆ Ycplac33 gpd1L164P-
CBS4C
Haploid, ura3∆, gpd1∆, Ycplac33 gpd1L164P -
CBS4C
This study
ER7A gpd1∆ Ycplac33 Haploid, ura3∆, gpd1∆, Ycplac33 This study
ER7A gpd1∆ Ycplac33 GPD1-
ER7A
Haploid, ura3∆, gpd1∆, Ycplac33 GPD1-ER7A This study
ER7A gpd1∆ Ycplac33
gpd1L164P-CBS4C
Haploid, ura3∆, gpd1∆, Ycplac33 gpd1L164P -
CBS4C
This study
26B x ER7A gpd1∆/∆ Ycplac33 Haploid, ura3∆/∆, gpd1∆/∆, Ycplac33 This study
26B x ER7A gpd1∆/∆ Ycplac33
GPD1-ER7A
Haploid, ura3∆/∆, gpd1∆/∆, Ycplac33 GPD1-ER7A This study

Chapter IV 127
26B x ER7A gpd1∆/∆ Ycplac33
gpd1L164P-CBS4C
Haploid, ura3∆/∆, gpd1∆/∆, Ycplac33 gpd1L164P -
CBS4C
This study
Mating, sporulation and internal crosses
Mating and sporulation were carried out according to standard procedures (Sherman and
Hicks, 1991). Mating type of segregants was determined by diagnostic PCR for the MAT
locus (Huxley et al, 1990). Meiotic spores of the cross 26B/ER7A were isolated by random
spore analysis as described by Treco and Winston (2001). The hybrid 26B/ER7A strain was
plated on a sporulation plate to initiate sporulation for a period of about two weeks up to 1
month until asci were observed. The yeast cells were washed off the sporulation plate and
suspended in 25 ml of MilliQ water, in a 300 ml Erlenmeyer flask together with sterile 0.45
mm glass beads. 500 µl Zymolase (10mg/ml) and 10 µl of β-mercaptoethanol were added to
the cell suspension in order to degrade the asci. This cell suspension was incubated overnight
at 30˚C by shaking at 200 rpm. The cell suspension was transferred to a 50 ml tube together
with the glass beads, and shaken vigorously. The cell debris was centrifuged at 20000 rpm for
20 min. The supernatant was discarded and the pellet was suspended in 5 ml of Nonidet P-40
and placed on ice for 15 min. This was followed by 4 rounds of sonication (30 s, 75%). The
cell suspension rested 2 min on ice between two rounds. After that, the cell suspension was
centrifuged for 10 min at 3000 rpm, the supernatant was discarded, and the cells were re-
suspended in 1.5% Nonidet P-40. This procedure was repeated once, followed by 4 more
rounds of sonication and incubation on ice. Lastly, the cell suspension was centrifuged for 10
min at 3000 rpm. The supernatant was discarded, and cells were re-suspended in 300 ml of
MilliQ water. The cell suspension was diluted to obtain single colonies on plates. Plates were
incubated at 30˚C until single colonies were visible. These single colonies were re-plated and
checked for mating type to confirm haploidy. Usually, this procedure yielded 90% haploids.
Internal crossing of 26B and ER7A was carried out as follows. First, diploids were isolated
from the cross between ER7A and 26B. For this purpose, the mating type of single colonies
resulting from the cross between ER7A and 26B was checked. In the first step of internal
crossing, the diploids were streaked out on a sporulation plate to initiate sporulation until
sufficient asci were visible. In the second step, spores were isolated using random spore
analysis (see further). The isolated spores were all plated on YD and incubated for 2 days at

128 Chapter IV
30˚C to ensure that enough diploids had formed. In the last step, newly formed diploids were
transferred to a new sporulation plate to start the next cycle of internal crossing.
Fermentation conditions
The 26B, ER7A and CBS4C strains were tested in two fermentations: minimal medium and
YP 10% glucose. The minimal medium was composed of 1.9 g l-1
yeast nitrogen base (Difco),
5 g l-1
ammonium sulphate, 250 mg l-1
leucine, 50 mg l-1
uracil, 100 mg l-1
histidine, 30 mg l-1
lysine, 20 mg l-1
methionine and 50 g l-1
glucose. The inoculum was prepared in minimal
medium containing 2% (w/v) glucose to inoculate the fermentation with an initial OD of 1.
Fermentations were carried out in Erlenmeyer flasks, which were equipped with air locks,
ensuring the exclusion of oxygen but allowing the release of CO2. The fermentations were
performed at 30˚C and cultures were continuously stirred at 200 rpm.
The parental strains, ER7A and 26B, as well as CBS4C, were additionally tested in YPD,
which contained 0.2% (w/v) yeast extract, 0.6% (w/v) peptone, and 10% (w/v) glucose. The
free nitrogen content present in YPD was adjusted to that present in wheat liquefact. The
fermentations were carried out in cylindrical glass tubes, which were closed with a rubber
stopper containing a glass pipe, sealed off with a cotton plug to release CO2. 100 ml
fermentation medium was added to each tube. Inoculum cultures were grown statically
overnight at 30˚C in 5 ml of YD medium, one day ahead of the fermentation and this culture
was used completely to inoculate the 100ml fermentation tube. The empty weight, starting
weight and weight after 72h fermentation of the tubes was measured to determine the net
weight loss, due to conversion of sugar to carbon dioxide, during the fermentation.
Fermentations ran for 72 hours at 30˚C and were stirred at 200 rpm. After the 72 hours, the
final weight was determined. The fermentation broth was cooled for 1 night at 4˚C prior to the
analysis of glycerol and ethanol concentration, in order to minimize evaporation of ethanol
during the sample taking. The fermentations of the initial screen of 26B/ER7A segregants,
those of the reciprocal hemizygosity analysis, and those of the gpd1∆ strains were carried out
in 100 ml YP 10% glucose.
Screening of additional selected segregants was downscaled to a 5ml fermentation. The pre-
culture was started one day ahead of the fermentation in 3 ml of YD medium. Cultures were

Chapter IV 129
grown statically overnight at 30˚C. The next day, the pre-cultures were used to inoculate the
5ml fermentations at a rate of 1/20. Fermentations were kept for 96h at 30˚C and afterwards
placed at 4˚C overnight prior to the analysis of the fermentation broth in order to prevent
ethanol evaporation.
Determination of fermentation parameters
In all fermentations weight loss was used to follow the progress of the fermentation. Glucose,
glycerol and ethanol in the medium were determined by HPLC (Waters® isocratic BreezeTM
HPLC, ion exchange column WAT010290). Column temperature was 75˚C, 5 mM H2SO4
was used as eluent with a flow rate of 1 ml min-1
and refractive index detection was used
(Waters, 2414 RI detector). The product yield was calculated from the final product
concentration (g l-1
) and the difference in glucose concentration at the start and end of the
fermentation (consumed glucose in g l-1
). Yields of screenings, RHA and the gpd1∆ strain
constructs were related to the yield of 26B in order to decrease variance between different
experiments.
DNA methods
Yeast genomic DNA was extracted with Phenol/Chloroform/Isoamyl-alcohol (25:24:1)
(Hoffman and Winston, 1987) and further purified with diethyl-ether extraction or ethanol
precipitation if required. PCR was performed with high-fidelity polymerases PhusionTM
(Finnzymes) or ExTaqTM
(TaKaRa) for cloning and amplification of deletion or insertion
cassettes, and sequencing purposes. Sequencing was carried out using the dideoxy chain-
termination method (Sanger and Coulson, 1975) at the VIB Genetic Service Facility
(Antwerp). The sequences were analyzed with geneious (Geneious Basic 5.3.4), SeqMan
(Lasergene Coresuite 8) or CLC DNA workbench (CLC bio) software.
Pooled-segregant whole-genome sequence analysis
The segregant 26 was isolated from the cross of CBS4C and ER7A. This segregant was
backcrossed with its own parent ER7A. From this backcross, the 22 most superior segregants

130 Chapter IV
(lowest glycerol production) were assembled in the 'selected pool' while 22 random
segregants were used to assemble the 'unselected pool'. The two pools were made by
combining equal amounts of cells based on OD600. High molecular weight DNA (3 µg, ~
20kb fragments) was isolated from the pools and parent strains according to Johnston and
Aust (1994). The purity of the DNA sample was estimated from UV measurement (260/280 =
1.7 - 2.0). The DNA samples were provided to BGI (Hong Kong, China) for whole-genome
sequence analysis by Illumina technology.
Mapping of short read sequences, variant calling and QTL analysis were carried out as
described earlier by Swinnen et al. (2012a) and by Hubmann et al. (2013). The SNP variant
frequencies were calculated by dividing the number of the alternative variant by the total
number of aligned reads. A very high or a very low frequency was a sign of a one-sided SNP
segregation preferentially coming from one parent, indicating a genetic linkage to the trait of
interest. Genetic linkage was statistically confirmed using EXPloRA (Duitama et al.
submitted for publication) or the methods described earlier (Swinnen et al, 2012a).
Detection of SNP markers by allele specific PCR
Individual SNPs were scored by PCR. The forward and reverse primer contained the
nucleotide of ER7A or CBS4C as the 3’ terminal nucleotide, respectively. The annealing
temperature was optimized using DNA extracts of ER7A and CBS4C so as to allow only
hybridization with primers containing an exact match.
Reciprocal hemizygosity analysis (RHA)
For RHA analysis (Steinmetz et al, 2002), two diploid strains were constructed by crossing
26B and ER7A wild type or deletion strains for the candidate gene, so that the resulting
diploids only contained a single allele from either 26B or ER7A for the candidate gene being
evaluated. The SMP1, HOT1 and GPD1 deletions were carried out as described by Gueldner
et al. (2002) using the bleR marker conferring phleomycine resistance. After the
transformation, the gene deletions were verified by PCR using primers outside the deleted
gene. In case of SMP1 and GPD1 the deletion cassette enlarged the PCR fragment indicating

Chapter IV 131
the integration of the bleR cassette in the locus. In case of HOT1 the deletion cassette was
smaller than the deleted fragment of HOT1, thus a decrease in the PCR fragment showed
correct deletion. Each deletion strain was crossed with the wild type strain of the other parent,
resulting in two hybrid 26B/ER7A diploids. The correct genotype of these diploids was
reconfirmed by the presence of two PCR fragments, one resulting from the wild type allele
the other from the deleted allele. RHA was performed with three independent isolates of all
tested diploids.
Construction of YCplac GPD1 plasmids
The primers, A-3709 and A-3743, were used to PCR amplify genomic DNA of CBS4C and
ER7A chr. IV (410523 - 413479), containing the promoter, GPD1 ORF, and terminator. The
resulting PCR fragment was digested with KpnI, purified, and ligated to the plasmid
YCplac33, which was digested with KpnI prior to ligation. The constructs YCplac33 GPD1-
ER7A and YCplac33 gpd1L164P
-CBS4C were verified using Sanger sequencing. URA3 was
deleted in the strain 26B gpd1∆ and ER7A gpd1∆. Both strains were mated to obtain the
ER7A x 26B gpd1∆/∆ ura3∆/∆. The deletion cassette was constructed as described by
Gueldner et al. (2002) with the geneticin resistance marker KanMX6. Transformants were
selected for the two selectable markers, phleomycin and geneticin, to avoid a cassette switch.
URA3 gene deletion was confirmed by PCR and absence of growth on SD-ura plates. The
YCplac33 GPD1-ER7A, YCplac33 gpd1L164P
-CBS4C and the empty plasmid were transferred
to the strain BY4742 gpd1∆, 26B gpd1∆ ura3∆, ER7A gpd1∆ ura3∆, and ER7A/26B
gpd1∆/∆ ura3∆/∆, using the LiAc/PEG transformation method (Gietz et al, 1992).
Data deposition
Sequencing data have been deposited at the SRA database (NCBI),
http://www.ncbi.nlm.nih.gov/sra, with the account number SRA059109.

132 Chapter IV
4.3 Results
Selection of a segregant without the ssk1E330N…K356N
allele
Previous work has identified the Saccharomyces cerevisiae strain CBS6412 as a strain with
an unusually low glycerol yield and a concomitant higher ethanol yield. Genetic analysis
identified the ssk1E330N…K356N
mutation as a major causative mutation (Hubmann et al 2013)
(Figure 1A). Among the 44 segregants of the cross CBS4C/ER7A, which were selected for
‘low glycerol’, only a single segregant, 26B, was present, in which ssk1E330N…K356N
was absent
(Figure 1A). Despite the absence of ssk1E330N…K356N
in this segregant, its glycerol yield was
equally low and its ethanol yield equally high as the superior parent strain CBS4C, both in
minimal medium with 5% glucose and rich yeast extract-peptone medium with 10% glucose
(Figure 1B). Hence, 26B showed the same phenotypic difference with the inferior parent
strain ER7A as CBS4C (Figure 1B). In this work, the fermentation medium, referred to as YP
10% glucose, was modified to adapt the conditions to more industrial-like conditions. In the
previous study, fermentations were carried out in minimal medium, which results in higher
glycerol yields when compared to those obtained in industrial scale. Moreover, the elevated
sugar concentration caused a higher osmotic pressure leading to the induction of osmostress
genes and induced glycerol formation. In this way, we increased the selection strength on the
low glycerol phenotype allowing for the detection of weakly linked genes, which confer both
a low glycerol production phenotype as well as osmo-tolerance.
Targeted backcross with the inferior parent ER7A
The mating type of segregant 26B was switched from Matα to MatA by induction of the HO-
gene located on the plasmid pFL39 GAL1 HO KanMX to allow mating with the inferior
parent ER7A (Matα). Glycerol yield of the hybrid diploid, 26B/ER7A showed an intermediate
phenotype between ER7A and 26B (Figure 1B). The ethanol yield obtained in YP 10%
glucose distinguished more clearly between the four strains when compared to minimal
medium. Strain ER7A showed the lowest ethanol yield (0.475 g g-1
) among all tested strains.
The ethanol yield was higher in the diploid 26B/ER7A (0.481 g g-1
) and the segregant 26B
(0.484 g g-1
) and reached the maximum for the CBS4C strain (0.488 g g-1
). 260 meiotic
segregants were characterized for glycerol and ethanol yield in fermentations with 100 ml YP

Chapter IV 133
10% glucose. 26B, ER7A and the hybrid diploid were used as controls in each batch of
fermentations.
Figure 1 Phenotypes of the parental strains ER7A and CBS4C and the segregant 26B. (A) Scheme of the
crossings to map mutations linked to the low glycerol yield phenotype. The initial parental cross of ER7A and
CBS4C resulted in the segregant 26B with a low glycerol phenotype but without the ssk1E330N…K356N allele. The
26B segregant was crossed back with the inferior parent ER7A to find other linked mutations. (B) Glycerol and
ethanol yield obtained in minimal medium with 5% glucose and in YP 10% glucose for the parental strains,
ER7A and CBS4C, the segregant 26B, and the zygote 26B x ER7A.
Glycerol and ethanol yield of the segregants in each batch were normalized to those of 26B,
which were set to 100%. ER7A and the diploid 26B/ER7A showed an average glycerol yield
of 146% and 124% and a concomitantly decreased ethanol yield of 98.1% and 99.4% (Figure
2A). The glycerol and ethanol yield showed a Gaussian distribution amongst the segregants,
which extended over the range of the two parental stains. Both population means were located
closely to the hybrid diploid 26B/ER7A. In general, glycerol and ethanol yield of the

134 Chapter IV
segregant population correlated inversely (as determined with a Pearson test), meaning that
low glycerol yield usually resulted in high ethanol yield. Exceptions to this correlation were
strains with an unusually low ethanol yield that failed to show a correspondingly higher
glycerol yield. Application of two criteria, a glycerol yield lower than 120% of 26B and an
ethanol yield higher than 99% of 26B, resulted in the selection of a set of 34 superior
segregants. We re-checked the 34 segregants showing a glycerol yield below 120% of 26B in
100 ml fermentations; 22 segregants showed a stable relative glycerol yield combined with a
high ethanol yield (Figure 2B). These 22 segregants were selected for QTL mapping with
pooled-segregant whole-genome sequence analysis. A second pool with 22 randomly selected
segregants was also subjected to pooled-segregant whole-genome sequence analysis and used
as the unselected control pool (Figure 2B).
Figure 2 Glycerol and ethanol yield in parental strains, hybrid diploid and segregants. (A) Glycerol and
ethanol yield in the parental strains, 26B (■) and ER7A (▲),the hybrid diploid strain 26B/ER7A (●) and in
segregants of 26B/ER7A (◯). Fermentations were carried out in 100 ml YP with 10% glucose. Glycerol and
Ethanol yields of all segregants, ER7A and the diploid 26B/ER7A were related to the yield of 26B, which was
set as 100%. (B,C) Distribution of the glycerol and ethanol yield in the unselected (B) and selected (C) segregant
pool of 26B/ER7A. The criteria for selection of “low glycerol” segregants (<120% glycerol yield, >99% ethanol
yield) are indicated with stippled lines. The 22 selected segregants were fermented twice to confirm low glycerol
production. These segregants were used for pooled-segregant whole-genome sequence analysis. The glycerol
and ethanol yield of the parental strains, 26B and ER7A, and diploid 26B/ER7A are indicated as in (A).

Chapter IV 135
Pooled-segregant whole-genome sequence analysis and QTL mapping
The genomic DNA of the selected and unselected pools, as well as the parent strain 26B, was
extracted and submitted to custom sequence analysis using Illumina HiSeq 2000 technology
(BGI, Hong Kong, China). The parent strain ER7A has been sequenced in our previous study
(data accession number SRA054394). Read mapping and SNP filtering were carried out as
described previously (Hubmann et al 2013). The SNP variant frequency was plotted against
the SNP chromosomal position (Figure 3). Of the total number of 21,818 SNPs between
CBS4C and ER7A, 5,596 SNPs of CBS4C were found back in 26B. These SNPs were used
for mapping minor QTLs in the genomic areas that were not identical between 26B and
ER7A. The other genomic areas were completely devoid of SNPs because they were identical
between the 26B and ER7A parents (Figure 3). The scattered raw SNP variant frequencies
were smoothened and a confidence interval was calculated, as previously described (Swinnen
et al, 2012a). The Hidden-Markov Model, EXPloRA (Duitama et al. submitted for
publication), was used to evaluate whether candidate regions showed significant linkage to
the low glycerol phenotype. EXPloRA reported six candidate QTLs: on chr. I (3859-11045),
chr. II (584232-619637), chr. IV (316389-375978 and 696486-748140), and chr. XIII
(600902-610995 and 634582-640415) for the selected segregant pool. The locus on chr. I was
present in both the selected and unselected pool and was thus likely linked to an inadvertently
selected trait, such as sporulation capacity or spore viability. It was excluded from further
analysis. The locus on chr. II was also present in the previous mapping with the two original
parents, CBS4C and ER7A, but the linkage was not significant (Hubmann et al 2013). The
backcross has now confirmed its usefulness. On chr. IV and XIII, new QTLs were detected,
which were not present in the mapping with the original parent strains CBS4C and ER7A.
EXPloRA also reported two significantly linked loci on chr. VI (169586-170209) and chr. VII
(472620-493523) for the unselected pool. Both loci were linked to the inferior parent, ER7A.
For the region on chr. VII, the linked locus with the inferior parent genome was also present
in the selected pool. Both loci likely represent linkage to inadvertently selected traits, such as
sporulation capacity or spore viability. It is unclear why the locus on chr. VI was only present
in the unselected pool. Since both loci were not linked to the low glycerol phenotype they
were not investigated further.

136 Chapter IV
Figure 3 Plots of SNP variant frequency versus chromosomal position and corresponding probability of
linkage to the superior or inferior parent. Plots of SNP variant frequency versus chromosomal position of all
16 yeast chromosomes for the selected (raw data: light grey triangles; smoothened data: red line) and unselected
pool (raw data: light grey circles; smoothened data: green line). Significant upward deviations from the average
of 0.5 indicate linkage to the superior parent 26B, while significant downward deviations indicate linkage to the
inferior parent ER7A. The smoothened line was determined as described previously (Swinnen et al, 2012a).
Linked regions were detected with EXPLoRA (Duitama et al. submitted for publication).
The QTLs on chr. II, IV and XIII were further investigated in detail. Selected individual SNPs
were scored in the 22 individual superior segregants to determine the SNP variant frequency
precisely and determine the statistical significance of the putative linkage. However, using the
binomial test previously described (Swinnen et al, 2012a) none of the three loci was found to

Chapter IV 137
be significantly linked to the genome of the superior parent strain 26B with the number of
segregants available. Therefore, we screened 400 additional F1 segregants of the diploid
26B/ER7A for low glycerol and high ethanol yield. In addition, we performed four rounds of
random inbreeding to increase the recombination frequency (Parts et al, 2011) and
subsequently evaluated 400 F5 segregants in small-scale fermentations for glycerol/ethanol
yield. The results for all tested segregants, including the 260 tested once for QTL analysis, are
shown in Figure 4A. The glycerol and ethanol yield are expressed as percentage of that of the
superior parent strain 26B. There was again a clear inverse relationship between glycerol and
ethanol yield. From the 800 segregants, we selected in total 48 superior segregants, 22 F1
segregants and 26 F5 segregants (Figure 4B). Subsequently, individual SNPs in the putative
QTLs were scored on chr. II, IV and XIII in all individual segregants, i.e. the 22 segregants of
the sequenced selected pool, the 22 additional selected F1 segregants and the 26 selected F5
segregants to calculate the SNP variant frequency and the corresponding P-value. Both
parameters were also determined for the two combined groups, 44 F1 segregants and the total
of 70 segregants (Figure 4C). Due to the low association of the three regions to the trait (70%-
80%), the P-values for the small segregant population of 22 or 26 individuals were not
significant. On the other hand, the three QTLs mapped with the large combined segregant
populations of 44 and 70 (Figure 4C) were significant. The region on chromosome II was
confirmed to be linked from position 504240 till 680091. The P-values reached a minimum
for the SNP markers, 504240 and 535197. In contrast, the highest association in the
sequenced pool was found at position 598260 predicted by EXPloRA (Duitama et al.
submitted for publication). On chromosome IV, EXPloRA predicted the two regions, 316389-
375978 and 696486-748140, as being significantly linked. The highest SNP variant
frequencies were found in the first region from 310000 to 410000. In all pools, the highest
frequency was found at position 411831, which was followed by a clear drop in the
frequency. The second region on chromosome IV was not significant in all tested segregant
pools. On chromosome XIII, EXPloRA reported two closely located regions, 600902-610995
and 634582-640415, which probably derived from a single QTL. In the total segregant pool,
the SNP at position, 606166 and 620234, showed the highest association, reaching a minimal
P-value at position 606166. The upstream region on chromosome XIII was not significantly
linked.

138 Chapter IV
Figure 4 Linkage analysis of QTLs on chr. II, IV and XIII with different groups of segregants. (A)
Glycerol and ethanol yield of the parental strains, 26B (■) and ER7A (▲), and the hybrid diploid strain
26B/ER7A (●).Glycerol and ethanol yield of the first isolated F1 segregants from 26B/ER7A (◯), of the
additional F1 segregants (□) and of the F5 segregants (◇). Fermentations were carried out in 5 ml YP 10%
glucose. Glycerol and ethanol yield of all segregants, ER7A and the diploid 26B/ER7A were related to the yield
of 26B, which was set as 100% (B) Segregants were selected for low glycerol (<120% glycerol yield, stippled
line) and high ethanol (>99% ethanol yield, stippled line) after each round of screening, resulting in the
following segregant groups: 22 F1 segregants used for pooled-segregant whole-genome sequence analysis (◯),
22 additional selected F1 segregants (□), and 26 F5 segregants (◇). These segregants were reconfirmed in 100
ml YP 10% glucose. (C) SNP variant frequency (top) and respective P-value (bottom) were determined by
allele-specific PCR in individual segregants of the sequenced selected pool (●), additional F1 selected pool (◯),
the total F1 selection of 44 (▲), the selection of F5 segregants (∆), and the total selection of all 70 segregants (■)
to fine-map the QTLs on chr. II, IV and XIII, which were detected with EXPloRA. The statistical confidence
line (for P-value ≤ 0.05) is indicated with a stippled line.

Chapter IV 139
Identification of causative genes in the QTLs on chr. II, IV and XIII
Three candidate genes in the three QTLs were selected based on their known function in
glycerol metabolism. SMP1, which is located in the QTL on chr. II (594,864 to 593,506 bp),
encodes a putative transcription factor involved in regulating glycerol production during the
response to osmostress (de Nadal et al, 2003). The gene is located in the chromosomal region
from 584,232 to 619,637 bp, which was predicted as most significantly linked by the
EXPloRA model. The 26B SMP1 allele has two point mutations, which are changing the
primary protein sequence at position 110 from arginine to glycine and at position 269 from
proline to glycine. Hence, we have named this allele smp1R110Q,P269Q
. On chr. IV, the SNP
with the highest linkage was located at position 411,831 bp (Figure 4C), which is within the
open reading frame of GPD1 (411,825 to 413,000 bp), the structural gene for the NAD+-
dependent cytosolic glycerol 3-phosphate dehydrogenase (Albertyn et al, 1994; Larsson et al,
1993). The GPD1 allele of 26B harbors a point mutation, changing leucine at position 164
into proline. This mutation was found earlier (DDBJ database data, accession number
AY598965). The GPD1 allele of 26B was named gpd1L164P
. On chr. XIII, the SNP with the
highest linkage was located at position 606,166 bp (Figure 4C), which is within the open
reading frame of HOT1 (605,981 to 608,140 bp). HOT1 encodes a transcription factor
required for the response to osmotic stress of glycerol biosynthetic genes, including GPD1,
and other HOG-pathway regulated genes (Alepuz et al, 2003; Rep et al, 1999). The 26B
HOT1 allele contains two non-synonymous point mutations, changing proline at position 107
to serine and histidine at position 274 to tyrosine. We have named the HOT1 allele of 26B,
hot1P107S,H274Y
.
The relevance of smp1R110Q,P269Q
, gpd1L164P
and hot1P107S,H274Y
for the low glycerol/high
ethanol phenotype was further investigated using reciprocal hemizygosity analysis (RHA)
(Steinmetz et al, 2002). For that purpose, two 26B/ER7A hybrid and hemizygous diploid
26B/ER7A were constructed, in which each pair contained a single copy of the superior allele
or the inferior allele of SMP1, GPD1 or HOT1, respectively. The three pairs of hemizygous
diploids were tested in the same 100 ml YP 10% glucose fermentations as used for the
screening. The parent strains 26B and ER7A and the hybrid diploid 26B/ER7A were added as
controls. The glycerol and ethanol yields were expressed as percentage of those of 26B, which
were set at 100%. The significance of any differences between the strains was evaluated using

140 Chapter IV
a two-tailed unpaired t-test with a P-value < 0.05 considered to indicate a significant
difference. The results of the RHA are shown in Figure 5.
Figure 5 Reciprocal hemizygosity analysis (RHA). RHA for the candidate genes, SMP1 (chromosome II),
GPD1 (chromosome IV), and HOT1 (chromosome XIII) to evaluate them as causative genes in the QTLs. For
RHA, diploids were constructed with either the deletion of the ER7A allele or the deletion of the 26B allele.
Glycerol and ethanol yield of the two hemizygous diploids were related to the parental strain 26B. The Student t-
test was used to confirm significant differences in glycerol and ethanol yield for the two diploids and is indicated
with *.
The results indicate that both smp1R110Q,P269Q
and hot1P107S,H274Y
, but not gpd1L164P
, derived
from the superior parent 26B, cause a significant drop in the glycerol yield compared to the
alleles of the inferior parent strain ER7A. Ethanol yield increased in the presence of
smp1R110Q,P269Q
and hot1P107S,H274Y
when compared to the inferior allele; however, significant
differences were only observed for the hot1P107S,H274Y
allele with a P-value < 0.05 but not for
smp1R110Q,P269Q
. The smp1R110Q,P269Q
gene is a causative gene in the QTL on chr. II; however it
cannot be excluded that this QTL may contain a second causative gene, especially since
smp1R110Q,P269Q
is not located in the region with the strongest linkage (lowest P-value). The
RHA with the GPD1 alleles failed to show any difference both for glycerol and ethanol yield
(Figure 5). Hence, the superior character of the gpd1L164P
allele could not be confirmed with

Chapter IV 141
RHA. This is remarkable because the SNP with the strongest linkage (lowest P-value) in the
QTL on chr. IV was located in the open reading frame of GPD1 and showed very strong
linkage to the phenotype. The hot1P107S,H274Y
allele of the superior strain 26B, on the other
hand, caused a reduction in glycerol and an increase in ethanol production, and both changes
were significant (P-value < 0.05) (Figure 5). Hence, these results indicate that hot1P107S,H274Y
is a causative allele in the QTL on chr. XIII and because it contains the SNP with the
strongest linkage (lowest P-value) it is likely the main causative allele in this QTL.
Expression of the gpd1L164P
allele in gpd1∆ strains
Several explanations could account for the failure to confirm the superior character of the
gpd1L164P
allele from 26B in the RHA test. A closely located gene may be the real causative
gene, the gpd1L164P
allele may be effective only in a haploid genetic background or the effect
of the gpd1L164P
allele may be suppressed through epistasis by one or both of the other two
superior alleles, smp1R110Q,P269Q
and hot1P107S,H274Y
. To distinguish between these possibilities,
the gpd1L164P
allele was amplified from CBS4C and the GPD1 allele from strain ER7A by
PCR (410,523 to 413,479 bp, including promotor, ORF and terminator). The PCR fragment
was ligated in the centromeric plasmid YCplac33, resulting in plasmids YCplac33-gpd1L164P
-
CBS4C and YCplac33-GPD1-ER7A. Both plasmids were transformed into gpd1∆ strains of
the two parents 26B and ER7A, the hybrid diploid 26B/ER7A and the lab strain BY4742
(Giaever et al, 2002; Winzeler et al, 1999). All strains were tested in 100ml scale
fermentations with YP 10% glucose. Glycerol and ethanol yield were determined after 120h
fermentation and were expressed as percentage of those of 26B. The results are shown in
Figure 6. The expression of the gpd1L164P
-CBS4C or GPD1-ER7A allele in the gpd1∆ strains
of the superior parent 26B and the hybrid diploid 26B/ER7A enhanced glycerol yield and
reduced ethanol yield to the same extent for the two alleles. However, in the gpd1∆ strains of
the inferior parent ER7A and the lab strain BY4742, the expression of gpd1L164P
-CBS4C allele
significantly reduced glycerol yield and increased ethanol yield compared to the expression of
the GPD1-ER7A allele in the respective strains. The latter confirms that the gpd1L164P
-CBS4C
allele is superior for the low glycerol/ high ethanol phenotype compared to the GPD1-ER7A
allele. The difference between the two alleles is not dependent on the haploid or diploid
background of the strain but seems to be related with the presence of the two other superior

142 Chapter IV
alleles, smp1R110Q,P269Q
and hot1P107S,H274Y
. In 26B and 26B/ER7A, no differential effect on
glycerol and ethanol yield was observed in the presence of both alleles gpd1L164P
-CBS4C and
GPD1-ER7A. In contrast, the glycerol and ethanol yield between the two expressed GPD1
alleles significantly differed in ER7A and BY4742, probably due to the absence of both
superior alleles, smp1R110Q,P269Q
and hot1P107S,H274Y
. Hence, the gpd1L164P
allele is causative for
the ‘low glycerol’ phenotype, however the gpd1L164P
alleles phenotypically interferes with the
smp1R110Q,P269Q
and hot1P107S,H274Y
alleles in 26B.
Figure 6 Expression of gpd1L164P
-CBS4C and GPD1-ER7A in segregant 26B, ER7A, the diploid 26B/ER7A
and BY4742. Glycerol and ethanol yield in the gpd1∆ strains, 26B, ER7A, 26B/ER7A and BY4742, harbouring
the plasmids YCplac33, YCplac33-GPD1-ER7A, and YCplac33-gpd1L164P-CBS4C. Fermentations were carried
out in 100 ml YP 10% glucose. Glycerol and ethanol yield of the strains were related to the yield of 26B, which
was set as 100%, to decrease experimental variations. In the BY 4742 and ER7A backgrounds, which lack the
smp1R110Q,P269Q and hot1P107S,H274Y alleles, the gpd1L164P allele clearly reduced glycerol yield and concomitantly
increased ethanol yield compared to the wild type GPD1 allele. In the strains 26B and 26B/ER7A, which contain
the smp1R110Q,P269Q and hot1P107S,H274Y alleles, the gpd1L164P allele resulted in a similar glycerol yield as the wild
type GPD1 allele.

Chapter IV 143
Figure 7 Presence of the 26B alleles, smp1R110Q,P269Q
, gpd1L164P
and hot1P107S,H274Y
, in the selected segregant
population. Mean values are indicated for each group.
We have scored the final 70 superior segregants with a glycerol yield < 120% and an ethanol
yield > 99% of that of the superior parent 26B, for the presence of the three causative alleles,
smp1R110Q,P269Q
, gpd1L164P
and hot1P107S,H274Y
. The results are shown in Figure 7. The largest
group of superior segregants contained all three mutant alleles, followed by smaller groups
with only two of the three mutant alleles and finally the three smallest groups with only one
mutant allele. Hence, there was a tendency that the glycerol yield decreased and the ethanol
yield increased with the number of mutant alleles present in a selected segregant. Although
the means of the groups showed differences depending on the number of mutant alleles, these
differences were not significant due to the small population size and high phenotypic variance
within the groups. The frequency of the three mutant alleles in the 70 superior segregants was
smp1R110Q,P269Q
: 76%, gpd1L164P
: 83% and hot1P107S,H274Y
: 70%. Therefore, the gpd1L164P
allele
showed a slight preference for the phenotype over the two other mutant alleles, despite its
epistatic suppression by its two transcriptional regulators, smp1R110Q,P269Q
and hot1P107S,H274Y
.
The selected segregants frequently possess at least two out of three mutant alleles, hence at
least two alleles were required to confer the superior phenotype for the majority of the
selected segregants.
144 Chapter IV
4.4 Discussion
Identification of alleles causative for reduced glycerol yield in segregant 26B
The goal of the present work was to investigate whether natural yeast strains may harbour
specific alleles that would allow reducing the glycerol yield and increasing the ethanol yield
in yeast fermentation. Here, we successfully identified three mutant alleles, which separately
and together reduce the glycerol yield in a subtle way without affecting at least not in a
conspicuous way the overall rate and characteristics of the fermentation process. Combined
with the previous discovery of the ssk1E330N…K356N
allele in strain CBS4C (Hubmann et al
2013), the current results indicate that the original diploid parent strain CBS6412 contains at
least four specific alleles of well-known structural and regulatory genes filtered by natural
selection and evolution for compatibility with survival in the natural environment. The chance
that these alleles exert significant negative effects on other essential functions of the yeast
cells is probably not completely absent but at least minimized compared to drastic genetic
modifications like gene deletion or overexpression. Screening of biodiversity for such specific
alleles is therefore a fruitful strategy to identify mutant alleles that can be used as specific
gene tools for strain improvement by targeted genetic modification.
Identification of minor QTLs and causative genes
Non-selectable quantitative traits, like glycerol or ethanol formation in yeast display a
polygenic inheritance. Causative genes contribute to varying degrees to the phenotype. While
identification of major QTLs has become straightforward with pooled-segregant whole-
genome sequence analysis (Deutschbauer et al, 2005; Ehrenreich et al, 2010; Parts et al,
2011; Swinnen et al, 2012b), identification of minor QTLs remains challenging. In the present
work, we successfully implemented a targeted backcross (Sinha et al, 2008) for identification
of minor QTLs. This approach requires an F1 segregant displaying the phenotype-of-interest,
in which one or more superior alleles are absent. The F1 segregant 26B descending from the
parental cross ER7A/CBS4C was identified as such a segregant, in which the major causative
gene, ssk1E330N…K356N
, previously found in QTL mapping (Hubmann et al 2013), was absent.
Moreover, the ratio of selected to the total number of F1 segregants from ER7A/CBS4C
indicated that two or three additional mutations besides the major gene ssk1E330N…K356N
were
present in CBS4C. The absence of the ssk1E330N…K356N
allele in the segregant 26B required

Chapter IV 145
that all or most minor QTLs are present in this segregant to confer the phenotype-of-interest.
Interestingly, these combined mutations resulted in an equally low glycerol yield in the
segregant 26B when compared to the parental strain CBS4C. This indicates that the effect of
the major causative allele, ssk1E330N…K356N
functionally interferes with the other minor linked
alleles, smp1R110Q,P269Q
, gpd1L164P
and hot1P107S,H274Y
, i.e. ssk1E330N…K356N
allele suppresses the
effect of the minor contributing alleles. In genetic mapping, such gene-gene interactions result
in insignificant linkage disequilibrium for the suppressed QTLs, which results in particular
from parental crosses with all causative mutations present. To avoid this problem, backcross
strategies have been successfully applied to detect minor QTLs (Birkeland et al, 2010;
Demogines et al, 2008; Sinha et al, 2008). In the present work, we eliminated the major allele
ssk1E330N…K356N
by backcrossing the segregant 26B with its inferior parent ER7A. In principle
this approach can be repeated with a segregant of the new generation that still displays the
low glycerol phenotype. As shown in Figure 7, several of the new generation segregants
contained only one of the three causative alleles and still displayed a low glycerol yield under
the cut-off of 120%. This suggests that there are still additional alleles present in these strains
able to confer low glycerol yield in the absence of the other alleles and that a new backcross
of such a segregant with the inferior parent may allow identification of additional alleles
conferring low glycerol yield.
Random coincidence versus linkage in small segregant populations
In small populations of segregants, random coincidence can easily cause falsely predicted
QTLs (Beavis, 1998), which are difficult to distinguish from QTLs with significant, but weak
linkage. An unselected pool helps in adjusting the significance threshold for minor QTLs in
order to exclude false positives caused by random coincidence. Higher stringency in QTL
selection can eliminate false QTLs but also weakly linked true QTLs. It is well known that a
higher number of segregants increases the reliability of minor QTL detection. In previous
work, many minor QTLs could be identified by using millions of segregants and a selectable
phenotype (Parts et al, 2011). However, many quantitative traits are not selectable and the
phenotypic screening of large numbers of segregants can be very laborious, as in the case of
low glycerol/high ethanol yield, and is thus often limited to small numbers of segregants.
Furthermore, the sequencing depth considerably determines the accuracy of SNP variant
frequencies in pooled DNA samples. Generally, a low sequencing depth causes high variation

146 Chapter IV
of the SNP variant frequency, even if a large population of segregants is used. In practice, the
sequencing depth should be adjusted to the number of pooled segregants. If the number of
segregants exceeds the sequencing depth, the surplus of segregants no longer enhances the
reliability of mapping and is thus useless. In this case, the selected segregants could be split
into different pools to enable cross-validation of the population subsets. An essential
difference between a false QTL caused by random coincidence and a true minor QTL is that
the latter should be consistently reproducible in different selected segregant populations,
whereas a false QTL caused by random coincidence is not. Therefore, we used three different
pools of segregants resulting in three independent pools of small-size with segregants
displaying low glycerol yield. This allowed us to distinguish the false QTLs on chr IV
(696486-748140) and chr XIII (634582-640415) from the true, weakly linked QTLs on the
same chromosomes, chrIV (316389-375978) and chrXIII (600902-610995). Resampling of
more selected segregants resulted in a clear differentiation of false QTLs from weakly linked
QTLs. Moreover, all three pools combined retrieved equal analysis power as one huge
population. Hence, both strategies enable a reliable identification of minor QTLs.
Novel mutant alleles and their epistatic interactions
The discovery of three novel alleles of known components of glycerol metabolism and its
regulation suggests that complex trait analysis could be a promising avenue for identification
of novel components involved in cellular functions. It seems plausible that further mapping
and analysis of even more minor QTLs, as discussed previously, may easily result in
identification of new genes involved in the regulation of glycerol metabolism.
In this work we have identified three novel alleles of components with a well-established role
in glycerol metabolism and its regulation. Smp1 is a transcription factor, belonging to the
MEF2 family, that regulates the expression of stress-responsive genes, such as GPD1. Its
DNA binding domain is located at the amino acid residues 1-90 (Dodou and Treisman, 1997).
Upon osmotic stress, Smp1 is phosphorylated by Hog1, which physically interacts with its C-
terminal domain. Four different phosphorylation sites were identified, i.e. Ser348, Ser357,
Thr365, and Ser376, all located within a region coincident with the Hog1 binding domain.
Phosphorylation of Smp1 is essential for its functioning, since an allele unable to be
phosphorylated caused an impaired stress response (de Nadal et al, 2003). The point

Chapter IV 147
mutations in the 26B allele, smp1R110Q,P269Q
, are not located in the domain for DNA
recognition or the Hog1 binding domain. However, the change of a proline to a glycine, close
to the phosphorylation sites, might change Smp1 structure, thereby influencing its ability to
be bound and/or phosphorylated by Hog1.
GPD1 encodes NAD+ dependent cytosolic glycerol 3-phosphate dehydrogenase. It catalyzes
the conversion of dihydroxyacetone phosphate (DHAP) to glycerol 3-phosphate through the
oxidation of NADH. The expression of GPD1 is induced by the HOG-pathway and it is
essential for growth under high osmolarity (Albertyn et al, 1994). Possible domains for
binding of NADH, H+ and DHAP have been predicted based on similarity with proteins with
a comparable function (Marchler-Bauer et al, 2009). The single point mutation present in the
26B allele, gpd1L164P
, may be located in the putative NADH-binding domain, but the location
of this domain is not well predicted. This mutation was found earlier and called a ‘natural
variant’ (DDBJ database data, accession number AY598965). No linkage of gpd1L164P
with
low glycerol yield was observed in RHA but its effect was revealed by expression of the two
parental GPD1 alleles in GPD1-deficient mutants. The L164P mutation could reduce the
intrinsic activity of the Gpd1 enzyme and results in reduced glycerol production.
The gpd1L164P
allele was clearly subject to epistatic suppression. In the BY 4742 and ER7A
backgrounds, which lack the smp1R110Q,P269Q
and hot1P107S,H274Y
alleles, the allele clearly
reduced glycerol yield compared to the wild type GPD1 allele (Figure 6). On the other hand,
its expression in the strains 26B and 26B/ER7A, which contain the smp1R110Q,P269Q
and
hot1P107S,H274Y
alleles, resulted in a similar glycerol yield as the wild type GPD1 allele. The
epistatic effect may be explained at the biochemical level by the fact that the reduction in
expression of GPD1, caused by the smp1R110Q,P269Q
and hot1P107S,H274Y
alleles, is so strong that
the mutation in GPD1 itself has no significant effect anymore. Hot1 activates transcription of
GPD1 and other HOG-dependent genes under osmo-stress (Alepuz et al, 2003; Rep et al,
2000; Rep et al, 1999). Alepuz et al. (2003) proposed that Hot1 serves as an anchor for Hog1,
which directly recruits the RNA polymerase II complex. The position of the Hog1 binding
domain in Hot1 is unknown. It is unclear how the two mutations in the 26B allele,
hot1P107S,H274Y
, could affect the functioning of the protein.

148 Chapter IV
4.5 Supplementary material
Supplementary Table 1: Primers used
No. Function Sequence
A-4770 SNP check Pair 1, CBS4C Chr II w 535197 GAAACTGAAACCAGGAGGAG
A-4735 SNP check Pair 1, ER7A Chr II w 535197 GAAACTGAAACCAGGAGGAA
A-4736 SNP check Pair 1, CBS4C Chr II c 535985 CTTTATGTAGTCTGGATTTTAG
A-4737 SNP check Pair 1, ER7A Chr II c 535985 CTTTATGTAGTCTGGATTTTAA
A-4738 SNP check Pair 2, CBS4C Chr II w 598260 TTCAAGTTAAATCGAATTGTAT
A-4739 SNP check Pair 2, ER7A Chr II w 598260 TTCAAGTTAAATCGAATTGTAC
A-4740 SNP check Pair 2, CBS4C Chr II c 599590 ATATCAATGTAAACACGTCA
A-4741 SNP check Pair 2, ER7A Chr II c 599590 ATATCAATGTAAACACGTCG
A-4742 SNP check Pair 3, CBS4C Chr II w 680091 GATATTAGTGTACATACGTTGC
A-4743 SNP check Pair 3, ER7A Chr II w 680091 GATATTAGTGTACATACGTTGA
A-4744 SNP check Pair 3, CBS4C Chr II c 681213 TTCCTTTTGAAGTGTCCTCG
A-4745 SNP check Pair 3, ER7A Chr II c 681213 TTCCTTTTGAAGTGTCCTCT
A-4746 SNP check Pair 4, CBS4C Chr XII w 169083 TCTCCATTACCAGCTGAA
A-4747 SNP check Pair 4, ER7A Chr XII w 169083 TCTCCATTACCAGCTGAG
A-4748 SNP check Pair 4, CBS4C Chr XII c 169876 GCATATATATATTTTAAGAAAATT
A-4749 SNP check Pair 4, ER7A Chr XII c 169876 GCATATATATATTTTAAGAAAATC
A-4750 SNP check Pair 5, CBS4C Chr XII w 198118 CAGAGTGGCAGACATTATCG
A-4751 SNP check Pair 5, ER7A Chr XII w 198118 CAGAGTGGCAGACATTATCA
A-4752 SNP check Pair 5, CBS4C Chr XII c 198478 GTAGCTGCCACAAAGCAC
A-4753 SNP check Pair 5, ER7A Chr XII c 198478 GTAGCTGCCACAAAGCAT
A-5009 SNP check Pair 6, CBS4C Chr II w 650007 TCTGCGTCTCTACGTTCTTG
A-5010 SNP check Pair 6, ER7A Chr II w 650007 TCTGCGTCTCTACGTTCTTA
A-5011 SNP check Pair 6, CBS4C Chr II c 650708 CACGCGTCGTTCTCGTC
A-5012 SNP check Pair 6, ER7A Chr II c 650708 CACGCGTCGTTCTCGTT
A-5013 SNP check Pair 7, CBS4C Chr II w 707209 ACATGTACACAAATCTTGAT
A-5014 SNP check Pair 7, ER7A Chr II w 707209 ACATGTACACAAATCTTGAC
A-5015 SNP check Pair 7, CBS4C Chr II c 708732 AGAAGAGAAGATCAAGCGTA

Chapter IV 149
A-5016 SNP check Pair 7, ER7A Chr II c 708732 AGAAGAGAAGATCAAGCGTG
A-5017 SNP check Pair 8, CBS4C Chr II w 137510 CCCATTTTCTCGAATTGCAGA
A-5018 SNP check Pair 8, ER7A Chr II w 137510 CCCATTTTCTCGAATTGCAGG
A-5019 SNP check Pair 8, CBS4C Chr II c 138796 TGGCTTATGCAGGCGGTAAT
A-5020 SNP check Pair 8, ER7A Chr II c 138796 TGGCTTATGCAGGCGGTAAC
A-5049 SNP check Pair 9, CBS4C Chr II w 664541 GAATATGGATATGTAGCCAC
A-5050 SNP check Pair 9, ER7A Chr II w 664541 GAATATGGATATGTAGCCAT
A-5051 SNP check Pair 9, CBS4C Chr II c 665836 ATGGTCTTCAGAGGTCCC
A-5052 SNP check Pair 9, ER7A Chr II c 665836 ATGGTCTTCAGAGGTCCT
A-5053 SNP check Pair 10, CBS4C Chr II w 694207 CATGACAGTGAGTCTGAGTC
A-5054 SNP check Pair 10, ER7A Chr II w 694207 CATGACAGTGAGTCTGAGTT
A-5055 SNP check Pair 10, CBS4C Chr II c 695455 TTCAACAATCCTCAAAATCC
A-5056 SNP check Pair 10, ER7A Chr II c 695455 TTCAACAATCCTCAAAATCT
A-8483 SNP check Pair 15, CBS4C Chr IV 342149 w ATTTGGTGAGCAGATCATT
A-8482 SNP check Pair 15, ER7A Chr IV 342149 w ATTTGGTGAGCAGATCATC
A-8485 SNP check Pair 15, CBS4C Chr IV c 343682 GAATGGTCTGCATTCAGA
A-8484 SNP check Pair 15, ER7A Chr IV c 343682 GAATGGTCTGCATTCAGG
A-8487 SNP check Pair 16, CBS4C Chr IV w 374477 GGTAGTTCTGCCGGTTTG
A-8486 SNP check Pair 16, ER7A Chr IV w 374477 GGTAGTTCTGCCGGTTTA
A-8489 SNP check Pair 16, CBS4C Chr IV c 375389 TGGAGTAGATGAGTTGAATG
A-8488 SNP check Pair 16, ER7A Chr XII c 375389 TGGAGTAGATGAGTTGAATA
A-8491 SNP check Pair 17, CBS4C Chr IV w 716135 CGTTGCTTTTGGCATCCA
A-8490 SNP check Pair 17, ER7A Chr IV w 716135 CGTTGCTTTTGGCATCCG
A-8493 SNP check Pair 17, CBS4C Chr IV c 716689 CGAGTTACAACGATGCGT
A-8492 SNP check Pair 17, ER7A Chr IV c 716689 CGAGTTACAACGATGCGC
A-8495 SNP check Pair 18, CBS4C Chr XIII w
606166 CTATAGGTATCAATCTTGAT
A-8494 SNP check Pair 18, ER7A Chr XIII w 606166 CTATAGGTATCAATCTTGAC
A-8497 SNP check Pair 18, CBS4C Chr XIII c 606800 GCTGGTTGATACCAAAATA
A-8496 SNP check Pair 18, ER7A Chr XIII c 606800 GCTGGTTGATACCAAAATG
A-8499 SNP check Pair 19, CBS4C Chr XIII w
637066 GAATTCAACTCCCTGAGC
A-8498 SNP check Pair 19, ER7A Chr XIII w 637066 GAATTCAACTCCCTGAGT
A-8501 SNP check Pair 19, CBS4C Chr XIII c 637703 GGACCTAAATGACGTCTG

150 Chapter IV
A-8500 SNP check Pair 19, ER7A Chr XIII c 637703 GGACCTAAATGACGTCTA
A-9111 SNP check Pair 20, CBS4C Chr II w 557132 CCAAAGGAAAGACCATGCTC
A-9112 SNP check Pair 20, ER7A Chr II w 557132 CCAAAGGAAAGACCATGCTT
A-9113 SNP check Pair 20, CBS4C Chr II c 558463 GACTTCCAAATCCGAGACG
A-9114 SNP check Pair 20, ER7A Chr II c 558463 GACTTCCAAATCCGAGACA
A-9115 SNP check Pair 21, CBS4C Chr II w 316389 GAATTGCGACTTTGACCATA
A-9116 SNP check Pair 21, ER7A Chr II w 316389 GAATTGCGACTTTGACCATG
A-9117 SNP check Pair 21, CBS4C Chr II c 316965 AGCTAAATAATAAGTAAGATCCG
A-9118 SNP check Pair 21, ER7A Chr II c 316965 AGCTAAATAATAAGTAAGGTCCC
A-9119 SNP check Pair 22, CBS4C Chr II w 333847 TCTGATTTATTCTTTTATCCTGT
A-9120 SNP check Pair 22, ER7A Chr II w 333847 TCTGATTTATTCTTTTATCCTGC
A-9121 SNP check Pair 22, CBS4C Chr II c 334511 CACGATGCCCGCTTTGTTCC
A-9122 SNP check Pair 22, ER7A Chr II c 334511 CACGATGCCCGCTTTGTTTT
A-9736 SNP check Pair 23, CBS4C Chr II w 459460 ATGATATTCAGCAAATTTGCTT
A-9737 SNP check Pair 23, ER7A Chr II w 459460 ATGATATTCAGCAAATTTGCTG
A-9738 SNP check Pair 23, CBS4C Chr II c 460849 CAGTGGTAGTGCTCCTTA
A-9739 SNP check Pair 23, ER7A Chr II c 460849 CAGTGGTAGTGCTCCTTG
A-9740 SNP check Pair 24, CBS4C Chr II w 504240 GACTTTTTGCTGTGCTGT
A-9741 SNP check Pair 24, ER7A Chr II w 504240 GACTTTTTGCTGTGCTGC
A-9742 SNP check Pair 24, CBS4C Chr II c 505225 TGTTGTTGCTGCTGTTGT
A-9743 SNP check Pair 24, ER7A Chr II c 505225 TGTTGTTGCTGCTGTTGC
A9744 SNP check Pair 25, CBS4C Chr IV w 439631 AGTTAAACATTATTATTCGTT
A-9745 SNP check Pair 25, ER7A Chr IV w 439631 AGTTAAACATTATTATTCGTG
A-9746 SNP check Pair 25, CBS4C Chr IV c 440415 CAAAGTGTCAGATGCT
A-9747 SNP check Pair 25, ER7A Chr IV c 440415 CAAAGTGTCAGATGCC
A-9748 SNP check Pair 26, CBS4C Chr IV w 470659 TCAAAAGTCAAGTCTTGTTGAGC
A-9749 SNP check Pair 26, ER7A Chr IV w 470659 TCAAAAGTCAAGTCTTGTTGAGT
A-9750 SNP check Pair 26, CBS4C Chr IV c 471261 TCGCTGCATGCACTTCTC
A-9751 SNP check Pair 26, ER7A Chr IV c 471261 TCGCTGCATGCACTTCTT
A-9752 SNP check Pair 27, CBS4C Chr IV w 498006 GCACGCTATCAACTTTCTTA
A-9753 SNP check Pair 27, ER7A Chr IV w 498006 GCACGCTATCAACTTTCTTG
A-9754 SNP check Pair 27, CBS4C Chr IV c 499592 ATAATAGGTTCCCCTCCT

Chapter IV 151
A-9755 SNP check Pair 27, ER7A Chr IV c 499592 ATAATAGGTTCCCCTCCC
A-9962 SNP check Pair 28, CBS4C Chr XIII w
566283 AATCGTGCTGATGATTCCAT
A-9963 SNP check Pair 28, ER7A Chr XIII w 566283 AATCGTGCTGATGATTCCAC
A-9964 SNP check Pair 28, CBS4C Chr XIII c 566967 GTGGCAATCGCATTGGAT
A-9965 SNP check Pair 28, ER7A Chr XIII c 566967 GTGGCAATCGCATTGGAC
A-9966 SNP check Pair 29, CBS4C Chr XIII w
580772 TGATAGCGTTTATTCCAG
A-9967 SNP check Pair 29, ER7A Chr XIII w 580772 TGATAGCGTTTATTCCAA
A-9968 SNP check Pair 29, CBS4C Chr XIII c 582017 GAGATCAAAATGTTCTTGAC
A-9969 SNP check Pair 29, ER7A Chr XIII c 582017 GAGATCAAAATGTTCTTGAT
A-9970 SNP check Pair 30, CBS4C Chr XIII w
619387 GCCGGTAGTTGCGCT
A-9971 SNP check Pair 30, ER7A Chr XIII w 619387 GCCGGTAGTTGCGCC
A-9972 SNP check Pair 30, CBS4C Chr XIII c 620234 TCTCTTCACTTTCTTCTTCAC
A-9973 SNP check Pair 30, ER7A Chr XIII c 620234 TCTCTTCACTTTCTTCTTCAT
A-3913 SNP check Pair GPD1, CBS4C Chr IV w
411831
CACAAATATTGATAATATAAAGATGTCTGC
C
A-3914 SNP check Pair GPD1, ER7A Chr IV w
411831
CACAAATATTGATAATATAAAGATGTCTGC
T
A-3915 SNP check Pair GPD1, CBS4C Chr IV c
412313 AGTTCCTCAGTGATGTAAGAGGATG
A-3916 SNP check Pair GPD1, ER7A Chr IV c
412313 AGTTCCTCAGTGATGTAAGAGGATA
A-8396 HOT1 deletion cassette, long flanking site
ATAGGATAACCATCAGCTTCGATTATTCTA
CACT
GATGAGCCCTTTCTTCCAGCTGAAGCTTCGT
ACGC
A-8397 HOT1 deletion cassette, long flanking site
GTGCCGTTTTACCTCTCTCCATACCGTTCAG
AATG
AACTTGTACAATCTTGCATAGGCCACTAGT
GGATCTG
A-8398 Verification of deletion, upstream of HOT1 TGGGTATTGCGATTCTTTGC
A-8399 Verification of deletion, downstream of HOT1 TTCGCCATCCTCATCATCTT
A-8392 SMP1 deletion cassette, long flanking site
AATTGAACCTATCAAAGATGATAGAAATCG
TAC
AGTTACTTTCATAAAGCCAGCTGAAGCTTC
GTACGC
A-8393 SMP1 deletion cassette, long flanking site
AGGCAATGAAGGCTTTGGCAAATTCTCGTA
AGGCG
ACGGGTAAAAATTATGCATAGGCCACTAGT
GGATCTG
A-8394 Verification of deletion, upstream of SMP1 GCTCTAGATAAGCAAACACAA
A-8395 Verification of deletion, downstream of SMP1 TCCATCCTTTCAATCGCAAT
A-8478 GPD1 deletion cassette, long flanking site
CATCAAATCTATCCAACCTAATTCGCACGT
AGA
CTGGCTTGGTATCAGCTGAAGCTTCGTACG

152 Chapter IV
C
A-8479 GPD1 deletion cassette, long flanking site
CGACGTCCTTGCCCTCGCCTCTGAAATCCTT
TGG
AATGTGGTAAGGCATAGGCCACTAGTGGAT
CTG
A-8480 Verification of deletion, upstream of GPD1 CCGCACAACAAGTATCAGA
A-8481 Verification of deletion, downstream of GPD1 AAGTAAGGTCTGTGGAACAA
B-231 URA3 deletion cassette, long flanking site
ATGTCGAAAGCTACATATAAGGAACGTGCT
GCTACTCATCCTAGTCCTGTCAGCTGAAGC
TTCGTACGC
B-232 URA3 deletion cassette, long flanking site
TTAGTTTTGCTGGCCGCATCTTCTCAAATAT
GCTTCCCAGCCTGCTTTTCGCATAGGCCACT
AGTGGATCTG
A-3864 Verification of deletion, inside KanMX6 GTTGTATTGATGTTGGACGA
A-2970 Verification of deletion, downstream of URA3 TGGCGAGGTATTGGATAGTTCC
1648 MAT locus GGTATTTGCTAGAACTACACTGA
5584 MAT-alpha-Sc (399-425) GACTACTTCGCGCAACAGTATAATTTT
5585 MAT-a-Sc (324-347) AAGAAAGCAAAGCCTTAATTCCAA
A-3709 GPD1 promoter ORF terminator cloning
TTTCAAGGTACCAAACATATGCGCGCCACG
T
KpnI
A-3743 GPD1 promoter ORF terminator cloning CTACTAGGTACCATTTTGCGTCGCGCACGT
KpnI
Nucleotides in capital letters are derived from S. cerevisiae genome for homologous recombination at HOT1,
SMP1 or GPD1 locus. Sequences with underlined letters functioned as primers for amplification of the deletion
or promoter cassettes from respective plasmids (Güldner et al, 2002).

Chapter IV 153
Supplementary Table 2: Plasmids used in this study
Plasmid Description Reference
pUG6 E. coli/ vector containing, Amp+, loxP-
KanMX6-loxP disruption cassette
Güldner et al., 2002
pUG66 E. coli/ vector containing, Amp+, loxP-bleR-
loxP disruption cassette
Güldner et al., 2002
pFL39 GAL1 HO KanMX vector containing HO gene
Ycplac33 yeast shuttle vector URA3
Ycplac33 GPD1-ER7A yeast shuttle vector URA3 GPD1-ER7A
Ycplac33 gpd1L164P yeast shuttle vector URA3, gpd1L164P
Yields
Absolute yield
Relative yield
YS/ i = cifinal
(csini -cS
final )
Y% = YS/ i
segr
YS/ i
26B


Chapter V
General discussion and future perspectives

156 Chapter V
1. Application and valorisation of the project
Bioethanol is increasingly used as biofuel for transportation purposes, replacing petroleum
derived fuels. The biofuel markets boomed in recent years and its industry has grown rapidly
worldwide. Also in Europe, several bioethanol production plants have recently been
constructed and are now actively producing bioethanol. New legislation has been implied that
imposes the mandatory addition of biofuel in existing fossil fuels, and new European goals
have been established for replacement of fossil fuels by biofuels, guaranteeing steady sales
and likely further expansion of the bioethanol market and industry. Currently, wheat and to a
lesser extent corn and sugar beet, are used as substrates in the European plants. As these
substrates are also used as food an feed, there is a strong drive to replace them with
lignocellulosic wastes and dedicated energy crops. However, current lignocellulosic bio-
ethanol production processes require a large increase in efficiency and cost reduction to make
them commercially viable.
In addition to engineering dedicated yeast strains for second generation bioethanol, the
improvement of ethanol yield has been a target for strain improvement. This is valid for both
first and second generation bioethanol production. In tropical regions, sugar cane will likely
remain the substrate of choice for bioethanol production because of the high cost-efficiency of
the production process, which results in a very competitive ethanol price. However, even in
this case yield improvement is highly desirable. In fact, the high osmolarity of the sucrose
solution extracted from sugar cane, glycerol overproduction and concomitant loss in ethanol
yield is a continuous challenge. Glycerol levels in bio-ethanol production can vary between
about 1% and 6 - 7% (w/v) depending on the particular process used. Obviously, production
of 6 - 7% (w/v) glycerol means a loss of about 5% (w/v) ethanol, which is a huge loss in
economic terms. The impact of improved industrial yeast strains with lower glycerol
production and concomitantly higher ethanol yield can thus be very high. The knowledge
obtained in the present project on mutations causing reduced glycerol production and
enhanced ethanol yield is therefore of great value for the development of novel industrial
yeast strains with high conversion efficiency.
Besides that, the findings of the current work might be relevant for the enforcement of
glycerol formation and a concomitant reduction in ethanol titre. Higher glycerol levels are
desirable in wine production because they improve the mouthfeel and reduce the ethanol

Chapter V 157
concentration of the wine. Yeast strains, which exhibit this desirable trait, are currently in
very high demand in the wine industry.
2. Optimization of ethanol production
The goal of the present work was to find genetic configurations of S. cerevisiae, which
confers a ‘low glycerol’ phenotype. Glycerol synthesis is indispensible for cellular and
metabolic integrity of S. cerevisiae. Nevertheless, glycerol formation in this yeast species can
vary considerably, depending on environmental and genetic constraints implying that there is
room for engineering glycerol yield without severe effects on growth and stress tolerance
To define the minimal glycerol requirement in a fermentation process, one has to mainly
consider the nitrogen source, the availability of oxygen and the osmotic pressure (particularly
determined by sugar concentration) since these factors greatly influence redox balancing. In
fact, optimizing fermentation conditions and medium composition are important factors in
reducing by-product formation in an alcoholic fermentation process, as demonstrated in
several studies (Albers et al, 1996; Alfenore et al, 2004; Bideaux et al, 2006). Certainly, some
of the suggested improvements might be indeed readily implemented in the industrial process,
because such optimizations do not require de-novo yeast strain development construction of
novel yeast strains and they impact the ethanol industry much faster. For instance, significant
ethanol yield improvement in starch-based ethanol production was achieved through
integration of starch saccharification in the fermentation process. Running saccharification
and fermentation simultaneously has several advantages, such as the fast and complete
enzymatic hydrolysis of sugars, the prevention of high osmotic pressure and a concomitant
reduction of glycerol formation, and the inhibition of bacterial growth due to the much lower
levels of free sugar substrate. Furthermore, the incorporation of yeast propagation in the SSF
technology has also found rapid implementation in the starch-based processes due to high-
sustained ethanol yield and the lower production costs (Madson and Monceaux, 1999). In
Brazilian ethanol production, most fermentations are operated in fed-batch mode referred to
as Melle-Boinot process. The duration of one fermentation cycle is only approximately 8h,
due to the high cell density, with the yeast taking roughly one tenth of the bioreactor’s

158 Chapter V
volume. After every fermentation cycle, the yeast cells are re-used in the subsequent cycle,
avoiding strong yeast propagation and biomass formation and hence, glycerol formation.
Furthermore, slow sugar feeding keeps the sugar concentration low, thereby lowering the
osmotic pressure imposed by the sugar (Basso et al, 2011).
Apart from process optimization, genetic prerequisites were established in the yeasts for
obtaining a highly productive strain. Yeast strains have undergone a long process of selection
becoming more and more adapted to the specific applications by human activities (Sicard and
Legras, 2011). More recently, dedicated breeding programs have supported this selection
process and have put major strains forth that are used in today’s ethanol industry (Basso et al,
2008). Still, recent advances in metabolic engineering evidenced that even these highly
efficient natural production strains can be improved using targeted genetic modifications.
The present work investigated the feasibility of gradually reducing glycerol formation in S.
cerevisiae by controlling its synthesis. In considering the role of glycerol as redox sink for the
anaerobic excess NADH and as compatible solute to adapt to hyperosmotic conditions, the
cellular requirement in glycerol production clearly depends on the medium composition and
on the availability of an alternative redox sink, such as oxygen.
The key enzyme of the glycerol synthetic pathway is glycerol 3-phosphate dehydrogenase
(GPDH), encoded by GPD1 and GPD2. GPDH activity strongly relates to transcriptional
expression of GPD1 and/or GPD2. Enhanced transcription, resulting in higher GPDH
activity, is observed under osmotic stress conditions and under anaerobic conditions. The
exchange of the natural GPD1 and GPD2 promoters by lower-strength promoters deregulated
gene expression and clearly limited glycerol synthesis. However, the low expression of GPD1
and GPD2 resulted in reduced growth of the promoter replaced strains at high extra-cellular
osmolarity or anaerobic conditions similar to the growth behaviour that was observed for the
gpd1Δ gpd2Δ mutant. The GPD1 and GPD2 mutants were thoroughly characterized for
growth and product formation during both aerobic and anaerobic very high ethanol
performance fermentation (Pagliardini et al, 2013; Pagliardini et al, 2010). Under aerobic
conditions, the yeast’s growth and metabolic activity was not influenced by the low GPDH
activity and was at wild-type level in aerobic fermentation (Pagliardini et al, 2010).
Productivity and viability was maintained in spite of lowered GPDH activity. In contrast, the

Chapter V 159
same strains tested under anaerobic conditions showed strongly impaired growth and
fermentation abilities besides the reduction in glycerol yield (Pagliardini et al, 2013).
Interestingly, cell viability in the presence of high ethanol concentrations was drastically
lower under anoxic conditions, pointing out that even limited changes in minor pathways,
such as glycerol formation, impact the global cellular network. In this context, promoter
engineering provided a unique tool to estimate the glycerol demand of S. cerevisiae under
hyperosmotic or anaerobic conditions. Moreover, it allowed to investigate the metabolic and
physiological changes in yeast at low versus abolished glycerol formation. Surprisingly,
changes were not only found for the usual suspects, i.e. osmo-tolerance and redox balancing,
but also for cell viability in the presence of high ethanol concentrations.
Deletion of the genes, coding for the glycerol pathway enzymes, caused severe side-effects on
several industrially relevant traits, as was shown by inhibiting or gradually reducing glycerol
formation. Hence, future engineering approaches to reduce glycerol should allow for cellular
integrity, improving the strain in a subtle manner. Supposedly, lowering glycerol formation
requires the modification of several target genes, which are linked to this phenotype. Several
attempts focused on solving the redox imbalance, caused by glycerol reduction or
abolishment. However, complete abolishment of glycerol formation makes cells susceptible to
change in osmolarity. One way to re-establish the osmotolerant state is the replacement of
glycerol by other compatible solutes, as recently shown for trehalose (Guo et al, 2011).
Alternatively, it is possible to allow for controlled but not excessive glycerol production to
enable cellular homeostasis upon changes in osmolarity. As depicted in Figure 1, the high
osmolarity glycerol pathway in S. cerevisiae enables a multi-level control of glycerol
formation in response to high osmolarity.
The primary level of manipulation affects or interrupts the osmo-sensing or signal
transduction process. In the present work, the frameshift mutation found in Ssk1 apparently
prevents signal transduction and hence also activation of the MAPK Hog1 (Figure 1A). The
deletion of SSK1 inhibits signal transduction of the Sln1 branch but this does not result in an
osmo-sensitive state. In fact, O’Rourke and Herskowitz (2004) suggested that the Sln1-branch
operates under conditions of moderate osmolarity. Severe osmo-stress disables the sensor and
requires the activity of the Sho1-branch and the general stress response pathway (O'Rourke et
al, 2004). The SSK1 variant, ssk1E330N…K356N
, might permanently disable signal transduction

160 Chapter V
from the Sln1-branch. Still, yeast cells are able to withstand modest osmotic stress without
glycerol accumulation. The ssk1E330N…K356N
variant is therefore an interesting gene tool to
render yeast less sensitive to changes in osmolarity while activation of Hog1 only occurs
during extreme hyperosmolarity. Besides Hog1 activation, downstream signalling targets or
promoters of structural genes can be targeted to modify the induction of transcription of
GPD1 and GPP2, coding for the structural enzymes of glycerol synthesis (Figure 1B).
Figure 1 Multi-level control of high osmolarity glycerol pathway in Saccharomyces cerevisiae. Cellular
glycerol formation in response to high osmolarity can be controlled at several levels: (A) the interruption of the
osmo-sensing process or the signal transduction by Ssk1 prevents the activation of the MAPK Hog1; (B) after
Hog1 activation, GPD1 promoter replacement or the utilization of the low-activity transcriptional activators,
Hot1 or Smp1, reduces the transcription of the GDP1 gene; (C) expressing allelic variants of the glycerol 3-
phosphate dehydrogenase (GPDH) with lower activity compared to the natural GPD1 allele.

Chapter V 161
In fact, the deregulation of GPD1 transcription by promoter replacement probably disabled
the induction of its expression during hyperosmotic conditions. However, this deregulation
resulted in side-effects; hence more subtle modification is necessary to allow for cellular
integrity. Such modifications were found in the modified transcriptional activator, Hot1 or
Smp1, both required for transcriptional induction of osmo-responsive genes. There is evidence
that mutations in HOT1 significantly reduce GPD1 transcription (Rep et al, 1999); however,
it remains to be elucidated whether the mutations we found in HOT1 cause a decrease in
activity of the transcription factor.
Finally, reduction of glycerol formation in yeast is possible using low-activity variants of
glycerol 3-phosphate dehydrogenase (GPDH). The GPDH activity measured in the superior
parental strains, CBS4C and segregant 26B, was consistently lower than that in ER7A. Future
experiments should give an answer to the question whether this is due to a decreased GPD1
expression level, which result from the allelic variants of GPD1, SMP1 and HOT1.
3. Extending the toolbox for yeast metabolic engineering
Metabolic engineering, as a new engineering discipline, emerged from the objective of
developing novel microorganisms, which can better fulfil industrial requirements. Classical
approaches of strain improvement, like mutagenesis or breeding, reached their limitations,
because today’s objectives in microorganism engineering aim far beyond the natural substrate
or product range of the species itself. The implementation of new dissimilation or bio-
synthesis pathways requires an extended genetic tool set, which enables the establishment of
the phenotype relevant genetic configuration. In recent years, the genetic engineering of S.
cerevisiae has made significant progress and genetic modifications are possible in manifold
ways due to the availability of a large genetic tool set, comprising several types of expression
vectors, reporter genes and selectable or counter-selectable markers for a highly efficient
transformation (Nevoigt, 2008). Through the present work, we showed that this toolbox is still
extendable particularly with regards to tools for fine adjustment of cellular activities.
Promoter engineering and the identification of mutations defining the polygenic trait ‘low
glycerol production’ in natural strains, provide two novel avenues for the improvement of the
currently used bioethanol production yeast strains, with minimal risk of affecting other

162 Chapter V
commercially important properties of the strains. Promoter engineering is a modern advanced
tool in rational metabolic engineering and helps finding a compromise between extreme
phenotypes, in our case the desired phenotype of low glycerol production and the undesired
phenotype of growth inhibition under anaerobic conditions. The promoter replacement
cassettes (Nevoigt et al, 2006), which we have used to modify glycerol synthesis in the
CEN.PK strain family, are now available for the modification of glycerol formation in
production strains.
Besides controlling the transcription of the isoenzymes catalysing the rate-controlling step of
glycerol formation, the natural gene variants of GPD1, SMP1 and HOT1, which were found
in CBS6412 and found to be linked to the ‘low glycerol’ phenotype in this work, offer a
further potential for the fine adjustment of glycerol formation and the improvement of the
currently used production strains. The rapid and efficient identification of such mutant alleles
over the whole genome has been facilitated by development of the genetic analysis platform
‘pooled-segregant whole-genome sequence analysis’. This platform is an excellent tool for
reverse engineering of S. cerevisiae, particularly with regards to the characterization of non-
selectable quantitative traits, which undergo polygenic inheritance in yeast.
4. Designed on the drawing board: Future cell factories
Back in the early days of metabolic engineering, this discipline was defined ‘as the purposeful
modification of intermediary metabolism using recombinant DNA techniques’ (Cameron and
Tong, 1993). Such modification comprised the production improvement of host own or of
new chemicals, the extensions of the substrate range of a host organism, and the addition of
new catabolic activities. In those days, the complexity of a metabolic network was the critical
step in the implementation of the new metabolic constraints (Stephanopoulos and Sinskey,
1993). Today, powerful experimental and mathematical methods are available to determine
this network, allowing for the precise quantification of in vivo fluxes and the subsequent
identification of critical nodes in the metabolic networks. As a relatively young scientific
discipline, metabolic engineering currently revolutionizes chemical manufacturing, using
knowledge on cellular metabolism for the production of valuable chemicals. So far, the re-
engineering of existing organisms has been the prime goal of metabolic engineering. Beyond

Chapter V 163
that, what are the future challenges in metabolic engineering and towards which future is this
discipline heading? Generally, the goal of many engineering disciplines is the creation of new
products, which are helpful in our daily life. For instance the invention of the steam engine or
fuel engines was revolutionary in the sense, that it replaced the force of humans or animals by
a physical or a chemical process for the generation of the necessary force for movements.
Accordingly, the creation of new ‘molecular machines’ may allow us to manufacture nano-
molecular products far beyond human visibility. First steps are made by Gibson and
colleagues (2010), which recently synthesized and assembled the genome of Mycoplasma
mycoides and Voigt and co-workers (Moon et al, 2012), which aims to implement genetic
programs to control the metabolic networks, similar to circuits in electronics. Our future
microbial production strains might soon be designed on the drawing board as a ‘cell factory’,
perfectly suited for its purpose.


References

166 References
Akada R, Hirosawa I, Kawahata M, Hoshida H, Nishizawa Y (2002) Sets of integrating plasmids and gene disruption
cassettes containing improved counter-selection markers designed for repeated use in budding yeast. Yeast 19: 393-402.
Akada R, Matsuo K, Aritomi K, Nishizawa Y (1999) Construction of recombinant sake yeast containing a dominant
FAS2 mutation without extraneous sequences by a two-step gene replacement protocol. J Biosci Bioeng 87: 43-48.
Albers E, Larsson C, Liden G, Niklasson C, Gustafsson L (1996) Influence of the nitrogen source on Saccharomyces
cerevisiae anaerobic growth and product formation. Appl Environ Microbiol 62: 3187-3195.
Albertyn J, Hohmann S, Thevelein JM, Prior BA (1994) GPD1, which encodes glycerol-3-phosphate dehydrogenase, is
essential for growth under osmotic stress in Saccharomyces cerevisiae, and its expression is regulated by the high-
osmolarity glycerol response pathway. Mol Cell Biol 14: 4135-4144.
Aldiguier AS, Alfenore S, Cameleyre X, Goma G, Uribelarrea JL, Guillouet SE, Molina-Jouve C (2004) Synergistic
temperature and ethanol effect on Saccharomyces cerevisiae dynamic behaviour in ethanol bio-fuel production.
Bioprocess Biosyst Eng 26: 217-222.
Alepuz PM, de Nadal E, Zapater M, Ammerer G, Posas F (2003) Osmostress-induced transcription by Hot1 depends on a
Hog1-mediated recruitment of the RNA Pol II. EMBO J 22: 2433-2442.
Alepuz PM, Jovanovic A, Reiser V, Ammerer G (2001) Stress-induced map kinase Hog1 is part of transcription
activation complexes. Mol Cell 7: 767-777.
Alexander MR, Tyers M, Perret M, Craig BM, Fang KS, Gustin MC (2001) Regulation of cell cycle progression by
Swe1p and Hog1p following hypertonic stress. Mol Biol Cell 12: 53-62.
Alfenore S, Cameleyre X, Benbadis L, Bideaux C, Uribelarrea JL, Goma G, Molina-Jouve C, Guillouet SE (2004)
Aeration strategy: a need for very high ethanol performance in Saccharomyces cerevisiae fed-batch process. Appl
Microbiol Biotechnol 63: 537-542.
Alfenore S, Molina-Jouve C, Guillouet SE, Uribelarrea JL, Goma G, Benbadis L (2002) Improving ethanol production
and viability of Saccharomyces cerevisiae by a vitamin feeding strategy during fed-batch process. Appl Microbiol
Biotechnol 60: 67-72.
Alper H, Fischer C, Nevoigt E, Stephanopoulos G (2005) Tuning genetic control through promoter engineering. Proc
Natl Acad Sci U S A 102: 12678-12683.
Alper H, Moxley J, Nevoigt E, Fink GR, Stephanopoulos G (2006) Engineering yeast transcription machinery for
improved ethanol tolerance and production. Science 314: 1565-1568.
Alper H, Stephanopoulos G (2007) Global transcription machinery engineering: a new approach for improving cellular
phenotype. Metab Eng 9: 258-267.
Ambroset C, Petit M, Brion C, Sanchez I, Delobel P, Guerin C, Chiapello H, Nicolas P, Bigey F, Dequin S, Blondin B
(2011) Deciphering the molecular basis of wine yeast fermentation traits using a combined genetic and genomic
approach. G3 (Bethesda) 1: 263-281.
Anderlund M, Nissen TL, Nielsen J, Villadsen J, Rydstrom J, Hahn-Hagerdal B, Kielland-Brandt MC (1999) Expression
of the Escherichia coli pntA and pntB genes, encoding nicotinamide nucleotide transhydrogenase, in Saccharomyces
cerevisiae and its effect on product formation during anaerobic glucose fermentation. Appl Environ Microbiol 65: 2333-
2340.
Anderson RM, Bitterman KJ, Wood JG, Medvedik O, Cohen H, Lin SS, Manchester JK, Gordon JI, Sinclair DA (2002)
Manipulation of a nuclear NAD+ salvage pathway delays aging without altering steady-state NAD+ levels. J Biol Chem
277: 18881-18890.
Andre L, Hemming A, Adler L (1991) Osmoregulation in Saccharomyces cerevisiae. Studies on the osmotic induction of
glycerol production and glycerol-3-phosphate dehydrogenase (NAD+). FEBS Lett 286: 13-17.
Ansell R, Granath K, Hohmann S, Thevelein JM, Adler L (1997) The two isoenzymes for yeast NAD+-dependent
glycerol 3-phosphate dehydrogenase encoded by GPD1 and GPD2 have distinct roles in osmoadaptation and redox
regulation. Embo J 16: 2179-2187.
References 167
Arshad M, Khan ZM, Khalil ur R, Shah FA, Rajoka MI (2008) Optimization of process variables for minimization of
byproduct formation during fermentation of blackstrap molasses to ethanol at industrial scale. Lett Appl Microbiol 47:
410-414.
Bai FW, Anderson WA, Moo-Young M (2008) Ethanol fermentation technologies from sugar and starch feedstocks.
Biotechnol Adv 26: 89-105.
Bailey JE (1991) Toward a science of metabolic engineering. Science 252: 1668-1675.
Bailey JE, Sburlati A, Hatzimanikatis V, Lee K, Renner WA, Tsai PS (1996) Inverse metabolic engineering: A strategy
for directed genetic engineering of useful phenotypes. Biotechnol Bioeng 52: 109-121.
Bakker BM, Overkamp KM, van Maris AJ, Kotter P, Luttik MA, van Dijken JP, Pronk JT (2001) Stoichiometry and
compartmentation of NADH metabolism in Saccharomyces cerevisiae. FEMS Microbiol Rev 25: 15-37.
Barnett JA (2003) Beginnings of microbiology and biochemistry: the contribution of yeast research. Microbiology 149:
557-567.
Basso LC, Basso TO, Rocha SN (eds) (2011) Ethanol Production in Brazil: The Industrial Process and Its Impact on
Yeast Fermentation, Biofuel Production-Recent Developments and Prospects: InTech.
Basso LC, de Amorim HV, de Oliveira AJ, Lopes ML (2008) Yeast selection for fuel ethanol production in Brazil. FEMS
Yeast Res 8: 1155-1163.
Beavis W (1998) QTL analyses: Power, precision, and accuracy. In Molecular Dissection of Complex Traits, Paterson
AH (ed), pp 145-161: CRC PressINC.
Bideaux C, Alfenore S, Cameleyre X, Molina-Jouve C, Uribelarrea JL, Guillouet SE (2006) Minimization of glycerol
production during the high-performance fed-batch ethanolic fermentation process in Saccharomyces cerevisiae, using a
metabolic model as a prediction tool. Appl Environ Microbiol 72: 2134-2140.
Bilsland-Marchesan E, Arino J, Saito H, Sunnerhagen P, Posas F (2000) Rck2 kinase is a substrate for the osmotic stress-
activated mitogen-activated protein kinase Hog1. Mol Cell Biol 20: 3887-3895.
Birkeland SR, Jin N, Ozdemir AC, Lyons RH, Jr., Weisman LS, Wilson TE (2010) Discovery of mutations in
Saccharomyces cerevisiae by pooled linkage analysis and whole-genome sequencing. Genetics 186: 1127-1137.
Bjorkqvist S, Ansell R, Adler L, Liden G (1997) Physiological response to anaerobicity of glycerol-3-phosphate
dehydrogenase mutants of Saccharomyces cerevisiae. Appl Environ Microbiol 63: 128-132.
Blomberg A (2000) Metabolic surprises in Saccharomyces cerevisiae during adaptation to saline conditions: questions,
some answers and a model. FEMS Microbiol Lett 182: 1-8.
Blomberg A, Adler L (1989) Roles of glycerol and glycerol-3-phosphate dehydrogenase (NAD+) in acquired
osmotolerance of Saccharomyces cerevisiae. J Bacteriol 171: 1087-1092.
Boender LG, de Hulster EA, van Maris AJ, Daran-Lapujade PA, Pronk JT (2009) Quantitative physiology of
Saccharomyces cerevisiae at near-zero specific growth rates. Appl Environ Microbiol 75: 5607-5614.
Boles E, Lehnert W, Zimmermann FK (1993) The role of the NAD-dependent glutamate dehydrogenase in restoring
growth on glucose of a Saccharomyces cerevisiae phosphoglucose isomerase mutant. Eur J Biochem 217: 469-477.
Boulahya (2005) Evaluation des potentialités fermentaires de souches mutées de S. cerevisiae en vue d'une production
nulle de glycérol dans une fermentation éthanolique. Université de Toulouse, INSA Toulouse, France.
Bouwman J, Kiewiet J, Lindenbergh A, van Eunen K, Siderius M, Bakker BM (2011) Metabolic regulation rather than de
novo enzyme synthesis dominates the osmo-adaptation of yeast. Yeast 28: 43-53.
Brem RB, Yvert G, Clinton R, Kruglyak L (2002) Genetic dissection of transcriptional regulation in budding yeast.
Science 296: 752-755.
Brewster J, de Valoir T, Dwyer N, Winter E, Gustin M (1993) An osmosensing signal transduction pathway in yeast.
Science 259: 1760-1763.

168 References
Bro C, Regenberg B, Forster J, Nielsen J (2006) In silico aided metabolic engineering of Saccharomyces cerevisiae for
improved bioethanol production. Metab Eng 8: 102-111.
Brookfield JF (2012) Heritability. Curr Biol 22: R217-219.
Brown AD (1978) Compatible solutes and extreme water stress in eukaryotic micro-organisms. Adv Microb Physiol 17:
181-242.
Buchner H (1897) Die Bedeutung der aktiven löslichen Zellprodukte für den Chemismus der Zelle. Münchener,
Medizinische Wochenschrift 44: 299–302, 321–322.
Camarasa C, Sanchez I, Brial P, Bigey F, Dequin S (2011) Phenotypic landscape of Saccharomyces cerevisiae during
wine fermentation: evidence for origin-dependent metabolic traits. PLoS One 6: e25147.
Cambon B, Monteil V, Remize F, Camarasa C, Dequin S (2006) Effects of GPD1 overexpression in Saccharomyces
cerevisiae commercial wine yeast strains lacking ALD6 genes. Appl Environ Microbiol 72: 4688-4694.
Cameron DC, Tong IT (1993) Cellular and metabolic engineering. An overview. Appl Biochem Biotechnol 38: 105-140.
Cao L, Zhang A, Kong Q, Xu X, Josine TL, Chen X (2007) Overexpression of GLT1 in fps1DeltagpdDelta mutant for
optimum ethanol formation by Saccharomyces cerevisiae. Biomol Eng 24: 638-642.
Costenoble R, Valadi H, Gustafsson L, Niklasson C, Franzen CJ (2000) Microaerobic glycerol formation in
Saccharomyces cerevisiae. Yeast 16: 1483-1495.
Cot M, Loret MO, Francois J, Benbadis L (2007) Physiological behaviour of Saccharomyces cerevisiae in aerated fed-
batch fermentation for high level production of bioethanol. FEMS Yeast Res 7: 22-32.
Crabtree HG (1928) The carbohydrate metabolism of certain pathological overgrowths. Biochem J 22: 1289-1298.
Cronwright GR, Rohwer JM, Prior BA (2002) Metabolic control analysis of glycerol synthesis in Saccharomyces
cerevisiae. Appl Environ Microbiol 68: 4448-4456.
D'Amato ME, Ehrenreich L, Cloete K, Benjeddou M, Davison S (2010) Characterization of the highly discriminatory loci
DYS449, DYS481, DYS518, DYS612, DYS626, DYS644 and DYS710. Forensic Sci Int Genet 4: 104-110.
Darku ID, Richard TL (2001) Biofuels: Ethanol Producers. In eLS: John Wiley & Sons, Ltd.
de Nadal E, Alepuz PM, Posas F (2002) Dealing with osmostress through MAP kinase activation. EMBO Rep 3: 735-
740.
de Nadal E, Casadome L, Posas F (2003) Targeting the MEF2-like transcription factor Smp1 by the stress-activated Hog1
mitogen-activated protein kinase. Mol Cell Biol 23: 229-237.
de Nadal E, Posas F (2010) Multilayered control of gene expression by stress-activated protein kinases. EMBO J 29: 4-
13.
de Nadal E, Posas F (2011) Elongating under Stress. Genet Res Int 2011: 326286.
De Nadal E, Zapater M, Alepuz PM, Sumoy L, Mas G, Posas F (2004) The MAPK Hog1 recruits Rpd3 histone
deacetylase to activate osmoresponsive genes. Nature 427: 370-374.
Demogines A, Smith E, Kruglyak L, Alani E (2008) Identification and dissection of a complex DNA repair sensitivity
phenotype in Baker's yeast. PLoS Genet 4: e1000123.
Dequin S, Casaregola S (2011) The genomes of fermentative Saccharomyces. C R Biol 334: 687-693.
Deutschbauer AM, Davis RW (2005) Quantitative trait loci mapped to single-nucleotide resolution in yeast. Nat Genet
37: 1333-1340.
Devantier R, Scheithauer B, Villas-Boas SG, Pedersen S, Olsson L (2005) Metabolite profiling for analysis of yeast stress
response during very high gravity ethanol fermentations. Biotechnol Bioeng 90: 703-714.

References 169
Dihazi H, Kessler R, Eschrich K (2004) High osmolarity glycerol (HOG) pathway-induced phosphorylation and
activation of 6-phosphofructo-2-kinase are essential for glycerol accumulation and yeast cell proliferation under
hyperosmotic stress. J Biol Chem 279: 23961-23968.
Dodou E, Treisman R (1997) The Saccharomyces cerevisiae MADS-box transcription factor Rlm1 is a target for the
Mpk1 mitogen-activated protein kinase pathway. Mol Cell Biol 17: 1848-1859.
Donalies UE, Nguyen HT, Stahl U, Nevoigt E (2008) Improvement of Saccharomyces yeast strains used in brewing,
wine making and baking. Adv Biochem Eng Biotechnol 111: 67-98.
Dos Santos MA (1997) Energy analysis of crops used for producing ethanol and CO2 emissions. The International
Virtual Institute of Global Change (IVIG) availabe at http://wwwivigcoppeufrjbr.
Douglas Crabb W, Mitchinson C (1997) Enzymes involved in the processing of starch to sugars. Trends in biotechnology
15: 349-352.
Duitama J, Srivastava P, Mandoiu I (2012) Towards accurate detection and genotyping of expressed variants from whole
transcriptome sequencing data. BMC Genomics 13: S6.
Duitama J, Srivastava PK, Ma, x, ndoiu II (2011) Towards accurate detection and genotyping of expressed variants from
whole transcriptome sequencing data. In Computational Advances in Bio and Medical Sciences (ICCABS), 2011 IEEE 1st
International Conference on pp 87-92.
Dujon B (1996) The yeast genome project: what did we learn? Trends Genet 12: 263-270.
Duong CT, Strack L, Futschik M, Katou Y, Nakao Y, Fujimura T, Shirahige K, Kodama Y, Nevoigt E Identification of
Sc-type ILV6 as a target to reduce diacetyl formation in lager brewers' yeast. Metab Eng 13: 638-647.
Edgley M, Brown AD (1983) Yeast Water Relations: Physiological Changes Induced by Solute Stress in Saccharomyces
cerevisiae and Saccharomyces rouxii. Journal of General Microbiology 129: 3453-3463.
Eglinton JM, Heinrich AJ, Pollnitz AP, Langridge P, Henschke PA, de Barros Lopes M (2002) Decreasing acetic acid
accumulation by a glycerol overproducing strain of Saccharomyces cerevisiae by deleting the ALD6 aldehyde
dehydrogenase gene. Yeast 19: 295-301.
Ehrenreich IM, Torabi N, Jia Y, Kent J, Martis S, Shapiro JA, Gresham D, Caudy AA, Kruglyak L (2010) Dissection of
genetically complex traits with extremely large pools of yeast segregants. Nature 464: 1039-1042.
Ehsani M, Fernandez MR, Biosca JA, Julien A, Dequin S (2009) Engineering of 2,3-butanediol dehydrogenase to reduce
acetoin formation by glycerol-overproducing, low-alcohol Saccharomyces cerevisiae. Appl Environ Microbiol 75: 3196-
3205.
Eriksson P, Andre L, Ansell R, Blomberg A, Adler L (1995) Cloning and characterization of GPD2, a second gene
encoding sn-glycerol 3-phosphate dehydrogenase (NAD+) in Saccharomyces cerevisiae, and its comparison with GPD1.
Mol Microbiol 17: 95-107.
EU (2003) DIRECTIVE 2003/30/EC OF THE EUROPEAN PARLIAMENT AND OF THE COUNCIL of 8 May 2003
on the promotion of the use of biofuels or other renewable fuels for transport. Official Journal of the European Union.
F.O.Licht's (2013) World Ethanol & Biofuels Report. 11.
FAO (2006) Food Outlook Global Market Analysis.
FAO (2008) The State of Food and Agriculture; Biofuels: prospects, risks and opportunities.
Farrell AE, Plevin RJ, Turner BT, Jones AD, O'Hare M, Kammen DM (2006) Ethanol can contribute to energy and
environmental goals. Science 311: 506-508.
Ferreira C, van Voorst F, Martins A, Neves L, Oliveira R, Kielland-Brandt MC, Lucas C, Brandt A (2005) A member of
the sugar transporter family, Stl1p is the glycerol/H+ symporter in Saccharomyces cerevisiae. Mol Biol Cell 16: 2068-
2076.
Ferrigno P, Posas F, Koepp D, Saito H, Silver PA (1998) Regulated nucleo/cytoplasmic exchange of HOG1 MAPK
requires the importin beta homologs NMD5 and XPO1. EMBO J 17: 5606-5614.

170 References
Fischer CR, Alper H, Nevoigt E, Jensen KL, Stephanopoulos G (2006) Response to Hammer et al.: Tuning genetic
control--importance of thorough promoter characterization versus generating promoter diversity. Trends Biotechnol 24:
55-56.
Fischer CR, Klein-Marcuschamer D, Stephanopoulos G (2008) Selection and optimization of microbial hosts for biofuels
production. Metab Eng 10: 295-304.
Fischer E (1894) Synthesen in der Zuckergruppe II. Berichte der deutschen chemischen Gesellschaft 27: 3189-3232.
Fischer E, Thierfelder H (1894) Verhalten der verschiedenen Zucker gegen reine Hefen. Ber Dtsch Chem Ges 27: 2031–
2037.
Forsburg SL, Nurse P (1991) Cell cycle regulation in the yeasts Saccharomyces cerevisiae and Schizosaccharomyces
pombe. Annu Rev Cell Biol 7: 227-256.
Galbe M, Sassner P, Wingren A, Zacchi G (2007) Process engineering economics of bioethanol production. Adv Biochem
Eng Biotechnol 108: 303-327.
Galibert F, Alexandraki D, Baur A, Boles E, Chalwatzis N, Chuat JC, Coster F, Cziepluch C, De Haan M, Domdey H,
Durand P, Entian KD, Gatius M, Goffeau A, Grivell LA, Hennemann A, Herbert CJ, Heumann K, Hilger F, Hollenberg
CP, Huang ME, Jacq C, Jauniaux JC, Katsoulou C, Karpfinger-Hartl L, et al. (1996) Complete nucleotide sequence of
Saccharomyces cerevisiae chromosome X. Embo J 15: 2031-2049.
Gancedo C, Gancedo JM, Sols A (1968) Glycerol metabolism in yeasts. Pathways of utilization and production. Eur J
Biochem 5: 165-172.
Gardner N, Rodrigue N, Champagne CP (1993) Combined effects of sulfites, temperature, and agitation time on
production of glycerol in grape juice by Saccharomyces cerevisiae. Appl Environ Microbiol 59: 2022-2028.
Gasch AP, Spellman PT, Kao CM, Carmel-Harel O, Eisen MB, Storz G, Botstein D, Brown PO (2000) Genomic
expression programs in the response of yeast cells to environmental changes. Mol Biol Cell 11: 4241-4257.
Gay-Lussac JL (1810) Extrait d'une mémoire sur la fermentation. Ann Chim 76: 245–259.
Geertman JM, van Dijken JP, Pronk JT (2006) Engineering NADH metabolism in Saccharomyces cerevisiae: formate as
an electron donor for glycerol production by anaerobic, glucose-limited chemostat cultures. FEMS Yeast Res 6: 1193-
1203.
Geertman JM, van Maris AJ, van Dijken JP, Pronk JT (2006) Physiological and genetic engineering of cytosolic redox
metabolism in Saccharomyces cerevisiae for improved glycerol production. Metab Eng 8: 532-542.
Geijer C, Ahmadpour D, Palmgren M, Filipsson C, Klein DM, Tamas MJ, Hohmann S, Lindkvist-Petersson K (2012)
Yeast aquaglyceroporins use the transmembrane core to restrict glycerol transport. J Biol Chem 287: 23562-23570.
Gervais P, Beney L (2001) Osmotic mass transfer in the yeast Saccharomyces cerevisiae. Cell Mol Biol (Noisy-le-grand)
47: 831-839.
Giaever G, Chu AM, Ni L, Connelly C, Riles L, Veronneau S, Dow S, Lucau-Danila A, Anderson K, Andre B, Arkin
AP, Astromoff A, El-Bakkoury M, Bangham R, Benito R, Brachat S, Campanaro S, Curtiss M, Davis K, Deutschbauer
A, Entian KD, Flaherty P, Foury F, Garfinkel DJ, Gerstein M, Gotte D, Guldener U, Hegemann JH, Hempel S, Herman
Z, Jaramillo DF, Kelly DE, Kelly SL, Kotter P, LaBonte D, Lamb DC, Lan N, Liang H, Liao H, Liu L, Luo C, Lussier M,
Mao R, Menard P, Ooi SL, Revuelta JL, Roberts CJ, Rose M, Ross-Macdonald P, Scherens B, Schimmack G, Shafer B,
Shoemaker DD, Sookhai-Mahadeo S, Storms RK, Strathern JN, Valle G, Voet M, Volckaert G, Wang CY, Ward TR,
Wilhelmy J, Winzeler EA, Yang Y, Yen G, Youngman E, Yu K, Bussey H, Boeke JD, Snyder M, Philippsen P, Davis
RW, Johnston M (2002) Functional profiling of the Saccharomyces cerevisiae genome. Nature 418: 387-391.
Gibson DG, Glass JI, Lartigue C, Noskov VN, Chuang R-Y, Algire MA, Benders GA, Montague MG, Ma L, Moodie
MM, Merryman C, Vashee S, Krishnakumar R, Assad-Garcia N, Andrews-Pfannkoch C, Denisova EA, Young L, Qi Z-
Q, Segall-Shapiro TH, Calvey CH, Parmar PP, Hutchison CA, Smith HO, Venter JC (2010) Creation of a Bacterial Cell
Controlled by a Chemically Synthesized Genome. Science 329: 52-56.
Gietz D, St Jean A, Woods RA, Schiestl RH (1992) Improved method for high efficiency transformation of intact yeast
cells. Nucleic Acids Res 20: 1425.

References 171
Gietz RD, Schiestl RH (1991) Applications of high efficiency lithium acetate transformation of intact yeast cells using
single-stranded nucleic acids as carrier. Yeast 7: 253-263.
Gietz RD, Schiestl RH (1991) Applications of high efficiency lithium acetate transformation of intact yeast cells using
single-stranded nucleic acids as carrier. Yeast 7: 253-263.
Gietz RD, Schiestl RH (2007) High-efficiency yeast transformation using the LiAc/SS carrier DNA/PEG method. Nat
Protoc 2: 31-34.
Goffeau A, Barrell BG, Bussey H, Davis RW, Dujon B, Feldmann H, Galibert F, Hoheisel JD, Jacq C, Johnston M, Louis
EJ, Mewes HW, Murakami Y, Philippsen P, Tettelin H, Oliver SG (1996) Life with 6000 genes. Science 274: 546-&.
Grant WD (2004) Life at low water activity. Philos Trans R Soc Lond B Biol Sci 359: 1249-1266; discussion 1266-1247.
Guadalupe Medina V, Almering MJ, van Maris AJ, Pronk JT (2010) Elimination of glycerol production in anaerobic
cultures of a Saccharomyces cerevisiae strain engineered to use acetic acid as an electron acceptor. Appl Environ
Microbiol 76: 190-195.
Gueldener U, Heinisch J, Koehler GJ, Voss D, Hegemann JH (2002) A second set of loxP marker cassettes for Cre-
mediated multiple gene knockouts in budding yeast. Nucleic Acids Res 30: e23.
Guo W, Adams V, Mason J, McCabe ER (1997) Identification of a ferritin light chain pseudogene near the glycerol
kinase locus in Xp21 by cDNA amplification for identification of genomic expressed sequences. Biochem Mol Med 60:
169-173.
Guo W, Lovell RS, Zhang YH, Huang BL, Burris TP, Craigen WJ, McCabe ER (1996) Ahch, the mouse homologue of
DAX1: cloning, characterization and synteny with GyK, the glycerol kinase locus. Gene 178: 31-34.
Guo W, Worley K, Adams V, Mason J, Sylvester-Jackson D, Zhang YH, Towbin JA, Fogt DD, Madu S, Wheeler DA, et
al. (1993) Genomic scanning for expressed sequences in Xp21 identifies the glycerol kinase gene. Nat Genet 4: 367-372.
Guo X, Huang Z, Szoka FC (2004) Improved preparation of PEG-diortho ester-diacyl glycerol conjugates. Methods
Enzymol 387: 147-152.
Guo X, Zhuge B, Zhuge J (2002) [Research progress on the glycerol kinase]. Wei Sheng Wu Xue Bao 42: 510-513.
Guo ZP, Zhang L, Ding ZY, Shi GY (2011) Minimization of glycerol synthesis in industrial ethanol yeast without
influencing its fermentation performance. Metab Eng 13: 49-59.
Guo ZP, Zhang L, Ding ZY, Wang ZX, Shi GY (2009) Interruption of glycerol pathway in industrial alcoholic yeasts to
improve the ethanol production. Appl Microbiol Biotechnol 82: 287-292.
Guo ZP, Zhang L, Ding ZY, Wang ZX, Shi GY (2010) Improving ethanol productivity by modification of glycolytic
redox factor generation in glycerol-3-phosphate dehydrogenase mutants of an industrial ethanol yeast. J Ind Microbiol
Biotechnol.
Guo ZP, Zhang L, Ding ZY, Wang ZX, Shi GY (2011) Improving ethanol productivity by modification of glycolytic
redox factor generation in glycerol-3-phosphate dehydrogenase mutants of an industrial ethanol yeast. J Ind Microbiol
Biotechnol 38: 935-943.
Harden A, Young WJ (1905) The influence of phosphates on the fermentation of glucose by yeast-juice: preliminary
communication. Proc Chem Soc (London) 21: 189–191.
Hermann BG, Patel M (2007) Today's and tomorrow's bio-based bulk chemicals from white biotechnology: a techno-
economic analysis. Appl Biochem Biotechnol 136: 361-388.
Heux S, Sablayrolles JM, Cachon R, Dequin S (2006) Engineering a Saccharomyces cerevisiae wine yeast that exhibits
reduced ethanol production during fermentation under controlled microoxygenation conditions. Appl Environ Microbiol
72: 5822-5828.
Hoffman CS, Winston F (1987) A ten-minute DNA preparation from yeast efficiently releases autonomous plasmids for
transformation of Escherichia coli. Gene 57: 267-272.

172 References
Hohmann S (2002) Osmotic stress signaling and osmoadaptation in yeasts. Microbiol Mol Biol Rev 66: 300-372.
Hohmann S (2009) Control of high osmolarity signalling in the yeast Saccharomyces cerevisiae. FEBS Lett 583: 4025-
4029.
Holst B, Lunde C, Lages F, Oliveira R, Lucas C, Kielland-Brandt MC (2000) GUP1 and its close homologue GUP2,
encoding multimembrane-spanning proteins involved in active glycerol uptake in Saccharomyces cerevisiae. Mol
Microbiol 37: 108-124.
Homer N, Merriman B, Nelson SF (2009) BFAST: an alignment tool for large scale genome resequencing. PLoS One 4:
e7767.
Hong KK, Nielsen J (2012) Metabolic engineering of Saccharomyces cerevisiae: a key cell factory platform for future
biorefineries. Cell Mol Life Sci 69: 2671-2690.
Hubmann G, Guillouet S, Nevoigt E (2011) Gpd1 and Gpd2 fine-tuning for sustainable reduction of glycerol formation in
Saccharomyces cerevisiae. Appl Environ Microbiol 77: 5857-5867.
Huxley C, Green ED, Dunham I (1990) Rapid assessment of S. cerevisiae mating type by PCR. Trends Genet 6: 236.
Jacques KA, Lyons TP, Kelsall DR (eds) (2003) The alcohol textbook - a reference for the beverage, fuel and industrial
alcohol industries. Nottingham: Nottingham University Press.
Jain VK, Divol B, Prior BA, Bauer FF (2011) Elimination of glycerol and replacement with alternative products in
ethanol fermentation by Saccharomyces cerevisiae. J Ind Microbiol Biotechnol 38: 1427-1435.
Johnston CG, Aust SD (1994) Detection of Phanerochaete chrysosporium in soil by PCR and restriction enzyme analysis.
Appl Environ Microbiol 60: 2350-2354.
Jones AM, Ingledew WM (1994) Fuel alcohol production: appraisal of nitrogenous yeast foods for very high gravity
wheat mash fermentation. Process Biochemistry 29: 483-488.
Jung JY, Kim TY, Ng CY, Oh MK (2012) Characterization of GCY1 in Saccharomyces cerevisiae by metabolic
profiling. J Appl Microbiol 113: 1468-1478.
Jung S, Marelli M, Rachubinski RA, Goodlett DR, Aitchison JD (2010) Dynamic changes in the subcellular distribution
of Gpd1p in response to cell stress. J Biol Chem 285: 6739-6749.
Kelsall DR, Lyons TP (2003) Grain dry milling and cooking procedures: extracting sugars in preparation for
fermentation. In The Alcohol Textbook - A reference for the beverage, fuel and industrial alcohol industries, 4th ed., pp
9-21. Nottingham: Nottingham University Press.
Kleijn RJ, Geertman JM, Nfor BK, Ras C, Schipper D, Pronk JT, Heijnen JJ, van Maris AJ, van Winden WA (2007)
Metabolic flux analysis of a glycerol-overproducing Saccharomyces cerevisiae strain based on GC-MS, LC-MS and
NMR-derived C-labelling data. FEMS Yeast Res 7: 216-231.
Koizumi T (2003) The Brazilian ethanol programme: impacts on world ethanol and sugar markets. FAO comodity and
trade policy research working paper No.1.
Kong QX, Cao LM, Zhang AL, Chen X (2007) Overexpressing GLT1 in gpd1Delta mutant to improve the production of
ethanol of Saccharomyces cerevisiae. Appl Microbiol Biotechnol 73: 1382-1386.
Kong QX, Gu JG, Cao LM, Zhang AL, Chen X, Zhao XM (2006) Improved production of ethanol by deleting FPS1 and
over-expressing GLT1 in Saccharomyces cerevisiae. Biotechnol Lett 28: 2033-2038.
Kong QX, Zhang AL, Cao LM, Chen X (2007) Over-expressing GLT1 in a gpd2Delta mutant of Saccharomyces
cerevisiae to improve ethanol production. Appl Microbiol Biotechnol 75: 1361-1366.
Kotaka A, Sahara H, Kondo A, Ueda M, Hata Y (2009) Efficient generation of recessive traits in diploid sake yeast by
targeted gene disruption and loss of heterozygosity. Appl Microbiol Biotechnol 82: 387-395.
Kuhn C, Petelenz E, Nordlander B, Schaber J, Hohmann S, Klipp E (2008) Exploring the impact of osmoadaptation on
glycolysis using time-varying response-coefficients. Genome Inform 20: 77-90.

References 173
Kumar P, Barrett DM, Delwiche MJ, Stroeve P (2009) Methods for Pretreatment of Lignocellulosic Biomass for Efficient
Hydrolysis and Biofuel Production. Industrial & Engineering Chemistry Research 48: 3713-3729.
Lages F, Silva-Graca M, Lucas C (1999) Active glycerol uptake is a mechanism underlying halotolerance in yeasts: a
study of 42 species. Microbiology 145 ( Pt 9): 2577-2585.
Larsson K, Ansell R, Eriksson P, Adler L (1993) A gene encoding sn-glycerol 3-phosphate dehydrogenase (NAD+)
complements an osmosensitive mutant of Saccharomyces cerevisiae. Mol Microbiol 10: 1101-1111.
Lavoisier AL (1789) Traité Élémentaire de Chimie. Paris: Cuchet [Translated by R Kerr (1790) as Elements of
Chemistry Edinburgh: Creech].
Liden G, Walfridsson M, Ansell R, Anderlund M, Adler L, Hahn-Hagerdal B (1996) A glycerol-3-phosphate
dehydrogenase-deficient mutant of Saccharomyces cerevisiae expressing the heterologous XYL1 gene. Appl Environ
Microbiol 62: 3894-3896.
Lin SJ, Guarente L (2003) Nicotinamide adenine dinucleotide, a metabolic regulator of transcription, longevity and
disease. Curr Opin Cell Biol 15: 241-246.
Lin Y, Tanaka S (2006) Ethanol fermentation from biomass resources: current state and prospects. Appl Microbiol
Biotechnol 69: 627-642.
Luttik MA, Overkamp KM, Kotter P, de Vries S, van Dijken JP, Pronk JT (1998) The Saccharomyces cerevisiae NDE1
and NDE2 genes encode separate mitochondrial NADH dehydrogenases catalyzing the oxidation of cytosolic NADH. J
Biol Chem 273: 24529-24534.
Luyten K, Albertyn J, Skibbe WF, Prior BA, Ramos J, Thevelein JM, Hohmann S (1995) Fps1, a yeast member of the
MIP family of channel proteins, is a facilitator for glycerol uptake and efflux and is inactive under osmotic stress. Embo J
14: 1360-1371.
Mabee WE (2007) Policy options to support biofuel production. Adv Biochem Eng Biotechnol 108: 329-357.
Madson PW, Monceaux DA (1999) Fuel ethanol production. In The Alcohol Textbook. A Reference for the Beverage,
Fuel and Industrial Alcohol Industries, Jacques KA, Lyons TP, Kelsall DR (eds), third ed. edn, pp 257–268. Nottingham,
UK: Nottingham University Press.
Maeda T, Takekawa M, Saito H (1995) Activation of yeast PBS2 MAPKK by MAPKKKs or by binding of an SH3-
containing osmosensor. Science 269: 554-558.
Maeda T, Watanabe Y, Kunitomo H, Yamamoto M (1994) Cloning of the pka1 gene encoding the catalytic subunit of the
cAMP-dependent protein kinase in Schizosaccharomyces pombe. J Biol Chem 269: 9632-9637.
Maeda T, Wurgler-Murphy SM, Saito H (1994) A two-component system that regulates an osmosensing MAP kinase
cascade in yeast. Nature 369: 242-245.
Marchler-Bauer A, Anderson JB, Chitsaz F, Derbyshire MK, DeWeese-Scott C, Fong JH, Geer LY, Geer RC, Gonzales
NR, Gwadz M, He S, Hurwitz DI, Jackson JD, Ke Z, Lanczycki CJ, Liebert CA, Liu C, Lu F, Lu S, Marchler GH,
Mullokandov M, Song JS, Tasneem A, Thanki N, Yamashita RA, Zhang D, Zhang N, Bryant SH (2009) CDD: specific
functional annotation with the Conserved Domain Database. Nucleic Acids Research 37: D205-D210.
MarketLine (2012) Alcoholic Drinks: Global Industry Guide. http://wwwjust-drinkscom/market-research/alcoholic-
drinks-global-industry-guide_id138428aspx.
Martinez-Montanes F, Pascual-Ahuir A, Proft M (2010) Toward a genomic view of the gene expression program
regulated by osmostress in yeast. OMICS 14: 619-627.
Martinez-Pastor MT, Marchler G, Schuller C, Marchler-Bauer A, Ruis H, Estruch F (1996) The Saccharomyces
cerevisiae zinc finger proteins Msn2p and Msn4p are required for transcriptional induction through the stress response
element (STRE). EMBO J 15: 2227-2235.
Mettetal JT, Muzzey D, Gomez-Uribe C, van Oudenaarden A (2008) The frequency dependence of osmo-adaptation in
Saccharomyces cerevisiae. Science 319: 482-484.
Mobini-Dehkordi M, Nahvi I, Zarkesh-Esfahani H, Ghaedi K, Tavassoli M, Akada R (2008) Isolation of a novel mutant

174 References
strain of Saccharomyces cerevisiae by an ethyl methane sulfonate-induced mutagenesis approach as a high producer of
bioethanol. J Biosci Bioeng 105: 403-408.
Molin M, Norbeck J, Blomberg A (2003) Dihydroxyacetone Kinases in Saccharomyces cerevisiaeAre Involved in
Detoxification of Dihydroxyacetone. Journal of Biological Chemistry 278: 1415-1423.
Mollapour M, Piper PW (2006) Hog1p mitogen-activated protein kinase determines acetic acid resistance in
Saccharomyces cerevisiae. FEMS Yeast Res 6: 1274-1280.
Moon TS, Lou C, Tamsir A, Stanton BC, Voigt CA (2012) Genetic programs constructed from layered logic gates in
single cells. Nature 491: 249-253.
Nadal-Ribelles M, Conde N, Flores O, Gonzalez-Vallinas J, Eyras E, Orozco M, de Nadal E, Posas F (2012) Hog1
bypasses stress-mediated down-regulation of transcription by RNA polymerase II redistribution and chromatin
remodeling. Genome Biol 13: R106.
Neuberg C, Reinfurth E (1918) Natürliche und erzwungene Glycerinbildung bei der alkoholischen Gärung. . BiochemZ
92: 32.
Neves L, Lages F, Lucas C (2004) New insights on glycerol transport in Saccharomyces cerevisiae. FEBS Lett 565: 160-
162.
Nevoigt E (2008) Progress in metabolic engineering of Saccharomyces cerevisiae. Microbiol Mol Biol Rev 72: 379-412.
Nevoigt E, Fischer C, Mucha O, Matthaus F, Stahl U, Stephanopoulos G (2007) Engineering promoter regulation.
Biotechnol Bioeng 96: 550-558.
Nevoigt E, Kohnke J, Fischer CR, Alper H, Stahl U, Stephanopoulos G (2006) Engineering of promoter replacement
cassettes for fine-tuning of gene expression in Saccharomyces cerevisiae. Appl Environ Microbiol 72: 5266-5273.
Nevoigt E, Pilger R, Mast-Gerlach E, Schmidt U, Freihammer S, Eschenbrenner M, Garbe L, Stahl U (2002) Genetic
engineering of brewing yeast to reduce the content of ethanol in beer. FEMS Yeast Res 2: 225-232.
Nevoigt E, Stahl U (1996) Reduced pyruvate decarboxylase and increased glycerol-3-phosphate dehydrogenase [NAD+]
levels enhance glycerol production in Saccharomyces cerevisiae. Yeast 12: 1331-1337.
Nevoigt E, Stahl U (1997) Osmoregulation and glycerol metabolism in the yeast Saccharomyces cerevisiae. FEMS
Microbiol Rev 21: 231-241.
Nguyen HT, Dieterich A, Athenstaedt K, Truong NH, Stahl U, Nevoigt E (2004) Engineering of Saccharomyces
cerevisiae for the production of L-glycerol 3-phosphate. Metab Eng 6: 155-163.
Nguyen HT, Nevoigt E (2009) Engineering of Saccharomyces cerevisiae for the production of dihydroxyacetone (DHA)
from sugars: a proof of concept. Metab Eng 11: 335-346.
Nicolaou SA, Gaida SM, Papoutsakis ET (2010) A comparative view of metabolite and substrate stress and tolerance in
microbial bioprocessing: From biofuels and chemicals, to biocatalysis and bioremediation. Metab Eng 12: 307-331.
Nissen TL, Anderlund M, Nielsen J, Villadsen J, Kielland-Brandt MC (2001) Expression of a cytoplasmic
transhydrogenase in Saccharomyces cerevisiae results in formation of 2-oxoglutarate due to depletion of the NADPH
pool. Yeast 18: 19-32.
Nissen TL, Hamann CW, Kielland-Brandt MC, Nielsen J, Villadsen J (2000) Anaerobic and aerobic batch cultivations of
Saccharomyces cerevisiae mutants impaired in glycerol synthesis. Yeast 16: 463-474.
Nissen TL, Kielland-Brandt MC, Nielsen J, Villadsen J (2000) Optimization of ethanol production in Saccharomyces
cerevisiae by metabolic engineering of the ammonium assimilation. Metab Eng 2: 69-77.
Norbeck J, Blomberg A (1997) Metabolic and regulatory changes associated with growth of Saccharomyces cerevisiae in
1.4 M NaCl. Evidence for osmotic induction of glycerol dissimilation via the dihydroxyacetone pathway. J Biol Chem
272: 5544-5554.
Norbeck J, Pahlman AK, Akhtar N, Blomberg A, Adler L (1996) Purification and characterization of two isoenzymes of
DL-glycerol-3-phosphatase from Saccharomyces cerevisiae. Identification of the corresponding GPP1 and GPP2 genes

References 175
and evidence for osmotic regulation of Gpp2p expression by the osmosensing mitogen-activated protein kinase signal
transduction pathway. J Biol Chem 271: 13875-13881.
Olesen K, Franke Johannesen P, Hoffmann L, Bech Sorensen S, Gjermansen C, Hansen J (2000) The pYC plasmids, a
series of cassette-based yeast plasmid vectors providing means of counter-selection. Yeast 16: 1035-1043.
Olesen K, Franke Johannesen P, Hoffmann L, Bech Sorensen S, Gjermansen C, Hansen J (2000) The pYC plasmids, a
series of cassette-based yeast plasmid vectors providing means of counter-selection. Yeast 16: 1035-1043.
O'Rourke SM, Herskowitz I (2002) A third osmosensing branch in Saccharomyces cerevisiae requires the Msb2 protein
and functions in parallel with the Sho1 branch. Mol Cell Biol 22: 4739-4749.
O'Rourke SM, Herskowitz I (2004) Unique and redundant roles for HOG MAPK pathway components as revealed by
whole-genome expression analysis. Mol Biol Cell 15: 532-542.
O'Rourke SM, Herskowitz I, O'Shea EK (2002) Yeast go the whole HOG for the hyperosmotic response. Trends Genet
18: 405-412.
Oud B, van Maris AJ, Daran JM, Pronk JT (2012) Genome-wide analytical approaches for reverse metabolic engineering
of industrially relevant phenotypes in yeast. FEMS Yeast Res 12: 183-196.
Overkamp KM, Bakker BM, Kotter P, Luttik MA, Van Dijken JP, Pronk JT (2002) Metabolic engineering of glycerol
production in Saccharomyces cerevisiae. Appl Environ Microbiol 68: 2814-2821.
Pagliardini J, Hubmann G, Alfenore S, Nevoigt E, Bideaux C, Guillouet SE (2013) The metabolic costs of improving
ethanol yield by reducing glycerol formation capacity under anaerobic conditions in Saccharomyces cerevisiae. Microb
Cell Fact 12: 29.
Pagliardini J, Hubmann G, Bideaux C, Alfenore S, Nevoigt E, Guillouet SE (2010) Quantitative evaluation of yeast's
requirement for glycerol formation in very high ethanol performance fed-batch process. Microb Cell Fact 9: 36.
Pahlman AK, Granath K, Ansell R, Hohmann S, Adler L (2001) The yeast glycerol 3-phosphatases Gpp1p and Gpp2p
are required for glycerol biosynthesis and differentially involved in the cellular responses to osmotic, anaerobic, and
oxidative stress. J Biol Chem 276: 3555-3563.
Parts L, Cubillos FA, Warringer J, Jain K, Salinas F, Bumpstead SJ, Molin M, Zia A, Simpson JT, Quail MA, Moses A,
Louis EJ, Durbin R, Liti G (2011) Revealing the genetic structure of a trait by sequencing a population under selection.
Genome Res 21: 1131-1138.
Pascual-Ahuir A, Serrano R, Proft M (2001) The Sko1p repressor and Gcn4p activator antagonistically modulate stress-
regulated transcription in Saccharomyces cerevisiae. Mol Cell Biol 21: 16-25.
Pasteur L (1857) Mémoire sur la fermentation alcoolique. Compt Rend 45: 1032–1036.
Pasteur ML (1858) Production constante de glycérine dans la fermentation alcoolique. C R Acad Sci 46: 857.
Pavlik P, Simon M, Schuster T, Ruis H (1993) The glycerol kinase (GUT1) gene of Saccharomyces cerevisiae: cloning
and characterization. Curr Genet 24: 21-25.
Pecori Giraldi F, Pesce S, Maroni P, Pagliardini L, Lasio G, Losa M, Cavagnini F (2010) Inhibitory effect of prepro-
thyrotrophin-releasing hormone (178-199) on adrenocorticotrophic hormone secretion by human corticotroph tumours. J
Neuroendocrinol 22: 294-300.
Peralta-Yahya PP, Keasling JD (2010) Advanced biofuel production in microbes. Biotechnol J 5: 147-162.
Peralta-Yahya PP, Zhang F, del Cardayre SB, Keasling JD (2012) Microbial engineering for the production of advanced
biofuels. Nature 488: 320-328.
Petelenz-Kurdziel E, Eriksson E, Smedh M, Beck C, Hohmann S, Goksor M (2011) Quantification of cell volume
changes upon hyperosmotic stress in Saccharomyces cerevisiae. Integr Biol (Camb) 3: 1120-1126.
Popp A, Nguyen HT, Boulahya K, Bideaux C, Alfenore S, Guillouet SE, Nevoigt E (2008) Fermentative production of L-
glycerol 3-phosphate utilizing a Saccharomyces cerevisiae strain with an engineered glycerol biosynthetic pathway.
Biotechnol Bioeng 100: 497-505.

176 References
Posas F, Chambers JR, Heyman JA, Hoeffler JP, de Nadal E, Arino J (2000) The transcriptional response of yeast to
saline stress. J Biol Chem 275: 17249-17255.
Posas F, Wurgler-Murphy SM, Maeda T, Witten EA, Thai TC, Saito H (1996) Yeast HOG1 MAP kinase cascade is
regulated by a multistep phosphorelay mechanism in the SLN1-YPD1-SSK1 "two-component" osmosensor. Cell 86:
865-875.
Proft M, Mas G, de Nadal E, Vendrell A, Noriega N, Struhl K, Posas F (2006) The stress-activated Hog1 kinase is a
selective transcriptional elongation factor for genes responding to osmotic stress. Mol Cell 23: 241-250.
Proft M, Pascual-Ahuir A, de Nadal E, Arino J, Serrano R, Posas F (2001) Regulation of the Sko1 transcriptional
repressor by the Hog1 MAP kinase in response to osmotic stress. EMBO J 20: 1123-1133.
Proft M, Struhl K (2002) Hog1 kinase converts the Sko1-Cyc8-Tup1 repressor complex into an activator that recruits
SAGA and SWI/SNF in response to osmotic stress. Mol Cell 9: 1307-1317.
Proft M, Struhl K (2004) MAP kinase-mediated stress relief that precedes and regulates the timing of transcriptional
induction. Cell 118: 351-361.
Pronk JT (2002) Auxotrophic yeast strains in fundamental and applied research. Appl Environ Microbiol 68: 2095-2100.
Raitt DC, Posas F, Saito H (2000) Yeast Cdc42 GTPase and Ste20 PAK-like kinase regulate Sho1-dependent activation
of the Hog1 MAPK pathway. EMBO J 19: 4623-4631.
Ralser M, Wamelink MM, Kowald A, Gerisch B, Heeren G, Struys EA, Klipp E, Jakobs C, Breitenbach M, Lehrach H,
Krobitsch S (2007) Dynamic rerouting of the carbohydrate flux is key to counteracting oxidative stress. J Biol 6: 10.
Remize F, Barnavon L, Dequin S (2001) Glycerol export and glycerol-3-phosphate dehydrogenase, but not glycerol
phosphatase, are rate limiting for glycerol production in Saccharomyces cerevisiae. Metab Eng 3: 301-312.
Remize F, Cambon B, Barnavon L, Dequin S (2003) Glycerol formation during wine fermentation is mainly linked to
Gpd1p and is only partially controlled by the HOG pathway. Yeast 20: 1243-1253.
Remize F, Roustan JL, Sablayrolles JM, Barre P, Dequin S (1999) Glycerol overproduction by engineered
saccharomyces cerevisiae wine yeast strains leads to substantial changes in By-product formation and to a stimulation of
fermentation rate in stationary phase. Appl Environ Microbiol 65: 143-149.
Rep M, Krantz M, Thevelein JM, Hohmann S (2000) The transcriptional response of Saccharomyces cerevisiae to
osmotic shock. Hot1p and Msn2p/Msn4p are required for the induction of subsets of high osmolarity glycerol pathway-
dependent genes. J Biol Chem 275: 8290-8300.
Rep M, Proft M, Remize F, Tamas M, Serrano R, Thevelein JM, Hohmann S (2001) The Saccharomyces cerevisiae
Sko1p transcription factor mediates HOG pathway-dependent osmotic regulation of a set of genes encoding enzymes
implicated in protection from oxidative damage. Mol Microbiol 40: 1067-1083.
Rep M, Reiser V, Gartner U, Thevelein JM, Hohmann S, Ammerer G, Ruis H (1999) Osmotic stress-induced gene
expression in Saccharomyces cerevisiae requires Msn1p and the novel nuclear factor Hot1p. Mol Cell Biol 19: 5474-
5485.
Rigoulet M, Aguilaniu H, Averet N, Bunoust O, Camougrand N, Grandier-Vazeille X, Larsson C, Pahlman IL, Manon S,
Gustafsson L (2004) Organization and regulation of the cytosolic NADH metabolism in the yeast Saccharomyces
cerevisiae. Mol Cell Biochem 256-257: 73-81.
Ronnow B, Kielland-Brandt MC (1993) GUT2, a gene for mitochondrial glycerol 3-phosphate dehydrogenase of
Saccharomyces cerevisiae. Yeast 9: 1121-1130.
Saerens SM, Duong CT, Nevoigt E Genetic improvement of brewer's yeast: current state, perspectives and limits. Appl
Microbiol Biotechnol 86: 1195-1212.
Sahara H, Kotaka A, Kondo A, Ueda M, Hata Y (2009) Using promoter replacement and selection for loss of
heterozygosity to generate an industrially applicable sake yeast strain that homozygously overproduces isoamyl acetate. J
Biosci Bioeng 108: 359-364.

References 177
Sambrook J, Maniatis T, Fritsch EF (1989) Molecular cloning : a laboratory manual, 2nd edn. Cold Spring Harbor,
N.Y.: Cold Spring Harbor Laboratory.
Sanchez-Gonzalez Y, Cameleyre X, Molina-Jouve C, Goma G, Alfenore S (2008) Dynamic microbial response under
ethanol stress to monitor Saccharomyces cerevisiae activity in different initial physiological states. Bioprocess Biosyst
Eng.
Sanger F, Coulson AR (1975) A rapid method for determining sequences in DNA by primed synthesis with DNA
polymerase. J Mol Biol 94: 441-448.
Sato N, Kawahara H, Toh-e A, Maeda T (2003) Phosphorelay-regulated degradation of the yeast Ssk1p response
regulator by the ubiquitin-proteasome system. Mol Cell Biol 23: 6662-6671.
Schmidtke LM, Blackman JW, Agboola SO (2012) Production technologies for reduced alcoholic wines. J Food Sci 77:
R25-41.
Schmidtke LM, Clark AC, Scollary GR (2011) Micro-oxygenation of red wine: techniques, applications, and outcomes.
Crit Rev Food Sci Nutr 51: 115-131.
Schuller D, Casal M (2005) The use of genetically modified Saccharomyces cerevisiae strains in the wine industry. Appl
Microbiol Biotechnol 68: 292-304.
Schuller D, Casal M (2005) The use of genetically modified Saccharomyces cerevisiae strains in the wine industry. Appl
Microbiol Biotechnol 68: 292-304.
Schwann T (1837) Vorläufige Mittheilung, bettreffend Versuche über die Weingährung und Fäulniss. Ann Phys Chem
41: 184–193.
Schwartz MA, Madhani HD (2004) Principles of MAP kinase signaling specificity in Saccharomyces cerevisiae. Annu
Rev Genet 38: 725-748.
Shepherd A, Piper PW (2010) The Fps1p aquaglyceroporin facilitates the use of small aliphatic amides as a nitrogen
source by amidase-expressing yeasts. FEMS Yeast Res 10: 527-534.
Sherman F, Hicks J (1991) Micromanipulation and dissection of asci. Methods Enzymol 194: 21-37.
Sicard D, Legras JL (2011) Bread, beer and wine: yeast domestication in the Saccharomyces sensu stricto complex. C R
Biol 334: 229-236.
Siderius M, Van Wuytswinkel O, Reijenga KA, Kelders M, Mager WH (2000) The control of intracellular glycerol in
Saccharomyces cerevisiae influences osmotic stress response and resistance to increased temperature. Mol Microbiol 36:
1381-1390.
Sinha H, David L, Pascon RC, Clauder-Munster S, Krishnakumar S, Nguyen M, Shi G, Dean J, Davis RW, Oefner PJ,
McCusker JH, Steinmetz LM (2008) Sequential elimination of major-effect contributors identifies additional quantitative
trait loci conditioning high-temperature growth in yeast. Genetics 180: 1661-1670.
Sprague GF, Cronan JE (1977) Isolation and characterization of Saccharomyces cerevisiae mutants defective in glycerol
catabolism. Journal of Bacteriology 129: 1335-1342.
Steinmetz LM, Scharfe C, Deutschbauer AM, Mokranjac D, Herman ZS, Jones T, Chu AM, Giaever G, Prokisch H,
Oefner PJ, Davis RW (2002) Systematic screen for human disease genes in yeast. Nat Genet 31: 400-404.
Steinmetz LM, Sinha H, Richards DR, Spiegelman JI, Oefner PJ, McCusker JH, Davis RW (2002) Dissecting the
architecture of a quantitative trait locus in yeast. Nature 416: 326-330.
Stephanopoulos G (2007) Challenges in engineering microbes for biofuels production. Science 315: 801-804.
Stephanopoulos G, Sinskey AJ (1993) Metabolic engineering methodologies and future prospects. Trends in
biotechnology 11: 392-396.
Sutherland FC, Lages F, Lucas C, Luyten K, Albertyn J, Hohmann S, Prior BA, Kilian SG (1997) Characteristics of
Fps1-dependent and -independent glycerol transport in Saccharomyces cerevisiae. J Bacteriol 179: 7790-7795.

178 References
Swinnen S, Schaerlaekens K, Pais T, Claesen J, Hubmann G, Yang Y, Demeke M, Foulquie-Moreno MR, Goovaerts A,
Souvereyns K, Clement L, Dumortier F, Thevelein JM (2012) Identification of novel causative genes determining the
complex trait of high ethanol tolerance in yeast using pooled-segregant whole-genome sequence analysis. Genome
Research.
Swinnen S, Thevelein JM, Nevoigt E (2012) Genetic mapping of quantitative phenotypic traits in Saccharomyces
cerevisiae. FEMS Yeast Res 12: 215-227.
Tamas MJ, Luyten K, Sutherland FC, Hernandez A, Albertyn J, Valadi H, Li H, Prior BA, Kilian SG, Ramos J,
Gustafsson L, Thevelein JM, Hohmann S (1999) Fps1p controls the accumulation and release of the compatible solute
glycerol in yeast osmoregulation. Mol Microbiol 31: 1087-1104.
Teige M, Scheikl E, Reiser V, Ruis H, Ammerer G (2001) Rck2, a member of the calmodulin-protein kinase family, links
protein synthesis to high osmolarity MAP kinase signaling in budding yeast. Proc Natl Acad Sci U S A 98: 5625-5630.
Thomas KC, Ingledew WM (1990) Fuel alcohol production: effects of free amino nitrogen on fermentation of very-high-
gravity wheat mashes. Appl Environ Microbiol 56: 2046-2050.
Thorsen M, Di Y, Tangemo C, Morillas M, Ahmadpour D, Van der Does C, Wagner A, Johansson E, Boman J, Posas F,
Wysocki R, Tamas MJ (2006) The MAPK Hog1p modulates Fps1p-dependent arsenite uptake and tolerance in yeast.
Mol Biol Cell 17: 4400-4410.
Treco DA, Winston F (2001) Growth and Manipulation of Yeast. In Current Protocols in Molecular Biology: John Wiley
& Sons, Inc.
Tyo KE, Nevoigt E, Stephanopoulos G Directed evolution of promoters and tandem gene arrays for customizing RNA
synthesis rates and regulation. Methods Enzymol 497: 135-155.
USA (2007) ENERGY INDEPENDENCE AND SECURITY ACT 110th Congress Public Law 110-140.
USDA (2012) Feed Grains: Yearbook tables. United States Departement of Agriculture, available at:
http://wwwersusdagov/data-products/feed-grains-database/feed-grains-yearbook-tablesaspx.
Valadi A, Granath K, Gustafsson L, Adler L (2004) Distinct intracellular localization of Gpd1p and Gpd2p, the two yeast
isoforms of NAD+-dependent glycerol-3-phosphate dehydrogenase, explains their different contributions to redox-driven
glycerol production. J Biol Chem 279: 39677-39685.
Valadi H, Larsson C, Gustafsson L (1998) Improved ethanol production by glycerol-3-phosphate dehydrogenase mutants
of Saccharomyces cerevisiae. Appl Microbiol Biotechnol 50: 434-439.
Valadi H, Valadi A, Ansell R, Gustafsson L, Adler L, Norbeck J, Blomberg A (2004) NADH-reductive stress in
Saccharomyces cerevisiae induces the expression of the minor isoform of glyceraldehyde-3-phosphate dehydrogenase
(TDH1). Curr Genet 45: 90-95.
Van Aelst L, Hohmann S, Zimmermann FK, Jans AW, Thevelein JM (1991) A yeast homologue of the bovine lens fibre
MIP gene family complements the growth defect of a Saccharomyces cerevisiae mutant on fermentable sugars but not its
defect in glucose-induced RAS-mediated cAMP signalling. EMBO J 10: 2095-2104.
van Dijken JP, Bauer J, Brambilla L, Duboc P, Francois JM, Gancedo C, Giuseppin ML, Heijnen JJ, Hoare M, Lange
HC, Madden EA, Niederberger P, Nielsen J, Parrou JL, Petit T, Porro D, Reuss M, van Riel N, Rizzi M, Steensma HY,
Verrips CT, Vindelov J, Pronk JT (2000) An interlaboratory comparison of physiological and genetic properties of four
Saccharomyces cerevisiae strains. Enzyme Microb Technol 26: 706-714.
van Dijken JP, Scheffers WA (1986) Redox balances in the metabolism of sugars by yeasts. FEMS Microbiology Letters
32: 199-224.
Van Dyk JS, Pletschke BI (2012) A review of lignocellulose bioconversion using enzymatic hydrolysis and synergistic
cooperation between enzymes—Factors affecting enzymes, conversion and synergy. Biotechnology Advances 30: 1458-
1480.
van Hoek P, de Hulster E, van Dijken JP, Pronk JT (2000) Fermentative capacity in high-cell-density fed-batch cultures
of baker's yeast. Biotechnol Bioeng 68: 517-523.

References 179
van Hoek P, van Dijken JP, Pronk JT (2000) Regulation of fermentative capacity and levels of glycolytic enzymes in
chemostat cultures of Saccharomyces cerevisiae. Enzyme Microb Technol 26: 724-736.
Verduyn C, Postma E, Scheffers WA, Van Dijken JP (1992) Effect of benzoic acid on metabolic fluxes in yeasts: a
continuous-culture study on the regulation of respiration and alcoholic fermentation. Yeast 8: 501-517.
Vilela-Moura A, Schuller D, Mendes-Faia A, Silva RD, Chaves SR, Sousa MJ, Corte-Real M (2011) The impact of
acetate metabolism on yeast fermentative performance and wine quality: reduction of volatile acidity of grape musts and
wines. Appl Microbiol Biotechnol 89: 271-280.
Wang DI, Cooney C. L., Demain A. L., Dunnill P., Humphrey A., M. L (1979) Fermentation and enzyme technology.
New York.
Wang XD, Zhang XE, Guo YC, Zhang ZP, Cao ZA, Zhou YF (2009) Characterization of glycerol dehydratase expressed
by fusing its alpha- and beta-subunits. Biotechnol Lett 31: 711-717.
Wang ZX, Zhuge J, Fang H, Prior BA (2001) Glycerol production by microbial fermentation: a review. Biotechnol Adv
19: 201-223.
Warburg O (1932) Das sauerstoffübertragende Ferment der Atmung. Angewandte Chemie 45: 1-6.
Warmka J, Hanneman J, Lee J, Amin D, Ota I (2001) Ptc1, a type 2C Ser/Thr phosphatase, inactivates the HOG pathway
by dephosphorylating the mitogen-activated protein kinase Hog1. Mol Cell Biol 21: 51-60.
Westfall PJ, Ballon DR, Thorner J (2004) When the stress of your environment makes you go HOG wild. Science 306:
1511-1512.
Westfall PJ, Patterson JC, Chen RE, Thorner J (2008) Stress resistance and signal fidelity independent of nuclear MAPK
function. Proc Natl Acad Sci U S A 105: 12212-12217.
Williamson DH, Lund P, Krebs HA (1967) The redox state of free nicotinamide-adenine dinucleotide in the cytoplasm
and mitochondria of rat liver. Biochem J 103: 514-527.
Winzeler EA, Richards DR, Conway AR, Goldstein AL, Kalman S, McCullough MJ, McCusker JH, Stevens DA,
Wodicka L, Lockhart DJ, Davis RW (1998) Direct allelic variation scanning of the yeast genome. Science 281: 1194-
1197.
Winzeler EA, Richards DR, Conway AR, Goldstein AL, Kalman S, McCullough MJ, McCusker JH, Stevens DA,
Wodicka L, Lockhart DJ, Davis RW (1998) Direct allelic variation scanning of the yeast genome. Science 281: 1194-
1197.
Winzeler EA, Shoemaker DD, Astromoff A, Liang H, Anderson K, Andre B, Bangham R, Benito R, Boeke JD, Bussey
H, Chu AM, Connelly C, Davis K, Dietrich F, Dow SW, El Bakkoury M, Foury F, Friend SH, Gentalen E, Giaever G,
Hegemann JH, Jones T, Laub M, Liao H, Liebundguth N, Lockhart DJ, Lucau-Danila A, Lussier M, M'Rabet N, Menard
P, Mittmann M, Pai C, Rebischung C, Revuelta JL, Riles L, Roberts CJ, Ross-MacDonald P, Scherens B, Snyder M,
Sookhai-Mahadeo S, Storms RK, Veronneau S, Voet M, Volckaert G, Ward TR, Wysocki R, Yen GS, Yu K,
Zimmermann K, Philippsen P, Johnston M, Davis RW (1999) Functional characterization of the S. cerevisiae genome by
gene deletion and parallel analysis. Science 285: 901-906.
Wojda I, Alonso-Monge R, Bebelman JP, Mager WH, Siderius M (2003) Response to high osmotic conditions and
elevated temperature in Saccharomyces cerevisiae is controlled by intracellular glycerol and involves coordinate activity
of MAP kinase pathways. Microbiology 149: 1193-1204.
Wurgler-Murphy SM, Maeda T, Witten EA, Saito H (1997) Regulation of the Saccharomyces cerevisiae HOG1 mitogen-
activated protein kinase by the PTP2 and PTP3 protein tyrosine phosphatases. Mol Cell Biol 17: 1289-1297.
Yadav VG, De Mey M, Lim CG, Ajikumar PK, Stephanopoulos G (2012) The future of metabolic engineering and
synthetic biology: towards a systematic practice. Metab Eng 14: 233-241.
Yale J, Bohnert HJ (2001) Transcript expression in Saccharomyces cerevisiae at high salinity. J Biol Chem 276: 15996-
16007.
Ye GM, Chen C, Huang S, Han DD, Guo JH, Wan B, Yu L (2005) Cloning and characterization a novel human 1-acyl-
sn-glycerol-3-phosphate acyltransferase gene AGPAT7. DNA Seq 16: 386-390.

180 References
Zarrinpar A, Bhattacharyya RP, Nittler MP, Lim WA (2004) Sho1 and Pbs2 act as coscaffolds linking components in the
yeast high osmolarity MAP kinase pathway. Mol Cell 14: 825-832.
Zhang A, Kong Q, Cao L, Chen X (2007) Effect of FPS1 deletion on the fermentation properties of Saccharomyces
cerevisiae. Lett Appl Microbiol 44: 212-217.
Zhang L, Tang Y, Guo ZP, Ding ZY, Shi GY (2011) Improving the ethanol yield by reducing glycerol formation using
cofactor regulation in Saccharomyces cerevisiae. Biotechnol Lett 33: 1375-1380.
Zhao S, Douglas NW, Heine MJ, Williams GM, Winther-Larsen HC, Meaden PG (1994) The STL1 gene of
Saccharomyces cerevisiae is predicted to encode a sugar transporter-like protein. Gene 146: 215-219.
Zwietering MH, Jongenburger I, Rombouts FM, van 't Riet K (1990) Modeling of the bacterial growth curve. Appl
Environ Microbiol 56: 1875-1881.