application of remote sensing techniques in...
TRANSCRIPT

_____________________________________________________________________________
______________________________________________________________________________ International Journal of Geosciences and Geomatics, Vol. 1, Issue 1, 2013 9 Page
Application of Remote Sensing Techniques in
Geoenvironmental Engineering
Dr. Mahdi O. Karkush
1 , Prof. Dr.Abdul Razak T. Ziboon
2 , Dr Hadeel M. Hussien3
1. Baghdad University/Civil Engineering Dept. 2. University of Technology
3. Baghdad University/Civil Engineering Dept.
KEYWORDS: Contaminated soil, remote sensing, spectral reflectance, Geoenvironmental engineering.
ABSTRACT The present study focused on the application of remote sensing techniques in geoenvironmental engineering. The work was divided into two parts: the first part deals with measuring the reflectance ratio of synthetically contaminated soil samples by using radiometer. The soil samples were obtained from Al-Khadymiya district/Baghdad city/Iraq. Four different types of contaminants were used: kerosene, ammonium hydroxide, lead nitrate and copper sulphate. The natural soil samples were contaminated synthetically by soaking in isolated pans contain a solute of distilled water and contaminant for 30 days. The contaminants were mixed with distilled water in two percentages 10 & 25% of the dry weight of the clay soil sample. The spectral reflectance ratio of contaminated soil were measured using radiometer device which helps in getting standard curves for wavelengths of different types of pollutants. These standard curves will be helpful in analyzing the satellite imagery of specific area to get the spatial distribution of soil contaminants using geographic information system (GIS). The second part deals with the field measurements of the spectral reflectance ratio of nine spots in naturally contaminated soil with hydrocarbons inside the plot of Al-Daura Refinery Company in the south west of Baghdad city by using radiometer device. Also, the satellite imagery was analyzed by using GIS technique and ERDAS10 software to get the spectral
reflectance curves which help in producing thematic maps for the spatial distribution and concentration of pollutants. The obtained results showed good agreement between the spectral reflectance measured by radiometer and the spectral reflectance obtained from analyzing the satellite imagery. The study also improves a method to save time, efforts, and staff. INTRODUCTION The soil contamination can be considered as the presence of man-made chemicals or other alteration in the natural soil environment. Some of the soil properties can be estimated using spectral responses of surface soil for different bands of radiometer. The great demand for information about properties of surface and sub-surface soil and short time available for the work arises to employ remote sensing techniques in geotechnical engineering which reduce the time, cost, efforts, and staff. Yousif (2004) used the remote sensing techniques to classify the soil of Al-Najaf city by comparing the results obtained from remote sensing techniques with those obtained from traditional classification method. Al-Maliky (2005) constructed maps explained the zones of distributions and concentrations of pollutants in air, water and soil depending on an integrated measured and collected data base utilizing from GIS and Arcview software. Carr et al., (2006) used PXRF metal analyzer to obtain rabid in-situ elemental analysis for urban soil to produce spatial maps for the distribution of
_____________________________________________________________________________
______________________________________________________________________________ International Journal of Geosciences and Geomatics, Vol. 1, Issue 1, 2013 01 Page
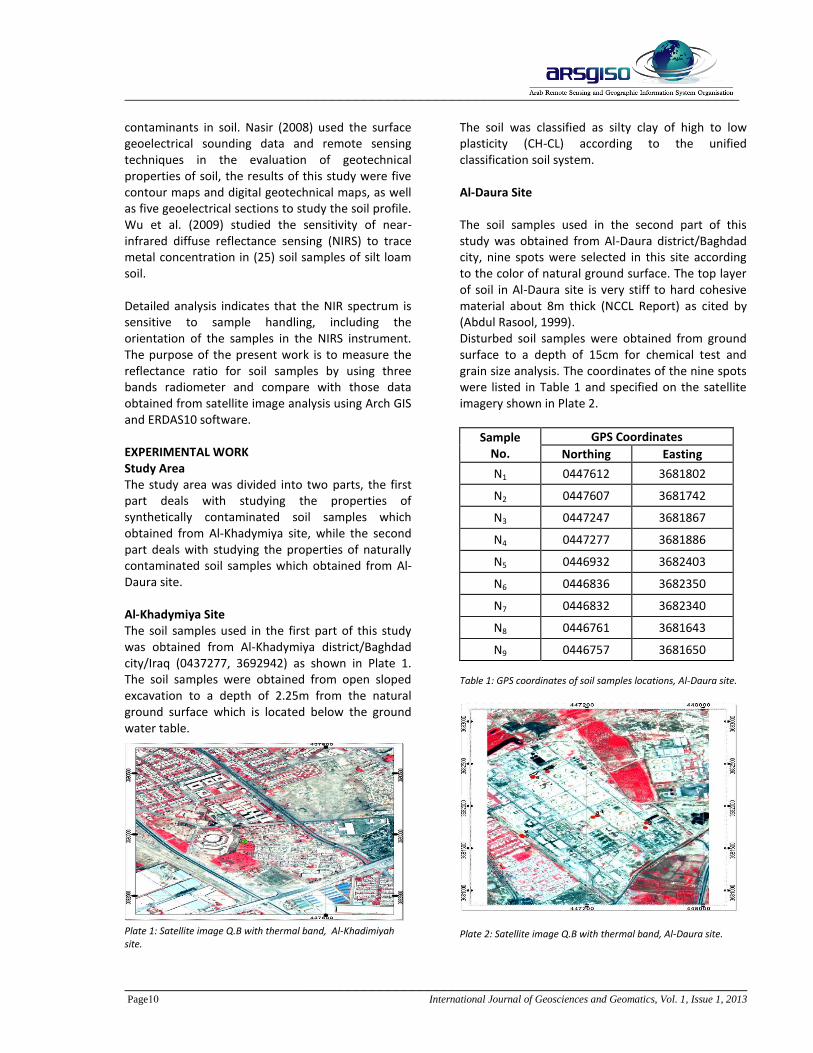
contaminants in soil. Nasir (2008) used the surface geoelectrical sounding data and remote sensing techniques in the evaluation of geotechnical properties of soil, the results of this study were five contour maps and digital geotechnical maps, as well as five geoelectrical sections to study the soil profile. Wu et al. (2009) studied the sensitivity of near-infrared diffuse reflectance sensing (NIRS) to trace metal concentration in (25) soil samples of silt loam soil. Detailed analysis indicates that the NIR spectrum is sensitive to sample handling, including the orientation of the samples in the NIRS instrument. The purpose of the present work is to measure the reflectance ratio for soil samples by using three bands radiometer and compare with those data obtained from satellite image analysis using Arch GIS and ERDAS10 software. EXPERIMENTAL WORK Study Area The study area was divided into two parts, the first part deals with studying the properties of synthetically contaminated soil samples which obtained from Al-Khadymiya site, while the second part deals with studying the properties of naturally contaminated soil samples which obtained from Al-Daura site. Al-Khadymiya Site The soil samples used in the first part of this study was obtained from Al-Khadymiya district/Baghdad city/Iraq (0437277, 3692942) as shown in Plate 1. The soil samples were obtained from open sloped excavation to a depth of 2.25m from the natural ground surface which is located below the ground water table. Plate 1: Satellite image Q.B with thermal band, Al-Khadimiyah site.
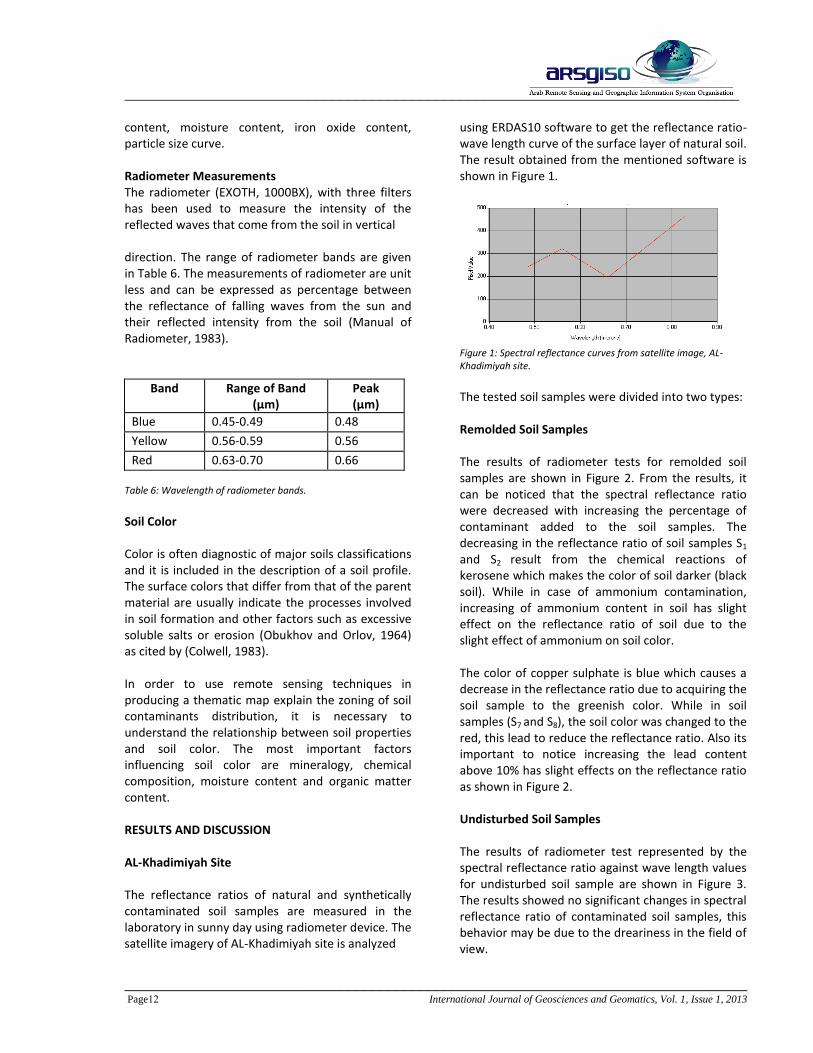
The soil was classified as silty clay of high to low plasticity (CH-CL) according to the unified classification soil system. Al-Daura Site The soil samples used in the second part of this study was obtained from Al-Daura district/Baghdad city, nine spots were selected in this site according to the color of natural ground surface. The top layer of soil in Al-Daura site is very stiff to hard cohesive material about 8m thick (NCCL Report) as cited by (Abdul Rasool, 1999). Disturbed soil samples were obtained from ground surface to a depth of 15cm for chemical test and grain size analysis. The coordinates of the nine spots were listed in Table 1 and specified on the satellite imagery shown in Plate 2.
Sample No.
GPS Coordinates
Northing Easting
N1 0447612 3681802
N2 0447607 3681742
N3 0447247 3681867
N4 0447277 3681886
N5 0446932 3682403
N6 0446836 3682350
N7 0446832 3682340
N8 0446761 3681643
N9 0446757 3681650
Table 1: GPS coordinates of soil samples locations, Al-Daura site.
Plate 2: Satellite image Q.B with thermal band, Al-Daura site.

_____________________________________________________________________________
______________________________________________________________________________ International Journal of Geosciences and Geomatics, Vol. 1, Issue 1, 2013 00 Page
Materials Used After soil sampling, the soil samples obtained from Al-Khadymiya were air dried and divided into nine parts. Eight of these soil samples were soaked with four types of chemical solutions which used as contaminants, each contaminant was added in two percentages 10 & 25% by weight of the dry soil sample. The designation of soil samples are given in Table 2. The contaminants used in the present study represent three groups: (1) kerosene was used as an example of petroleum hydrocarbon wastes, (2) ammonium hydroxide was used as an example of agricultural fertilizer, and (3) copper (II) sulphate and Lead (II) nitrate were used as examples of heavy metals (Table 3).
Table 2: Designation of tested soil samples, Al-Khadymiya site.
Table 3: Chemical and physical properties of used contaminants, Al-Khadymiya site. * x and y ranged (4-6) for industrial kerosene & ** at 20 °C
Chemical Analysis The chemical tests were conducted for all types of soil samples, to determine the chemical composition
of soil samples. The results of chemical tests for soil samples obtained from Al-Khadymiya site are given in Table 4. While, the hydrocarbons and lead contents of the soil samples obtained from Al-Daura site are given in Table 5.
Table 4: Results of the chemical tests, Al-Khadymiya site. *CEC is the cation exchange capacity of minerals in meq/100g at pH of 7.
Soil Sample
Hydrocarbons content, %
Lead content, %
N1 0 0.0025
N2 0.185 0.0022
N3 0.285 0.0048
N4 0.644 0.0034
N5 22.44 0.0233
N6 3.629 0.0035
N7 3.225 0.0027
N8 0 0.0043
N9 0 0.0035 Table 5: Hydrocarbons and lead contents of soil samples, Al-Daura site.
Spectral Reflectance Analysis The properties of soils that govern their spectral reflectance are color, texture, structure and surface roughness, particle size, mineralogy, organic matter, free carbonates, salinity, moisture and the oxides/hydroxides of iron and manganese. Also, the chemical composition of the soil influences spectral signature of soils through the absorption processes (Manchanda et al., 2002 and Colwell, 1983). Radiometer capacity is used to explain some of the physical properties of soil, such as organic matter
Soil sample symbol
Description
S0 Natural soil sample
S1 & S2 Soil samples contaminated with 10% & 25% of kerosene respectively
S3 & S4 Soil samples contaminated with 10% & 25% of ammonium hydroxide respectively
S5 & S6 Soil samples contaminated with 10% & 25% of copper sulphate respectively
S7 & S8 Soil samples contaminated with 10% & 25% of lead nitrate respectively
_____________________________________________________________________________
______________________________________________________________________________ International Journal of Geosciences and Geomatics, Vol. 1, Issue 1, 2013 01 Page
content, moisture content, iron oxide content, particle size curve. Radiometer Measurements The radiometer (EXOTH, 1000BX), with three filters has been used to measure the intensity of the reflected waves that come from the soil in vertical direction. The range of radiometer bands are given in Table 6. The measurements of radiometer are unit less and can be expressed as percentage between the reflectance of falling waves from the sun and their reflected intensity from the soil (Manual of Radiometer, 1983).
Band Range of Band (µm)
Peak (µm)
Blue 0.45-0.49 0.48
Yellow 0.56-0.59 0.56
Red 0.63-0.70 0.66 Table 6: Wavelength of radiometer bands.
Soil Color Color is often diagnostic of major soils classifications and it is included in the description of a soil profile. The surface colors that differ from that of the parent material are usually indicate the processes involved in soil formation and other factors such as excessive soluble salts or erosion (Obukhov and Orlov, 1964) as cited by (Colwell, 1983). In order to use remote sensing techniques in producing a thematic map explain the zoning of soil contaminants distribution, it is necessary to understand the relationship between soil properties and soil color. The most important factors influencing soil color are mineralogy, chemical composition, moisture content and organic matter content. RESULTS AND DISCUSSION AL-Khadimiyah Site The reflectance ratios of natural and synthetically contaminated soil samples are measured in the laboratory in sunny day using radiometer device. The satellite imagery of AL-Khadimiyah site is analyzed
using ERDAS10 software to get the reflectance ratio-wave length curve of the surface layer of natural soil. The result obtained from the mentioned software is shown in Figure 1. Figure 1: Spectral reflectance curves from satellite image, AL-Khadimiyah site.
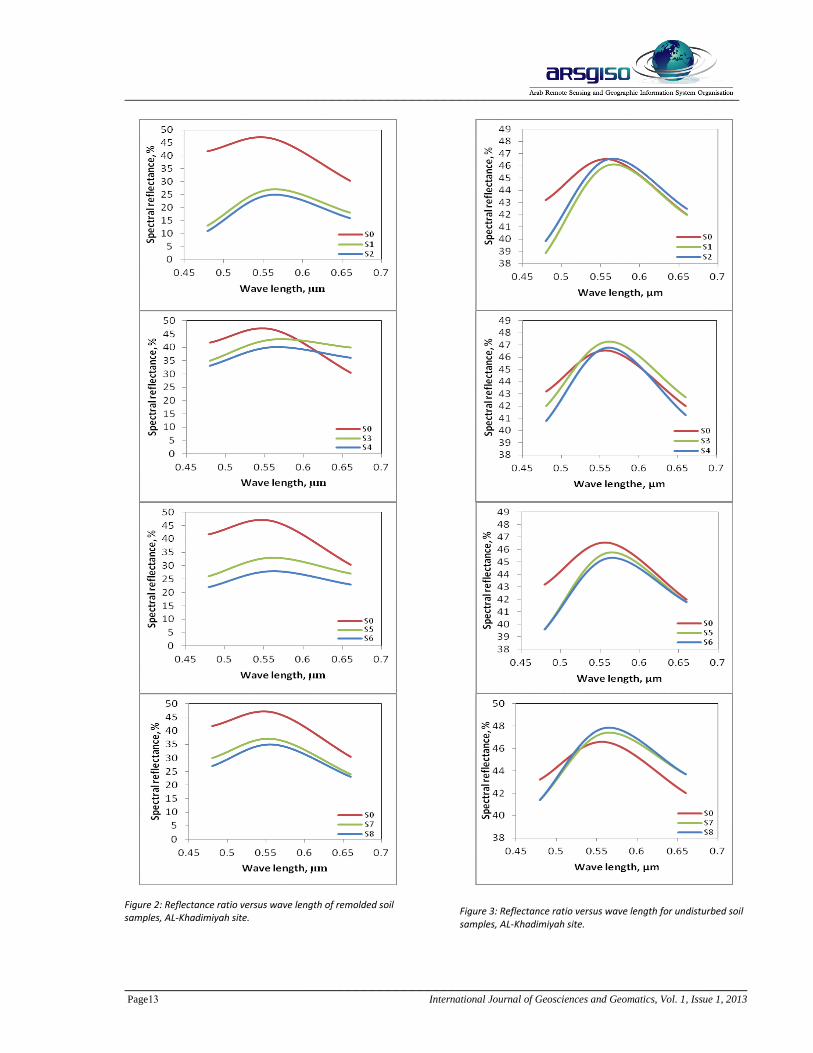
The tested soil samples were divided into two types: Remolded Soil Samples The results of radiometer tests for remolded soil samples are shown in Figure 2. From the results, it can be noticed that the spectral reflectance ratio were decreased with increasing the percentage of contaminant added to the soil samples. The decreasing in the reflectance ratio of soil samples S1 and S2 result from the chemical reactions of kerosene which makes the color of soil darker (black soil). While in case of ammonium contamination, increasing of ammonium content in soil has slight effect on the reflectance ratio of soil due to the slight effect of ammonium on soil color. The color of copper sulphate is blue which causes a decrease in the reflectance ratio due to acquiring the soil sample to the greenish color. While in soil samples (S7 and S8), the soil color was changed to the red, this lead to reduce the reflectance ratio. Also its important to notice increasing the lead content above 10% has slight effects on the reflectance ratio as shown in Figure 2. Undisturbed Soil Samples The results of radiometer test represented by the spectral reflectance ratio against wave length values for undisturbed soil sample are shown in Figure 3. The results showed no significant changes in spectral reflectance ratio of contaminated soil samples, this behavior may be due to the dreariness in the field of view.
_____________________________________________________________________________
______________________________________________________________________________ International Journal of Geosciences and Geomatics, Vol. 1, Issue 1, 2013 02 Page
Figure 2: Reflectance ratio versus wave length of remolded soil samples, AL-Khadimiyah site.
Figure 3: Reflectance ratio versus wave length for undisturbed soil samples, AL-Khadimiyah site.
_____________________________________________________________________________
______________________________________________________________________________ International Journal of Geosciences and Geomatics, Vol. 1, Issue 1, 2013 03 Page
5060708090
100110120130140150160
0.4 0.5 0.6 0.7
Pix
el v
alu
e
Wave length, µm
N1N2N3N4N5N6N7N8N9
Al-Daura Site The reflectance ratios of undisturbed naturally contaminated soil samples are measured in the field in sunny day using radiometer device. Nine spots of naturally contaminated soil are tested in five locations inside the refinery factory of Al-Daura. The results of spectral ratio for field conditions (9) points are shown in Figure 4.
Figure 4:Spectral reflectance curves, Al-Daura site.
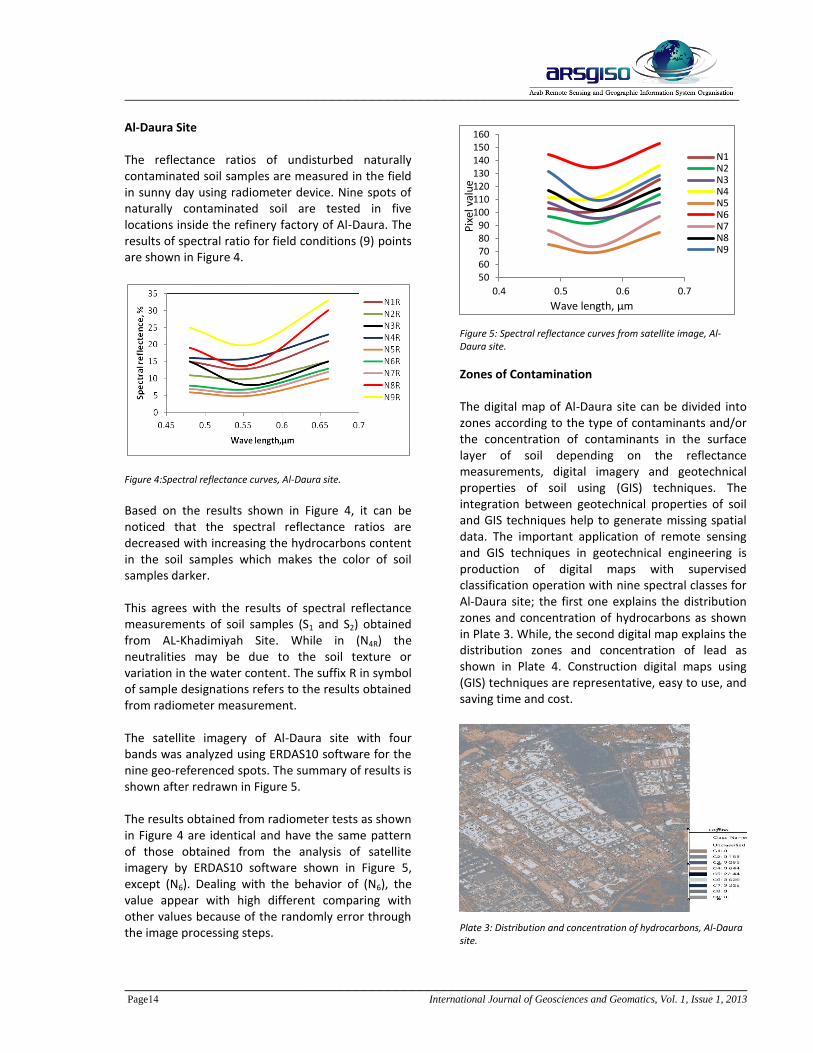
Based on the results shown in Figure 4, it can be noticed that the spectral reflectance ratios are decreased with increasing the hydrocarbons content in the soil samples which makes the color of soil samples darker. This agrees with the results of spectral reflectance measurements of soil samples (S1 and S2) obtained from AL-Khadimiyah Site. While in (N4R) the neutralities may be due to the soil texture or variation in the water content. The suffix R in symbol of sample designations refers to the results obtained from radiometer measurement. The satellite imagery of Al-Daura site with four bands was analyzed using ERDAS10 software for the nine geo-referenced spots. The summary of results is shown after redrawn in Figure 5. The results obtained from radiometer tests as shown in Figure 4 are identical and have the same pattern of those obtained from the analysis of satellite imagery by ERDAS10 software shown in Figure 5, except (N6). Dealing with the behavior of (N6), the value appear with high different comparing with other values because of the randomly error through the image processing steps.
Figure 5: Spectral reflectance curves from satellite image, Al-Daura site.
Zones of Contamination The digital map of Al-Daura site can be divided into zones according to the type of contaminants and/or the concentration of contaminants in the surface layer of soil depending on the reflectance measurements, digital imagery and geotechnical properties of soil using (GIS) techniques. The integration between geotechnical properties of soil and GIS techniques help to generate missing spatial data. The important application of remote sensing and GIS techniques in geotechnical engineering is production of digital maps with supervised classification operation with nine spectral classes for Al-Daura site; the first one explains the distribution zones and concentration of hydrocarbons as shown in Plate 3. While, the second digital map explains the distribution zones and concentration of lead as shown in Plate 4. Construction digital maps using (GIS) techniques are representative, easy to use, and saving time and cost. Plate 3: Distribution and concentration of hydrocarbons, Al-Daura site.

_____________________________________________________________________________
______________________________________________________________________________ International Journal of Geosciences and Geomatics, Vol. 1, Issue 1, 2013 04 Page
Plate 4: Distribution and concentration of lead, Al-Daura site.
The predicted and measured (reference) contents and the spatial distributions of hydrocarbons and lead were interpolated by using ERDAS10 software to produce digital maps of layers for both hydrocarbons and lead as shown in Plates 5 and 6. This application of remote sensing and GIS techniques in geotechnical engineering is new and powerful in predicating the geotechnical properties of surface soil layer especially in the field of soil contamination.
Plate 5: Distribution and concentration of hydrocarbons content in the soil, Al-Daura site.
Plate 6: Distribution and concentration of lead content in the soil,
Al-Daura site.
CONCLUSION The presence of soil contaminant has different effects on the physical properties and reflectance ratio of soil, the effects mainly depend on the type and percentage of contaminant in the soil. The agricultural fertilizers represented by ammonium hydroxide has less effect on the physical properties and soil reflectance ratio among the contaminates used in the present study. Also, the copper sulphate has effect less than kerosene on the reflectance ratio of soil. The spectral reflectance ratio decreases with increasing the percentage of contaminant added to the natural soil sample. The spectral reflectance also depends on the soil sample color. The use of satellite images with high resolution and different bands provides a very large amount of qualitative and quantitative information for study area to state the soil contamination states. The using of remote sensing techniques safe time, effort, cost and provide large quantity of data and information about the properties of soil. References Abdul Rasool H., (1999), "Some Geotechnical Properties of Oil Contaminated Soil", M.Sc. Thesis, University of Baghdad. Al-Maliky, M. A. S., (2005), "Evaluation of Air, Water and Soil Pollutants in Baghdad City Using Geographic Information System (GIS)", M.Sc. Thesis, College of Sciences, University of Baghdad. (in Arabic). Annual Book of ASTM Standards, (2003), "Soil and Rock; Building; Stone; Peats". Carr R., Zhang C., Moles N., and Harder M., (2007), "Identification and Mapping of Heavy Metal Pollution in Soils of a Sports Ground in Galway City, Ireland, Using a Portable XRF Analyser and GIS", Environ Geochem Health, Vol.30 pp. 45–52. Colwell R. N., (1983), “Manual of Remote Sensing”, Volume 1, Second Edition, American Society of Photogammetry. ERDAS Field Guide™, (2008), Volume I and II.
_____________________________________________________________________________
______________________________________________________________________________ International Journal of Geosciences and Geomatics, Vol. 1, Issue 1, 2013 05 Page
Head K. H., (1982), "Manual of Soil Laboratory Testing", MA (Cantab), C. Eng, FICE, FGS, Engineering Laboratory Equipment Limited, Pentech Press, London: Plymouth, Volumes I, II, III. Manchanda, M. L., Kudrat, K. & Tiwari, A. K., (2002), "Soil Survey and Mapping Using Remote Sensing", Regional Remote Sensing Service Centre, Dehradun 248001, India. Manual of Radiometer, (1983), Exoth Company, U. S. A. Nasir, A. N. I., (2008), “Geotechnical Engineering Study for Salah Al-Din Governorate Using Geophysical and Remote Sensing Techniques”, Ph.D. Thesis, Building and Construction Engineering Department, University of Technology. Jensen J. R., (1996), "Introductory Digital Image Processing a Remote Sensing Perspective", Second Edition. Prentice Hall. Upper Saddle River, New Jersey. Yousif, B. F., (2004), “The Use of Remote Sensing Techniques in the Classification of Al-Najaf Soil”, M.Sc. Thesis, Building and Construction Engineering Department, University of Technology. Wu C. Y., Jacobson A. R., Laba M., Kim B., Baveye P. C., (2009), "Surrogate Correlations and Near-Infrared Diffuse Reflectance Sensing of Trace Metal Content in Soils", Water Air Soil PoVol.209, pp.377-390.